


Abstract
Mango (Mangifera indica L.) establishment is strongly constrained by soil salinity, yet comparative evaluations of diverse maternal sources for rootstock-related salinity responses remain limited. In mango, embryo type (polyembryonic vs. monoembryonic) is frequently employed as a proxy for vigour and stress tolerance, yet it is uncertain whether differences in performance are attributable to embryo category per se or to genotypic variation within and between these groups. We evaluated seedlings from 21 open-pollinated mango maternal sources (14 monoembryonic and seven polyembryonic types) under saline irrigation at water electrical conductivities of 0.65, 3.0 and 6.0 dS m−1 over an 18-week period. Growth, biomass, leaf gas exchange, optical pigment indices and Na+ and K+ concentrations in leaves, stems and roots were measured. Saline conditions reduced growth, total dry mass, chlorophyll index, net photosynthetic rate and tissue K+/Na+ ratios, but the magnitude of the response differed markedly among maternal sources. Overall, source-level variation provided more informative screening information than the contrast between embryo categories. Candidates were evaluated using performance at 6.0 dS m−1 and performance retention relative to the control. ’Indonesia’ and ‘Pahutan’ maintained comparatively high values for both traits, retaining approximately 80% and 79% of the control total dry mass and 89% and 86% of the control net photosynthetic rate, respectively. ‘Ceylon’ and ‘Baramasi Vengurla’ maintained high absolute biomass under the highest salinity treatment, whereas M. zeylanica, ‘Kerala-5’, ‘Chandrakiran’ and ‘Peach’ expressed favourable responses for selected physiological traits but differed substantially in plant size or biomass retention. Growth, photosynthetic performance and regulation of ion responses were assessed jointly, providing integrated support to the observed contrasts. The integrated screening framework identified maternal sources whose progenies combined favourable growth, photosynthetic and ion-regulation responses, warranting further evaluation using genetically characterised, clonally propagated and grafted material.
1. Introduction
Soil and irrigation-water salinity increasingly constrain horticultural production, particularly in arid and semi-arid regions where limited rainfall and high evaporative demand promote salt accumulation in the root zone [1,2]. Mango (Mangifera indica L.) is considered sensitive to salinity, and reductions in vegetative growth, leaf function and productivity have been reported under saline soil or irrigation conditions [3,4,5]. Because perennial orchard trees remain in the field for several years, poor establishment or progressive ion accumulation can exert lasting constraints on canopy development and yield, with substantial implications for long-term orchard productivity.
Plant responses to salinity comprise an early osmotic component arising from reduced soil-water availability, followed by ionic injury associated with the accumulation and toxicity of Na+ and Cl− in plant tissues. Restricted water uptake and stomatal conductance can reduce carbon assimilation, while progressive Na+ accumulation and disruption of K+ nutrition impair metabolism and tissue function [6,7]. In mango, salinity has been associated with lower chlorophyll status and photosynthetic performance, altered biomass partitioning, greater Na+ accumulation and reduced K+/Na+ ratios [8,9,10,11,12,13].
Salt-tolerant rootstocks may contribute to salinity management in mango, particularly in regions where leaching water is limited or the use of saline irrigation is unavoidable. In such environments, rootstocks capable of restricting Na+ and Cl− transport to the scion, maintaining osmotic balance and sustaining physiological function may improve tree establishment and productivity under saline conditions. However, these potential benefits depend on rootstock–scion interactions and require validation in grafted plants under field conditions [14,15]. Available information on salt tolerance in mango is based largely on the evaluation of relatively few genotypes, with most studies focusing on polyembryonic types. This emphasis reflects both practical and genetic considerations. Polyembryonic seeds produce multiple nucellar embryos that are clonal copies of the maternal genotype, thereby reducing within-seedling genetic variation and facilitating replication of a defined rootstock genotype in experimental settings. By contrast, monoembryonic seeds typically yield a single zygotic embryo, resulting in greater genetic variability among seedlings and complicating the attribution of phenotypic differences to specific genotypes rather than to segregation within families [16,17]. Despite these advantages, monoembryonic seedlings are still used as rootstocks in several mango-producing countries (i.e., in India and Mexico), reflecting local cultivar preferences and established propagation practices favouring zygotic seedlings. Advances in vegetative propagation methods, including improved grafting and budding protocols, clonal hedge orchards for rootstock and scion production and micropropagation could enable wider deployment of selected monoembryonic or other genotypes as uniform clonal rootstocks. While polyembryonic rootstocks are commonly used in saline environments [13], comparative studies have shown that salinity tolerance varies considerably among polyembryonic accessions, despite the presence of relatively salt-tolerant genotypes within these populations [18]. However, evidence on salinity tolerance among monoembryonic mango rootstocks remains limited, as most screening studies have focused on polyembryonic genotypes [18]. Consequently, it remains unclear whether salt tolerance in mango is associated with embryo type per se or is determined primarily by the specific maternal genotype and its nuclear background [19].
This study was conceived as a comparative screening of 21 open-pollinated mango maternal sources under saline irrigation. The objectives were to characterise variation in growth, biomass allocation, gas exchange, optical indices and tissue ion regulation and to determine whether responses differed primarily among individual maternal sources or between monoembryonic and polyembryonic groups. Because salinity tolerance is unlikely to be represented adequately by a single trait, candidate identification integrated complementary response domains. Maintenance of total plant dry mass and net photosynthetic rate under the highest salinity treatment provided the primary screening criteria, while biomass allocation, optical indices and tissue ion regulation were used to distinguish the response profiles of the selected maternal sources.
2. Materials and Methods
2.1. Plant Material and Experimental Conditions
The experiment was conducted in 2020 at the ICAR-Central Soil Salinity Research Institute, Karnal, India (29°42′31.7″ N, 76°57′12.7″ E; 243 m above sea level). Twenty-one open-pollinated maternal sources were evaluated, comprising 14 sources with maternal genotypes classified as monoembryonic and seven as polyembryonic (Table 1). M. odorata and M. zeylanica were assigned to the monoembryonic category for this experiment because no polyembryonic seedlings were observed in the seed lots used, although polyembryony has been reported in both species [20,21,22]. Polyembryonic seeds typically produced 2–4 seedlings per seed, from which a single seedling presumed to be of nucellar origin was retained for subsequent evaluation. Nucellar versus zygotic origin was not independently verified, and therefore seedlings were not genetically assigned to either embryonic origin. Therefore, ‘embryo type’ refers to the classification of the maternal source, whereas ‘maternal-source variation’ refers to phenotypic variation among the open-pollinated progenies evaluated and is not interpreted as genotypic variance.
Table 1.
Open-pollinated mango maternal sources evaluated under saline irrigation. Embryo type: M = monoembryonic; P = polyembryonic. Source: HRTC = Horticultural Research and Testing Centre, Saharanpur, Uttar Pradesh, India; ICAR-IARI = Indian Council of Agricultural Research—Indian Agricultural Research Institute, New Delhi, Delhi, India; ICAR-CISH = Indian Council of Agricultural Research—Central Institute for Subtropical Horticulture, Lucknow, Uttar Pradesh, India; RFRS = Regional Fruit Research Station, Vengurla, Maharashtra, India.
Approximately six-month-old seedlings were transplanted on 20 December 2019 into earthen pots containing 8 kg of garden soil, river sand and farmyard manure (1:1:1, v/v). The initial potting-medium ECe was 0.61 dS m−1, and the pH was 7.52. Leachate was not collected, and root-zone substrate ECe was not measured during or at the end of the experiment. Thus, the reported treatment EC values represent irrigation-water EC and should not be interpreted as root-zone EC.
After two weeks of acclimation, four seedlings from each maternal source were allocated to each of three irrigation treatments, resulting in 252 experimental plants.
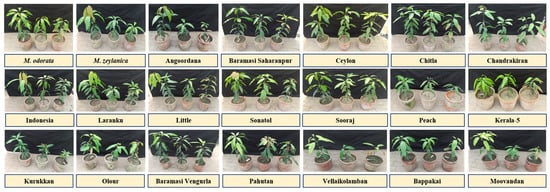
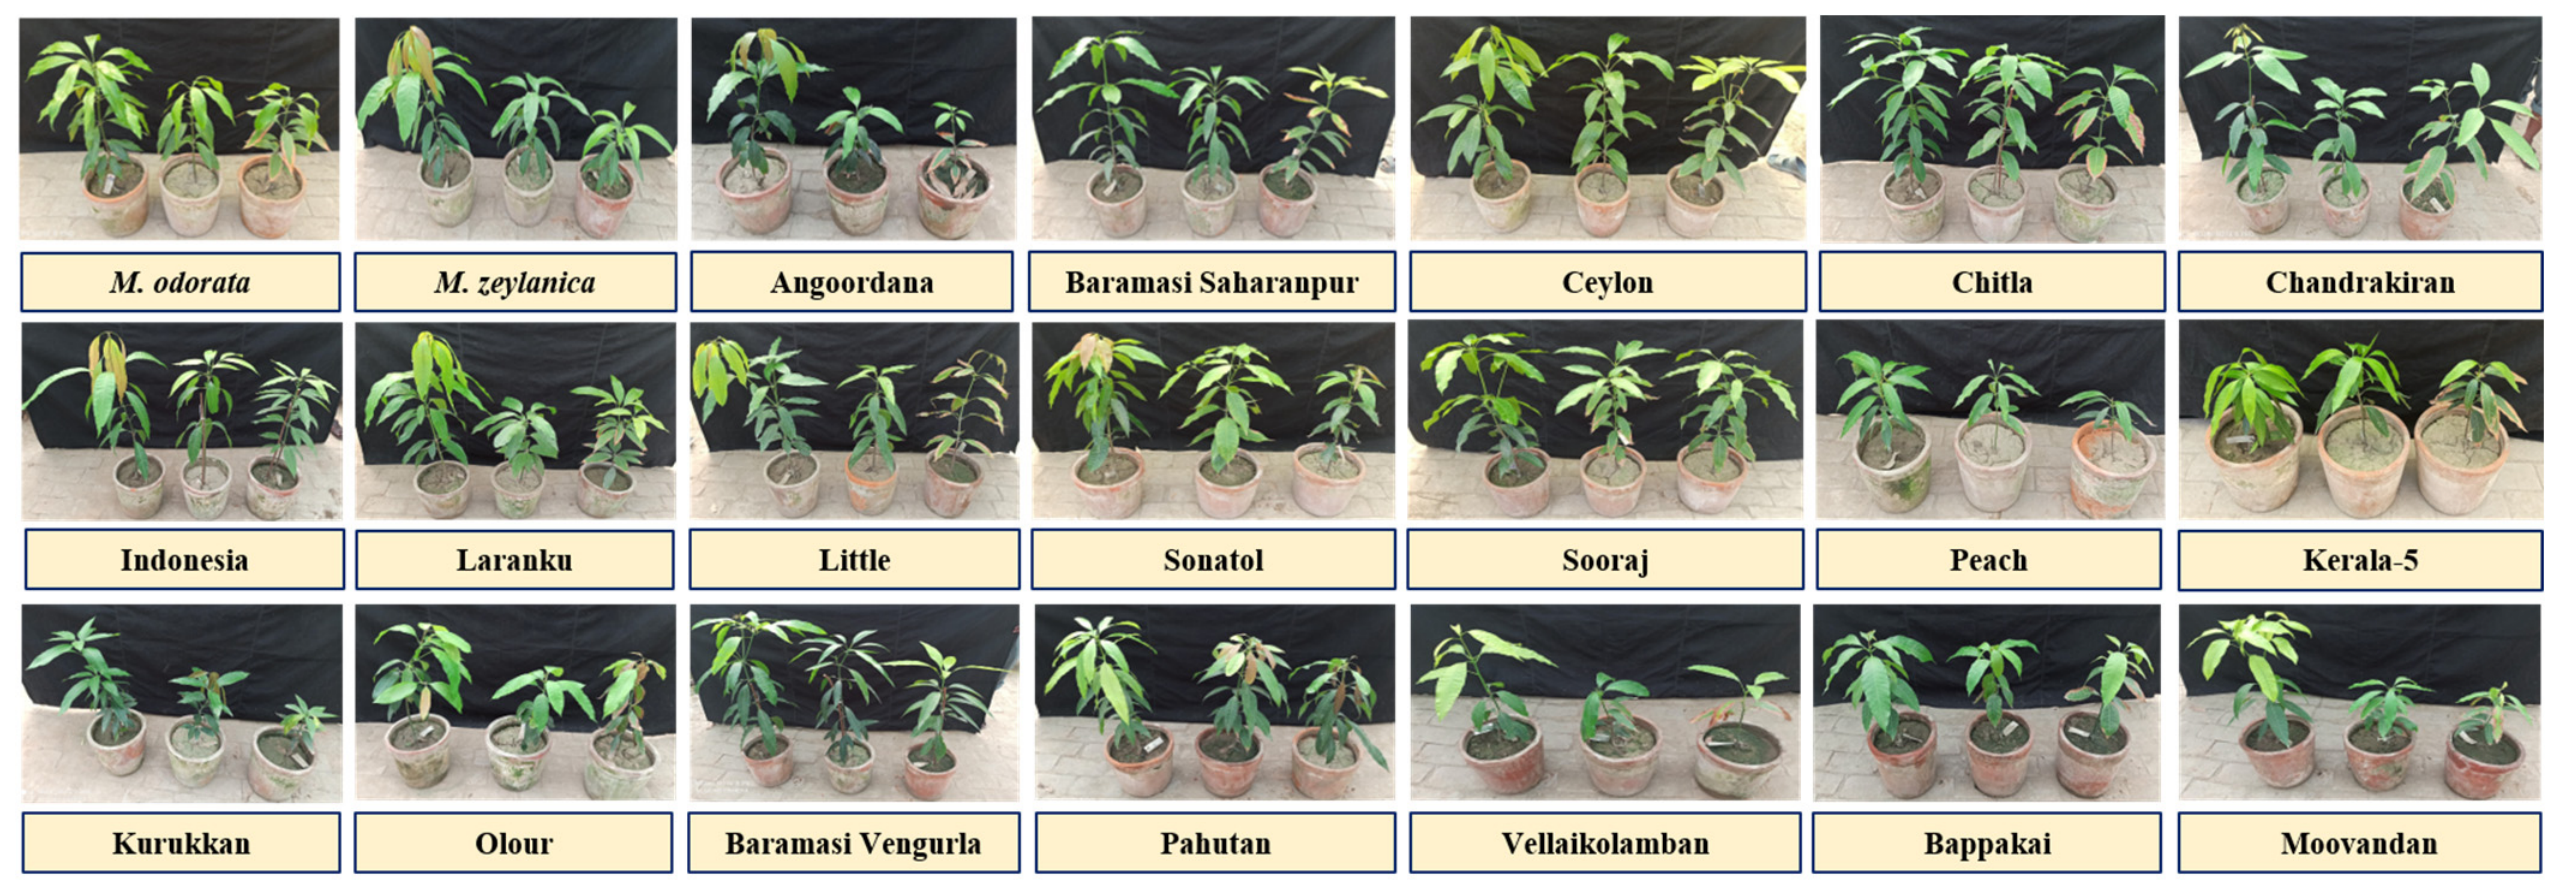
Saline irrigation water was prepared by diluting naturally saline groundwater, with an electrical conductivity of approximately 16 dS m−1, obtained from a saline aquifer in Panipat district, Haryana, India. The diluted waters had target electrical conductivities of 3.0 and 6.0 dS m−1, while fresh irrigation water with an electrical conductivity of 0.65 dS m−1 served as the control. The electrical conductivity, pH and ionic composition of the irrigation waters are reported in Supplementary Table S1. Treatments consisted of fresh water (0.65 dS m−1) and saline irrigation water adjusted to 3.0 or 6.0 dS m−1 (Figure 1).
Figure 1.
Representative seedlings from 21 open-pollinated mango (Mangifera spp.) maternal sources exposed to three irrigation-water electrical conductivities. For each maternal source, the photographs show representative seedlings irrigated with control water at 0.65 dS m−1, moderate-salinity water at 3.0 dS m−1 and high-salinity water at 6.0 dS m−1, arranged from left to right. Because image acquisition was not standardised for quantitative comparison, apparent differences in plant size should be interpreted qualitatively.
Salinity was increased in 1.5 dS m−1 increments to reduce abrupt osmotic shock. The experiment was arranged in four blocks, with pots randomly allocated to positions within each treatment in each block. Pot positions were repositioned within their respective blocks at 15-day intervals to minimise potential positional effects. Pots were fitted with drainage holes covered with glass wool to prevent loss of the potting substrate. Plants were irrigated at seven-day intervals, with volumes determined gravimetrically from pot-mass loss. Treatments continued from 3 January to 8 May 2020. No leachate was collected, and root-zone substrate ECe was not measured. Thus, the reported EC values represent irrigation-water EC (ECiw) and should not be interpreted as measured root-zone ECe. No plant mortality occurred during the study.
2.2. Measurements
Measurements were made after 18 weeks of saline irrigation. Plant height, stem diameter and leaf number were recorded. Plants were harvested and separated into leaves, stems and roots, and tissues were oven-dried to constant mass. Total plant dry mass was calculated as the sum of leaf, stem and root dry mass. The root-to-shoot ratio was calculated as root dry mass divided by the sum of leaf and stem dry mass.
Net photosynthetic rate (Pn), transpiration rate (E) and intercellular CO2 concentration (Ci) were measured between 09:00 and 11:00 h with an LI-6400XT portable photosynthesis system (LI-COR Biosciences, Lincoln, NE, USA). Instantaneous water-use efficiency (WUEi) was calculated as Pn/E and analysed as an independent response variable. Relative chlorophyll status was measured with a SPAD-502 meter (Konica Minolta, Japan), and epidermal anthocyanin and flavonol indices were measured with a Dualex Scientific leaf clip (Force-A, France). Measurements were carried out on the uppermost fully expanded leaf. For gas exchange measurements, the cuvette conditions were maintained at a photosynthetic photon flux density of 1000 μmol m−2 s−1, CO2 concentration of 400 ppm and a leaf temperature of 25 °C.
The uppermost fully expanded leaves used for photosynthetic and other measurements were carefully detached, washed with distilled water, shade-dried, placed in paper envelopes and oven-dried to constant mass at 70 °C in a hot-air oven (NSW, India). The dried leaves were finely ground using a hammer mill. A 50 mg subsample of powdered leaf material was digested with 1 M HNO3. Na+ and K+ concentrations were determined using a flame photometer (Type 128, Systronics, Gujarat, India) and expressed on a dry-mass basis. Tissue K+/Na+ ratios were calculated from the corresponding concentrations.
2.3. Data Analysis
2.3.1. Mixed-Effects Analysis of Saline-Irrigation and Embryo-Type Effects
Each seedling represented an independent experimental unit and contributed one endpoint observation per trait. The experiment comprised 21 maternal mango sources, three saline-irrigation treatments and four seedlings per maternal source and treatment, for a total of 252 experimental plants.
Linear mixed-effects models were fitted separately for each measured trait. Saline-irrigation treatment, embryo type and their interaction were included as fixed effects. Saline-irrigation treatment was treated as a categorical factor with three levels corresponding to irrigation-water electrical conductivities of 0.65, 3.0 and 6.0 dS m−1. Maternal source, nested within embryo type, was included as a random intercept to account for variation among maternal sources belonging to the same embryo type. Residual variance represented seedling-to-seedling variation within maternal source and treatment. The embryo-type effect was therefore estimated from variation among the 14 monoembryonic and seven polyembryonic maternal sources, not from the total number of individual seedlings. Given the unequal representation and the numbers of maternal sources in the two categories, embryo-type effects were treated as secondary (exploratory). The maternal-source random effect accounts for phenotypic heterogeneity among sources but does not separate genetic variance from environmental or maternal components.
Models were fitted by restricted maximum likelihood using the lme4 and lmerTest packages in R, with the BOBYQA optimiser. Sum-to-zero contrasts were applied to the fixed factors. Fixed effects were evaluated using Type III tests with denominator degrees of freedom and F-tests based on the Kenward–Roger approximation.
Estimated marginal means and corresponding 95% confidence intervals were calculated for each saline-irrigation treatment using the emmeans package. The relative change between the control and highest saline-irrigation treatment was calculated from the estimated marginal means as follows:
where EMM0 and EMM6 denote the estimated marginal means at irrigation-water electrical conductivities of 0.65 and 6.0 dS m−1, respectively.
Model convergence and singularity were inspected for every fitted model. Model assumptions were assessed by visually examining residual-versus-fitted plots and normal quantile-quantile plots. Because only moderate departures from residual normality were observed and no consistent failure of model assumptions was evident, analyses were conducted on the original measurement scales.
2.3.2. Maternal-Source Performance and Retention Under Severe Salinity
Maternal-source responses were evaluated descriptively using source means calculated from the four seedlings in each saline-irrigation treatment. This source-level evaluation was separate from the mixed-model tests of saline-irrigation treatment, embryo type and their interaction. No pairwise hypothesis tests or formal statistical classifications were used to rank individual maternal sources.
Candidate evaluation focused on total plant dry mass (PDM) and net photosynthetic rate (Pn) under the highest saline-irrigation treatment. For each maternal source, absolute performance at an irrigation-water electrical conductivity of 6.0 dS m−1 was considered together with retention relative to its corresponding control mean. Retention was calculated as follows:
where i denotes the maternal source, and subscripts 0 and 6 represent irrigation-water electrical conductivities of 0.65 and 6.0 dS m−1, respectively. Retention values were multiplied by 100 when expressed as percentages.
A Combined Relative Endpoint Performance Index was calculated as the geometric mean of the PDM and Pn endpoint treatment-to-control ratios:
The geometric mean was used to combine the two treatment-to-control ratios while preventing a high value for one component from fully compensating for poor retention of the other. Total plant dry mass and net photosynthetic rate were assigned equal weight. The index is expressed as a percentage, with 100 indicating complete retention of both traits relative to the control. Values below or above 100 indicate an overall decrease or increase, respectively.
2.3.3. Ion-Regulation Score and Candidate Map
An Ion-Regulation Domain Score was calculated to summarise changes in Na+ concentration and K+/Na+ ratio across leaves, stems and roots. For each maternal source and tissue, Na+ accumulation and K+/Na+ maintenance under the highest saline-irrigation treatment were calculated relative to the control:
where t denotes leaf, stem or root tissue. Each response variable was standardised across the 21 maternal sources using the following:
where xi,j is the response of maternal source i for variable j, and μj and sj are the corresponding mean and sample standard deviation across maternal sources.
Na+ response values were multiplied by −1 before standardisation so that higher standardised values consistently represented more favourable responses. The Na+-regulation component was calculated as the mean of the standardised leaf, stem and root Na+ responses. The K+/Na+-maintenance component was calculated as the mean of the standardised retention responses for the three tissue K+/Na+ ratios. The final score was calculated as follows:
Leaf, stem and root responses were assigned equal weight within each component. The Na+-regulation and K+/Na+-maintenance components were then assigned equal weight in the final score. Positive values indicate above-average ion regulation relative to the 21 maternal sources evaluated, whereas negative values indicate below-average performance. Because all variables were standardised within the present germplasm panel, a score of zero represents the panel mean rather than a physiological threshold. The score is therefore not an absolute classification of salinity tolerance.
A multidimensional candidate map was constructed using ggplot2 and ggrepel. Total plant dry mass and Pn at 6.0 dS m−1 were plotted on the x- and y-axes, respectively. Bubble area represented the Combined Retention Index, which summarised the joint retention of total plant dry mass and net photosynthetic rate, whereas bubble fill represented the Ion-Regulation Domain Score, which independently summarised multi-tissue Na+ regulation and K+/Na+ maintenance. Maternal sources were displayed in separate panels according to embryo type. Dashed vertical and horizontal lines represented the trial-wide medians of PDM and Pn at 6.0 dS m−1. These lines provided descriptive benchmarks and were not statistical thresholds for classifying salinity tolerance.
2.3.4. Principal Component Analysis
Principal component analysis was used to describe multivariate variation among maternal sources in their responses to the highest saline-irrigation treatment. For each maternal source, natural-log response ratios were calculated from source means under the 6.0 dS m−1 treatment relative to the corresponding control:
For total plant dry mass, Pn, SPAD index and tissue K+/Na+ ratios, more positive values represented greater maintenance under saline irrigation. For Na+ concentrations, the direction was reversed:
so that more positive values represented comparatively lower Na+ accumulation.
The PCA included nine variables: total plant dry mass, Pn, SPAD index, Na+ concentrations in leaves, stems and roots and K+/Na+ ratios in the corresponding tissues. The analysis was intentionally restricted to representative variables from the growth, photosynthetic and ion-regulation domains to reduce repeated weighting of closely related measurements.
Response variables were centred and scaled to unit variance, and PCA was performed by singular-value decomposition of the resulting standardised matrix. Variable loadings, percentage contributions and communalities across the first two principal components were examined to interpret the principal dimensions of variation. Pairwise Pearson correlations among the nine response variables were also calculated to describe associations between selected responses.
Uncertainty in maternal-source PCA scores was evaluated using a stratified non-parametric bootstrap with 1000 iterations. Within each iteration, individual seedlings were resampled with replacement within each maternal source × saline-irrigation treatment combination. Maternal-source response ratios were recalculated, and PCA was refitted to the standardised pseudo-sample matrix. Component-sign ambiguity was corrected by aligning each bootstrap eigenvector with the corresponding eigenvector from the original analysis using their dot product (when an inner product was negative, the corresponding bootstrap scores were multiplied by −1). Percentile-based 95% bootstrap intervals were then obtained for maternal-source scores on the first two principal components.
All analyses and visualisations were performed in R 4.4.2 using the lme4, lmerTest, emmeans, dplyr, tidyr, ggplot2 and ggrepel packages.
3. Results
3.1. Overall Responses to Saline Irrigation and Embryo Category
We first assessed the effects of salt treatments on the maternal sources, and therefore, all three irrigation-water EC levels were included in the mixed-effects analysis. EMMs showed that most traits changed progressively across the three irrigation-water EC levels, although the magnitude of the change between successive salinity levels differed among traits. Specifically, saline irrigation significantly affected all measured growth, biomass, physiological, optical and ion-related traits (all p < 0.001; Supplementary Table S2). Plant height declined from an EMM of 54.4 cm in the control to 40.5 cm at an irrigation-water EC of 6 dS m−1, corresponding to a reduction of 25.6%. The number of leaves per plant declined by 33.4%, while stem diameter decreased by 14.1%. Salinity × embryo-type interactions were significant for plant height and leaf number, but not for stem diameter, indicating that the average response to saline irrigation differed between embryo types for two of the three growth traits.
As expected, biomass accumulation was particularly sensitive to saline irrigation. Total plant dry mass decreased from 22.8 g plant−1 in the control to 13.5 g plant−1 at 6 dS m−1, representing a reduction of 40.8%. The corresponding reductions in leaf, stem and root dry mass were 43.0%, 41.2% and 36.9%, respectively. In contrast, the conventional root-to-shoot ratio increased by 20.6%, from 0.385 to 0.464, indicating that aboveground biomass declined proportionally more than root biomass. Salinity × embryo type interactions were significant for total dry mass and all component biomass traits, as well as for the root-to-shoot ratio, indicating that the magnitude of biomass responses differed between the two embryo types.
Leaf photosynthetic characteristics also declined markedly with increasing irrigation-water EC. The SPAD chlorophyll index decreased by 26.2%, from 51.9 under control conditions to 38.3 at 6 dS m−1. Net photosynthetic rate declined by 49.1%, from 5.87 to 2.99 µmol CO2 m−2 s−1, while transpiration rate declined by 39.6%. Intercellular CO2 concentration decreased by 28.6%, and instantaneous water-use efficiency declined by 19.0%. Significant salinity × embryo type interactions were detected for SPAD, net photosynthetic rate, transpiration rate and intercellular CO2 concentration, whereas the interaction was not significant for instantaneous water-use efficiency.
Saline irrigation also resulted in significant changes in tissue ion composition. Leaf, stem and root Na+ concentrations increased by 180.4%, 110.9% and 125.8%, respectively, between the control and 6 dS m−1 treatments. In contrast, leaf, stem and root K+ concentrations declined by 38.6%, 36.3% and 35.4%, respectively. Consequently, K+/Na+ ratios decreased by 75.2% in leaves, 67.4% in stems and 69.8% in roots. Salinity × embryo type interactions were significant for leaf and stem K+ concentrations, Na+ concentrations in each of the three organs and the K+/Na+ ratio in each organ. The interaction was not significant for root K+ concentration. These interactions describe differences in the average response of the two embryo types and do not establish that all maternal sources within a category responded similarly.
The optical pigment indices responded in the opposite direction to most growth and photosynthetic traits. The anthocyanin index increased by 55.4%, whereas the flavonol index increased by 41.4% between the control and the highest saline-irrigation treatment. The salinity × embryo type interaction was significant for the flavonol index but not for the anthocyanin index. These increases indicate treatment-induced changes in leaf optical properties associated with epidermal flavonoids.
Embryo category significantly affected several growth and biomass traits, including plant height, stem diameter, leaf number, individual components as well as total dry mass and root-to-shoot ratio. Embryo type effects were also detected for SPAD, instantaneous water-use efficiency, stem Na+ and root Na+. However, embryo type main effects were not significant for net photosynthetic rate, transpiration rate, intercellular CO2 concentration, anthocyanin index, flavonol index, leaf Na+, or the tissue K+/Na+ ratios. Moreover, the considerable variation among maternal sources within both categories indicates that embryo type should be regarded as a secondary grouping factor rather than as a general predictor of saline-irrigation performance. Given the absence of genetic verification, these results represent average differences between the two groups and do not establish whether embryo type has a causal effect on responses to saline irrigation or, if so, the nature of that effect.
The largest salinity-treatment F statistics were observed for intercellular CO2 concentration (F2227 = 927.04), stem K+/Na+ ratio (F2227 = 559.97), transpiration rate (F2227 = 418.94), leaf K+/Na+ ratio (F2227 = 411.75), net photosynthetic rate (F2227 = 389.28), root K+/Na+ ratio (F2227 = 381.25), stem K+ concentration (F2227 = 355.11), SPAD (F2227 = 314.50) and total plant dry mass (F2227 = 312.61). These results indicate that these traits were particularly responsive to salinity treatment. None of the fitted random-intercept models was identified as singular. Inspection of residual-versus-fitted plots showed that residuals were generally centered around zero, without strong systematic trends or pervasive changes in variance across fitted values. Normal Q–Q plots indicated approximate residual normality for most traits, although moderate departures from normality were observed in the distribution tails for several biomass, gas-exchange and ion-related variables. Because these departures were limited and did not indicate a consistent failure across the fitted models, the original response scales were retained. Complete model diagnostics are provided in Supplementary Figure S1.
3.2. Maternal-Source Variation in Key Performance Traits
Maternal sources differed substantially in absolute size under control conditions and in the magnitude of their responses across the saline-irrigation gradient. Absolute performance and proportional retention values for all 21 maternal sources are reported in Supplementary Table S3, while Table 2 summarises the sources exhibiting the most informative combined and trait-specific response profiles.
Table 2.
Absolute performance and proportional retention of total plant dry mass and net photosynthetic rate for selected open-pollinated mango maternal sources under the highest saline-irrigation treatment. PDM at 6 and Pn at 6 represent maternal-source means at an irrigation-water electrical conductivity of 6.0 dS m−1. Retention was calculated as the mean value at 6.0 dS m−1 divided by the corresponding control mean and multiplied by 100. The interpretation column summarises the principal performance characteristic of each source and does not represent a formal statistical classification. Emb., embryo category; M, monoembryonic; P, polyembryonic; PDM, total plant dry mass, expressed as g plant−1; Pn, net photosynthetic rate, expressed as µmol CO2 m−2 s−1. Values are means of four seedlings per maternal source and treatment.
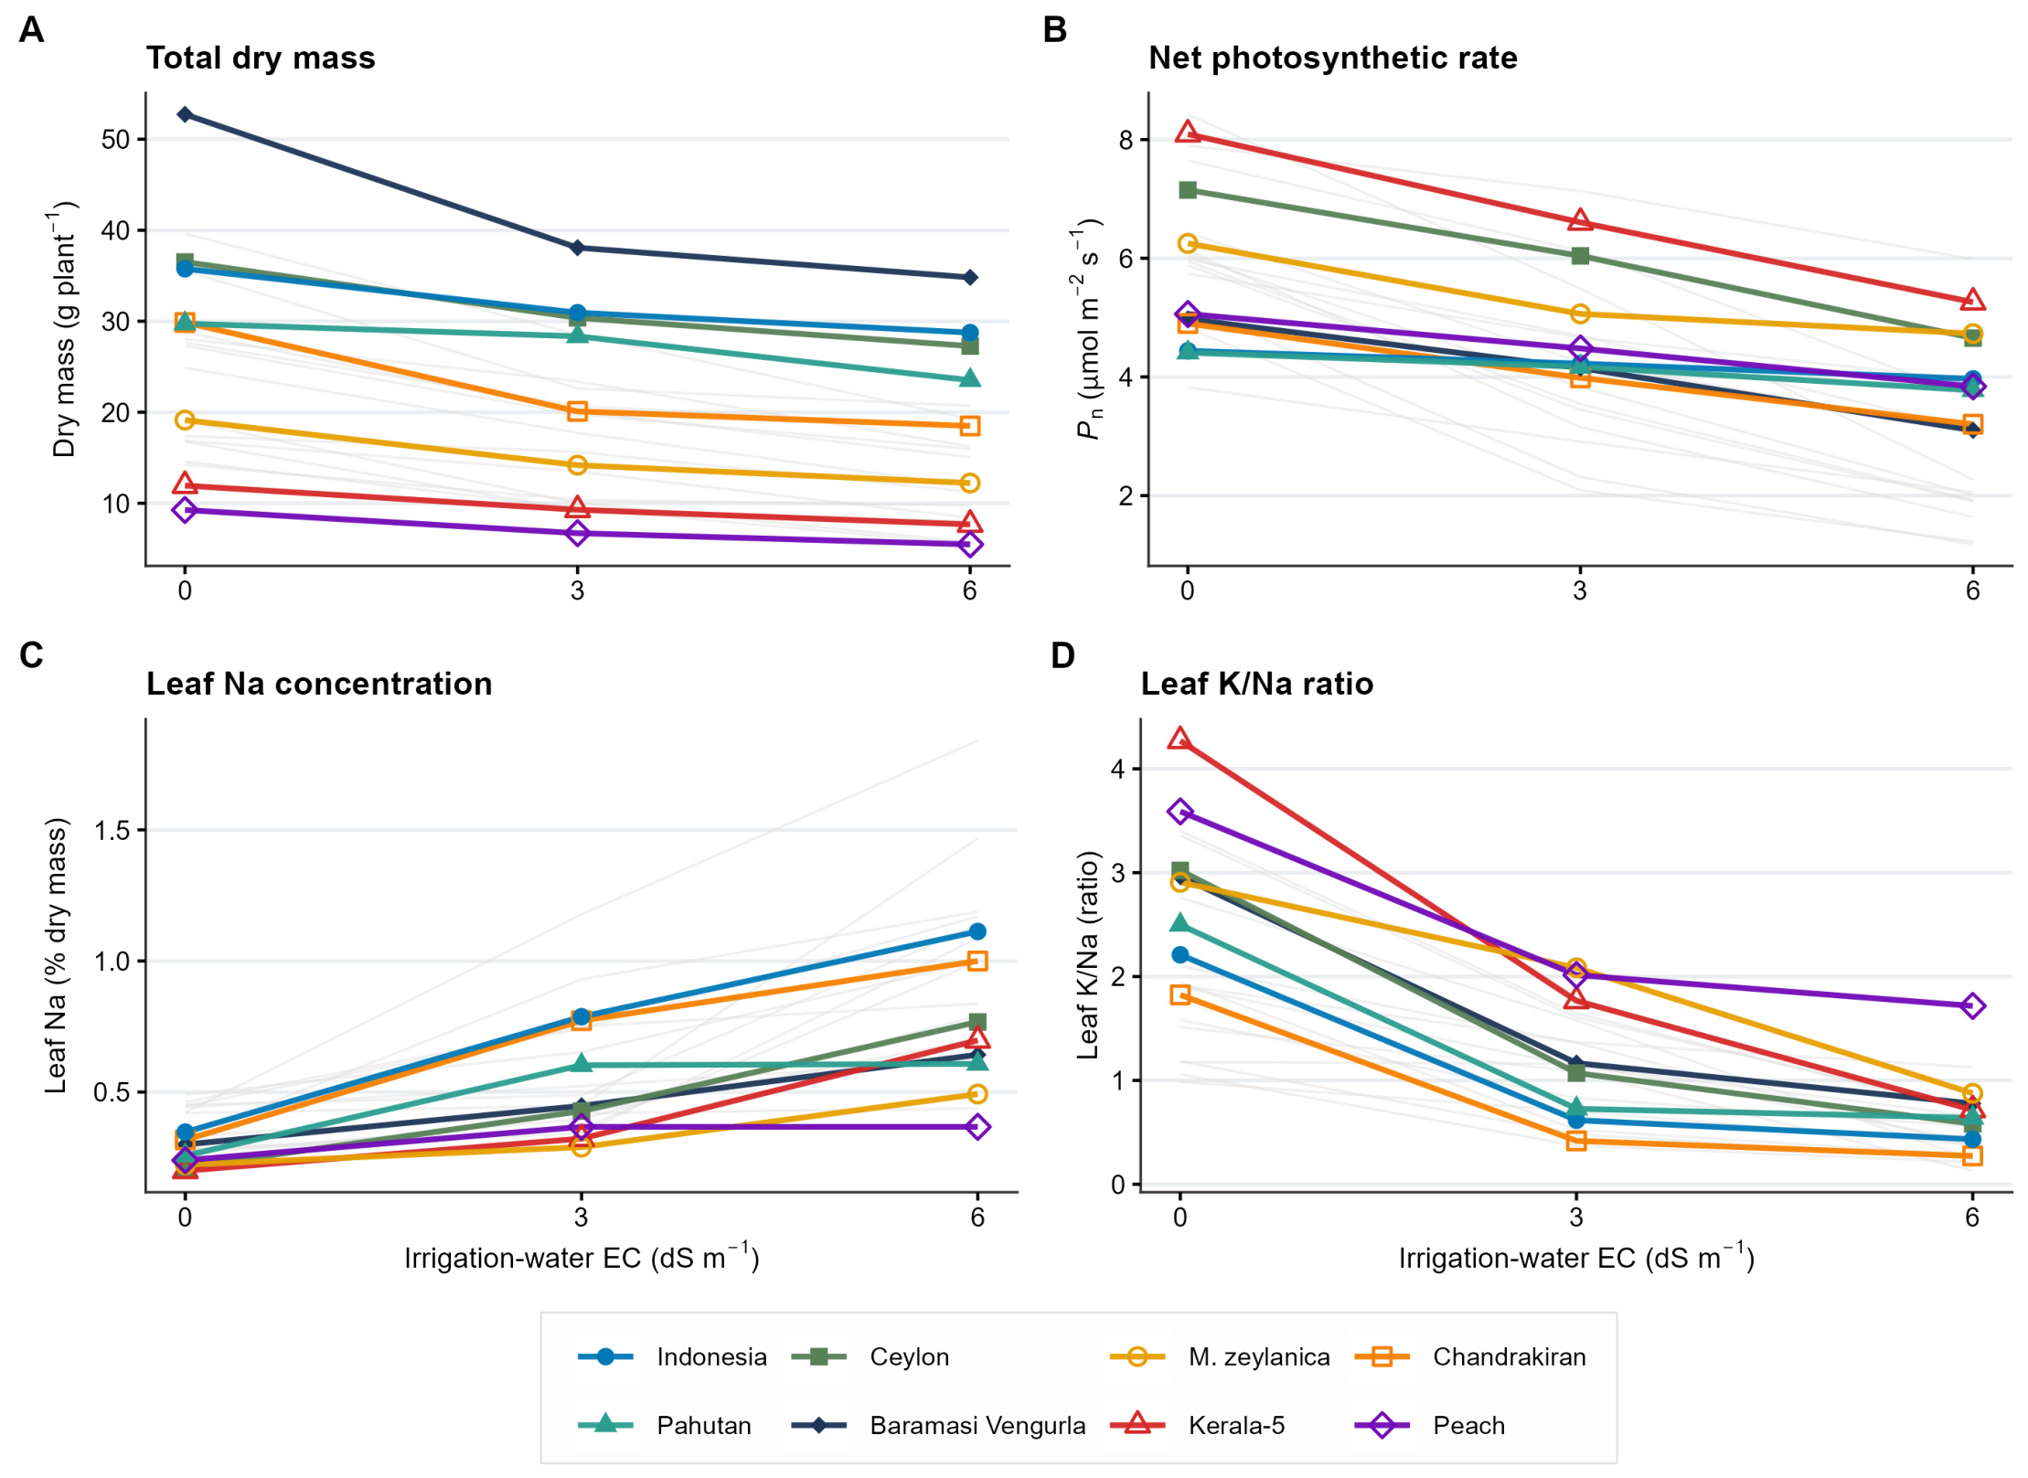
The baseline variation affected absolute control-to-treatment differences: vigorous control plants could show large numerical declines while still maintaining high biomass under the highest treatment. Candidate interpretation therefore considered both stressed performance and proportional retention. Indonesia and Pahutan retained relatively high proportions of both total dry mass and net photosynthetic rate. At the endpoint, Indonesia under 6.0 dS m−1 had mean total dry mass and Pn equivalent to 80.4% and 89.4%, respectively, of the corresponding independent control-group means, whereas Pahutan retained 79.1% and 85.6%, respectively. Ceylon retained 74.7% of control total dry mass and produced 27.3 g plant−1 under the highest treatment. Baramasi Vengurla had the highest absolute total dry mass under 6.0 dS m−1 (34.8 g plant−1), but its proportional retention of total dry mass and Pn was lower, at 66.0% and 62.3%, respectively.
Other sources showed more trait-specific responses, including relatively high photosynthetic retention but low absolute biomass. These contrasting response profiles are summarised in Table 2. M. zeylanica and Kerala-5 maintained comparatively high Pn under the highest salinity treatment but produced relatively low absolute biomass. Chandrakiran showed moderate absolute biomass and photosynthetic performance under the highest treatment but retained only 61.9% of its control total dry mass. ‘Peach’ retained 75.9% of control Pn but produced only 5.5 g plant−1 total dry mass under the highest treatment. The physiological retention and absolute growth performance provided complementary information and were considered jointly in interpreting the performance of maternal sources.
3.3. Photosynthetic and Ion-Regulation Profiles
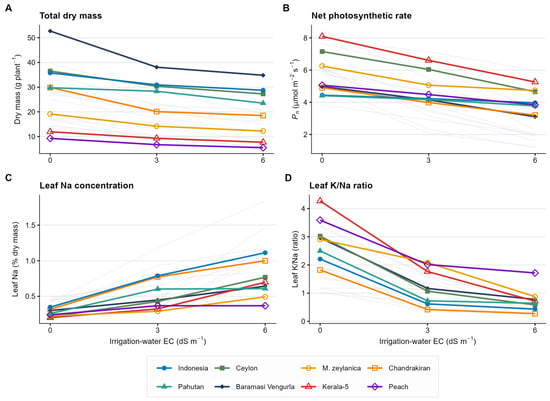
The contrasting maternal sources did not share a single response pattern. Indonesia and Pahutan combined relatively high biomass retention with high Pn retention, but their leaf Na+ concentrations still increased, and leaf K+/Na+ ratios declined. Ceylon and Baramasi Vengurla maintained high absolute biomass despite less favourable relative Pn responses. M. zeylanica, Kerala-5 and Peach maintained comparatively high Pn retantion relative to controls retention but differed substantially in absolute biomass production. These contrasting profiles indicate that similar levels of performance under salinity can arise from different combinations of biomass maintenance, photosynthetic retention and tissue ion composition. Maternal-source responses across the three irrigation treatments are shown for total plant dry mass, net photosynthetic rate, leaf Na+ concentration and leaf K+/Na+ ratio in Figure 2.
Figure 2.
Maternal-source means for (A) total plant dry mass, (B) net photosynthetic rate (Pn), (C) leaf Na+ concentration and (D) leaf K+/Na+ ratio across three irrigation-water electrical conductivity levels (nominal 0 [control, EC = 0.65], 3.0 and 6.0 dS m−1). Eight maternal sources representing contrasting growth and ion-regulation profiles are highlighted in colour (Baramasi Vengurla, Ceylon, Chandrakiran, Indonesia, Kerala-5, M. zeylanica, Pahutan, and Peach); the remaining 13 sources are shown in light grey. Points represent means of four independent seedlings per maternal source and treatment (n = 4); error bars are omitted to maintain visual clarity. Lines connect treatment means to facilitate visual comparison across salinity levels and do not imply continuous response functions or repeated measures on identical plants.
3.4. Performance Retention and Multidimensional Candidate Evaluation
Candidate screening and multivariate response summaries focused on the contrast between the non-saline control and the highest treatment because this comparison provided the clearest test of performance maintenance. Moreover, this approach avoids fitting family-specific slopes or nonlinear responses from only three treatment points.
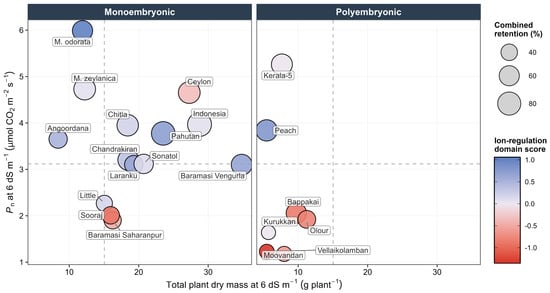
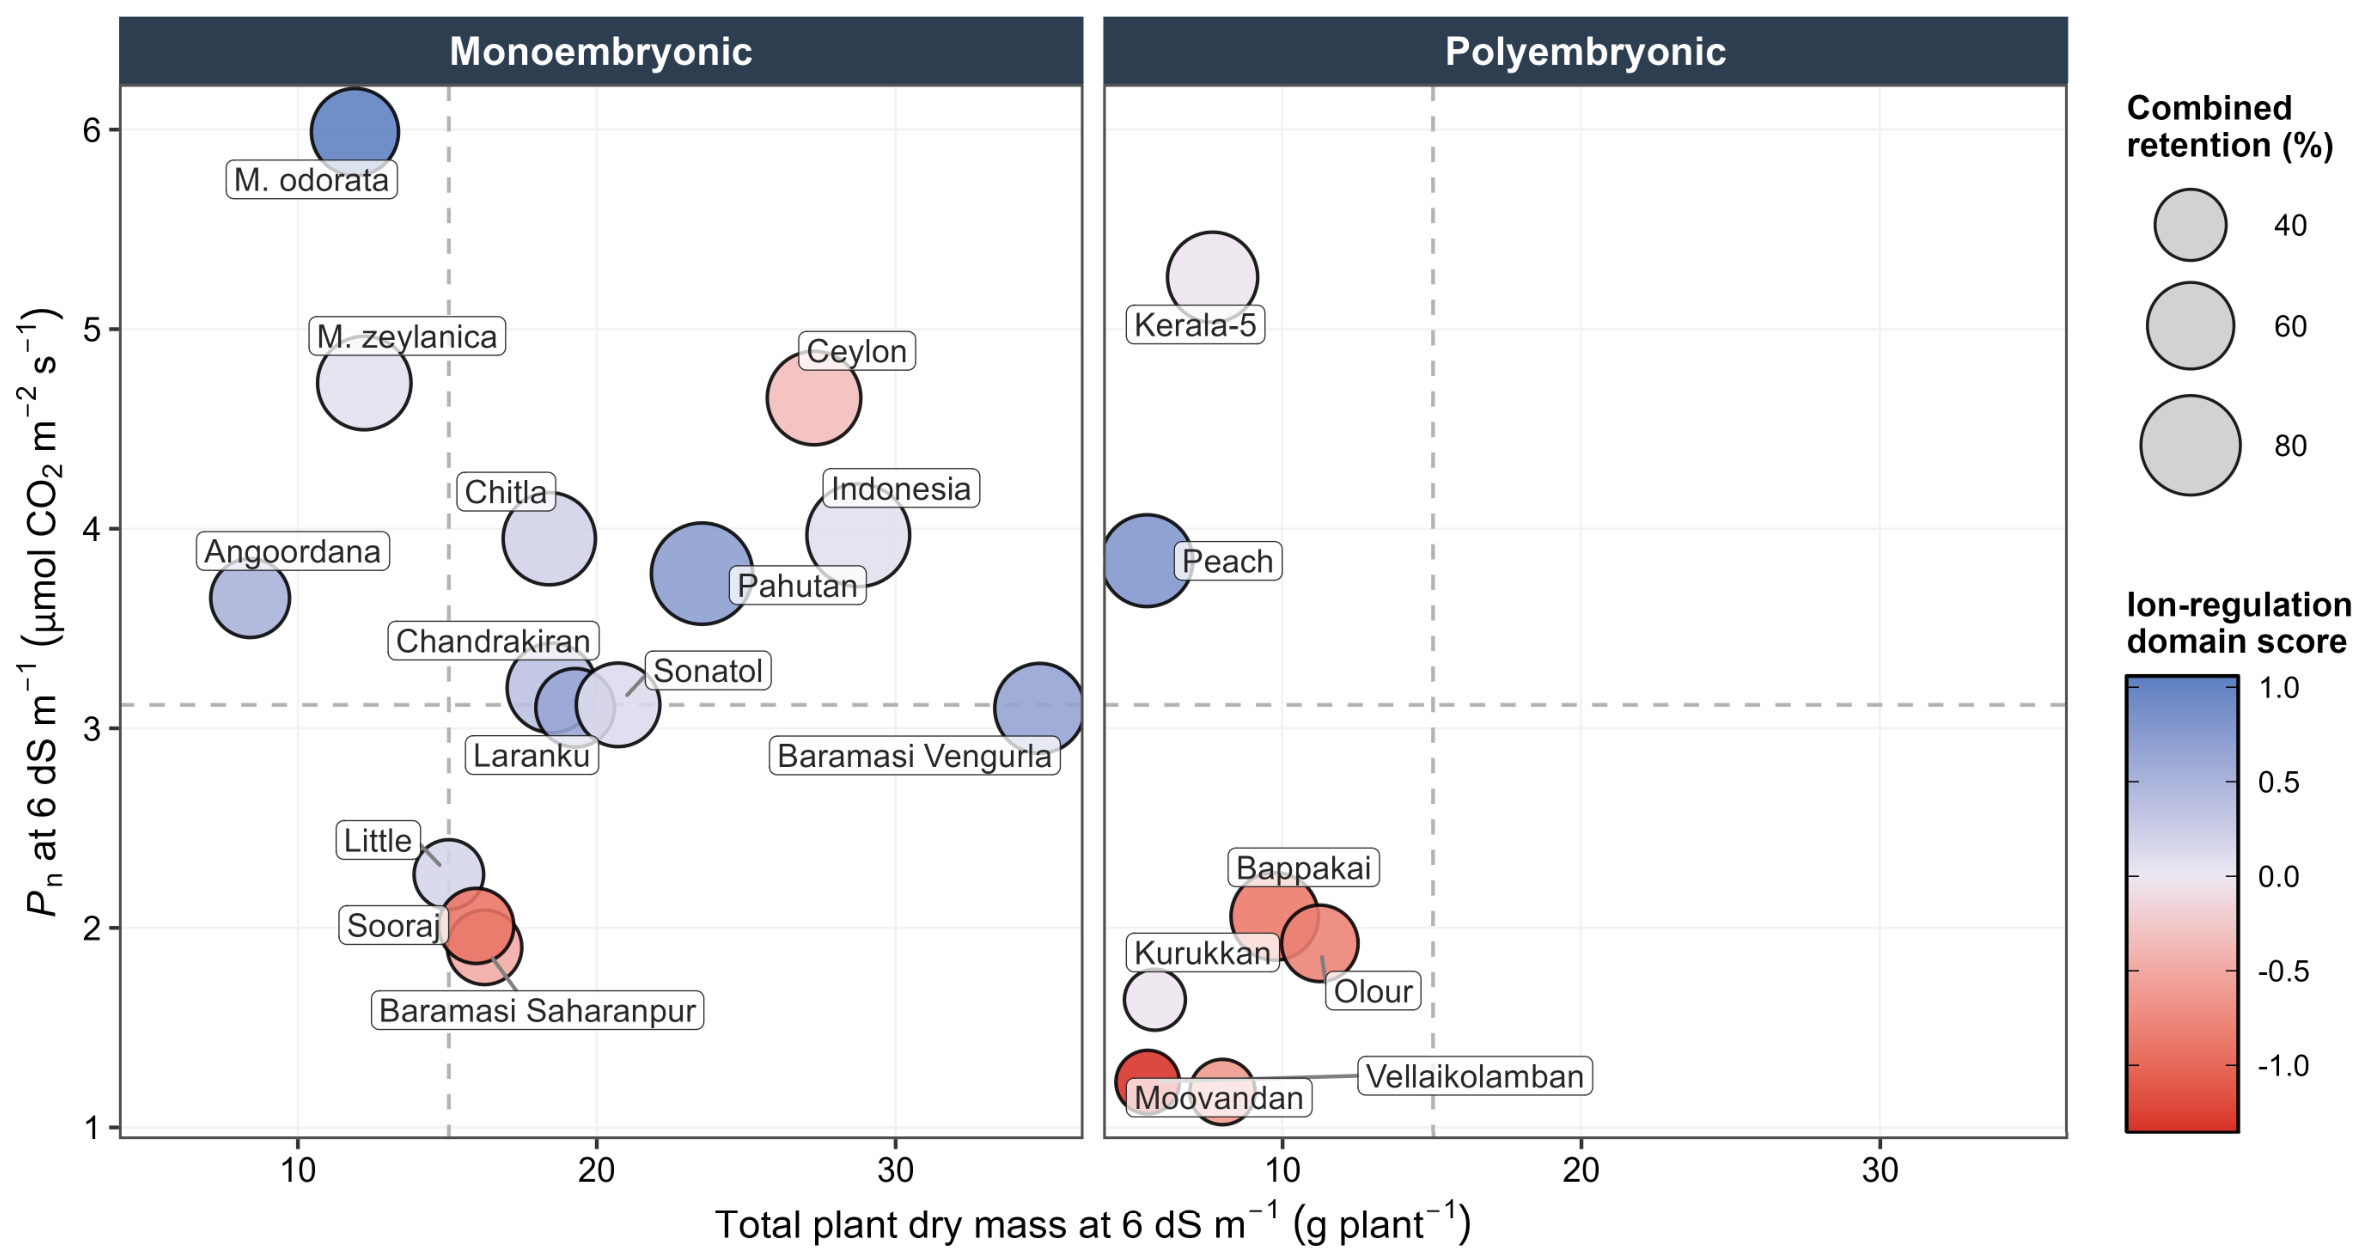
Absolute performance at 6.0 dS m−1, proportional retention relative to non-saline control and whole-plant ion homeostasis revealed substantial phenotypic divergence among the 21 maternal sources (Figure 3).
Figure 3.
Integrated multi-dimensional evaluation of 21 open-pollinated mango (Mangifera spp.) maternal sources under the highest saline-irrigation treatment (6.0 dS m−1). The x and y axes show maternal-source mean total plant dry mass and net photosynthetic rate, respectively (n = 4). Bubble area is proportional to the Combined Retention Index, calculated as the geometric mean of total dry mass and Pn retention relative to the corresponding control. Bubble fill indicates the standardised Ion-Regulation Domain Score calculated from Na+ accumulation and K+/Na+ ratio maintenance in leaves, stems and roots. Dashed lines represent the trial-wide medians for total dry mass and Pn at 6.0 dS m−1. Maternal sources are displayed separately according to embryo category. The median lines and resulting quadrants provide descriptive benchmarks and do not represent statistically defined tolerance classes.
The maternal sources displayed a broad range of absolute and relative responses. While the two embryo categories overlapped in net photosynthetic rate and ion-regulation scores, polyembryonic types generally occupied the lower range of absolute total dry mass. Considerable variation was evident among maternal sources within each category. For instance, monoembryonic types ranged from high combined performance in ‘Indonesia’ and ‘Pahutan’ to low performance in ‘Sooraj’ and ‘Baramasi Saharanpur’. Likewise, polyembryonic sources ranged from comparatively high photosynthetic performance in ‘Kerala-5’ and ‘Peach’ to poor combined performance in ‘Moovandan’ and ‘Vellaikolamban’. Thus, embryo category alone did not adequately capture response variation among maternal sources or provide a sufficient basis for their characterisation.
Across the exploratory assessment of responses, tolerance was characterised by the concurrent maintenance of absolute total dry mass, net carbon assimilation and proportional retention under severe salinity. Two monoembryonic accessions, ‘Indonesia’ and ‘Pahutan’, most closely matched these criteria. Both maternal sources sustained above-median absolute total dry mass and relatively high-performance retention relative to their respective controls. Furthermore, both accessions had positive standardised ion-regulation domain scores, indicating above-average performance for limiting Na+ accumulation and maintaining K+/Na+ ratios across leaf, stem and root tissues.
Other high-biomass maternal sources differed in photosynthetic retention and tissue ion responses. ‘Baramasi Vengurla’ produced the greatest absolute dry mass under saline irrigation, while ‘Ceylon’ maintained high biomass together with relatively high absolute photosynthetic rates. However, both exhibited substantially lower proportional retention and more negative ion-regulation domain scores than ‘Indonesia’ and ‘Pahutan’. Their relatively high biomass under salinity appeared to reflect, at least in part, high baseline growth under control conditions rather than superior proportional retention under stress.
Specialised or restricted response profiles characterised the remaining accessions across both embryonic classes: (i) Photosynthetic maintenance without high biomass production: Accessions such as the wild relative M. zeylanica, alongside polyembryonic accessions ‘Kerala-5’ and ‘Peach’, maintained moderate to relatively high Pn and favorable ion-regulation scores but produced low absolute total dry mass. This pattern indicates that maintenance of photosynthetic performance and ion regulation is not necessarily accompanied by high biomass accumulation under salinity. This response may reflect differences in baseline growth capacity and carbon allocation under stress, although these mechanisms were not directly evaluated here. (ii) Low performance across measured traits: Conversely, polyembryonic accessions widely utilised as commercial rootstocks (e.g., ‘Kurukkan’ and ‘Moovandan’), alongside monoembryonic accessions such as ‘Sooraj’, ‘Little’ and ‘Baramasi Saharanpur’, exhibited concurrent reductions across all evaluation criteria. These accessions showed below-median total dry mass, low net photosynthetic rates under severe salinity (Pn < 2.0 μmol CO2 m−2 s−1), low proportional retention (<50%) and low ion-regulation scores.
Finally, multi-tissue ion regulation was only partially aligned with absolute biomass and photosynthetic capacity. The presence of genotypes displaying effective ion exclusion but limited biomass (e.g., M. odorata, ‘Kerala-5’), alongside accessions with vigorous biomass but less favorable ion regulation (e.g., ‘Baramasi Vengurla’), demonstrates that tissue ion homeostasis and growth maintenance represent complementary, and likely genetically distinct, components of salinity tolerance in mango germplasm.
3.5. Multivariate Structure of Maternal-Source Responses
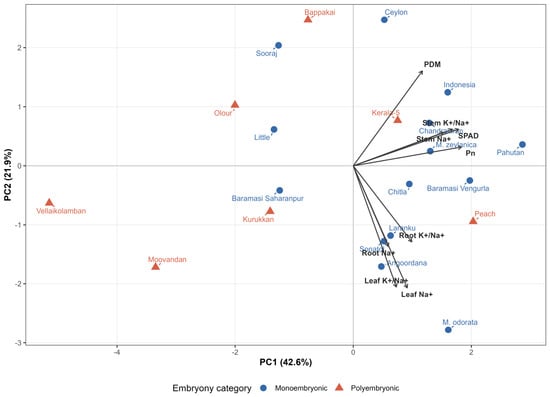
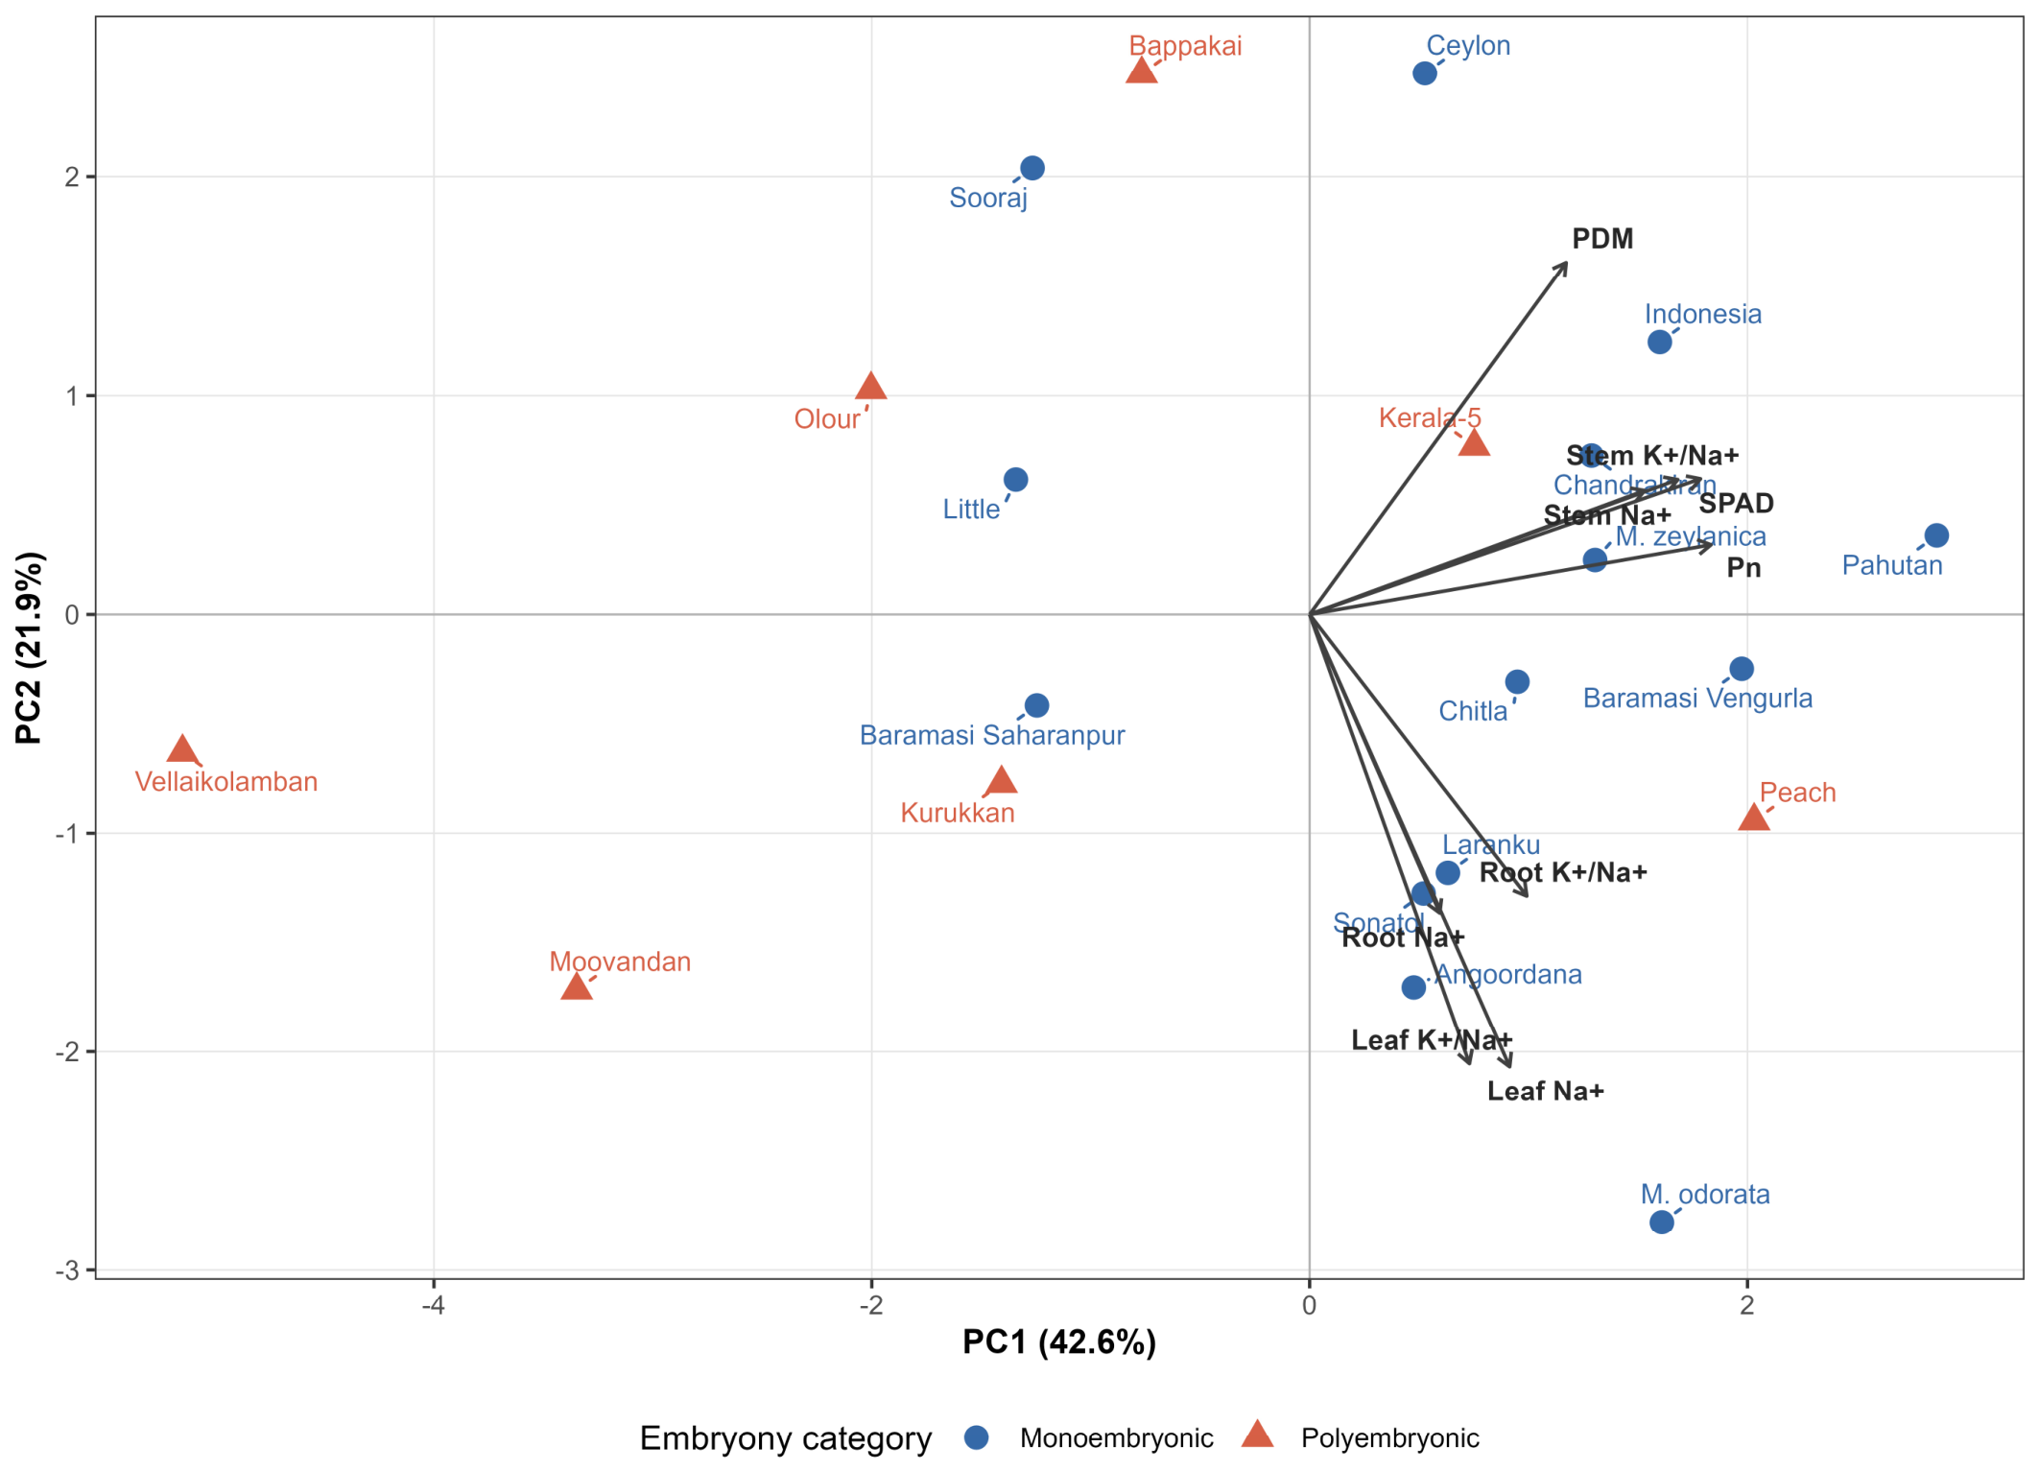
To determine whether these contrasting response profiles reflected a common coordinated response or distinct combinations of physiological traits, control-to-high-salinity responses were examined using PCA. The first two principal components explained 64.5% of the total variance, with PC1 accounting for 42.6% and PC2 for 21.9% of the total variance, respectively (Figure 4).
Figure 4.
Principal component analysis of salinity responses among 21 open-pollinated mango maternal sources. The PCA was performed on nine standardised natural-log response ratios calculated between the 6.0 dS m−1 irrigation treatment and the non-saline control. Arrows indicate variable loadings. Points represent maternal-source scores and are coloured according to the embryo category.
The first two principal components described different patterns of variation among maternal sources. All nine response variables loaded positively on PC1, indicating that this axis represented a common gradient of response to the 6.0 dS m−1 treatment. Net photosynthetic rate and SPAD had the largest PC1 loadings, followed by stem K+/Na+ maintenance at 0.423 and stem Na+ accumulation at 0.385. Together, these four variables contributed 74.2% of the variation represented by PC1. Total plant dry-mass response had a smaller positive loading of 0.295. Thus, high PC1 scores primarily represented maternal sources that maintained photosynthetic function and stem ion regulation under saline irrigation, while low PC1 scores represented coordinated reductions across several response traits. The 95% bootstrap intervals for PC1 remained entirely above zero for several sources with positive PC1 scores, including ‘Pahutan’, ‘Peach’, ‘Baramasi Vengurla’, ‘Indonesia’, M. odorata, M. zeylanica and ‘Chandrakiran’. Conversely, the intervals remained entirely below zero for ‘Vellaikolamban’, ‘Moovandan’, ‘Olour’, ‘Kurukkan’, ‘Little’, ‘Sooraj’ and ‘Baramasi Saharanpur’, supporting the separation of these sources along the principal multivariate gradient.
PC2 contrasted biomass maintenance from leaf and root ion-regulation responses. Total plant dry-mass response loaded positively on PC2 at 0.405, whereas limited leaf Na+ accumulation, leaf K+/Na+ maintenance, limited root Na+ accumulation and root K+/Na+ maintenance loaded negatively, with coefficients ranging from −0.324 to −0.521. Leaf Na+ regulation and leaf K+/Na+ maintenance together contributed 53.8% of PC2, while total dry-mass response contributed a further 16.4%. Positive PC2 scores indicated comparatively strong biomass retention but less favourable leaf and root ion regulation, while negative PC2 scores were associated with relatively stronger ion regulation relative to biomass maintenance. Thus, PC2 represented a contrast between biomass maintenance and tissue ion regulation rather than a simple tolerance gradient.
The distribution of monoembryonic and polyembryonic maternal sources overlapped in the PC1–PC2 space, and substantial variation was evident within both embryo categories. Polyembryonic sources included ‘Peach’ with a strongly positive PC1 score, ‘Kerala-5’ with moderately positive scores on both components and ‘Vellaikolamban’ and ‘Moovandan’ with strongly negative PC1 scores. Similarly, monoembryonic sources spanned the PC1 gradient, with Pahutan at the positive extreme and ‘Baramasi Saharanpur’ and ‘Sooraj’ at the negative extreme. Thus, the PCA did not reveal discrete multivariate separation between embryo categories but instead highlighted substantial variation among individual maternal sources.
The PCA therefore did not reveal discrete multivariate separation between embryo types but instead highlighted considerable differences among individual maternal sources. The biplot also showed close alignment between net photosynthetic rate and SPAD responses, between limited leaf Na+ accumulation and leaf K+/Na+ maintenance and between limited stem Na+ accumulation and stem K+/Na+ maintenance. The corresponding correlations were 0.865, 0.853 and 0.872, respectively. These associations indicate coordinated responses within photosynthetic and organ-specific ion-regulation domains, while also confirming that several ion variables conveyed partly overlapping information.
Overall, PC1 summarised the extent to which maternal sources maintained a coordinated set of growth, photosynthetic and ion-related traits relative to their controls, whereas PC2 distinguished biomass maintenance from leaf and root ion regulation. Pahutan showed the highest PC1 score, while ‘Peach’, ‘Baramasi Vengurla’, M. odorata, ‘Indonesia’, M. zeylanica, and ‘Chandrakiran’ also had positive PC1 scores. However, these sources differed substantially in absolute biomass and photosynthetic performance under the highest salinity treatment. Thus, the PCA describes multidimensional response patterns among maternal sources rather than providing an independent ranking of their potential suitability as rootstock.
4. Discussion
4.1. Saline Irrigation Altered Growth, Photosynthetic Performance and Ion Balance
The coordinated changes in morphological, physiological and ionic traits revealed divergent responses of mango maternal sources to saline irrigation. At 6.0 dS m−1, total plant dry mass declined by approximately 41%, with reductions in leaf, stem and root biomass. Plant height, stem diameter and leaf number were also reduced. Similar growth inhibition has been reported in mango seedlings and rootstock genotypes exposed to salinity, although the magnitude of the response varies substantially among materials evaluated [9,10,11,12,13]. Previous evaluations have similarly reported reductions in plant height, leaf production, leaf area and dry matter in mango seedlings with increasing salinity [10]. The smaller proportional reduction in root dry mass than in shoot dry mass resulted in an increased root-to-shoot ratio. However, because root biomass also declined in absolute terms, this shift primarily reflects greater sensitivity of shoot growth rather than enhanced root production [23]. Maintenance of a relatively larger root system could contribute to water and nutrient acquisition under saline conditions. Nonetheless, the endpoint measurements in the present study do not establish whether this shift in biomass partitioning was adaptive. Another limitation is that because responses were evaluated after 18 weeks of saline irrigation, the relative contributions of the early osmotic effects and progressively developing effects of ion accumulation cannot be distinguished.
The decline in growth was accompanied by marked reductions in leaf SPAD index, net photosynthetic rate (Pn), transpiration rate (E) and intercellular CO2 concentration (Ci). Reduced gas exchange can constrain carbon assimilation, thereby limiting leaf expansion and biomass accumulation and contributing to the close association between physiological performance and growth under salinity. The concurrent reductions in Pn, E and Ci are consistent with an important stomatal component of photosynthetic limitation [24].
Salt stress can severely impair photosynthetic assimilation through multiple interacting processes, including pigment degradation, oxidative damage to photosynthetic tissues and reduced CO2 availability within the leaf [25]. In our study, the substantial reduction in net photosynthetic rate under severe salinity points to both stomatal and non-stomatal restrictions on carbon assimilation, although the magnitude of such responses typically varies with species, stress severity and experimental conditions [26]. The decrease in Pn was proportionally greater than the decrease in E, resulting in lower WUEi. Thus, the reduction in transpiration did not compensate for the higher loss of carbon assimilation. Because WUEi was calculated as Pn/E, this response reflects the relative changes in its two component variables and should not be interpreted as an independent mechanism of salinity tolerance [27].
Concurrently, reductions in gas exchange and SPAD values were accompanied by marked increases in anthocyanin and flavonol optical indices. Under conditions of constrained carbon assimilation, plants may accumulate epidermal phenolic compounds that help mitigate radiation-induced and oxidative stress associated with excess absorbed light energy [28]. However, because anthocyanin and flavonol levels in the present study were estimated via non-destructive optical indices, further biochemical analyses are required to confirm their protective role in salinity tolerance.
4.2. Absolute Performance and Retention Reveal Contrasting Candidate Profiles
The wide variation in plant growth under control conditions among maternal sources creates a challenge for candidate selection. Ranking sources solely on absolute performance under salinity may favour materials with high constitutive vigour, whereas ranking solely on proportional retention may favour less vigorous plants that experience little relative reduction but still produce limited biomass [29]. Considering stressed performance together with proportional retention therefore provides a more informative basis for comparing maternal sources and identifying promising materials for further evaluation. ‘Indonesia’ and ‘Pahutan’ showed the most favourable combination of absolute performance under 6.0 dS m−1 and proportional retention relative to their respective controls. Specifically, ‘Indonesia’ retained 80.4% of control dry mass and 89.4% of control Pn, whereas ‘Pahutan’ retained 79.1% and 85.6%, respectively. Their performance therefore reflected neither high constitutive size alone nor favourable retention from a low baseline. Instead, both sources combined meaningful biomass production under saline irrigation with limited proportional losses in two key performance traits.
‘Ceylon’ and ‘Baramasi Vengurla’ presented a different but potentially useful response profile. ‘Baramasi Vengurla’ produced the greatest total dry mass under the highest salinity treatment, while ‘Ceylon’ maintained both high absolute biomass and a comparatively high net photosynthetic rate. Their proportional retention, particularly for Pn, was less favourable than that of ‘Indonesia’ and ‘Pahutan’. These sources can therefore be characterised primarily by their capacity to maintain relatively high absolute performance under saline irrigation rather than by minimal change from the control.
Other maternal sources exhibited more specialised response profiles. M. zeylanica maintained a relatively high Pn, together with high photosynthetic retention and strong SPAD retention, although its absolute biomass remained moderate. ‘Kerala-5’ also had a high absolute Pn at 6.0 dS m−1 despite low plant biomass. ‘Peach’ retained a relatively large proportion of its control photosynthetic rate but produced the lowest dry mass among the selected sources. ‘Chandrakiran’ occupied an intermediate position for both biomass and photosynthetic performance.
Plant dry matter integrates carbon assimilation over time with leaf area development, respiration, biomass allocation and tissue turnover, whereas Pn represents leaf-level photosynthetic activity measured at a specific point in time under defined conditions. Thus, a small plant may maintain a relatively high Pn while having insufficient total leaf area or cumulative duration of carbon gain to achieve high whole-plant biomass [30]. These contrasting profiles demonstrate that maintenance of photosynthesis does not necessarily translate directly into high biomass accumulation. The candidate diagram is useful because it preserves these distinctions. Absolute biomass and Pn are displayed directly, while bubble size summarises their joint retention, and colour represents ion regulation. It should nevertheless be interpreted as a comparative screening tool rather than as a definitive classification of salinity tolerance. Based on the combined evidence, ‘Indonesia’ and ‘Pahutan’ warrant priority for further validation, while ‘Ceylon’ and ‘Baramasi Vengurla’ represent high-vigour candidates, and the remaining selected sources provide contrasting physiological profiles.
4.3. Ion Regulation Contributed to Response Diversity but Did Not Determine Performance Alone
Saline irrigation increased Na+ concentrations in leaves, stems and roots while reducing K+ concentrations and organ K+/Na+ ratios. The strongest proportional increase occurred in leaves, indicating substantial Na+ accumulation in photosynthetically active tissues over the 18-week treatment period [31]. Similar patterns have been documented in polyembryonic mango genotypes, where salinity drives Na+ accumulation, alters nutrient concentrations and creates marked variation in root-to-shoot ion partitioning [10,13]. Comparatively salt-tolerant rootstocks often exhibit restricted Na+ or Cl- transport to sensitive tissues, although the organs responsible for ion exclusion or retention vary among genotypes.
In the present study, ion regulation and growth maintenance were related but distinct components of the response to salinity. Some maternal mango sources exhibited effective ion regulation without accumulating high biomass, whereas maternal sources with high biomass did not invariably maintain the most favorable ion balances. This incomplete correspondence is biologically plausible because tissue ion concentrations reflect the combined effects of uptake, transport and distribution among tissues and growth-driven dilution. Consequently, a low tissue Na+ concentration cannot automatically be attributed to root exclusion. It may instead derive from retention in non-photosynthetic organs, reduced transpirational flux, intracellular sequestration or biomass dilution [32]. Conversely, a source that maintains vigor despite high tissue Na+ may possess greater tissue-level tolerance or more effective vacuolar compartmentation. Distinguishing among these specific physiological mechanisms would require total ion content modelling and subcellular localisation assays. Therefore, tissue ion concentrations and ion ratios should not be used as standalone proxies for salinity tolerance in early-stage screening. Instead, ion profiling is most valuable when integrated alongside biomass tracking to distinguish tissue-level tolerance from ion exclusion strategies across candidate rootstock lineages [33].
4.4. Multivariate Analysis Supports Multiple Response Strategies
The PCA summarised coordinated responses across growth, photosynthetic and ion-related traits. PC1 captured a general gradient of coordinated response, with the largest contributions from Pn SPAD, stem K+/Na+ maintenance and restricted stem Na+ accumulation. This pattern emphasises the importance of maintaining photosynthetic function and stem ion balance in differentiating the evaluated maternal sources. The close alignment of Pn and SPAD suggests that sources retaining chlorophyll-related optical properties also tended to maintain photosynthetic activity. Nevertheless, SPAD is an indirect index influenced by chlorophyll concentration, leaf structure and leaf thickness and should not be interpreted as a direct measurement of photosynthetic capacity. Its association with Pn is physiologically meaningful but does not demonstrate that chlorophyll loss was the primary cause of reduced photosynthesis.
PC2 distinguished relative biomass maintenance from leaf and root ion regulation. This contrast reinforces the observation that growth under saline irrigation did not depend uniformly on low tissue Na+ accumulation or high K+/Na+ retention. Some maternal sources maintained biomass despite less favourable leaf or root ion responses, while others displayed favourable ion regulation without comparable biomass production. Salinity response in this germplasm panel therefore appears to involve different combinations of physiological traits rather than a single common response profile.
The positions of ‘Pahutan’, ‘Indonesia’, ‘Baramasi Vengurla’, ‘Peach’ and M. odorata illustrate these differences. ‘Pahutan’ showed the strongest coordinated response along PC1, whereas ‘Indonesia’ combined a positive multivariate response with high absolute performance under salinity. ‘Baramasi Vengurla’ aligned more closely with biomass maintenance, whereas ‘Peach’ and M. odorata achieved positive PC1 scores through relatively stronger physiological responses despite their lower biomass.
Consistent with the univariate analyses and candidate mapping, monoembryonic and polyembryonic maternal sources overlapped in the PCA, with substantial variation within each category. This implies that within the material evaluated, embryo category alone does not consistently distinguish multivariate salinity-response profiles.
4.5. Implications for Mango Rootstock Selection
The results identify ‘Indonesia’ and ‘Pahutan’ as the most promising maternal sources for further evaluation because they combined high proportional retention with substantial absolute biomass and photosynthetic activity under the highest saline-irrigation treatment. ‘Ceylon’ and ‘Baramasi Vengurla’ also warrant further attention because of their high absolute biomass under salinity. M. zeylanica, ‘Kerala-5’, ‘Chandrakiran’, ‘Peach’ and M. odorata provide contrasting profiles that may be useful for investigating specific components of photosynthetic maintenance and ion regulation. The identified candidates represent maternal sources whose open-pollinated seedling progenies showed promising average responses. Individual candidate genotypes intended for uniform rootstock deployment should subsequently be tested as vegetatively propagated material and evaluated after grafting with relevant scion cultivars. Moreover, the present experiment evaluated ungrafted juvenile seedlings, whereas horticultural rootstock performance depends on the interaction between rootstock and scion. Selected sources should therefore be tested for propagation efficiency, uniformity, graft compatibility and their effects on scion growth, nutrient status and productivity [33].
Longer-term experiments should determine whether early advantages in biomass accumulation and photosynthetic activity persist as salts accumulate in the root zone and plant tissues. Repeated measurements over time would help distinguish early osmotic responses from later ion-related effects. Ultimately, evaluation of grafted plants under field conditions will be required to establish whether the selected materials improve orchard establishment, canopy development and productivity where saline irrigation cannot be avoided.
Overall, the present study demonstrates substantial variation in response to saline-irrigation among mango maternal sources, which cannot be adequately predicted from embryo category alone. Combining absolute performance with proportional retention identifies candidates that might be overlooked when either criterion is considered in isolation, while ion analysis and PCA reveal distinct physiological response profiles among maternal sources. This integrated framework provides a basis for prioritising contrasting mango maternal sources for further rootstock evaluation while recognising that their suitability must be validated using clonal or genetically verified material under grafted, soil-based and field conditions.
5. Conclusions
Seedling progenies of open-pollinated maternal sources differed substantially in growth, photosynthetic performance and ion regulation during 18 weeks of saline irrigation. Maternal-source variation provided more informative screening information than the overall contrast between monoembryonic and polyembryonic maternal sources. Using a screening framework that combines stressed performance, proportional retention and complementary physiological domains, rather than an unqualified average of multiple correlated traits, the study identified ‘Indonesia’ and ‘Pahutan’ as showing the strongest combined maintenance of total dry mass and net photosynthetic rate under 6.0 dS m−1 irrigation. ‘Ceylon’ and ‘Baramasi Vengurla’ maintained high absolute biomass, whereas M. zeylanica, ‘Kerala-5’, ‘Chandrakiran’ and ‘Peach’ expressed favourable responses for selected traits but differed in size and overall biomass maintenance. These materials should therefore be regarded as contrasting candidate maternal sources for further evaluation in salt-tolerant rootstock development. Validation using genetically verified, clonally propagated and grafted material under longer-term, soil-based and field conditions is required before definitive recommendations can be made.
Supplementary Materials
The following supporting information can be downloaded at https://www.mdpi.com/article/10.3390/horticulturae12111318/s1: Figure S1. Residual diagnostic plots for linear mixed-effects models fitted to 24 growth, biomass, physiological, optical and ion-related traits of open-pollinated mango maternal sources exposed to saline irrigation. For each trait, the left panel shows conditional Pearson residuals plotted against conditional fitted values, with a dashed horizontal line at zero and a red locally weighted smooth included as visual references. The right panel shows a normal Q–Q plot of the conditional Pearson residuals, with the red line indicating the expected relationship under residual normality. Models included saline-irrigation treatment, embryo category and their interaction as fixed effects, with maternal source nested within embryo category fitted as a random intercept. Models were estimated by restricted maximum likelihood. Four seedlings were evaluated per maternal source and treatment. Table S1. Electrical conductivity, pH and ionic composition of the control and saline irrigation waters used in the experiment. Saline irrigation treatments were prepared by diluting naturally saline groundwater to target electrical conductivities of 3.0 and 6.0 dS m−1. ECiw, electrical conductivity of irrigation water; Na+, sodium; K+, potassium; Ca2+ + Mg2+, combined calcium and magnesium concentration; Cl−, chloride; HCO3−, bicarbonate; meq L−1, milliequivalents per litre. Table S2. Fixed effects, estimated marginal means and variance components for growth, biomass, physiological, optical and ion-related traits of mango seedlings exposed to saline irrigation. Type III tests are reported for saline-irrigation treatment (S), embryo category (E) and their interaction (S × E) from linear mixed-effects models fitted separately for each trait. Irrigation-water electrical conductivity was treated as a categorical fixed effect with levels of 0, 3.0 and 6.0 dS m−1, and maternal source nested within embryo category was included as a random intercept. Numerator and denominator degrees of freedom, F statistics and P values are shown for each fixed effect; denominator degrees of freedom were estimated using the Kenward–Roger approximation. Estimated marginal means and 95% confidence intervals are reported for each irrigation-water EC treatment. ‘EC6 as a percentage of control’ represents the estimated mean at 6 dS m−1 divided by the control estimated mean and multiplied by 100. ‘Percentage change from EC0 to EC6’ was calculated as 100 × (EC6 − EC0)/EC0. Positive values indicate an increase and negative values indicate a decrease relative to the control. Family and residual variance components are also reported. All models were non-singular. Four seedlings were evaluated for each maternal source × saline-irrigation treatment combination. Table S3. Absolute performance and proportional retention of total plant dry mass and net photosynthetic rate for 21 open-pollinated mango (Mangifera spp.) maternal sources under the highest saline-irrigation treatment. PDM at 6 and Pₙ at 6 represent maternal-source means at an irrigation-water electrical conductivity of 6.0 dS m−1. Retention was calculated separately for each maternal source as the mean value at 6.0 dS m−1 divided by the corresponding mean under the non-saline control and multiplied by 100. Emb., embryo category; M, monoembryonic; P, polyembryonic; PDM, total plant dry mass, expressed as g plant−1; Pₙ, net photosynthetic rate, expressed as µmol CO2 m−2 s−1. Each mean is based on four seedlings per maternal source and treatment. Table S4. Numerical output of the principal component analysis of saline-irrigation responses among 21 open-pollinated mango (Mangifera spp.) maternal sources. The PCA was performed on nine standardised natural-log response ratios calculated from maternal-source means under the 6.0 dS m−1 irrigation treatment relative to the corresponding non-saline control. The variables comprised total plant dry mass, net photosynthetic rate, SPAD chlorophyll index, Na+ concentrations in leaves, stems and roots and K+/Na+ ratios in the corresponding organs. Na+ log-response ratios were multiplied by −1 before standardisation so that more positive values consistently represented comparatively limited Na+ accumulation. Variables were centred and scaled to unit variance. Table S4a: Eigenvalues and explained variance; Table S4b: PC1 and PC2 loadings, contributions and communalities; Table S4c: Maternal-source scores and bootstrap intervals; Table S4d: PCA variables, calculations and favourable response directions; Table S4e: Correlation matrix.
Author Contributions
Conceptualisation, A.S. (Anshuman Singh); methodology, A.S. (Anshuman Singh), A.K. and R.K.; formal analysis, A.S. (Anshuman Singh), J.P., G.C., B.B., D.S.M. and A.S. (Akath Singh); investigation, A.S. (Anshuman Singh), A.K., R.K. and R.K.Y.; resources, A.K., R.K., P.C.S. and R.K.Y.; data curation, A.S. (Anshuman Singh); writing—original draft preparation, A.S. (Anshuman Singh), G.C., P.K., B.B. and J.P.; writing—review and editing, A.S. (Anshuman Singh), G.C., B.B., P.K., A.S. (Akath Singh), R.K., P.C.S. and R.K.Y.; visualisation, A.S. (Anshuman Singh) and G.C.; project administration, P.C.S. All authors have read and agreed to the published version of the manuscript.
Funding
This research was funded by the Department of Agriculture, Government of Haryana, under the Rashtriya Krishi Vikas Yojana (RKVY) grant for the project ‘Identification of Salt-Tolerant Scion and Rootstocks in Mango and Low-Chill Temperate Fruits’ (Project ID: NRMA CSSRICOL201702200946).
Data Availability Statement
The original contributions presented in this study are included in the article/Supplementary Materials. Further inquiries can be directed to the corresponding author (As.S.).
Acknowledgments
The authors gratefully acknowledge the financial support provided by Rashtriya Krishi Vikas Yojana, Haryana, and the logistical support provided by the Director, ICAR–Central Soil Salinity Research Institute, Karnal. The authors also thank the Director, ICAR–Indian Agricultural Research Institute, New Delhi; Director, ICAR–Central Institute for Subtropical Horticulture, Lucknow; and Joint Director (Horticulture Research and Training Centre), Saharanpur, Government of Uttar Pradesh, for providing the experimental material used in this study.
Conflicts of Interest
The authors declare no conflicts of interest.
References
- Denaxa, N.-K.; Nomikou, A.; Malamos, N.; Liveri, E.; Roussos, P.A.; Papasotiropoulos, V. Salinity effect on plant growth parameters and fruit bioactive compounds of two strawberry cultivars, coupled with environmental conditions monitoring. Agronomy 2022, 12, 2279. [Google Scholar] [CrossRef] [Scilit]
- Melino, V.; Tester, M. Salt-Tolerant Crops: Time to Deliver. Annu. Rev. Plant Biol. 2023, 74, 671–696. [Google Scholar] [CrossRef] [Scilit] [PubMed]
- Carneiro, M.A.; Lima, A.M.N.; Cavalcante, Í.H.L.; Cunha, J.C.; Rodrigues, M.S.; Lessa, T.B.d.S. Soil salinity and yield of mango fertigated with potassium sources. Rev. Bras. Eng. Agríc. Ambient. 2017, 21, 310–316. [Google Scholar] [CrossRef] [Scilit][Green Version]
- Chaudhari, S.K.; Singh, A. NRM interventions for enhanced mango productivity and quality. Adv. Agric. Res. Technol. J. 2019, 3, 9–29. [Google Scholar]
- Iqbal, J.; Kiran, S.; Hussain, S.; Iqbal, R.K.; Ghafoor, U.; Younis, U.; Zarei, T.; Naz, M.; Germi, S.G.; Danish, S.; et al. Acidified Biochar Confers Improvement in Quality and Yield Attributes of Sufaid Chaunsa Mango in Saline Soil. Horticulturae 2021, 7, 418. [Google Scholar] [CrossRef] [Scilit]
- Negrão, S.; Schmöckel, S.M.; Tester, M. Evaluating physiological responses of plants to salinity stress. Ann. Bot. 2016, 119, 1–11. [Google Scholar] [CrossRef] [Scilit] [PubMed]
- Shavrukov, Y. Salt stress or salt shock: Which genes are we studying? J. Exp. Bot. 2012, 64, 119–127. [Google Scholar] [CrossRef] [Scilit] [PubMed]
- de Lucena, C.C.; de Siqueira, D.L.; Martinez, H.E.P.; Cecon, P.R. Salt stress change chlorophyll fluorescence in mango. Rev. Bras. Frutic. 2012, 34, 1245–1255. [Google Scholar] [CrossRef] [Scilit]
- Pandey, P.; Singh, A.K.; Dubey, A.K.; Awasthi, O.P. Effect of salinity stress on growth and nutrient uptake in polyembryonic mango rootstocks. Indian J. Hortic. 2014, 71, 28–34. [Google Scholar]
- Pandey, P.; Singh, A.K.; Dubey, A.K.; Dahuja, A. Biochemical and salt ion uptake responses of seven mango (Mangifera indica L.) rootstocks to NaCl stress. J. Hortic. Sci. Biotechnol. 2014, 89, 367–372. [Google Scholar] [CrossRef] [Scilit]
- Mahouachi, J. Long-term salt stress influence on vegetative growth and foliar nutrient changes in mango (Mangifera indica L.) seedlings. Sci. Hortic. 2018, 234, 95–100. [Google Scholar] [CrossRef] [Scilit]
- Nimbolkar, P.K.; Reju, M.K.; Varalakshmi, L.R.; Upreti, K.K.; Laxman, R.H.; Kalaivanan, D. Mineral nutrient composition in leaf and root tissues of fifteen polyembryonic mango genotypes, grown under varying levels of salinity. J. Hortic. Sci. 2021, 16, 164–176. [Google Scholar] [CrossRef] [Scilit]
- Nimbolkar, P.K.; Kurian, M.R.; Upreti, K.K.; Laxman, R.H.; Shivashankara, K.S.; Varalakshmi, L.R. Physio-biochemical responses of polyembryonic mango (Mangifera indica L.) genotypes to varying levels of salinity stress. J. Hortic. Sci. 2023, 18, 150–161. [Google Scholar] [CrossRef] [Scilit]
- Ahmed, N.; Khalid, S.; Grewal, A.G.; Ali, M.A.; Anjum, M.A.; Rahi, A.A.; Danish, S. Performance of mango scion cultivars under various levels of artificially induced salinity stress. Pak. J. Bot. 2020, 52, 1143–1158. [Google Scholar] [CrossRef] [Scilit] [PubMed]
- Muhammed, M.A.A.; Mohamed, A.K.S.H.; Qayyum, M.F.; Haider, G.; Ali, H.A.M. Physiological response of mango transplants to phytohormones under salinity stress. Sci. Hortic. 2022, 296, 110918. [Google Scholar] [CrossRef] [Scilit]
- Saúco, V.G. Mango rootstock, a review. Acta Hortic. 2019, 1244, 1–16. [Google Scholar] [CrossRef] [Scilit]
- Dubey, A.K.; Sharma, R.M.; Deepak; Kumar, A. Long term performance of mango varieties on five polyembryonic rootstocks under subtropical conditions: Effect on vigour, yield, fruit quality and nutrient acquisition. Sci. Hortic. 2021, 280, 109944. [Google Scholar] [CrossRef] [Scilit]
- Perveen, N.; Dinesh, M.R.; Sankaran, M.; Ravishankar, K.V.; Krishnajee, H.G.; Hanur, V.S.; Alamri, S.; Kesawat, M.S.; Irfan, M. Comparative transcriptome analysis provides novel insights into molecular response of salt-tolerant and sensitive polyembryonic mango genotypes to salinity stress at seedling stage. Front Plant Sci. 2023, 14, 1152485. [Google Scholar] [CrossRef] [Scilit] [PubMed]
- Damodaran, T.; Rajan, S.; Jha, S.K.; Misra, V.K.; Sahu, A. Screening polyembryonic mango accessions for salt tolerance and assessing dynamics of sodium (Na+), potassium (K+), and antioxidants. Fruits 2018, 73, 228–235. [Google Scholar] [CrossRef] [Scilit]
- Rhodes, A.M.; Campbell, C.; Malo, S.E.; Carmer, S.G. A Numerical Taxonomic Study of the Mango Mangifera indica L.1. J. Am. Soc. Hortic. Sci. 1970, 95, 252–256. [Google Scholar] [CrossRef] [Scilit]
- Zakaria, W.; Malik, T.A.; Masri, M. Germination pattern of three Mangifera species. J. Trop. Agric. Food Sci. 2002, 30, 163–172. [Google Scholar]
- Kanade, N.M.; Kurian, R.M.; Sankaran, M. Differential expression of polyembryony in certain mango genotypes. Indian J. Hortic. 2022, 79, 415–421. [Google Scholar] [CrossRef] [Scilit]
- Singh, A.; Kumar, A.; Kumar, R.; Prakash, J.; Kumar, N.; Verma, A.K. Evaluation of salt tolerance in jamun (Syzygium cumini L. Skeels) using morpho-physiological traits and membership function analysis. Sci. Hortic. 2024, 326, 112742. [Google Scholar] [CrossRef] [Scilit]
- El-Katony, T.M.; Hassan, N.M.; Abo-Ismael, S.H.; Abdelfatah, S.N. Salinity stress and drought stress differentially affect biomass allocation, leaf orientation and performance of two sesame (Sesamum indicum L.) cultivars. BMC Plant Biol. 2026, 26, 1336. [Google Scholar] [CrossRef] [Scilit] [PubMed]
- Khoshbakht, D.; Asghari, M.R.; Haghighi, M. Effects of foliar applications of nitric oxide and spermidine on chlorophyll fluorescence, photosynthesis and antioxidant enzyme activities of citrus seedlings under salinity stress. Photosynthetica 2018, 56, 1313–1325. [Google Scholar] [CrossRef] [Scilit]
- Flexas, J. Drought-inhibition of Photosynthesis in C3 Plants: Stomatal and Non-stomatal Limitations Revisited. Ann. Bot. 2002, 89, 183–189. [Google Scholar] [CrossRef] [Scilit] [PubMed]
- Pérez-Pérez, J.G.; Robles, J.M.; García-Sánchez, F.; Botía, P. Comparison of deficit and saline irrigation strategies to confront water restriction in lemon trees grown in semi-arid regions. Agric. Water Manag. 2016, 164, 46–57. [Google Scholar] [CrossRef] [Scilit]
- Kumar, K.; Debnath, P.; Singh, S.; Kumar, N. An Overview of Plant Phenolics and Their Involvement in Abiotic Stress Tolerance. Stresses 2023, 3, 570–585. [Google Scholar] [CrossRef] [Scilit]
- Temme, A.A.; Kerr, K.L.; Donovan, L.A. Vigour/tolerance trade-off in cultivated sunflower (Helianthus annuus) response to salinity stress is linked to leaf elemental composition. J. Agron. Crop Sci. 2019, 205, 508–518. [Google Scholar] [CrossRef] [Scilit]
- Jung, D.; Lee, J.; Kang, W.; Hwang, I.; Son, J. Estimation of Whole Plant Photosynthetic Rate of Irwin Mango under Artificial and Natural Lights Using a Three-Dimensional Plant Model and Ray-Tracing. Int. J. Mol. Sci. 2018, 19, 152. [Google Scholar] [CrossRef] [Scilit] [PubMed]
- Othman, Y.A.; Hani, M.B.; Ayad, J.Y.; St Hilaire, R. Salinity level influenced morpho-physiology and nutrient uptake of young citrus rootstocks. Heliyon 2023, 9, e13336. [Google Scholar] [CrossRef] [Scilit] [PubMed]
- Rius-García, X.; Videgain-Marco, M.; Casanova-Gascón, J.; Acuña-Rello, L.; Zufiaurre-Galarza, R.; Martín-Ramos, P. Evaluation of Salt Tolerance in Four Self-Rooted Almond Genotypes for Super-High-Density Orchards Under Varying Salinity Levels. Agriculture 2025, 15, 254. [Google Scholar] [CrossRef] [Scilit]
- Sousa, V.F.d.O.; dos Santos, G.L.; Maia, J.M.; Maia Júnior, S.d.O.; Santos, J.P.d.O.; Costa, J.E.; da Silva, A.F.; Dias, T.J.; Ferreira-Silva, S.L.; Taniguchi, C.A.K. Salinity-tolerant dwarf cashew rootstock has better ionic homeostasis and morphophysiological performance of seedlings. Rev. Bras. Eng. Agríc. Ambient. 2023, 27, 92–100. [Google Scholar] [CrossRef] [Scilit]

Disclaimer/Publisher’s Note: The statements, opinions and data contained in all publications are solely those of the individual author(s) and contributor(s) and not of MDPI and/or the editor(s). MDPI and/or the editor(s) disclaim responsibility for any injury to people or property resulting from any ideas, methods, instructions or products referred to in the content. |
© 2026 by the authors. Licensee MDPI, Basel, Switzerland. This article is an open access article distributed under the terms and conditions of the Creative Commons Attribution (CC BY) license.