


Abstract
This study evaluated the economic and environmental performance of three pear production systems in the Altiplano region of Murcia, Spain: conventional cultivation (CC), organic cultivation (EC), and organic cultivation with biological control (ECB). Life Cycle Costing (LCC) and Life Cycle Assessment (LCA) were combined to calculate and compare production costs, profitability, and environmental impacts derived from the systems. Pear cultivation required a high initial investment although its cost accounting is dominated by variable costs. Despite slightly higher unit production costs, the organic systems were more profitable due to higher market prices. Environmentally, EC and ECB were less impactful than the conventional system in 8 of the 11 impact categories assessed. These results were mainly attributed to a lower use of fertilizer units, the use of organic fertilizers and pesticides instead of synthetic ones, and yields similar to those of the conventional system. In the CC system, synthetic fertilizer production was the main environmental hotspot, while in the organic systems the contributions were evenly distributed across different components. Compared with pear production in other Mediterranean areas, the three systems studied exhibited low greenhouse gas emissions (0.103–0.061 kg CO2 eq kg−1 of pears), mainly due to optimized fertilizer units, lower mechanization and similar yields to those reported in other areas. Overall, the results indicate that all three production systems are economically viable, profitable and with environmental performance in line with other studies. However, organic pear production, particularly when combined with biological control, is in this case the most profitable alternative and shows the most favorable environmental profile in the majority of the impact categories.
1. Introduction
Agrifood systems play an essential role in ensuring global food security and in the economic development of rural areas. However, they are also major contributors to climate change, biodiversity loss and the degradation of the natural resources [1,2]. At present, agrifood systems are responsible for approximately one-third of global anthropogenic greenhouse gas (GHG) emissions, originating from both agricultural activities and the associated processes with the food supply chain [3,4]. Furthermore, agriculture is the world’s largest consumer of freshwater, accounting for approximately 70% of global withdrawals [5]. It also relies heavily on inputs whose production requires high energy consumption derived from fossil fuels, such as mineral fertilizers and synthetic plant protection products, as well as on fuel for agricultural machinery and water pumping for irrigation [6,7,8]. The growing global demand for food, joined with the increasing scarcity of natural resources and the impacts of climate change, presents the challenge of increasing agrifood production while minimizing resources consumption and the associated environmental impacts [9]. In this context, the transition to more efficient and sustainable production systems has become a priority for both the scientific community and international agricultural policies.
In this context, organic agriculture has been established as one of the principal strategies for reducing the environmental impacts of agricultural production through the substitution of synthetic fertilizers and plant protection products with organic alternatives. This management approach promotes key ecosystem functions, such as increasing soil organic matter, enhancing soil organic carbon sequestration, and improving cation exchange capacity (CEC) [7,10].
Spain is one of the European countries with the largest area under organic farming, with approximately three million hectares certified in 2024 [11]. Nevertheless, the environmental superiority of these production systems cannot be taken for granted, since differences in productivity, input use, and management practices may substantially affect the environmental impact per unit of product [12].
Life Cycle Assessment (LCA) is a well-established methodology for evaluating and comparing the environmental performance of different agricultural systems and for identifying the environmental hotspots that contribute most significantly to their impacts [12,13,14,15,16]. In fruit production systems, several studies have demonstrated that the environmental performance of conventional and organic farming depends on multiple factors, including crop yield, management practices, climatic conditions, and the choice of functional unit used in the life cycle assessment [17,18,19,20]. In particular, although organic farming does not rely on synthetic inputs, this does not necessarily result in a lower environmental impact per unit of product, as lower crop yields may partially or even completely offset the environmental benefits associated with the absence of synthetic inputs [12].
The sustainability of a production system depends not only on environmental performance but also on its socioeconomic viability. Management practices can influence crop yield as well as the production costs associated with fertilizers, plant protection products, and labor and machinery use, ultimately determining the economic profitability of the orchard.
In organic farming systems, the use of authorized inputs and the implementation of specific management practices may lead to higher production costs and/or lower productivity than in conventional farming systems [12,21]. Therefore, understanding the economic performance of different production systems is essential for assessing both the economic and environmental sustainability of farms [12,22,23,24,25]. This approach is also aligned with the objectives of the European Farm to Fork Strategy and the regulatory framework established by the Spanish Food Chain Act (Act 12/2013, as amended by Act 16/2021), which seek to enhance transparency in cost formation throughout the agrifood chain and ensure fair remuneration for agricultural producers.
Fruit crops are of particular interest because of their long productive lifespan and the cumulative effects of management practices on both environmental and economic performance [26]. In southeastern Spain, pear production is concentrated in the Altiplano region of Murcia, particularly in the municipalities of Jumilla and Yecla, where the Protected Designation of Origin (PDO) Pera de Jumilla is located [27]. This production system, which is characteristic of semi-arid Mediterranean conditions, faces major challenges associated with limited water availability, increasing climate variability, and growing pressure from pests and diseases, all of which threaten its long-term sustainability and economic viability [12]. As a result, the cultivated area has declined by approximately 18% over the past decade, highlighting the need for more sustainable and resilient production strategies [27].
Organic farming has emerged as a promising alternative to conventional management, while the integration of biological control strategies offers additional opportunities to reduce the use of synthetic plant protection products and promote more sustainable pest management [24]. Nevertheless, the environmental and economic implications of these alternative production systems for Mediterranean pear orchards remain insufficiently understood.
Although LCA and Life Cycle Costing (LCC) have been widely applied to a range of fruit crops [12,22,28], studies addressing pear production under Mediterranean conditions remain scarce. In particular, no previous study has jointly applied LCA and LCC to compare conventional, organic, and organic production systems incorporating biological control in pear production under Mediterranean conditions. This research gap is particularly relevant in the context of European policies promoting greater transparency regarding both production costs and the environmental performance of agricultural products. However, relatively few studies have combined LCA and LCC to provide an integrated assessment of the environmental and economic performance of different production systems, and evidence comparing three alternative management systems within the same production context remains limited.
The present study was conducted within the framework of the PRIMA DREAM project, which aims, among other objectives, to evaluate alternative management practices to conventional production systems in Mediterranean fruit production areas.
Accordingly, the aim of this study was to jointly assess the environmental and economic performance of three representative pear production systems in the Altiplano region of Murcia: conventional (CC), organic (EC), and organic with biological control (ECB). To this end, Life Cycle Assessment (LCA) and Life Cycle Costing (LCC) were combined to compare the three production systems, identify their main environmental and economic hotspots, and evaluate the trade-offs between productivity, production costs, and environmental impacts.
2. Materials and Methods
2.1. Description of the Study Area and Production Systems
The study area of this work is focused in southeastern Spain, where the largest pear production area is located in the Altiplano region (Murcia), within the municipalities of Jumilla and Yecla [27].
This territory has certain particular characteristics that are not found in other pear-producing regions of Spain, such as its climate, which is characterized by mild winters, hot summers, low rainfall typical of southeastern Spain, and generally light winds [29,30,31]. These conditions make it particularly suitable for pear cultivation. The area is recognized under the Protected Designation of Origin (PDO) Pera de Jumilla. The harvesting season is a distinguishing feature of pear cultivation due to its earliness. The Ercolini variety is predominant, accounting for 87% of total production, while the Blanquilla and Etrusca varieties are used as pollinizers.
2.2. Establishment of the Production Systems and Data Collection
The crop analyzed in this study is pear cultivated at a planting density of 4 m × 2 m, with localized drip irrigation using two pressure-compensating emitters of 4 L/h per tree, the main variety being Ercolini, with Blanquilla as the pollinizer and BA-29 as the rootstock. Three production systems are compared and analyzed: conventional cultivation (CC), organic cultivation (EC), and organic cultivation with a biological control strategy (ECB).
Data on the production process used to establish the production models and their cost and revenue structures were collected in 2025 through 12 on-site surveys con-ducted with growers and technical specialists from the sector, most of whom belonged to the Campos de Jumilla Cooperative, which represents nearly 80% of the area under the PDO Pera de Jumilla. The 12 surveys were conducted with 12 producers from the cooperative, with four producers representing each production system. Each producer managed an individual farm supervised by a cooperative technician. The technicians, who oversee multiple farms, selected the producers based on their knowledge of the production systems and farming practices in the study area. The information collected therefore reflects the practices considered representative of each production system rather than the specific management practices of individual farms. In addition, the production systems were established using information from previous publications by the IMIDA Bioeconomy Research Team [12,32].
The survey included all technical and economic data described in Table 1: production systems (planting density, yield, non-marketable fresh produce, etc.), infrastructure (irrigation equipment, irrigation network, farm building, land preparation/planting infrastructure, etc.), inputs, and labor and machinery performance in the various field operations. It should be clarified that this is not a statistical analysis of different farms; rather, the surveys were conducted to identify representative production systems based on the management practices that are commonly adopted [12,32].
Table 1.
Technical and economic variables established for the economic analysis.
The information was collected in three phases [21,33]. The first consisted of an open interview with the respondents. In the second phase, a structured questionnaire, designed by the IMIDA (Murcian Institute for Agricultural and Environmental Research and Development) research team, was administered. This questionnaire gathered detailed information on the production systems and associated investments, production performance indicators, labor requirements, and other production costs. Finally, once the production systems had been defined, the information obtained from the surveys was validated through specific follow-up questions addressed to the respondents. Regarding revenues, farm-gate pear prices were updated according to quality grades and production systems, using official sources of regional agricultural product prices, namely the Regional Agricultural Statistics [34] and price information provided by the Campos de Jumilla Cooperative. The purpose of this study within the framework of the DREAM project is to evaluate alternative strategies to conventional practices in different orchards.
The data in Table 1 represent the resources required for each production cycle once the orchard has reached full maturity. For the partially productive years, the production and input coefficients described in Table 2 and Table 3 were established. Both the coefficients and the years in which the systems reach full production were also obtained from the surveys and reflect the experience of farmers and specialized technicians in the study area. The useful life of the three production systems analyzed was considered to be 25 years. However, for the conventional cultivation system (CC), full production (100% yield) was assumed to be reached in year 5, with an annual gross production of 31,000 kg·ha−1·yr−1. In contrast, for the organic cultivation (EC) and organic cultivation with biological control (ECB) systems, full productivity was assumed to be achieved in year 6, with an annual gross production of 28,000 kg·ha−1·yr−1. For the years prior to full production, the production coefficients presented in Table 2 and the input coefficients described in Table 3 were applied. Regarding materials, their useful life was assumed to be the same across all three production systems: 30 years for the water reservoir, 15 years for the irrigation equipment, and 10 years for the irrigation network.
Table 2.
Production coefficients.
Table 3.
Input coefficients.
This economic assessment is subject to limitations related to market-driven price variability. Additionally, in the context of agronomic studies, results may be influenced by agroclimatic factors and the specific geographical characteristics of the study area. Furthermore, a small number of surveys makes it impossible to obtain statistical representativeness.
2.3. Economic Assessment
The economic analysis was structured in two stages:
- Economic analysis from an accounting and analytical perspective, aimed at establishing the cost and revenue structure of three pear production systems (organic, organic with biological control and conventional).
- Calculation of a set of economic feasibility and profitability indicators.
2.3.1. Production Cost and Income Structure
The economic analysis, from an accounting and analytical perspective, was conducted by establishing the production cost and income structure for each scenarios. The results are expressed in euros (€) per unit of area (hectare) and per unit of output (kg), as these are the most commonly used units in agricultural economic analyses [12,35,36].
The analysis begins by identifying production costs, which are classified into fixed costs and variable costs [23,25,37]. An opportunity cost is assigned to each cost component [38], reflecting the alternative return that capital could generate if invested in a risk-free savings account. The opportunity cost is calculated using an interest rate of 1.5% [30]. Land is assumed to be owner-operated, which is the predominant situation in this territory and for this crop. Since land is not subject to depreciation and its opportunity cost would be the same across all production systems under the identical land conditions considered in this comparative analysis, it is excluded from the production costs to avoid distorting the comparison. In addition, the analysis assumes that all investments are financed with the farmer’s own capital [12,32].
The cost analysis was performed by accounting for the entire useful life of orchards: preparation and planting phase, tree formation phase and the adult stage. It is fundamental to note that the main cost structure presented is for a full-yield year. However, costs per kilogram, considering the formative stage, will also be presented. For formative years, inputs, in the same way as production, were calculated as a coefficient over a full-yield production cycle (Table 2 and Table 3). Although costs are presented for full-production stage and taking into account all life span (compensated cost), the main cost and revenue structure and the derived economic indicators correspond to a year at full production, as this is the stage of greatest interest to producers and facilitates comparisons with other agricultural economic studies. Furthermore, the compensated costs are very similar to the unit costs obtained for a full-production year and are on the same scale across all systems. Since this is a comparative analysis, using costs calculated for a full-production year or over the entire useful life of the orchard does not lead to relevant differences in the comparison among systems.
Fixed costs
Fixed costs correspond to costs derived from the depreciation of the investment. Depreciation is calculated using the straight-line method [32,39]. In the three systems, the investments required are identical, since the management system does not determine changes in the infrastructure required. The investments include all the infrastructure required for irrigation: irrigation equipment, irrigation network, and regulating reservoir. The reservoir is sized to store half of the water required during the month with the highest water demand. The irrigation equipment is sized according to the flow rate required by the emitters per unit area and the size of the farms. The irrigation network is sized in the same way, using polyethylene pipes (Ø63 mm and Ø16 mm) and pressure-compensating drippers with a flow rate of 4 L·h−1. The investments also include a building for the irrigation equipment and implements auxiliary equipment (hoes, pruning shears, etc.) and land preparation and planting, with an area of 80 m2 for an average 5-hectare farm. Preparation and planting involve the following tasks: ploughing with a moldboard plough, collecting the remains of the previous crop, loosening the soil, soil finishing and levelling, and planting grafted nursery plants.
Variable costs
Variable costs are those that may vary from one production cycle to another [32,39]. Variable costs correspond to those associated with the operations carried out during the course of an annual production cycle. Machinery is accounted for as a variable cost, since it is assumed that the farm contracts external services.
- Annual pruning and green pruning.
Pear cultivation under fertigation requires annual manual winter pruning. It is very common to carry out a lighter green pruning at the end of spring. The pruning item corresponds, in both cases, to the cost associated with the labor used for this task. After pruning, the pruned wood is shredded between the tree rows and incorporated into the soil; the cost of the shredding operation with a 90–100 hp tractor equipped with a hammer shredder is accounted for under machinery costs.
- Production insurance.
The insurance cost is calculated based on the report “Average Insurance Cost in the Autonomous Community of Murcia” prepared by Agroseguro, as described by García García [32].
- Machinery.
This includes the use of machinery in activities such as plant protection treatments and herbicide treatments, shallow tillage in the alleyways using a cultivator or mower, and pruning shredding. It is assumed that farms hire external services to carry out these operations. Machinery costs are accounted for through the market unit cost: tractor + implement + labor. This cost differs among the three systems, since the following vary: the number of plant protection treatments, herbicide treatments only in conventional cultivation, and the number and type of alleyway operations (Table 1). In EC and ECB, an in-row cultivator is incorporated to eliminate weeds in the tree rows.
- Plant protection and biotechnological control.
Plant protection treatments vary annually and from one farm to another due to various agroclimatic factors; however, according to the survey data, it is possible to establish average treatment programs for each model. Table 1 specifies the number of plant protection treatments, always carried out with a 90/100 hp tractor equipped with a trailed sprayer and air-blast atomizer in all systems. The active substances vary, according to conventional and organic cultivation. In the ECB cultivation system, pheromones are also applied through dispensers and releases of beneficial fauna are carried out, that is, biotechnological control and biological control, respectively.
- Fertilizers.
The fertilizer requirements of pear trees are established for nutrient balance and average production in this area [32]. The fertilizer requirements, expressed in fertilizer units and used to establish fertilization programs, are 125-70-175-35-20 in conventional cultivation (CC) and 90-60-160-22-5 in organic cultivation (both EC and ECB), reflecting their lower productivity, as verified based on the information obtained from the surveys. The fertilizers used in CC are inorganic, whereas in EC and ECB they consist of combinations of manure (sheep/goat) and liquid organic fertilizers permitted in organic production.
- Herbicides.
This cost item appears only in conventional cultivation (CC). Two treatments are carried out annually during the growing season. For herbicide application, a spray tank fitted with two spray lances is used, with two operators spraying both tree rows along each alleyway; that is, the herbicide is applied only to the tree rows. The herbicide used is glyphosate or a similar product.
- Maintenance.
The maintenance cost is calculated as a percentage (1.50%) of the investment value of the assets subject to maintenance: the storage building, the irrigation equipment, and the irrigation network. This cost is common to all systems, since the assets on which it is calculated do not vary.
- Electricity (irrigation).
Electricity consumption of the pumps used to carry out fertigation is calculated from the average flow rate of the irrigation equipment and the irrigation network, together with the corresponding irrigation hours, based on the average water consumption specified in the following section.
- Water.
Irrigation water consumption was established based on the information obtained from the surveys. Annual water allocations of 4800 m3 ha−1 for CC and 4250 m3 ha−1 for EC and ECB were established, according to their average productivity (Table 1).
- Fruit thinning.
This operation is carried out manually and shows similar labor productivity across all systems; it is performed to adjust production in relation to standard fruit sizes.
- Harvesting.
This task is carried out manually and shows similar labor productivity across all systems. It includes harvesting and transporting the crop to the packing house. It varies among systems due to differences in productivity.
- Permanent labor.
The farm owner usually works on tasks related to farm management, such as purchasing inputs, scheduling and monitoring irrigation, and contracting external services such as pruning. This is accounted for as a labor cost in hours per hectare and year and is similar across all systems.
Incomes
Total incomes for each production system are calculated based on the average annual yield obtained from the surveys (kg‧ha−1) and the average annual selling prices (€‧kg−1) for the period 2023–2025 in the Region of Murcia. Pear prices were obtained from the Regional Agricultural Statistics, the Price Observatory of the Regional Ministry of Agriculture, Livestock, Water and Fisheries of the Region of Murcia and the settlement of prices paid to the members of the Campos de Jumilla cooperative (Murcia). In the market, only two price categories are distinguished: conventionally produced pears and organically produced pears.
2.3.2. Socio-Economic Indicators
Once the production cost and income structures for each system have been established, a series of economic indicators are calculated to analyze the viability, profitability, and employment generation of the three models, enabling a comparative analysis. To do this, the Net Margin must first be calculated [32,40], using the following equation:
NM = IN − (FC + VC + OC)
NM = Net Margin (€); IN = Incomes (€‧ha−1); FC = Fixed Costs (€‧ha−1); VC = Variable Costs (€‧ha−1); OC = Opportunity Costs (€‧ha−1). This is an indicator of economic viability.
The indicators used are:
- NM/Investment (NM/K0) (%): Long-term profitability indicator.
- NM/Variable Costs (NM/VC) (%): Return on working capital, i.e., an indicator of short-term profitability.
- NM/Total Costs (NM/TC) (%): This shows the global profitability of the activity.
- Average cost of production (AC) (€‧kg−1): This indicates the minimum sale price of the product at origin for the activity to be viable. For an already established market price, it can be expressed as the minimum size for viability (ha).
- Break-even point (BEP) (kg‧ha−1): This indicates the minimum production, for the average market sale price, for the activity to be viable.
- The Agricultural Work Unit (AWU) (AWU‧ha−1): This is an indicator of the direct employment generation linked to the rural environment. One AWU is considered to correspond to 1840 h of agricultural work [41].
2.4. Environmental Assessment: Life Cycle Assessment (LCA)
The life cycle assessment was carried out following the methodology established in ISO 14040 and ISO 14044 [14,15], which define the following four phases:
2.4.1. Goal and Scope Definition
This life cycle assessment was conducted in order to compare the environmental impact of three different pear cultivation systems in the Altiplano region of the Region of Murcia: conventional cultivation, organic cultivation, and organic cultivation with biological control. This study was limited to the cultivation stage.
The functional unit (FU) established for the entire analysis was 1 kg of harvested pears. For the life cycle assessment, the entire useful life of both the crop and the materials was taken into account.
The components considered in the life cycle assessment are the following:
- Infrastructure: Includes the manufacture fuel and lubricants consumed by machinery during land preparation and planting, together with the associated atmospheric emissions. It also includes the seedling production process in the nursery (based on Ecoinvent data), the irrigation equipment, the irrigation network, the raw materials required for their manufacture, and the manufacturing and transport processes. In addition, the reservoir is included, taking into account the fuel and lubricants consumed during its construction, the associated emissions, and the raw materials, manufacturing, and transport required for its construction.
- Machinery: The fuel and lubricants consumed by machinery during agricultural operations throughout the production cycle, and their emissions to the atmosphere.
- Energy: Electrical energy consumed during fertigation.
- Fertilizer production: Production of commercial synthetic and organic fertilizers, including transport and packaging. Manure is also included.
- Emissions from fertilizers: Emissions resulting from the application of synthetic and organic fertilizers to the soil.
- Pesticides: The production of insecticides and herbicides, their packaging and transport, and their emissions to soil, air, and water in the conventional system. In the organic systems, the production of insecticides, their packaging and transport, and their emissions to soil, air, and water are considered. Likewise, in the ECB system, the production of the plastic used for the pheromone dispensers and its transport, together with the energy associated with the production of Anthocoris sp., are considered. Emissions resulting from the application of plant protection products are calculated using the fixed emission factors established by the EU [42].
- Waste treatment: The treatment of infrastructure components and packaging (metals and plastics) that have reached the end of their useful life. It was assumed that 80% of these materials are recycled and the remaining 20% are disposed of in landfills [12,23]. Pruning residues were not considered waste, as they are shredded and used as mulch.
2.4.2. Life Cycle Inventory Development
The foreground data were obtained from the surveys and are presented in relation to the FU in Table 4. Due to the large amount of data involved, software was required to carry out the LCA. In this case, SimaPro 10.3 (developed by Pré Sustainability) was used, as it allows the use of extensive methodological and inventory databases. The background data (fuel, energy, materials, products, and transport) were obtained from the Ecoinvent 3.10 database (integrated into SimaPro 10.3).
Table 4.
Life cycle inventory of the primary data for CC, EC, and ECB in relation to the FU: 1 kg of pears.
Iron chelate and foliar corrective products were not considered in the assessment, as they are not included in Ecoinvent and the quantities applied are very small.
The study presents other noteworthy limitations regarding organic fertilizers, mainly due to the lack of specific information available, in agreement with that reported by other authors [12]. Therefore, their production was modelled using generic organic fertilizer processes from the Ecoinvent market section, according to their main component (nitrogen, phosphorus, or potassium). For the same reason, generic pesticide production models were also applied to the active substances copper oxychloride, hexythiazox, and spinosad.
Furthermore, the technical data sheets for liquid organic fertilizers contain very limited information regarding the nature and proportion of their components. The impacts associated with the cultivation of young plants in the nursery were considered using the corresponding Ecoinvent process for the cultivation of fruit trees in a nursery.
Atmospheric emissions resulting from diesel combustion by agricultural machinery were estimated using the emission factors established by the EEA [43]. Atmospheric emissions resulting from the application of nitrogen fertilizers to agricultural soils were calculated based on the guidelines of the IPCC [44] and the EEA [43]: NH3 and NO2 [43], as well as direct and indirect N2O emissions [44]. Nitrate and phosphate leaching were not taken into account, as the IPCC [44] indicated that the leached fraction may be considered zero in agricultural areas with warm climates, where rainfall inputs are lower than evapotranspiration, and where drip irrigation is used.
The inventory can be expressed per hectare by multiplying it by the compensated fresh yield, that is, taking into account the useful life of the tree: CC (27,652 kg·ha−1), EC (24,416 kg·ha−1), and ECB (24,416 kg·ha−1).
2.4.3. Life Cycle Impact Assessment and Interpretation
The methodology used for the characterization of potential environmental impacts was CML-IA Baseline 4.7 (available in SimaPro 10.3), as applied by many authors [12,17,18] and which defines 11 impact categories: abiotic depletion (AD), abiotic depletion of fossil fuels (ADFF), global warming (GW), ozone layer depletion (OLD), human toxicity (HT), freshwater aquatic ecotoxicity (FWAE), marine aquatic ecotoxicity (MAE), terrestrial ecotoxicity (TE), photochemical oxidation (PO), acidification (A), and eutrophication (E). For the interpretation of the results obtained, contribution analysis was used. This analysis illustrates, as percentages, how each of the analyzed components contributes to each impact category. In addition, the overall contribution was used, indicating the percentage contribution of each component to the overall environmental impact generated by the model [12,23]. The overall contribution (%) was calculated as the arithmetic mean of the contribution (%) of each component across all impact categories considered, giving equal weight to each impact category.
The absolute values of the different systems were evaluated and compared using the relative difference of the different environmental indicators, expressed as RD (%) = 100 × (S0 − Sn)/S0, where Sn corresponds to EC and ECB, and S0 corresponds to CC. When comparing the organic scenarios (EC and ECB), EC was used as S0 and ECB as Sn.
3. Results and Discussion
3.1. Economic Evaluation: Life Cycle Costing
Table 5 presents the initial investment and the corresponding amortization, based on the useful life of each asset, and its residual value, including the associated opportunity cost in the total cost. This table is identical for the three cultivation systems, as the infrastructure and initial equipment are the same in the systems.
Table 5.
Investment and amortization of investment.
The initial investment is very high (€20,034 ha−1) and requires a significant financial effort for establishment [32,45]. It is the same for both conventional and organic cultivation; that is, the management system does not determine different absolute investment values, since the planting density, irrigation network, and, in general, the fixed asset costs are the same.
In both cases, the largest share of the investment corresponds to land preparation and planting, which accounts for 42.1% of the total investment, mainly because this is a high-density crop (1250 trees·ha−1). This is followed in importance by the irrigation infrastructure, since the combined cost of the irrigation equipment, irrigation network, and regulating reservoir represents almost 42% of the investment. Together, these items account for 84% of the total investment. These two results are similar to those reported by Paunović et al. [46] for an intensive orchard with a 4 × 1.5 m planting pattern, in which the planting material and irrigation infrastructure accounted for 86% of the initial investment value.
The investment is substantial, but when it is allocated to depreciation and, therefore, to fixed costs, it represents slightly more than 5% in all cases, in line with other pome fruit crops in Europe, such as intensive apple cultivation in Romania, where fixed costs account for 4.42% [47].
Regular full production is reached in the 4th/5th year under conventional fertigation in Mediterranean areas [32,46]. There is no scientific literature that provides specific information on the age at which the trees reach full production, but in general, fruit trees under intensive cultivation enter production earlier but have shorter useful lives [23,47]. The factor that most influences useful life is proper management, especially with regard to nutrition and plant health.
The total production costs in €·ha−1 are similar (Table 6); the higher cost of the conventional system is due to the harvesting and insurance items, reflecting its slightly higher productivity compared with the organic system.
Table 6.
Cost structure of the three systems analyzed.
Certain manual operations have the same cost, namely winter pruning, green pruning, and fruit thinning. Harvesting, which is mainly carried out manually, varies according to production per hectare, but in all systems, it is the largest relative cost, accounting for around 30% of the total cost (TC). Labor costs are therefore the most important cost component, as is the case in other intensive and highly productive woody crops [23,47].
The differences among the systems are mainly due to fertilization and plant health management. Organic fertilization is more expensive than inorganic fertilization, especially when liquid organic fertilizers are applied through fertigation [33].
The use of organic fertilization strategies based on compost, manure, or other solid organic fertilizers, instead of liquid organic fertilizers for fertigation, can reduce this cost item [12,33,47,48].
In plant health management, the costs are very similar, being lower in organic than in conventional cultivation. The largest difference is only €182 ha−1 between CC and EC (Table 6), a value of little relevance in relation to a total cost of around €17,000–18,000 ha−1. In ECB, costs increase slightly due to the release of beneficial insects and the application of pheromones.
Machinery costs are higher in CC because of the greater number of plant protection treatments (9 per year). Likewise, EC (8 treatments) has higher machinery costs than ECB, which applies only 4 foliar treatments. Therefore, the small difference in the plant health management cost item in favor of EC is offset by the greater use of machinery compared with ECB. This has environmental implications, since tractor-mounted sprayer treatments consume fuel.
The cost of irrigation water and, consequently, the associated electricity consumption is slightly higher in the conventional system. Higher production results in a higher cost, although this is of little economic significance.
Overall, the unit production cost (€·kg−1) shows very little difference among the systems. The organic systems have an additional cost of only 2.9 euro cents·kg−1 in ECB and 3.4 euro cents·kg−1 in EC compared with conventional production (CC). This is a very small value that can easily be covered by a higher market price paid to farmers for adopting differentiated cultivation practices. Therefore, this crop is well suited to organic production, which remains competitive with conventional production despite these additional costs.
Based on the average data for the 2023–2025 period shown in Table 7, it can be seen that the pear market does not place a large value on the difference between conventional and organic products. Nevertheless, the observed difference of €0.06 per unit is sufficient, under the market conditions observed during this period, to make organic production economically attractive. Although this price premium is relatively small, it reflects the actual market conditions observed in recent years and should be interpreted with caution, as such differences may vary in response to changes in market conditions. This conclusion is supported by the economic indicators presented in Table 8. The viability and profitability indicators are positive for all systems and are higher for the organic systems, since the difference in the average market price more than compensates for the unit production cost or average cost (AC). Among these indicators, the ECB system performs best, although its values are very close to those of the organic system (EC). For example, the NM/TC ratio is 26.6% for ECB, 25.5% for EC, and 23.3% for CC.
Table 7.
Farm-gate pear prices in the period of 2023–2025.
Table 8.
Economic indicators of pear cultivation.
The short-term indicator (NM/VC) is higher than the long-term indicator (NM/K0) in all systems, because the investment is relatively high due to the intensive production system and high planting density. Consequently, the NM/K0 indicator is lower. As expected, the CC system must achieve higher productivity than the organic systems (Table 5), since its break-even point (BEP) is higher (24,392 kg·ha−1 to reach economic viability).
With regard to employment generated by primary pear production, the differences are almost exclusively due to the higher productivity of the CC system and, consequently, its greater labor requirements for harvesting. In all cases, these systems exhibit a high AWU indicator compared with other production systems under intensive fertigation in the Mediterranean area, such as lemon [12] or trellised vineyards [30].
3.2. Environmental Evaluation: Life Cycle Assessment
In the conventional cultivation system, fertilizer production is the main contributor to the overall environmental impact caused by the system accounting for 54% of the total (Table 9 and Figure 1). It can therefore be identified as the system’s environmental hotspot, consistent with previous studies [23,49]. In turn, pesticides, machinery, and the emissions associated with fertilizer application make similar contributions, representing 12%, 13%, and 14% of the overall impact, respectively. In contrast, the components with the lowest contribution are infrastructure (9%), energy (3%), and waste treatment (−4%). The latter shows a negative contribution because it is assumed that 80% of the waste generated is recycled.
Fertilizer production is the main contributing component in 8 of the 11 impact categories, with contributions ranging from 47% to 85%, similar to those reported by Wang et al. [19]. Likewise, in the remaining three categories, OLD, A, and E, it is the second most influential component, being exceeded only by pesticides in the case of OLD (58%) and by the emissions resulting from fertilizer application in A and E, where these account for 60% and 66%, respectively, mainly due to ammonia emissions. Machinery stands out for its contribution to the ADFF category (34%), mainly due to the fuel production process, and to GW (30%), as a consequence of the emissions generated by diesel combustion in agricultural machinery.
The contribution profiles observed in the conventional system (CC) differ substantially from those recorded in the two organic cultivation systems (EC and ECB). These differences are mainly attributed to the use of synthetic fertilizers and plant protection products in CC, whereas in EC and ECB the main inputs are organic fertilizers and pesticides permitted in organic production. In addition, the total fertilizer units applied in the organic systems are lower than those applied in the conventional system, a trend also reported for other crops, such as lemon [12].
The contributions of the different components to the overall environmental impact generated by the organic production systems EC and ECB are very similar, since they are identical in terms of infrastructure, input use, and gross production, differing only in the application of pheromones and the use of biological control in the ECB system. This results in a slight reduction in the dose of plant protection products and in the associated use of machinery for their application. As shown in Figure 1, the overall environmental impact is mainly distributed among four components: machinery, pesticides, emissions resulting from fertilizer application, and infrastructure. For these four components, EC shows contributions of 24%, 23%, 21%, and 19%, respectively. In the ECB system, the corresponding contributions are 25% for pesticides, 21% for emissions from fertilizers, 21% for machinery, and 19% for infrastructure. It is important to note that the greater relative importance of these categories in the organic systems does not necessarily imply a greater environmental impact. This is due to the elimination of synthetic fertilizers and the reduction in pesticide use, which redistributes the relative contribution of the different components across the impact categories.
Figure 1.
Contribution of system components to the potential environmental impacts derived from the three production models analyzed: CC, EC, and ECB. Abiotic depletion (AD), abiotic depletion fossil fuels (ADFFs), global warming (GW), ozone layer depletion (OLD), human toxicity (HT), fresh water aquatic ecotoxicity (FWAE), marine aquatic ecotoxicity (MAE), terrestrial ecotoxicity (TE), photochemical oxidation (PO), acidification (A), and eutrophication (E).
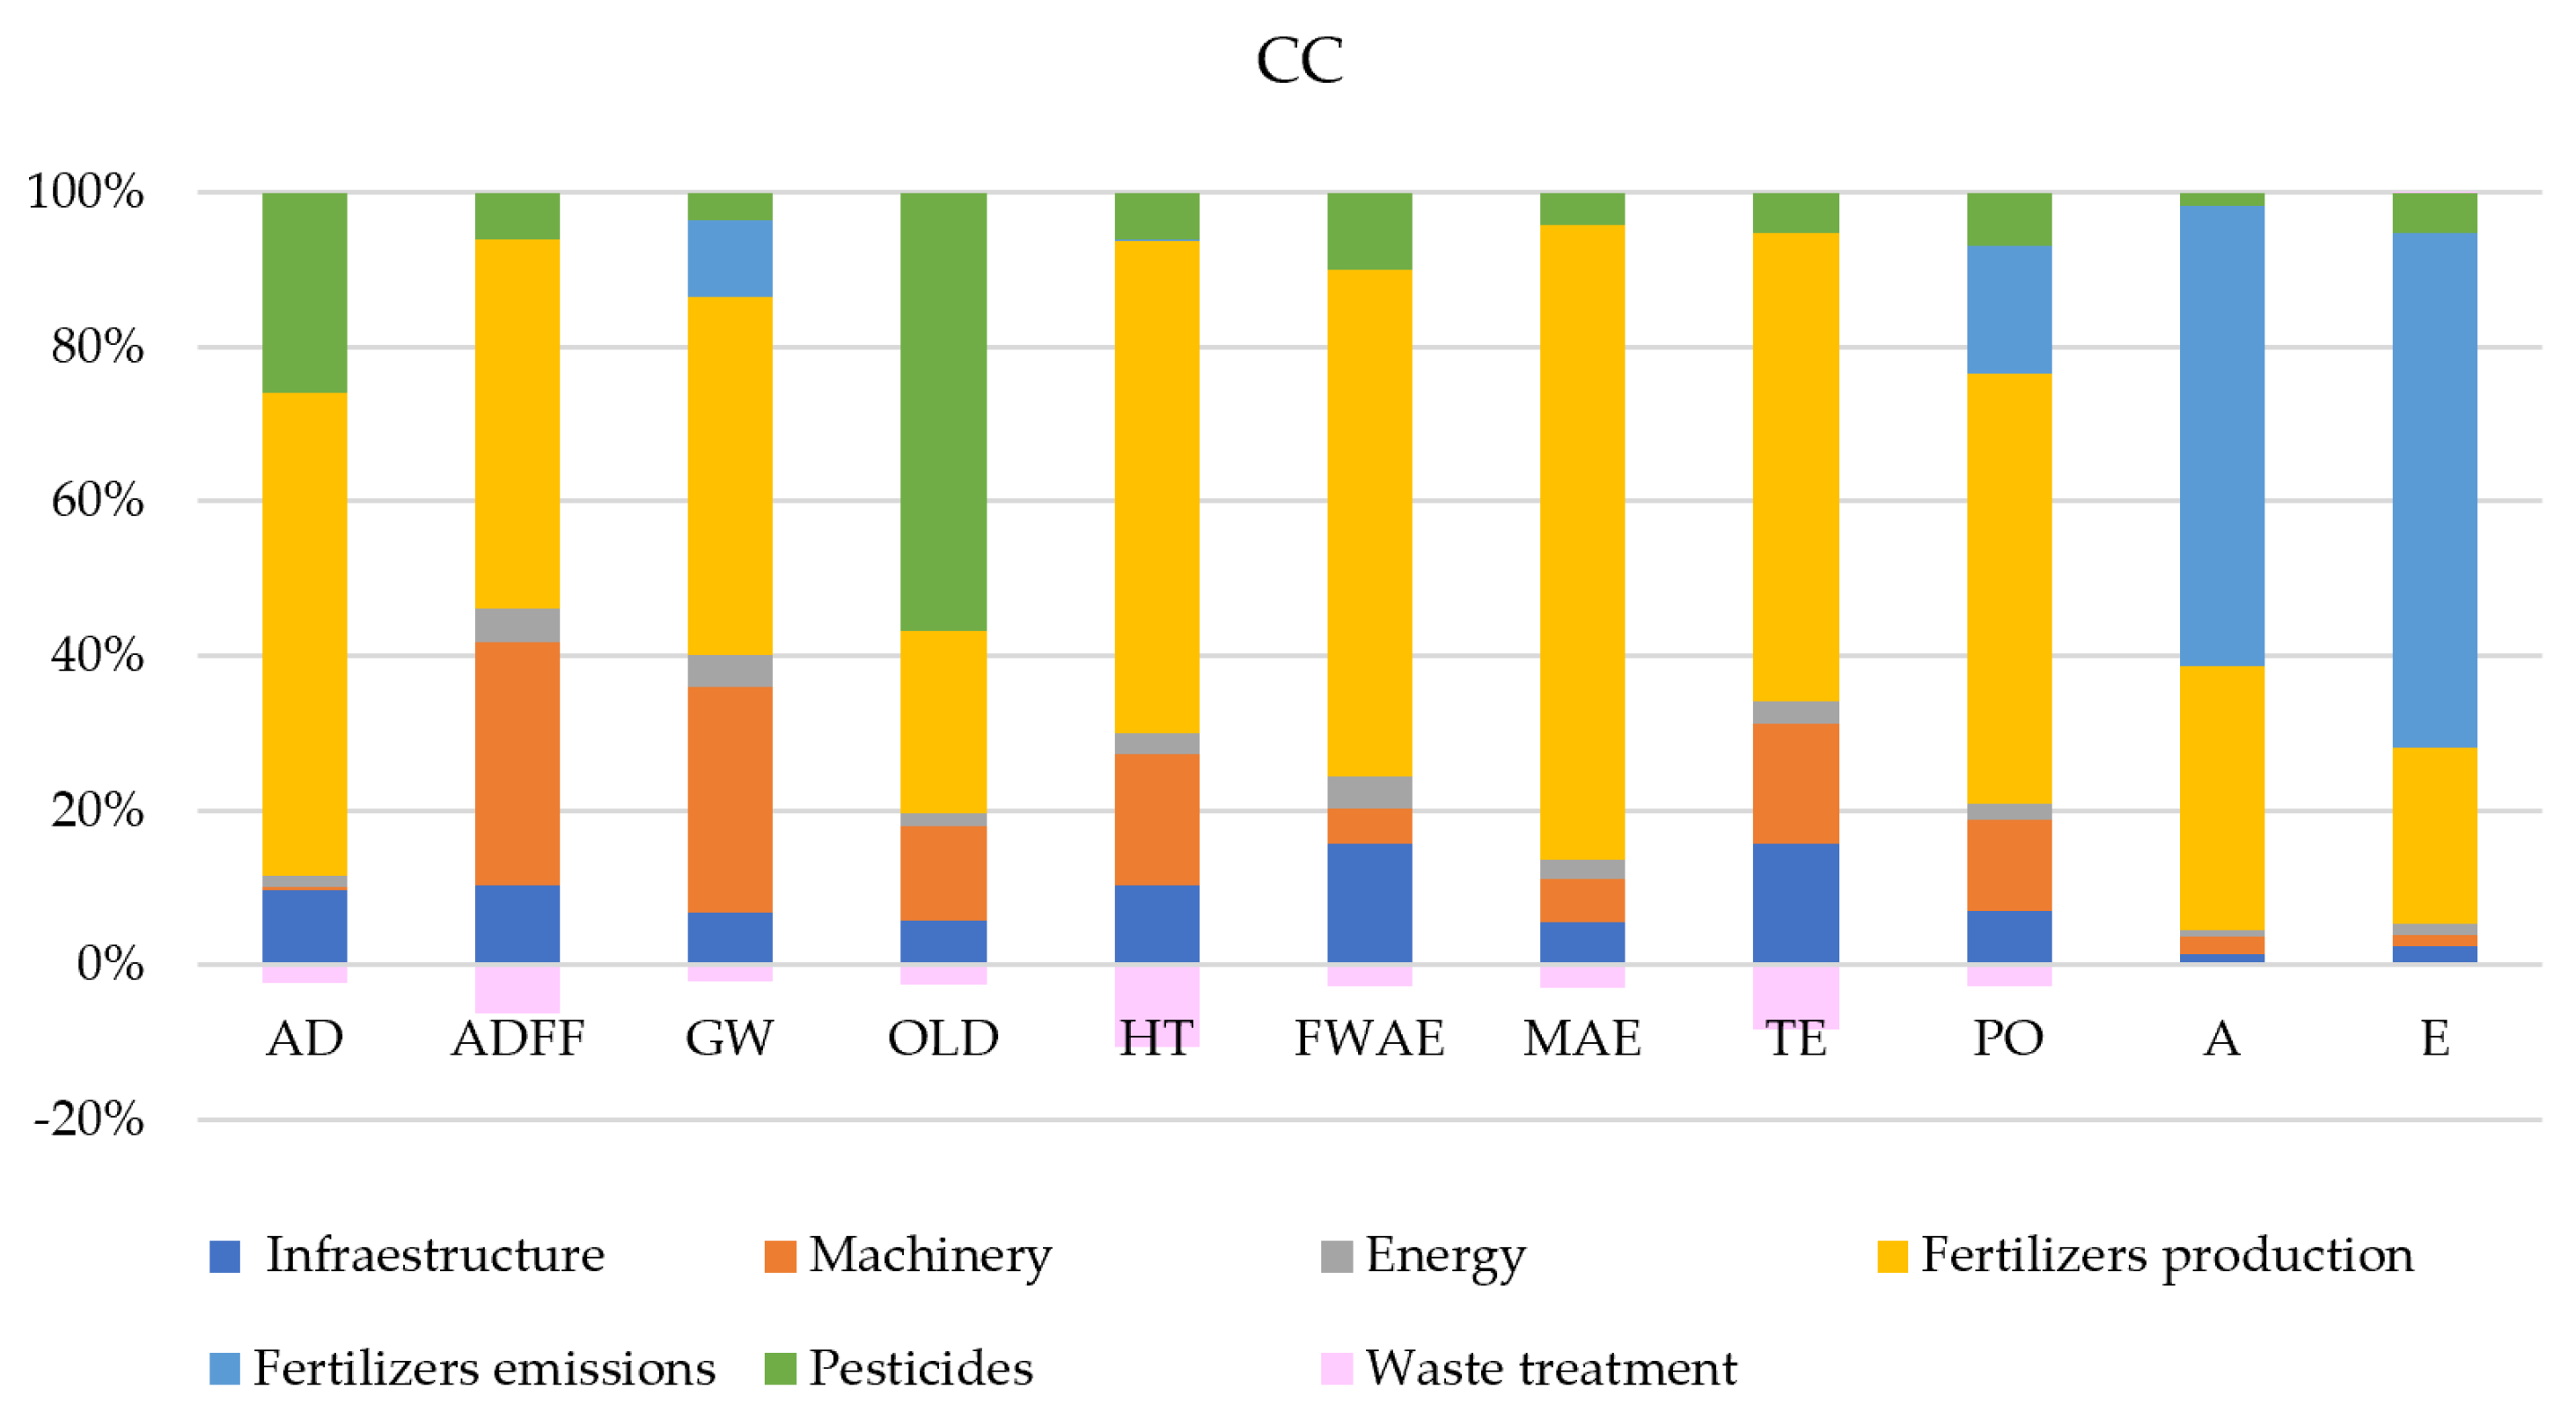
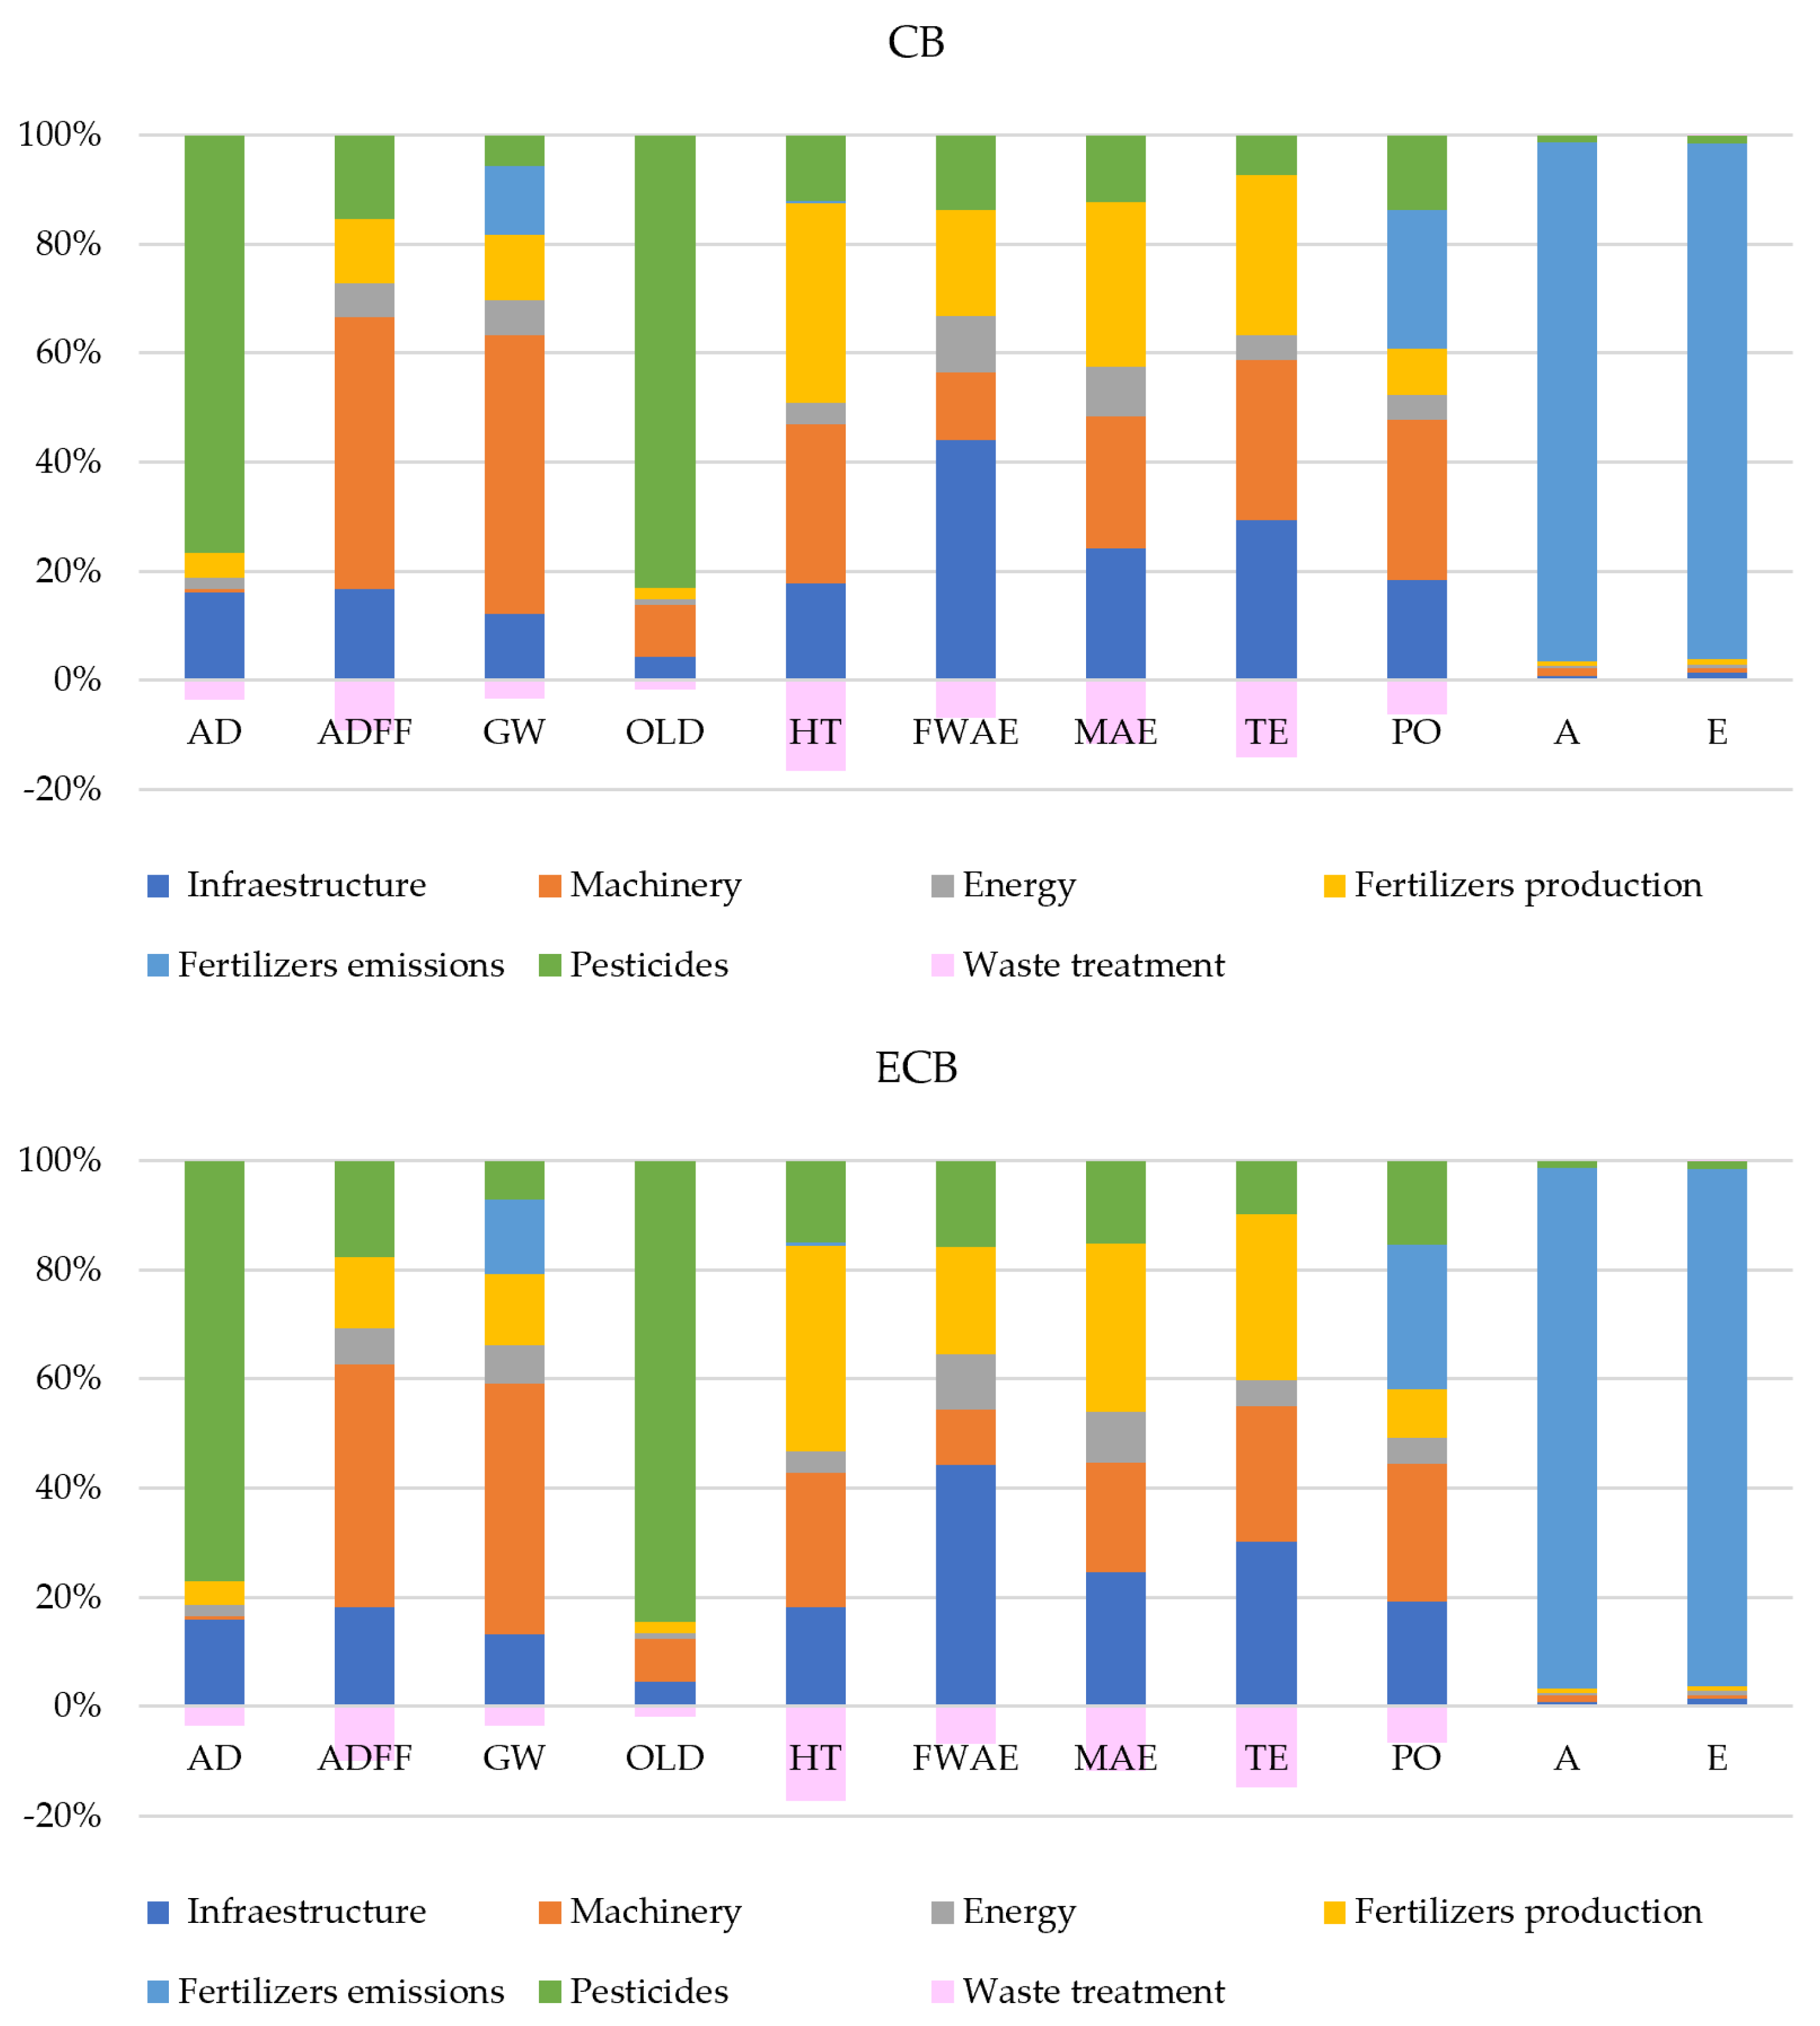
Table 9.
Characterization of the potential environmental impacts and the contributions of the components to each impact category in CC, EC, and ECB.
After analyzing the components with the highest contributions to the impact categories considered in both systems, machinery accounted for 48–55% of the total impact in the ADFF and GW categories and for 23–35% of the impacts in the HT, MAE, TE, and PO categories. The contributions of machinery to the ADFF, HT, MAE, TE, and PO categories were primarily associated with the diesel production process. In contrast, in the GW category, 77% of the impact attributed to machinery resulted from emissions generated during diesel combustion.
As in the CC system, pesticides are the main source of impact in the OLD category in both organic systems analyzed, accounting for 85% and 86% of the total impact in the EC and ECB systems, respectively. Likewise, this component is responsible for 80% of the AD impact category.
On the other hand, the emissions resulting from fertilization show a predominant contribution to the A (96%) and E (94%) impact categories, with identical values in both systems, mainly associated with NH3 emissions. In addition, they make a significant contribution to photochemical oxidation, accounting for 27% and 28% of the total impact in the EC and ECB systems, respectively, primarily due to nitrogen dioxide (NO2) emissions.
Infrastructure is the main contributor to the FWAE category, primarily due to the nursery phase and, to a lesser extent, the irrigation equipment and network. It also contributes substantially to the TE, MAE, and HT categories, accounting for 20–47% of the total impact, mainly as a result of the nursery phase.
In addition to conducting a contribution analysis for the assessed scenarios to identify environmental hotspots, it is also necessary to analyze the absolute values of the impact categories and compare the scenarios.
In terms of absolute values, the conventional cultivation system shows higher impacts than the organic systems in 8 of the 11 categories evaluated (Table 10). Given that the results are expressed per kilogram of pears produced, these differences can be mainly attributed to the combination of some factors: (i) similar yields in the three cultivation systems evaluated; (ii) the higher input of fertilizer units in the conventional system compared with the organic systems (CC: 125-70-175-35-20; EC and ECB: 90-60-160-22-5); (iii) the environmental impacts associated with the chemical synthesis process used for the production of inorganic fertilizers; and (iv) to a lesser extent, the use of synthetic pesticides in the conventional system. In contrast, the acidification and eutrophication categories are mainly driven by NH3 emissions from fertilizer application to the soil. In the organic systems, more than half of the fertilizer units are supplied by manure, which has a higher NH3 emission factor than the synthetic fertilizers used in the conventional system. Consequently, the organic systems show higher impacts in these two categories.
Table 10.
Values of the potential environmental impacts of the proposed scenarios and the relative difference between them.
For their part, the absolute values of the impact categories for the EC and ECB systems are practically identical, with relative differences ranging from 0% to 9% (Table 10). This similarity is because both systems use the same inputs, differing only in that the ECB system incorporates the release of beneficial insects and the use of pheromone dispensers. These practices make it possible to reduce both the application rate and the number of plant protection treatments carried out compared with the EC system. As a result, the fuel consumption associated with the application operations is reduced, which translates into a slightly lower environmental impact of the ECB system compared with the EC system.
Particular attention is paid to the GW category, as it is the impact category most commonly used in life cycle assessments (LCA) of agri-food products [6,12,22,23,50]. Furthermore, its widespread recognition by society is due to the relevance of global warming as one of the major environmental challenges of our time [12].
In the present study, the GW category showed values of 0.102 kg CO2 eq kg−1 in the conventional system and 0.061 and 0.056 kg CO2 eq kg−1 in the EC and ECB systems, respectively. Compared with the average value reported by Subedi et al. [50] for generic fruit production (503 ± 365 g CO2 eq kg−1), the GW values obtained in the present study are considerably lower. However, restricting the comparison to conventionally managed pome fruit systems under Mediterranean conditions, the GW value obtained for the CC system in the present study is higher than those reported by other authors, which range from 0.040–0.075 kg CO2 eq kg−1 [49,51,52,53].
By contrast, studies specifically assessing pear production under similar climatic conditions reported considerably higher GW values than all three systems evaluated in the present study. Particularly, Vatsanidou et al. [7] reported a GW impact of 0.285 kg CO2 eq kg−1 for a conventional production system, whereas Tamburini et al. [25] reported a value of 0.376 kg CO2 eq kg−1 for an organic production system. These differences are likely the result of both agronomic and methodological factors, including agronomic management practices, the type and amount of inputs applied, crop yield, and the boundaries and methodological assumptions considered in LCA.
For example, Tamburini et al. [25] applied 800 kg N ha−1 to achieve a fruit yield of 30,000 kg ha−1, whereas Vatsanidou et al. [7] reported an average nitrogen application of 189 kg N ha−1 for an average fruit yield of 20,300 kg ha−1. In both studies, nitrogen application rates were higher than those applied in the present study (CC: 125 kg N ha−1; EC and ECB: 88 kg N ha−1), despite the present study achieving similar fruit yields or, in comparison with Vatsanidou et al. [7], substantially higher yields. In addition, differences in the emission factor used to estimate nitrogen-related emissions should be considered when comparing the results. Vatsanidou et al. [7] applied an emission factor of 0.01, whereas the present study used a value of 0.005, which partially explains the lower estimated emissions reported here.
Nevertheless, as García Castellanos et al. [12] pointed out, the variability among LCA studies cannot be explained solely by agronomic factors. Differences in system boundaries, inventory assumptions, functional units, and impact assessment methods also contribute substantially to the variability observed across studies.
4. Conclusions
Pear cultivation in the Altiplano requires a high initial investment, mainly associated with orchard establishment and irrigation infrastructure. However, as these costs are depreciated over the orchard useful life, annual production costs are dominated by variable inputs, particularly fertilization, plant protection, machinery, and permanent labor. Although the organic systems (EC and ECB) showed slightly higher unit production costs than the conventional system (CC), their higher market value resulted in greater profitability, with the ECB system achieving the highest economic return.
From an environmental perspective, the organic systems consistently outperformed the conventional system across most impact categories. Their lower environmental burden was primarily explained by the reduced application of fertilizer units, the absence of synthetic fertilizers and pesticides, and fruit yields similar to the conventional system. In CC systems, the production of synthetic fertilizers was identified as the main environmental hotspot. These findings highlight the potential interest of investigating partial substitution of mineral fertilizers with organic alternatives, together with the adoption of biological pest control strategies, as a possible strategy to further reduce the environmental impact of conventional pear production systems.
Within the organic systems, the incorporation of biological control in ECB further reduced environmental impacts by decreasing pesticide applications and the associated fuel consumption. Future improvements could focus on reducing the dependence on fossil diesel through economically viable biofuel alternatives and on mitigating ammonia emissions associated with organic fertilizers.
Finally, the global warming (GW) impacts obtained in this study for the cultivation phase were lower than those reported in comparable studies on pear production, mainly because similar fruit yields were achieved with fewer field operations and lower fertilizer inputs. Overall, the results demonstrate that organic pear production, particularly when combined with biological control, represents a profitable and environmentally sustainable alternative for Mediterranean orchards.
Author Contributions
J.G.G. and J.A.S.S. were responsible for funding acquisition. B.G.C., J.G.G. and J.A.S.S. conceived and designed the present study. B.G.C. and J.G.G. collected the data from the collaborating farms. B.G.C. and J.G.G. made the agronomic calculations and established the models. J.G.G. performed the economic analysis. B.G.C. and I.G.M. performed the life cycle assessment. I.G.M., B.G.C. and J.G.G. drafted the manuscript and I.G.M. prepared the final version. J.G.G., B.G.C. and J.A.S.S. supervised the entire manuscript. All authors have read and agreed to the published version of the manuscript.
Funding
This research was funded by the PRIMA Programme (Partnership for Research and Innovation in the Mediterranean Area) under project DREAM (Diversified orchards for REsilient and sustAinable Mediterranean farming systems).
Data Availability Statement
The original contributions presented in this study are included in the article. Further inquiries can be directed to the corresponding author.
Acknowledgments
The authors are grateful to the pear producers in the Region of Murcia for their collaboration and to the Dream Project. The authors acknowledge the use of ChatGPT (OpenAI) as an assistance tool in the design and preparation of the graphical abstract. ChatGPT was not used for the generation of scientific content, data analysis, or interpretation of the results.
Conflicts of Interest
The authors declare no conflicts of interest.
References
- Intergovernmental Panel on climate Change (IPCC). Climate Change 2023: Synthesis Report. Contribution of Working Groups I, II and III to the Sixth Assessment Report of the Intergovernmental Panel on Climate Change; Core Writing Team, Lee, H., Romero, J., Eds.; IPCC: Geneva, Switzerland, 2023. [Google Scholar] [CrossRef] [Scilit]
- Food and Agriculture Organization of the United Nations (FAO). The State of Food and Agriculture 2023: Revealing the True Cost of Food to Transform Agrifood Systems; FAO: Rome, Italy, 2023. [Google Scholar] [CrossRef] [Scilit]
- Crippa, M.; Solazzo, E.; Guizzardi, D.; Monforti-Ferrario, F.; Tubiello, F.N.; Leip, A. Food Systems Are Responsible for a Third of Global Anthropogenic GHG Emissions. Nat. Food 2021, 2, 198–209. [Google Scholar] [CrossRef] [Scilit]
- Food and Agriculture Organization of the United Nations (FAO). The State of Food and Agriculture 2024: Value-Driven Transformation of Agrifood Systems; FAO: Rome, Italy, 2024. [Google Scholar] [CrossRef] [Scilit]
- Food and Agriculture Organization of the United Nations (FAO); UN-Water. Progress on Change in Water-Use Efficiency: Global Status and Acceleration Needs for SDG Indicator 6.4.1, 2021; FAO: Rome, Italy, 2021. [Google Scholar] [CrossRef] [Scilit]
- Ferrara, C.; De Feo, G. Life Cycle Assessment Application to the Wine Sector: A Critical Review. Sustainability 2018, 10, 395. [Google Scholar] [CrossRef] [Scilit]
- Vatsanidou, A.; Fountas, S.; Liakos, V.; Nanos, G.; Katsoulas, N.; Gemtos, T. Life Cycle Assessment of Variable Rate Fertilizer Application in a Pear Orchard. Sustainability 2020, 12, 6893. [Google Scholar] [CrossRef] [Scilit]
- Wood, S.; Cowie, A. A Review of Greenhouse Gas Emission Factors for Fertiliser Production; University of Tasmania: Hobart, Australia, 2004. [Google Scholar]
- Intergovernmental Panel on Climate Change (IPCC). Climate Change 2022: Impacts, Adaptation and Vulnerability. Contribution of Working Group II to the Sixth Assessment Report of the Intergovernmental Panel on Climate Change, 1st ed.; Cambridge University Press: Cambridge, UK; New York, NY, USA, 2022. [Google Scholar]
- Tasca, A.L.; Nessi, S.; Rigamonti, L. Environmental Sustainability of Agri-Food Supply Chains: An LCA Comparison between Two Alternative Forms of Production and Distribution of Endive in Northern Italy. J. Clean. Prod. 2017, 140, 725–741. [Google Scholar] [CrossRef] [Scilit]
- Ministerio de Agricultura, Pesca y Alimentación (MAPA). Estadísticas de Producción Ecológica 2024; Ministerio de Agricultura, Pesca y Alimentación: Madrid, Spain, 2025.
- García Castellanos, B.; García García, B.; García García, J. Economic and Environmental Assessment of Organic Lemon Cultivation: The Case of Southeastern Spain. Agronomy 2025, 15, 1372. [Google Scholar] [CrossRef] [Scilit]
- Boone, L.; Roldán-Ruiz, I.; Van Linden, V.; Muylle, H.; Dewulf, J. Environmental Sustainability of Conventional and Organic Farming: Accounting for Ecosystem Services in Life Cycle Assessment. Sci. Total Environ. 2019, 695, 133841. [Google Scholar] [CrossRef] [Scilit]
- ISO 14044:2006; Environmental Management—Life Cycle Assessment—Requirements and Guidelines. ISO: Geneva, Switzerland, 2006.
- ISO 14040:2006; Environmental Management—Life Cycle Assessment—Principles and Framework. ISO: Geneva, Switzerland, 2006.
- Van der Werf, H.M.G. Towards Better Representation of Organic Agriculture in Life Cycle Assessment. Nat. Sustain. 2020, 3, 419–425. [Google Scholar] [CrossRef] [Scilit]
- Cabot, M.I.; Lado, J.; Clemente, G.; Sanjuán, N. Towards Harmonised and Regionalised Life Cycle Assessment of Fruits: A Review on Citrus Fruit. Sustain. Prod. Consum. 2022, 33, 567–585. [Google Scholar] [CrossRef] [Scilit]
- Cabot, M.I.; Lado, J.; Sanjuán, N. Multi-Season Environmental Life Cycle Assessment of Lemons: A Case Study in South Uruguay. J. Environ. Manag. 2023, 326, 116719. [Google Scholar] [CrossRef] [Scilit]
- Wang, J.; Zhang, L.; He, X.; Zhang, Y.; Wan, Y.; Duan, S.; Xu, C.; Mao, X.; Chen, X.; Shi, X. Environmental Mitigation Potential by Improved Nutrient Managements in Pear (Pyrus pyrifolia L.) Orchards Based on Life Cycle Assessment: A Case Study in the North China Plain. J. Clean. Prod. 2020, 262, 121273. [Google Scholar] [CrossRef] [Scilit]
- Yan, M.; Cheng, K.; Yue, Q.; Yan, Y.; Rees, R.M.; Pan, G. Farm and Product Carbon Footprints of China’s Fruit Production—Life Cycle Inventory of Representative Orchards of Five Major Fruits. Environ. Sci. Pollut. Res. 2016, 23, 4681–4691. [Google Scholar] [CrossRef] [Scilit]
- García Castellanos, B.; Fuster Villa, P.E.; García, J.G.; Egea Clemente, F. Comparative Economic Evaluation of Greenhouse Pepper Cultivation Under Conventional and Organic Management. Agriculture 2026, 16, 889. [Google Scholar] [CrossRef] [Scilit]
- Falcone, G.; Fazari, A.; Vono, G.; Gulisano, G.; Strano, A. Application of the LCA Approach to the Citrus Production Chain—A Systematic Review. Clean. Environ. Syst. 2024, 12, 100156. [Google Scholar] [CrossRef] [Scilit]
- García Castellanos, B.; García García, B.; García García, J. Economic and Environmental Assessment of Conventional Lemon Cultivation: The Case of Southeastern Spain. Agronomy 2024, 14, 1842. [Google Scholar] [CrossRef] [Scilit]
- Ji, X.; Wang, J.; Dainese, M.; Zhang, H.; Chen, Y.; Cavalieri, A.; Jiang, J.; Wan, N. Ground Cover Vegetation Promotes Biological Control and Yield in Pear Orchards. J. Appl. Entomol. 2022, 146, 262–271. [Google Scholar] [CrossRef] [Scilit]
- Tamburini, E.; Pedrini, P.; Marchetti, M.; Fano, E.; Castaldelli, G. Life Cycle Based Evaluation of Environmental and Economic Impacts of Agricultural Productions in the Mediterranean Area. Sustainability 2015, 7, 2915–2935. [Google Scholar] [CrossRef] [Scilit]
- Cerutti, A.K. Life Cycle Assessment Application in the Fruit Sector: State of the Art and Recommendations for Environmental Declarations of Fruit Products. J. Clean. Prod. 2014, 73, 125–135. [Google Scholar] [CrossRef] [Scilit]
- Comunidad Autónoma de la Región de Murcia (CARM). Anuario de Estadística Agraria 2023–2024; Comunidad Autónoma de la Región de Murcia: Murcia, Spain, 2024.
- García Castellanos, B.; García García, B.; García García, J. Economic and Environmental Effects of Replacing Inorganic Fertilizers with Organic Fertilizers in Three Rainfed Crops in a Semi-Arid Area. Sustainability 2023, 15, 16897. [Google Scholar] [CrossRef] [Scilit]
- Ben Abdallah, S.; Gallego-Elvira, B.; Imbernón-Mulero, A.; Martínez-Alvarez, V.; Maestre-Valero, J. Environmental Footprint of Organic and Conventional Grapefruit Production Irrigated with Desalinated Seawater in Spain. Sustain. Prod. Consum. 2023, 39, 326–335. [Google Scholar] [CrossRef] [Scilit]
- García Castellanos, B.; García García, B.; García García, J. Evaluation of the Sustainability of Vineyards in Semi-Arid Climates: The Case of Southeastern Spain. Agronomy 2022, 12, 3213. [Google Scholar] [CrossRef] [Scilit]
- Martin-Gorriz, B.; Maestre-Valero, J.F.; Boix-Fayos, C.; Martínez-Mena, M. Carbon Emissions and Economic Assessment of Farm Operations under Different Tillage Practices in Organic Rainfed Almond Orchards in Semiarid Mediterranean Conditions. Sci. Hortic. 2020, 261, 108978. [Google Scholar] [CrossRef] [Scilit]
- García García, J. Estructura de Costes de las Orientaciones Productivas Agrícolas de la Región de Murcia: Frutos Secos, Frutales de Pepita, Vid y Olivo; Consejería de Agua, Agricultura, Ganadería y Pesca de la Región de Murcia: Murcia, Spain, 2019. [Google Scholar]
- Egea Clemente, F.; García Castellanos, B.; García García, J.; Fuster Villa, P.E. Economic Assessment of Conventional Broccoli Cultivation in Southeastern Spain. Agriculture 2025, 15, 2446. [Google Scholar] [CrossRef] [Scilit]
- Comunidad Autónoma de la Región de Murcia. Estadística Agraria de La Región de Murcia. Available online: https://esam.carm.es/ (accessed on 1 August 2026).
- García García, J. Estructura de Costes de las Orientaciones Productivas Agrícolas de la Región de Murcia: Frutales de Hueso y Cítricos; Consejería de Agua, Agricultura, Ganadería y Pesca de la Región de Murcia: Murcia, Spain, 2018. [Google Scholar]
- Sgroi, F.; Foderà, M.; Di Trapani, A.M.; Tudisca, S.; Testa, R. Cost-Benefit Analysis: A Comparison between Conventional and Organic Olive Growing in the Mediterranean Area. Ecol. Eng. 2015, 82, 542–546. [Google Scholar] [CrossRef] [Scilit]
- Mitrović, I.; Todorović, M.; Marković, M.; Mehmeti, A. Eco-Efficiency Analysis of Rainfed and Irrigated Maize Systems in Bosnia and Herzegovina. J. Water Clim. Change 2023, 14, 4489–4505. [Google Scholar] [CrossRef] [Scilit]
- Špička, J.; Dereník, P. How Opportunity Costs Change the View on the Viability of Farms? Empirical Evidence from the EU. Agric. Econ.-Czech 2021, 67, 41–50. [Google Scholar] [CrossRef] [Scilit]
- Abdalltef, E.A.; Khalaf, M.A.; Mohammed, I.A.A. An Economic Analysis of the Production Costs of Pepper (Capsicum annuum L.) Crop Under the Greenhouses in Anbar Governorate for the Agricultural Season 2019–2020. Int. J. Agric. Stat. Sci. 2021, 17, 755–764. [Google Scholar]
- Ministerio de Agricultura, Pesca y Alimentación (MAPA). Resultados Técnico-Económicos de Frutales 2017; Ministerio de Agricultura, Pesca y Alimentación: Madrid, Spain, 2019.
- García García, J.; García García, B. Sustainability Assessment of Greenhouse Pepper Production Scenarios in Southeastern Spain. Agronomy 2022, 12, 1254. [Google Scholar] [CrossRef] [Scilit]
- European Commission. Commission Recommendation (EU) 2021/2279 of 15 December 2021 on the Use of the Environmental Footprint Methods to Measure and Communicate the Life Cycle Environmental Performance of Products and Organisations; European Commission: Brussels, Belgium, 2021. [Google Scholar]
- European Environment Agency. EMEP/EEA Air Pollutant Emission Inventory Guidebook 2019: Technical Guidance to Prepare National Emission Inventories; Publications Office of the European Union: Luxembourg, 2019. [Google Scholar]
- Intergovernmental Panel on Climate Change (IPCC). 2019 Refinement to the 2006 IPCC Guidelines for National Greenhouse Gas Inventories; Intergovernmental Panel on Climate Change: Geneva, Switzerland, 2019. [Google Scholar]
- Sturiale, S.; Gava, O.; Gallardo, M.; Buendía Guerrero, D.; Buyuktas, D.; Aslan, G.E.; Laarif, A.; Bouslama, T.; Navarro, A.; Incrocci, L.; et al. Environmental and Economic Performance of Greenhouse Cropping in the Mediterranean Basin: Lessons Learnt from a Cross-Country Comparison. Sustainability 2024, 16, 4491. [Google Scholar] [CrossRef] [Scilit]
- Paunović, G.; Veljković, B.; Ilić, R.; Bošković-Rakočević, L. Economic Analysis of Pear Orchard Establishment. Acta Agric. Serbica 2018, 23, 157–165. [Google Scholar] [CrossRef] [Scilit]
- Vlad, I.M.; Butcaru, A.C.; Fîntîneru, G.; Bădulescu, L.A.; Stănică, F.; Mihai, C.A. A Life Cycle Cost Analysis—Relevant Method Supporting the Decision to Establish an Apple Orchard in an Organic System. Horticulturae 2023, 9, 1263. [Google Scholar] [CrossRef] [Scilit]
- Butcaru, A.C.; Vlad, I.M.; Mihai, C.A.; Bădulescu, L.A.; Fîntîneru, G.; Stănică, F. Modelling Life Cycle Cost Analysis (LCCA) Scenarios on the Use of Compost in Organic Pear Orchard in Romania. Available online: https://managementjournal.usamv.ro/pdf/vol.23_4/Art13.pdf (accessed on 5 August 2026).
- Bartzas, G.; Vamvuka, D.; Komnitsas, K. Comparative Life Cycle Assessment of Pistachio, Almond and Apple Production. Inf. Process. Agric. 2017, 4, 188–198. [Google Scholar] [CrossRef] [Scilit]
- Subedi, S.; Dent, B.; Adhikari, R. The Carbon Footprint of Fruits: A Systematic Review from a Life Cycle Perspective. Sustain. Prod. Consum. 2024, 52, 12–28. [Google Scholar] [CrossRef] [Scilit]
- Alaphilippe, A.; Boissy, J.; Simon, S.; Godard, C. Environmental Impact of Intensive versus Semi-Extensive Apple Orchards: Use of a Specific Methodological Framework for Life Cycle Assessments (LCA) in Perennial Crops. J. Clean. Prod. 2016, 127, 555–561. [Google Scholar] [CrossRef] [Scilit]
- Figueiredo, F.; Castanheira, É.G.; Feliciano, M.; Rodrigues, M.A.; Peres, A.M.; Maia, F.; Ramos, A.; Carneiro, J.; Coroama, V.C.; Freire, F. Carbon Footprint of Apple and Pear: Orchards, Storage and Distribution. In Proceedings of the Energy for Sustainability 2013 Sustainable Cities: Designing for People and the Planet, Coimbra, Portugal, 8–10 September 2013. [Google Scholar]
- Sessa, F.; Massimo, M.; Giulia, M.; Dal Piaz, A.; Damiano, Z.; Mazzetto, F. Life Cycle Assessment of Apples at a Country Level: The Case Study of Italy. In Proceedings of the 9th International Conference on Life Cycle Assessment in the Agri-Food Sector (LCA Food 2014), San Francisco, CA, USA, 8–10 October 2014. [Google Scholar]

Disclaimer/Publisher’s Note: The statements, opinions and data contained in all publications are solely those of the individual author(s) and contributor(s) and not of MDPI and/or the editor(s). MDPI and/or the editor(s) disclaim responsibility for any injury to people or property resulting from any ideas, methods, instructions or products referred to in the content. |
© 2026 by the authors. Licensee MDPI, Basel, Switzerland. This article is an open access article distributed under the terms and conditions of the Creative Commons Attribution (CC BY) license.