


Abstract
Forecasting the mango harvest window from flowering aids cultivar selection and harvest planning. This study evaluated the cross-site and cross-season generalizability of accumulated growing degree days (GDD) calculated using either a lower base temperature (Tb) alone or both lower and upper temperature thresholds (Tb and TB), relative to calendar days, for Australian mango cultivars. Operational values of Tb = 12 °C and TB = 32 °C were recommended for all assessed cultivars. The coefficient of variation across site-season populations for calendar days, GDD calculated using Tb alone, and GDD calculated using both Tb and TB was 13.5%, 2.5%, and 1.3%, respectively, confirming the robustness of the bounded GDD estimate across growing environments. Cultivar-specific GDD values associated with minimum and maximum fruit maturity were established using two complementary approaches. The first was based on ripening time (GDDr), with time-to-ripen at 20 °C durations of 12 and 6 days used to define lower and upper maturity boundaries (minGDDr and maxGDDr). The second was based on internal attributes at harvest (GDDi), including flesh color, dry matter (DM), soluble solids concentration (SSC), titratable acidity (TA), and flesh firmness. Minimum maturity was based on cultivar-specific flesh-color and DM targets and an SSC:TA criterion of 7.0. The mean firmness of cohorts at maxGDDr ranged from 2.2 to 3.6 kgf; a 3 kgf individual-fruit benchmark was therefore used for maxGDDi assessment. There was close agreement between GDDr and GDDi estimates of minimum maturity. The average of minGDDr and minGDDi for ‘B74’, ‘Honey Gold’, and ‘Keitt’ differed from previously published preliminary values by only 9–13 °C d, equivalent to approximately one calendar day, while values for ‘Nam Dok Mai’, ‘1201’, and ‘4069’ had not previously been estimated. Overall, minGDD values were established for nine cultivars, while complete harvest windows were resolved within the current study for four. For the remaining five cultivars, upper-boundary estimates were based on a single assessment approach, legacy observations, or remained unresolved.
1. Introduction
1.1. GDD
Accumulated heat units, also referred to as thermal time or growing degree days (GDD), integrate daily temperatures above a defined base threshold. The concept was formalized for agricultural applications by Arnold [1] and has since been widely adopted across agronomic and horticultural systems as a biologically meaningful alternative to calendar-day estimates for predicting phenological development, including time from flowering to harvest [2]. Because plant developmental rates are strongly temperature dependent, GDD-based approaches generally outperform calendar-day methods when appropriate temperature thresholds are selected, and crop-specific targets are applied [3]. The value of thermal time models for quantifying progress between key phenological stages of commercial crops in crop management was highlighted in the context of climate variability in a recent review of the use of GDD models [3].
Advances in sensor technology, automated data logging and digital agriculture platforms have further facilitated the practical adoption of GDD-based decision tools [4]. High-frequency, on-farm air temperature monitoring now allows orchard-specific thermal time accumulation to be calculated with minimal manual input, while avoiding the use of interpolated regional weather data. The use of orchard-specific temperature data will improve the precision of harvest forecasting and thus improve supply-chain planning.
1.2. Mango Cultivar Production Windows
In the Australian production system, mango (Mangifera indica L.) cultivars ‘Nam Dok Mai’ and ‘Kensington Pride’ (KP) are considered to be ‘early season’ producers, ‘R2E2’ mid-season (typically a few weeks later than KP), ‘B74’ mid-season (two to three weeks later than R2E2) and ‘Keitt’ late season [5], in the context of harvest timing at a given growing location. ‘Honey Gold’ can be considered as ‘mid-to-late’ and the more recent commercial releases of ‘Lady Jane’ and NMBP selections ‘1243’ and ‘4069’ can be described as early- to mid-season cultivars based on their observed harvest timing relative to these established cultivars. Note that these classifications refer to harvest timing within a region and therefore confound flowering time with fruit-development duration.
1.3. GDD and Mango
Mango fruit development is influenced by temperature, making the use of GDD preferable to calendar days for the measurement of development periods [6,7]. A cultivar-specific GDD value from flowering to harvest maturity should be generalizable across seasons and growing regions, and relatively insensitive to shifts in flowering date, whether driven by seasonal climate variability or deliberate flowering manipulation, as well as to variation in local temperature conditions during the fruit development period.
In practical use, it is desirable to relate fruit development to a commercially defined harvest-maturity stage. However, many historical mango GDD recommendations have relied on imprecise phenological reference points, such as visual (‘eyeball’) estimation of flowering stage and the date of commercial harvest [8,9]. Furthermore, many recommendations were derived from single-season or single-location datasets, limiting their robustness and transferability across environments.
We proposed a standardized protocol for determining mango fruit development GDD requirements in a precursor paper [7]. This protocol involves tagging individual panicles at a defined flowering stage, recording local temperature data using in-orchard monitoring stations, and destructively sampling fruit around the anticipated maturity window. Fruit maturity is assessed using multiple maturity attributes, including flesh color, fruit mass, dry matter (DM) content, soluble solids concentration (SSC), titratable acidity (TA), and the SSC:TA ratio. Using this approach, cultivar-specific minimum GDD targets of 1728, 1740 and 2185 °C d were proposed for ‘B74’, ‘Honey Gold’ and ‘Keitt’, respectively [7], with further validation recommended. There was insufficient data to support a recommendation for ‘Kensington Pride’ or ‘R2E2’. The current study provides validation of the previous work, extends the assessment to additional cultivars and establishes criteria for maximum as well as minimum harvest maturity.
Further, the calculation of daily GDD in mango studies has traditionally employed the linear formulation described by Arnold [1]:
where Tmax and Tmin are the daily maximum and minimum air temperatures, respectively, and Tb is the lower base temperature below which developmental progress is assumed to be negligible. Previous mango studies applied a Tb of either 10 °C [6] or 12 °C [8,10]. However, this formulation (Equation (1)) does not account for the reduction in developmental rate at supra-optimal temperatures, which are frequently encountered during mango fruit development in tropical production systems. In other production systems, this limitation has led to the adoption of bounded thermal-time approaches that incorporate both lower and upper temperature thresholds to better represent the non-linear response of biological processes to temperature [2]. For mango, Amaral et al. [7] adopted the segmented temperature-response model proposed by Ometto [11], which incorporates both a lower base temperature (Tb) and an upper threshold temperature (TB). This approach reduces the risk of overestimating development under high-temperature conditions. The operational calculation is:
The values Tb = 12 °C and TB = 32 °C were provided as preliminary recommendations based on relatively small datasets, with a call for further validation and extension to other cultivars of commercial relevance in Australia [7]. These issues are addressed in the current study.
1.4. Phenological Stages
1.4.1. Flowering
The estimation of the GDD required for a crop phenological stage requires definition of a ‘start’ and an ‘end’ point. The start point for mango fruit development is generally taken as a defined stage of inflorescence development. This has been variably defined in past work as the asparagus stage, an early stage of reproductive development in which the compact emerging panicle has an asparagus-like appearance [7,10], or the later Christmas-tree stage, in which the expanded branched panicle resembles a Christmas tree and approximately two-thirds of the flowers are open [12,13]. For the task of establishing GDD targets, use of the asparagus stage is preferable as this stage has a short duration, typically around 1 week. In commercial practice, use of the Christmas tree stage is preferred, as it can be assessed by visual assessment during a ‘drive by’ of trees. However, with a duration of weeks, use of this stage as a ‘start point’ adds uncertainty to the forecast of time of harvest maturity using a GDD window. In the current study, we adopt the use of the asparagus stage as the start point.
1.4.2. Harvest Maturity
Maturation refers to the progressive on-tree development of fruit toward physiological and commercial harvest maturity, whereas ripening refers to the subsequent changes leading from mature hard-green fruit toward eating ripeness. The required stage of fruit development at harvest depends on supply-chain requirements. One supply chain may target fruit that have only just achieved physiological maturity and the ability to ripen, thereby maximizing postharvest life, whereas another may target tree-ripened fruit intended for consumption within days of harvest. Many Australian supply chains operate within an intermediate window bounded by (i) minimum maturity that permits ripening to acceptable eating quality and (ii) maximum maturity that provides at least 6 days for pre-ripening storage and distribution at a pulp temperature of 18–20 °C [14].
Several ripeness indices have been proposed for mango that combine multiple attributes, such as firmness, TA, SSC and flesh color, into a single composite measure [15]. The SSC:TA ratio has been used as an indicator of both the maturation and ripening of mango fruit, reflecting the general increase in SSC and decline in TA during later fruit development [16,17]. Alternative sweet–acid indices such as BrimA have been explored in mango [18], but in the context of ripening stage and consumer acceptability rather than harvest-maturity determination [18].
Fruit harvest maturity is sometimes associated with the external attributes of skin ‘greenness’ and fruit shape; however, these characteristics can be inconsistent across growing conditions [19]. Within the Australian mango industry, fruit DM has become a widely used indicator of fruit maturity as it can be measured noninvasively in the field by handheld near-infrared (NIR) spectroscopy [20,21,22]. Both the Australian Mango Industry Association (AMIA) and the US-based National Mango Board have provided cultivar-specific minimum DM targets to be achieved in fruit before harvest. These values are associated with the achievement of an acceptable eating quality following ripening, following the conversion of starch reserves into soluble sugars, and assume that the fruit have reached a suitable physiological maturity to allow ripening. However, while DM increases with fruit maturity, its absolute level is impacted by fruit growing conditions, including tree water status, crop load, canopy position, and cultivar-specific carbohydrate accumulation patterns. Consequently, the DM threshold associated with harvest maturity as defined by flesh color should be established for each cultivar and each growing condition, rather than applied as a universal fixed value [7,23,24].
Other attributes can be used to index maturation; however, readily measurable attributes are required for routine in-field assessment of fruit maturity. For example, SSC and TA can be rapidly, if destructively, assessed in extracted juice using combined refractometer-conductivity meters such as the Pocket Brix Acidity meter (ATAGO Co., Ltd., Tokyo, Japan).
In our precursor study [7], minimum harvest maturity was established using cultivar-specific flesh-color targets, with SSC:TA used as a supporting criterion based on a strong cultivar-specific relationship between flesh color (CIE B) and SSC:TA (R2 = 0.89, compared with R2 = 0.86 for DM and R2 = 0.58 for SSC alone [7]). It was reported that for all assessed cultivars, the SSC:TA ratio was >6.5 when fruits were at the cultivar-specific flesh-color associated with minimum maturity.
Maximum harvest maturity is defined by the major Australian supply chains by a requirement for fruit to be ‘hard green’ or ‘hard to hand feel’ at harvest, a definition also adopted in the Australian export specifications [25]. The (Australian) Mango Quality Assessment Manual [26] provides a definition of ‘hard’ as requiring a force of >30.0 N (i.e., >3 kgf) to deform the skin surface by 2 mm using a 12 mm spherical probe (Shimadzu EZ Tester, Shimadzu Corporation, Kyoto, Japan). While equivalent figures for a penetrometer have not been provided for mango, the equivalent to 30 N assessed using the EZTester for a penetrometer was 10 kgf (using a tip of 11.1 mm-diameter tip, i.e., 96.77 mm2 area) in assessment of avocado [26]. This is nominally equivalent to 5.2 kgf measured with an 8 mm diameter tip (of 50.27 mm2); however, such conversion of durometer to penetrometer reading is tenuous. As penetrometers are more widely used in industry than durometers, establishment of a penetrometer-based standard is recommended.
1.5. Objectives
The objectives of the present study were to:
- validate and refine previously proposed minimum GDD targets for ‘B74’, ‘Honey Gold’, and ‘Keitt’ across multiple seasons and climatic regions, including independent confirmation using postharvest ripening behavior;
- validate and refine existing GDD recommendations where available, including the approximately 1600 GDD target for ‘Kensington Pride’, and develop GDD recommendations for ‘R2E2’, ‘Nam Dok Mai’, ‘NMBP 1201’, ‘NMBP 1243’, ‘NMBP 4069’, ‘Agam’, and ‘Lady Jane’;
- re-assess lower and upper temperature thresholds (Tb and TB) on a cultivar-specific basis;
- define harvest maturity windows relevant to the needs of the major Australian supply chains, with the minimum boundary based on a cross-cultivar SSC:TA value and cultivar-specific flesh-color and DM criteria, and the maximum boundary based on postharvest ripening time and harvest firmness;
- assess the ‘harvestable window’ for a range of cultivars, defined as the GDD between achieving minimum and maximum maturity specifications.
2. Materials and Methods
2.1. Experimental Sites and Cultivars
Trials were conducted in the 2023, 2024, and 2025 seasons on commercial farms and research stations across Queensland (QLD), Western Australia (WA), and the Northern Territory (NT), Australia, spanning latitudes of approximately 12–23° S and elevations of 8–597 m above sea level (m a.s.l.). The study included 79 populations of 11 cultivars in 37 unique site-season combinations, with several cultivars commonly represented at a site (Table 1). A population was a site × season × cultivar combination, and repeated fruit harvests within a population were termed cohorts. The cultivars included commercially established cultivars and advanced breeding selections. Sites captured a broad range of tropical and subtropical temperature regimes characteristic of Australian mango production. Time-to-ripen assessments were conducted for selected population cohorts, as detailed in Appendix A.
Table 1.
Locations, production regions, climate zones, seasons, and cultivars included in growing degree day (GDD) assessment trials. Locations were in Queensland (QLD), Western Australia (WA), and the Northern Territory (NT), Australia.
‘Honey Gold’, ‘B74’ and ‘Keitt’ data from Amaral et al. [7], collected over the years 2018–2022, were accessed for use in validation of the minGDD values proposed in that study and to extend sampling endpoints for these cultivars.
2.2. Temperature Monitoring
At all but two sites, air temperature data were obtained using SensorHost (Rockhampton, Australia) LoRa (Long Range radio)-enabled temperature sensors mounted within weather screens. TinyTag (Gemini Data Loggers Ltd., Chichester, UK) loggers were used as backup temperature sensors at some sites. Sensors within weather screens were installed on star pickets at 1.2 m above ground level over grass or mulch and positioned approximately 10 m from orchard trees to minimize canopy interference while representing the orchard microclimate. The exceptions were the Katherine Research Station, which employed a GoannaAg (Goondiwindi, Australia) automatic weather station and the Kununurra site, which employed a Wildeye® (Nedlands, Australia) device (provided by the Northern Territory Farmers Association). Data from all stations were recorded at 15 min intervals and processed using the same procedures.
2.3. Site Historical Temperature and GDD
Approximately ten years (2013–2023) of daily farm temperature records for four locations representing Australian mango production areas (Darwin, Bowen, Dimbulah and Bungundarra) were assembled. Daily minimum and maximum temperatures were averaged across available years to create a mean seasonal (day of year, DOY, 1–365) temperature profile, with missing values excluded from the calculation. Cumulative GDD was calculated for this mean seasonal data using Equation (2), with Tb = 12 °C and TB = 32 °C.
These reference data were used to forecast likely harvest maturity, with historical records progressively replaced by current-season, site-specific temperature data as the season progressed. This was essential for planning activity across multiple sites.
2.4. Panicle Tagging and Harvests
For this study, a ‘population’ was defined as a unique site × season × cultivar combination. Fruit within each population shared a flowering-tagging date and were collected in successive harvest cohorts, generally at weekly intervals across the anticipated maturity window. Fruit within a cohort therefore shared both flowering and harvest dates and had the same accumulated GDD.
At each site, approximately 200 reproductive terminals at the asparagus stage were tagged using biodegradable colored flagging tape (Forestry Tools Australia, Sydney, NSW, Australia). This tape remained intact for the duration of a season, and although some color fading occurred, discrimination among tagging panicle events remained acceptable. In a small number of cases where the asparagus stage was missed, terminals at the Christmas tree stage were tagged. When more than one flowering event was monitored within the same orchard, different flagging tape colors were used to distinguish panicle events. Sites were initially inspected at weekly intervals, with panicle developmental stage recorded until fruit set. Following fruit set, tags were repositioned from the subtending stem onto the panicle to maintain identification of individual fruiting units throughout development.
For ‘B74’, ‘Honey Gold’, and ‘Keitt’, fruits were destructively sampled around the previously recommended targets of 1728, 1740, and 2185 GDD, respectively, calculated using Tb = 12 °C and TB = 32 °C [7]. Sampling extended approximately 100–200 GDD before and after each target to characterize maturity attributes across the anticipated harvest window. Calendar dates corresponding to the targets were calculated from current-season temperature data for each site.
For ‘Kensington Pride’ (KP) and ‘R2E2’, fruit sampling was centered on GDD targets previously reported by Diczbalis et al. [8] and Moore et al. [10], namely 1600 and 1800 GDD, respectively. However, the minimum maturity stage was missed in the first season of R2E2 sampling at around 1800 GDD. Observing that growers typically harvest earlier than the published recommended GDD value, sampling was started 300–400 GDD before the literature target in the subsequent seasons.
For the cultivars ‘Nam Dok Mai’ (NDM), NMBP ‘1243’ (marketed as ‘Yes’), NMBP ‘1201’ (‘Ah ha’), and NMBP ‘4069’ (‘Now’), fruit harvesting commenced at approximately 1400 GDD (calculated using Tb = 12 °C and TB = 32 °C). Subsequent harvests were conducted at weekly intervals until harvest maturity was reached, typically over a period of two to six weeks depending on cultivar and season.
The GDD range over which fruit was harvested, the number of contributing populations, and the number of fruits assessed for each cultivar are presented in Table 2. For selected populations (Appendix A), harvesting continued at approximately weekly intervals beyond commercial harvest maturity.
Table 2.
GDD (Tb = 12 °C; TB = 32 °C) values for the earliest and latest harvests for each cultivar, and number of populations (season × site) per cultivar.
The minGDD targets proposed by Amaral et al. [7] from 2018–2022 data were assessed using six independent 2023–2025 site-season populations for ‘B74’, five for ‘Honey Gold’, and five for ‘Keitt’. These populations provided temporal and geographic validation of the earlier recommendations.
Following harvest, fruits were transported to the laboratory for assessment of optical and compositional maturity attributes. A subset of fruits from each harvest cohort, typically about 10 fruits where availability permitted, was held at 20 °C for postharvest ripening assessment as described in Section 2.7. These ‘matched’ subsets were used in establishing the fruit firmness value associated with a desired time-to-ripen.
2.5. Attribute Assessment
Individual fruit weight and linear dimensions of length (L), width (W), and thickness (T), were recorded and an absorbance spectrum (400–1000 nm range) was then acquired from the mid-shoulder of each side of intact fruit using a handheld near-infrared (NIR) spectrometer (F-750 Produce Quality Meter; Felix Instruments, Camas, WA, USA) with dry matter content (NIR-DM) estimated using a neural-network-based calibration model (Mango2023v2App) developed from destructively measured reference samples generated in this and previous studies [7,23]. One spectrum was acquired from each side of each fruit, resulting in two spectra per fruit. For attributes measured bilaterally, the two cheeks were retained as separate analytical observations because within-fruit differences between cheeks were considered relevant.
The NIR-DM method was validated using approximately 37% of the total dataset (n = 936 cheek-level samples; mean = 15.6% FW; SD = 2.6% FW). Spectra and NIR-DM estimates were collected before a cylindrical core (20 mm diameter) was excised from the center of each cheek, skinned, and trimmed to 10 mm length from the skin side. Samples were weighed fresh, dried in a fan-forced dehydrator (Ezidri 2000, Adelaide, Australia) at 65 °C for 48 h, and reweighed. Fresh and dry weights were measured using a precision balance with 0.001 g resolution, and gravimetric DM content was calculated as:
Prediction statistics of R2 = 0.89 and RMSE = 0.94% FW were achieved.
Following estimation of NIR-DM, fruits were cut longitudinally to separate the two cheeks, with cuts made approximately 2 cm from the seed. Flesh firmness was measured on each cheek after skin removal using a handheld pocket dial penetrometer (Fruit Test FT series, Wagner Instruments, Greenwich, CT; 0–20 kgf scale) fitted with an 8 mm diameter plunger. The plunger was inserted steadily into the flesh to the manufacturer-specified stopping point indicated by the break in tip diameter, and the maximum force was recorded.
Juice was extracted from the remaining pulp of each cheek, either using a garlic press or by hand squeezing tissue wrapped in muslin cloth. SSC of the homogenized juice was measured using a digital Brix:acid refractometer/conductivity meter (Atago, Japan). This measurement was taken immediately after stirring the sample, preventing starch grains from settling onto the sapphire window of the refractometer. Titratable acidity (TA) was determined using the same instrument in 1 mL of juice diluted with 50 mL of distilled water. Instrument-derived TA estimates were validated against standard acid–base titration conducted using 5 mL juice samples from a subset of ten fruits, using 0.1 N NaOH and a 1% (w/v) citric acid standard for calibration. Prediction statistics of R2 = 0.969 and RMSE = 0.103% citric acid equivalents were achieved.
Flesh color (CIE L*a*b* color space) was assessed at the midpoint of the cut-cheek face, where tissue was subsequently sampled for DMC assessment. Color was visually assessed using ‘B74’ Calypso® flesh-color reference cards, with scores of 3, 5, 7, 9, and 11 extended to 13, 15, and 17 as described by Amaral et al. [7]. The cards span white-green (score 3) to yellow-orange (score 17). A CR-400 chroma meter (Konica Minolta, Singapore) was also used in some populations and calibrated to a reference tile after approximately every 50 samples. Hue angle, expressed on a 0–360° scale, was calculated from a* and b* coordinates using the two-argument arctangent function to ensure correct quadrant assignment:
This function uses the signs of and to assign the angle to the correct quadrant of the CIE color plane. Where the calculated angle was negative, was added to convert it to the equivalent positive angle. This provides a continuous circular metric suitable for comparing flesh color development across samples and maturity stages [27].
2.6. Optimization of Tb and TB
Lower (Tb) and upper threshold (TB) temperatures were optimized for six commercially important cultivars: ‘Kensington Pride’, ‘B74’, ‘Honey Gold’, ‘R2E2’, ‘Keitt’, and ‘1243’. Only populations with complete temperature records across the flowering-to-harvest period were eligible. For each cultivar, three eligible populations assessed using the same methodology were selected to represent contrasting production regions, subject to the cultivar’s commercial planting distribution. Each population contributed repeated harvest cohorts and multiple individual-fruit assessments. Population codes, sites, regions, numbers of hard-green harvest cohorts, and ripening-assessment status are documented in Appendix A (Table A1); populations used for Tb and TB optimization are identified by a dagger (†).
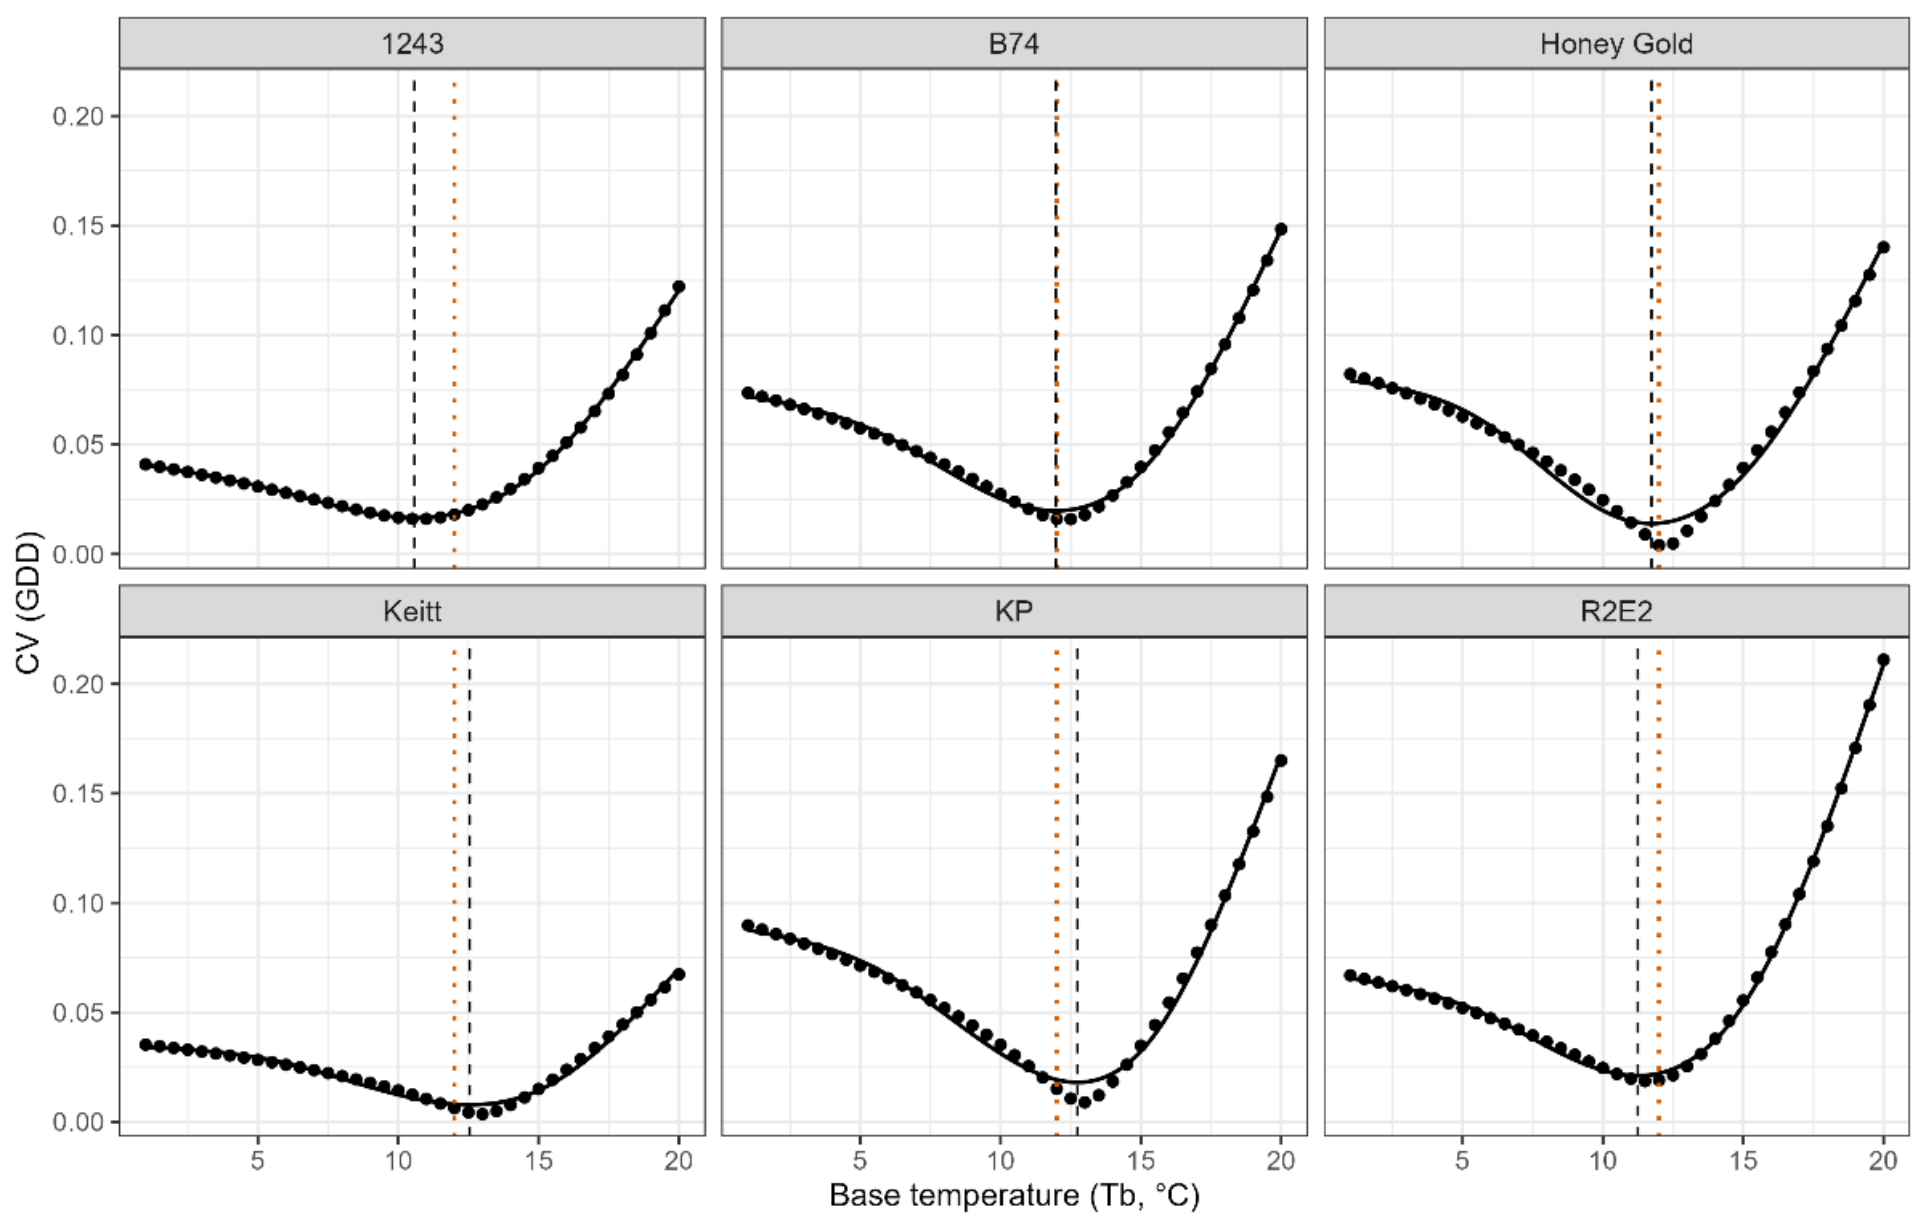
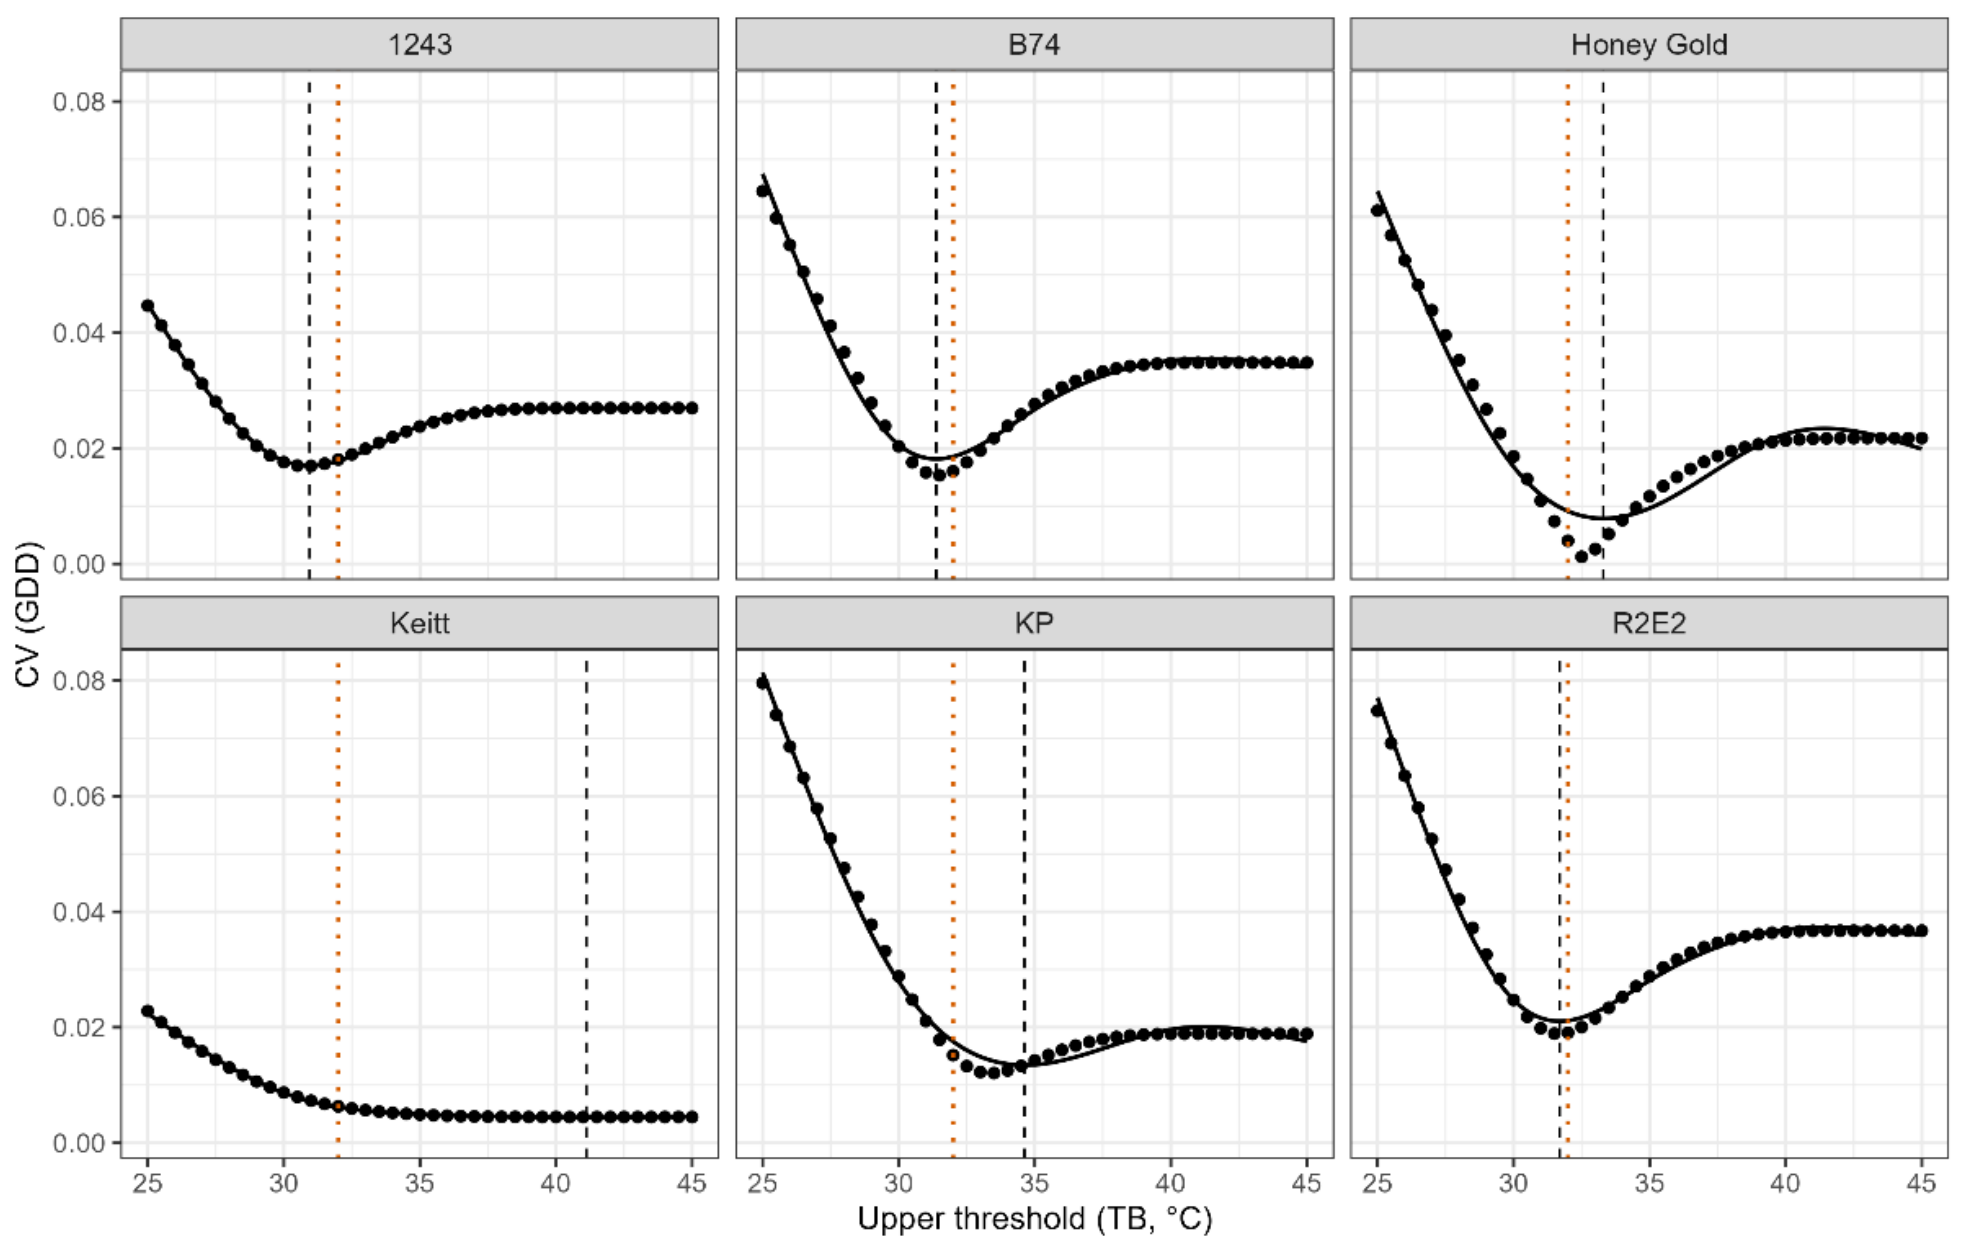
The optimal Tb and TB for each cultivar were estimated by minimizing the coefficient of variation (CV), following Amaral et al. [7]. For Tb optimization, GDD was calculated for candidate Tb values from 1 to 20 °C in 0.5 °C increments while TB was fixed at 32 °C. At each candidate Tb, flowering-to-minimum-maturity GDD was first averaged within each population, and the CV was then calculated across the three population means. A penalized cubic regression spline was fitted to the resulting CV–Tb relationship, and the Tb associated with the minimum fitted CV was identified. For TB optimization, the same procedure was applied to candidate TB values from 25 to 45 °C in 0.5 °C increments while Tb was fixed at 12 °C. Thus, each point in Figures 2 and 3 represents one CV calculated across three population mean GDD values at a candidate threshold, rather than an individual-population observation. For comparison, the CV of calendar days from flowering to minimum harvest maturity was calculated for the same populations.
Based on the outcome of the above assessment, operational values of Tb = 12 °C and TB = 32 °C were used for all cultivars in subsequent estimation of the GDD of harvest windows.
2.7. Estimation of Harvest Window Based on Postharvest Ripening
Postharvest ripening assessments were conducted on a subset of harvested fruit spanning a range of GDD values for each cultivar, following the shelf-life assessment protocol of Macnish & Duong [26]. Fruits were held in an air-conditioned laboratory set at 20 °C, i.e., consistent with the mango ripening recommendation in [26]. Ripening progress was monitored at two-day intervals by tactile assessment using whole-hand pressure. A cohort was considered to have reached the eating-ripe stage when fruits were judged to be at the firm-soft stage, i.e., deforming under moderate hand pressure, which is associated with a firmness of 5.0–7.0 N or 0.51–0.71 kgf when assessed using a penetrometer with an 8 mm-diameter probe [22]. Fruit developing decay or rot were removed from consideration, and trials ended at 20 days (with some cohorts not achieving the ‘soft’ hand-feel stage). The fruits were then destructively assessed for flesh firmness using a penetrometer, following which fruits were cut longitudinally and juice was extracted from cheek tissue for SSC and TA assessment, as described in Section 2.5.
The lower GDD boundary based on ripening behavior (minGDDr) was defined as the mean GDD of the earliest up-to-three population cohorts for which fruit both (i) ripened within 12 days at 20 °C (days-to-ripe ≤ 12) and (ii) achieved SSC ≥ 12% w/v at the eating-ripe stage, as recommended by Macnish & Duong [26]. The 12-day criterion was adopted from Australian industry guidance, indicating that mangoes should typically ripen within approximately 6–12 days at 18–20 °C in the absence of ethylene treatment [14]. Where fewer than three qualifying cohorts were available, the estimate was based on the available qualifying cohorts. The upper GDD boundary based on ripening behavior (maxGDDr) was defined as the mean GDD of the latest up-to-three population cohorts for which fruit reached the eating-ripe stage within 6 days at 20 °C (days-to-ripe ≤ 6; eating-ripe firmness ≤ 0.71 kgf), consistent with the Australian mango ripening guidance described in Section 2.7. Where fewer than three qualifying cohorts were available, the estimate was based on the available qualifying cohorts.
2.8. Determination of Harvest Windows Using Flesh Color, SSC:TA Ratio, Dry Matter and Firmness
The lower GDD boundary based on internal quality attributes (minGDDi) was defined as the mean GDD of the earliest up-to-three qualifying cohorts, consistent with Section 2.7. A cohort met the minimum-maturity requirement when its mean satisfied the SSC:TA, flesh-color, and NIR-DM criteria. A minimum SSC:TA ratio of 7 was applied to all cultivars, following method-development observations in which some ‘R2E2’ fruits with ratios near 6–6.5 did not ripen satisfactorily. Minimum flesh-color scores of 7, 7, 9, and 13 were adopted for ‘KP’, ‘B74’, ‘Honey Gold’, and ‘Keitt’, respectively [7], together with AMIA minimum DM values of 15% FW for ‘KP’, ‘B74’, and ‘Honey Gold’ and 13% FW for ‘R2E2’ [22,28,29]. For cultivars without an established flesh-color threshold, the mean score of the earliest up-to-three cohorts otherwise meeting the criterion defined the candidate color target. For cultivars without an established DM specification, DM observed at minGDDi, considered with precursor observations where available, was used after classification to propose a candidate reference for future validation; these candidate DM values were not used to define minGDDi.
The maxGDDr boundary represents the upper end of the commercial harvest window, defined by the latest cohorts that reached eating ripe within ≤6 days at 20 °C. Mean harvest firmness in cohorts meeting this criterion ranged from 2.2 to 3.6 kgf (8 mm probe); a common 3 kgf benchmark was therefore adopted for maxGDDi. To account for within-cohort variation, maxGDDi was defined as the mean GDD of the earliest up-to-three cohorts in which more than 10% of individual fruit had harvest firmness below 3 kgf. At least five valid firmness measurements per cohort were required. Where fewer than three qualifying cohorts were available, the estimate used the available cohorts; where the criterion was not represented adequately within the sampled GDD range, maxGDDi was reported as unresolved.
2.9. Statistical Analysis and Visualization
Generalized Additive Models (GAMs) were fitted where data density was sufficient to describe non-linear relationships between fruit attributes and thermal time; polynomial regression was used for limited datasets. GAMs were implemented in R using the mgcv package [30]. Common GDD and NIR-DM axis limits were applied across cultivars to facilitate graphical comparison.
3. Results
3.1. Temperature and GDD Profiles
The four study locations encompassed a broad range of thermal environments representative of major mango-growing regions in northern Australia, including tropical coastal environments at Darwin and Bowen, with Bowen experiencing cooler seasonal conditions than Darwin, and cooler inland subtropical environments at Dimbulah and Bungundarra. Season plots of daily mean temperature exhibited clear latitudinal and continental gradients, with temperature differences between sites during the winter and spring periods that are critical for flowering, fruit development, and maturation (Figure 1). Darwin consistently maintained the highest mean temperatures throughout the year, with relatively minor seasonal amplitude, reflecting its tropical maritime climate. In consequence, the rate of GDD accumulation in Darwin exceeded that of other locations. Bowen displayed intermediate thermal conditions, with warmer temperatures than the inland sites during winter but cooler summer temperatures than Darwin. In contrast, Bungundarra and Dimbulah experienced substantially cooler winter conditions, characterized by lower daily mean temperatures from June to August and greater seasonal variability. Across all sites, the coolest period occurred between July and August, with temperatures increasing progressively from September through December.
Figure 1.
Seasonal temperature and cumulative GDD data from ten-year (2013–2023) farm temperature records for sites in Bowen, Darwin, Dimbulah and Bungundarra. Top panel: Daily mean temperature. Bottom panel: Cumulative GDD, calculated using the bounded method (Tb = 12 °C; TB = 32 °C) from 1 June (DOY 152).
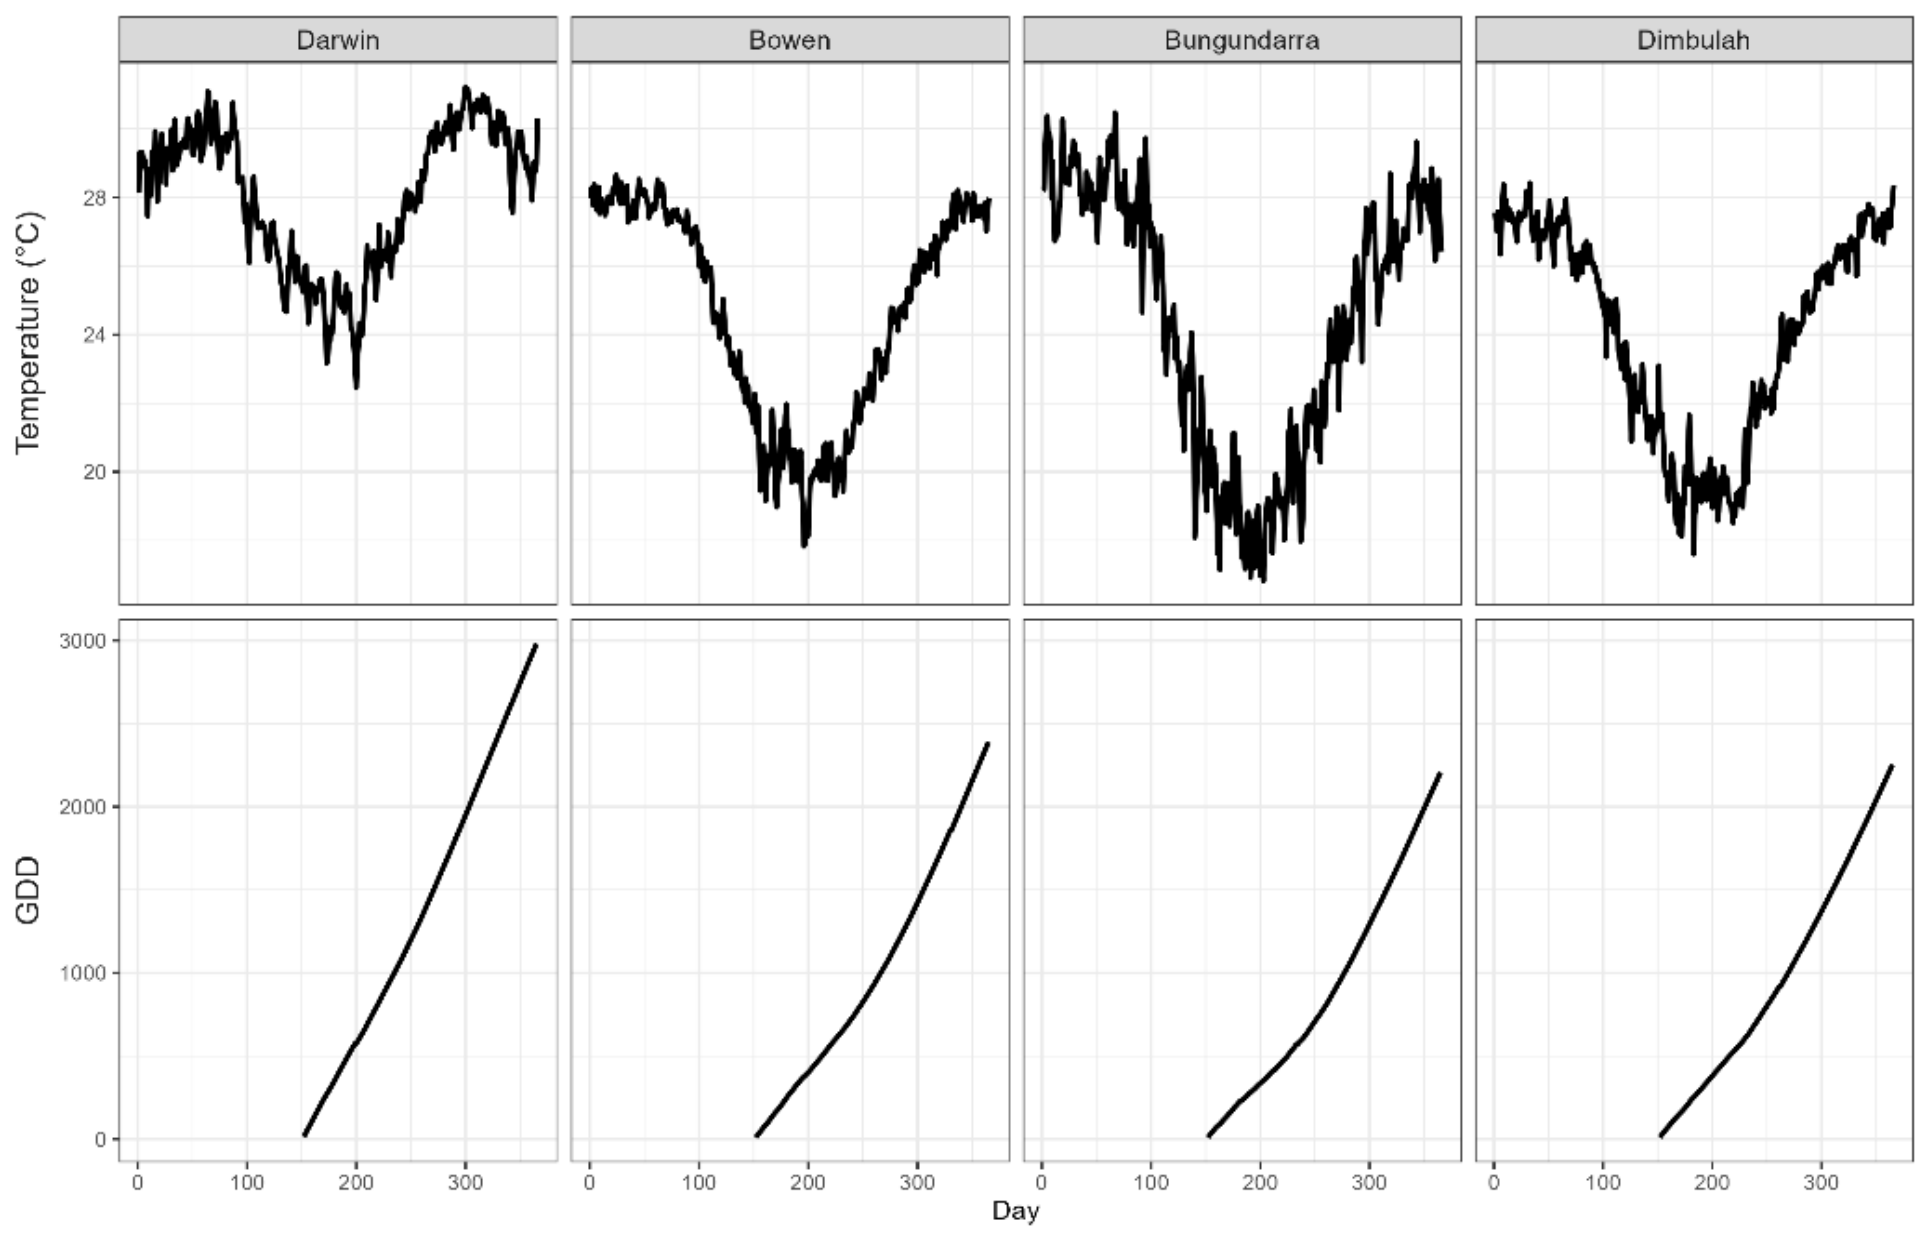
This difference between sites was mirrored in monthly mean daily GDD values (Table 3). Darwin maintained the highest daily GDD accumulation rate across the year, with only a modest winter dip, whereas Bowen was intermediate and showed a more pronounced winter minimum. Bungundarra and Dimbulah had the lowest winter values (June–August). Site differences were also seen in the number of days with Tmin < 12 °C within the June–December accumulation window: Darwin = 1, Bowen = 4, Bungundarra = 52, and Dimbulah = 72. The number of days with Tmax > 32 °C also varied: Darwin = 214, Bowen = 12, Bungundarra = 77, and Dimbulah = 103.
Table 3.
Monthly mean daily thermal time accumulation (GDD) across sites, from ten-year (2013–2023) farm temperature records. Standard deviation values are given in parentheses (n = 10). Daily GDD was calculated using the thresholds of Tb = 12 °C and TB = 32 °C.
Applying representative cultivar-specific GDD targets to the mean seasonal temperature profiles showed substantial differences among sites in the calendar time required to reach the same thermal-time target (Table 4). From 1 June, the calendar time required to reach the representative cultivar-specific GDD targets ranged from 127 to 213 days across cultivar × site combinations. For a given cultivar, regional differences in thermal accumulation resulted in a 45–49-day range in time to target, while within a given site the difference between the early ‘Kensington Pride’ and late ‘Keitt’ targets was 37–43 days.
Table 4.
Calendar days from 1 June required to reach representative cultivar-specific GDD targets, calculated from ten-year farm temperature records for Bowen, Darwin, Dimbulah and Bungundarra using Tb = 12 °C and TB = 32 °C.
3.2. Optimized Tb and TB Values
Fitted CV–Tb relationships had minima from 10.6 to 12.7 °C across cultivars (Figure 2; Table 5). The responses were generally shallow around the minima, and the common operational value Tb = 12 °C remained within the low-CV region for all cultivars. Tb = 12 °C was therefore retained for subsequent analyses.
Table 5.
Cultivar-specific lower base temperature (Tb) and upper threshold temperature (TB) values associated with minimum fitted coefficient of variation in accumulated GDD from flowering to minimum harvest maturity.
Figure 2.
Coefficient of variation (CV) of accumulated growing degree days (GDD) from flowering (asparagus stage) to minimum harvest maturity as a function of Tb, calculated using TB = 32 °C. Each point is the CV calculated across three population mean GDD values at one candidate Tb; the populations represented contrasting production regions. Solid black lines are fitted CV–Tb responses, black dashed vertical lines indicate the cultivar-specific minimum fitted CV, and orange dotted vertical lines indicate the common operational value Tb = 12 °C used in subsequent analyses.
Fitted CV–TB relationships varied more among cultivars than the corresponding CV–Tb relationships (Figure 3; Table 5). Minima occurred at 31.0–34.6 °C for ‘1243’, ‘B74’, ‘Honey Gold’, ‘Kensington Pride’, and ‘R2E2’. For ‘Keitt’, the fitted curve reached a broad low-CV plateau above approximately 37 °C; its numerical minimum at 41.1 °C did not identify a unique biological threshold. The common operational value TB = 32 °C remained within or close to the low-CV region for the cultivar set and was retained for subsequent analyses.
As expected, mean cross-site variation in time to minimum harvest maturity was highest when expressed as calendar days, substantially reduced using classic GDD, and reduced further using Tb- and TB-bounded GDD, with mean CV values across cultivars of approximately 13.5%, 2.5%, and 1.3%, respectively (Table 6).
Table 6.
Variability in time from the asparagus stage of flowering to minimum harvest maturity across sites, expressed as calendar days, classic growing degree days (GDD; Tb = 12 °C, with no upper threshold), and bounded GDD (Tb = 12 °C; TB = 32 °C). Values are mean ± SD, with CV (%) in parentheses, across n = 3 site-season populations per cultivar.
Figure 3.
Coefficient of variation (CV) of accumulated growing degree days (GDD) from flowering (asparagus stage) to minimum harvest maturity as a function of TB, calculated using Tb = 12 °C. Each point is the CV calculated across three population mean GDD values at one candidate TB; the populations represented contrasting production regions. Solid black lines are fitted CV–TB responses, black dashed vertical lines indicate the cultivar-specific numerical minimum fitted CV, and orange dotted vertical lines indicate the common operational value TB = 32 °C. For ‘Keitt’, the broad high-TB plateau indicates that the numerical minimum should not be interpreted as a uniquely resolved biological threshold.
3.3. Characterizing the Harvest Window
Harvest windows were characterized using two complementary approaches: postharvest ripening duration (GDDr) and internal fruit attributes at harvest (GDDi). The ripening-based approach is presented first because harvest firmness associated with the upper ripening boundary (maxGDDr) was subsequently used to inform the firmness criterion applied in defining maxGDDi.
3.3.1. Harvest Window Based on Ripening Time
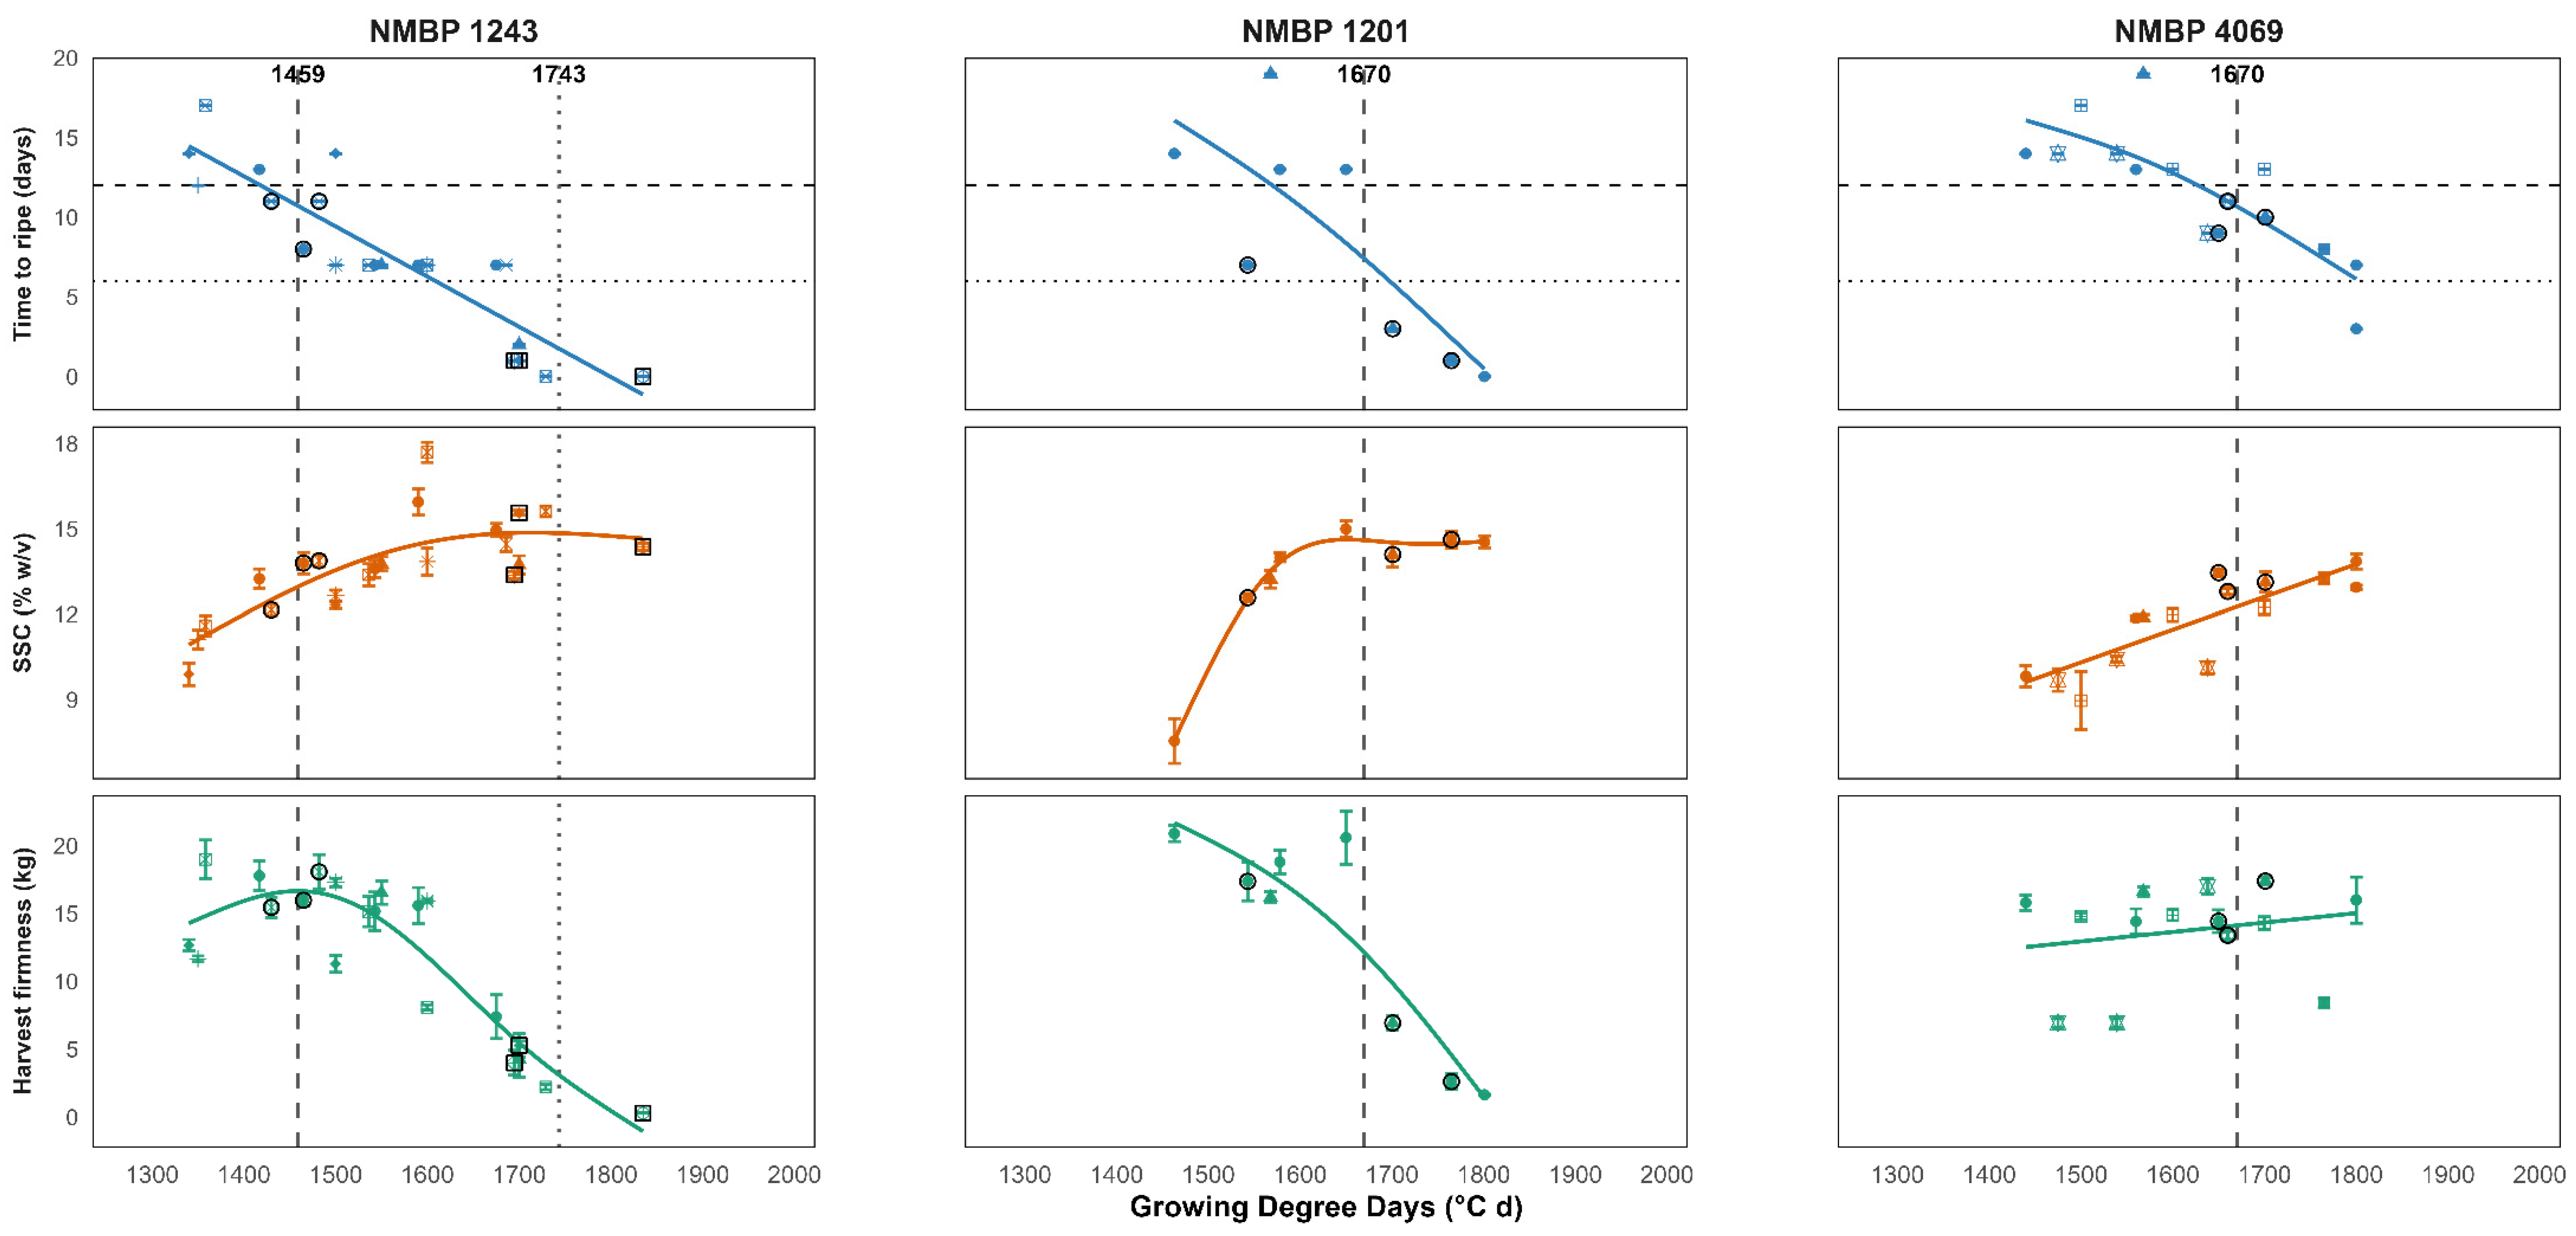
As expected for fruit of advancing maturity, increasing GDD was associated with a shorter time to ripen, lower firmness at harvest, and higher SSC at the eating-ripe assessment. The time course of these attributes during fruit development on tree for cultivars ‘Nam Dok Mai’, ‘R2E2’ and ‘Kensington Pride’ is shown in Figure 4, while those for ‘B74’, ‘Honey Gold’ and ‘Keitt’ and the recently commercialized NMBP selections (1243, 1201 and 4069) are provided in Appendix B.
Figure 4.
Population-cohort means ± SE for time to ripen (top panels), SSC at eating-ripe assessment (middle panels), and firmness of the matched hard-green cohorts at harvest (bottom panels), plotted against GDD for the high-importance commercial cultivars Nam Dok Mai (n = 16), R2E2 (n = 27), and Kensington Pride (n = 12), where n is the number of cohorts used in the ripening trials. In the top panels, horizontal dashed and dotted lines indicate the 12-day and 6-day ripening-time criteria, respectively. Dashed vertical lines indicate minGDDr, defined as the mean GDD of the earliest up-to-three cohorts meeting the criteria of time to ripen ≤ 12 days and eating-ripe SSC ≥ 12%. Dotted vertical lines indicate maxGDDr, defined as the mean GDD of the latest up-to-three cohorts reaching the eating-ripe stage within ≤ 6 days and with eating-ripe firmness ≤ 0.71 kgf. Black open circles and squares denote cohorts used in the minGDDr and maxGDDr calculations, respectively. Because minGDDr and maxGDDr represent the mean GDD of the selected cohorts, the vertical boundary lines do not necessarily coincide with individual highlighted points. Eating-ripe firmness was used in selection of maxGDDr cohorts but is not plotted; the bottom panels show firmness at harvest. Values of 20 days indicate cohorts that had not reached the eating-ripe stage by the end of the 20-day assessment period. Different point shapes represent site-season populations, as described in Table A1. As described in Section 2.7, these GDD recommendations were calculated as the average GDD of the earliest up to three qualifying cohorts for minGDDr and the latest up-to-three qualifying cohorts for maxGDDr or, where fewer than three qualifying cohorts were available, based on the available qualifying cohorts. The average values of these attributes for the selected cohorts are shown in Table 7. For cultivars with resolved maxGDDr and matched harvest-firmness data, mean harvest firmness of the corresponding upper-boundary cohorts ranged from 2.2 to 3.6 kgf (Table 7). A value of 3 kgf firmness was used as the firmness benchmark for the individual-fruit maxGDDi assessment.
Table 7.
Ripening time-derived minGDD and maxGDD for the harvest window for nine cultivars, calculated as the mean GDD of up to three qualifying cohorts meeting the required specifications. Average DM, SSC and time to ripen of the minGDDr qualifying cohorts, and average firmness of the maxGDDr cohorts are provided.
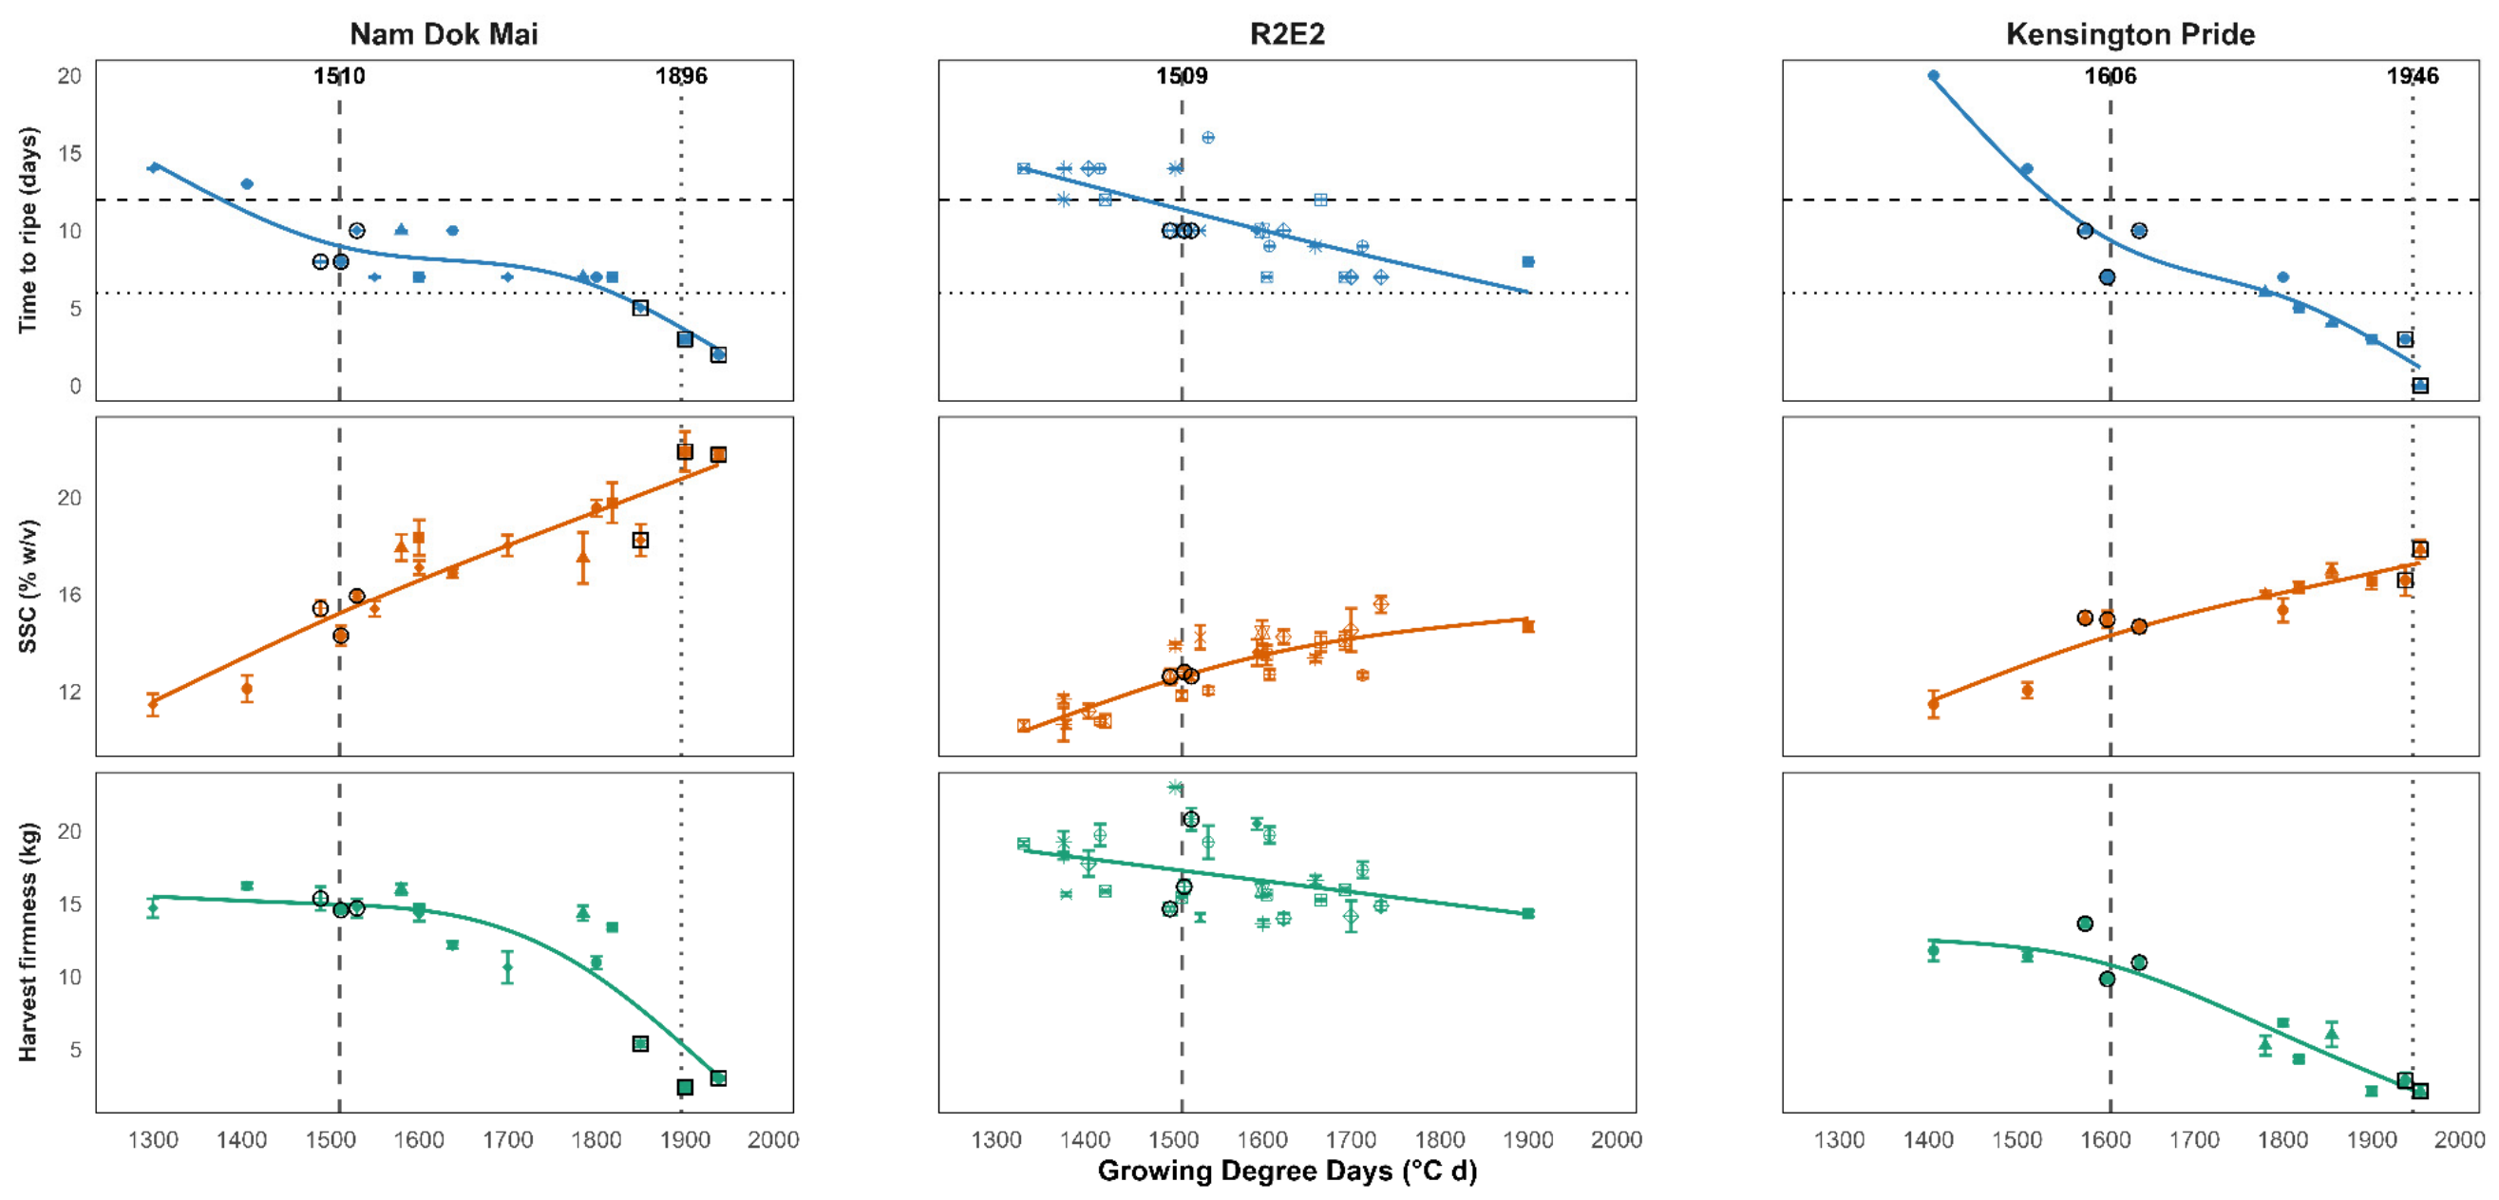
Ripening-based maturity boundaries varied among cultivars (Figure 4; Table 7). minGDDr was resolved for all nine cultivars, whereas maxGDDr was resolved for ‘1243’, ‘B74’, ‘Honey Gold’, ‘Kensington Pride’, and ‘Nam Dok Mai’ but not for ‘1201’, ‘4069’, ‘Keitt’, or ‘R2E2’. Matched harvest-firmness data were unavailable for the late ‘Honey Gold’ cohorts that defined maxGDDr. Legacy data extended the observed range for ‘Honey Gold’ and ‘Keitt’ to 2172 and 2762 °C d, respectively [7,31]; the ‘Honey Gold’ flesh-color response was consistent with its current maxGDDr, while ‘Keitt’ remained below a maximum-maturity color endpoint. These legacy observations therefore support upper references but do not satisfy the current matched firmness and ripening criteria.
3.3.2. Harvest Windows Based on Flesh Color, SSC:TA Ratio, DM and Firmness
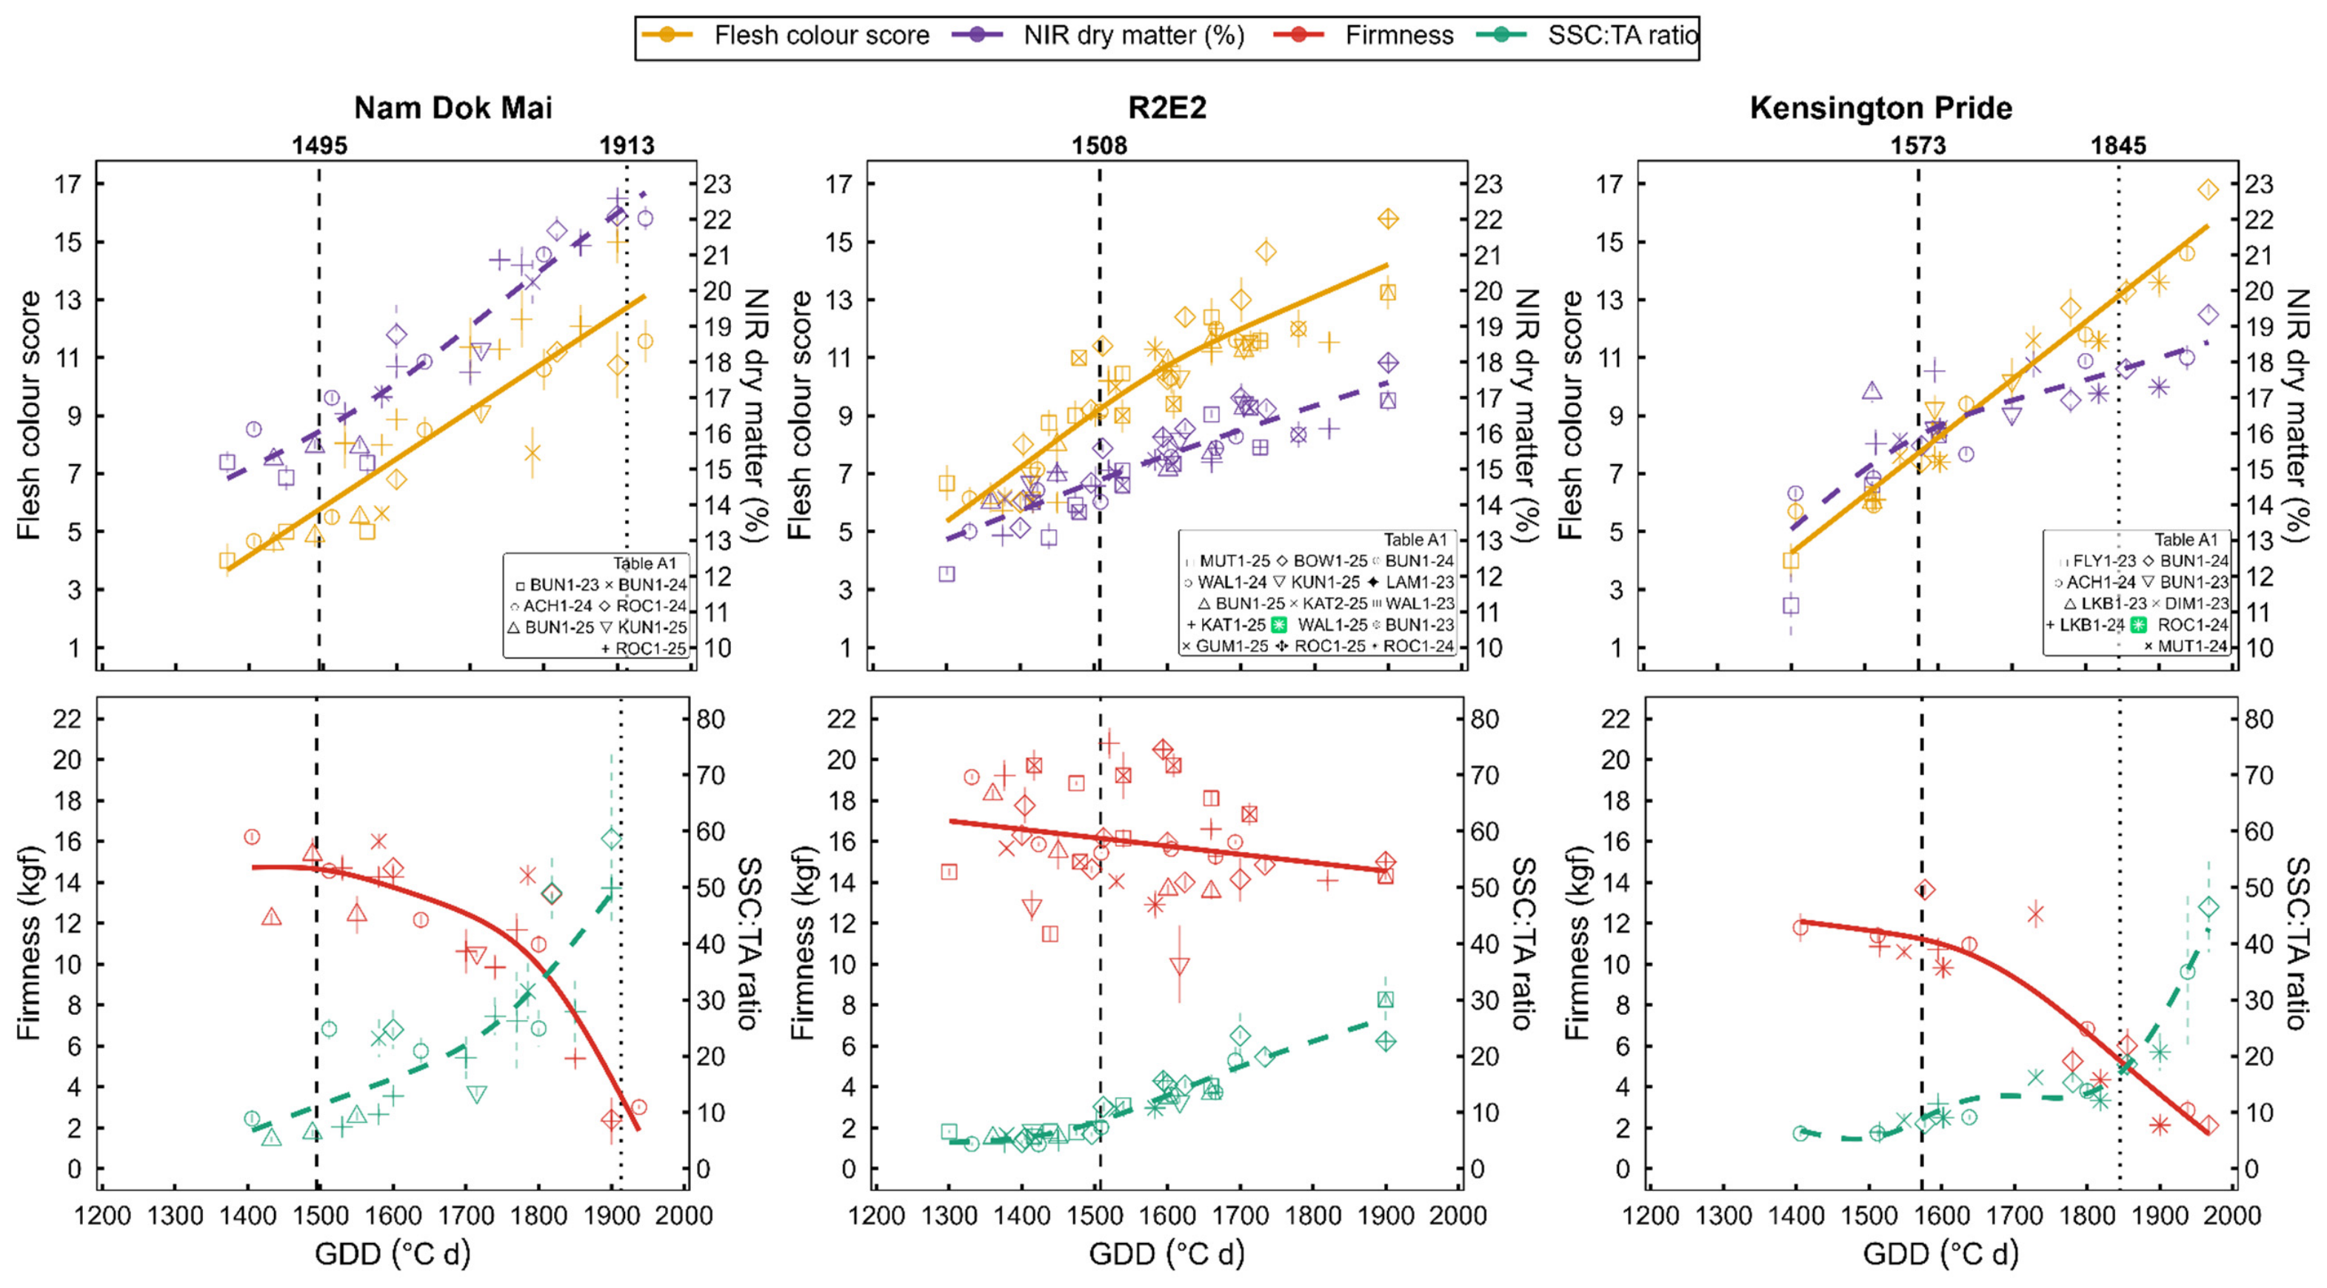
For the nine cultivars assessed, internal flesh-color attributes a* and b*, DM and SSC:TA ratio increased with accumulated GDD, whereas hue angle and flesh firmness decreased. The time course of these attributes during fruit development on the tree is shown in Figure 5 for cultivars ‘Nam Dok Mai’, ‘R2E2’ and ‘Kensington Pride’, while those for ‘B74’, ‘Honey Gold’ and ‘Keitt’ and the recently commercialized NMBP selections (1243, 1201 and 4069) are provided in Appendix C (Figure A3 and Figure A4). ‘Lady Jane’ and ‘Agam’ were not included in these comparisons because each was represented by only two populations (site × season combinations; Table 2).
Figure 5.
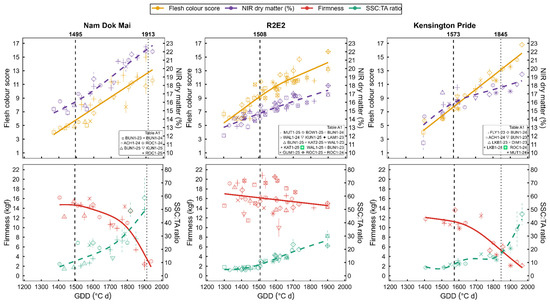
Population-cohort means ± SE for flesh color score and NIR dry matter (top panels), and harvest firmness and SSC:TA ratio (bottom panels), plotted against GDD at harvest for Nam Dok Mai (NDM), R2E2 and Kensington Pride (KP). Colored lines are GAM fits. Dashed vertical lines indicate minGDDi, based on internal maturity attributes, and dotted vertical lines indicate maxGDDi, based on the revised individual-fruit harvest-firmness assessment relative to the 3 kgf benchmark. Corresponding minGDDi and maxGDDi values (°C d) are shown above the top panels where resolved. The attribute legend is shown at the top of the figure. Different point shapes represent site-season populations, identified by the population codes shown within each panel and detailed in Table A1.
Flesh-color scores of 7, 7, 9 and 13 for ‘KP’, ‘B74’, ‘Honey Gold’ and ‘Keitt’, respectively, as proposed by Amaral et al. [7] were adopted as indices of minimum harvest maturity. For the remaining cultivars, the mean flesh-color score of the earliest up-to-three qualifying cohorts was used to establish a cultivar-specific flesh-color target (Table 8). Cohort mean DM was also checked against available AMIA cultivar-specific minimum recommendations. The upper harvest boundary (maxGDDi) was based on individual-fruit harvest firmness using a 3 kgf benchmark.
Table 8.
Cultivar-specific mean internal-attribute values for the up-to-three cohorts at the minimum and maximum internal-attribute GDD boundaries (minGDDi and maxGDDi), presented as the value at minGDDi/the value at maxGDDi. Where maxGDDi was unresolved within the sampled range, the value is reported as NA. Flesh color is presented as the recommended cultivar-specific target score. For cultivars without a previously established target, the score was derived from qualifying cohorts at minGDDi, with GDD and CIE L*a*b* values provided as supporting descriptors. The final column presents retained industry DM specifications and candidate cultivar-specific DM references arising from the present study. Candidate values require future validation and should not be interpreted as revised individual-fruit industry standards.
There were notable cultivar differences in the thermal requirement to minimum harvest maturity, with minGDDi ranging from 1428 °C d for ‘1243’ to 2177 °C d for ‘Keitt’. Upper boundaries were resolved for ‘B74’, ‘Nam Dok Mai’, ‘Kensington Pride’, ‘1243’, and ‘1201’, but were not resolved within the sampled GDD range for ‘Honey Gold’, ‘Keitt’, ‘R2E2’, or ‘4069’. For ‘B74’, minGDDi and maxGDDi values of 1706 and 1988 °C d, respectively, were identified (Appendix C, Figure A3). MinGDDi was lower for ‘Nam Dok Mai’ and ‘Kensington Pride’, at approximately 1495 and 1573 °C d, respectively, while their maxGDDi values were approximately 1913 and 1845 °C d, respectively (Figure 5). ‘Keitt’ displayed the highest minimum maturity boundary in this set, at approximately 2177 °C d. Selection ‘1243’ was characterized by earlier minimum and maximum maturity boundaries, at approximately 1428 and 1657 °C d, respectively, than selection ‘1201’, for which minGDDi and maxGDDi remained approximately 1584 and 1783 °C d, respectively (Appendix C, Figure A4).
Cultivar-specific flesh-color targets, maturity attributes at minGDDi and maxGDDi, and existing or candidate DM reference values are summarized in Table 8. Existing industry DM specifications were retained for ‘B74’ and ‘Kensington Pride’. Candidate references of ≥16% w/w for ‘Honey Gold’, ‘Keitt’, and ‘Nam Dok Mai’, ≥14% for ‘R2E2’, approximately 14% for ‘1243’, and 14–15% for ‘1201’ are proposed for future validation. Insufficient data were available to propose a DM specification for ‘4069’.
Although the existing 15% industry minimum for ‘Honey Gold’ was used during minGDDi classification, the observed maturity responses supported ≥16% as a candidate reference for future validation. Preliminary maturity targets for ‘Agam’ were L* = 80.67, a* = 1.69, b* = 45.33, hue = 89.38°, DM = 15.7%, NIR-DM = 15.7%, flesh-colour score = 11, minGDDi = 1545 °C d, and maxGDDi = 1805 °C d. Because these estimates came from two populations at one location across two seasons, they require validation elsewhere. For ‘Lady Jane’, the limited dataset yielded mean L* = 80.90, a* = −6.14, b* = 38.04, hue = 98.58°, DM = 16.2%, NIR-DM = 16.2%, flesh-color score = 7, and median GDD = 1585 °C d. Limited sample quality and GDD coverage prevented reliable resolution of either boundary. These observations are provided to guide future sampling and are not included as recommended harvest windows in Table 9.
3.3.3. Integrated Cultivar-Specific Harvest Windows
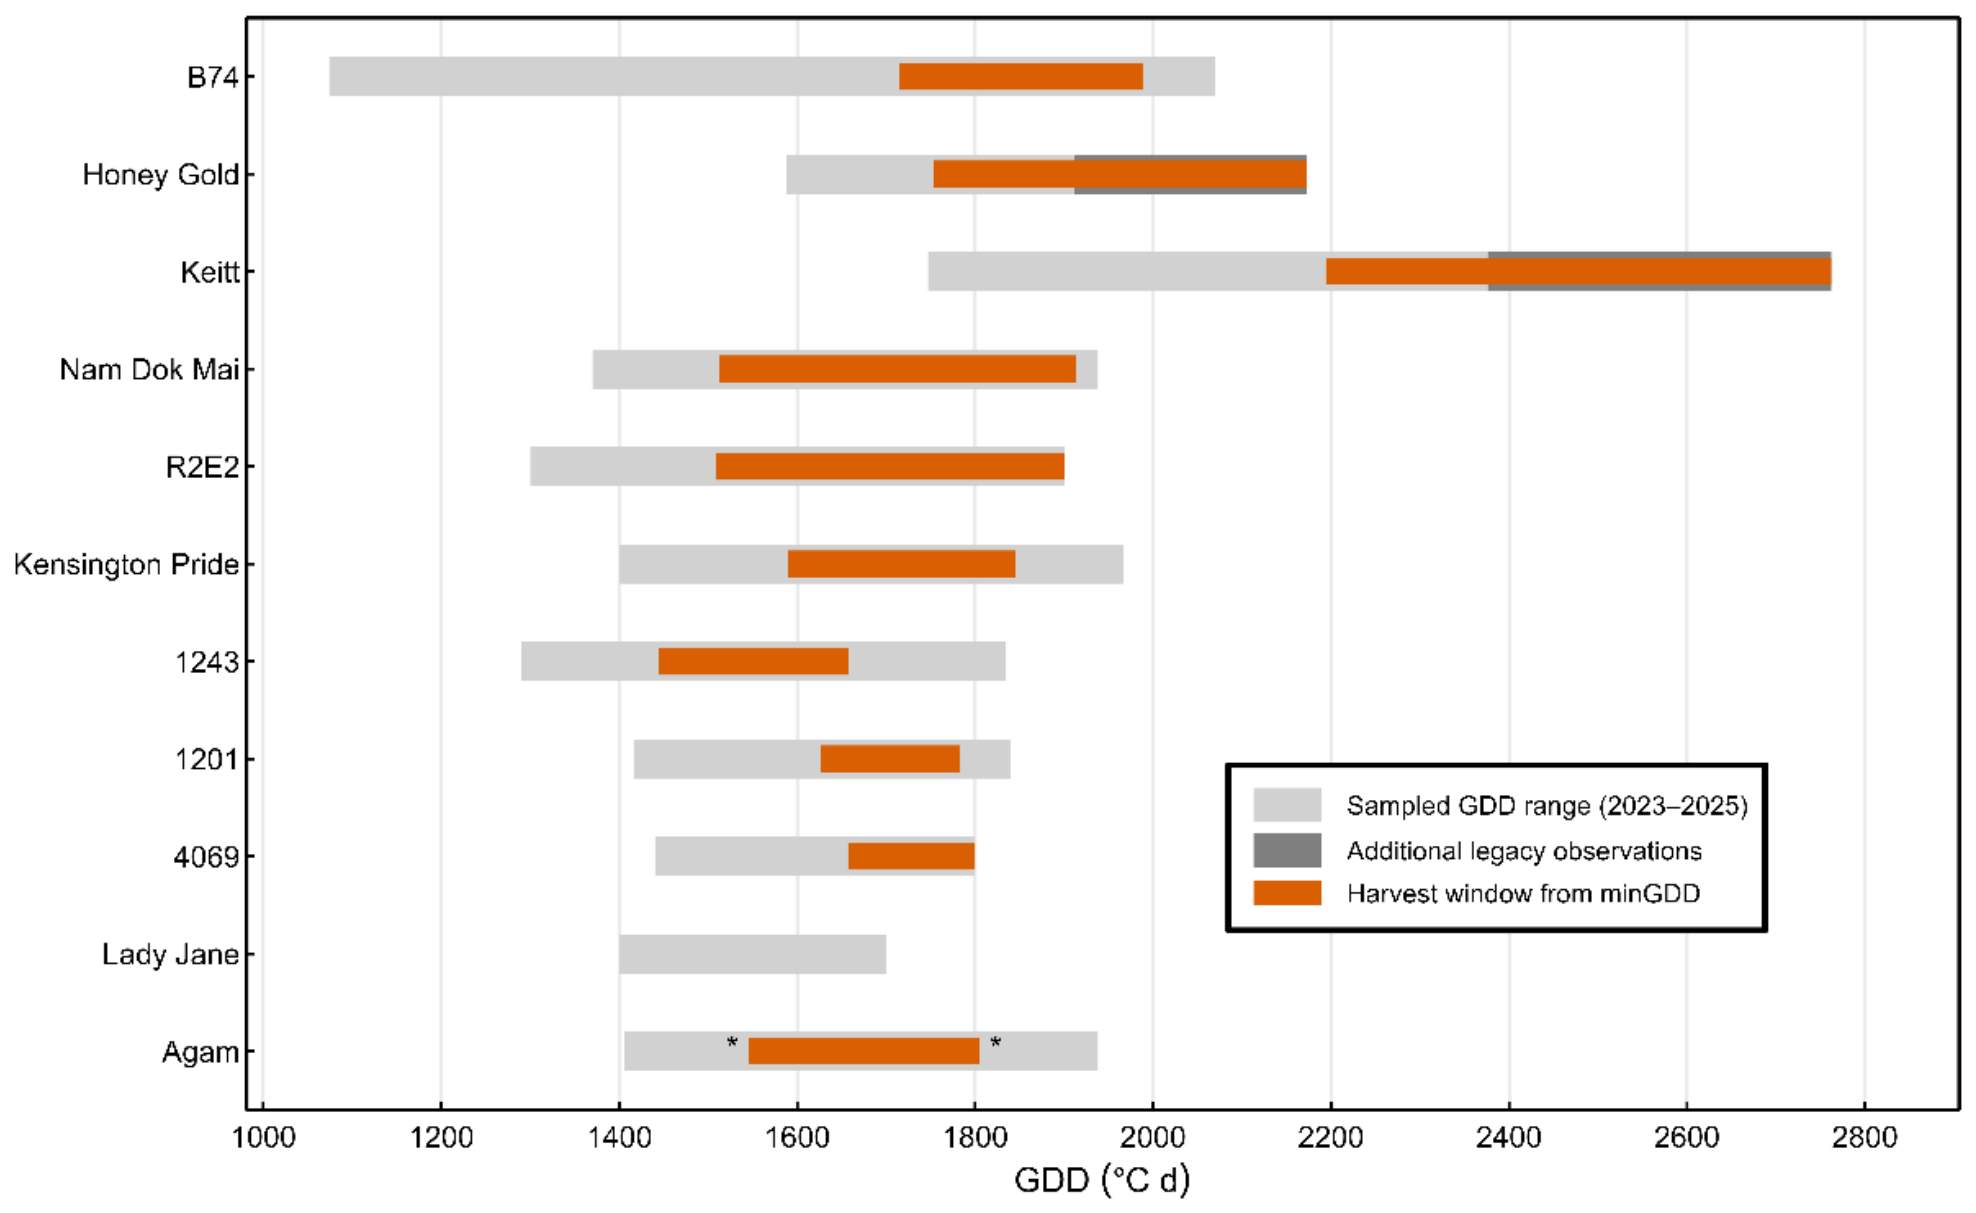
The two harvest-window approaches were integrated to derive the recommendations in Table 9. Where both lower-boundary estimates were available, recommended minGDD was the mean of minGDDi and minGDDr. Recommended maxGDD was based on maxGDDi because the individual-fruit firmness criterion captures within-cohort soft-fruit risk and produced the more conservative commercial boundary; maxGDDr was retained as supporting postharvest evidence. Where maxGDDi remained unresolved, the highest sampled GDD or, for ‘Honey Gold’ and ‘Keitt’, a legacy upper reference was presented as a lower-limit or provisional reference rather than a validated maximum.
Table 9.
Previously published precursor study [7] values, revisions, and current study recommendations for growing degree days (GDD) from flowering (asparagus stage) to minimum (minGDD) and maximum harvest maturity (maxGDD), with GDD calculated in the precursor and current study using Tb = 12 °C and TB = 32 °C. The minGDDi boundary was based primarily on SSC:TA ≥ 7, together with established cultivar-specific flesh color targets where available and existing AMIA minimum DM specifications of 13% or 15%, where available. For cultivars without an established specification, candidate DM references were derived after boundary classification and were not used to define minGDDi.” The maxGDDi boundary was based on an individual-fruit harvest-firmness assessment relative to a 3 kgf benchmark (8 mm penetrometer probe), as described in Section 2.8. The minGDDr boundary was based on fruit reaching eating-ripe firmness (≤0.71 kgf) within 12 days and SSC ≥ 12%, while maxGDDr was based on fruit reaching eating-ripe firmness within 6 days. Recommended minGDD values were averaged between minGDDi and minGDDr where both estimates were available. For resolved upper boundaries, the recommended maxGDD was based on maxGDDi. The difference between the minimum and maximum values represents the harvest window. The unit for all GDD values is °C d. Where the upper boundary was unresolved, the highest sampled GDD is reported as a lower limit, preceded by the symbol >.
Figure 6.
Cultivar-specific harvest windows and sampled thermal-time coverage. Light-grey bars indicate the GDD range sampled during 2023–2025, while dark-grey extensions indicate additional observations from previous work. Orange bars extend from the recommended minGDD to the resolved maxGDD where available. For ‘Honey Gold’ and ‘Keitt’, the orange bars extend to legacy upper maturity reference points inferred from later flesh-color observations; however, these values have not been validated as maxGDD using the firmness- and ripening-based criteria applied in the present study. For ‘R2E2’ and ‘4069’, where the upper boundary remained unresolved, the orange bars extend to the highest GDD represented in the current dataset. For ‘Agam’, (*) indicates preliminary harvest GDD boundaries requiring further validation. ‘Lady Jane’ is shown for sampling coverage only because the available data were insufficient to resolve harvest GDD boundaries.
4. Discussion
4.1. Validation and Transferability of GDD Targets
Agreement between independently derived estimates provides the strongest evidence that a thermal-time target transfers across environments. Despite new seasons and sites, revised minGDD values for ‘B74’, ‘Honey Gold’, and ‘Keitt’ differed from the 2018–2022 estimates by only 13, 11, and 9 °C d, respectively—approximately one day of fruit development. This agreement supports the transferability of targets when flowering stage, temperature monitoring, and maturity assessment are standardized.
For the additional cultivars, confidence rests on replication among independent site × season populations rather than on the larger number of fruits or harvest cohorts within a population. The broad representation achieved for ‘R2E2’, ‘1243’, and ‘Kensington Pride’ strengthens their minGDD estimates, whereas further independent environments remain important for validating upper boundaries and the less extensively represented cultivars.
4.2. Site Differences
The pronounced regional divergence in calendar time required to reach the same GDD target demonstrates why fixed calendar-day recommendations do not transfer well across Australian production regions. Thermal time provides a common developmental scale, while pairing flowering date with cultivar-specific minGDD and maxGDD converts that scale into a practical forecast window for harvest scheduling and resourcing.
4.3. GDD Calculation
Most mango GDD studies have used only a lower base temperature, including Australian work [8] and the cultivar-specific approach of Osuna-García [13]. Such models assume continued developmental response as temperature rises, although high temperature can suppress mango photosynthesis and induce fruit stress [34,35]. A bounded formulation is therefore biologically defensible for hot environments and is consistent with the TB = 32 °C proposed for ‘Tommy Atkins’ in Brazil [36] and adopted in our earlier Australian work [7].
Across cultivars, the bounded calculation reduced mean cross-environment variability relative to both calendar days and classic GDD (Table 6). Keitt was the exception: its CV was already extremely low with classic GDD (0.2%) and was not reduced by the bounded calculation (0.4%). A Tb-only calculation may therefore be operationally adequate for Keitt under the environments represented, consistent with the lower-threshold approach used by Osuna-García [13].
The broad high-TB plateau for ‘Keitt’ does not identify a unique upper threshold. Two explanations remain plausible. First, the sampled Keitt populations were largely subtropical or elevated and contained relatively few days above approximately 37 °C, so changing TB above that level had little effect on accumulated GDD. Second, Keitt may have a genuinely different cultivar-specific thermal response, potentially related to its Floridian breeding background [37,38]. The observational design cannot distinguish these explanations; Keitt trials in hotter tropical environments, or controlled-temperature experiments, are required. The result should not be interpreted as evidence that Keitt lacks a supra-optimal temperature response.
For the remaining cultivars, fitted Tb values clustered around 12 °C and fitted TB values around 32 °C, with shallow CV responses near these operational values. Using common Tb = 12 °C and TB = 32 °C therefore offers a practical default and avoids confusion arising from historical use of both 10 and 12 °C base temperatures [8,10]. Nevertheless, the threshold optimization used only three populations per cultivar, so validation with additional independent thermal environments remains warranted.
4.4. Defining Minimum and Maximum Harvest Maturity in GDD
The main advance is a cultivar-specific harvest window rather than a minimum-maturity target alone. minGDD marks the lower commercial boundary at which fruit can ripen to acceptable quality, whereas maxGDD is an operational supply-chain boundary beyond which handling tolerance and remaining postharvest life become limiting. It is therefore not a physiological endpoint and may require adjustment for supply chains with different transit and ripening requirements.
GDDi and GDDr capture complementary information: internal attributes describe maturity at harvest, while ripening duration describes the remaining postharvest life. Their close agreement at the lower boundary supports averaging minGDDi and minGDDr. At the upper boundary, maxGDDi was prioritized because the proportion of individual fruit below 3 kgf exposes soft-fruit risk that a cohort mean can conceal; maxGDDr provides supporting evidence on the commercial consequence of that softening.
The cross-cultivar SSC:TA criterion of ≥7 provided a consistent lower-boundary rule and helped derive flesh-color targets for cultivars lacking established standards. Its agreement with ripening-based minGDD supports the chosen value, but cultivar-specific refinement remains appropriate, particularly for low-acidity cultivars such as ‘R2E2’ and ‘4069’, for which a higher ratio may be more discriminating.
The 3 kgf benchmark is also close to the transition between National Mango Board Stage 3 and substantially softer Stage 4 ‘Keitt’ fruit [39]. It should nevertheless be treated as a provisional common commercial benchmark, not a universal physiological threshold, until validated across cultivars, instruments, and supply chains.
4.5. Operational Use of Maturity Attributes
The maturity attributes used here are best viewed as tools for calibrating and auditing GDD targets rather than as competing stand-alone predictors. SSC:TA and flesh color are informative but require destructive sampling; periodic measurements can ground-truth an orchard’s thermal-time forecast, whereas routine block monitoring favors non-destructive measures.
NIR spectroscopy enables high-throughput, non-destructive DM assessment, but DM at a given maturity stage varies with growing conditions and should be interpreted with GDD and periodic flesh-color checks [20,21,22,23,24]. The present results support retaining approximately 15% DM for ‘B74’ and ‘Kensington Pride’ and suggest that the current ‘Honey Gold’ minimum may warrant movement toward 16%, while the 13% ‘R2E2’ minimum may be conservative. Candidate values for other cultivars (Table 8) are starting points for validation, not revised industry standards.
Flesh color remains a useful cultivar-specific destructive reference for calibrating NIR-DM, but color-card scores are sensitive to lighting and observer judgment. Standardized assessment or a reliable non-destructive color method would improve operational consistency.
At the upper boundary, individual-fruit firmness is valuable because it detects soft-fruit risk that cohort means can obscure. Non-destructive firmness methods and direct cross-instrument calibration should be priorities for translating the provisional 3 kgf penetrometer benchmark into routine commercial use.
4.6. Cultivar-Specific Harvest Maturity Windows and Study Limitations
Cultivar differences in minGDD and harvest-window breadth do not map directly onto conventional early-, mid-, or late-season labels, because those labels combine flowering date with fruit-development duration [40]. Forecasting harvest timing therefore requires both a flowering-date estimate and the cultivar’s GDD window; either component alone can misclassify regional production timing.
The recommendations form an evidence hierarchy. Minimum boundaries are generally better supported than maximum boundaries; complete current-study windows were resolved for ‘B74’, ‘Kensington Pride’, ‘Nam Dok Mai’, and ‘1243’, while ‘1201’ has an internal-attribute upper boundary only and other upper references remain provisional or unresolved. This distinction is important when the values are used for commercial decisions.
The multi-location design incorporated the biological and management variability typical of commercial orchards, but did not isolate effects of row orientation, crop load, water status, rootstock, or management history. Agreement among independent populations suggests that GDD was robust within the represented conditions, not that those factors have no effect.
Unresolved upper boundaries largely reflect right-truncated sampling caused by commercial harvest and pruning, fruit drop, bird damage, and depletion of tagged fruit. Future validation should deliberately retain late fruit and collect matched flesh color, harvest firmness, and postharvest-ripening data, particularly for ‘Honey Gold’, ‘Keitt’, ‘R2E2’, and ‘4069’.
Additional qualifications remain cultivar-specific: the ‘1201’ upper boundary requires postharvest validation; ‘Agam’ was represented by only two populations at one location; and ‘Lady Jane’ lacked sufficient coverage to resolve either boundary. For ‘Nam Dok Mai’, the reported minGDD applies to supply chains requiring normal ripening to eating quality and not to intentionally immature hard-green markets [41,42].
5. Conclusions
Flowering-to-harvest thermal time provided a more transferable basis for mango harvest forecasting than calendar days across contrasting Australian production environments. Mean cross-environment CV declined from 13.5% for calendar days to 2.5% for classic GDD and 1.3% for bounded GDD. Previously proposed minGDD values for ‘B74’, ‘Honey Gold’, and ‘Keitt’ were independently validated; minGDD values were established for nine cultivars, and complete current-study harvest windows were resolved for four. The following recommendations balance operational simplicity with the differing strength of evidence for cultivar-specific upper boundaries:
- •
- For standardized forecasting, calculate GDD using common operational values of Tb = 12 °C and TB = 32 °C, together with the cultivar-specific minGDD and maxGDD values reported here.
- •
- Define recommended minGDD by integrating minGDDi and minGDDr, and use maxGDDi for resolved upper boundaries because the individual-fruit 3 kgf criterion provides the more conservative commercial limit. Treat single-method, legacy, and unresolved upper estimates as provisional until matched late-harvest and ripening data are available.
- •
- For ‘Keitt’, a Tb-only calculation may be adequate in environments comparable to those represented because classic GDD already gave a very low CV (0.2%) and bounded GDD did not improve it (0.4%). Validate this response in hotter sites before concluding that ‘Keitt’ lacks a supra-optimal temperature response.
Together, these thresholds convert standardized flowering observations and orchard temperature records into cultivar-specific harvest forecasts. Mango breeding programs should report flowering-to-harvest GDD routinely, and orchard planners should combine flowering behavior with cultivar-specific GDD requirements when selecting cultivar–region combinations and scheduling harvest resources.
Supplementary Materials
The following supporting information can be downloaded at: https://www.mdpi.com/article/10.3390/horticulturae12101240/s1, File S1: Hard_green_harvest_exercises_merged; File S2: NIR_DM_validation_2023_2025_merged_v2; File S3: NIR_DM_validation_2024_independent_pairs; File S4: Ripening_exercises_merged.
Author Contributions
Conceptualization, M.H.P.d.A. and K.B.W.; methodology, M.H.P.d.A., K.B.W., C.M. and G.D.; investigation, M.H.P.d.A.; formal analysis, M.H.P.d.A.; writing—original draft preparation, M.H.P.d.A.; writing—review and editing, K.B.W., C.M. and G.D.; supervision, K.B.W., C.M. and G.D. All authors have read and agreed to the published version of the manuscript.
Funding
This project was funded by Hort Innovation, using the mango research and development levy, contributions from the Australian Government and co-investment from CQUniversity (project MG22000). Hort Innovation is the grower-owned, not-for-profit research and development corporation for Australian horticulture.
Institutional Review Board Statement
Not applicable.
Informed Consent Statement
Not applicable.
Data Availability Statement
The original contributions presented in this study are included in the article/Supplementary Materials. Further inquiries can be directed to the corresponding authors.
Acknowledgments
The authors acknowledge Jashan Kaur of NT DPI, Maisa Pereira of CQUni and David Bin of QDAF for assistance with field assessments in this multi-locality study. Logistical support was also provided by NT DPI, through Upendra Shekhawat and Muhammad Sohail, and by the QDAF Walkamin Research Station. Orchard access and assistance were also provided by participating growers: Tom Griggs, Kris Bailey, Teresa Tan, Dave Gray, Stephen, Rylan and Darcy Scurr, Marie Piccone, Anna Drury, Rory Nunes, Dale McDonald, Jeff Gooding, Ray Courtice, Ian Groves, Ben Martin and Brad Bowen.
Conflicts of Interest
Kerry Walsh has involvement with the development of the F750 fruit quality spectrometer but was not involved in the quality control exercise undertaken for the device used in this study.
Appendix A. Harvest Exercises
Table A1.
Characterization of study populations (site × cultivar × season). ‘Hard-green harvests (n)’ indicates the number of harvest cohorts sampled at the hard-green stage for each population. ‘Ripening assessment’ indicates whether fruit from that population was assessed for ripening time. Superscript numerals after locality names identify different orchards sampled within the same region and season.
Appendix B. Supplementary Ripening-Based Harvest-Window Responses
Figure A1.
As for Figure 4, for B74, Honey Gold and Keitt.
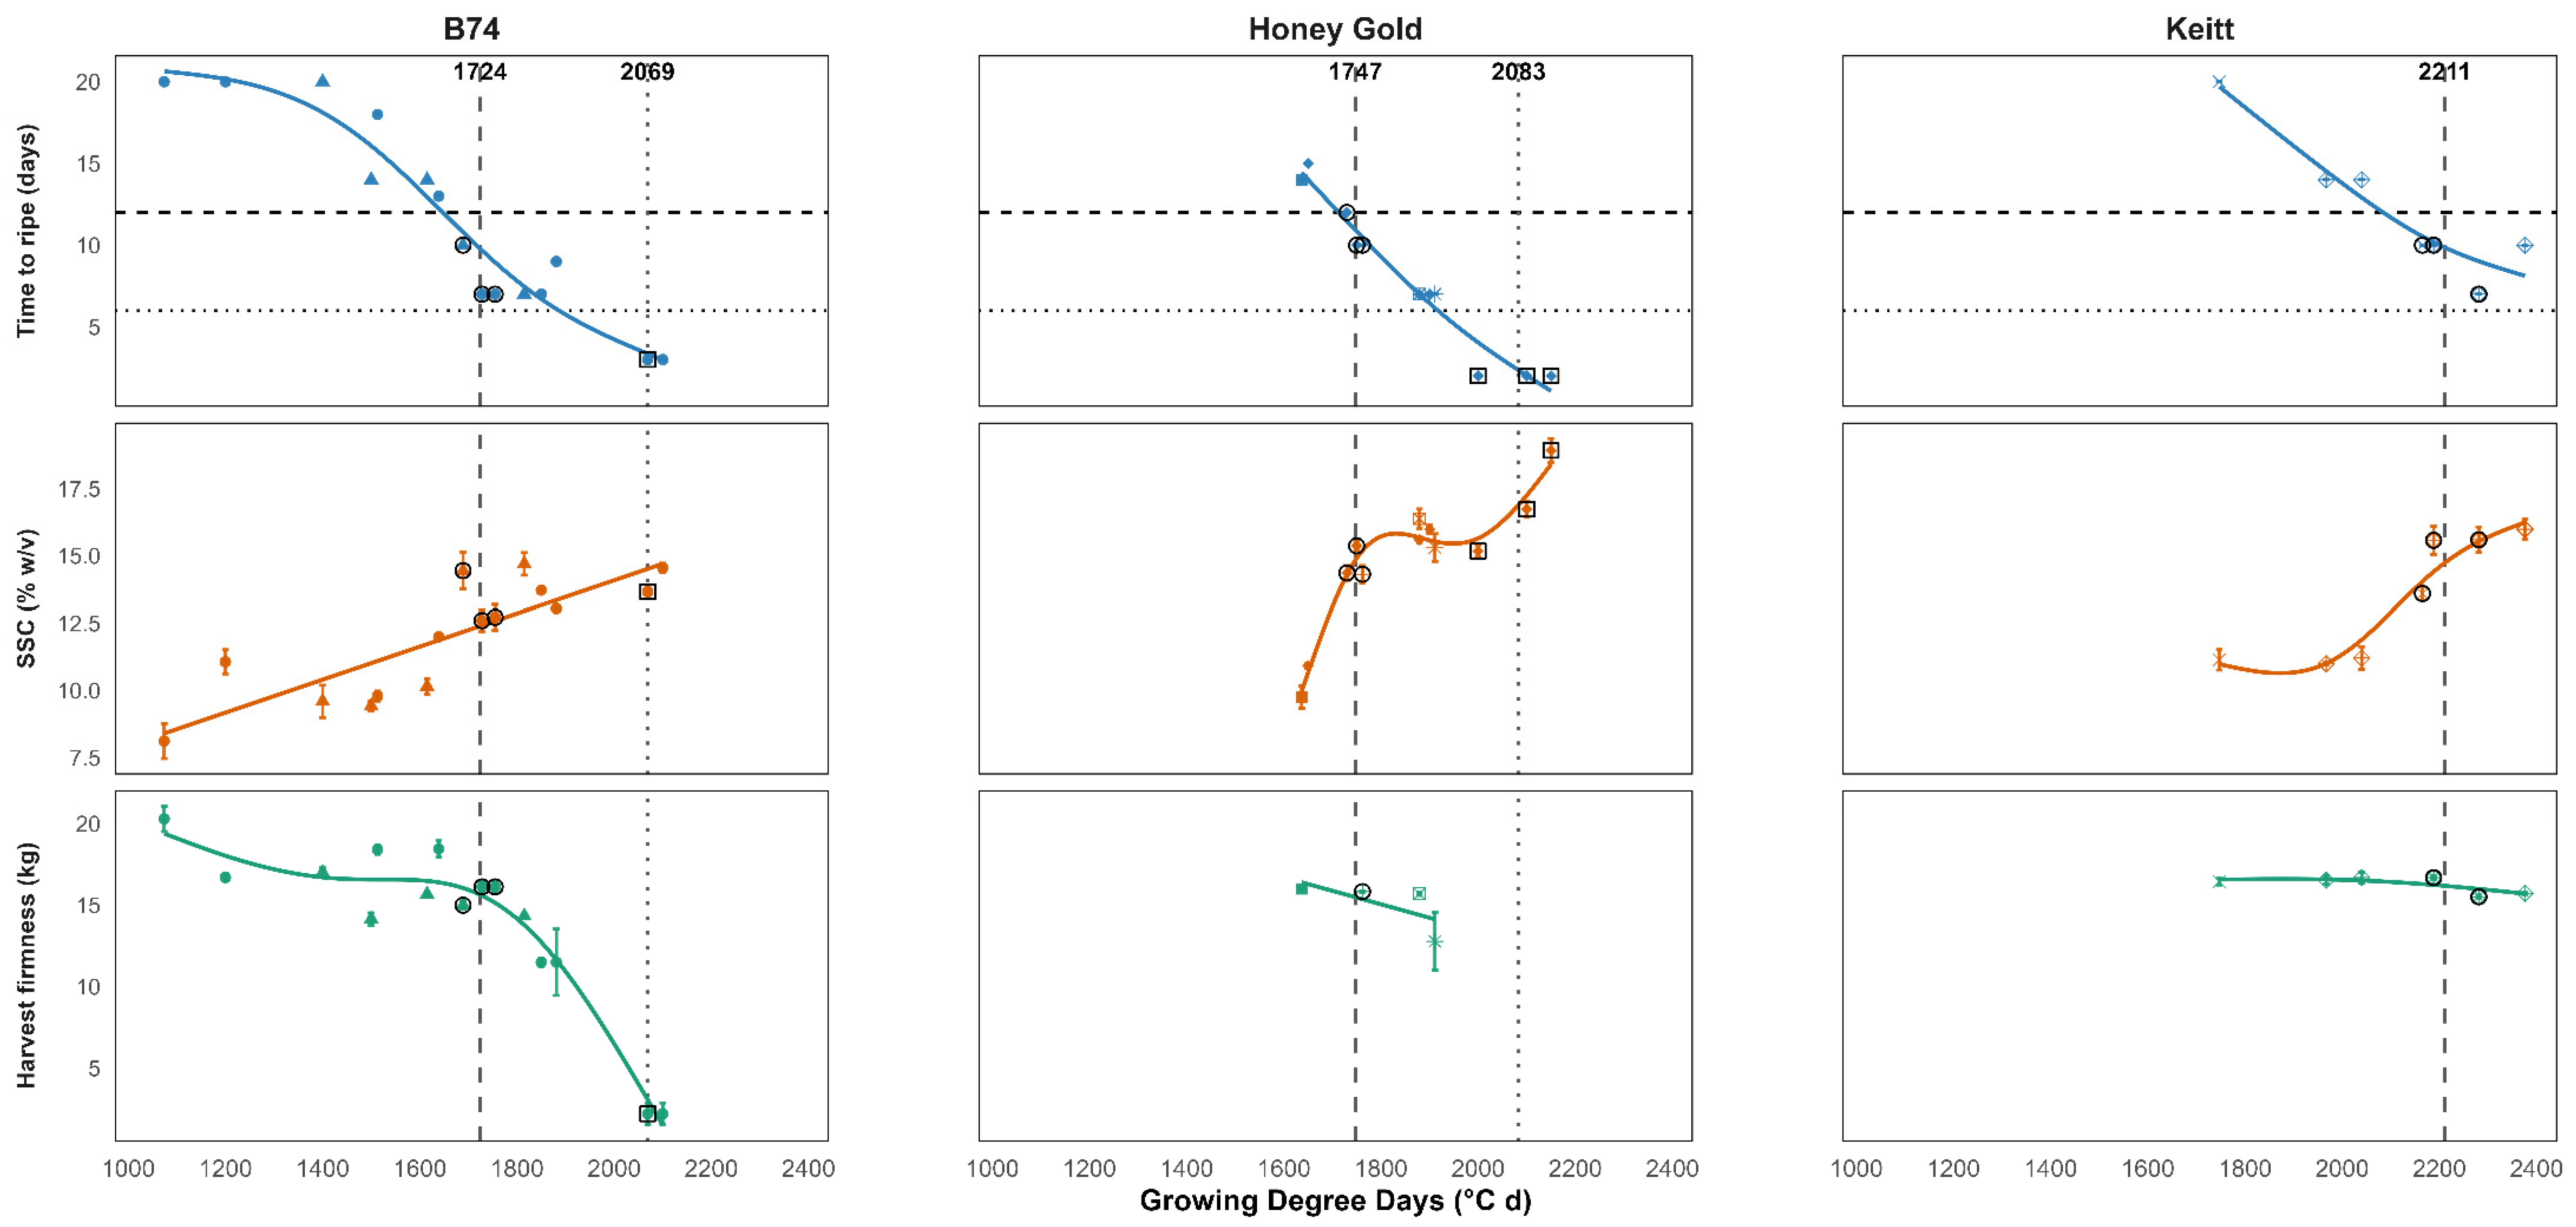
Figure A2.
As for Figure 4, for NMBP 1243, NMBP 1201 and NMBP 4069.
Appendix C. Supplementary Harvest-Attribute Responses
Figure A3.
Flesh color score and NIR dry matter (top panels), and harvest firmness and SSC:TA ratio (bottom panels), plotted against GDD at harvest for B74, Honey Gold and Keitt. Symbols, fitted lines, vertical maturity boundaries and population codes are as described for Figure 5. Corresponding minGDDi and maxGDDi values (°C d) are shown above the top panels where resolved. Site-season population codes are detailed in Table A1. The dotted vertical line for maxGDDi, where resolved, represents the revised upper harvest boundary based on the individual-fruit harvest-firmness assessment relative to the 3 kgf benchmark.
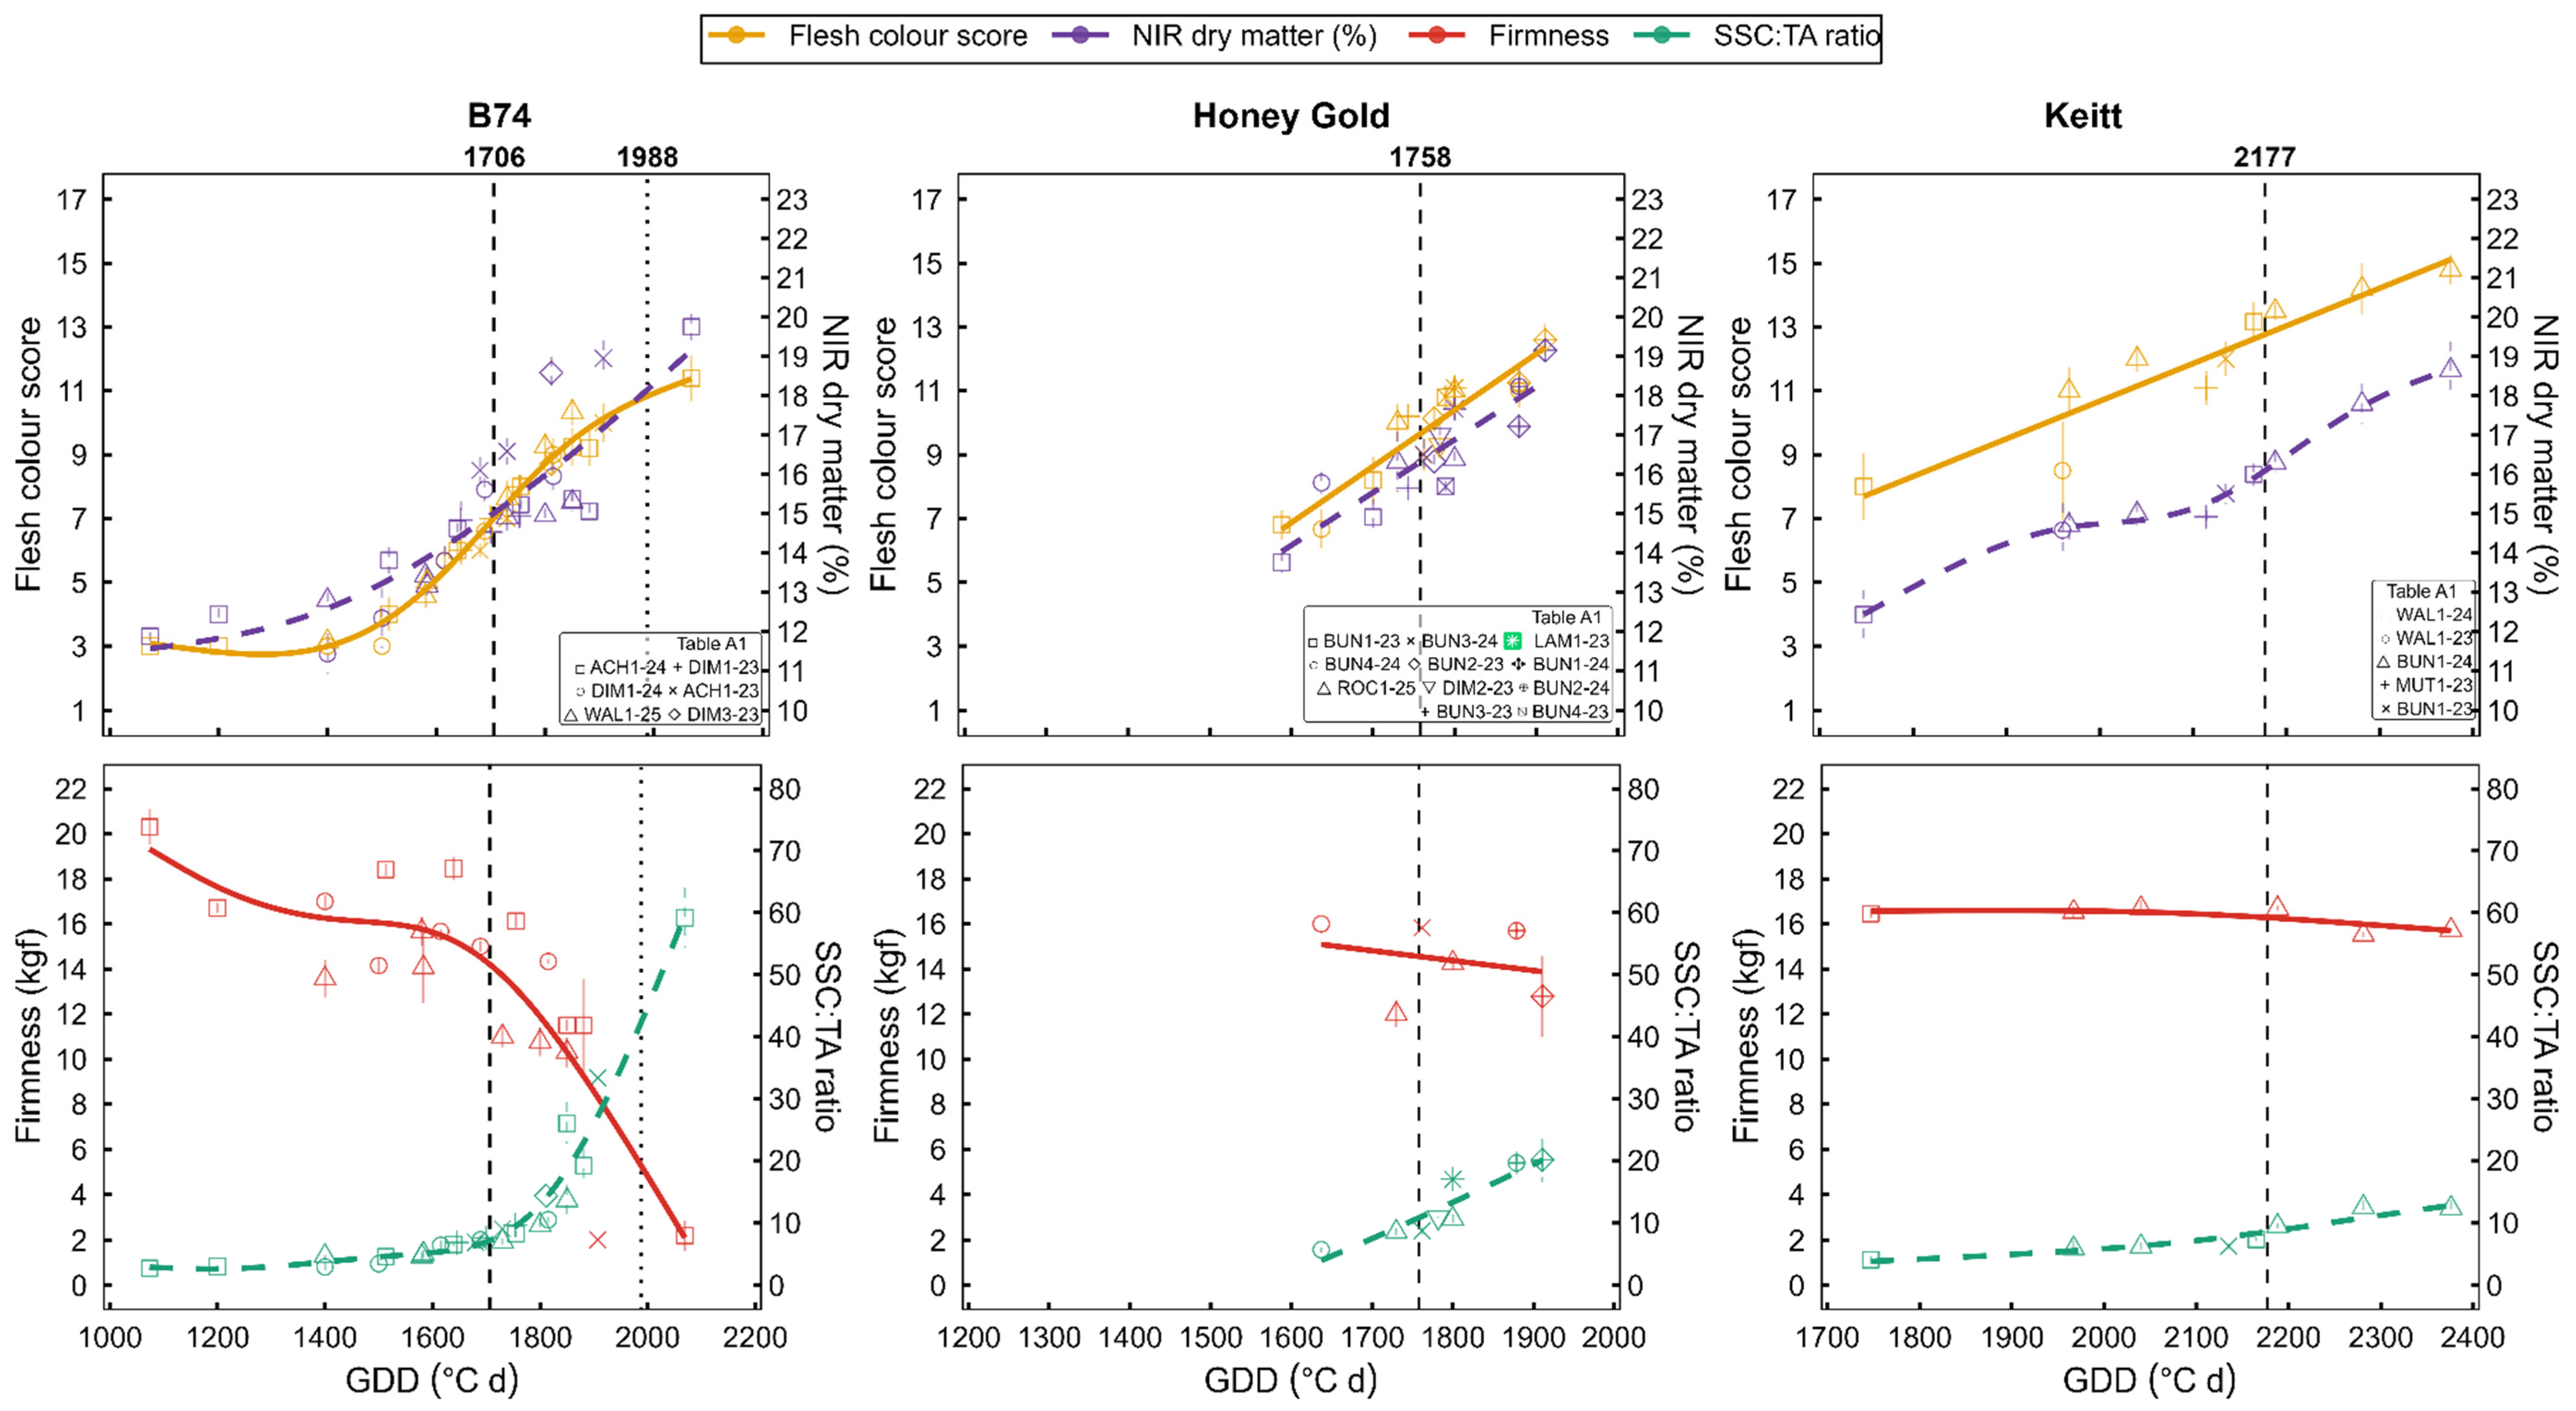
Figure A4.
As for Figure A3, for 1243, 1201 and 4069. The dotted vertical line for maxGDDi, where resolved, represents the revised upper harvest boundary based on the individual-fruit harvest-firmness assessment relative to the 3 kgf benchmark.
References
- Arnold, C.Y. Maximum-minimum temperatures as a basis for computing heat units. Proc. Am. Soc. Hortic. Sci. 1960, 76, 682–692. [Google Scholar]
- McMaster, G.S.; Wilhelm, W.W. Growing degree-days: One equation, two interpretations. Agric. For. Meteorol. 1997, 87, 291–300. [Google Scholar] [CrossRef] [Scilit]
- Fotouo Makouate, H.; Zude-Sasse, M. Advances in growing degree days models for flowering to harvest: Optimizing crop management with methods of precision horticulture—A review. Horticulturae 2025, 11, 1415. [Google Scholar] [CrossRef] [Scilit]
- Dhonju, H.K.; Bhattarai, T.; Amaral, M.H.; Matzner, M.; Walsh, K.B. Management information systems for tree fruit—2: Design of a mango harvest forecast engine. Horticulturae 2024, 10, 301. [Google Scholar] [CrossRef] [Scilit]
- Meurant, N.; Holmes, R.; MacLeod, N.; Fullelove, G.; Bally, I.S.E.; Kernot, I. Mango Information Kit: Agrilink, Your Growing Guide to Better Farming Guide (Agrilink Series QAL9903); Department of Primary Industries, Queensland Horticulture Institute: Coes Creek, QLD, Australia, 1999. Available online: https://era.dpi.qld.gov.au/id/eprint/1647/ (accessed on 23 January 2026).
- Whiley, A.; Hofman, P. Development of Best Practice Protocols for Production of Calypso™ Mango; Final Report FR02049; Sunshine Horticultural Services Ltd. for Horticulture Australia Ltd.: Nambour, QLD, Australia, 2006. [Google Scholar]
- Amaral, M.H.; McConchie, C.; Dickinson, G.R.; Walsh, K.B. Growing degree day targets for fruit development of Australian mango cultivars. Horticulturae 2023, 9, 489, Correction in Horticulturae 2025, 11, 1294. https://doi.org/10.3390/horticulturae11111294. [Google Scholar] [CrossRef] [Scilit]
- Diczbalis, Y.; Wicks, C.; Landrigan, M. Heat Sums to Predict Fruit Maturity in Mango (cv. Kensington Pride): A Report for Acacia Hills Farm Pty. Ltd. (Northern Territory) and the Horticultural Research and Development Corporation (HRDC); Final Report FR605; Horticultural Research and Development Corporation: New Delhi, India, 1997; ISBN 1864238763. [Google Scholar]
- Léchaudel, M.; Joas, J. An overview of preharvest factors influencing mango fruit growth, quality and ripening. Sci. Hortic. 2007, 113, 107–117. [Google Scholar] [CrossRef]
- Moore, C.; Owens, G.; Connelly, M. Developing a Crop Forecasting System for the Australian Mango Industry; Project MG05004 Final Report; Northern Territory Government & Horticulture Australia Limited: North Sydney, NSW, Australia, 2010; Available online: https://www.horticulture.com.au/information-hub/our-projects/historical-reports/mg05004 (accessed on 22 March 2023).
- Ometto, J.C. Bioclimatologia Vegetal [Plant Bioclimatology]; Agronômica Ceres: São Paulo, Brazil, 1981. [Google Scholar]
- Hofman, P.J. Development of Best Practice Pre- and Postharvest Protocols for Production of Calypso Mango: Phase II (Project No. MG06005); Horticulture Australia Ltd.: North Sydney, NSW, Australia, 2011; Available online: https://www.horticulture.com.au/information-hub/our-projects/historical-reports/mg06005 (accessed on 5 March 2025).
- Osuna-García, J.A. Validation of the Heat Unit’s Technique to Determine the Optimum Harvest Time on Main Exporting Mango Varieties; Instituto Nacional de Investigaciones Forestales, Agrícolas y Pecuarias & National Mango Board: Ciudad de México, Mexico, 2019; Available online: https://www.mango.org/wp-content/uploads/2020/02/Heat_Units_ENG.pdf (accessed on 2 February 2026).
- Ledger, S.; Barker, L.; Hofman, P.; Campbell, J.; Jones, V.; Holmes, R.; Campbell, T.; Weinert, M. Mango Ripening Manual; Queensland Government, Department of Agriculture, Fisheries and Forestry: Brisbane, QLD, Australia, 2012; Available online: https://www.industry.mangoes.net.au/cmsb/uploads/mango-ripening-manual_d4-final.pdf (accessed on 16 January 2026).
- Kienzle, S.; Sruamsiri, P.; Carle, R.; Sirisakulwat, S.; Spreer, W.; Neidhart, S. Harvest maturity specification for mango fruit (Mangifera indica L. ‘Chok Anan’) in regard to long supply chains. Postharvest Biol. Technol. 2011, 61, 41–55. [Google Scholar] [CrossRef] [Scilit]
- Lalel, H.J.D.; Singh, Z.; Tan, S.C. Distribution of aroma volatile compounds in different parts of mango fruit. J. Hortic. Sci. Biotechnol. 2003, 78, 131–138. [Google Scholar] [CrossRef] [Scilit]
- Medlicott, A.P.; Thompson, A.K. Analysis of sugars and organic acids in ripening mango fruits (Mangifera indica L. var. Keitt) by high performance liquid chromatography. J. Sci. Food Agric. 1985, 36, 561–566. [Google Scholar] [CrossRef] [Scilit]
- Wongkhot, A.; Rattanapanone, N.; Chanasut, U. BrimA, total acidity and total soluble solids correlate to total carotenoid content as indicators of the ripening process of six Thai mango fruit cultivars. Chiang Mai Univ. J. Nat. Sci. 2012, 11, 97–103. [Google Scholar]
- Khan, R.I.; Ali, S.; Maryam, A.; Rehman, R.N.U.; Abbas, M.; Hussain, R.; Hussain, K.; Razzaq, K.; Sabir, M.A.; Khalid, M.F.; et al. Mango maturity indices and harvesting methods. In Handbook of Research on Mango Fruit: Postharvest Science, Production, Nutrition, and Processing Technology; Hussain, S., Nahar, K., Rajwana, I.A., Ercisli, S., Ahmad, S., Eds.; Apple Academic Press: Williston, VT, USA, 2025; pp. 313–340. [Google Scholar] [CrossRef] [Scilit]
- Subedi, P.P.; Walsh, K.B.; Owens, G. Prediction of mango eating quality at harvest using short-wave near infrared spectrometry. Postharvest Biol. Technol. 2007, 43, 326–334. [Google Scholar] [CrossRef] [Scilit]
- Henriod, R. Industry moves on quality standards. Mango Matters 2015, 20, 10. Available online: https://era.dpi.qld.gov.au/id/eprint/6544/1/MG15002%20final%20report-543.pdf?utm_source (accessed on 23 February 2026).
- Australian Mango Industry Association. 2016 Mango Industry Quality Standards. 2016. Available online: https://www.horticulture.com.au/information-hub/our-projects/project-reports/mg15002 (accessed on 23 February 2026).
- Anderson, N.; Walsh, K.B.; Subedi, P.P.; Hayes, A.; McGlasson, W.B. Achieving robustness across season, location and cultivar for a NIRS model for intact mango fruit dry matter content. Postharvest Biol. Technol. 2020, 168, 111202. [Google Scholar] [CrossRef] [Scilit]
- De Freitas, S.T.; Guimarães, Í.T.; Vilvert, J.C.; do Amaral, M.H.P.; Brecht, J.K.; Marques, A.T.B. Mango dry matter content at harvest to achieve high consumer quality of different cultivars in different growing seasons. Postharvest Biol. Technol. 2022, 189, 111917. [Google Scholar] [CrossRef] [Scilit]
- Department of Primary Industries, Plant Biosecurity & Product Integrity. Pre-Harvest Treatment, Hard Mature Condition, and Inspection Standards of Mangoes; I Interstate Certification Assurance ICA-69, Version 1. 2025. Available online: https://interstatequarantine.org.au/wp-content/uploads/2025/09/ICA-69-V1-09-25-Pre-Harvest-Treatment-Hard-Mature-Condition-and-Inspection-Standards-of-Mangoes.pdf (accessed on 30 April 2026).
- Macnish, A.; Duong, H. Mango Quality Assessment Manual: A Guide to Assessing the Postharvest Quality of Australian Mangoes, 2nd ed.; Queensland Government, Department of Primary Industries: Cairns, QLD, Australia, 2025; Available online: https://www.industry.mangoes.net.au/cmsb/uploads/mango-quality-assessment-manual-web-lr.pdf (accessed on 21 February 2026).
- McGuire, R.G. Reporting of objective color measurements. HortScience 1992, 27, 1254–1255. [Google Scholar] [CrossRef] [Scilit]
- Ainsworth, N. Quality Standards, Refinement and Testing; Final Report, Project No. MG15002; Horticulture Innovation Australia Ltd.: Sydney, NSW, Australia, 2016. Available online: https://era.dpi.qld.gov.au/id/eprint/6544/1/MG15002%20final%20report-543.pdf (accessed on 25 October 2025).
- Australian Mango Industry Association. Australian Mango Retail Guide 2025. Australian Mangoes. 2025. Available online: https://www.industry.mangoes.net.au/cmsb/uploads/australian-mango-retail-guide-2025-v2.pdf (accessed on 23 February 2026).
- Wood, S.N. Generalized Additive Models: An Introduction with R, 2nd ed.; Chapman and Hall/CRC: Boca Raton, FL, USA, 2017. [Google Scholar] [CrossRef] [Scilit]
- Amaral, M.H.P. Benchmarking New Methods for Estimation of Quantity and Harvest Timing of the Mango Crop. Master’s Thesis, Central Queensland University, Norman Gardens, QLD, Australia, 2022. Available online: https://figshare.com/articles/thesis/Benchmarking_new_methods_for_estimation_of_quantity_and_harvest_timing_of_the_mango_crop/21708602 (accessed on 27 July 2026).
- Winston, E.C.; Hofman, P.; Macnish, A.; Marques, R.; Scurr, R. Improving Fruit Quality and Profitability of ‘Honey Gold’™ Mango; Tropical Horticultural Consulting Pty Ltd., Project Number MG10009; Horticulture Australia Ltd.: Sydney, Australia, 2014; Available online: https://www.horticulture.com.au/information-hub/our-projects/project-reports/mg10009 (accessed on 21 April 2023).
- Henriod, R.; Sole, D. Development of maturity standards for a new Australian mango cultivar, ‘NMBP-1243’. Acta Hortic. 2017, 1183, 17–22. [Google Scholar] [CrossRef] [Scilit]
- Lu, P.; Chacko, E.K.; Bithell, S.L.; Schaper, H.; Wiebel, J.; Cole, S.; Müller, W.J. Photosynthesis and stomatal conductance of five mango cultivars in the seasonally wet–dry tropics of northern Australia. Sci. Hortic. 2012, 138, 108–119. [Google Scholar] [CrossRef] [Scilit]
- Léchaudel, M.; Lopez-Lauri, F.; Vidal, V.; Sallanon, H.; Joas, J. Response of the physiological parameters of mango fruit (transpiration, water relations and antioxidant system) to its light and temperature environment. J. Plant Physiol. 2013, 170, 567–576. [Google Scholar] [CrossRef] [Scilit]
- Rodrigues, J.C.; Souza, P.J.O.; Lima, R.T. Estimation of basal temperatures and thermal requirement in mango production at the Northeast of Para State, Brazil. Rev. Bras. Frutic. 2013, 35, 143–150. [Google Scholar]
- Bally, I.S.E. Mango Genetic Improvement; Final Report, HRDC Project FR035; Queensland Department of Primary Industries: Brisbane, QLD, Australia, 1993. Available online: https://era.dpi.qld.gov.au/id/eprint/5098/ (accessed on 31 August 2026).
- Knight, R.J.; Campbell, R.J.; Maguire, I. Important Mango Cultivars and Their Descriptors. In The Mango, 2nd ed.; Litz, R.E., Ed.; CAB International: Wallingford, UK, 2009. [Google Scholar] [CrossRef] [Scilit]
- National Mango Board. Mango Maturity and Ripeness Guide. Orlando, FL, USA. 2019. Available online: https://www.mango.org/wp-content/uploads/2017/10/Mango_Maturity_And_Ripeness_Guide.pdf (accessed on 20 March 2026).
- Bally, I.S.E. Mangifera Indica (mango), ver. 3.1. In Species Profiles for Pacific Island Agroforestry; Elevitch, C.R., Ed.; Permanent Agriculture Resources (PAR): Holualoa, HI, USA, 2006; Available online: https://agroforestry.org/free-publications/traditional-tree-profiles (accessed on 23 February 2026).
- Dirou, J.F. Mango Growing, 4th ed.; Agfact H6.1.10; NSW Department of Primary Industries: Orange, NSW, Australia, 2004. Available online: https://www.dpi.nsw.gov.au/__data/assets/pdf_file/0006/119787/mango-growing.pdf (accessed on 31 August 2026).
- Kienzle, S.; Sruamsiri, P.; Carle, R.; Spreer, W.; Neidhart, S. Harvest maturity detection for ‘Nam Dokmai #4’ mango fruit (Mangifera indica L.) in consideration of long supply chains. Postharvest Biol. Technol. 2012, 72, 64–75. [Google Scholar] [CrossRef] [Scilit]

Disclaimer/Publisher’s Note: The statements, opinions and data contained in all publications are solely those of the individual author(s) and contributor(s) and not of MDPI and/or the editor(s). MDPI and/or the editor(s) disclaim responsibility for any injury to people or property resulting from any ideas, methods, instructions or products referred to in the content. |
© 2026 by the authors. Licensee MDPI, Basel, Switzerland. This article is an open access article distributed under the terms and conditions of the Creative Commons Attribution (CC BY) license.