


Highlights
What are the main findings?
- Aluminum promoted biomass accumulation and root elongation in Camellia japonica under low P.
- Aluminum enhanced antioxidant defense and reduced oxidative damage in leaves.
- Aluminum increased acid phosphatase activity and P concentrations in leaves and roots.
What are the implications of the main findings?
- In hydroponically grown C. japonica at pH 4.0 and 0.025 mmol·L−1 P, Al treatments of 0.25–1.00 mmol·L−1 alleviated low-P stress, with greater biomass and root elongation, lower oxidative-damage indicators, and improved P status.
Abstract
High aluminum (Al) availability and phosphorus (P) deficiency often coexist in acidic soils. Suitable Al concentrations promote growth in Camellia japonica, but its response to Al under P deficiency remains unclear. To examine this response under controlled Al and P supplies, two-year-old C. japonica ‘Shiliuhong’ plants were grown hydroponically at pH 4.0 for 8 weeks under two P levels (0.025 and 0.100 mmol·L−1) and four Al concentrations (0, 0.25, 0.50, and 1.00 mmol·L−1; n = 5 for each measurement). We measured growth, leaf physiological traits, and acid phosphatase (APase) activity. Total Al and P concentrations were determined in leaves and roots. At 1.00 mmol·L−1 Al, shoot and root dry weights increased by 151.6% and 210.4%, respectively, under low P and by 175.7% and 255.5%, respectively, under normal P, relative to the corresponding Al-free treatments. Longest root length increased from 1.78 to 10.32 cm under low P and from 3.02 to 13.58 cm under normal P. Al increased chlorophyll and soluble sugar contents, superoxide dismutase (SOD) and peroxidase (POD) activities, and ascorbate (AsA) and glutathione (GSH) contents, while lowering H2O2, , and thiobarbituric acid-reactive substances (TBARS). Under low P, 1.00 mmol·L−1 Al reduced these oxidative-damage indicators by 23.8–56.0%, while root APase activity and root total P concentration increased by 66.8% and 156.5%, respectively. In the tested hydroponic system, C. japonica plants supplied with Al under low P showed better growth, less oxidative damage, and improved P status.
1. Introduction
Aluminum (Al) mobilization and low phosphorus (P) availability often occur together in acidic soils. As soil pH decreases, Al-bearing minerals dissolve and release Al3+ into the soil solution. Al3+ can bind rapidly to cell-wall components at the root apex. This alters cell-wall properties, restricts cell expansion and root elongation, and can disturb membrane function, ion balance, and reactive oxygen species (ROS) metabolism [1,2,3,4]. Acidic conditions also promote phosphate adsorption and fixation by Fe and Al oxides and clay minerals, which reduces P availability [5,6,7]. Increased Al availability and reduced P availability can limit root development and nutrient acquisition in acidic soils.
P is a component of nucleic acids, phospholipids, ATP, and other phosphorylated compounds and is required for energy transfer, photosynthesis, membrane structure, and biosynthesis [8,9]. P deficiency affects energy metabolism, protein synthesis, and membrane lipid composition [9,10]. It also alters root architecture, although the response differs among plant species and genotypes. Primary-root growth may be restricted, while lateral-root and root-hair development may be promoted in some plants [11,12]. Low P induces several responses related to P acquisition, including changes in phosphate transport and acid phosphatase (APase) activity [13,14]. P deficiency can also impair photosynthesis and disturb cellular redox balance, accompanied by ROS accumulation and oxidative damage. Enzymatic and non-enzymatic antioxidants, including superoxide dismutase (SOD), peroxidase (POD), ascorbate (AsA), and glutathione (GSH), are involved in the response to P deficiency [15]. Within the genus Camellia, P responses have been studied mainly in tea (C. sinensis). A pot study showed that mycorrhizal inoculation promoted root growth and P acquisition and altered root morphology, soil phosphatase activity, and P transporter expression [16]. In another study, ten-month-old tea plants received nutrient solutions with different P concentrations for 17 weeks. Low P reduced biomass, CO2 assimilation, chlorophyll content, Rubisco activity, and photosynthetic electron transport [17]. Nutrient-solution treatments also altered organic acid release and metabolism in tea roots [18], as well as the ionome and metabolome [19]. More recently, tea plants were grown hydroponically for 30 days at 0 or 250 μmol·L−1 P. Roots continued to elongate without P, whereas 250 μmol·L−1 P restricted main-root growth, increased lateral-root density, and promoted lipid accumulation [20]. Research in C. japonica has focused more on P use in the rhizosphere. In greenhouse and field experiments, several soil P fractions decreased near C. japonica roots, and rhizosphere pH was 0.2–0.4 units lower than that of the bulk soil [21]. These results show that C. japonica roots can alter the distribution of P in the rhizosphere. Its growth, leaf physiology, APase activity, and P status under controlled low-P conditions remain poorly understood.
In many plants, excess Al3+ restricts root elongation, damages root-apical cells, disturbs mineral nutrition, and increases oxidative damage [4,22]. Plants adapted to acidic soils may avoid or tolerate Al injury through different strategies [23,24,25]. A recent global survey recorded Al-accumulating species in several plant families, including Melastomataceae, Rubiaceae, Symplocaceae, Pentaphylacaceae, Fabaceae, and Theaceae. Species were classified mainly according to leaf Al concentration, with 1 g·kg−1 dry weight (DW) used as the threshold, and the degree of Al accumulation varied considerably among taxa [26]. Tea (Camellia sinensis) is a well-known Al accumulator and is relatively tolerant of high Al availability. Within a suitable concentration range, Al promotes root and shoot growth in tea and affects photosynthesis, antioxidant defense, and mineral nutrition [27,28,29]. When Al is absent, new-root formation is restricted, whereas Al supply maintains root-meristem activity and root development [30]. A growth-promoting response has also been reported in C. japonica, where Al increased root biomass, root activity, chlorophyll content, and several mineral nutrient concentrations [31]. The size and direction of these responses depend on the Al concentration and nutritional conditions. In a recent hydroponic study of tea, low Al improved root vitality, while high Al inhibited it [32].
Al and P nutrition are closely linked in plants adapted to acidic soils. In tea, Al promotes growth and P uptake under low P and modifies P-use efficiency under normal P supply [33]. Al can immobilize phosphate through Al–P binding in the rhizosphere or root apoplast, but Al-induced changes in root growth, organic acid exudation, cell-wall properties, and APase activity may also influence P acquisition [34,35]. In Al-tolerant red amaranth, for example, Al increases APase activity and improves P status under P deficiency [36]. The direction and magnitude of Al–P interactions therefore depend on the plant species, Al concentration, and P supply. Most related studies have focused on model species and crops such as tea, whereas little is known about ornamental camellias. It remains unclear how C. japonica responds to Al under low P and whether this response changes with P supply.
To examine these questions while controlling Al and P supply, two-year-old C. japonica ‘Shiliuhong’ plants were grown hydroponically under two P levels and four Al concentrations. This study aimed to characterize the growth, redox, and P-related responses of C. japonica to Al under low and normal P. We hypothesized that Al would alleviate low-P-induced growth inhibition and that the growth response to Al would differ between the two P levels.
2. Materials and Methods
2.1. Plant Materials
A total of 100 two-year-old, cutting-propagated plants of Camellia japonica L. ‘Shiliuhong’ were obtained from the same production batch at a commercial nursery in Wenjiang District, Chengdu, China. Eighty plants with similar shoot height (approximately 30–40 cm), root-system size, and overall growth condition were selected for the experiment. Two-year-old plants were chosen because their size was suitable for the hydroponic system and allowed them to be transferred without extensive root pruning. The nursery substrate had a pH of 5.0 ± 0.2.
2.2. Experimental Design
The nursery substrate was removed by gently rinsing the roots with deionized water. No manual removal was required; no visible substrate particles remained, and no root damage was observed after rinsing. Each plant was transferred to an opaque plastic container (24 cm × 24 cm × 26 cm) containing 10 L of nutrient solution. A foam board was used to support the plant at the top of each container. All plants were maintained in the same controlled growth chamber at 25 °C during the day and 20 °C at night, with a 14 h light/10 h dark photoperiod and a relative humidity of 70%. The chamber was equipped with light-emitting diode (LED) lamps, and the photosynthetic photon flux density was set at 400 μmol·m−2·s−1. The containers were arranged randomly, and their positions were changed during the experiment to reduce positional effects. Before treatment, the plants were acclimated for 2 weeks in one-tenth-strength modified Hoagland nutrient solution (Table 1). The acclimation solution was maintained at pH 5.0 ± 0.2, close to that of the nursery substrate. This procedure followed the protocol used in our research group’s previous hydroponic study of two-year-old C. japonica [31] and allowed the plants to adjust to hydroponic culture before treatment.
Table 1.
Composition of the one-tenth-strength modified Hoagland nutrient solution.
Table 2.
Experimental design of P and Al treatments.
After acclimation, the plants were transferred to treatment solutions prepared using the nutrient formula shown in Table 1. The NaH2PO4 concentration was adjusted to 0.025 or 0.100 mmol·L−1, and AlCl3·6H2O was added at 0, 0.25, 0.50, or 1.00 mmol·L−1. All other nutrient concentrations were kept constant among treatments. The normal-P level of 0.100 mmol·L−1 was retained from our research group’s previous hydroponic study. The upper Al concentration was set at 1.00 mmol·L−1 because this concentration produced the strongest growth-promoting response in the same study [31]. The low-P level of 0.025 mmol·L−1 was selected through preliminary screening. Plants remained viable at this P level and showed a clear response to P deficiency. The experiment included eight P × Al treatment combinations (Table 2). The treatment solutions were maintained at pH 4.0 ± 0.2 to maintain Al availability under acidic conditions. Both acclimation and treatment solutions were continuously aerated and renewed every 3 d. The pH was measured at each renewal and adjusted with dilute HCl or NaOH when necessary. The treatment period lasted 8 weeks. For each treatment, the nutrient solution was prepared as a single batch and distributed among 10 separate containers, with one plant in each container. Each container served as an independent experimental unit.
2.3. Sample Collection and Growth Measurements
After 8 weeks of treatment, the plants were photographed before harvest. The roots were rinsed with deionized water and immersed in 20 mmol·L−1 Na2EDTA for 20 min to remove residual treatment solution and loosely adsorbed Al from the root surface [37,38]. They were then rinsed several times with deionized water and gently blotted dry with absorbent paper. Five plants from each treatment were used for growth and elemental measurements. The longest root of each plant was measured from the root base to the tip using a ruler. The plants were separated into shoots and roots, heated at 105 °C for 30 min to stop enzymatic activity, and then dried at 80 °C to a constant weight. Shoot and root dry weights were measured using an analytical balance (BCE224I-1CCN, Sartorius Scientific Instruments (Beijing) Co., Ltd., Beijing, China; readability, 0.1 mg). Dried leaf and root samples were ground, passed through a 100-mesh sieve, and used for elemental analysis. From the other five plants, fresh leaf samples were collected for physiological and biochemical analyses, and fresh leaf and root samples were collected for APase assays. The fresh samples were immediately frozen in liquid nitrogen and stored at −80 °C until analysis.
2.4. Chlorophyll Content
Chlorophyll content was determined using the 80% acetone method [39]. Fresh leaf samples (0.2 g) were cut into small pieces and immersed in 10 mL of 80% acetone. The samples were kept at 4 °C in darkness for 48 h and gently shaken three to four times during extraction. After the leaf tissue was completely decolorized, the extract was mixed thoroughly. Absorbance was measured at 663 and 645 nm using a visible spectrophotometer (PV3, Shanghai Mapada Instruments Co., Ltd., Shanghai, China) and a quartz cuvette with a 1 cm optical path length. The same instrument was used for all subsequent absorbance measurements. Chlorophyll contents were calculated as follows:
where A663 and A645 are the absorbance values at 663 and 645 nm, respectively; V is the final volume of the extract (10 mL); and W is the fresh mass of the leaf sample (g). Chlorophyll contents were expressed as mg·g−1 fresh weight (FW).
2.5. Soluble Sugar and Soluble Protein Contents
Soluble sugar content was determined using the anthrone–sulfuric acid method [40]. Fresh leaf samples (0.2 g) were homogenized in 5 mL of 100 mmol·L−1 phosphate buffer (pH 7.8) at 4 °C. The homogenate was centrifuged at 15,800× g for 15 min. An aliquot of the supernatant (200 μL) was mixed with 1 mL of freshly prepared anthrone–sulfuric acid reagent containing 0.2% (w/v) anthrone in concentrated sulfuric acid. The mixture was heated at 100 °C for 10 min and then cooled to room temperature. Absorbance was measured at 625 nm. A glucose standard curve was prepared by treating a series of glucose standards in the same manner as the samples. Soluble sugar content was calculated from the standard curve and expressed as μmol·g−1 FW.
Soluble protein content was determined using the Coomassie Brilliant Blue G-250 method [41]. Fresh leaf samples (0.2 g) were homogenized with 2 mL of distilled water. The mortar was rinsed with 6 mL of distilled water, and the homogenate and rinses were combined and centrifuged at 1700× g for 10 min. The supernatant was collected and adjusted to 10 mL with distilled water. An aliquot of the extract (0.5 mL) was mixed with 2.5 mL of Coomassie Brilliant Blue G-250 reagent. The mixture was kept at room temperature for 15 min, and absorbance was measured at 595 nm. A bovine serum albumin standard curve was prepared using the same color-development procedure. Soluble protein content was calculated from the standard curve and expressed as mg·g−1 FW.
2.6. Oxidative Damage Indicators
Thiobarbituric acid-reactive substances (TBARS) were determined using the thiobarbituric acid method [42]. Fresh leaf samples (0.3 g) were homogenized with 2 mL of 10% trichloroacetic acid (TCA) and a small amount of quartz sand. The mortar was rinsed two to three times with 10% TCA. The extract was adjusted to 8 mL with 10% TCA and centrifuged at 1700× g for 10 min. An aliquot of the supernatant (2 mL) was mixed with 2 mL of 0.6% thiobarbituric acid. The mixture was heated in a boiling-water bath for 10 min and then cooled to room temperature. Absorbance was measured at 450, 532, and 600 nm. TBARS content was calculated and expressed as μmol·g−1 FW.
H2O2 content was determined using the titanium reagent method [43]. Fresh leaf samples (0.3 g) were homogenized with 5 mL of acetone prechilled to 4 °C. The homogenate was centrifuged at 2700× g for 10 min. One milliliter of the supernatant was mixed with 0.1 mL of 20% titanium tetrachloride (TiCl4) solution and 0.2 mL of concentrated ammonia solution. After a precipitate formed, the mixture was centrifuged at 2700× g for 15 min. The supernatant was discarded. The precipitate was washed two to three times with acetone and dissolved in 5 mL of 1 mol·L−1 H2SO4. Absorbance was measured at 410 nm. H2O2 content was calculated from an H2O2 standard curve and expressed as μmol·g−1 FW.
content was determined using the hydroxylamine oxidation–nitrite method [44]. Fresh leaf samples (0.3 g) were homogenized in 6 mL of prechilled 65 mmol·L−1 phosphate buffer (pH 7.8). The homogenate was centrifuged at 7000× g for 10 min. One milliliter of the supernatant was mixed with 1 mL of 65 mmol·L−1 phosphate buffer (pH 7.8) and 0.1 mL of 10 mmol·L−1 hydroxylamine hydrochloride and incubated at 25 °C for 20 min. Then, 1 mL of 17 mmol·L−1 sulfanilic acid and 1 mL of 7 mmol·L−1 α-naphthylamine were added. The mixture was incubated at 25 °C for another 20 min and extracted with an equal volume of n-butanol. Absorbance was measured at 530 nm. content was calculated from nitrite formation using a sodium nitrite standard curve and expressed as μg·g−1 FW.
2.7. Antioxidant Components and Enzyme Activities
Reduced AsA content was determined using the bathophenanthroline method described by Kampfenkel et al. [45]. Fresh leaf samples (0.2 g) were homogenized in 5 mL of 50 g·L−1 TCA. The homogenate was transferred to a centrifuge tube and adjusted to 8 mL with the same solution. It was then centrifuged at 1700× g for 15 min. After this, 1 mL of the supernatant was mixed with 1 mL of 50 g·L−1 TCA, 1 mL of anhydrous ethanol, 0.5 mL of 0.4% phosphoric acid in ethanol, 1 mL of 5 g·L−1 bathophenanthroline in ethanol, and 0.5 mL of 0.3 g·L−1 FeCl3 in ethanol. The mixture was incubated at 30 °C for 60 min. Absorbance was measured at 530 nm. Reduced AsA content was calculated from an ascorbic acid standard curve and expressed as mg (100 g FW)−1.
Reduced GSH content was determined using 5,5′-dithiobis (2-nitrobenzoic acid), abbreviated as DTNB [46]. Fresh leaf samples (0.3 g) were homogenized in 5 mL of prechilled 50 g·L−1 TCA containing 5 mmol·L−1 Na2EDTA. The homogenate was centrifuged at 15,800× g for 15 min at 4 °C, and the supernatant was collected. The reference solution contained 1 mL of distilled water, 1 mL of 0.1 mol·L−1 phosphate buffer (pH 7.0), and 0.5 mL of 4 mmol·L−1 DTNB. For the color reaction, 1 mL of the supernatant was mixed with 1 mL of 0.1 mol·L−1 phosphate buffer (pH 7.0) and 0.5 mL of 4 mmol·L−1 DTNB. The sample blank contained the same amounts of supernatant and phosphate buffer, but DTNB was replaced with 0.5 mL of 0.1 mol·L−1 phosphate buffer (pH 6.8). The mixtures were incubated at 25 °C for 10 min. Absorbance was measured at 412 nm. Reduced GSH content was calculated after blank correction using a GSH standard curve and expressed as μmol·g−1 FW.
For enzyme extraction, fresh leaf samples (0.3 g) were homogenized with 2 mL of 50 mmol·L−1 phosphate buffer (pH 7.8) under chilled conditions. The mortar was rinsed with the same buffer, and the combined extract was adjusted to 8 mL. The homogenate was centrifuged at 11,000× g for 20 min at 4 °C. The supernatant was collected as the crude enzyme extract. SOD activity was determined using the nitroblue tetrazolium (NBT) photoreduction method [47]. The reaction mixture contained 1.5 mL of 50 mmol·L−1 phosphate buffer (pH 7.8), 0.3 mL of 130 mmol·L−1 methionine, 0.3 mL of 750 μmol·L−1 NBT, 0.3 mL of 100 μmol·L−1 Na2EDTA, 0.3 mL of 20 μmol·L−1 riboflavin, and 0.3 mL of enzyme extract. Two control tubes contained phosphate buffer instead of enzyme extract. One control tube was kept in darkness and used as the blank. The other control tube and all sample tubes were exposed to light at 4000 lx for 30 min. Absorbance was measured at 560 nm. One unit of SOD activity was defined as the amount of enzyme required to inhibit NBT photoreduction by 50% under the assay conditions. SOD activity was calculated on a leaf fresh-mass basis and expressed as U·g−1 FW.
POD activity was determined using a modified guaiacol method based on Chance and Maehly [48]. The reaction solution was prepared by adding 2.8 mL of guaiacol and 1.9 mL of 30% H2O2 to 500 mL of 10 mmol·L−1 phosphate buffer (pH 6.0). The solution was mixed thoroughly and stored at 4 °C in darkness. The reaction was started by adding 0.2 mL of enzyme extract to 2.8 mL of the reaction solution. The blank contained phosphate buffer instead of enzyme extract. Absorbance at 470 nm was recorded every 10 s for 2 min, and the linear change in absorbance per minute was used for calculation. One unit of POD activity was defined as an increase of 0.01 in absorbance at 470 nm per minute under the assay conditions. POD activity was calculated on a leaf fresh-mass basis and expressed as U·g−1 FW.
2.8. Acid Phosphatase Activity
Total soluble APase activity in leaf and root extracts was determined using a modified p-nitrophenyl phosphate (p-NPP) assay [49]. Fresh leaf and root samples (0.2 g) were separately homogenized on ice with 5 mL of 0.2 mol·L−1 acetate buffer (pH 5.8). The homogenates were kept at 4 °C for 1 h and centrifuged at 3900× g for 30 min at 4 °C. The supernatants were collected as crude enzyme extracts. An aliquot of each extract (0.2 mL) was mixed with 5 mL of 5 mmol·L−1 p-NPP prepared in 0.2 mol·L−1 acetate buffer (pH 5.8). The mixture was incubated at 37 °C for 30 min, and the reaction was stopped by adding 1 mL of 1 mol·L−1 NaOH. Absorbance was measured at 405 nm. The amount of p-nitrophenol (pNP) released was determined using a pNP calibration curve ranging from 0 to 1.50 μmol per reaction, prepared under the same assay conditions. APase activity was calculated as follows:
where n is the amount of pNP released per reaction (μmol), V1 is the total volume of the crude enzyme extract (5.0 mL), V2 is the volume of enzyme extract used in the reaction (0.2 mL), m is the fresh mass of the sample (0.2 g), and t is the reaction time (0.5 h). APase activity was expressed as μmol pNP·g−1 FW·h−1.
2.9. Aluminum and Phosphorus Concentrations
Oven-dried leaf and root samples were ground and passed through a 100-mesh sieve. Each sample (0.2 g) was soaked overnight in the corresponding acid mixture. Leaf samples were digested with 5 mL of 65% HNO3 and 1 mL of 70% HClO4. Root samples were digested with 5 mL of 65% HNO3, 1 mL of 38% HCl, and 1 mL of 40% HF to ensure complete digestion. The samples were digested at 180 °C on a temperature-controlled hot plate until the solutions became clear. After cooling, the digests were filtered and diluted to 50 mL with ultrapure water. Total Al and P concentrations were determined using an inductively coupled plasma optical emission spectrometer (EXPEC 6510D, EXPEC Technology, Hangzhou, China) [50] and expressed as mg·g−1 DW.
2.10. Statistical Analysis
Data were analyzed using two-way analysis of variance (ANOVA), with P level and Al concentration as fixed factors. The model residuals were checked for normality and homogeneity of variance before analysis. The main effects of P level and Al concentration and their interaction (P × Al) were evaluated for each response variable. Tukey’s multiple-comparisons test was used to compare the eight P × Al treatment combinations. All observations were retained in the analysis, and differences were considered significant at p < 0.05. The p-values for the main and interaction effects are reported in Table 3; values below 0.001 are presented as p < 0.001. Statistical analyses were performed using GraphPad Prism version 10.6 (GraphPad Software, Boston, MA, USA). Data are presented as means ± standard errors (SE) of five independent biological replicates for each measurement.
Table 3.
Effects of phosphorus level, aluminum concentration, and their interaction on the measured variables of Camellia japonica.
3. Results
3.1. Effects of Aluminum on the Growth of Camellia japonica Under Two Phosphorus Levels
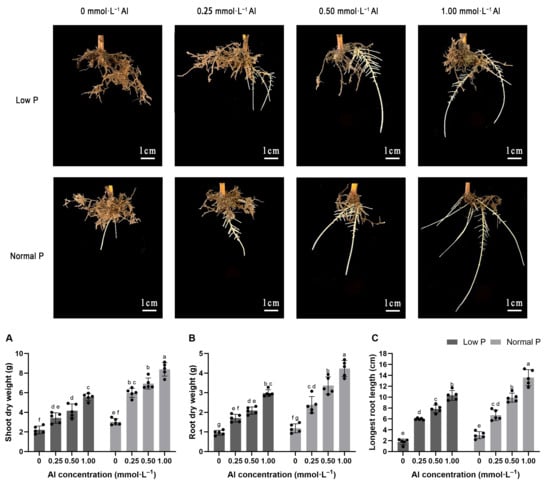
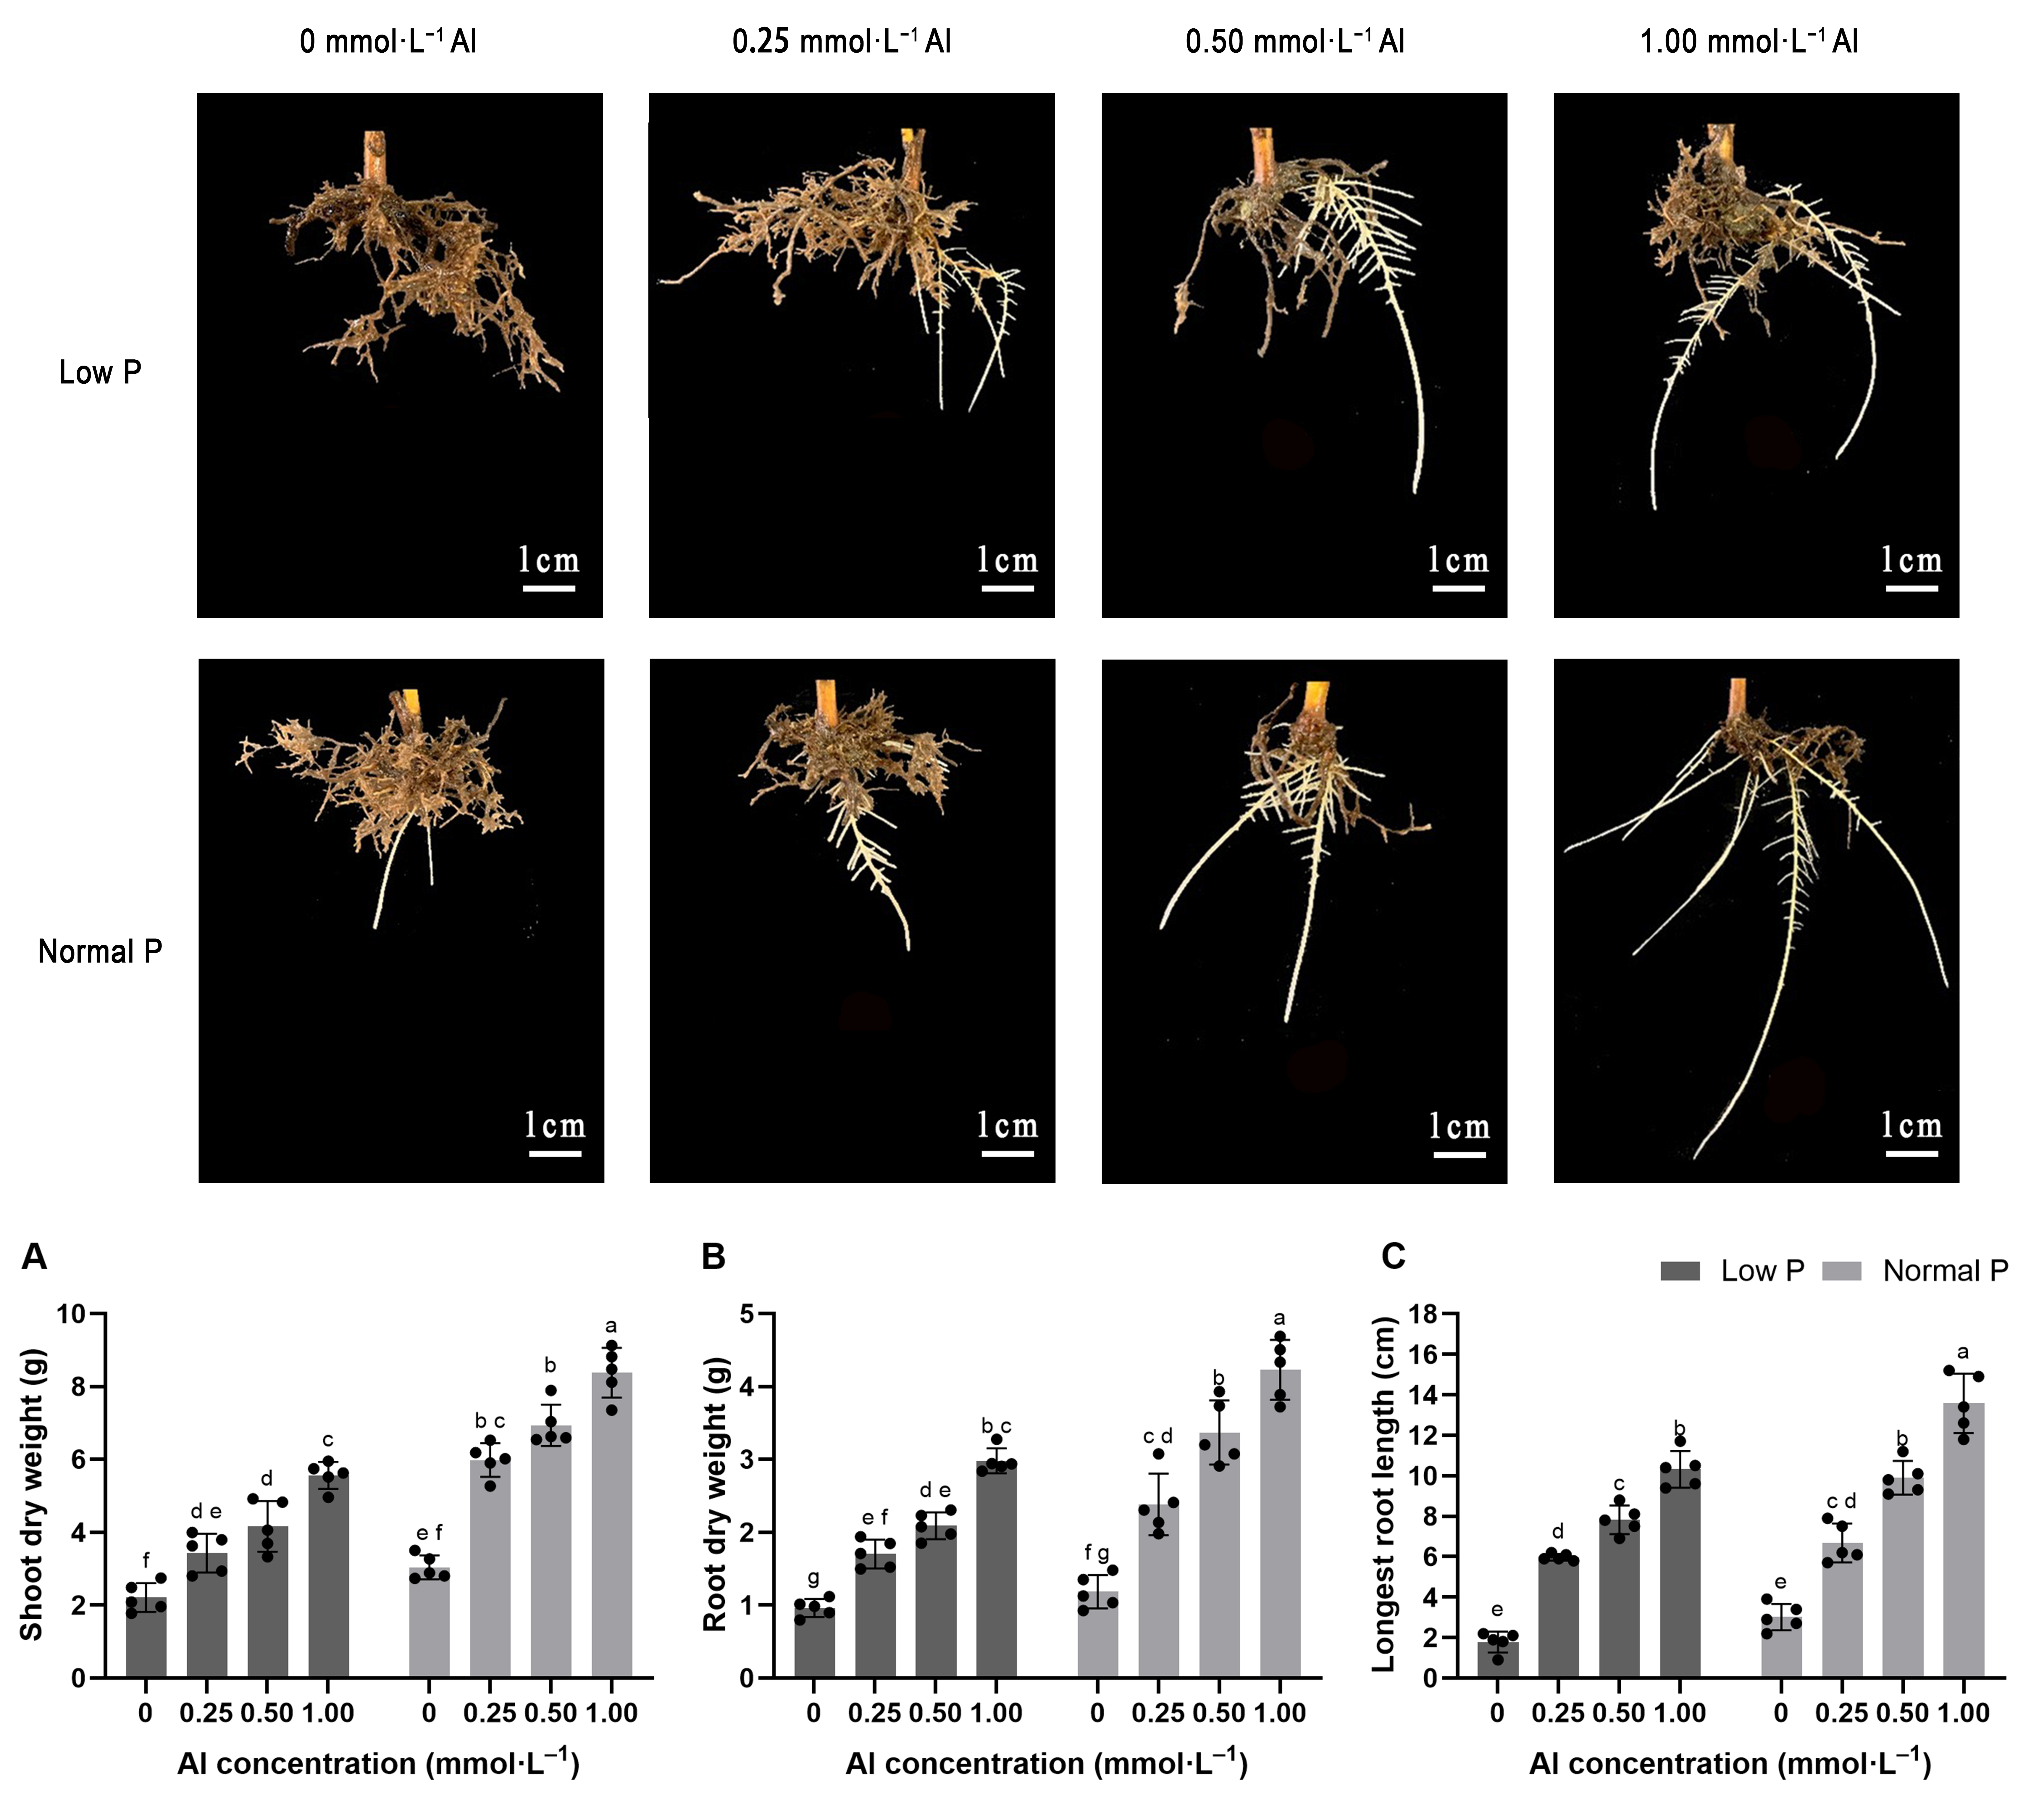
Al increased shoot dry weight, root dry weight, and longest root length at both P levels (Figure 1). Root photographs showed that young white roots became more evident after Al addition. Under low P, shoot and root dry weights reached 5.56 and 2.98 g at 1.00 mmol·L−1 Al, representing increases of 151.58% and 210.42%, respectively, relative to the Al-free treatment. Longest root length increased from 1.78 to 10.32 cm, corresponding to an increase of 479.78%. Under normal P, shoot and root dry weights reached 8.38 and 4.23 g, representing increases of 175.66% and 255.46%, respectively. Longest root length increased from 3.02 to 13.58 cm, an increase of 349.67%. In the absence of Al, the mean values of all three traits were lower under low P than under normal P, although the differences were not significant (p > 0.05). Root length showed a larger relative response to Al under low P, while shoot and root dry weights showed larger relative responses under normal P.
Figure 1.
Effects of phosphorus (P) and aluminum (Al) treatments on the growth traits and root appearance of Camellia japonica. Photographs were taken after 8 weeks of treatment. Each photograph includes an individual 1 cm scale bar and shows a representative plant from the corresponding treatment. The photographs show representative plants from each treatment. (A) Shoot dry weight; (B) root dry weight; (C) longest root length. Values are means ± SE (n = 5). Dots represent individual biological replicates. Different letters indicate significant differences among treatments according to Tukey’s multiple-comparisons test (p < 0.05).
3.2. Effects of Aluminum on Leaf Pigments and Soluble Compounds Under Two Phosphorus Levels
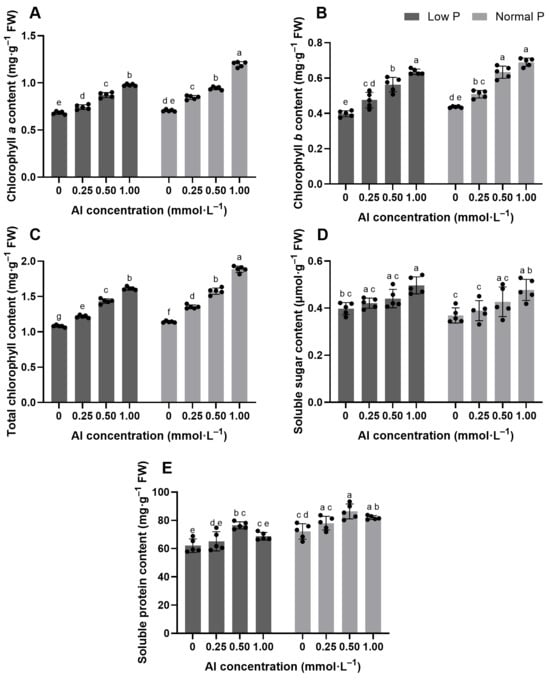
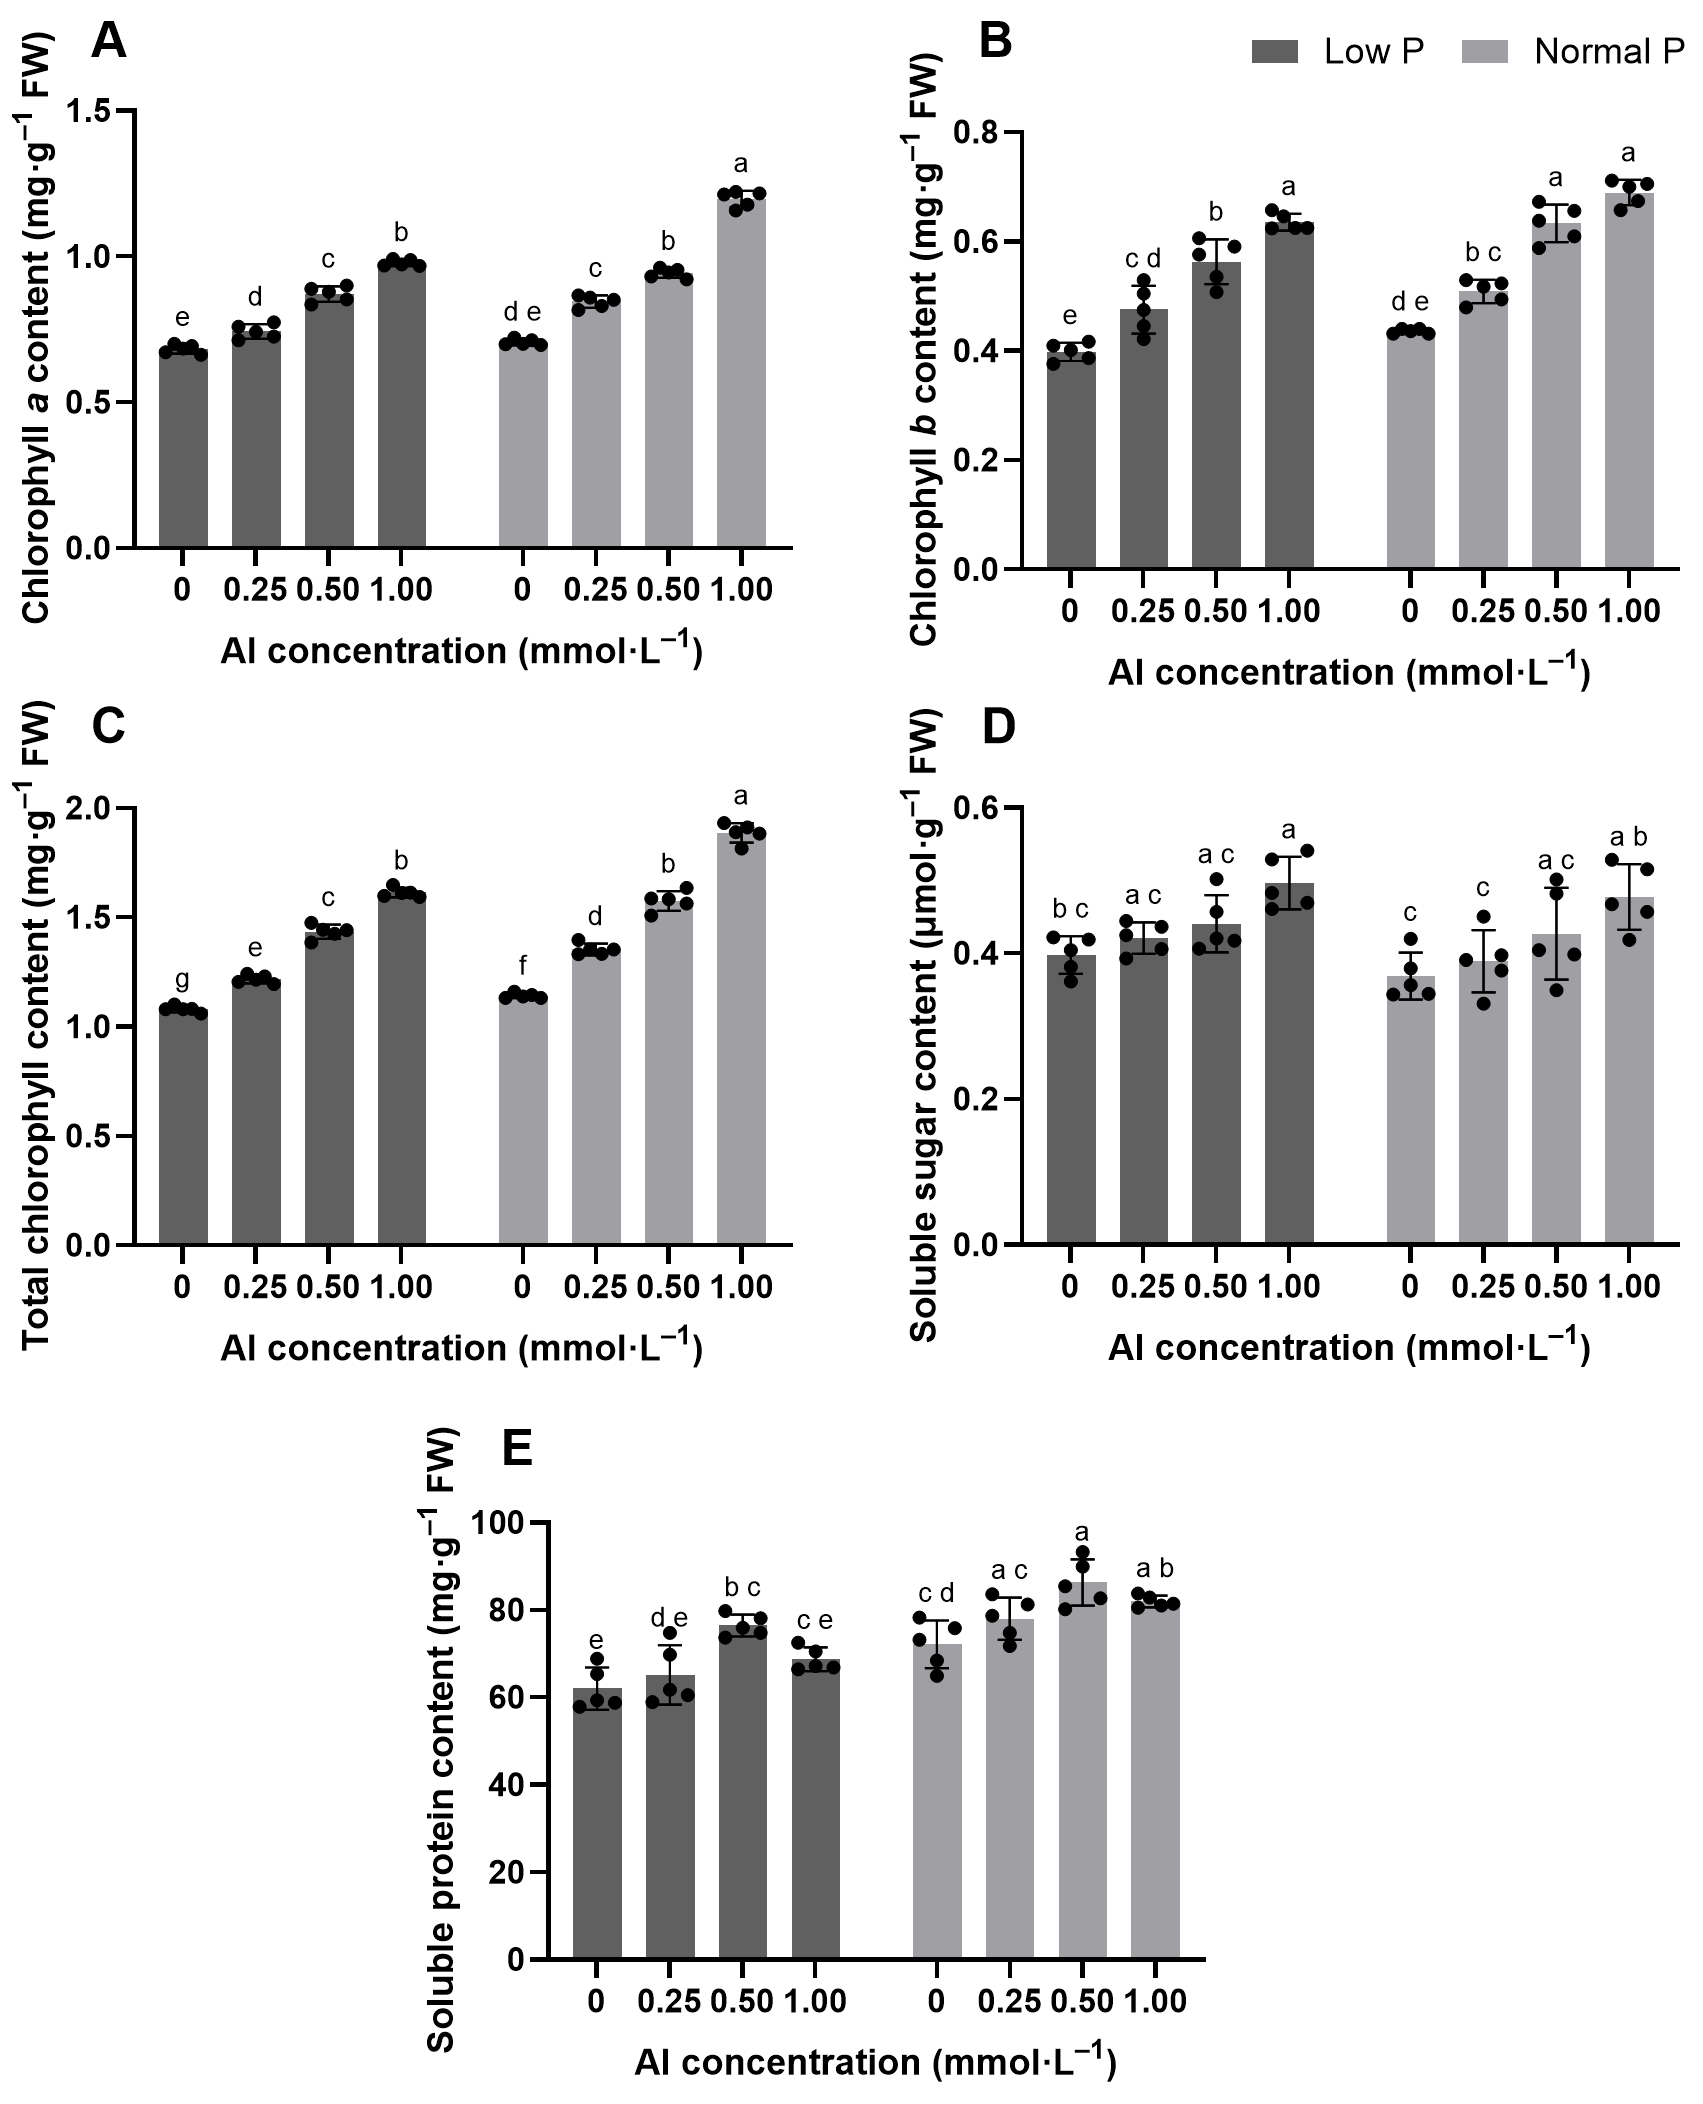
Leaf chlorophyll content increased with Al supply at both P levels (Figure 2A–C). Under low P, 1.00 mmol·L−1 Al increased chlorophyll a by 44.12%, chlorophyll b by 60.00%, and total chlorophyll by 49.07% compared with the Al-free treatment. Under normal P, the increases were 69.01%, 56.82%, and 65.79%. The highest chlorophyll values were recorded at 1.00 mmol·L−1 Al under both P levels. Soluble sugar also increased with Al supply (Figure 2D). Under low P, its content was 24.87% higher at 1.00 mmol·L−1 Al than in the Al-free treatment. A similar increase was found under normal P. Soluble protein showed a different pattern. Under low P, it increased by 23.24% at 0.50 mmol·L−1 Al and then decreased slightly at 1.00 mmol·L−1 Al (Figure 2E). Under normal P, soluble protein also reached its highest level at 0.50 mmol·L−1 Al and then decreased slightly at 1.00 mmol·L−1 Al.
Figure 2.
Effects of phosphorus and aluminum treatments on chlorophyll and soluble metabolites in Camellia japonica. (A) Chlorophyll a; (B) chlorophyll b; (C) total chlorophyll; (D) soluble sugar; (E) soluble protein. Values are means ± SE (n = 5). Dots represent individual biological replicates. Different letters indicate significant differences among treatments according to Tukey’s multiple-comparisons test (p < 0.05).
3.3. Effects of Aluminum on Oxidative-Damage Indicators and Antioxidant Responses Under Two Phosphorus Levels
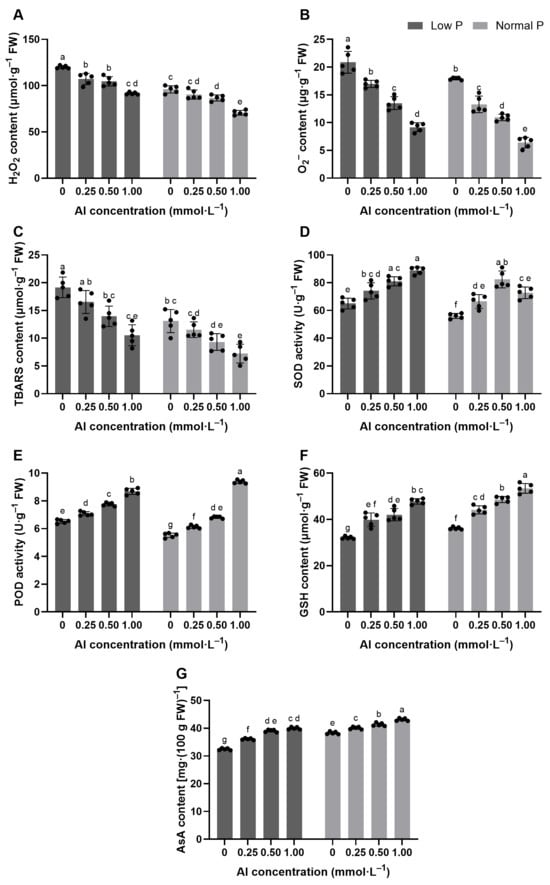
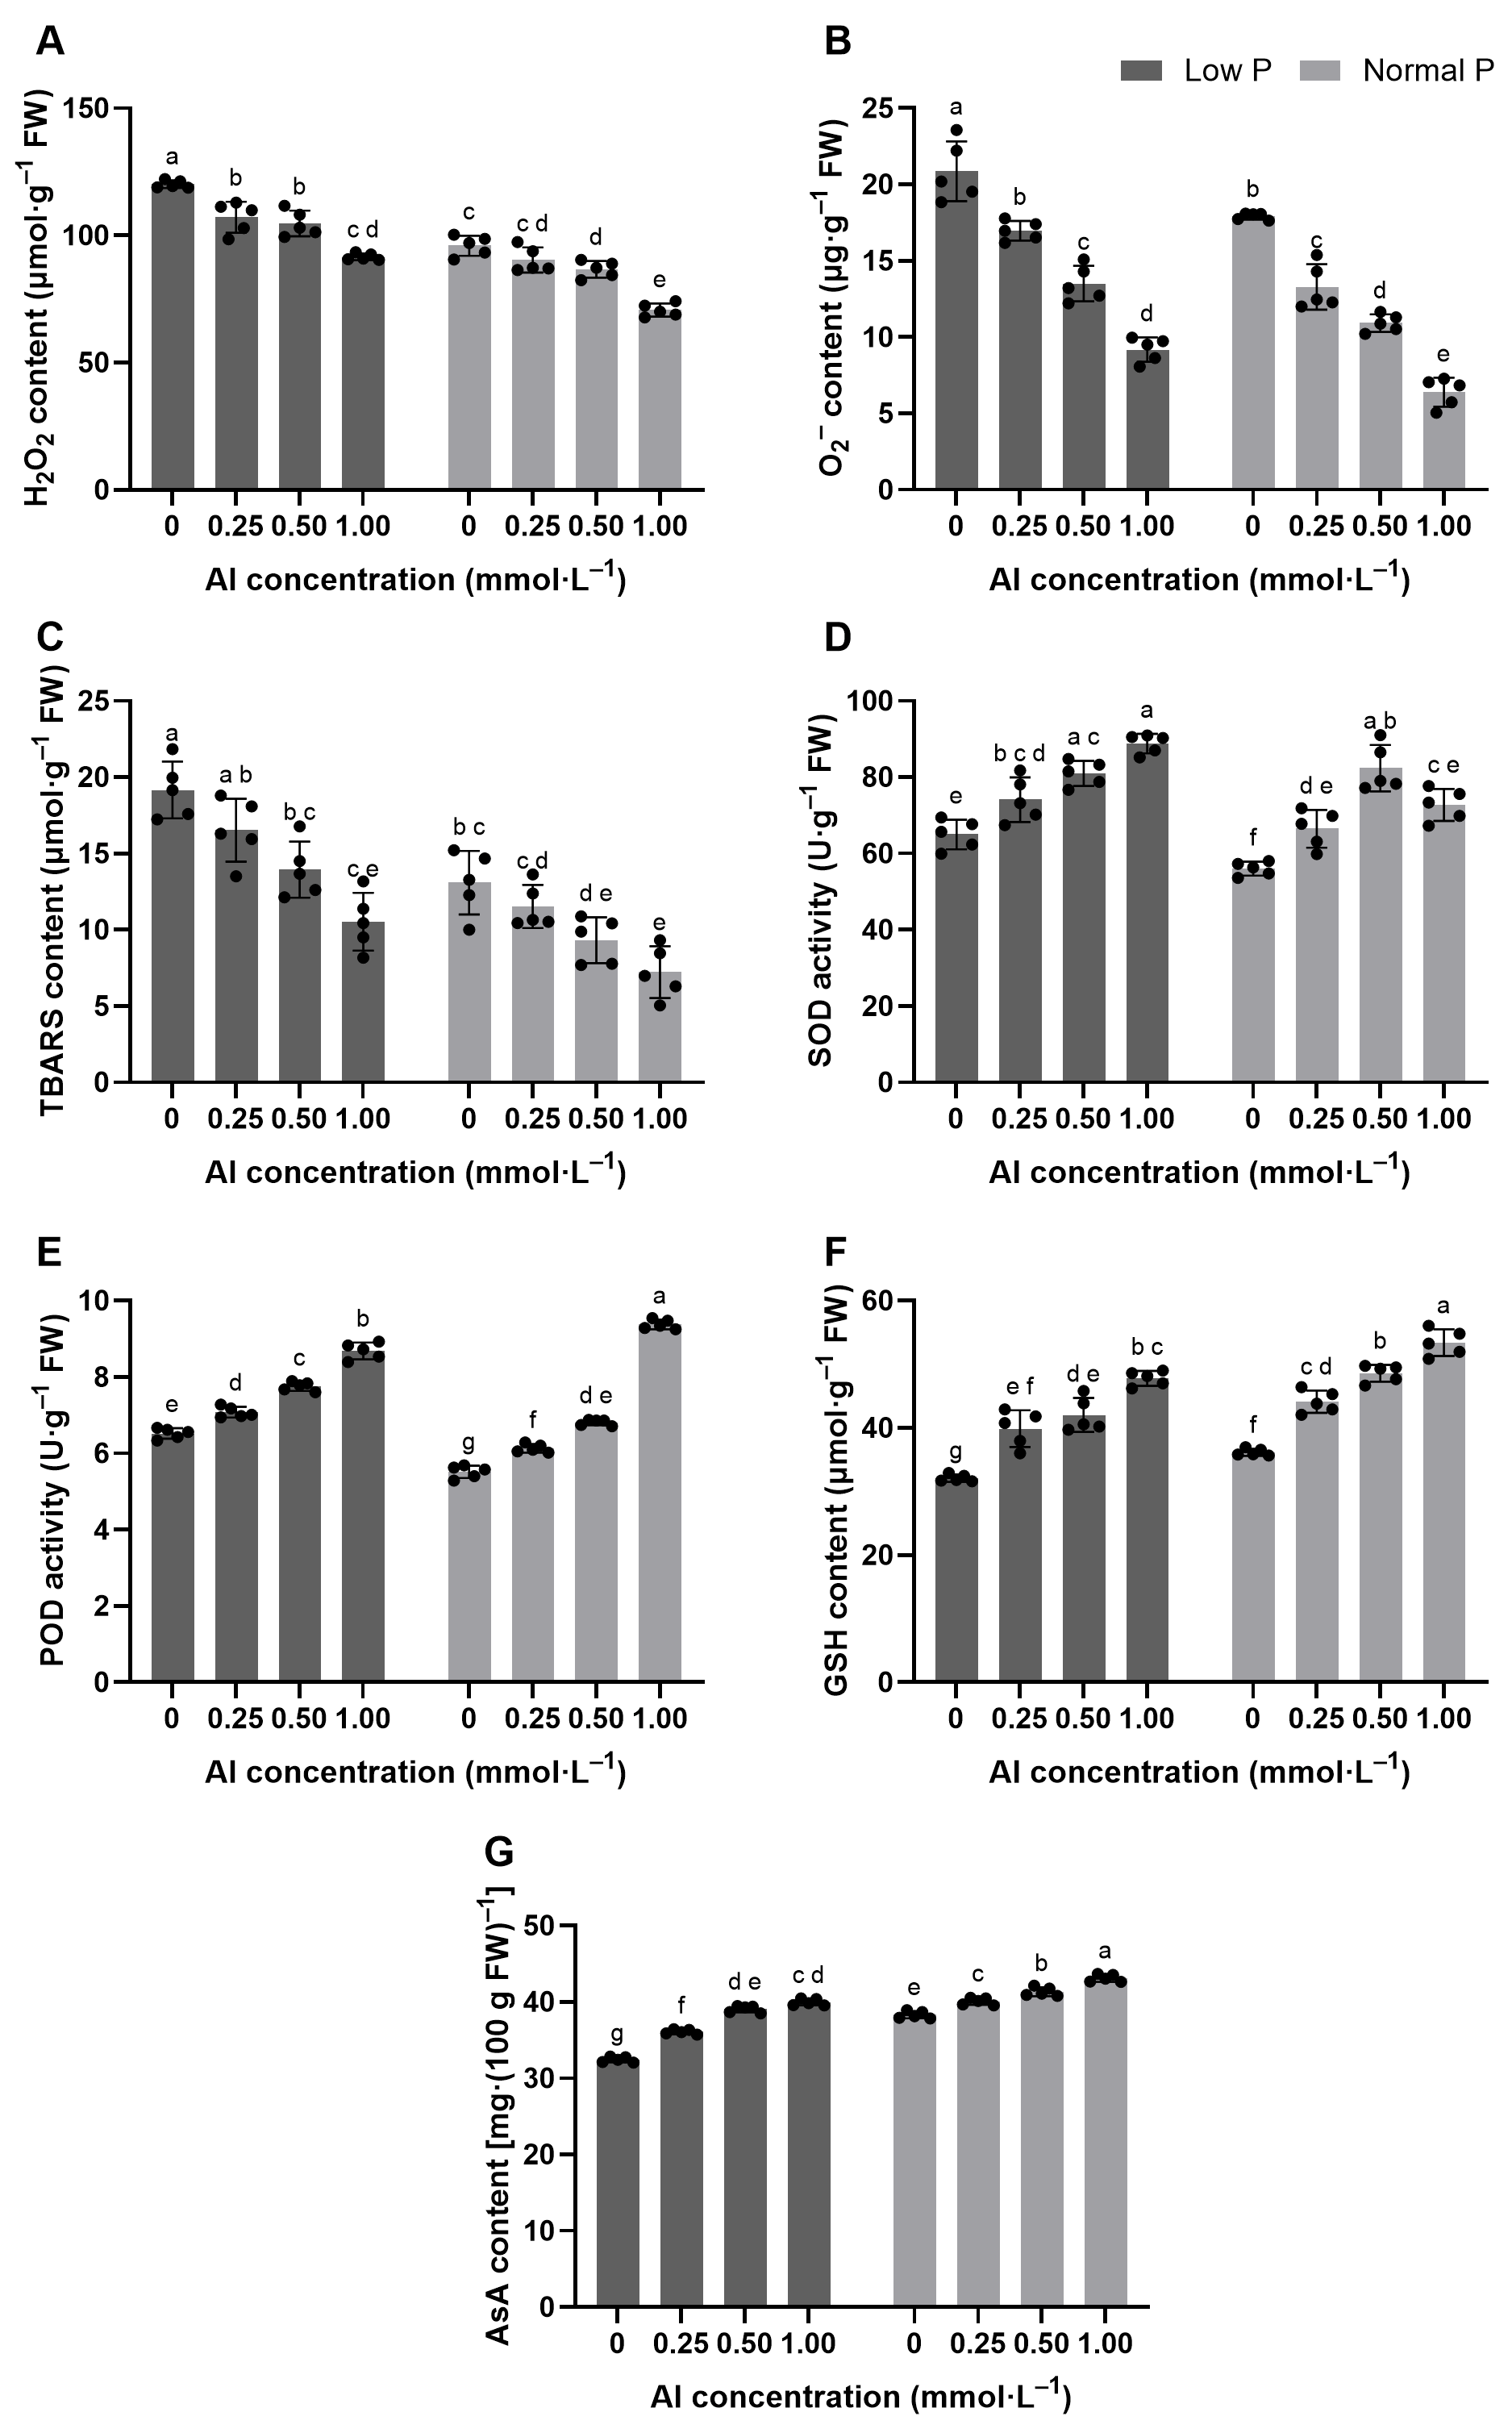
H2O2, , and TBARS decreased with increasing Al concentration under low P (Figure 3A–C). At 1.00 mmol·L−1 Al, H2O2 was 23.75% lower than in the Al-free treatment, while and TBARS decreased by 55.97% and 45.04%, respectively. These three indicators also decreased with Al addition under normal P. SOD and POD activities and GSH and AsA contents increased in response to Al treatment (Figure 3D–G). Under low P, 1.00 mmol·L−1 Al increased SOD and POD activities by 36.58% and 33.14%, respectively, while GSH and AsA contents increased by 48.89% and 23.13%. Similar responses were observed under normal P, although SOD activity reached its highest value at 0.50 mmol·L−1 Al. At both P levels, lower H2O2, , and TBARS values occurred together with higher antioxidant enzyme activities and antioxidant contents.
Figure 3.
Effects of phosphorus and aluminum treatments on oxidative-damage indicators and antioxidant responses in Camellia japonica. (A) H2O2 content; (B) content; (C) TBARS content; (D) SOD activity; (E) POD activity; (F) GSH content; (G) AsA content. Values are means ± SE (n = 5). Dots represent individual biological replicates. Different letters indicate significant differences among treatments according to Tukey’s multiple-comparisons test (p < 0.05).
3.4. Effects of Aluminum on Leaf and Root APase Activities Under Two Phosphorus Levels
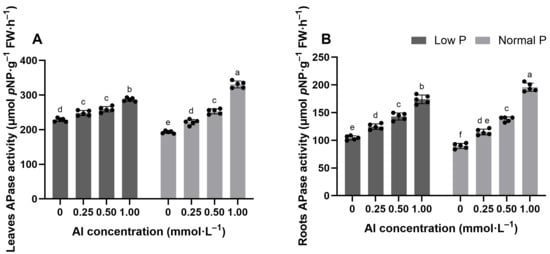
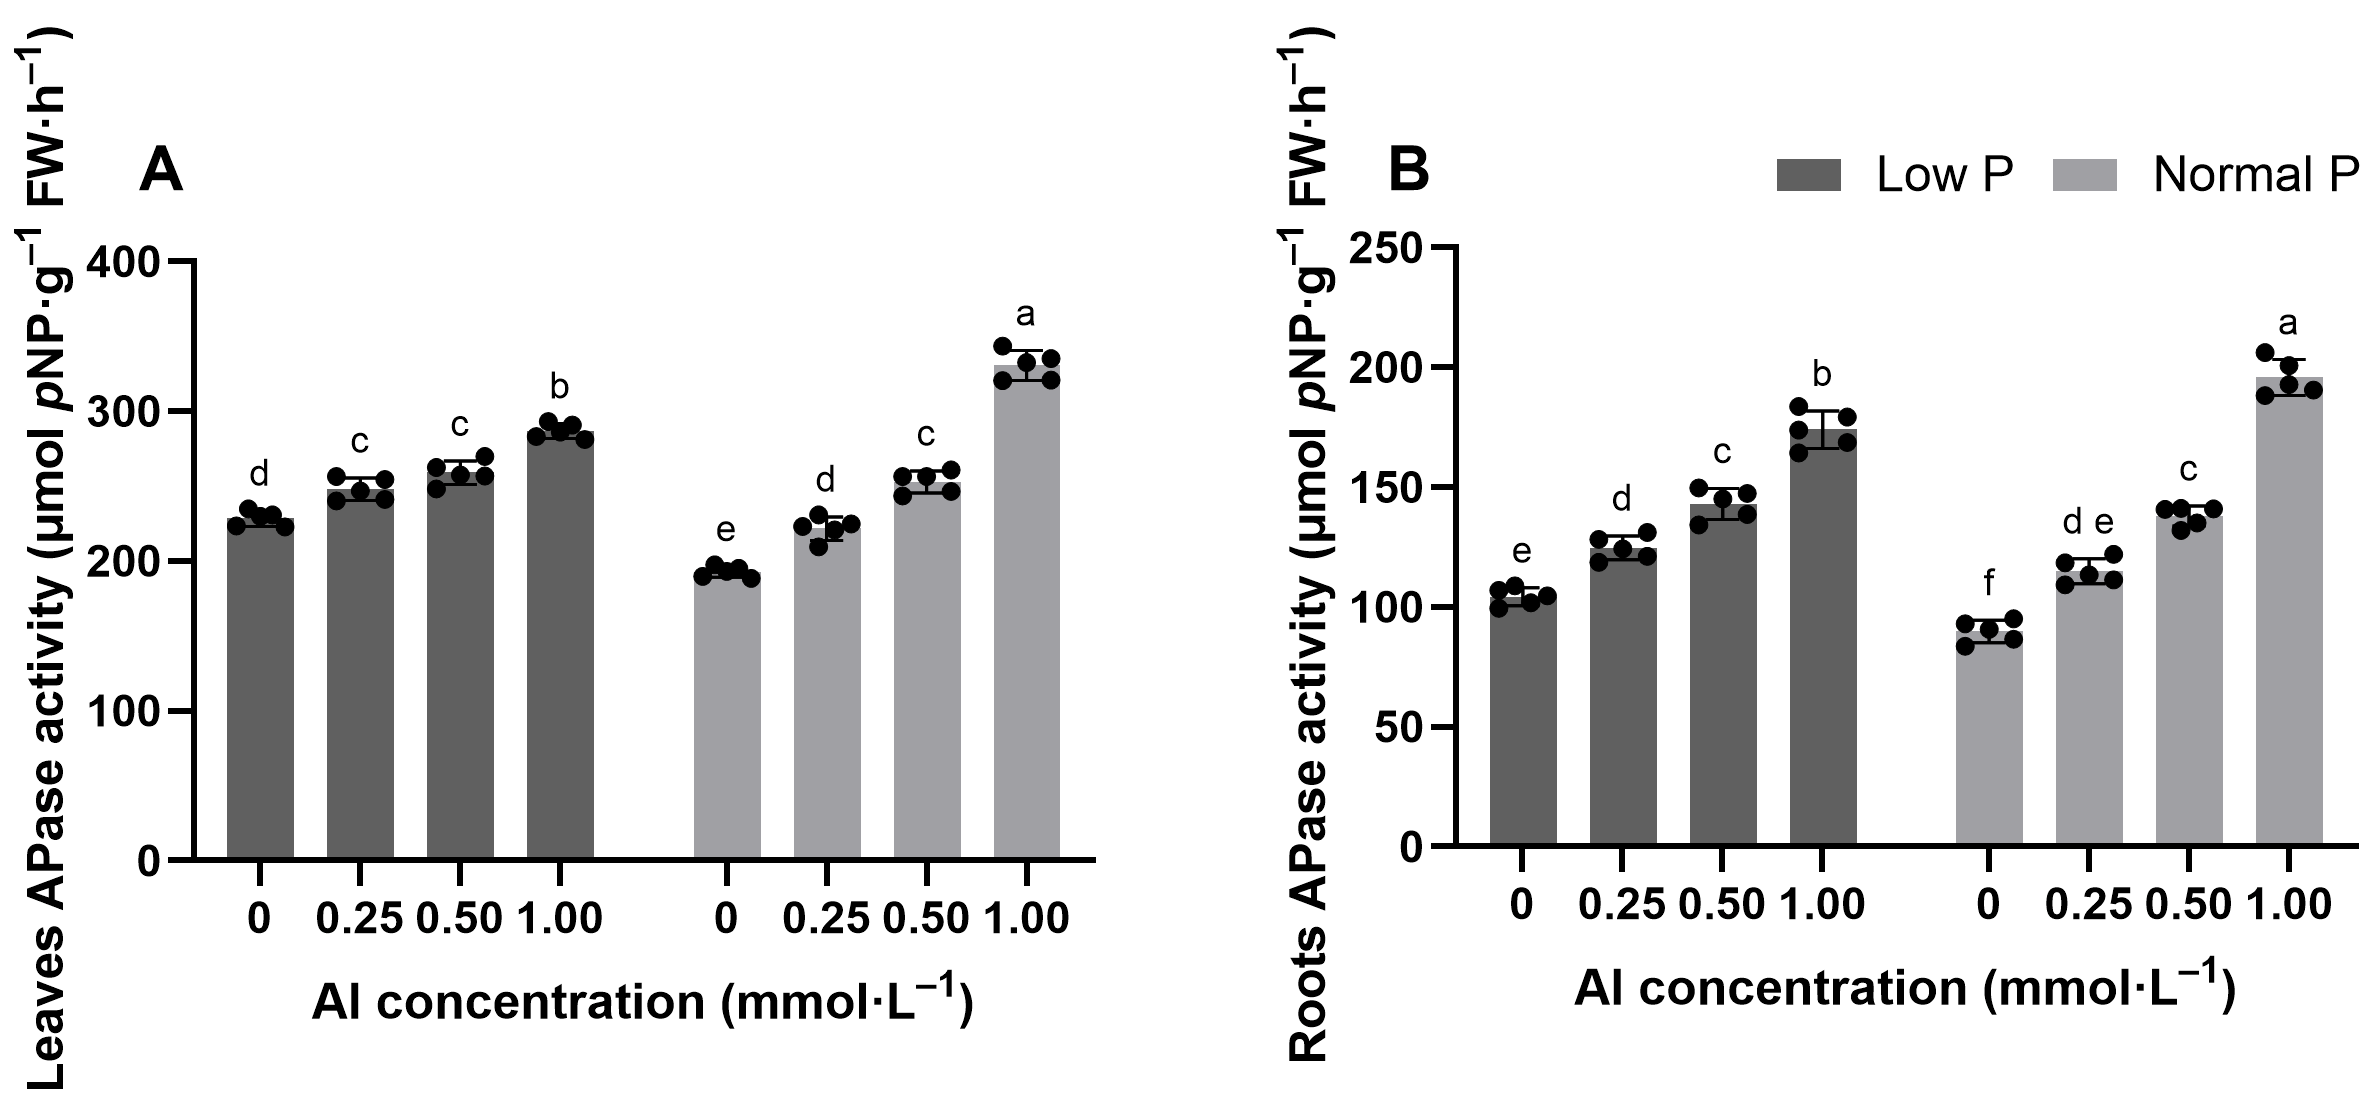
APase activity increased following Al addition in both leaves and roots at the two P levels (Figure 4). Under low P, 1.00 mmol·L−1 Al increased leaf and root APase activities by 25.59% and 66.78%, respectively, compared with the Al-free treatment. Under normal P, leaf and root APase activities reached 330.55 and 195.66 μmol pNP·g−1 FW·h−1, respectively, at 1.00 mmol·L−1 Al, corresponding to increases of 71.38% and 117.88%. Comparisons between the two P levels varied with Al concentration. At 0 and 0.25 mmol·L−1 Al, leaf APase activity was significantly higher under low P, whereas root APase activity did not differ significantly between the two P levels. At 0.50 mmol·L−1 Al, neither leaf nor root APase activity differed significantly between the two P levels. At 1.00 mmol·L−1 Al, both leaf and root APase activities were significantly higher under normal P.
Figure 4.
Effects of phosphorus and aluminum treatments on acid phosphatase (APase) activity in Camellia japonica. (A) Leaves; (B) roots. Panels (A,B) use different y-axis scales. Values are means ± SE (n = 5). Dots represent individual biological replicates. Different letters indicate significant differences among treatments according to Tukey’s multiple-comparisons test (p < 0.05).
3.5. Effects of Aluminum on Total Al and P Concentrations in Leaves and Roots Under Two Phosphorus Levels
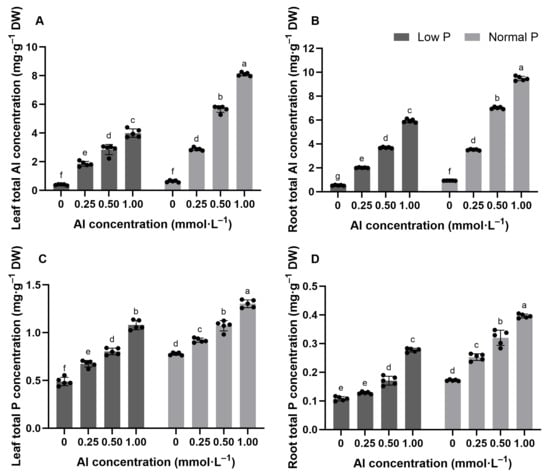
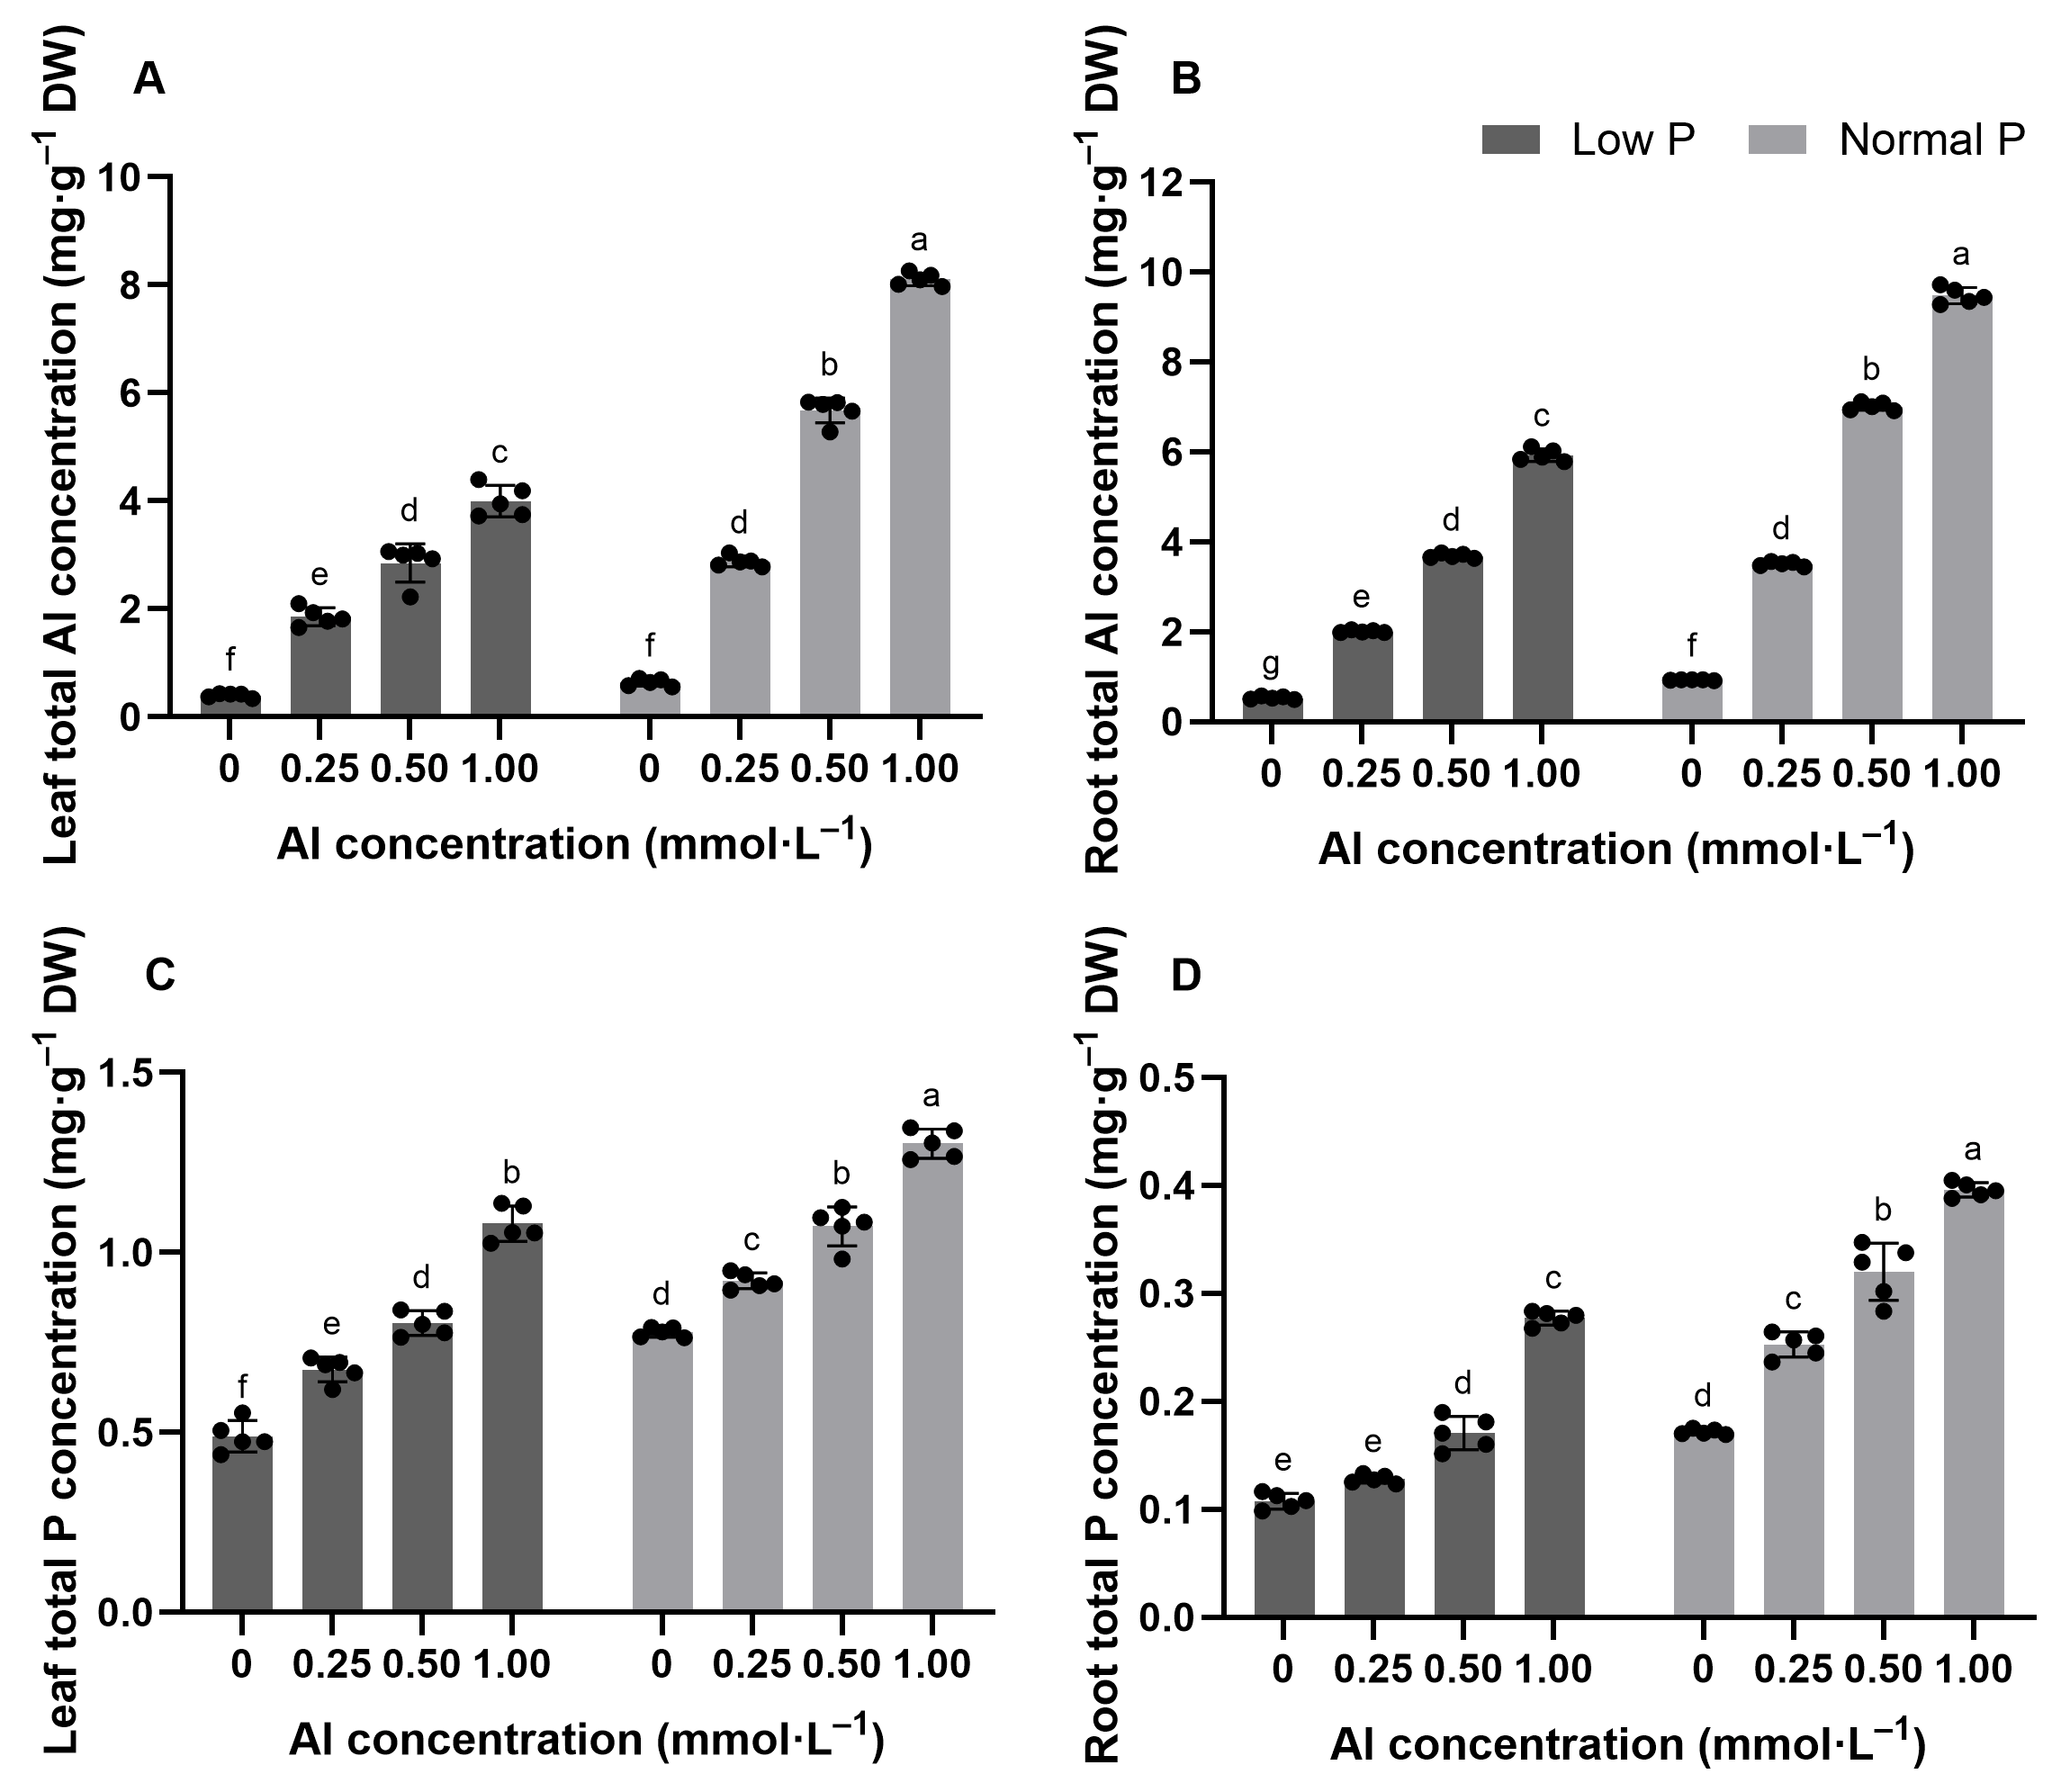
Total Al concentrations in leaves and roots increased with the Al concentration in the nutrient solution (Figure 5A,B). Under low P, leaf and root Al reached 3.997 and 5.927 mg·g−1 DW at 1.00 mmol·L−1 Al. The corresponding Al-free values were 0.396 and 0.530 mg·g−1 DW. Under normal P, leaf and root Al reached 8.106 and 9.473 mg·g−1 DW, compared with 0.634 and 0.929 mg·g−1 DW without Al. Al concentrations increased in both organs, with higher concentrations in roots than in leaves at each Al level. Al addition also increased total P concentrations in leaves and roots (Figure 5C,D). Under low P, 1.00 mmol·L−1 Al increased leaf P by 120.86% and root P by 156.48%. The concentrations reached 1.080 and 0.277 mg·g−1 DW. At the same Al level under normal P, leaf and root P reached 1.303 and 0.396 mg·g−1 DW. Unlike Al, P concentrations were higher in leaves than in roots. Al supply increased both Al and P concentrations, but the two elements showed different distributions between leaves and roots.
Figure 5.
Effects of phosphorus and aluminum treatments on total Al and P concentrations in leaves and roots of Camellia japonica. (A) Leaf total Al concentration; (B) root total Al concentration; (C) leaf total P concentration; (D) root total P concentration. The y-axis scales differ between panels (A,B) and between panels (C,D). Values are means ± SE (n = 5). Dots represent individual biological replicates. Different letters indicate significant differences among treatments according to Tukey’s multiple-comparisons test (p < 0.05).
3.6. Main and Interaction Effects of Phosphorus and Aluminum on the Measured Variables
Al concentration significantly affected every measured variable (Table 3). P level affected all variables except soluble sugar content and root APase activity. The P × Al interaction was significant for the three growth traits, chlorophyll a, total chlorophyll, SOD and POD activities, AsA content, leaf and root APase activities, leaf and root Al concentrations, and root P concentration. It was not significant for chlorophyll b, soluble sugar, soluble protein, H2O2, , TBARS, GSH, or leaf P concentration. P level therefore modified the response to Al for some, but not all, measured traits.
4. Discussion
Among the measured growth traits, longest root length showed the clearest response to Al. At both P levels, Al increased longest root length and shoot and root dry weights. Young white roots were less evident in plants without Al, especially under low P. In tea, Al maintains root-meristem activity and promotes new-root formation [30]. Liu et al. [31] also reported that Al promoted fine-root formation and plant growth in hydroponically grown C. japonica. Compared with the Al-free treatment, root biomass increased by 118% at 1.00 mmol·L−1 Al and by 42% at 2.00 mmol·L−1 Al. Shoot biomass, fine-root length, and fine-root number showed the same concentration pattern. Our results extend these earlier findings by showing that Al also promoted root growth under low-P conditions.
The growth traits, however, responded differently at the two P levels. Under low P, 1.00 mmol·L−1 Al increased longest root length by 479.78%, compared with 349.67% under normal P. The larger percentage under low P reflects the shorter roots in the corresponding Al-free treatment. In contrast, the relative increases in shoot and root dry weights were greater under normal P. Phosphorus is required for energy metabolism and biosynthesis [9]. Its greater availability under normal P may explain why the growth-promoting effect of Al was reflected more strongly in dry matter accumulation.
Al also affected leaf pigments and soluble compounds. Chlorophyll a, chlorophyll b, and total chlorophyll increased after Al addition at both P levels. Al has also been reported to increase leaf pigment contents and photosynthetic activity in tea [28]. Normal-P plants generally had more chlorophyll than low-P plants, and the responses of chlorophyll a and total chlorophyll to Al were stronger under normal P. Soluble sugar also increased steadily with Al at both P levels. This increase occurred together with greater shoot and root dry weights. In contrast, soluble protein varied among the treatments but showed no consistent response to increasing Al concentration.
Al addition was accompanied by decreases in H2O2, , and TBARS at both P levels. In the Al-free treatments, these indicators were higher under low P than under normal P, consistent with the disruption of leaf redox balance under P limitation. P deficiency can affect energy metabolism and increase ROS formation, which may lead to membrane lipid peroxidation [15,51,52]. After Al addition, all three indicators decreased at both P levels but remained higher under low P. This pattern indicates that P availability continued to influence leaf redox status.
SOD and POD activities and AsA and GSH contents increased alongside the decreases in H2O2, , and TBARS. SOD converts to H2O2, while POD and the AsA–GSH system participate in peroxide removal and redox regulation. The measured antioxidant components and oxidative-damage indicators responded in opposite directions to Al addition. Similar responses to Al have been reported in tea and C. japonica [28,31]. Exogenous AsA also reduced Al-induced oxidative damage in highbush blueberry [53]. The response of individual components varied with P and Al supply. Under normal P, SOD activity was highest at 0.50 mmol·L−1 Al, whereas POD activity continued to increase up to 1.00 mmol·L−1 Al. Under low P, SOD activity increased throughout the tested Al range. GSH increased at a similar rate under both P levels, while AsA showed a larger increase under low P. These differences indicate that P availability influenced the antioxidant response to Al.
APase activity reflects changes in P metabolism under Al treatment. Because phosphate was supplied in soluble form in the hydroponic solution, tissue APase activity was interpreted here in relation to plant P metabolism and P status. In the absence of Al, leaf APase activity was higher under low P, whereas root APase activity did not differ significantly between the two P levels. The higher leaf APase activity was consistent with the induction of phosphatases during P deficiency [54,55]. APase activity increased with Al addition, although the differences between P levels varied with organ and Al concentration. Red amaranth also showed an increase in root APase activity following Al treatment, accompanied by changes in total P and cytosolic Pi [36]. In the present hydroponic experiment, higher leaf and root APase activities occurred alongside longer roots and higher P concentrations after Al addition.
The P response differed between organs: root P showed a significant P × Al interaction, whereas leaf P increased with Al at both P levels. Al-related increases in root growth and P accumulation have also been reported in C. japonica and tea [31,56]. Studies in tea and Camellia oleifera further showed that the effects of Al on plant growth and P nutrition changed with P supply [33,57]. In the present study, the concurrent increases in root length, root APase activity, and root P concentration were particularly marked at 1.00 mmol·L−1 Al.
Total Al concentrations also differed between the two P levels. Root Al concentrations were higher than leaf Al concentrations at each Al level, consistent with the distribution previously reported in hydroponically grown C. japonica [31]. Al concentrations were also higher under normal P than under low P, particularly in leaves. P-dependent changes in leaf and root Al concentrations have also been reported in red amaranth and C. oleifera [36,57]. In the present study, the higher total Al concentrations under normal P occurred together with greater shoot and root biomass.
Al–P interactions vary among plant species and experimental conditions. In tea, Al stimulated growth under both low- and high-P supply, while its effects on P uptake and utilization differed between the two P levels [33]. In red amaranth, Al increased root APase activity under P deficiency and raised P concentrations in leaves and roots, showing that the Al response involved changes in both APase activity and P status [36]. Oil tea (C. oleifera) is another acid-soil-adapted species in the genus Camellia and has also been studied under combined Al and P treatments. In an 8-week sand-culture experiment, 4.00 mmol·L−1 Al reduced root length, root volume, and biomass of C. oleifera, while P addition promoted root growth, increased P content, and reduced Al accumulation in roots [58]. In the present 8-week hydroponic experiment at pH 4.0, Al concentrations up to 1.00 mmol·L−1 promoted the growth of C. japonica at both P levels. P supply changed the magnitude of the growth response and affected leaf and root APase activities and total Al and P concentrations. The growth-promoting response of C. japonica to Al was maintained under low P and was accompanied by changes in APase activity and P status.
5. Conclusions
Under the hydroponic conditions used in this study, Al promoted the growth of C. japonica under low-P conditions. The strongest response occurred at 1.00 mmol·L−1 Al and was accompanied by increases in root dry weight and longest root length, APase activity, and total P concentrations, together with lower oxidative-damage indicators. These results provide a basis for further studies of Al–P interactions in C. japonica grown in acidic substrates and soils.
Author Contributions
Conceptualization, A.M., L.S. and Y.Y.; methodology, A.M., Y.Y., J.C. and Y.G. (Yaqin Guan); software, Y.G. (Ying Gao) and Y.J.; validation, A.M., Y.Y., J.C., Y.G. (Yaqin Guan) and Z.L.; data curation, A.M., Y.Y. and J.C.; writing—original draft preparation, A.M. and L.S.; writing—review and editing, A.M., L.S., Y.Y., J.C., Y.G. (Yaqin Guan), Y.G. (Ying Gao), Y.J., Z.L. and X.L.; visualization, A.M.; supervision, L.S. and X.L.; project administration, L.S.; funding acquisition, L.S. All authors have read and agreed to the published version of the manuscript.
Funding
This work was funded by Sichuan Science and Technology Program, grant number 2021YFN0006.
Data Availability Statement
The original contributions presented in this study are included in the article. Further inquiries can be directed to the corresponding author.
Conflicts of Interest
The authors declare no conflicts of interest.
Abbreviations
| Al | aluminum |
| APase | acid phosphatase |
| AsA | ascorbate |
| DW | dry weight |
| FW | fresh weight |
| GSH | reduced glutathione |
| H2O2 | hydrogen peroxide |
| LP | low phosphorus |
| NP | normal phosphorus |
| superoxide | |
| P | phosphorus |
| POD | peroxidase |
| ROS | reactive oxygen species |
| SOD | superoxide dismutase |
| TBARS | thiobarbituric acid-reactive substances |
References
- Horst, W.J.; Wang, Y.; Eticha, D. The role of the root apoplast in aluminium-induced inhibition of root elongation and in aluminium resistance of plants: A review. Ann. Bot. 2010, 106, 185–197. [Google Scholar] [CrossRef] [Scilit] [PubMed]
- Kochian, L.V.; Piñeros, M.A.; Liu, J.; Magalhaes, J.V. Plant adaptation to acid soils: The molecular basis for crop aluminum resistance. Annu. Rev. Plant Biol. 2015, 66, 571–598. [Google Scholar] [CrossRef] [Scilit] [PubMed]
- Kopittke, P.M.; Moore, K.L.; Lombi, E.; Gianoncelli, A.; Ferguson, B.J.; Blamey, F.P.C.; Menzies, N.W.; Nicholson, T.M.; McKenna, B.A.; Wang, P.; et al. Identification of the primary lesion of toxic aluminum in plant roots. Plant Physiol. 2015, 167, 1402–1411. [Google Scholar] [CrossRef] [Scilit] [PubMed]
- Rahman, S.U.; Han, J.C.; Ahmad, M.; Ashraf, M.N.; Khaliq, M.A.; Yousaf, M.; Wang, Y.; Yasin, G.; Nawaz, M.F.; Khan, K.A.; et al. Aluminum phytotoxicity in acidic environments: A comprehensive review of plant tolerance and adaptation strategies. Ecotoxicol. Environ. Saf. 2024, 269, 115791. [Google Scholar] [CrossRef] [Scilit] [PubMed]
- Kochian, L.V.; Hoekenga, O.A.; Piñeros, M.A. How do crop plants tolerate acid soils? Mechanisms of aluminum tolerance and phosphorous efficiency. Annu. Rev. Plant Biol. 2004, 55, 459–493. [Google Scholar] [CrossRef] [Scilit] [PubMed]
- Lambers, H.; Shane, M.W.; Cramer, M.D.; Pearse, S.J.; Veneklaas, E.J. Root structure and functioning for efficient acquisition of phosphorus: Matching morphological and physiological traits. Ann. Bot. 2006, 98, 693–713. [Google Scholar] [CrossRef] [Scilit] [PubMed]
- Zheng, S.J. Crop production on acidic soils: Overcoming aluminium toxicity and phosphorus deficiency. Ann. Bot. 2010, 106, 183–184. [Google Scholar] [CrossRef] [Scilit] [PubMed]
- Lambers, H. Phosphorus acquisition and utilization in plants. Annu. Rev. Plant Biol. 2022, 73, 17–42. [Google Scholar] [CrossRef] [Scilit] [PubMed]
- Vance, C.P.; Uhde-Stone, C.; Allan, D.L. Phosphorus acquisition and use: Critical adaptations by plants for securing a nonrenewable resource. New Phytol. 2003, 157, 423–447. [Google Scholar] [CrossRef] [Scilit] [PubMed]
- Dissanayaka, D.M.S.B.; Ghahremani, M.; Siebers, M.; Wasaki, J.; Plaxton, W.C. Recent insights into the metabolic adaptations of phosphorus-deprived plants. J. Exp. Bot. 2021, 72, 199–223. [Google Scholar] [CrossRef] [Scilit] [PubMed]
- Liu, D. Root developmental responses to phosphorus nutrition. J. Integr. Plant Biol. 2021, 63, 1065–1090. [Google Scholar] [CrossRef] [Scilit] [PubMed]
- Niu, Y.F.; Chai, R.S.; Jin, G.L.; Wang, H.; Tang, C.X.; Zhang, Y.S. Responses of root architecture development to low phosphorus availability: A review. Ann. Bot. 2013, 112, 391–408. [Google Scholar] [CrossRef] [Scilit] [PubMed]
- Madison, I.; Gillan, L.; Peace, J.; Gabrieli, F.; Van den Broeck, L.; Jones, J.L.; Sozzani, R. Phosphate starvation: Response mechanisms and solutions. J. Exp. Bot. 2023, 74, 6417–6430. [Google Scholar] [CrossRef] [Scilit] [PubMed]
- Yang, S.Y.; Lin, W.Y.; Hsiao, Y.M.; Chiou, T.J. Milestones in understanding transport, sensing, and signaling of the plant nutrient phosphorus. Plant Cell 2024, 36, 1504–1523. [Google Scholar] [CrossRef] [Scilit] [PubMed]
- Hernández, I.; Munné-Bosch, S. Linking phosphorus availability with photo-oxidative stress in plants. J. Exp. Bot. 2015, 66, 2889–2900. [Google Scholar] [CrossRef] [Scilit] [PubMed]
- Shao, Y.D.; Hu, X.C.; Wu, Q.S.; Yang, T.Y.; Srivastava, A.K.; Zhang, D.J.; Gao, X.B.; Kuča, K. Mycorrhizas promote P acquisition of tea plants through changes in root morphology and P transporter gene expression. S. Afr. J. Bot. 2021, 137, 455–462. [Google Scholar] [CrossRef] [Scilit]
- Lin, Z.H.; Chen, L.S.; Chen, R.B.; Zhang, F.Z.; Jiang, H.X.; Tang, N. CO2 assimilation, ribulose-1,5-bisphosphate carboxylase/oxygenase, carbohydrates and photosynthetic electron transport probed by the JIP-test, of tea leaves in response to phosphorus supply. BMC Plant Biol. 2009, 9, 43. [Google Scholar] [CrossRef] [Scilit] [PubMed]
- Lin, Z.H.; Chen, L.S.; Chen, R.B.; Zhang, F.Z.; Jiang, H.X.; Tang, N.; Smith, B.R. Root release and metabolism of organic acids in tea plants in response to phosphorus supply. J. Plant Physiol. 2011, 168, 644–652. [Google Scholar] [CrossRef] [Scilit] [PubMed]
- Ding, Z.; Jia, S.; Wang, Y.; Xiao, J.; Zhang, Y. Phosphate stresses affect ionome and metabolome in tea plants. Plant Physiol. Biochem. 2017, 120, 30–39. [Google Scholar] [CrossRef] [Scilit] [PubMed]
- Liu, X.; Tian, J.; Liu, G.; Sun, L. Multi-omics analysis reveals mechanisms of strong phosphorus adaptation in tea plant roots. Int. J. Mol. Sci. 2023, 24, 12431. [Google Scholar] [CrossRef] [Scilit] [PubMed]
- Zoysa, A.K.N.; Loganathan, P.; Hedley, M.J. A technique for studying rhizosphere processes in tree crops: Soil phosphorus depletion around camellia (Camellia japonica L.) roots. Plant Soil 1997, 190, 253–265. [Google Scholar] [CrossRef] [Scilit]
- Chauhan, D.K.; Yadav, V.; Vaculík, M.; Gassmann, W.; Pike, S.; Arif, N.; Singh, V.P.; Deshmukh, R.; Sahi, S.; Tripathi, D.K. Aluminum toxicity and aluminum stress-induced physiological tolerance responses in higher plants. Crit. Rev. Biotechnol. 2021, 41, 715–730. [Google Scholar] [CrossRef] [Scilit] [PubMed]
- Bojórquez-Quintal, E.; Escalante-Magaña, C.; Echevarría-Machado, I.; Martínez-Estévez, M. Aluminum, a friend or foe of higher plants in acid soils. Front. Plant Sci. 2017, 8, 1767. [Google Scholar] [CrossRef] [Scilit] [PubMed]
- Brunner, I.; Sperisen, C. Aluminum exclusion and aluminum tolerance in woody plants. Front. Plant Sci. 2013, 4, 172. [Google Scholar] [CrossRef] [Scilit] [PubMed]
- Muhammad, N.; Zvobgo, G.; Zhang, G.P. A review: The beneficial effects and possible mechanisms of aluminum on plant growth in acidic soil. J. Integr. Agric. 2019, 18, 1518–1528. [Google Scholar] [CrossRef] [Scilit]
- Leal, M.D.V.; Piedade, L.C.A.; Castro, L.M.R.; Vinson, C.C.; Williams, T.C.R.; Lima, A.S.; Herrera, R.C. Global patterns of native aluminum-accumulating plants indicate a predominance in tropical regions and specific taxonomic groups. Plant Soil 2026, 525, 205–225. [Google Scholar] [CrossRef] [Scilit]
- Fung, K.F.; Carr, H.P.; Zhang, J.; Wong, M.H. Growth and nutrient uptake of tea under different aluminium concentrations. J. Sci. Food Agric. 2008, 88, 1582–1591. [Google Scholar] [CrossRef] [Scilit]
- Hajiboland, R.; Bahrami Rad, S.; Barceló, J.; Poschenrieder, C. Mechanisms of aluminum-induced growth stimulation in tea (Camellia sinensis). J. Plant Nutr. Soil Sci. 2013, 176, 616–625. [Google Scholar] [CrossRef] [Scilit]
- Zhang, X.; Liu, L.; Luo, S.; Ye, X.; Wen, W. Research advances in aluminum tolerance and accumulation in tea plant (Camellia sinensis). Beverage Plant Res. 2023, 3, 18. [Google Scholar] [CrossRef] [Scilit]
- Sun, L.; Zhang, M.; Liu, X.; Mao, Q.; Shi, C.; Kochian, L.V.; Liao, H. Aluminium is essential for root growth and development of tea plants (Camellia sinensis). J. Integr. Plant Biol. 2020, 62, 984–997. [Google Scholar] [CrossRef] [Scilit] [PubMed]
- Liu, Y.; Tao, J.; Cao, J.; Zeng, Y.; Li, X.; Ma, J.; Huang, Z.; Jiang, M.; Sun, L. The beneficial effects of aluminum on the plant growth in Camellia japonica. J. Soil Sci. Plant Nutr. 2020, 20, 1799–1809. [Google Scholar] [CrossRef] [Scilit]
- Zhang, X.; Luo, S.; Ye, X.; Liu, L.; Jia, X.; Jiang, D.; Wen, W. Physiological insights into the responses of tea plants to aluminum through an integrated transcriptomic and metabolomic analysis. Hortic. Adv. 2025, 3, 21. [Google Scholar] [CrossRef] [Scilit]
- Konishi, S.; Miyamoto, S.; Taki, T. Stimulatory effects of aluminum on tea plants grown under low and high phosphorus supply. Soil Sci. Plant Nutr. 1985, 31, 361–368. [Google Scholar] [CrossRef] [Scilit]
- Chen, W.; Tang, L.; Wang, J.; Zhu, H.; Jin, J.; Yang, J.; Fan, W. Research advances in the mutual mechanisms regulating response of plant roots to phosphate deficiency and aluminum toxicity. Int. J. Mol. Sci. 2022, 23, 1137. [Google Scholar] [CrossRef] [Scilit] [PubMed]
- Magalhaes, J.V.; Piñeros, M.A.; Maciel, L.S.; Kochian, L.V. Emerging pleiotropic mechanisms underlying aluminum resistance and phosphorus acquisition on acidic soils. Front. Plant Sci. 2018, 9, 1420. [Google Scholar] [CrossRef] [Scilit] [PubMed]
- Nazari, F.; Hajiboland, R.; Poschenrieder, C. Aluminum (Al) favors phosphorus (P) nutrition in Al-tolerant Amaranthus cruentus L. under P deficiency. Discov. Plants 2026, 3, 71. [Google Scholar] [CrossRef] [Scilit]
- Watanabe, T.; Misawa, S.; Osaki, M. Aluminum accumulation in the roots of Melastoma malabathricum, an aluminum-accumulating plant. Can. J. Bot. 2005, 83, 1518–1522. [Google Scholar] [CrossRef] [Scilit]
- Ma, J.; Saleem, M.H.; Yasin, G.; Mumtaz, S.; Qureshi, F.F.; Ali, B.; Ercisli, S.; Alhag, S.K.; Ahmed, A.E.; Vodnar, D.C.; et al. Individual and combinatorial effects of SNP and NaHS on morpho-physio-biochemical attributes and phytoextraction of chromium through Cr-stressed spinach (Spinacia oleracea L.). Front. Plant Sci. 2022, 13, 973740. [Google Scholar] [CrossRef] [Scilit] [PubMed]
- Arnon, D.I. Copper enzymes in isolated chloroplasts. Polyphenoloxidase in Beta vulgaris. Plant Physiol. 1949, 24, 1–15. [Google Scholar] [CrossRef] [Scilit] [PubMed]
- Yemm, E.W.; Willis, A.J. The estimation of carbohydrates in plant extracts by anthrone. Biochem. J. 1954, 57, 508–514. [Google Scholar] [CrossRef] [Scilit] [PubMed]
- Bradford, M.M. A rapid and sensitive method for the quantitation of microgram quantities of protein utilizing the principle of protein-dye binding. Anal. Biochem. 1976, 72, 248–254. [Google Scholar] [CrossRef] [PubMed]
- Hodges, D.M.; DeLong, J.M.; Forney, C.F.; Prange, R.K. Improving the thiobarbituric acid-reactive-substances assay for estimating lipid peroxidation in plant tissues containing anthocyanin and other interfering compounds. Planta 1999, 207, 604–611. [Google Scholar] [CrossRef] [Scilit]
- Patterson, B.D.; MacRae, E.A.; Ferguson, I.B. Estimation of hydrogen peroxide in plant extracts using titanium(IV). Anal. Biochem. 1984, 139, 487–492. [Google Scholar] [CrossRef] [Scilit] [PubMed]
- Li, J.; Maezawa, S.; Nakano, K. Determination of superoxide by nitrite ion method. Hortic. Res. 2002, 1, 279–282. [Google Scholar] [CrossRef] [Scilit]
- Kampfenkel, K.; Van Montagu, M.; Inzé, D. Extraction and determination of ascorbate and dehydroascorbate from plant tissue. Anal. Biochem. 1995, 225, 165–167. [Google Scholar] [CrossRef] [Scilit] [PubMed]
- Owens, C.W.I.; Belcher, R.V. A colorimetric micro-method for the determination of glutathione. Biochem. J. 1965, 94, 705–711. [Google Scholar] [CrossRef] [Scilit] [PubMed]
- Beauchamp, C.; Fridovich, I. Superoxide dismutase: Improved assays and an assay applicable to acrylamide gels. Anal. Biochem. 1971, 44, 276–287. [Google Scholar] [CrossRef] [Scilit] [PubMed]
- Chance, B.; Maehly, A.C. Assay of catalases and peroxidases. Methods Enzymol. 1955, 2, 764–775. [Google Scholar] [CrossRef] [Scilit]
- McLachlan, K.D. Acid phosphatase activity of intact roots and phosphorus nutrition in plants. 1. Assay conditions and phosphatase activity. Aust. J. Agric. Res. 1980, 31, 429–440. [Google Scholar] [CrossRef] [Scilit]
- Huang, C.L.; Schulte, E.E. Digestion of plant tissue for analysis by ICP emission spectroscopy. Commun. Soil Sci. Plant Anal. 1985, 16, 943–958. [Google Scholar] [CrossRef] [Scilit]
- Meng, X.; Chen, W.W.; Wang, Y.Y.; Huang, Z.R.; Ye, X.; Chen, L.S.; Yang, L.T. Effects of phosphorus deficiency on the absorption of mineral nutrients, photosynthetic system performance and antioxidant metabolism in Citrus grandis. PLoS ONE 2021, 16, e0246944. [Google Scholar] [CrossRef] [Scilit] [PubMed]
- Kayoumu, M.; Iqbal, A.; Muhammad, N.; Li, X.; Li, L.; Wang, X.; Gui, H.; Qi, Q.; Ruan, S.; Guo, R.; et al. Phosphorus availability affects the photosynthesis and antioxidant system of contrasting low-P-tolerant cotton genotypes. Antioxidants 2023, 12, 466. [Google Scholar] [CrossRef] [Scilit] [PubMed]
- Cárcamo-Fincheira, P.; Nunes-Nesi, A.; Soto-Cerda, B.; Tighe-Neira, R.; Tranamil-Manquein, J.; Mora-Sanhueza, R.; Inostroza-Blancheteau, C.; Reyes-Díaz, M. Ascorbic acid mitigates aluminum stress through improved antioxidant mechanism in highbush blueberry (Vaccinium corymbosum L.). Horticulturae 2025, 11, 330. [Google Scholar] [CrossRef] [Scilit]
- Duff, S.M.G.; Sarath, G.; Plaxton, W.C. The role of acid phosphatases in plant phosphorus metabolism. Physiol. Plant. 1994, 90, 791–800. [Google Scholar] [CrossRef] [Scilit]
- Wang, L.; Liu, D. Functions and regulation of phosphate starvation-induced secreted acid phosphatases in higher plants. Plant Sci. 2018, 271, 108–116. [Google Scholar] [CrossRef] [Scilit] [PubMed]
- Fan, K.; Wang, M.; Gao, Y.; Ning, Q.; Shi, Y. Transcriptomic and ionomic analysis provides new insight into the beneficial effect of Al on tea roots’ growth and nutrient uptake. Plant Cell Rep. 2019, 38, 715–729. [Google Scholar] [CrossRef] [Scilit] [PubMed]
- Yuan, J.; Huang, L.; Zhou, N.; Wang, H.; Niu, G. Fractionation of inorganic phosphorus and aluminum in red acidic soil and the growth of Camellia oleifera. HortScience 2017, 52, 1293–1297. [Google Scholar] [CrossRef] [Scilit]
- Qu, X.; Zhou, J.; Masabni, J.; Yuan, J. Phosphorus relieves aluminum toxicity in oil tea seedlings by regulating the metabolic profiling in the roots. Plant Physiol. Biochem. 2020, 152, 12–22. [Google Scholar] [CrossRef] [Scilit] [PubMed]

Disclaimer/Publisher’s Note: The statements, opinions and data contained in all publications are solely those of the individual author(s) and contributor(s) and not of MDPI and/or the editor(s). MDPI and/or the editor(s) disclaim responsibility for any injury to people or property resulting from any ideas, methods, instructions or products referred to in the content. |
© 2026 by the authors. Licensee MDPI, Basel, Switzerland. This article is an open access article distributed under the terms and conditions of the Creative Commons Attribution (CC BY) license.