


Abstract
Spontaneous fermentation is central to ancestral mezcal production, yet the bacterial and fungal communities associated with Agave cupreata must remain insufficiently characterized. This exploratory study described community composition and predicted functional profiles at three stages of a traditional fermentation defined by sugar depletion: 10 °Brix (0 h), 5 °Brix (72 h), and 2 °Brix (144 h). Ambient temperature ranged from 21.7 to 23.7 °C, must temperature from 28.5 to 29.9 °C, pH from 4.6 to 5.2, and relative humidity from 51.3% to 58.7%. At each stage, material collected from two wooden vats and three vertical positions was pooled into one composite sample. Bacterial 16S rRNA gene and fungal ITS1 amplicons were sequenced and analyzed using QIIME 2. At 10 °Brix, five dominant bacterial genera accounted for more than 93% of relative abundance. Lactic and acetic acid bacteria represented more than 91% at 5 °Brix, while Pediococcus, Lactiplantibacillus, and Loigolactobacillus were prominent at 2 °Brix. Seven fungal genera represented more than 98% of the initial profile, whereas Saccharomyces, Debaryomyces, and Maudiozyma accounted for more than 98% at 2 °Brix. PICRUSt2 predicted pathways related to carbohydrate degradation and fermentation, whereas FUNGuild assignments were predominantly saprotrophic at the later stages. Because one pooled sample was analyzed per stage, these patterns are descriptive and require validation in replicated fermentations. Despite these limitations, this study provides baseline information on the microbial communities associated with ancestral A. cupreata fermentation and identifies taxa and predicted functions that merit future isolation and experimental validation.
1. Introduction
Mezcal is a distilled agave beverage with substantial cultural, social, and economic importance in Mexico. Production has expanded in recent years, and exports have also increased, while a large proportion of the sector continues to depend on small producers and indigenous communities [1,2,3]. These production systems preserve locally developed knowledge, equipment, and practices that contribute to the regional identity of the beverage.
Under the Mexican standard, mezcal is classified as mezcal, artisanal mezcal, or ancestral mezcal according to the equipment and operations used during production [4]. The general process includes agave harvesting, cooking, milling, fermentation, distillation, bottling, and commercialization [4,5]. After cooking and milling, the resulting agave must is fermented either spontaneously or with selected inocula. During fermentation, microorganisms transform available carbohydrates and contribute to the formation of ethanol, organic acids, higher alcohols, esters, and other compounds that can influence the chemical and sensory properties of the distilled product [5,6,7].
Spontaneous agave fermentations are initiated by microorganisms introduced from the cooked plant material, water, wooden vats, tools, air, insects, workers, and the surrounding environment. Consequently, the structure of the fermenting consortium may vary among locations and production batches [8,9,10]. Lactic acid bacteria (LAB), acetic acid bacteria, and yeasts are frequently detected, but their relative abundances change as sugars are depleted and environmental conditions such as pH, temperature, oxygen availability, and ethanol concentration change. Characterizing these compositional patterns can help identify organisms for subsequent cultivation and experimental assessment. Microbial management has also been investigated as a strategy to improve the safety and chemical consistency of fermented foods and beverages [11,12].
Previous studies of agave fermentations have identified complex communities composed mainly of lactic acid bacteria, acetic acid bacteria, Saccharomyces, and non-Saccharomyces yeasts [7,8,9,10]. Culture-independent sequencing has expanded this knowledge by revealing taxa that may be overlooked by cultivation-based approaches and by describing changes in microbial composition during fermentation. However, information remains limited for ancestral A. cupreata fermentations from Guerrero, particularly regarding the simultaneous characterization of bacterial and fungal communities at different sugar-depletion stages [8].
Marker-gene amplicon sequencing provides a culture-independent approach for describing bacterial and fungal communities, although it does not directly measure gene expression or metabolite production. In addition, tools such as PICRUSt2 and FUNGuild can generate hypotheses about bacterial functional potential and fungal trophic assignments from taxonomic data [13,14]. Accordingly, this study addressed whether bacterial and fungal community profiles changed descriptively across three stages of spontaneous A. cupreata must fermentation. The objective was to characterize their taxonomic composition and explore predicted bacterial functions and fungal trophic modes. Because one pooled sample was analyzed per stage, the study was limited to a descriptive assessment. Nevertheless, the results provide baseline information for future replicated, cultivation-based, and multi-omics studies of this traditional fermentation system.
2. Materials and Methods
2.1. Study Site, Fermentation Conditions, and Sampling
Must samples were collected in June 2025 from an ancestral mezcal distillery in the indigenous community of El Calvario, Guerrero, Mexico (17°28′06.1″ N, 99°30′28.6″ W). Fermentation was conducted in two new 500 kg wooden vats made from Ayacahuite pine (Pinus ayacahuite). Each vat received 200 kg of cooked and milled A. cupreata material and 50 L of water. The contents were homogenized to an initial concentration of 10 °Brix.
The must was fermented in open wooden vats without lids or mechanical temperature control, following the traditional practice commonly used for ancestral mezcal production in the study region.
Ambient temperature and relative humidity were recorded using a digital thermo-hygrometer (model 445815; Extech Instruments, Nashua, NH, USA). Must temperature was measured using a Checktemp digital thermometer (HI98501; Hanna Instruments, Woonsocket, RI, USA). The pH was measured using a Hanna Instruments, HI9814, Woonsocket, RI, USA, and soluble solids were measured as °Brix using an Atago PAL-1 digital refractometer (Atago Co., Tokyo, Japan). Physicochemical measurements were obtained in technical triplicate at 24 h intervals.
Microbiome sampling was performed at three fermentation stages defined by soluble-solids depletion: initial (10 °Brix, 0 h), intermediate (5 °Brix, 72 h), and final (2 °Brix, 144 h). At each stage, subsamples were collected from the bottom, middle, and surface of each vat and combined to obtain a 150 mL vat-level composite. The composites from the two vats were then pooled, yielding one 300 mL sample per stage. Because the vat composites were pooled, downstream sequence analyses comprised one microbiome sample per stage and did not permit estimation of between-vat or spatial variability. Thus, no independent biological replicates were analyzed. Samples were transported under cold-chain conditions to the Laboratory of Molecular Microbiology and Environmental Biotechnology, Faculty of Chemical and Biological Sciences, Autonomous University of Guerrero. Because the vat composites were pooled, downstream sequence analyses comprised one microbiome sample per stage and did not permit estimation of between-vat or spatial variability.
2.2. DNA Extraction, Amplicon Library Preparation, and Sequencing
Total DNA was extracted from each composite must sample using the Quick-DNA Fungal/Bacterial Miniprep Kit (D6005; Zymo Research, Irvine, CA, USA) according to the manufacturer’s instructions. DNA integrity was assessed by electrophoresis in a 1% agarose gel, and concentration and A260/A280 purity ratios were measured with a NanoDrop 2000 spectrophotometer (Thermo Fisher Scientific, Waltham, MA, USA).
Bacterial amplicons were generated with primers 341F (5′-CCTACGGGNGGCWGCAG-3′) and 805R (5′-GACTACHVGGGTATCTAATCC-3′), which target the V3-V4 region of the 16S rRNA gene [15]. Fungal amplicons were generated with primers ITS1F (5′-CTTGGTCATTTAGAGGAAGTAA-3′) [16] and ITS2 (5′-GCTGCGTTCTTCATCGATGC-3′) [17], targeting the ITS1 region. Each 25 µL PCR reaction contained 12.5 µL of 2× Master Mix, 0.5 µL of each primer (10 µM), 10 ng of template DNA, and nuclease-free water. The thermal cycling conditions were as follows: 95 °C for 30 s; 35 cycles of 98 °C for 10 s, 55 °C for 30 s, and 72 °C for 30 s; followed by a final extension at 72 °C for 5 min. The amplicon libraries were prepared and sequenced by Microbioma-Lab (San Lucas Cuauhtelulpan, Tlaxcala, Mexico) using an Illumina MiSeq high-throughput sequencing platform with a paired-end sequencing configuration of 2 × 300 bp. The demultiplexed paired-end reads were provided in FASTQ format for subsequent bioinformatics analysis.
2.3. Sequence Processing and Taxonomic Assignment
Demultiplexed reads were processed in QIIME 2 v2026.10 [18]. DADA2 v2026.4.0 was used for quality filtering, error correction, paired-read merging, chimera removal, and inference of amplicon sequence variants (ASVs) [19]. Sequence-processing statistics were obtained from the DADA2 denoising summary.
Bacterial ASVs were classified with a naive Bayes classifier trained against SILVA release 138.2 [20]. Fungal ASVs were classified against the UNITE v10.0 database [21]. Sequences classified as chloroplasts or mitochondria and features that could not be assigned to the target domains were removed. Taxonomic bar plots were prepared at the genus level. Genera with relative abundance below 1% were grouped as “Others” for visualization only; unfiltered feature tables were used for diversity calculations.
2.4. Diversity Analysis, Functional Prediction, and Data Interpretation
Alpha diversity was summarized using the Shannon and Simpson indices and Chao1 richness estimator. Bray–Curtis dissimilarity was calculated and visualized by principal coordinate analysis (PCoA) [22]. Because only one pooled sample was available at each stage, diversity values and PCoA were interpreted descriptively, and no inferential tests of stage effects were performed. Technical replicates of the physicochemical measurements were used only to describe measurement variability and were not considered independent biological replicates.
Predicted bacterial pathways were generated using PICRUSt2 v2.6.3 [14]. Taxon-stratified outputs were used to describe the predicted contributions of abundant bacterial genera to selected pathways. Predicted metagenomic functional profiles were expressed as KEGG Orthology (KO) terms using the KEGG database [23] and normalized by 16S rRNA gene copy number.
Fungal taxa were assigned to ecological guilds using FUNGuild v1.1 [13], and the outputs were summarized at the trophic-mode level. The dominant bacterial and fungal genera were selected based on their relative abundance for taxon-focused functional analysis. Functional results were treated as predictions derived from marker-gene data and not as direct measurements of gene expression, pathway activity, or metabolite production. Correlations between environmental variables and microbial taxa were not calculated because only one pooled microbiome sample was available per stage, which was insufficient for statistically supported correlation analysis.
Taxonomic and diversity analyses and their corresponding visualizations were performed in QIIME2, whereas the predicted functional profiles were processed and visualized using Python version 3.14.6.
3. Results
3.1. Sequencing Output and Quality Control
A total of 217,364 bacterial 16S and 467,858 fungal ITS raw paired-end reads were obtained. After quality filtering, 214,484 bacterial reads (98.68%) and 452,838 fungal reads (96.79%) were retained. Paired-read merging produced 187,556 bacterial reads (86.29% of the input) and 438,869 fungal reads (93.80%). Following chimera removal, 76,647 bacterial reads (35.26%) and 316,113 fungal reads (67.57%) remained for downstream analyses. The final feature tables contained 38–49 bacterial ASVs and 32–51 fungal ASVs per fermentation stage. The number of ASVs detected in each sample is reported in Supplementary Tables S1 and S2.
3.2. Physicochemical Changes During Fermentation
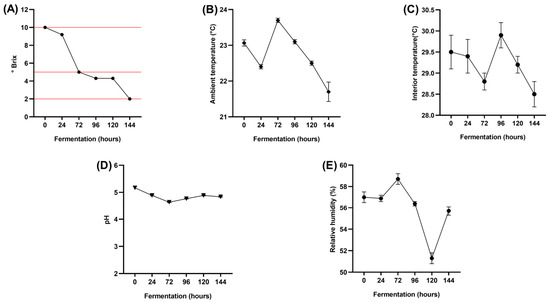
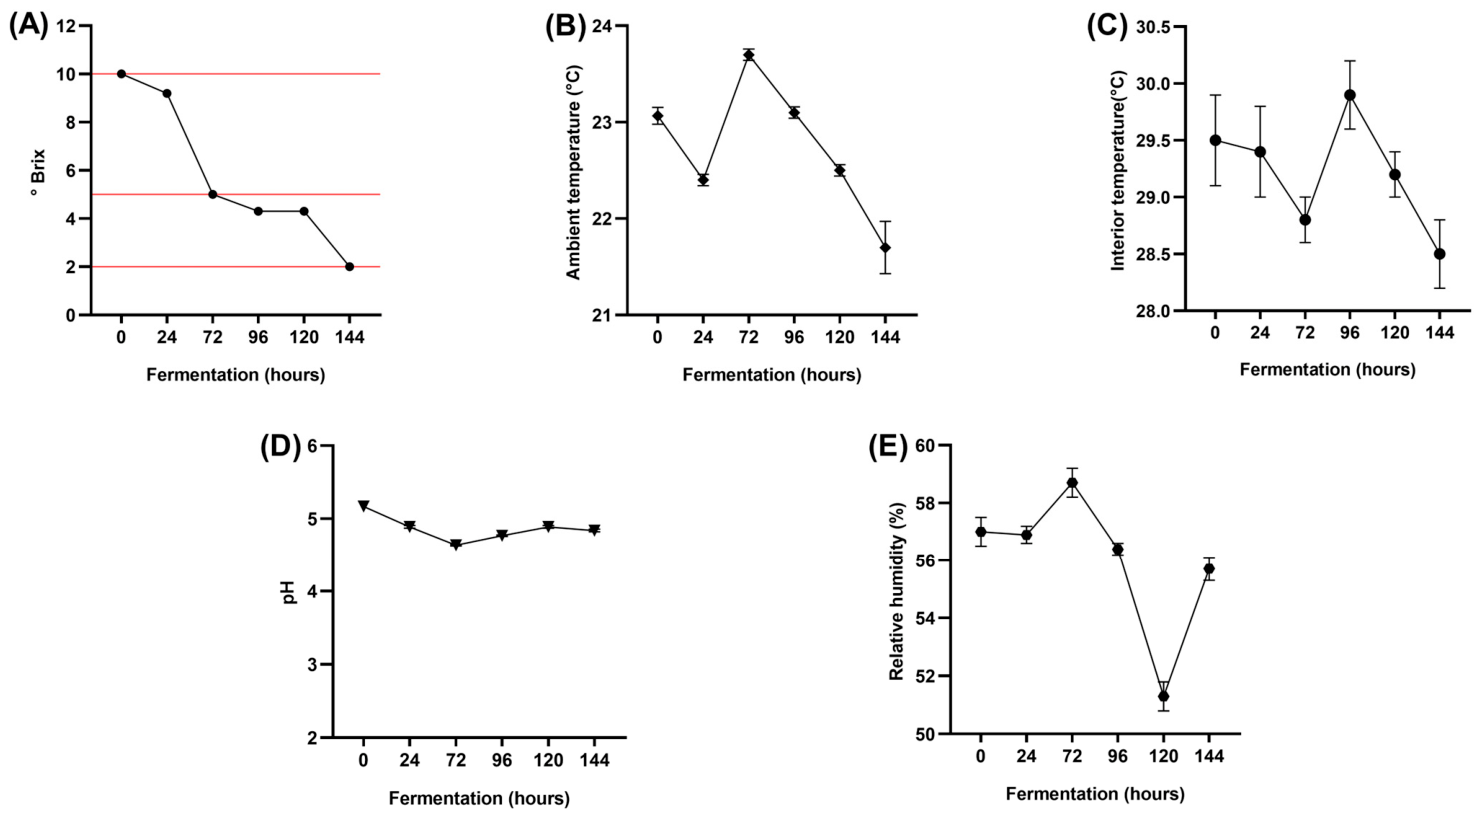
Soluble solids declined from 10 °Brix at 0 h to 5 °Brix at 72 h and 2 °Brix at 144 h (Figure 1A). Ambient temperature ranged from 21.7 to 23.7 °C, with the highest recorded value at 72 h (Figure 1B). Must temperature varied within a narrower interval, from 28.5 to 29.9 °C, and reached its maximum at 96 h (Figure 1C). The pH remained between 4.6 and 5.1 throughout the process (Figure 1D). Relative humidity ranged from 51.3% at 120 h to 58.7% at 72 h (Figure 1E). These measurements describe the environmental conditions of the sampled fermentation and were not subjected to between-fermentation statistical comparison.
Figure 1.
Physicochemical parameters recorded during spontaneous ancestral mezcal fermentation. (A) Soluble solids (°Brix); (B) ambient temperature; (C) must temperature; (D) pH; and (E) relative humidity. The horizontal reference lines in panel A indicate the 10, 5, and 2 °Brix levels used to define the microbiome sampling stages. Points represent the mean of technical measurements; error bars indicate the standard error of the mean (SEM).
3.3. Bacterial Community Composition and Diversity
At the phylum level, Firmicutes dominated the bacterial community and increased from approximately 80% at 10 °Brix to 85% at 5 °Brix and 97% at 2 °Brix. In contrast, Proteobacteria decreased from approximately 20% to 15% and 3%, respectively (Figure S1A).
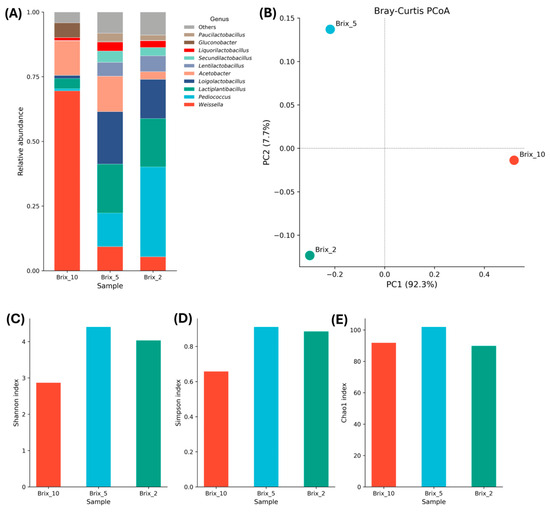
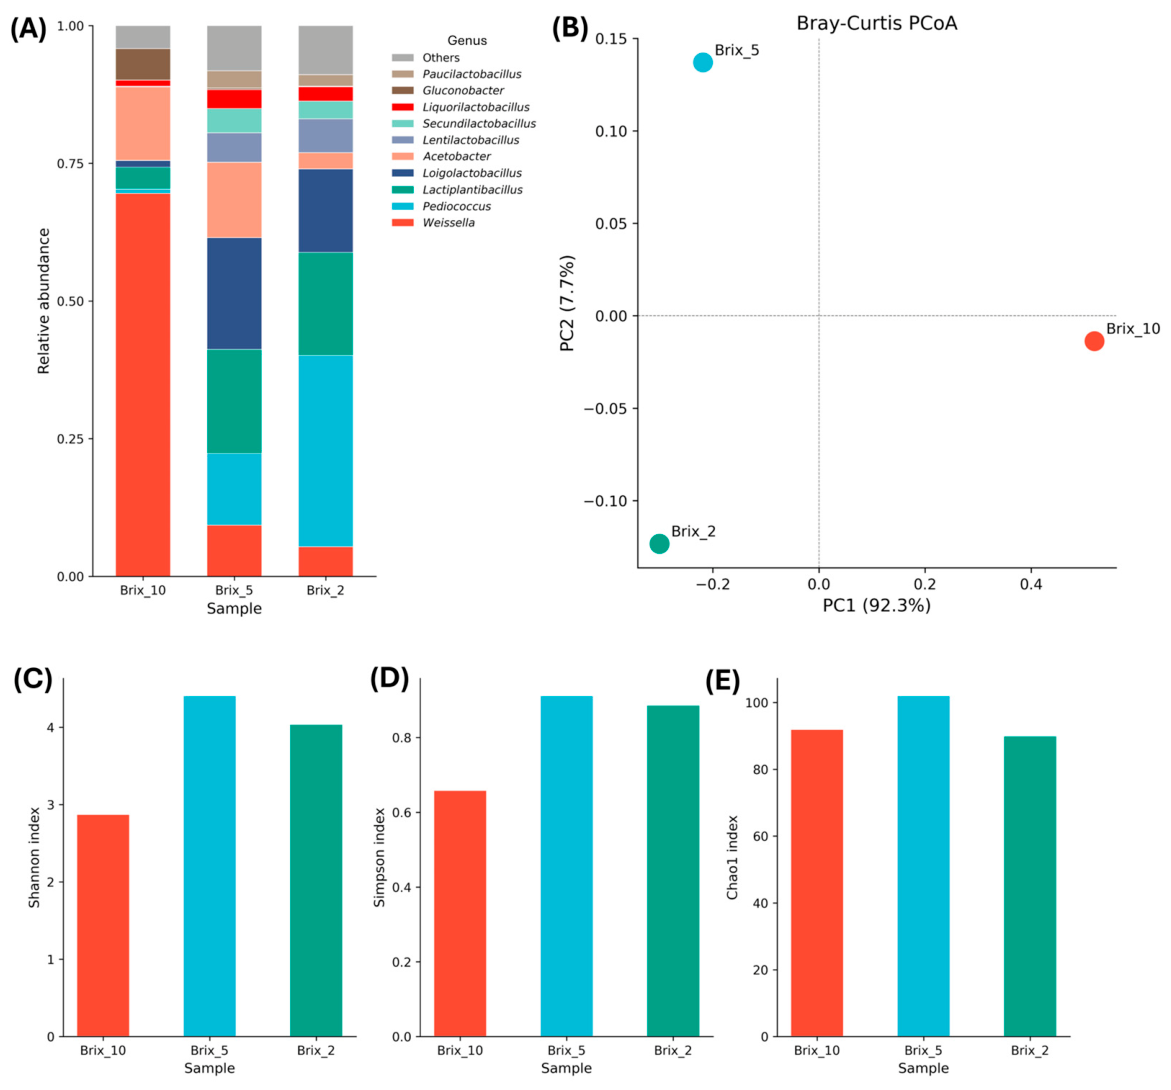
At 10 °Brix, Weissella, Lactiplantibacillus, Acetobacter, Liquorilactobacillus, and Gluconobacter together accounted for more than 93% of the bacterial relative abundance (Figure 2A). At 5 °Brix, the profile became more evenly distributed among Lactiplantibacillus, Loigolactobacillus, Weissella, Acetobacter, Pediococcus, Lentilactobacillus, Secundilactobacillus, Liquorilactobacillus, and Paucilactobacillus, which together represented more than 91% of the community. At 2 °Brix, Pediococcus, Lactiplantibacillus, and Loigolactobacillus were prominent, while the same broader group of LAB and acetic acid bacteria accounted for more than 90% of the total relative abundance.
Figure 2.
Bacterial community composition and diversity during spontaneous ancestral mezcal fermentation. (A) Relative abundance at the genus level; (B) Bray–Curtis principal coordinate analysis (PCoA); (C) Shannon index; (D) Simpson index; and (E) Chao1 richness estimate. One pooled composite sample was analyzed per stage; therefore, ordination and diversity values are descriptive.
The three stage-specific samples occupied distinct positions in the Bray–Curtis PCoA (Figure 2B), providing a descriptive visualization of compositional turnover. The Shannon index was 2.87 at 10 °Brix, 4.41 at 5 °Brix, and 4.04 at 2 °Brix (Figure 2C). Simpson values were 0.65, 0.91, and 0.88, respectively (Figure 2D), whereas Chao1 estimates were 92, 102, and 90 (Figure 2E). These values indicate that bacterial evenness was lowest in the initial composite and higher in the intermediate and final composites; however, the absence of biological replicates precludes statistical inference about temporal change.
3.4. Fungal Community Composition and Diversity
At the phylum level, Ascomycota represented more than 99% of the fungal relative abundance at all three fermentation stages. Basidiomycota occurred at a relative abundance below 1% and was detected mainly at 10 and 5 °Brix (Figure S1B).
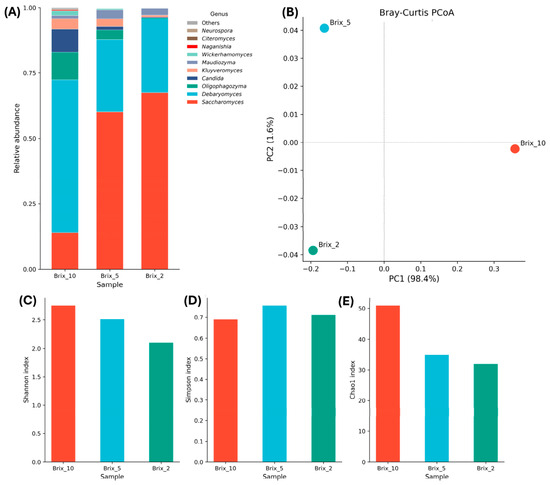
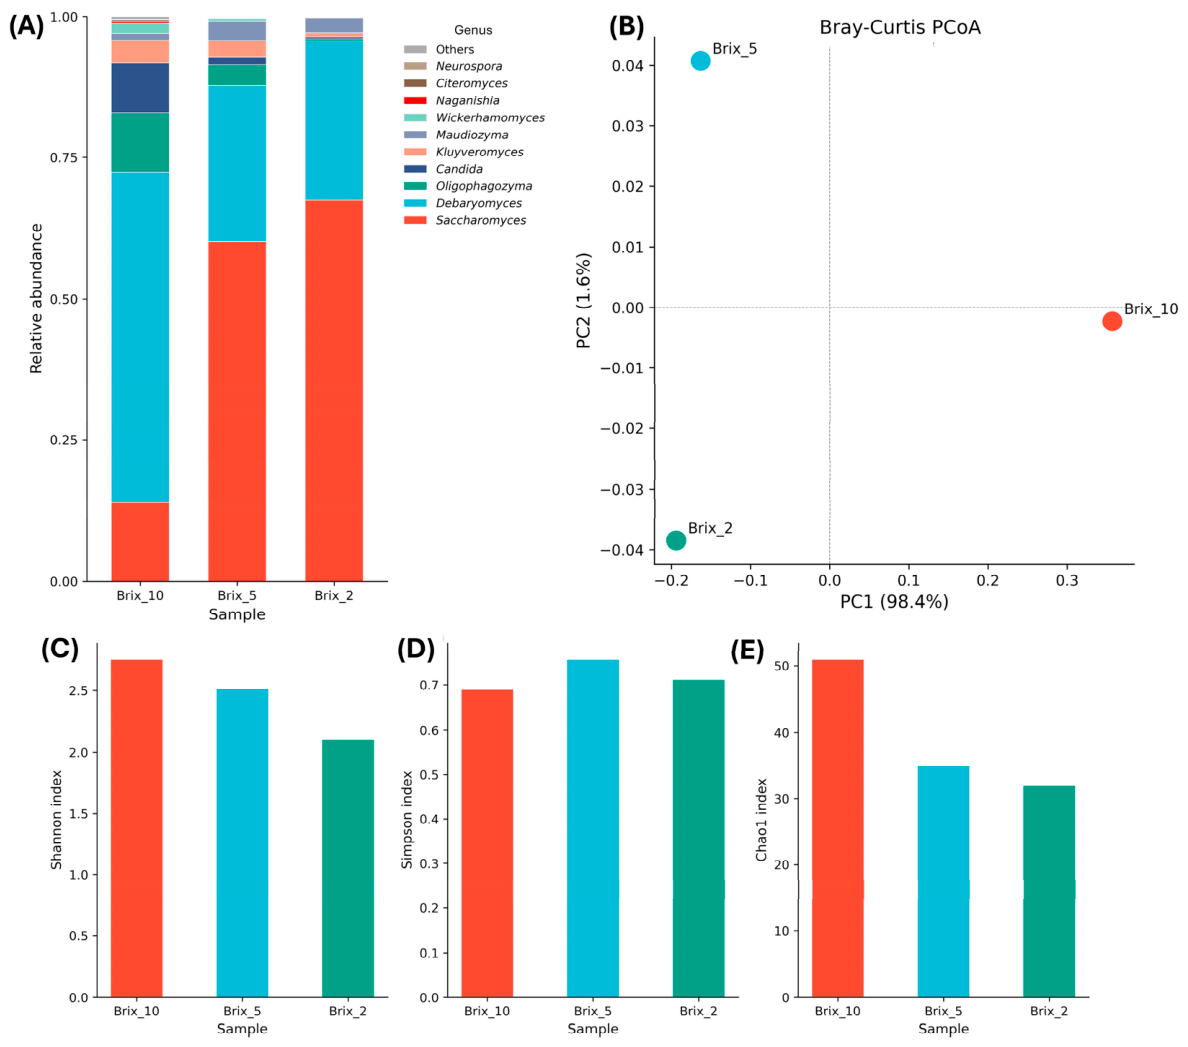
The fungal profile at 10 °Brix included Debaryomyces, Saccharomyces, Oligophagozyma, Candida, Kluyveromyces, Maudiozyma, and Wickerhamomyces, which together accounted for more than 98% of relative abundance (Figure 3A). At 5 °Brix, Saccharomyces, Debaryomyces, Oligophagozyma, Kluyveromyces, and Maudiozyma represented more than 97% of the profile. At 2 °Brix, the community was concentrated mainly in Saccharomyces, Debaryomyces, and Maudiozyma, which together accounted for more than 98% of fungal relative abundance.
Figure 3.
Fungal community composition and diversity during spontaneous ancestral mezcal fermentation. (A) Relative abundance at the genus level; (B) Bray–Curtis principal coordinate analysis (PCoA); (C) Shannon index; (D) Simpson index; and (E) Chao1 richness estimate. One pooled composite sample was analyzed per stage; therefore, ordination and diversity values are descriptive.
The three fungal composites were also separated in the Bray–Curtis PCoA (Figure 3B). The Shannon index was highest at the initial stage and declined to 2.51 at 5 °Brix and 2.10 at 2 °Brix (Figure 3C). Simpson values were 0.69, 0.75, and 0.71 (Figure 3D), and Chao1 estimates decreased from 51 at 10 °Brix to 35 at 5 °Brix and 32 at 2 °Brix (Figure 3E). The descriptive pattern therefore indicated a reduction in fungal richness and Shannon diversity as a smaller set of genera became dominant.
3.5. Predicted Bacterial Pathways and Fungal Trophic Modes
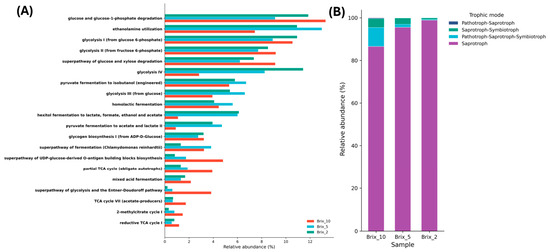
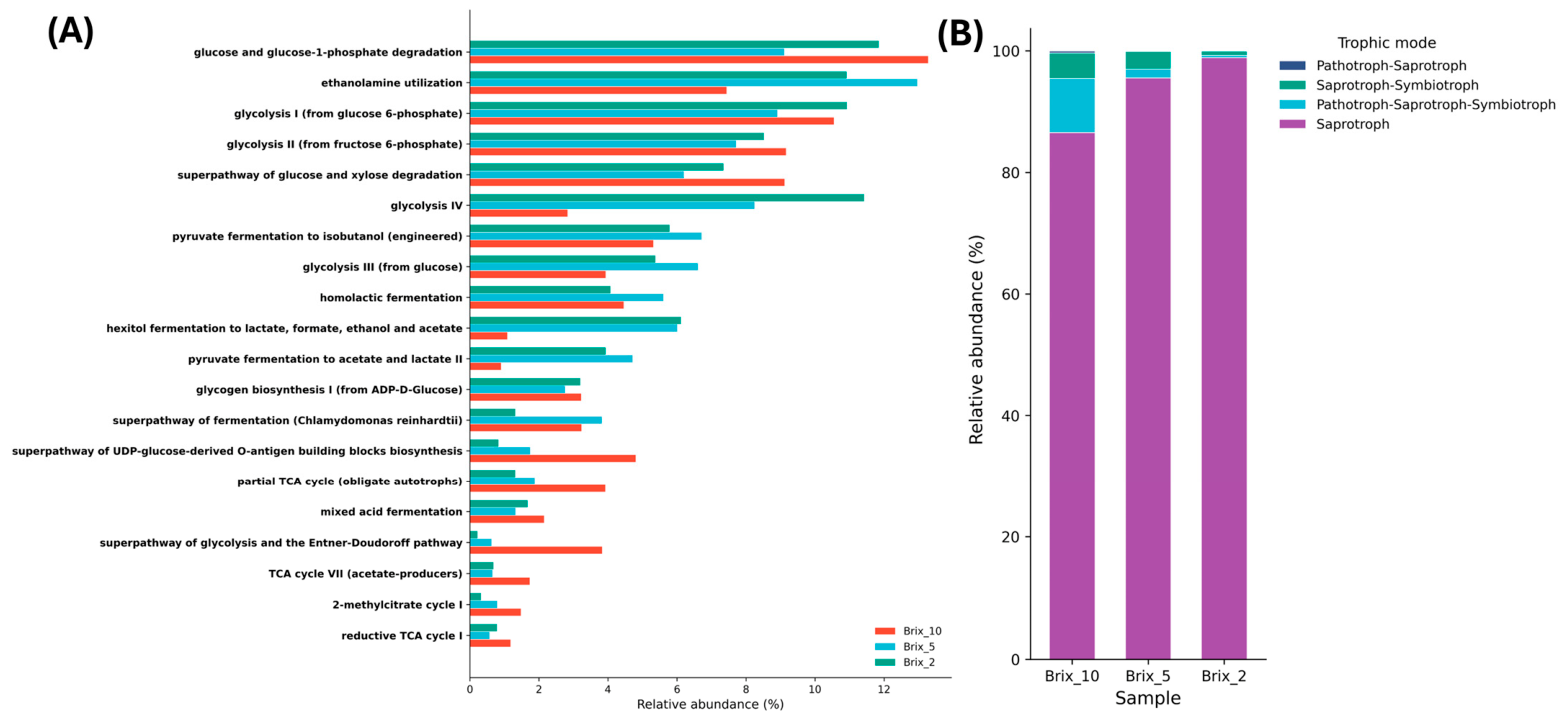
PICRUSt2 predictions were dominated by pathways related to carbohydrate utilization. Among the pathways displayed, glucose and glucose-1-phosphate degradation, glycolytic routes, and the superpathway of glucose and xylose degradation had high predicted relative abundances (Figure 4A). Several of these predicted pathway abundances were greater in the 5 and 2 °Brix composites than in the 10 °Brix composite. These patterns represent inferred genomic potential and do not demonstrate pathway expression.
Figure 4.
Predicted bacterial functions and fungal trophic-mode assignments during spontaneous ancestral mezcal fermentation. (A) Relative abundance of selected bacterial pathways predicted with PICRUSt2; (B) fungal trophic modes assigned with FUNGuild. Both analyses are inference-based and should not be interpreted as direct evidence of gene expression or metabolic activity.
FUNGuild assigned the initial fungal profile to several trophic-mode combinations, including saprotrophic and mixed pathotrophic–saprotrophic–symbiotrophic categories. At the intermediate and final stages, the displayed assignments were predominantly saprotrophic (Figure 4B). These categories reflect database-based ecological annotations of the detected taxa rather than measured fungal activity in the must.
3.6. Predicted Functional Contributions of Abundant Genera
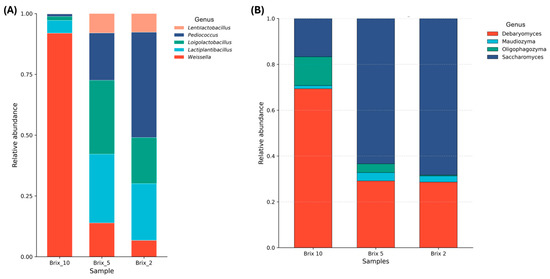
For taxon-focused visualization, the abundant bacterial genera Weissella, Pediococcus, Lactiplantibacillus, Loigolactobacillus, and Lentilactobacillus were selected, together with the abundant fungal genera Saccharomyces, Debaryomyces, Maudiozyma, and Oligophagozyma (Figure 5). The bacterial selection captured the transition from the Weissella-dominated initial composite toward increased representation of Pediococcus, Lactiplantibacillus, and Loigolactobacillus. The fungal selection captured the increasing predominance of Saccharomyces and persistence of Debaryomyces and Maudiozyma.
Figure 5.
Relative abundance (%) of microbial genera selected for taxon-focused functional visualization across the three fermentation stages. (A) Selected bacterial genera; (B) selected fungal genera. Values represent the pooled composite sample analyzed at each fermentation stage.
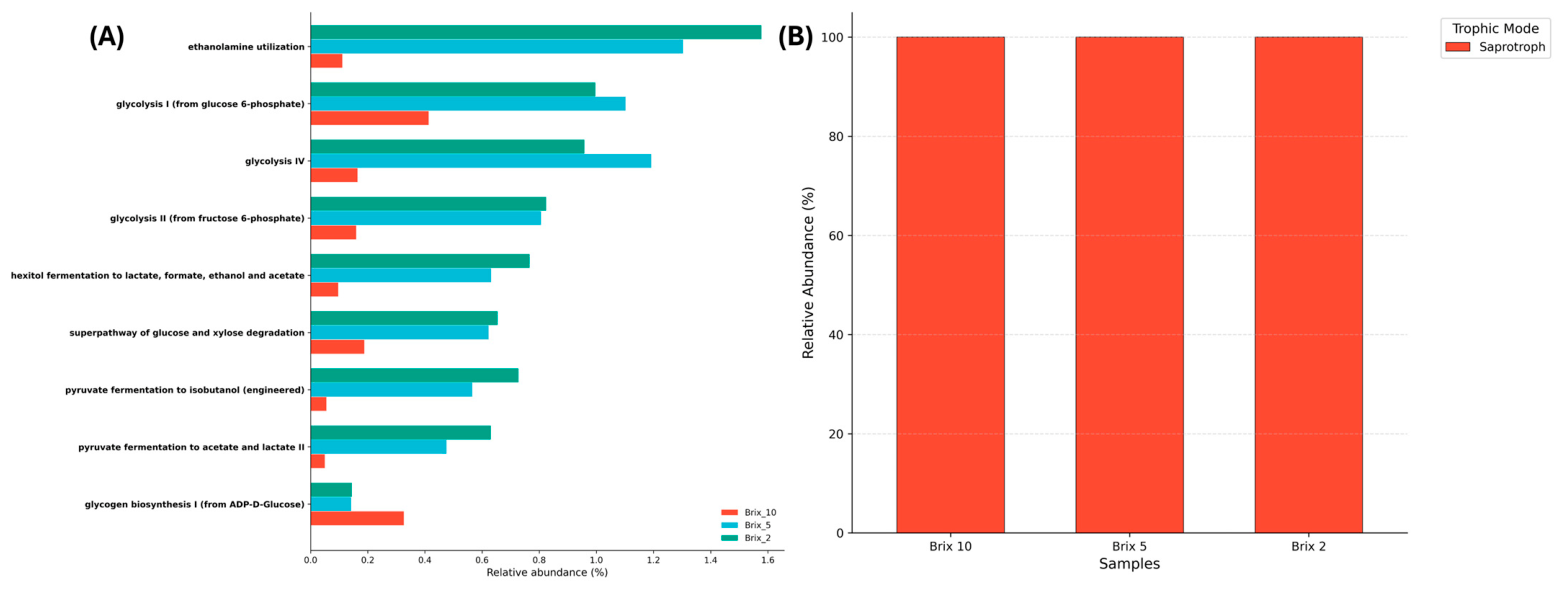
Taxon-stratified PICRUSt2 outputs indicated low predicted contributions at 10 °Brix and higher contributions at the later stages for ethanolamine utilization, glycolysis I, II, and IV, hexitol fermentation to lactate, formate, ethanol, and acetate, the glucose and xylose degradation superpathway, pyruvate fermentation to isobutanol, and pyruvate fermentation to acetate and lactate II (Figure 6A). Glycogen biosynthesis showed the opposite descriptive pattern, with a greater predicted contribution in the initial composite. The FUNGuild summary for the selected fungi was dominated by the saprotrophic trophic mode across stages (Figure 6B).
Figure 6.
Predicted functional profiles associated with abundant microbial genera. (A) Taxon-stratified relative contributions to selected bacterial pathways predicted with PICRUSt2; (B) fungal trophic-mode assignments for the selected fungal genera. Predicted values do not constitute measurements of pathway activity.
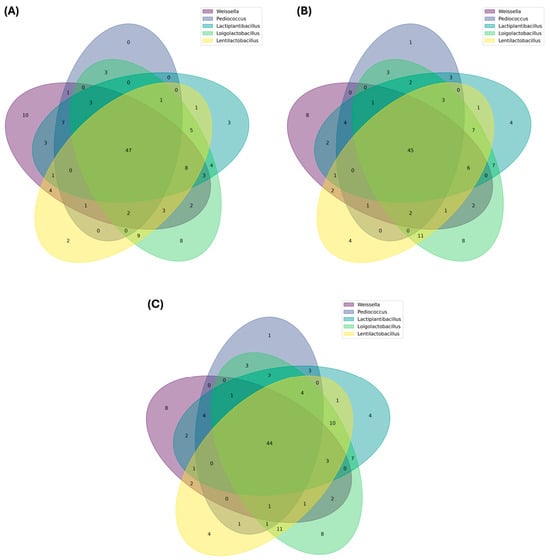
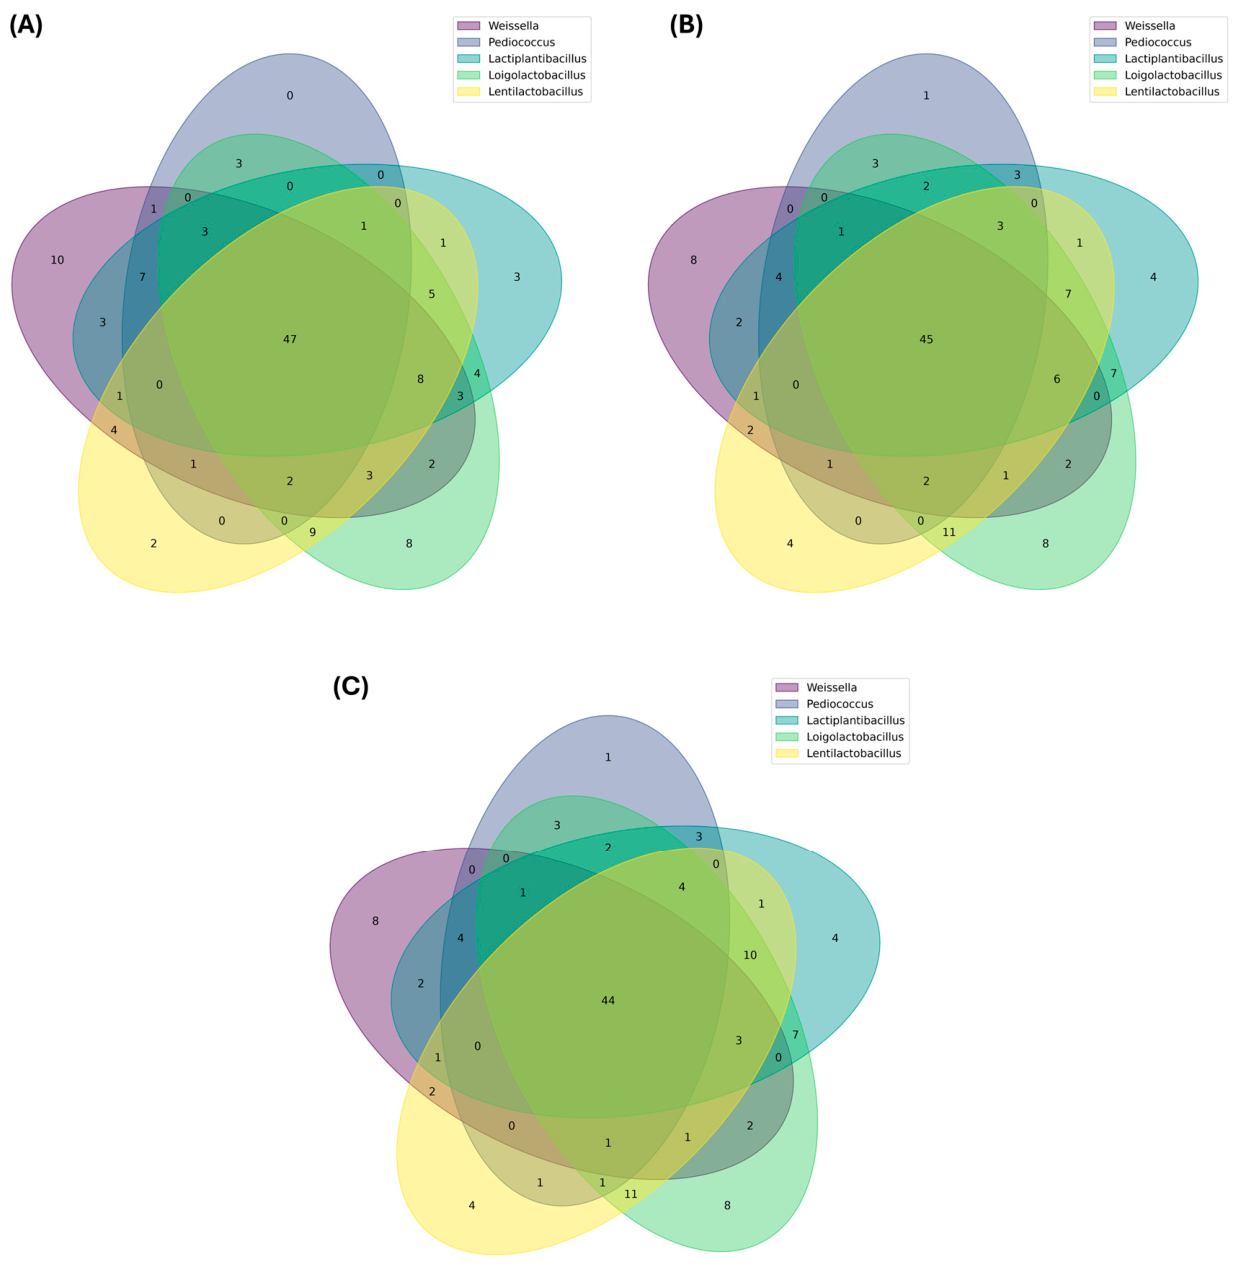
The selected bacterial genera shared 47 predicted pathways at 10 °Brix, 45 at 5 °Brix, and 44 at 2 °Brix (Figure 7). At 10 °Brix, the numbers of pathways assigned only to a single displayed genus were 10 for Weissella, 0 for Pediococcus, 3 for Lactiplantibacillus, 8 for Loigolactobacillus, and 2 for Lentilactobacillus. At 5 °Brix, the corresponding values were 8, 1, 4, 8, and 4, respectively. The same genus-specific counts were observed at 2 °Brix as at 5 °Brix. The large overlap indicates similarity among the predicted pathway sets, but functional redundancy cannot be confirmed without genomic, transcriptomic, or experimental validation.
Figure 7.
Overlap among pathways predicted for the abundant bacterial genera: (A) 10 °Brix; (B) 5 °Brix; and (C) 2 °Brix. Intersections show shared predicted pathway annotations, whereas non-overlapping areas show annotations assigned to one displayed genus.
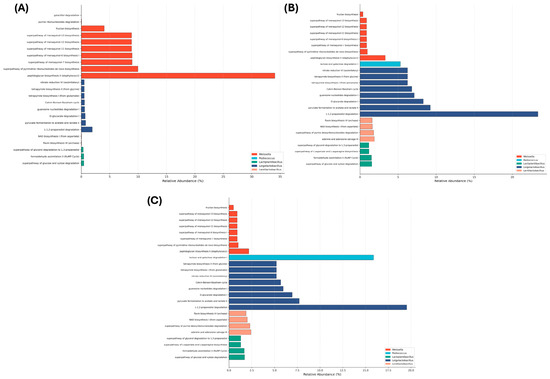
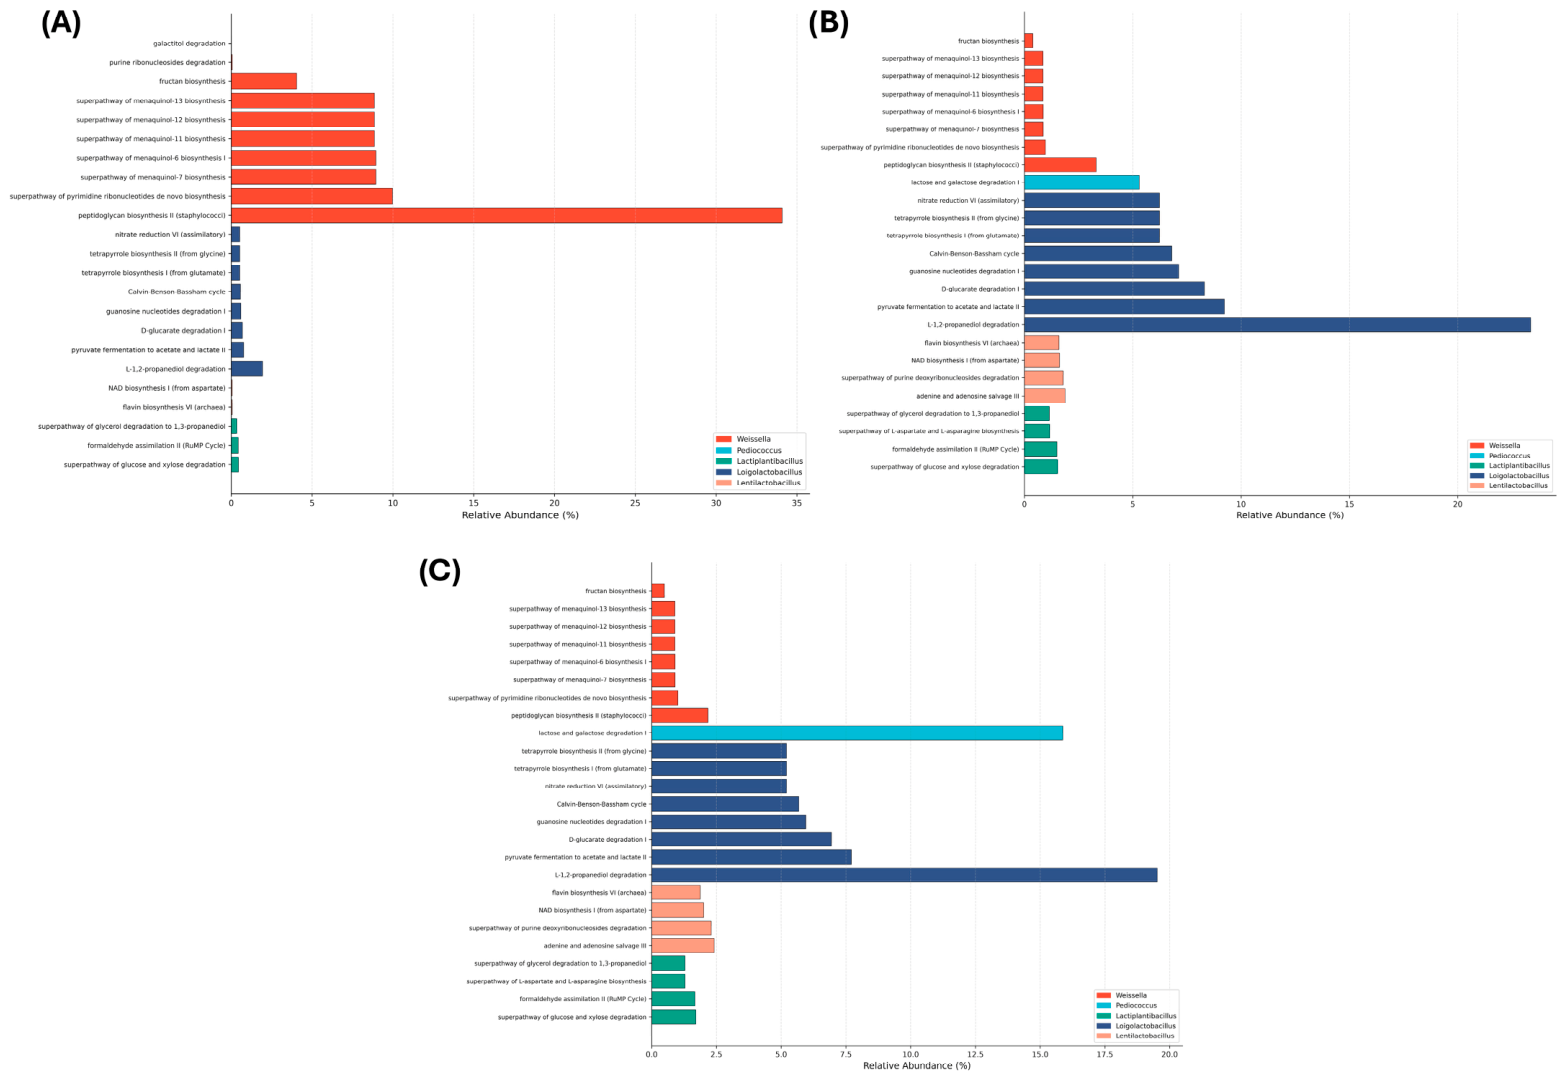
At 10 °Brix, Weissella showed the largest predicted contributions to pathways including fructan biosynthesis, menaquinol biosynthesis, de novo pyrimidine ribonucleotide biosynthesis, and peptidoglycan II biosynthesis (Figure 8A). At 5 °Brix, Loigolactobacillus contributed prominently to predicted nitrate reduction VI, tetrapyrrole biosynthesis, the Calvin–Benson–Bassham cycle, guanosine nucleotide degradation I, D-glucarate degradation I, pyruvate fermentation to acetate and lactate II, and L-1,2-propanediol degradation (Figure 8B). Pediococcus also contributed to the predicted lactose and galactose degradation I pathway. At 2 °Brix, Loigolactobacillus and Pediococcus remained prominent contributors, with additional predicted contributions from Lentilactobacillus and Lactiplantibacillus (Figure 8C). These results describe model-based taxonomic contributions and should not be interpreted as evidence that one genus was metabolically more active than another.
Figure 8.
Taxon-specific contributions to selected bacterial pathways predicted with PICRUSt2: (A) 10 °Brix; (B) 5 °Brix; and (C) 2 °Brix. Bar lengths represent predicted relative contributions, not experimentally measured pathway activity.
3.7. Integrated Visualization of Community Turnover
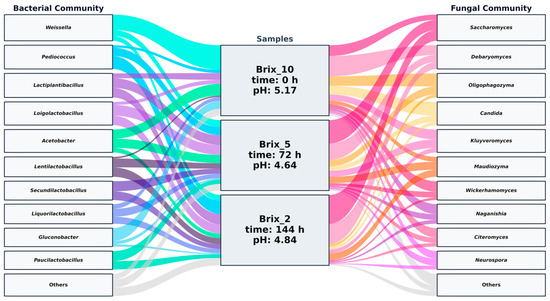
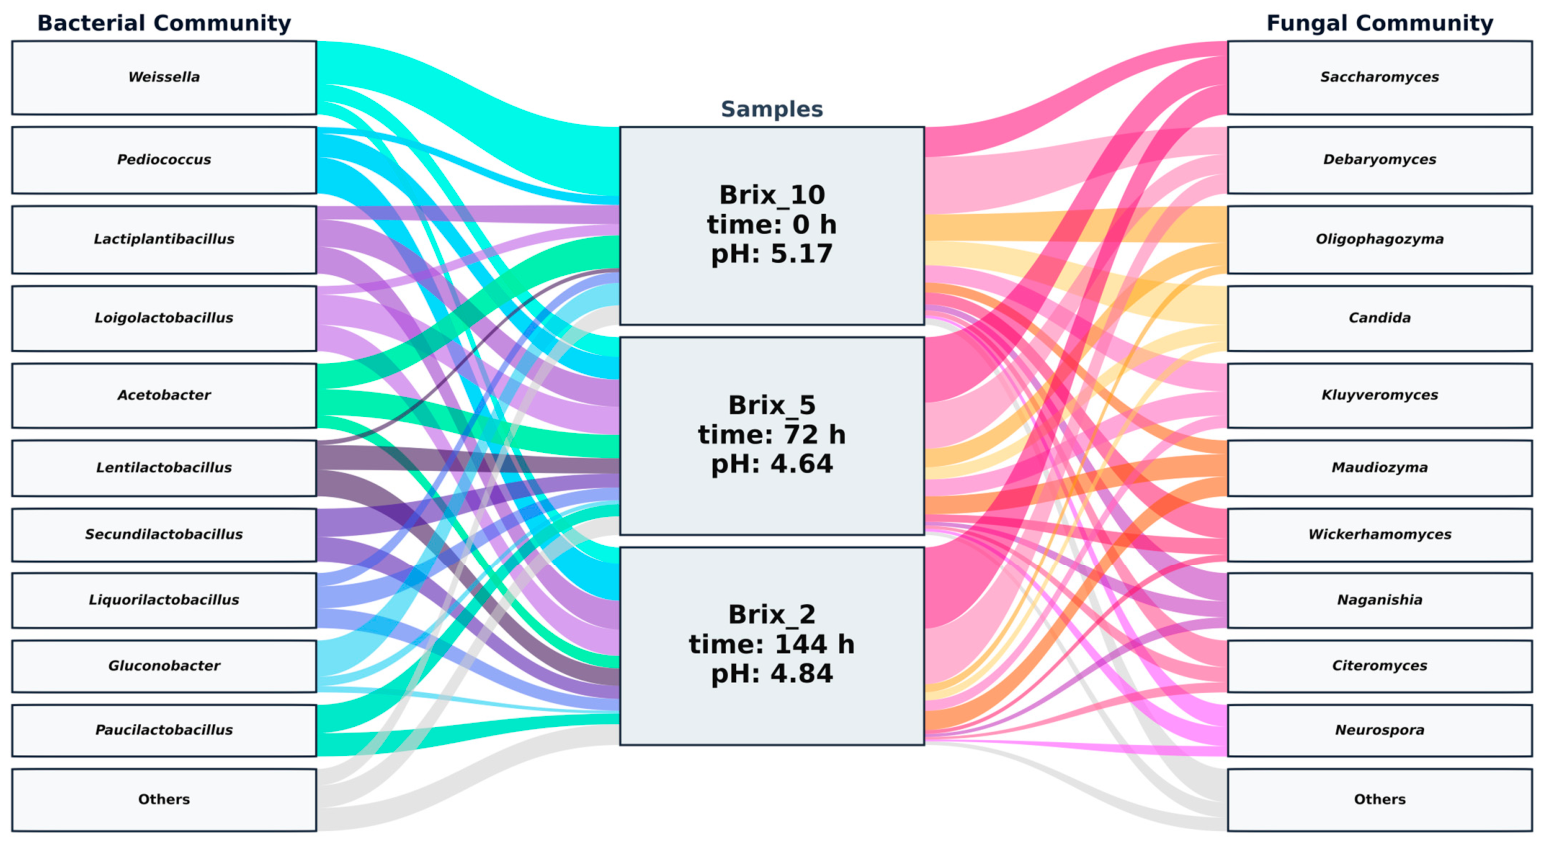
A Sankey diagram was used to integrate the relative abundances of the selected bacterial and fungal genera with the three sampling stages (Figure 9). The diagram summarizes the decline of initially abundant bacterial genera such as Weissella and the greater representation of Pediococcus, Lactiplantibacillus, and Loigolactobacillus at later stages. On the fungal side, the visualization shows increasing dominance of Saccharomyces and the persistence of Debaryomyces and Maudiozyma. Because the diagram is based on relative abundance from pooled samples, the bands should be interpreted as a compositional summary and not as evidence of direct interactions, migration, or causal taxonomic replacement.
Figure 9.
Sankey representation of bacterial and fungal relative abundances across the three fermentation stages. Band widths depict relative abundance associated with each pooled stage-specific sample. The visualization does not establish direct microbial interactions or causal ecological replacement.
4. Discussion
This exploratory amplicon survey described coordinated changes in bacterial and fungal relative abundance during a spontaneous A. cupreata must fermentation. The bacterial profile shifted from an initially uneven community dominated by Weissella toward a more even assemblage containing multiple LAB genera, whereas the fungal profile became progressively concentrated in Saccharomyces, Debaryomyces, and Maudiozyma. These compositional changes occurred while soluble solids declined from 10 to 2 °Brix and pH remained moderately acidic. The results are consistent with the concept that spontaneous beverage fermentations undergo environmental filtering as available substrates and fermentation-associated stresses change [8,24,25]. Nevertheless, the pooling design means that the observed profiles represent three snapshots of one fermentation process.
The increased relative abundance of Pediococcus, Lactiplantibacillus, and Loigolactobacillus in the intermediate and final composites is compatible with the capacity of LAB to persist under acidic, nutrient-limited, and metabolically stressful conditions. Members of Pediococcus can contribute organic acids and other metabolites in fermented foods and may tolerate several fermentation-associated stresses [26]. Lactiplantibacillus is widely associated with plant-based fermentations and has been studied for its contributions to acidification, stability, and sensory development [27]. Reports from other fermented substrates also indicate that Loigolactobacillus can become abundant under fermentation conditions [28]. In the present study, however, taxonomic resolution was primarily at the genus level, and no strains were isolated; species-specific technological traits therefore cannot be assigned to the detected ASVs.
The fungal transition was characterized by increasing relative abundance of Saccharomyces and persistence of Debaryomyces. Saccharomyces cerevisiae frequently becomes dominant in alcoholic fermentations as ethanol accumulates and fermentable sugars decline, although the current marker region and taxonomic analysis do not justify assigning all Saccharomyces reads to that species [29]. Mixed LAB-yeast communities can generate metabolic interactions that influence acidification and volatile-compound production, as demonstrated in co-culture systems and other traditional beverages [30,31]. The co-occurrence reported here is therefore biologically plausible, but the study did not measure microbial interactions, ethanol concentration, volatile compounds, or sensory properties.
Bacterial Shannon and Simpson values were greater in the 5 and 2 °Brix composites than in the initial composite, while fungal Shannon and Chao1 values declined. Similar studies of mezcal and other spontaneous fermentations have reported stage-dependent changes in diversity and the emergence of dominant bacterial or fungal groups [32,33]. In this manuscript, the PCoA provides a useful visualization of the three compositions but cannot support a statistical claim of temporal separation because there was one pooled sample per stage. Accordingly, terms such as “succession” and “turnover” are used descriptively to refer to changes in relative abundance across the sampled stages.
The PICRUSt2 output emphasized predicted carbohydrate-degradation and fermentation pathways, including glycolysis and routes associated with glucose, xylose, pyruvate, and ethanolamine metabolism. Such functions are compatible with the metabolic requirements of microorganisms growing in a carbohydrate-rich plant substrate [34,35,36,37]. The predicted contributions assigned to Weissella, Pediococcus, and other LAB also overlap with pathways previously described in cultured representatives, including exopolysaccharide synthesis, menaquinone-related functions, nucleotide metabolism, riboflavin biosynthesis, and purine transformation [38,39,40,41,42,43]. These comparisons support the biological plausibility of the predictions, but they do not verify that the pathways were present in the exact strains detected, expressed during fermentation, or responsible for the chemical composition of the must.
FUNGuild classified many detected fungi as saprotrophic or within mixed trophic categories. Saprotrophic assignments are consistent with fungal growth on cooked plant material; however, FUNGuild was developed primarily from ecological literature, and assignments can be uncertain or context dependent [13]. In a fermentation matrix, trophic-mode labels should therefore be viewed as broad annotations rather than direct functional measurements. Reporting the confidence category for each assignment is essential for assessing the reliability of this analysis.
The principal limitation was the lack of biological replication. Samples from two vats and three vertical positions were pooled into one composite per stage, preventing evaluation of spatial heterogeneity, between-vat variation, or statistically supported temporal effects. Additional limitations include primer and PCR bias, the compositional nature of relative-abundance data, incomplete species-level resolution, and the absence of absolute microbial quantification. Functional analyses were predictions based on marker-gene data and were not validated by shotgun metagenomics, metatranscriptomics, metabolomics, enzyme assays, or targeted chemical measurements.
Future studies should retain independent vat-level samples, include several production batches, incorporate extraction and PCR controls, quantify microbial loads, and measure the levels of ethanol, organic acids, sugars, and volatile compounds. Isolating the dominant LAB and yeasts would allow direct testing of their fermentation performance, stress tolerance, metabolite production, and compatibility in defined consortia. Such experiments are required before the detected genera can be proposed as validated starter culture components or used to standardize ancestral mezcal production.
5. Conclusions
This study described changes in bacterial and fungal community composition during spontaneous fermentation of A. cupreata must. The bacterial profile shifted from an initially Weissella-dominated community toward greater relative abundances of Pediococcus, Lactiplantibacillus, and Loigolactobacillus. The fungal community became increasingly dominated by Saccharomyces, Debaryomyces, and Maudiozyma. PICRUSt2 predicted functions mainly related to carbohydrate degradation and fermentation, whereas FUNGuild assignments were predominantly saprotrophic at the later stages. Because one pooled sample was analyzed per stage, these findings should be interpreted as descriptive and hypothesis-generating. Replicated studies are required to validate the observed microbial and predicted functional patterns.
Supplementary Materials
The following supporting information can be downloaded at https://www.mdpi.com/article/10.3390/fermentation12090405/s1, Figure S1: Relative abundance of bacterial and fungal communities at the phylum level during spontaneous A. cupreata must fermentation. (A) Bacterial phyla detected using 16S rRNA gene amplicon sequencing; (B) fungal phyla detected using ITS1 amplicon sequencing. One pooled composite sample was analyzed at each fermentation stage; therefore, the displayed values are descriptive; Table S1: Sequence-processing statistics for bacterial 16S rRNA gene amplicons; Table S2: Sequence-processing statistics for fungal ITS1 amplicons.
Author Contributions
Conceptualization, C.A.-R., N.X.M.-G. and J.T.-J.; methodology, C.A.-R., A.P.-H., R.R.-R., D.I.O.-D. and N.C.-A.; software, C.A.-R., R.R.-R. and A.P.-H.; validation, C.A.-R., D.I.O.-D. and J.T.-J.; formal analysis, A.R.-P., N.X.M.-G., R.R.-R. and V.I.M.-S.; investigation, C.A.-R. and J.T.-J.; resources, J.T.-J. and N.X.M.-G.; data curation, A.R.-P. and A.P.-H.; writing—original draft preparation, C.A.-R., Y.R.-R. and J.T.-J.; writing—review and editing, C.A.-R., Y.R.-R. and J.T.-J.; visualization, C.A.-R. and A.P.-H.; supervision, N.X.M.-G. and J.T.-J.; project administration, J.T.-J. All authors have read and agreed to the published version of the manuscript.
Funding
C.A.-R. received a scholarship from Mexico’s Secretaría de Ciencia, Humanidades, Tecnología e Innovación (SECIHTI).
Institutional Review Board Statement
Not applicable.
Informed Consent Statement
Not applicable.
Data Availability Statement
All raw sequencing reads have been deposited in the NCBI Sequence Read Archive (SRA) under BioProject accession number PRJNA1498234.
Acknowledgments
The authors thank Amairany Carrasco-López for assistance during the ancestral mezcal fermentation process.
Conflicts of Interest
The authors declare no conflicts of interest.
Abbreviations
The following abbreviations are used in this manuscript:
| ASV | Amplicon sequence variant |
| ITS | Internal transcribed spacer |
| LAB | Lactic acid bacteria |
| PCoA | Principal coordinate analysis |
| PICRUSt2 | Phylogenetic Investigation of Communities by Reconstruction of Unobserved States 2 |
| SRA | Sequence Read Archive |
References
- Consejo Regulador del Mezcal (COMERCAM). Informe Estadístico, 2026. Available online: https://comercam-dom.org.mx/wp-content/uploads/2026/05/INFORME-2026_VERSION-PUBLICA.pdf (accessed on 20 June 2026).
- López-Cruz, J.Y.; Martínez-Gutiérrez, G.A.; Caballero-García, A. Diagnóstico de la Situación del Agave-Mezcal y Opciones de Desarrollo Local en Comunidades Indígenas de Oaxaca. Asociación Mexicana de Ciencias Para el Desarrollo Regional, A.C.; Universidad Nacional Autonoma de Mexico: Mexico City, México, 2016; ISBN 978-607-96649-2-3. [Google Scholar]
- Rodríguez-Peralta, C.M.; Pardo-Núñez, J.; Aldrete-González, A.P. El entorno competitivo del mezcal: La estrategia de las grandes compañías de bebidas espirituosas frente a los pequeños productores de mezcal. Rev. Desarro. Económico 2019, 6, 17–30. [Google Scholar] [CrossRef] [Scilit]
- Secretaría de Economía. Norma Oficial Mexicana NOM-070-SCFI-2016, Bebidas Alcohólicas-Mezcal-Especificaciones. Diario Oficial de la Federación. Available online: https://dof.gob.mx/nota_detalle.php?codigo=5472787&fecha=23/02/2017#gsc.tab=0 (accessed on 20 June 2026).
- Ávila-Reyes, S.V.; Jiménez-Aparicio, A.R.; Melgar-Lalanne, G.; Fajardo-Espinoza, F.S.; Hernández-Sánchez, H. Mezcal: A Review of Chemistry, Processing, and Potential Health Benefits. Foods 2025, 14, 1408. [Google Scholar] [CrossRef] [Scilit]
- Terán-Bustamante, A.; Leyva-Hernández, S.N.; Martínez-Velasco, A. Knowledge and Innovation Management Model in the Mezcal Industry in Mexico. Heliyon 2025, 11, e42032. [Google Scholar] [CrossRef] [Scilit]
- Espinoza-Martinez, V.A.; Alvarez-Gutierrez, P.E.; de Jesus Palma-Cruz, F.; Enriquez-Valencia, R.; Ramirez-Lopez, M.P.; Lopez-Sanchez, C.; Vazquez-Lopez, H.G. Influence of the Biotechnological Process of Mezcal Fermentation on Yeast Diversity in Four Palenques of Oaxaca, Mexico. Beverages 2023, 9, 99. [Google Scholar] [CrossRef] [Scilit]
- Becerra-Lucio, P.A.; Diego-García, E.; Guillén-Navarro, K.; Peña-Ramírez, Y.J. Unveiling the Microbial Ecology behind Mezcal: A Spirit Drink with a Growing Global Demand. Fermentation 2022, 8, 662. [Google Scholar] [CrossRef] [Scilit]
- de los Ángeles Garibay Marcelo, M. Caracterización de la Diversidad de Levaduras Presentes Durante el Proceso de Fermentación del Mezcal en el Estado de Guerrero; Universidad Autónoma de Guerrero: Chilpancingo de los Bravo, México, 2019. [Google Scholar]
- López-Aguilar, R.; Zuleta-Prada, H.; Hernández-Montes, A.; Herbert-Pucheta, J.E. Comparative NMR Metabolomics Profiling between Mexican Ancestral & Artisanal Mezcals and Industrialized Wines to Discriminate Geographical Origins, Agave Species or Grape Varieties and Manufacturing Processes as a Function of Their Quality Attributes. Foods 2021, 10, 157. [Google Scholar] [CrossRef] [Scilit]
- Kusuma, S.A.F.; Barliana, M.I.; Gatera, V.A.; Fadhlillah, M.; Rubianti, R.; Rukayadi, Y. Fermented Food-Derived Antimicrobial Peptides: Indonesian Traditional Fermented Foods as an Evidence Base for the Stability–Potency Paradox. J. Funct. Foods 2026, 143, 107420. [Google Scholar] [CrossRef] [Scilit]
- Lu, Y.; Liu, Y.; Lv, J.; Ma, Y.; Guan, X. Changes in the Physicochemical Components, Polyphenol Profile, and Flavor of Persimmon Wine during Spontaneous and Inoculated Fermentation. Food Sci. Nutr. 2020, 8, 2728–2738. [Google Scholar] [CrossRef] [Scilit]
- Nguyen, N.H.; Song, Z.; Bates, S.T.; Branco, S.; Tedersoo, L.; Menke, J.; Schilling, J.S.; Kennedy, P.G. FUNGuild: An Open Annotation Tool for Parsing Fungal Community Datasets by Ecological Guild. Fungal Ecol. 2016, 20, 241–248. [Google Scholar] [CrossRef] [Scilit]
- Douglas, G.M.; Maffei, V.J.; Zaneveld, J.R.; Yurgel, S.N.; Brown, J.R.; Taylor, C.M.; Huttenhower, C.; Langille, M.G.I. PICRUSt2 for Prediction of Metagenome Functions. Nat. Biotechnol. 2020, 38, 685–688. [Google Scholar] [CrossRef] [Scilit] [PubMed]
- Klindworth, A.; Pruesse, E.; Schweer, T.; Peplies, J.; Quast, C.; Horn, M.; Glöckner, F.O. Evaluation of General 16S Ribosomal RNA Gene PCR Primers for Classical and Next-Generation Sequencing-Based Diversity Studies. Nucleic Acids Res. 2013, 41, e1. [Google Scholar] [CrossRef] [Scilit]
- Gardes, M.; Bruns, T.D. ITS Primers with Enhanced Specificity for Basidiomycetes--Application to the Identification of Mycorrhizae and Rusts. Mol. Ecol. 1993, 2, 113–118. [Google Scholar] [CrossRef] [Scilit]
- White, T.J.; Bruns, T.; Lee, S.; Taylor, J. Amplification and direct sequencing of fungal ribosomal RNA genes for phylogenetics. In PCR Protocols: A Guide to Methods and Applications; Innis, M.A., Gelfand, D.H., Sninsky, J.J., White, T.J., Eds.; Academic Press: San Diego, CA, USA, 1990; pp. 315–322. [Google Scholar]
- Bolyen, E.; Rideout, J.R.; Dillon, M.R.; Bokulich, N.A.; Abnet, C.C.; Al-Ghalith, G.A.; Alexander, H.; Alm, E.J.; Arumugam, M.; Asnicar, F.; et al. Reproducible, Interactive, Scalable and Extensible Microbiome Data Science Using QIIME 2. Nat. Biotechnol. 2019, 37, 852–857. [Google Scholar] [CrossRef] [Scilit] [PubMed]
- Callahan, B.J.; McMurdie, P.J.; Rosen, M.J.; Han, A.W.; Johnson, A.J.A.; Holmes, S.P. DADA2: High-Resolution Sample Inference from Illumina Amplicon Data. Nat. Methods 2016, 13, 581–583. [Google Scholar] [CrossRef] [Scilit] [PubMed]
- Bokulich, N.A.; Kaehler, B.D.; Rideout, J.R.; Dillon, M.; Bolyen, E.; Knight, R.; Huttley, G.A.; Gregory Caporaso, J. Optimizing Taxonomic Classification of Marker-Gene Amplicon Sequences with QIIME 2’s Q2-Feature-Classifier Plugin. Microbiome 2018, 6, 90. [Google Scholar] [CrossRef] [Scilit]
- Abarenkov, K.; Nilsson, R.H.; Larsson, K.-H.; Taylor, A.F.S.; May, T.W.; Frøslev, T.G.; Pawlowska, J.; Lindahl, B.; Põldmaa, K.; Truong, C.; et al. The UNITE Database for Molecular Identification and Taxonomic Communication of Fungi and Other Eukaryotes: Sequences, Taxa and Classifications Reconsidered. Nucleic Acids Res. 2024, 52, D791–D797. [Google Scholar] [CrossRef] [Scilit]
- Albuquerque, A.; Patanita, M.; Ribeiro, J.A.; Campos, M.D.; Santos, F.; Monteiro, T.; Basaloco, M.; do Rosário Félix, M. Metabarcoding Analysis Reveals Microbial Diversity and Potential Soilborne Pathogens Associated with Almond Dieback and Decline. Plants 2025, 14, 2309. [Google Scholar] [CrossRef] [Scilit]
- Kanehisa, M.; Furumichi, M.; Sato, Y.; Kawashima, M.; Ishiguro-Watanabe, M. KEGG for Taxonomy-Based Analysis of Pathways and Genomes. Nucleic Acids Res. 2023, 51, D587–D592. [Google Scholar] [CrossRef] [Scilit]
- Huang, R.; Fang, Y.; Zhong, Y.; Wang, D.; Lu, W.; Zhao, H.; Deng, Y. Advancing Fermentation Science: Microbial Dynamics, Metabolomics, and Safety in Fermented Vegetables. J. Future Foods 2026, 6, 780–795. [Google Scholar] [CrossRef] [Scilit]
- Park, I.; Mannaa, M. Fermented Foods as Functional Systems: Microbial Communities and Metabolites Influencing Gut Health and Systemic Outcomes. Foods 2025, 14, 2292. [Google Scholar] [CrossRef] [Scilit]
- Zhang, Y.; Kaushik, N.; Park, P.; Liu, R.; Liu, Y. Pediococcus Pentosaceus in Fermented Foods: Probiotic Properties and a Multi-Omics Framework for Applications. Trends Food Sci. Technol. 2025, 163, 105187. [Google Scholar] [CrossRef] [Scilit]
- Lin, M.; Lin, S.; He, H.; Yu, Y.; Hu, J.; Zhou, L. Lactiplantibacillus Plantarum in Fermented Beverages: Properties, Mechanisms, and Future Prospects. J. Funct. Foods 2025, 129, 106864. [Google Scholar] [CrossRef] [Scilit]
- Yang, H.; Wang, B.; Zhang, Q.; Cheng, H.; Yu, Z. Improvement of Fermentation Quality in the Fermented Total Mixed Ration with Oat Silage. Microorganisms 2021, 9, 420. [Google Scholar] [CrossRef] [Scilit]
- Zavala-Díaz de la Serna, F.J.; Contreras-López, R.; Lerma-Torres, L.P.; Ruiz-Terán, F.; Rocha-Gutiérrez, B.A.; Pérez-Vega, S.B.; Elías-Ogaz, L.R.; Salmerón, I. Understanding the Biosynthetic Changes That Give Origin to the Distinctive Flavor of Sotol: Microbial Identification and Analysis of the Volatile Metabolites Profiles During Sotol (Dasylirion sp.) Must Fermentation. Biomolecules 2020, 10, 1063. [Google Scholar] [CrossRef] [Scilit]
- Ferreira, I.; de Sousa Melo, D.; Menezes, A.G.T.; Fonseca, H.C.; de Assis, B.B.T.; Ramos, C.L.; Magnani, M.; Dias, D.R.; Schwan, R.F. Evaluation of Potentially Probiotic Yeasts and Lactiplantibacillus Plantarum in Co-Culture for the Elaboration of a Functional Plant-Based Fermented Beverage. Food Res. Int. 2022, 160, 111697. [Google Scholar] [CrossRef] [Scilit]
- Chen, C.; Xiong, Y.; Xie, Y.; Zhang, H.; Jiang, K.; Pang, X.-N.; Huang, M. Metabolic Characteristics of Lactic Acid Bacteria and Interaction with Yeast Isolated from Light-Flavor Baijiu Fermentation. Food Biosci. 2022, 50, 102102. [Google Scholar] [CrossRef] [Scilit]
- Becerra-Lucio, P.A.; Pérez-Rueda, E.; Dias, G.M.; Labrín-Sotomayor, N.Y.; Mendoza-Mendoza, A.; Partida-Martínez, L.P.; Zarza, E.; Peña-Ramírez, Y.J. Environmental Contributors to Bacterially Dominated Fermenting Consortia of Artisanal Mezcal. BMC Microbiol. 2026, 26, 730. [Google Scholar] [CrossRef] [Scilit]
- Lin, B.; Tang, J.; Li, Q.; Zhu, L.; Jiang, W.; Ke, H.; Wen, Z.; Liu, H.; Yang, S.; Yang, Q.; et al. Bacterial Community Improves the Volatile Components Coupled with Abiotic Factors during the Spontaneous Fermentation of Chinese Strong-Aroma Baijiu. Food Chem. X 2025, 25, 102068. [Google Scholar] [CrossRef] [Scilit]
- Rymuszka, A.; Gorczynska, W. Classical Food Fermentations as Modern Biotechnological Platforms: Alcoholic, Acetic, Butyric, Lactic and Propionic Pathways and Applications. Molecules 2026, 31, 333. [Google Scholar] [CrossRef] [Scilit]
- Zhang, K.; Chen, Y.; Song, T.; Li, X.L.; Xie, J. Simultaneous Utilization of Glucose and Xylose from Biomass Facilitate the Chain Elongation of Microbial Electrosynthesis. J. Environ. Chem. Eng. 2025, 13, 117600. [Google Scholar] [CrossRef] [Scilit]
- Kaval, K.G.; Garsin, D.A. Ethanolamine Utilization in Bacteria. mBio 2018, 9, e00066-18. [Google Scholar] [CrossRef] [Scilit]
- Bintsis, T. Lactic Acid Bacteria as Starter Cultures: An Update in Their Metabolism and Genetics. AIMS Microbiol. 2018, 4, 665–684. [Google Scholar] [CrossRef] [Scilit]
- Di Cagno, R.; De Angelis, M.; Limitone, A.; Minervini, F.; Carnevali, P.; Corsetti, A.; Gaenzle, M.; Ciati, R.; Gobbetti, M. Glucan and Fructan Production by Sourdough Weissella Cibaria and Lactobacillus Plantarum. J. Agric. Food Chem. 2006, 54, 9873–9881. [Google Scholar] [CrossRef] [Scilit]
- Li, X.; Wang, L. Genomic Insights into Dominant Lactic Acid Bacteria in Spoiled Plant-Based Meat Analogues. Curr. Res. Food Sci. 2026, 12, 101332. [Google Scholar] [CrossRef] [Scilit]
- Zhou, Q.; Zhao, C.; Li, X.; Wang, H.; Huang, Q.; Sun, Y.; Zhou, Y. Discovery of Lactic Acid Bacteria with High Nucleoside Degradation and Low Purine Production in Tomato Sour Soup. Int. J. Food Microbiol. 2025, 434, 111139. [Google Scholar] [CrossRef] [Scilit]
- Langa, S.; Peirotén, Á.; Rodríguez, S.; Calzada, J.; Prieto-Paredes, R.; Curiel, J.A.; Landete, J.M. Riboflavin Bio-Enrichment of Soy Beverage by Selected Roseoflavin-Resistant and Engineered Lactic Acid Bacteria. Int. J. Food Microbiol. 2024, 411, 110547. [Google Scholar] [CrossRef] [Scilit]
- Li, B.; Meng, X.; Liu, W. An Overview of Engineering Microbial Production of Nicotinamide Mononucleotide. J. Biotechnol. 2024, 396, 80–88. [Google Scholar] [CrossRef] [Scilit]
- Liu, Z.; Zou, X.-Y.; Yue, J.; Li, S.; Ou, X.; Huang, C.; Liu, C.-J.; Li, X.-R. Screening and Evaluation of Purines-Degrading Lactic Acid Bacteria Isolated from Traditional Fermented Foods in Yunnan Province and Their Uric Acid-Lowering Effects in Vivo. Front. Microbiol. 2025, 16, 1627956. [Google Scholar] [CrossRef] [Scilit]
Disclaimer/Publisher’s Note: The statements, opinions and data contained in all publications are solely those of the individual author(s) and contributor(s) and not of MDPI and/or the editor(s). MDPI and/or the editor(s) disclaim responsibility for any injury to people or property resulting from any ideas, methods, instructions or products referred to in the content. |
© 2026 by the authors. Licensee MDPI, Basel, Switzerland. This article is an open access article distributed under the terms and conditions of the Creative Commons Attribution (CC BY) license.