


Abstract
To address the limitations of conventional anaerobic digestion (AD), this study explored the integration of microbial electrolysis cells (MECs) with AD to improve biogas production and process stability. While AD is a proven technology for renewable energy recovery from waste, it can suffer from volatile fatty acid accumulation and reduced efficiency. The hybrid MEC–AD system leverages electro-methanogenesis to enhance methane yields and overall system performance. This research evaluated the effects of different electrode materials (graphite plate vs. graphite felt) and applied voltages (0.5 V and 0.7 V) on biogas output, methane content, and operational stability. Results showed that MEC–AD systems significantly outperformed conventional AD, with the highest biogas production reaching 239 ± 3 mL/gVS·d—an increase of up to 162% using graphite felt electrodes at 0.5 V. Internal resistance was also markedly lower with graphite felt (19 Ω/m2) compared to graphite plates (1120 Ω/m2). Furthermore, the pH of the MEC–AD system with graphite felt electrodes was maintained within the optimal range (6.8–7.0), avoiding the acidification seen in control systems. These findings underscore the promise of MEC–AD systems for advancing circular bio-economy initiatives and carbon neutrality. Further work is needed to refine electrode materials and reactor design for improved scalability and efficiency.
1. Introduction
Anaerobic digestion (AD) is a well-established technology for organic waste treatment, enabling renewable energy recovery in the form of methane while contributing to circular bio-economy and carbon neutrality goals [1]. However, conventional AD systems often suffer from limitations such as volatile fatty acid (VFA) accumulation, ammonia inhibition, reduced microbial activity at low temperatures, and suboptimal methane yields, particularly under high loading or low-strength wastewater conditions [2,3]. To overcome these challenges, the integration of microbial electrolysis cells (MECs) with AD has emerged as a promising strategy [4,5]. In AD–MEC systems, an externally applied voltage stimulates electro-methanogenesis by promoting hydrogen production at the cathode and enhancing direct interspecies electron transfer (DIET), thereby improving methane production efficiency [1,4]. Previous studies have reported methane yield enhancements ranging from 30–200% compared to conventional AD [6,7,8,9,10], along with increased methane purity due to in situ CO2 reduction, often exceeding 90% CH4 [11,12]. Additionally, MEC integration has been shown to mitigate VFA accumulation by facilitating the rapid conversion of intermediates such as propionate and butyrate, stabilizing pH and preventing process failure [2,13]. The improved electron transfer efficiency also supports more stable operation at low temperatures and under challenging loading conditions [2,5]. Despite these advantages, challenges related to reactor design, electrode durability, and scalability remain significant barriers to industrial implementation [1,2,14].
Among the various parameters influencing AD–MEC performance—such as hydraulic retention time (HRT), organic loading rate (OLR), reactor configuration, substrate type, and applied voltage—electrode design remains a critical yet insufficiently isolated variable [1,14]. In particular, the surface area-to-volume (S/V) ratio and electrode architecture strongly affect biofilm development, direct interspecies electron transfer (DIET), and overall methane production efficiency [11,15]. While many studies have demonstrated performance improvements in AD–MEC systems, most investigations focused primarily on methane yield enhancement rather than on the underlying electrochemical constraints governing system efficiency. Internal resistance, which comprises ohmic, charge transfer, and mass transfer components, directly determines electron flow and energy efficiency in microbial electrochemical systems [16]. However, the systematic evaluation of internal resistance under long-term semi-continuous AD-MEC operation remains limited.
To address this gap, the present study focused on the determination and comparison of internal resistance in AD–MEC systems equipped with graphite plate and graphite felt electrodes under identical operational conditions. By isolating electrode architecture as the principal variable, this work aims to clarify how structural differences influence electrochemical behavior, methane production, and process stability during extended operation. Linking internal resistance to reactor performance provides mechanistic insight essential for optimizing electrode selection and improving the scalability and energy efficiency of AD–MEC systems.
2. Materials and Methods
2.1. MEC–AD Fabrication and Setup
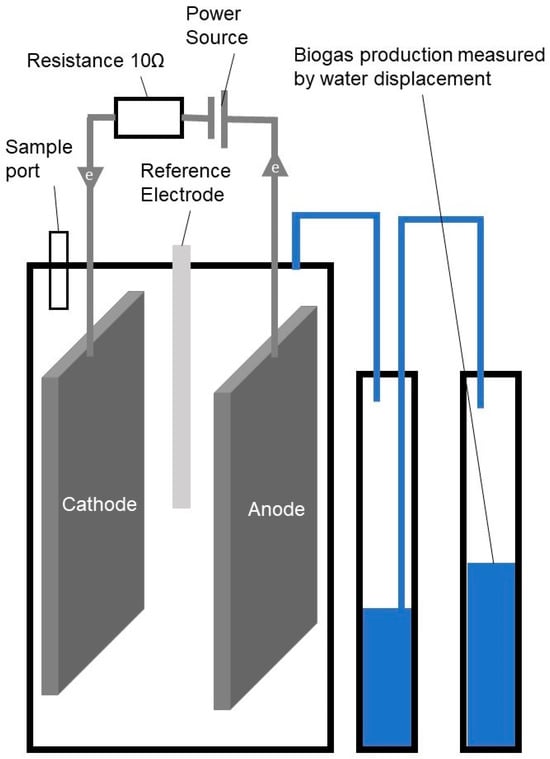
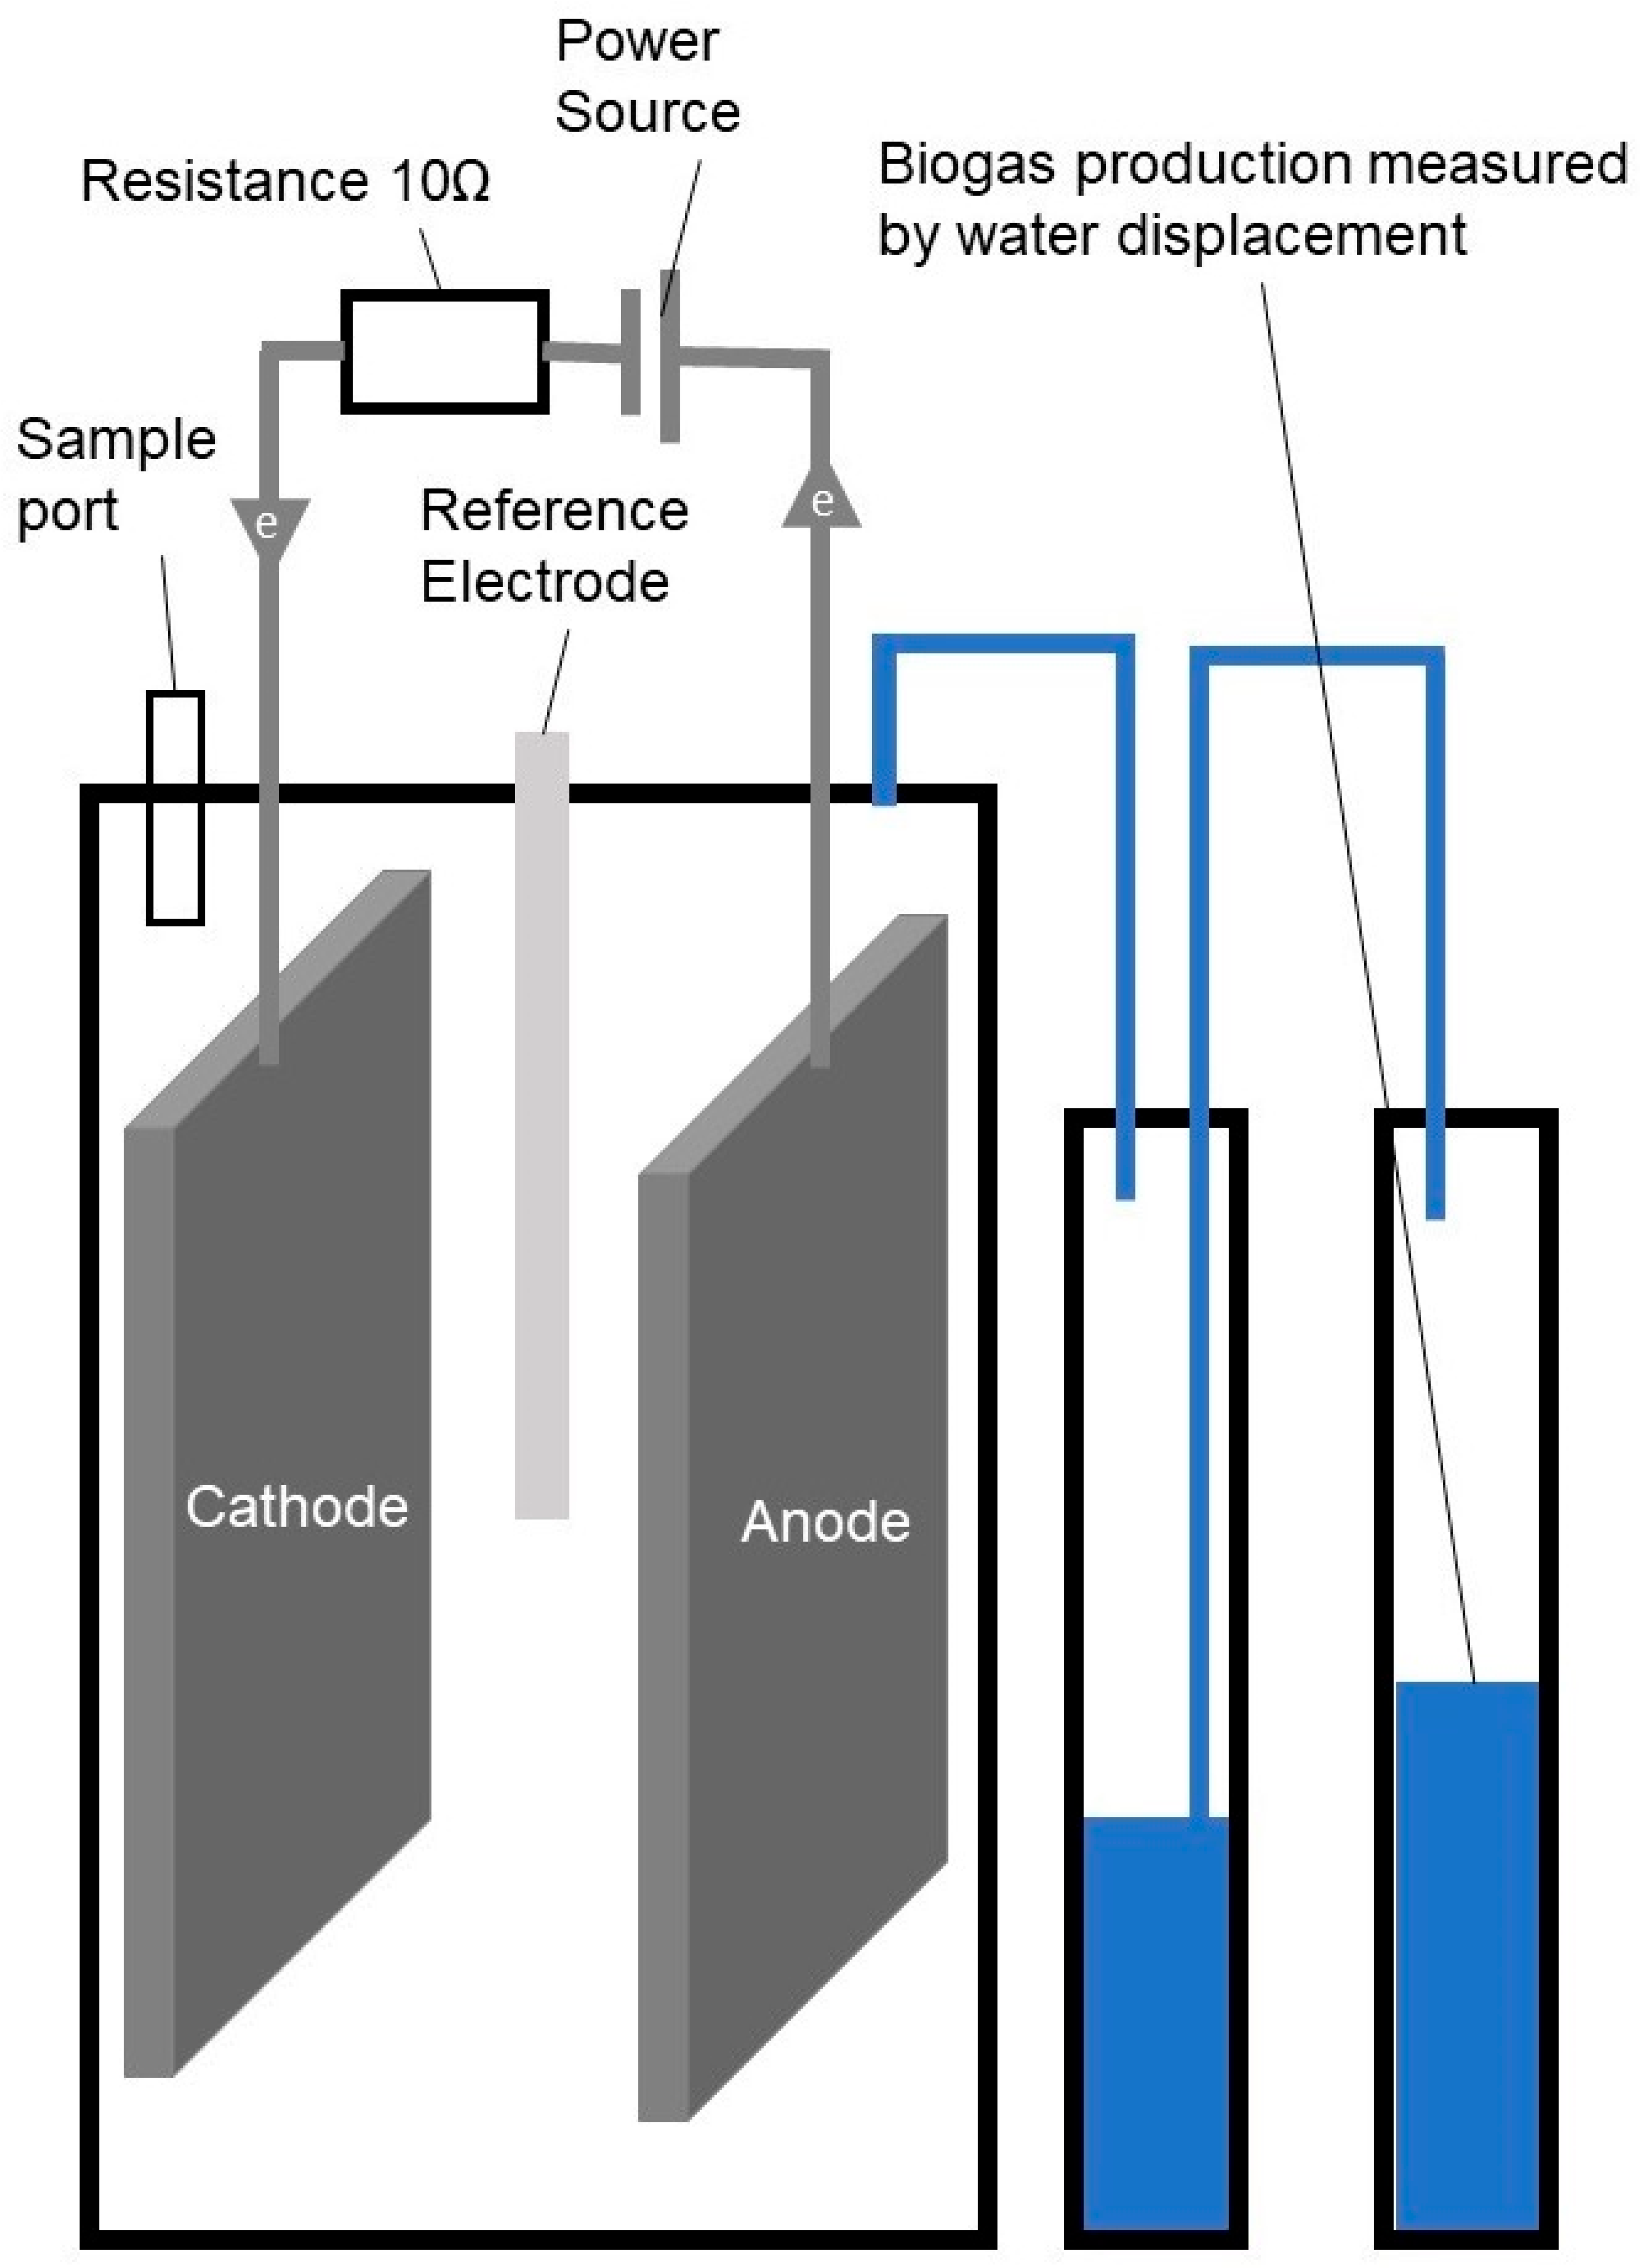
The experimental work was conducted to investigate the integration of AD with a MEC to enhance biogas production and energy efficiency during waste treatment. The anaerobic digestion reactor was constructed using a polyvinyl chloride (PVC) vessel, selected for its chemical resistance and durability under anaerobic conditions. The reactor featured an internal diameter of 10.3 cm, a height of 12.9 cm, and a total volume of 1074 cm3, providing adequate space for the integration of electrodes into the system. The use of PVC ensured the reactor’s stability and resistance to degradation during extended experimental periods. Two different types of electrodes were used: graphite plate (10.0 cm × 8.0 cm × 0.2 cm) and a graphite felt with the same dimensions. To support the electrodes in the PVC vessel, the electrodes were fixed to a graphite rod with a diameter of 1.0 cm and a length of 15.0 cm. A titanium wire (diameter 0.5 mm, length 15 cm) was used to conduct electrons between the electrodes and the external terminals. The resistance of the graphite plate electrode, with the titanium current collector, was 0.7 ± 0.3 Ω. The resistance of the graphite felt electrode, with the titanium current collector, was 0.4 ± 0.2 Ω. The cathode and anode were connected via copper wiring with a resistance of 10 Ω ± 1% (ARCOL HS50 10R F, ARCOL UK Limited, Truro, UK). Figure 1 shows a schematic representation of the experimental lab reactor.
Figure 1.
Schematic representation of the experimental single chamber MEC–AD continuous stirred tank reactor.
2.2. Operational Parameters and Experimental Design
The semi-continuous experiments were conducted over approximately a 100-day period with graphite plates and graphite felt as electrodes. Each experimental condition was performed in triplicate in a thermostatic room at 34 ± 1 °C with constant agitation (100 rpm). Samples were taken daily on working days. Graphite felt was use to increase the electrode surface area, thereby enhancing biocompatibility by providing a larger surface area where micro-organisms can attach and grow. The key objective was adapting biomass to MEC–AD conditions and to assess the influence of the presence of an electrode at open cell potential and different applied voltages (0.5 V, and 0.7 V) on gas production, gas composition, and system stability (pH and volatile solids (VS)). The results were analyzed in 2 periods, from day 30 to 64 phase 1, and from day 65 to 100 phase 2.
2.3. Graphite Plate Experiments
The reactors were operated in a semi-continuous mode. The liquid volume in the reactor was 900 mL Graphite plates were used as electrodes, and each condition was tested in duplicate. The control reactors operated as anaerobic digesters without electrodes. Two additional reactors were equipped with electrodes but did not have an external potential applied. The system was fed with glucose as the carbon source. In the adaptation phase and phase 1, the OLR was set at 1 g glucose/L/day, with a HRT of approximately 20 days. Each day, 45 mL of reactor content was removed and replaced with 45 mL of glucose solution (20 g/L). In phase 2, the OLR was increased to 2 g glucose/L/day, and the HRT was reduced to 10 days, involving daily removal and replenishment of 90 mL of reactor content. This increase in OLR and reduction in HRT were intentionally implemented to evaluate reactor robustness under stress conditions and were not intended for direct comparison with the graphite felt experiments.
2.4. Graphite Felt Experiments
In further experiments using graphite felt electrodes, each condition was tested in duplicate. The liquid volume in the reactor was reduced to 800 mL to accommodate the increased electrode volume. Control reactors without electrodes were also used, and an additional set of reactors with electrodes but no external potential was included. During the adaptation phase and phase 1, the OLR was set at 1 g glucose/L/day, with a 20-day HRT, requiring the removal and replacement of 40 mL of reactor content daily. Nutrients and P-buffer were added daily to replenish those removed during sampling. In contrast to the graphite plate experiments, the OLR was maintained at 1 g glucose/L/day throughout phase 2 to evaluate long-term operational stability rather than stress response.
2.5. Power Source and Potential Measurements
A direct current (DC) power supply (RS-3005D, RS-Pro, London, UK) was used to control the voltage applied to the MEC. The RS-3005D has an output voltage range of 0 V to 30 V, an output current range of 0 A to 5 A, and a maximum power rating of 150 W. It offers a voltage accuracy of ±0.5% (±20 mV) and a current accuracy of ±0.5% (±10 mA), ensuring reliability for sensitive electrochemical applications like microbial electrolysis. The anode and cathode potentials were measured using a silver/silver chloride (Ag/AgCl) reference electrode (QM710X, ProSense, Oosterhout, The Netherlands) with a potential of 0.197 V vs. the standard hydrogen electrode (SHE) at 25 °C. This reference electrode was selected for its stability in aqueous solutions. The reference electrode was connected to the reactor solution via a 3 M KCl salt bridge, consisting of a glass tube (10 cm long, 0.4 cm diameter) with a ceramic frit (QM715X/4X100/CF, ProSense, Oosterhout, The Netherlands).
2.6. Inoculum
Anaerobic sludge from the Valladolid municipal wastewater treatment plant in Spain was used as inoculum in the MEC–AD system (900 mL for the graphite plate experiment, and 800 mL for the graphite felt experiment). This sludge had a VS concentration of 14.8 gVS/L, providing a dense and active microbial community capable of both anaerobic digestion and electrochemical activities. Microorganisms in the sludge were responsible for breaking down organic matter, primarily glucose, to produce biogas and facilitate electron transfer in the MEC.
2.7. Biogas Production and Composition
Biogas production, consisting mainly of methane (CH4), carbon dioxide (CO2), and hydrogen (H2), was a key performance indicator of the MEC–AD system. The gas was collected in Tedlar gas sampling bags, chosen for their inert properties and ability to prevent gas permeation or contamination. Periodic gas samples were collected to monitor total gas volume and composition. The biogas composition was analyzed using a Varian CP-4900 Micro-GC chromatograph (Varian, Inc., Walnut Creek, CA, United States) equipped with a thermal conductivity detector. This instrument allowed for the precise quantification of hydrogen, methane, and carbon dioxide. The chromatographic analysis provided insights into how applied potentials influenced hydrogen production in the MEC and methane generation during anaerobic digestion.
2.8. Gas Production Measurement
Total biogas production was quantified by measuring the mass of water displaced during gas collection, a method based on the Archimedes’ principle. This approach provided an accurate and simple way to determine the total biogas volume produced during the experiment. Gas production data were collected at regular intervals to evaluate system performance.
2.9. pH and Electrode Potentials
The pH of the reactor was monitored daily using a Crison PH25 pH sensor (Crison Instruments, S.A., Alella, Spain), as pH is critical for both anaerobic digestion and electrochemical processes. Additionally, the electrical properties of the system, including cell, cathode and anode potentials, and the potential over the external resistance, were monitored daily using a PeakTech® P 3440 multimeter (PeakTech Prüf- und Messtechnik GmbH, Ahrensburg, Germany).
2.10. Nutrient Supplementation
To support microbial growth and maintain stable reactor conditions, nutrients and phosphate buffer (P-buffer) were added daily to replenish the nutrients and buffer removed during operation. The nutrient solution composition (in g/L) was: NH4Cl 170, KH2PO4 38, CaCl2·2H2O 8, MgSO4·4H2O 9, FeCl3·4H2O 2, CoCl2·6H2O 2, MnCl2·H2O 0.5, CuCl2·2H2O 0.03, ZnCl2 0.05, H3BO3 0.05, (NH4)6Mo7O24 0.09, Na2SeO3·5H2O 0.1, NiCl2·6H2O 0.05, EDTA 1, and Resorcinol 0.5, of which initially 1 mL was added. The initial buffer concentration was 10 mM of H2PO4−/HPO42−. Both the nutrient solution and buffer solution were added to the feed solution to replenish the amount of nutrients and buffer that were extracted.
2.11. Calculation of the Internal Resistance
From the measured potentials, the overpotential and the corresponding internal resistance of the cell can be determined. The overpotential (VO) is calculated as the difference between the sum of the cell potential and the potential across the resistance, and the difference between the anode and cathode potentials:
where:
is the overpotential (mV),
is the measured cell potential (mV),
is the potential measured across the external resistance (mV),
is the anode potential (mV),
is the cathode potential (mV).
The current flowing through the circuit is calculated using Ohm’s law, based on the voltage drop across the external resistance:
where:
is the current in the system (mA),
is the potential measured across the external resistance (mV),
is the external resistance (10 Ω).
The internal resistance of the setup is then calculated by dividing the overpotential by the current:
To analyze the different electrodes, the internal resistance is divided by the surface area of the electrode. For the graphite plate, the surface area was 0.008 m2; for the graphite felt, the surface area was assumed to be 0.5 m2/g [17], which was based on the mass of the graphite felt electrode (1.0 g), resulting in an area of 0.5 m2.
3. Results
3.1. Enhanced Biogas Production in MEC–AD Systems
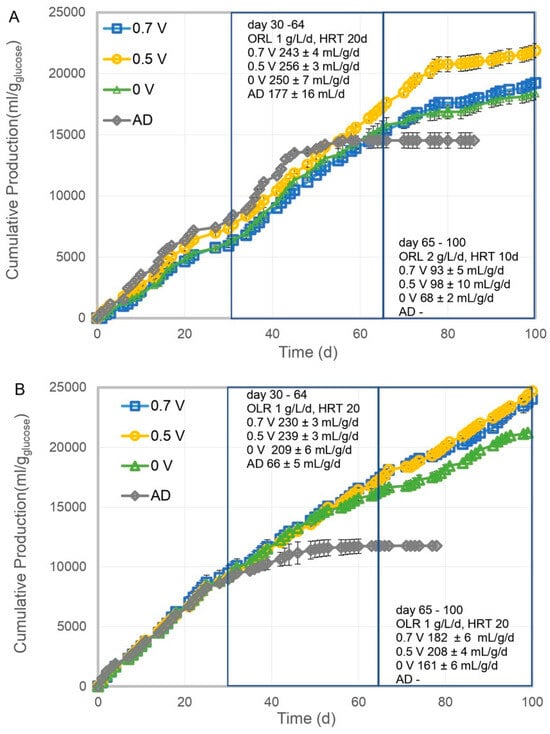
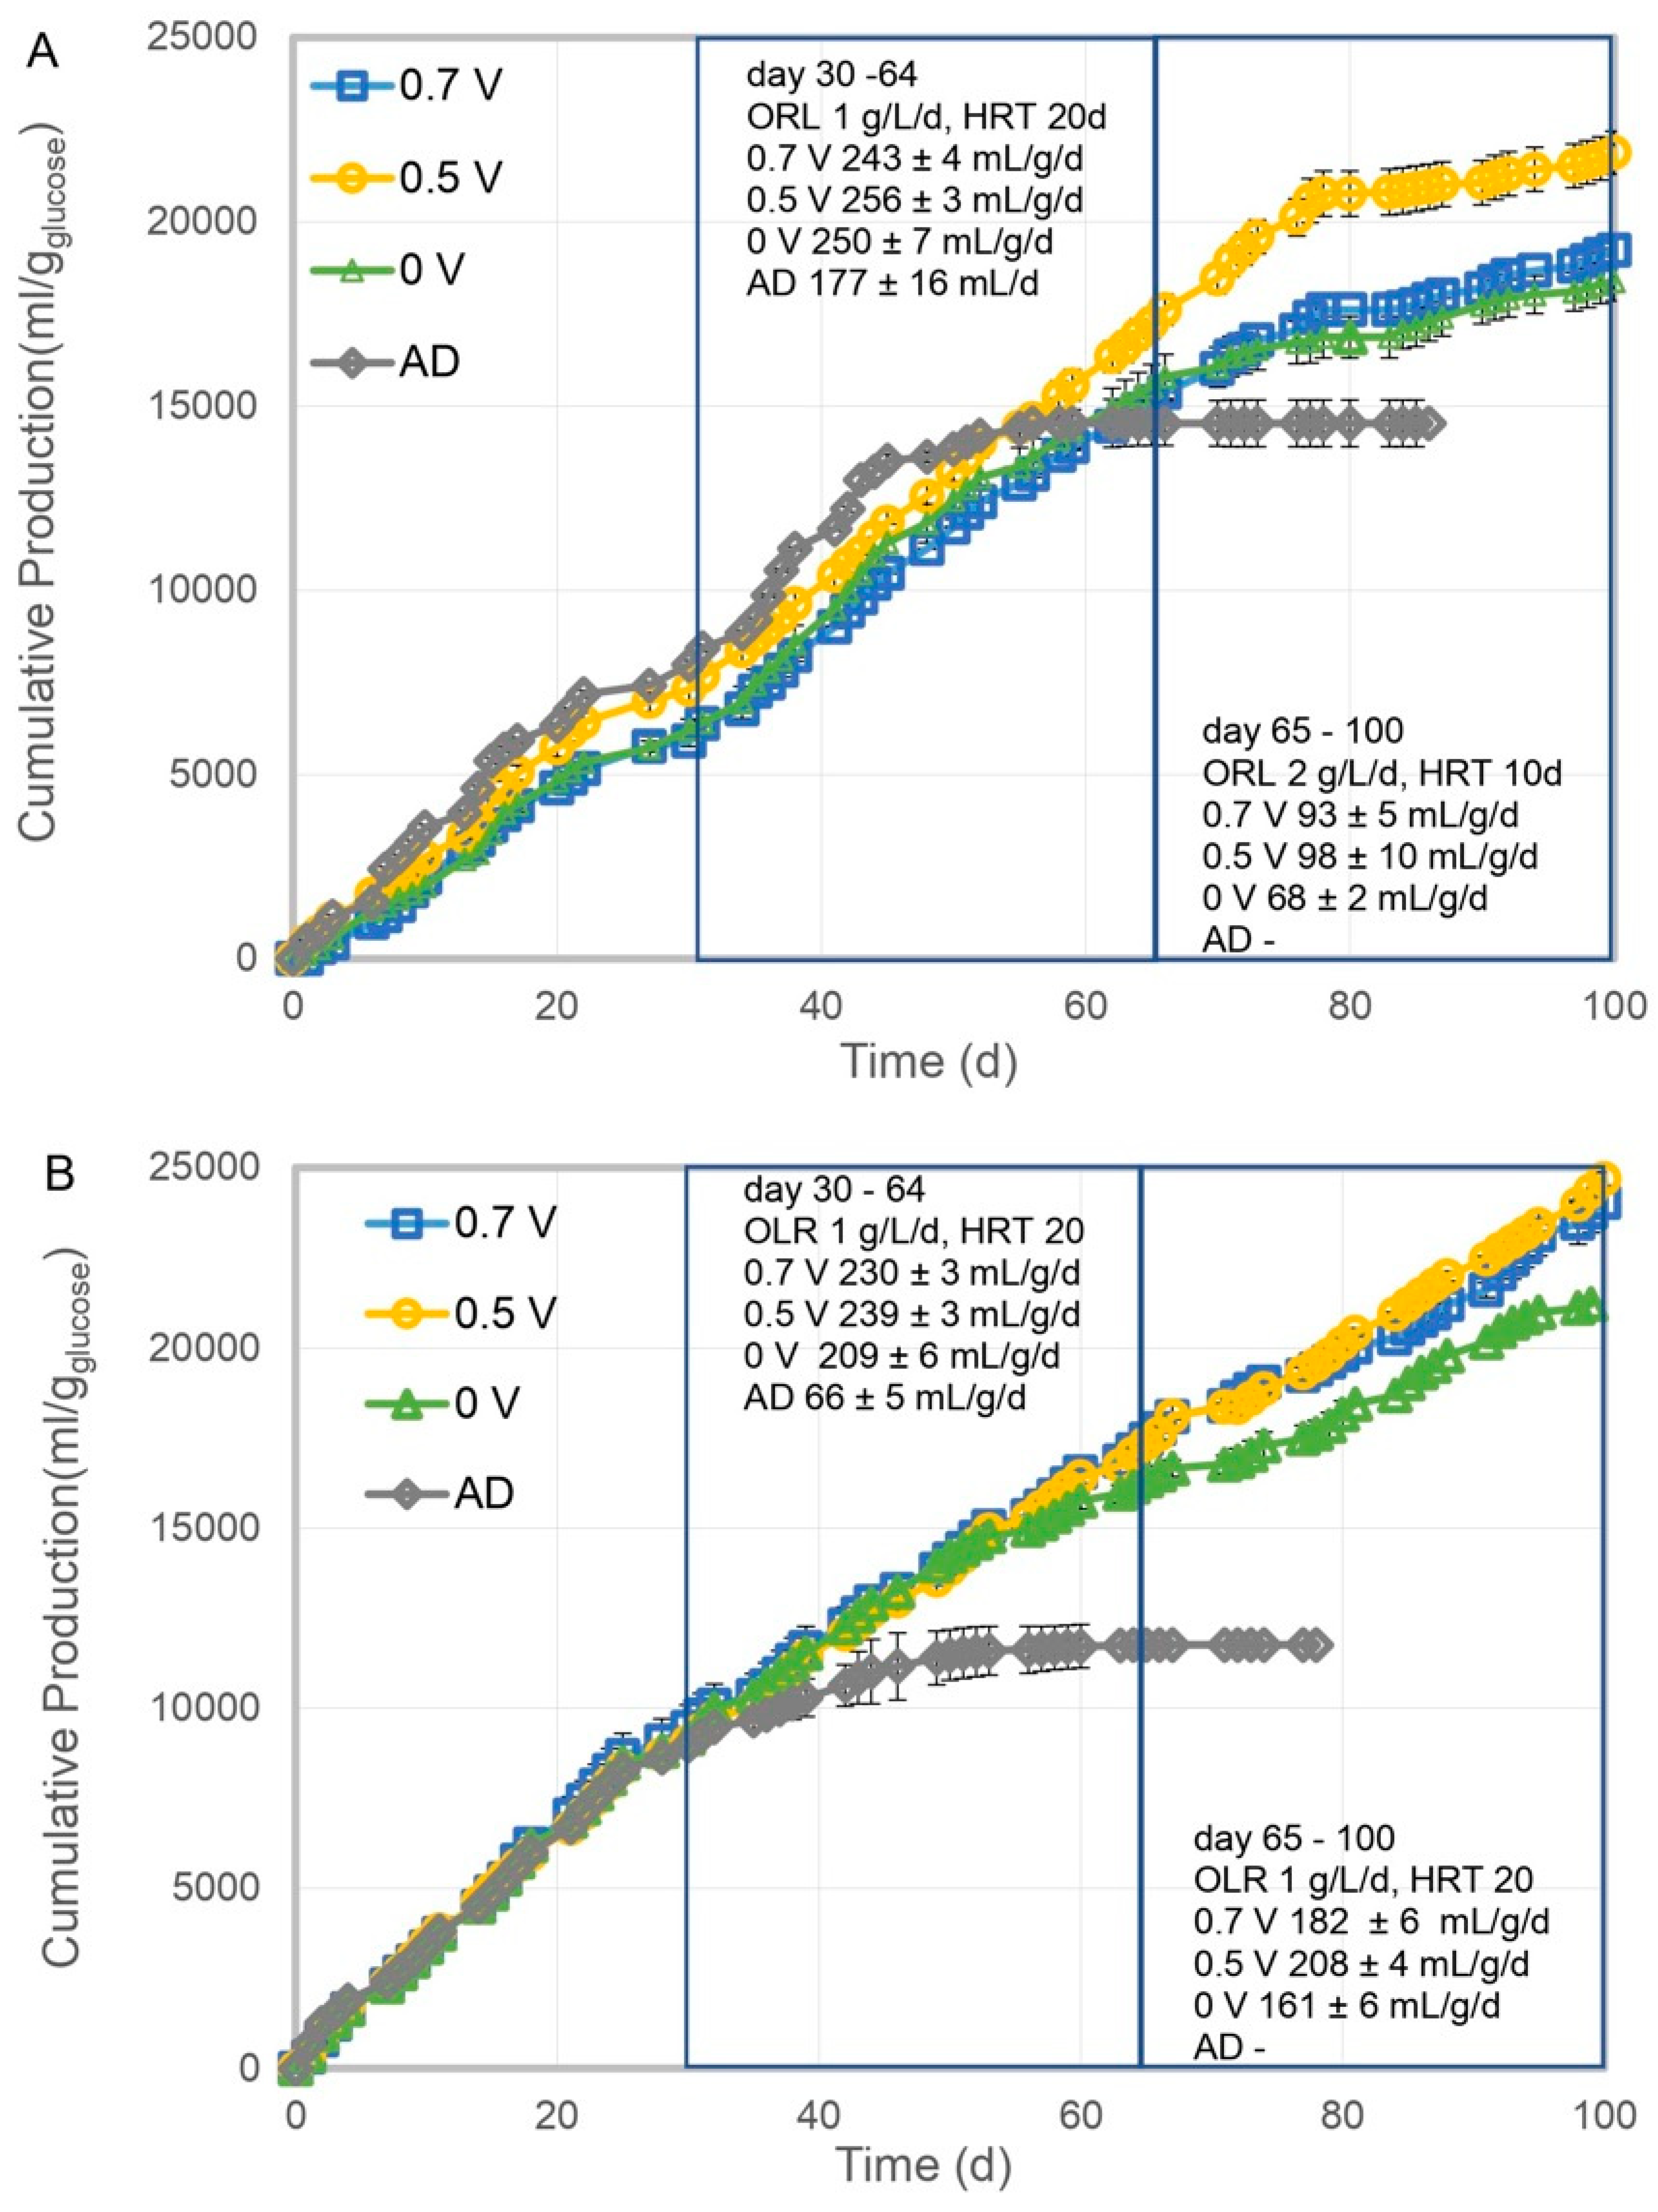
The cumulative gas production under varying experimental conditions is presented in Figure 2. Consistent with the finding of Xiao et al. [18] and Ao et al. [19], the reactors with electrodes demonstrated enhanced biogas production. Figure 2A shows the results obtained with graphite plate electrodes, while Figure 2B presents the results using graphite felt. In Phase 1 (Days 30–64), the presence of graphite plate electrodes had a positive effect on cumulative gas production. Biogas production in the MEC–AD system increased by 44.6%, with an applied potential of 0.5 V compared to the AD. The highest production rate was observed at an applied potential of 0.5 V, with an average production rate of 256 ± 3 mL/g/d. In contrast, the AD control reactor, without electrodes, exhibited the lowest gas production at 177 ± 16 mL/g/d. In Phase 2 (Days 65–100), the OLR was increased to 2 g/L/d and the HRT was reduced to 10 days. Under these conditions, gas production declined significantly across all systems. The AD control ceased biogas production entirely, while the highest production rate was again observed at 0.5 V (98 ± 10 mL/g/d), followed by 0.7 V (93 ± 5 mL/g/d) and OCV (68 ± 2 mL/g/d). Notably, the difference in gas production rates between the systems with an applied potential (0.5 V and 0.7 V) and the system operated at OCV increased during this phase. The biogas production of the MEC–AD enhanced by 44.1% with an applied potential of 0.5 V compared to the MEC–AD operated at OCV. This indicates a positive effect of the applied potential on the performance of MEC–AD systems.
Figure 2.
Cumulative biogas production of the MEC–AD system with graphite plate electrodes (A) and graphite felt electrodes (B) vs. AD control reactor.
For graphite felt electrodes (Figure 2B), a similar trend was observed. In Phase 1 (Days 30–64), the presence of graphite felt electrodes had a positive effect on cumulative gas production. The biogas production of the MEC–AD enhanced by 162.1% with an applied potential of 0.5 V compared to the AD. The average gas production at 0.5 V was 239 ± 3 mL/g/d, slightly higher than the production at 0.7 V (230 ± 3 mL/g/d). The OCV condition resulted in a gas production rate of 209 ± 6 mL/g/d, which was lower than the electroactive conditions but still significantly higher than the AD control (66 ± 5 mL/g/d). In Phase 2 (Days 65–100), under the same operating conditions (OLR = 1 g/L/d, HRT = 20 days), gas production remained relatively stable for 0.7 V (182 ± 6 mL/g/d) and 0.5 V (208 ± 4 mL/g/d). However, production decreased to 202 ± 7 mL/g/d for OCV, while the AD control reactor exhibited negligible gas production. The biogas production of the MEC–AD operated at 0.5 V enhanced by 29.2% compared to the MEC–AD operated at OCV. In Phase 2, the graphite plate reactors were operated at a higher OLR (2 g/L/day) and lower HRT (10 days) than the graphite felt reactors (1 g/L/day, 20 days). Consequently, the absolute biogas production rates between electrode materials in Phase 2 were not directly comparable.
Overall, the data demonstrate that applied potentials of 0.5 V and 0.7 V consistently enhanced cumulative gas production compared to the AD control within the range of enhancement reported in the literature of 30–200% [7,8,9]. Moreover, the production of biogas in the electroactive condition was consistently higher compared to the MEC–AD operated at OCV. Together, these findings suggest that electroactive conditions significantly improve gas production efficiency.
3.2. Enhanced Methane Content in MEC–AD Systems
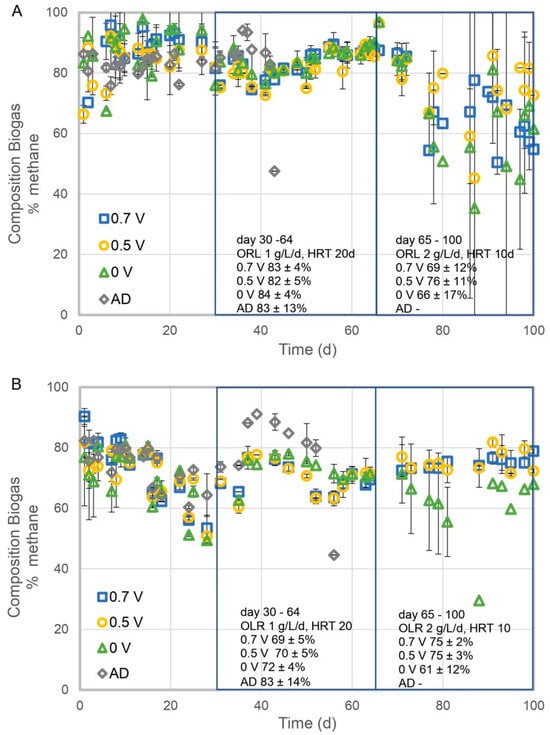
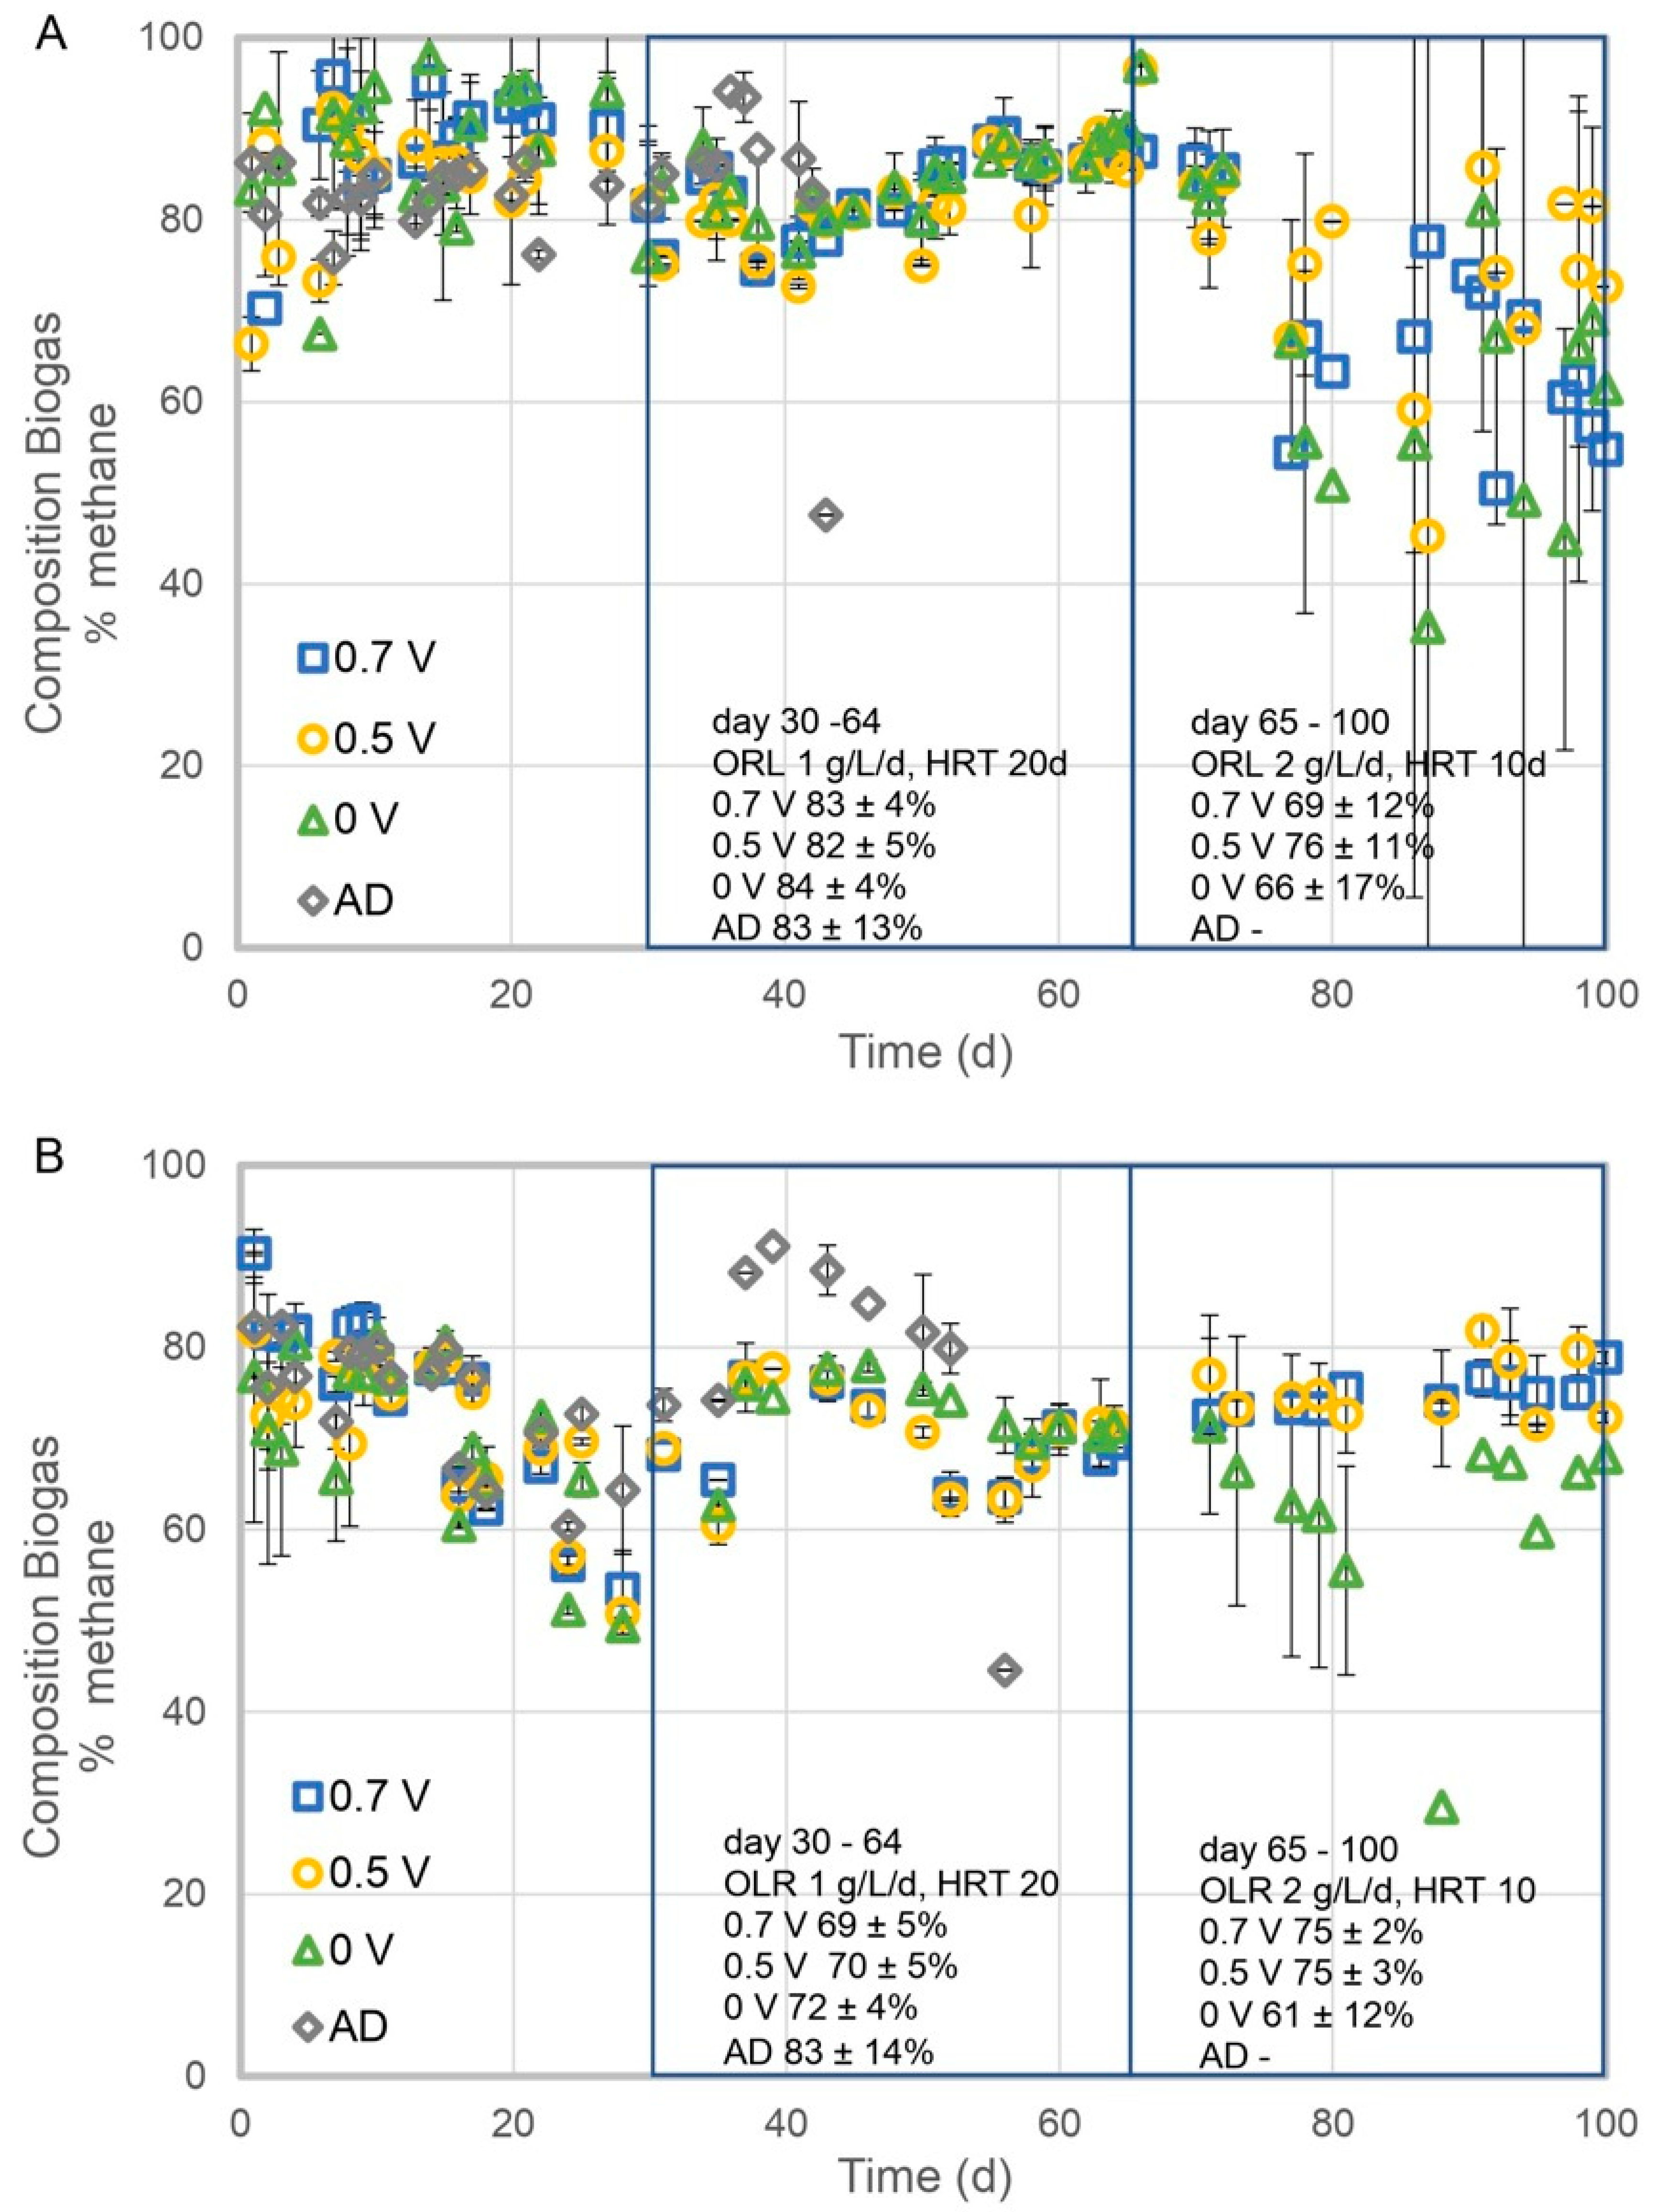
The biogas composition, expressed as the percentage of methane (% CH4), under varying experimental conditions is presented in Figure 3. Consistent with the finding of Molognoni et al. [20] and Ao et al. [19], the reactors with electrodes demonstrated an enhanced CH4 content of biogas. Figure 3A shows the results for graphite plate electrodes, while Figure 3B depicts the results for graphite felt electrodes. For the graphite plate electrodes (Figure 3A), in Phase 1 (Days 30–64), the methane content remained relatively high across all conditions, ranging between 82 and 84%, and there were no significant differences between the different setups. In Phase 2 (Days 65–100), the methane content decreased across all conditions, however, the biogas produced by the MEC–AD systems with an applied potential exhibited up to a 15% higher methane content compared with the system operated at OCV. At 0.7 V, the methane composition dropped to 69 ± 12%, while at 0.5 V, it was 76 ± 11%. The OCV condition showed a more pronounced decline, with methane content decreasing to 66 ± 17%. No measurable methane production was observed in the AD control during this phase.
Figure 3.
Methane content of the biogas produced by the MEC–AD system with graphite plate electrodes (A) and graphite felt electrodes (B) vs. AD control reactor.
For the graphite felt electrodes, similar trends were observed, although the methane content in the biogas was generally lower compared to the graphite plate experiment. In Phase 1 (Days 30–64), the methane composition was 69 ± 5% at 0.7 V and 70 ± 5% at 0.5 V. The OCV condition yielded a similar methane content of 72 ± 4%, while the AD control showed a higher average methane content (83 ± 14%) but with greater variability. The lower variability of the MEC–AD operated at OCV, 0.5, and 0.7 V indicated that the presence of the electrode enhanced process stability compared to AD. In Phase 2 (Days 65–100), the MEC–AD system operated at 0.5 and 0.7 V produced biogas with 23% more methane as the system operated at OCV. Compared to Phase 1, the methane content of the MEC–AD systems with graphite felt electrodes and an applied potential increased slightly. At 0.7 V, the methane composition reached 75 ± 2%, while at 0.5 V, it was 75 ± 3%. In contrast, the OCV condition displayed a decline, with the methane content dropping to 61 ± 12%, and no methane production was observed in the AD control. The lower variability of the MEC–AD operated at 0.5 and 0.7 V indicated that the applied potential enhanced process stability compared to the MEC–AD system operated at OCV. Overall, the results indicate that applied potentials of 0.5 V and 0.7 V contribute to maintaining relatively stable methane content in biogas. These findings highlight the potential stabilizing effect of applied potentials in MEC–AD systems for improving biogas quality under varying operational conditions.
3.3. Enhanced Stability of pH in MEC–AD Systems
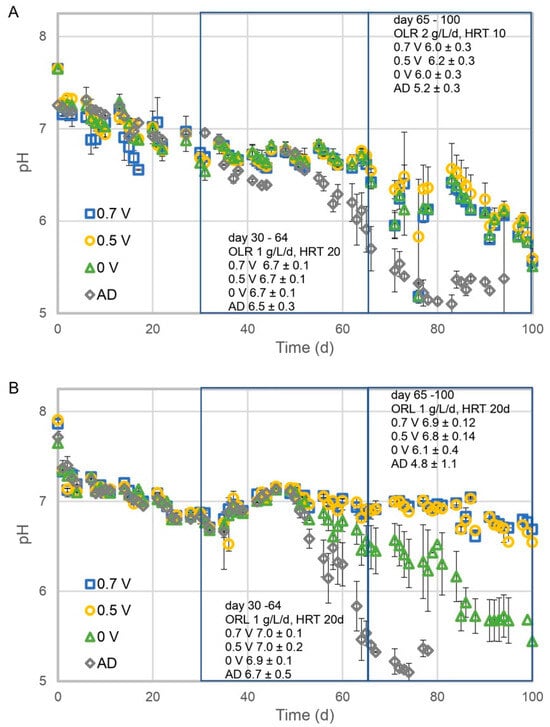
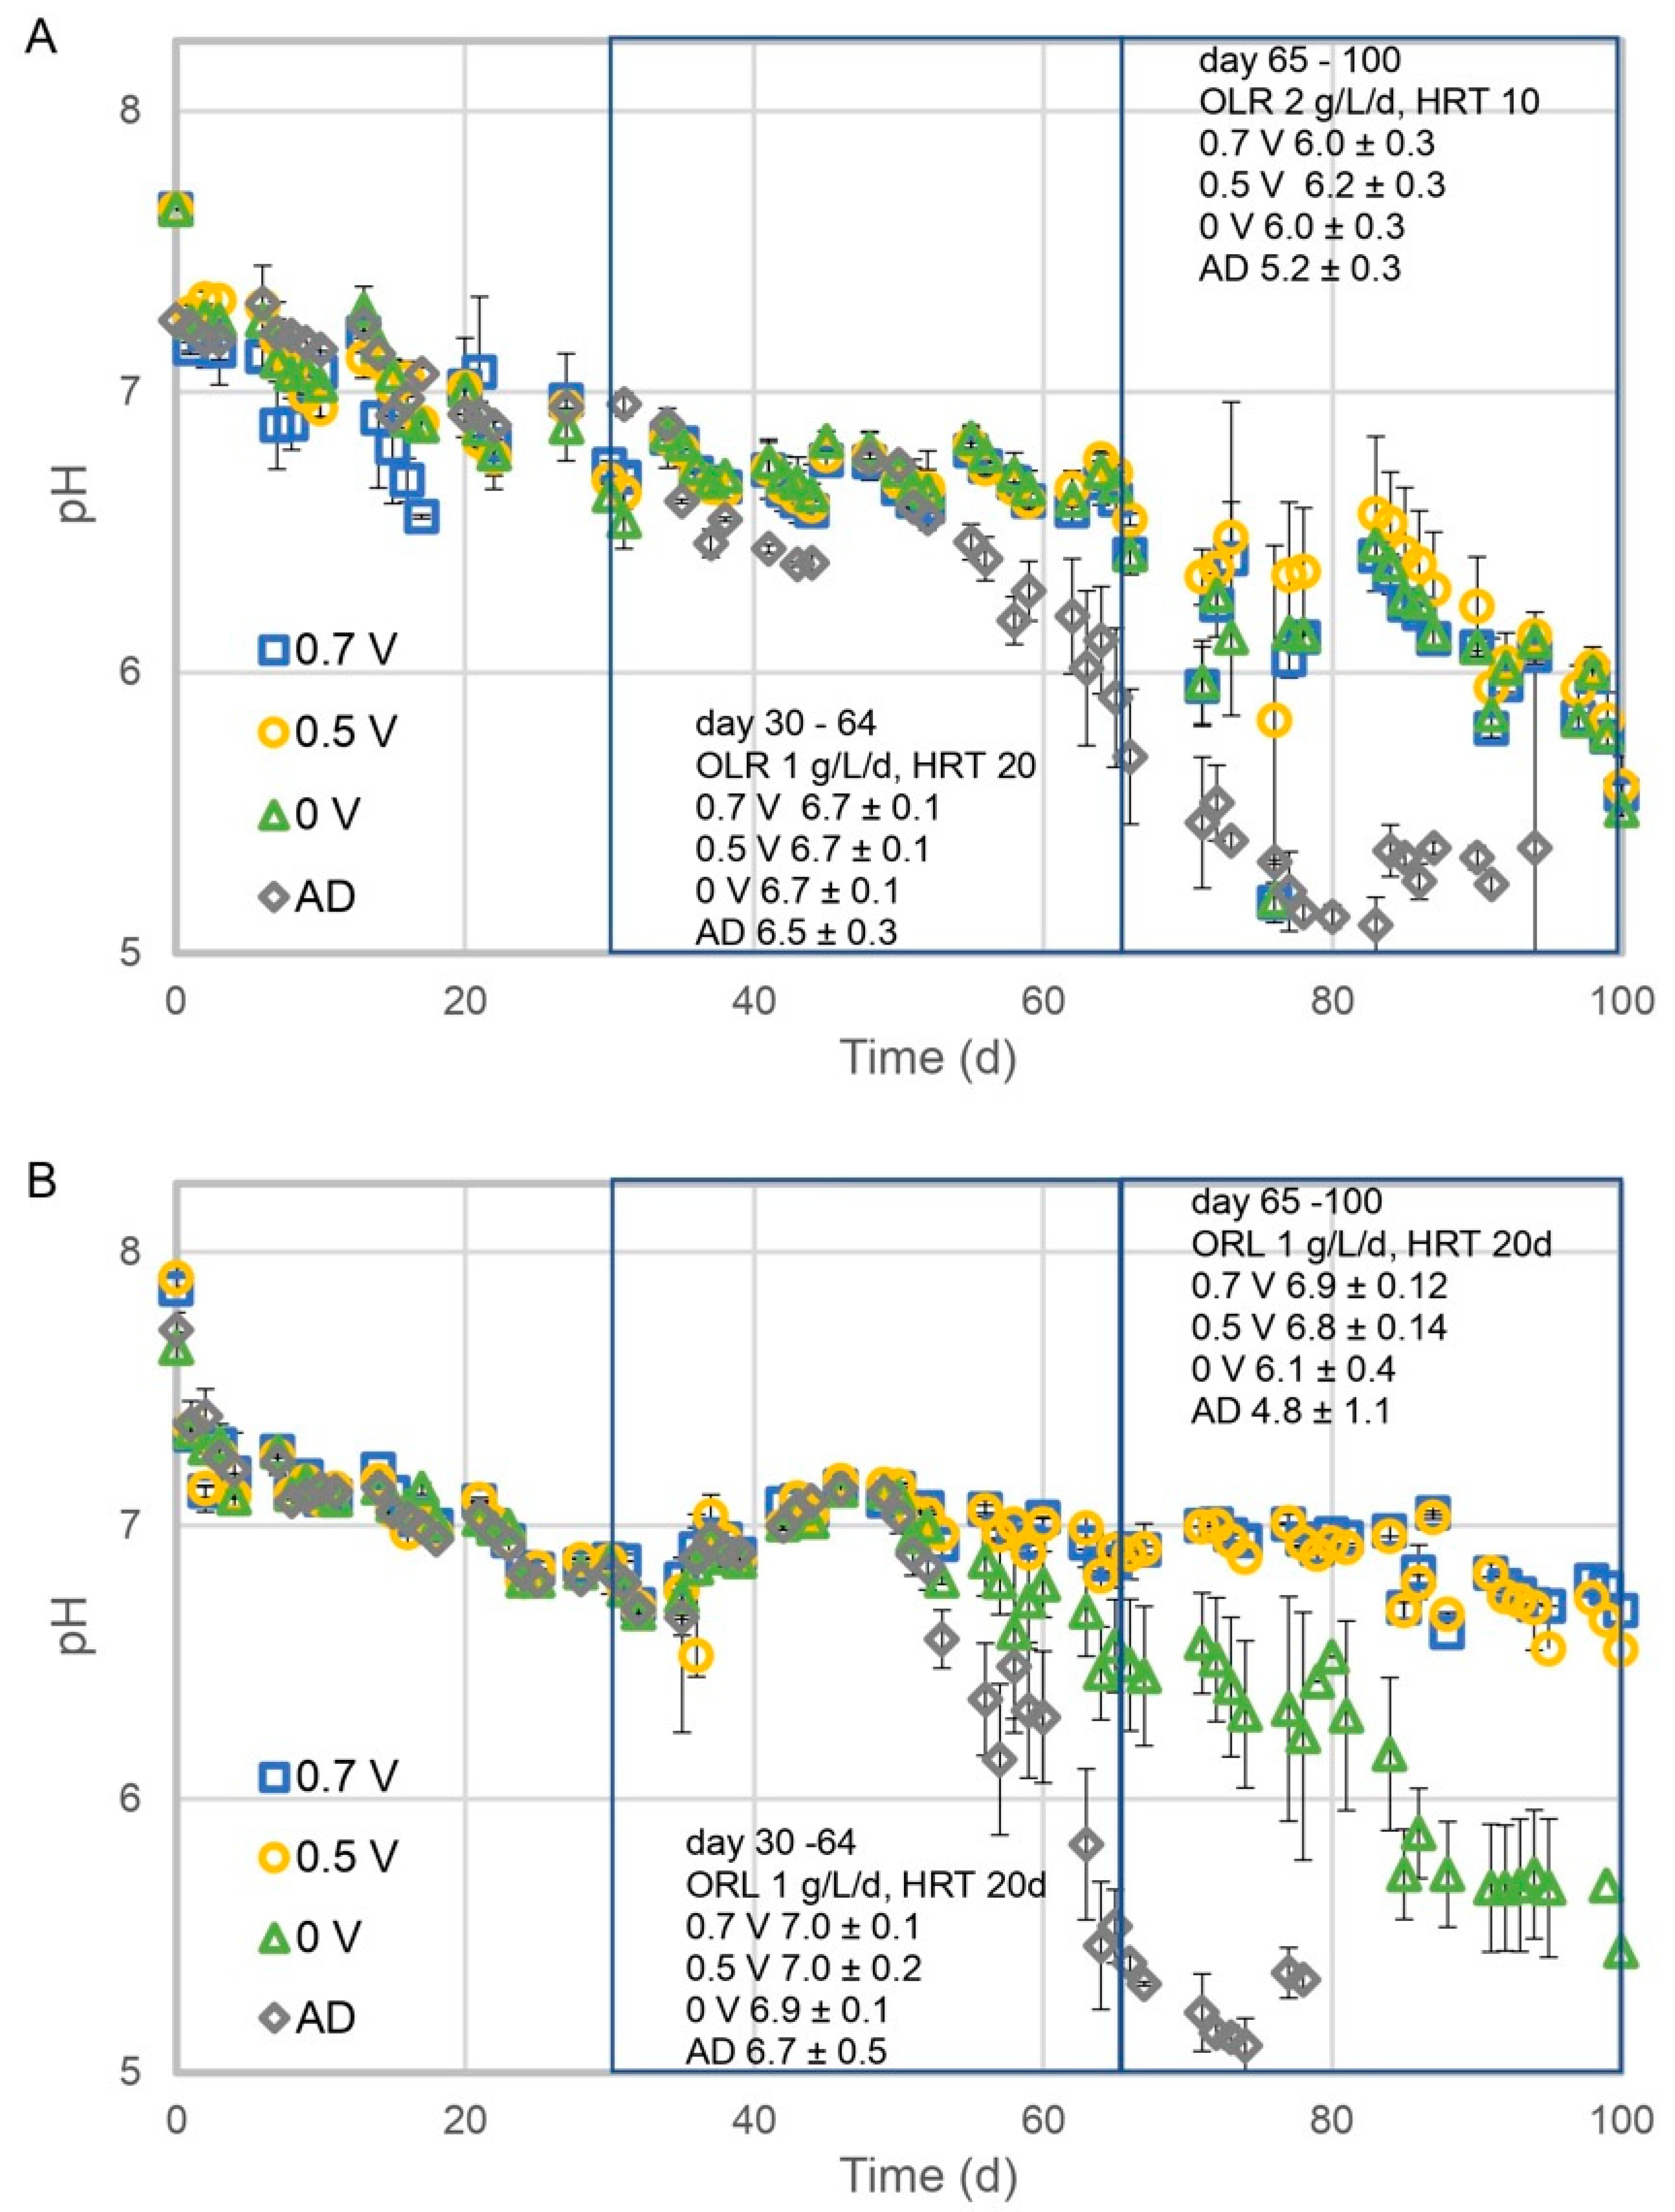
The pH profiles under different experimental conditions are presented in Figure 4. The pH in the reactors with electrodes was more stable than the pH in the reactors without electrodes. This is consistent with the findings of Xiao et al. [18], which reported an enhanced VFA consumption. Figure 4A shows the results for the graphite plate electrodes, while Figure 4B displays the results for the graphite felt electrodes. In Phase 1 (Days 30–64), the average pH remained stable across all conditions with graphite plate electrodes (Figure 4A). The average pH was 6.7 ± 0.1 at 0.7 V, 0.5 V, and OCV, while the anaerobic digestion (AD) control exhibited a slightly lower average pH of 6.5 ± 0.3. In Phase 2 (Days 65–100), a notable decline in average pH was observed across all systems. At 0.7 V and OCV, the average pH dropped to 6.0 ± 0.3, while at 0.5 V, it decreased slightly less, to 6.2 ± 0.3. The steepest decline occurred in the AD control reactor, where the average pH dropped to 5.2 ± 0.3, indicating significant acidification.
Figure 4.
The pH of the MEC–AD system with graphite plate electrodes (A) and graphite felt electrodes (B) vs. AD control reactor.
For graphite felt electrodes (Figure 4B), similar trends were observed, with stable pH values in Phase 1 and a decline in Phase 2. In Phase 1 (Days 30–64), the average pH remained relatively stable. At 0.7 V and 0.5 V, the average pH was 7.0 ± 0.1 and 7.0 ± 0.2, respectively. The OCV condition and AD control had slightly lower pH values, at 6.9 ± 0.1 and 6.7 ± 0.5, respectively. In Phase 2 (Days 65–100), a moderate decline in average pH was observed in systems with applied potentials. The average pH decreased slightly to 6.9 ± 0.1 at 0.7 V and to 6.8 ± 0.1 at 0.5 V. In contrast, the OCV condition experienced a more pronounced decrease, with the average pH dropping to 6.1 ± 0.4. The AD control reactor exhibited the most significant decline, with the average pH falling to 4.8 ± 1.1, indicating severe acidification and system instability. The results demonstrate that applied potentials (0.5 V and 0.7 V) stabilized pH levels in both graphite plate and graphite felt electrode systems. In Phase 2, the average pH declined in all systems. However, the pH drop was less pronounced in systems with applied potentials, while the AD control reactor exhibited severe acidification. These findings suggest that the application of voltage in MEC–AD systems can mitigate acidification and maintain more stable pH conditions, which are critical for system performance and stability under high loading operating conditions.
3.4. Enhanced Stability of TS & VS in MEC–AD Systems
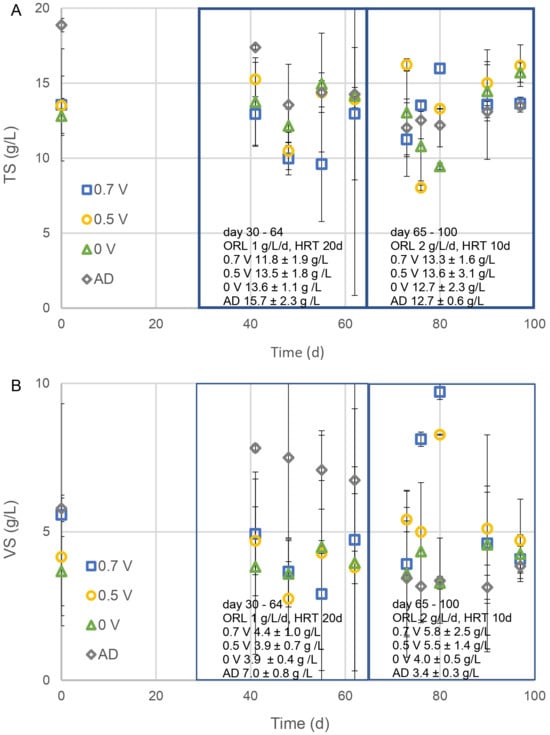
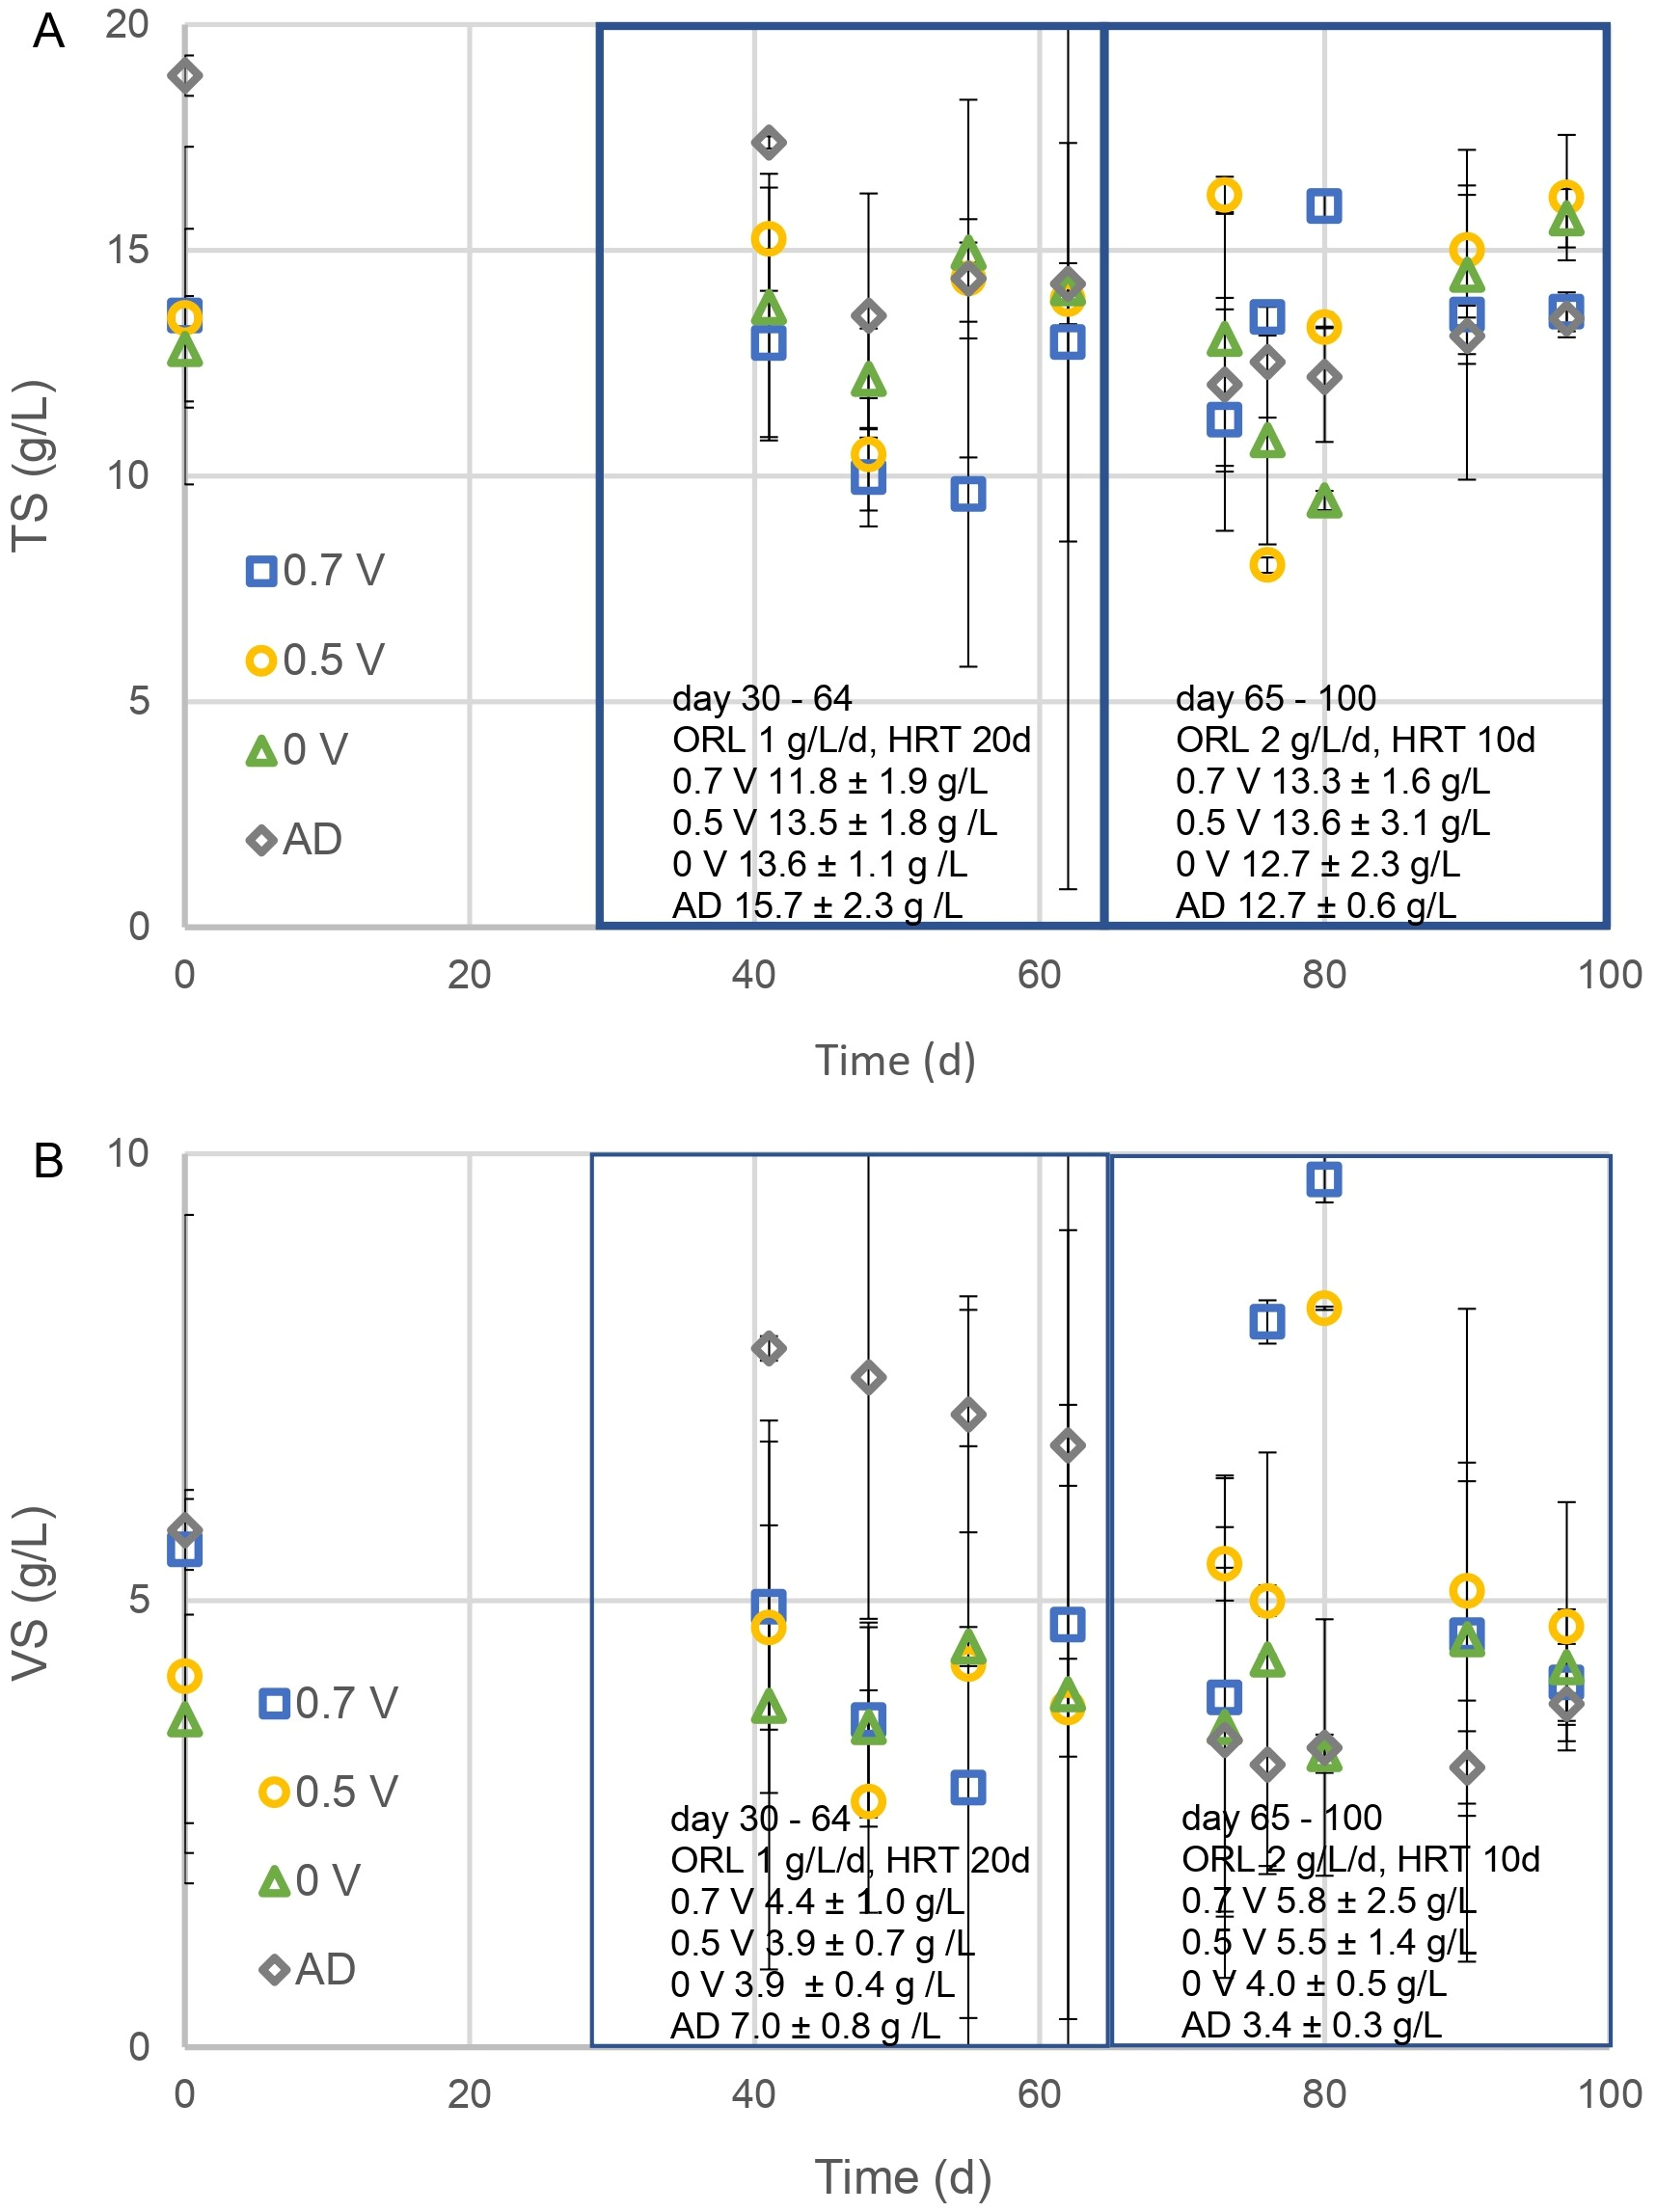
The profiles of total solids (TS) and VS for the graphite plate experiment are presented in Figure 5. Figure 5A shows the results for TS, while Figure 5B depicts the results for VS. In Phase 1 (Days 30–64), the TS values remained stable across all reactor setups. The AD control reactor exhibited the highest TS concentration, with an average of 15.7 ± 2.3 g/L, while the 0.7 V condition had the lowest TS concentration, averaging 11.8 ± 1.9 g/L. The VS concentrations in the reactors with applied potentials (0.5 V and 0.7 V) were also stable and followed a similar trend to TS. In contrast, the AD control showed a gradual decline in VS concentration, decreasing from 7.8 g/L to 6.2 g/L over the phase. In Phase 2 (Days 65–100), TS concentrations remained relatively stable across all conditions. The average TS ranged from 13.6 ± 3.1 g/L at 0.5 V to 12.7 ± 2.3 g/L at OCV. Similarly, the VS concentrations exhibited stability in systems with applied potentials. However, it is noteworthy that the AD control displayed the lowest VS concentration, averaging 3.4 ± 0.3 g/L, indicating significant solid degradation. The results demonstrate that both TS and VS concentrations remained relatively stable in systems with applied potentials (0.5 V and 0.7 V) during both phases. In contrast, the AD control exhibited higher TS and VS concentrations in Phase 1 but experienced notable reductions in Phase 2, suggesting greater solid degradation and system instability. The systems with applied potentials maintained consistent solid concentrations, underscoring their potential for enhancing stability and performance in MEC–AD systems under varying operational conditions.
Figure 5.
Evolution of TS (A) and VS (B) of the MEC–AD system with graphite plate electrodes.
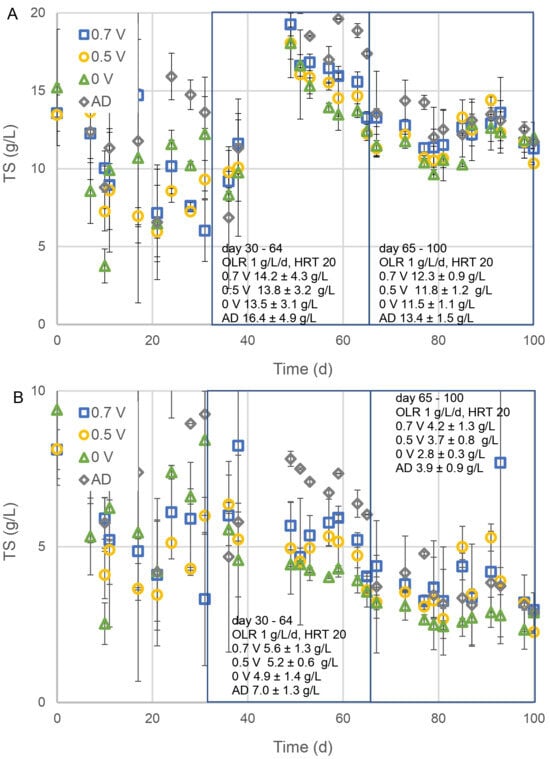
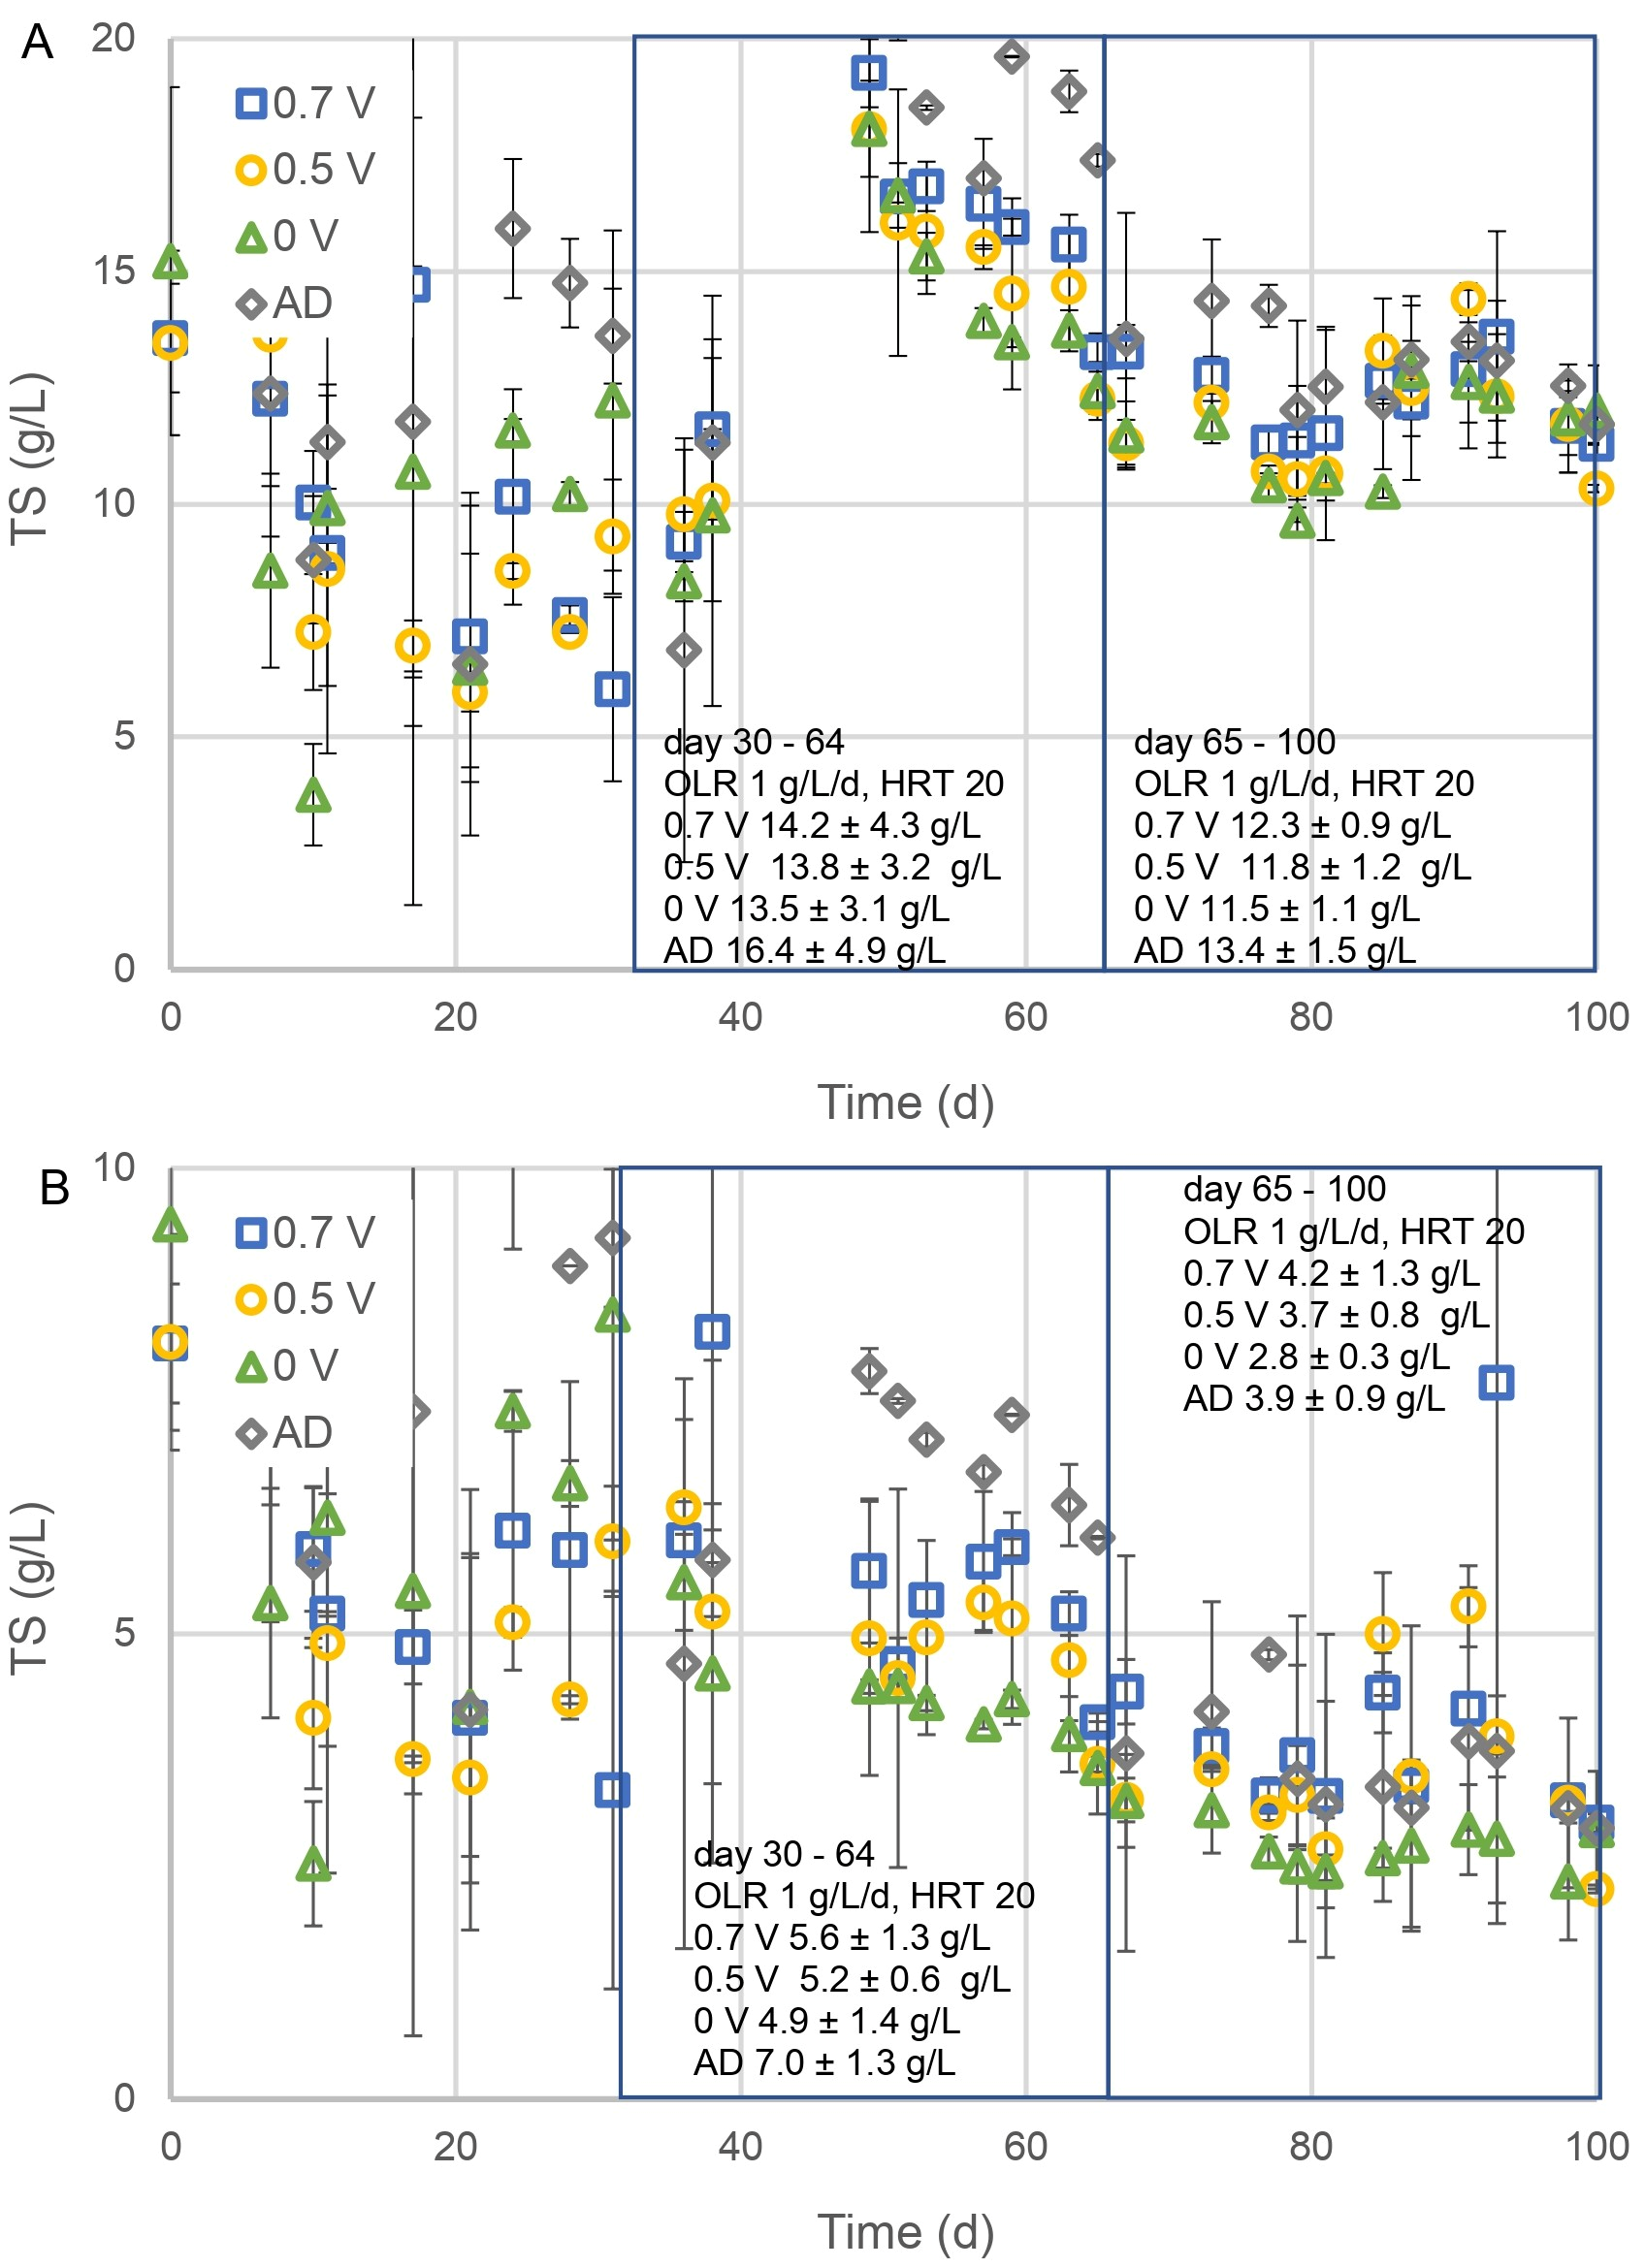
The profiles of TS and VS for the graphite felt experiment are presented in Figure 6. Figure 6A illustrates the TS results, while Figure 6B displays the VS results. During Phase 1 (Days 30–64), TS concentrations varied across the systems. At 0.7 V, the average TS concentration was 12.4 ± 4.3 g/L. For the 0.5 V condition, the TS concentration was slightly higher, averaging 13.8 ± 3.2 g/L. Under the OCV condition, the TS concentration was 13.5 ± 3.1 g/L, while the AD control reactor exhibited the highest TS concentration at 16.4 ± 4.9 g/L. The VS concentrations followed a similar trend as TS. At 0.7 V, the average VS concentration was 5.6 ± 1.3 g/L. For 0.5 V, the VS concentration was slightly lower, averaging 5.2 ± 0.6 g/L. Under the OCV condition, the VS concentration was the lowest at 4.9 ± 1.4 g/L, while the AD control recorded the highest VS concentration at 7.0 ± 1.3 g/L. In Phase 2 (Days 65–100), a slight decline in TS concentrations was observed across all systems. The average TS concentration at 0.7 V was 12.3 ± 0.9 g/L, while at 0.5 V, it was slightly lower at 11.8 ± 1.2 g/L. Under the OCV condition, the TS concentration was 11.5 ± 3.1 g/L, whereas the AD control maintained the highest TS concentration at 13.4 ± 1.5 g/L. A notable reduction in VS concentrations was observed, particularly in the non-electroactive conditions. At OCV, the average VS concentration dropped to 2.8 ± 0.3 g/L, and in the AD control, it decreased to 3.3 ± 0.9 g/L. In contrast, the decrease in VS concentrations for the electroactive conditions was less pronounced. At both 0.7 V and 0.5 V, the average VS concentration declined to 4.2 ± 1.3 g/L. These findings demonstrate that the TS and VS concentrations remained more stable in systems with applied potentials (0.5 V and 0.7 V) compared to the control (AD) throughout the experiment. In Phase 1, the AD control exhibited the highest TS and VS concentrations. However, in Phase 2, it showed a marked reduction, indicating system instability. In contrast, the systems with applied potentials maintained relatively stable solid concentrations, underscoring their potential to enhance system performance and stability in MEC–AD systems.
Figure 6.
Evolution of TS (A) and VS (B) of the MEC–AD system with graphite felt electrodes.
3.5. Cathode and Anode Potentials in MEC–AD Systems
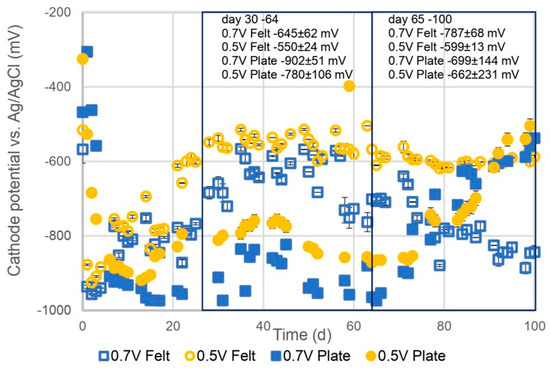
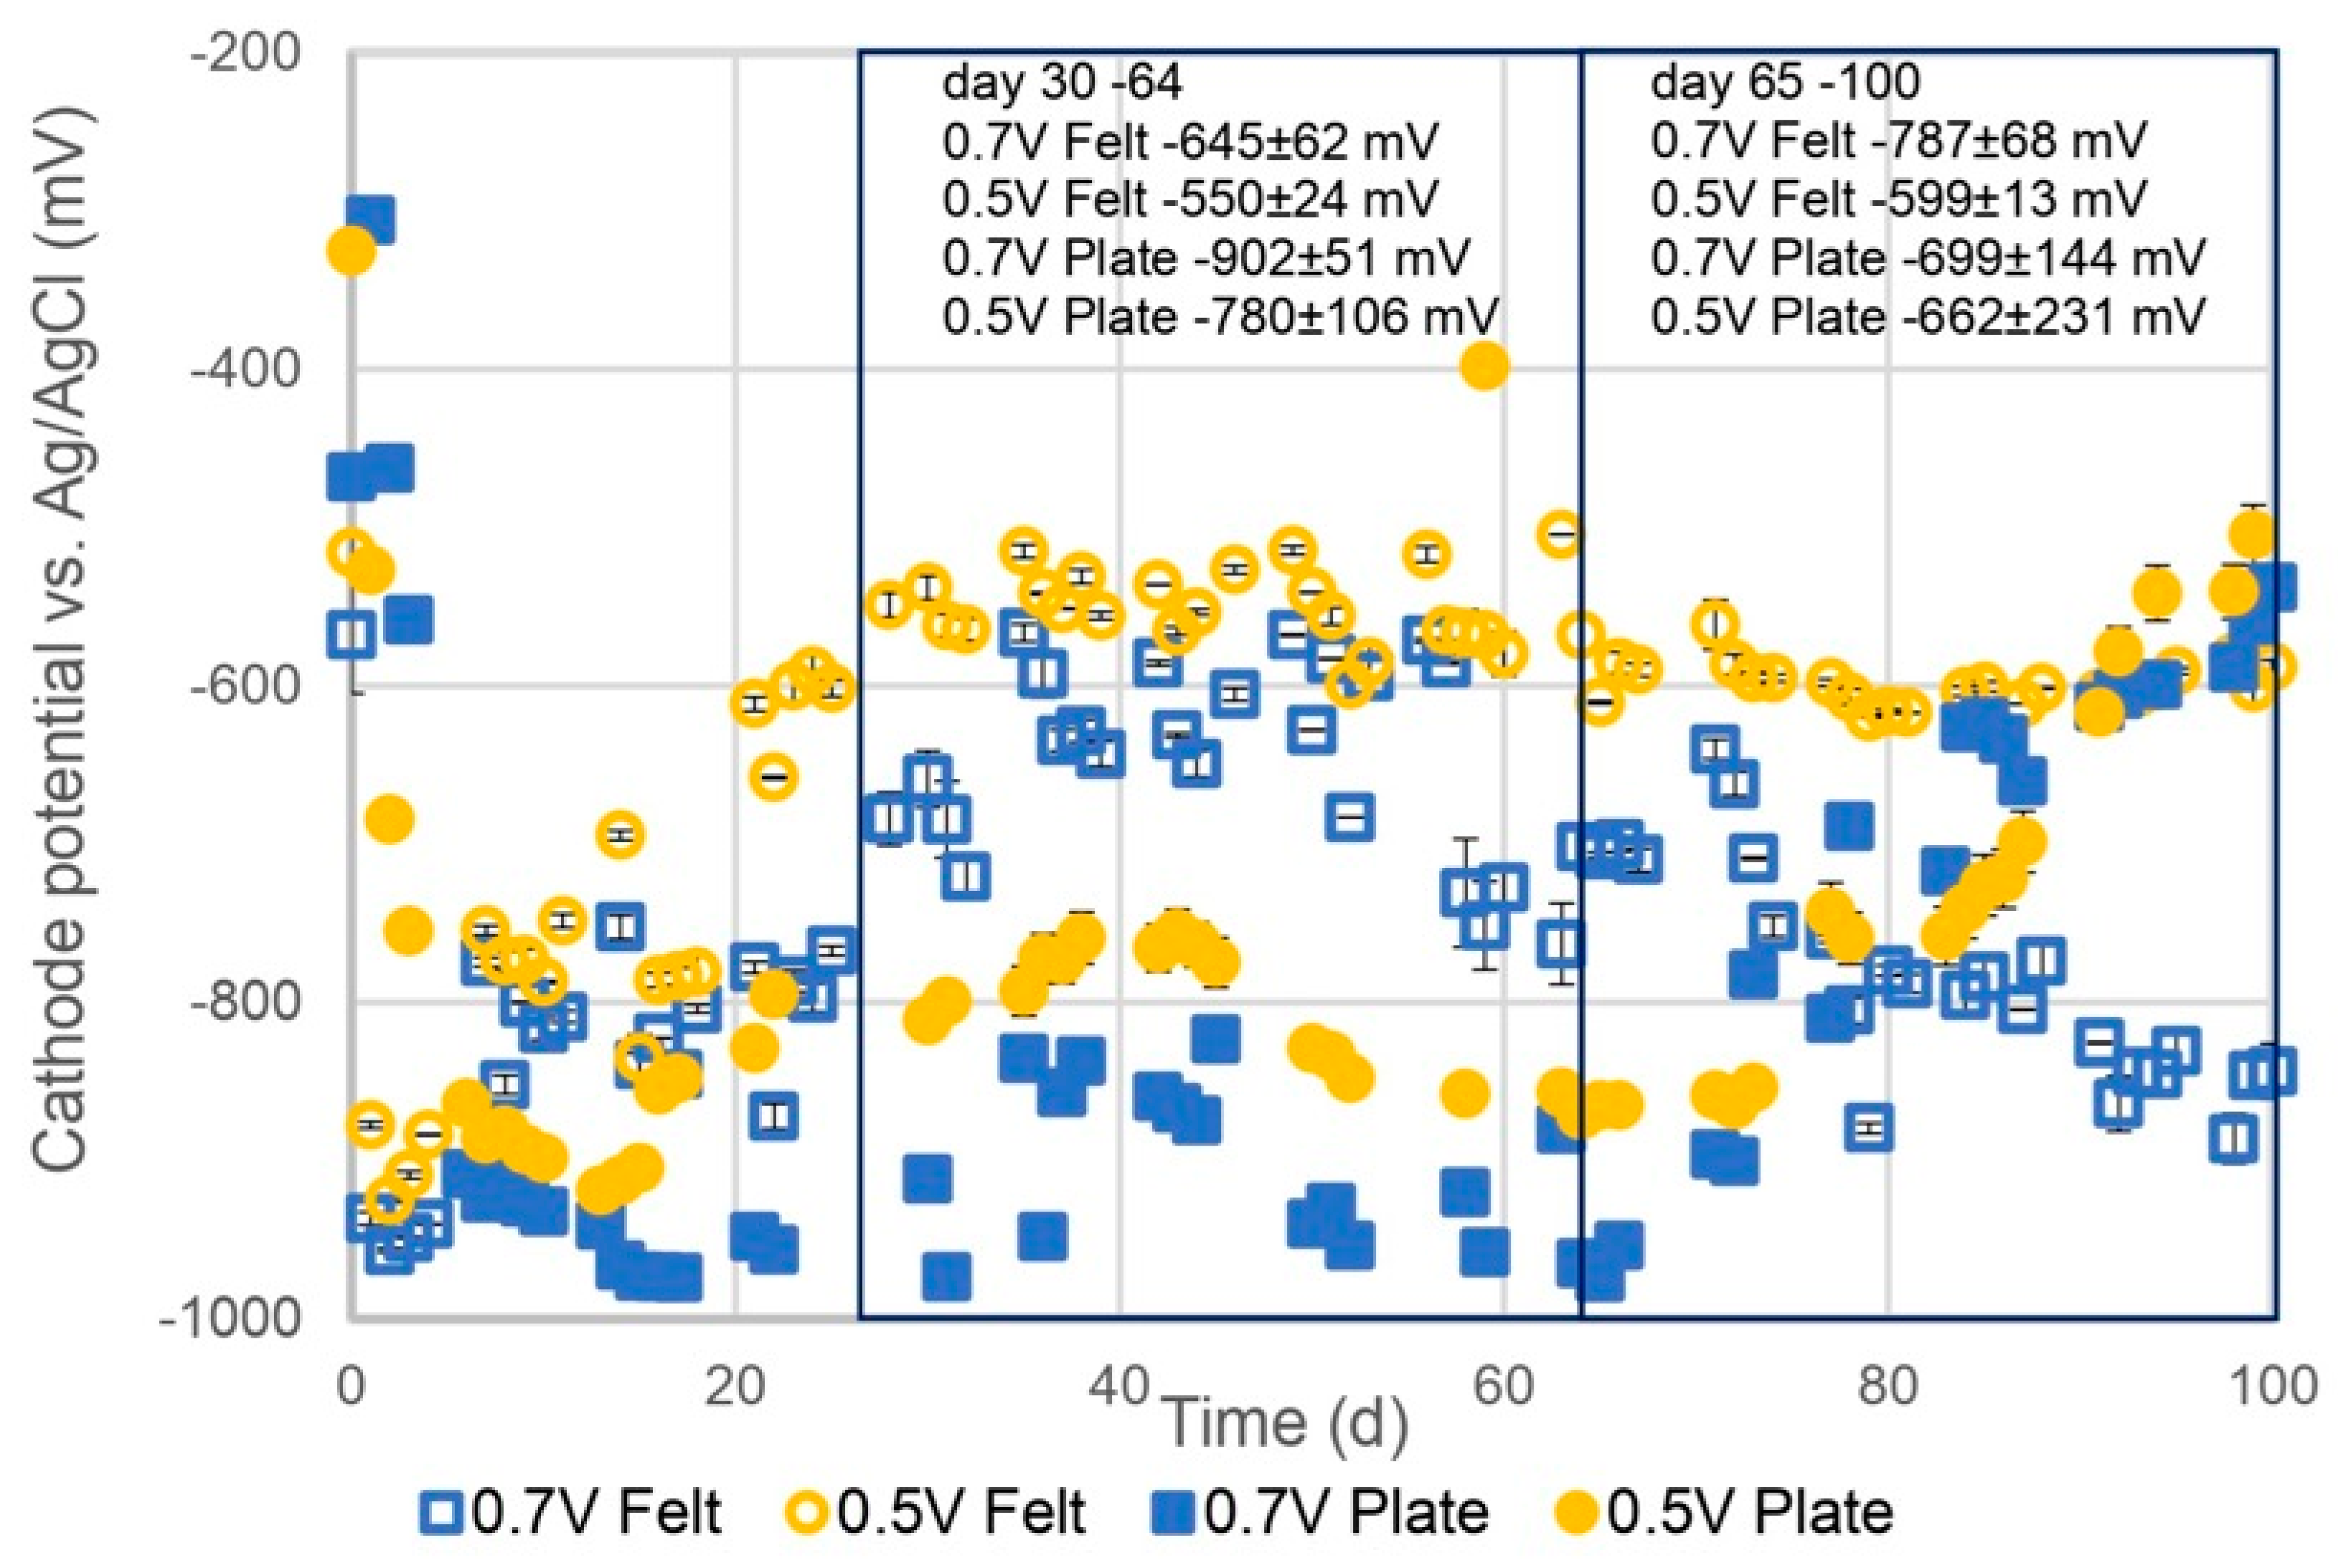
The cathode and anode potentials of the MEC–AD reactors without an applied potential were between −500 and −400 mV vs. Ag/AgCl. The cathode potential profiles versus Ag/AgCl under varying experimental conditions are presented in Figure 7. The figure shows the results for the graphite plate electrodes and graphite felt electrodes at applied potentials of 0.5 V and 0.7 V. In Phase 1 (Days 30–64), the cathode potentials were generally lower (more negative), with clear differences between the electrode types and applied potentials. For the graphite plate electrodes, the cathode potentials were significantly more negative, with averages of −902 ± 51 mV at 0.7 V and −780 ± 106 mV at 0.5 V. In comparison, the graphite felt electrodes exhibited less negative values, with averages of −645 ± 62 mV at 0.7 V and −503 ± 161 mV at 0.5 V. In Phase 2 (Days 65–100), the cathode potentials of the graphite plate electrodes became less negative, increasing by approximately 200 mV to −699 ± 144 mV at 0.7 V and −662 ± 231 mV at 0.5 V. The cathode potentials for the graphite felt electrodes showed a continuous decrease, becoming more negative over time. The average values dropped to −787 ± 68 mV at 0.7 V and −599 ± 113 mV at 0.5 V. The results indicate that the cathode potentials were consistently more negative at an applied potential of 0.7 V compared to 0.5 V, highlighting the influence of the applied potential on cathodic performance.
Figure 7.
Cathode potentials the MEC–AD system with graphite felt electrodes and graphite plate electrodes.
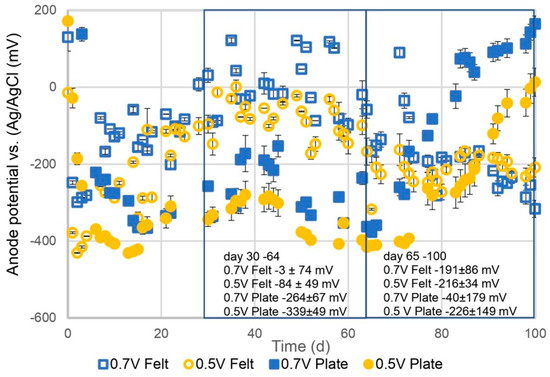
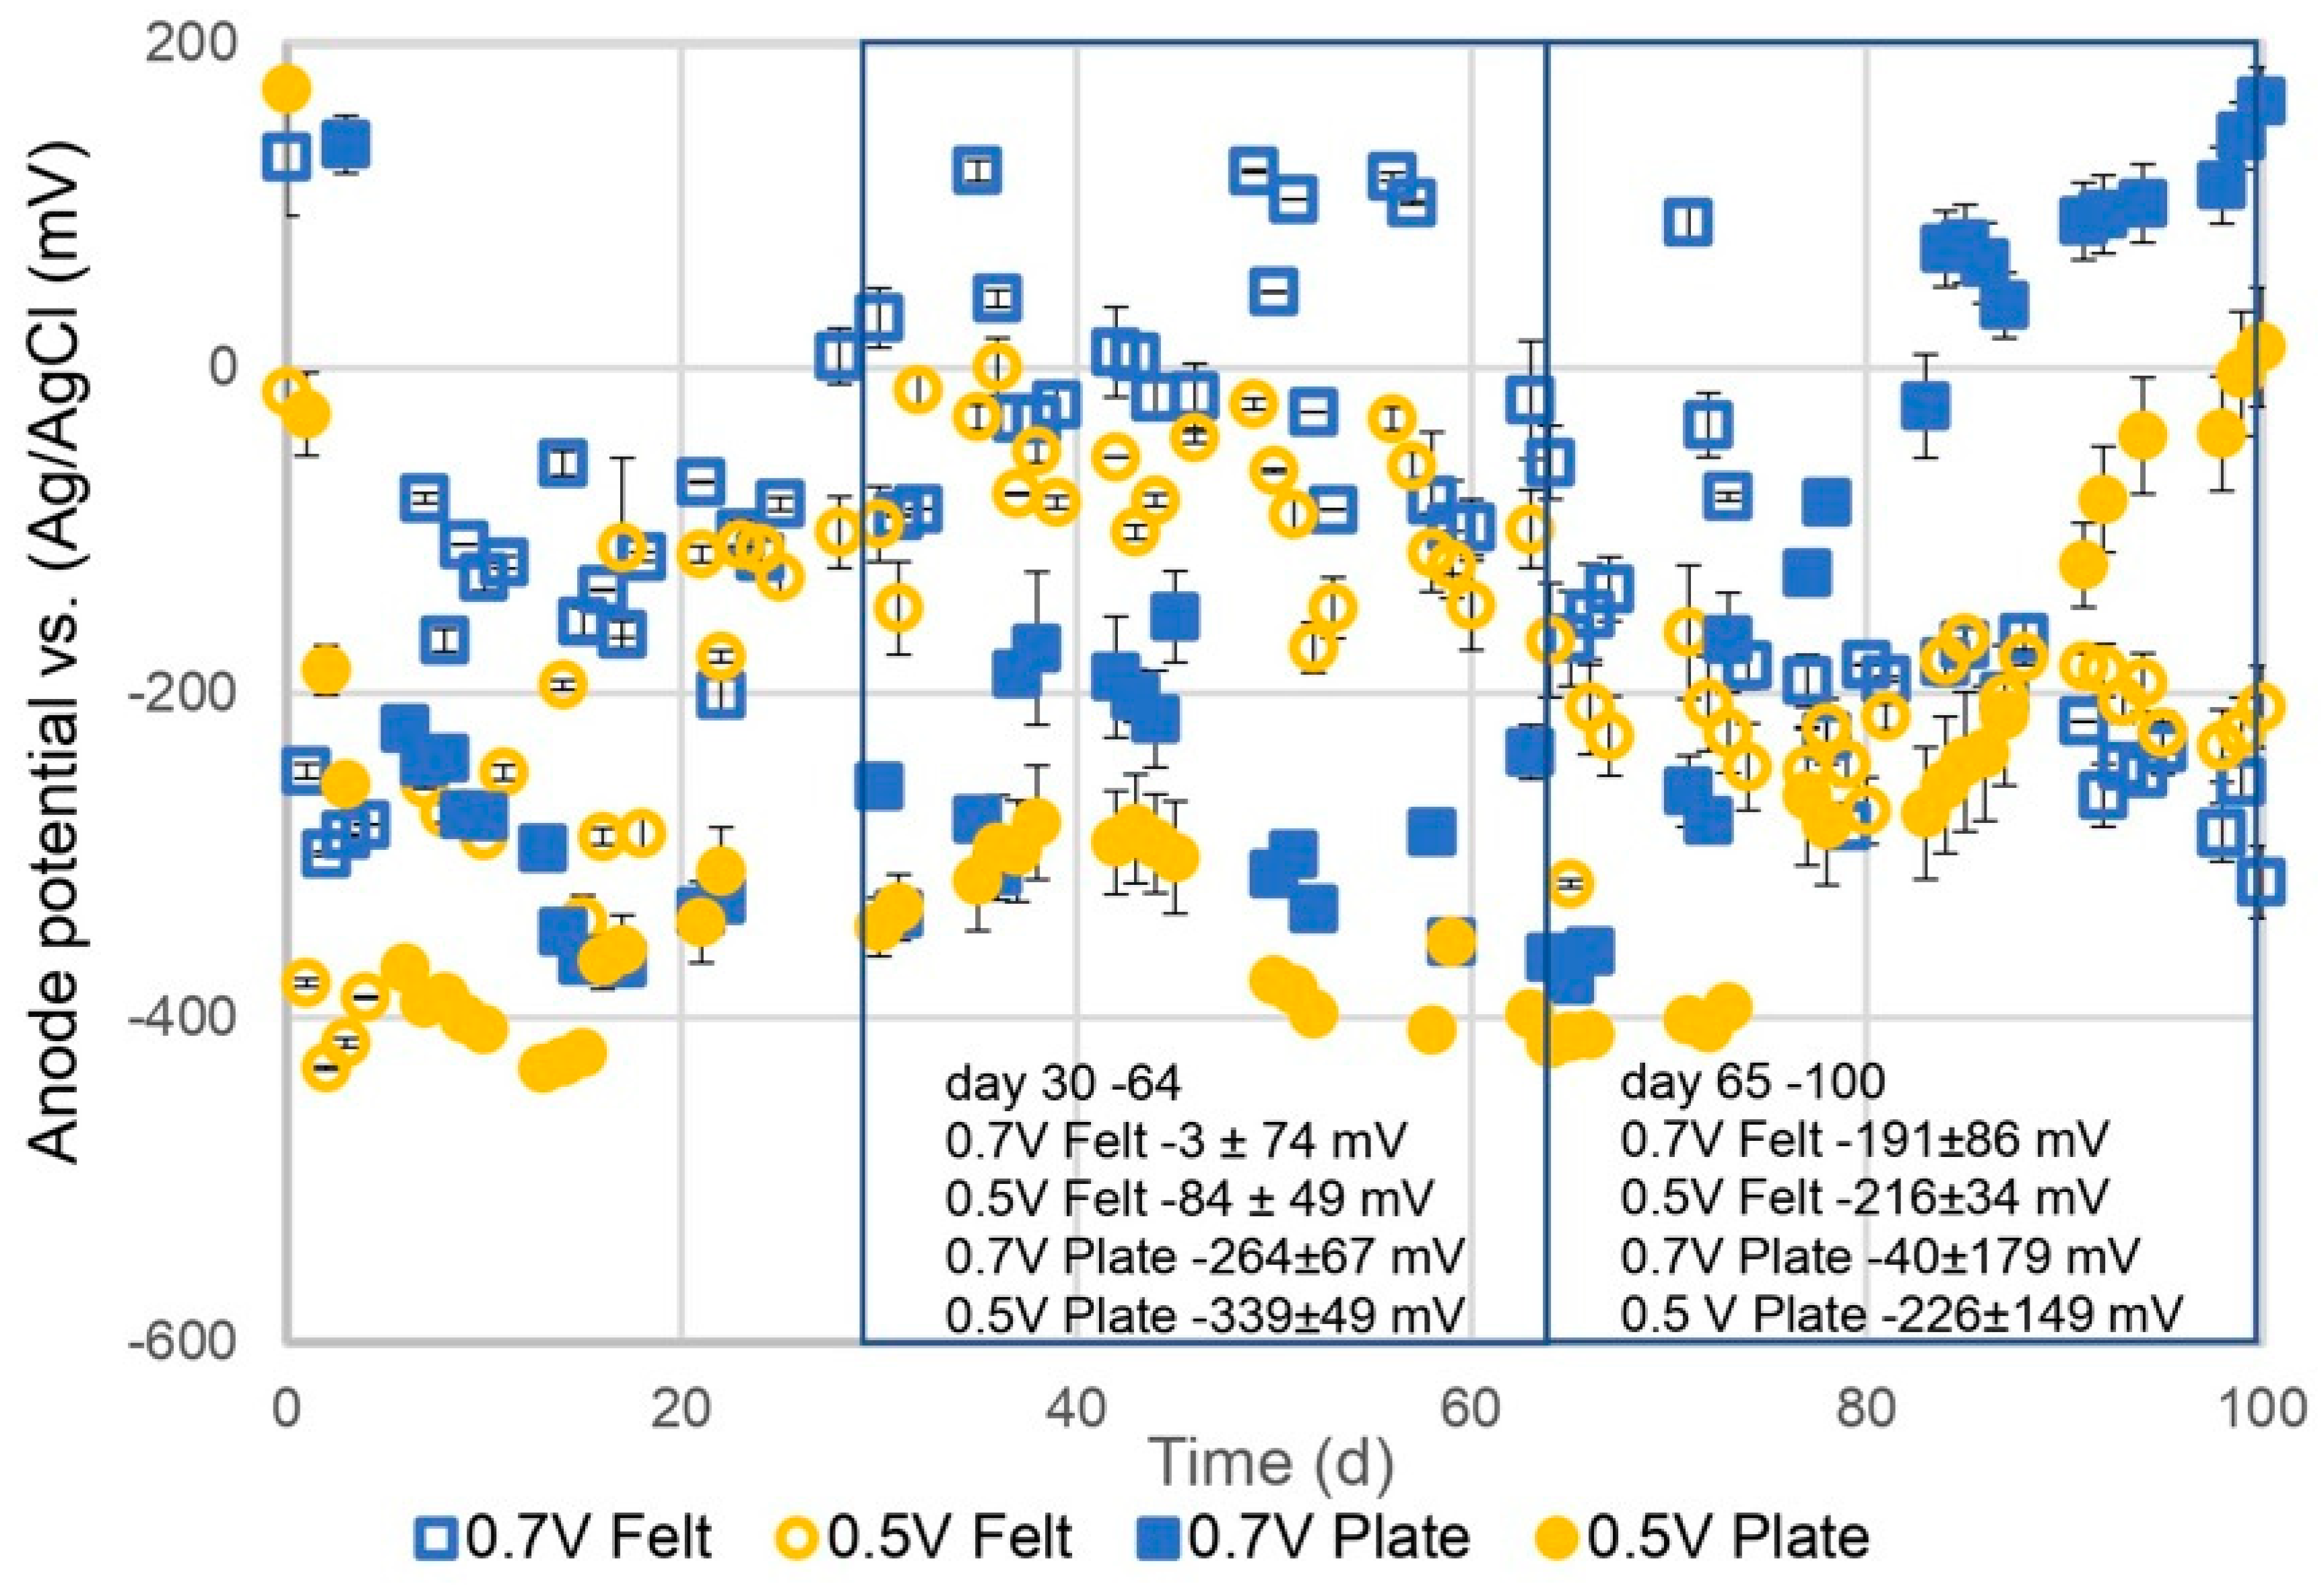
The anode potential profiles versus Ag/AgCl under varying experimental conditions are presented in Figure 8, comparing the performance of graphite plate and graphite felt electrodes at applied potentials of 0.5 V and 0.7 V during two operational phases. In Phase 1 (Days 30–64), the anode potentials varied significantly depending on the electrode material and applied potential. The graphite plate electrodes exhibited lower (more negative) anode potentials, with averages of −264 ± 67 mV at 0.7 V and −339 ± 49 mV at 0.5 V. In contrast, the anode potentials for the graphite felt electrodes were higher (less negative), with average values of −3 ± 74 mV at 0.7 V and −84 ± 49 mV at 0.5 V. These findings emphasize the critical role of electrode material and applied potential in influencing anode performance in MEC–AD systems.
Figure 8.
Anode potentials of the MEC–AD system with graphite felt electrodes and graphite plate electrodes.
In Phase 2 (Days 65–100), the anode potentials generally increased (became less negative) across all systems. For the graphite felt electrodes, the average anode potential increased to −191 ± 86 mV at 0.7 V and −216 ± 34 mV at 0.5 V. The graphite plate electrodes maintained more negative potentials, although they also became less negative compared to Phase 1. The average values were −400 ± 179 mV at 0.7 V and −226 ± 149 mV at 0.5 V. The 0.7 V condition consistently resulted in less negative anode potentials compared to 0.5 V, reflecting the influence of the applied potential on anode behavior. Furthermore, the increase in OLR and the reduction in HRT in Phase 2 led to less negative anode potentials across all systems, indicating increased operational stress.
3.6. Internal Resistance in MEC–AD Systems
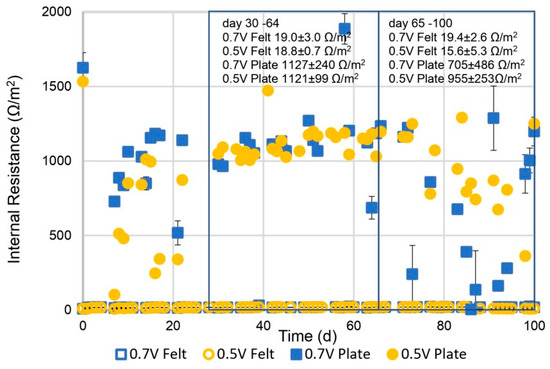
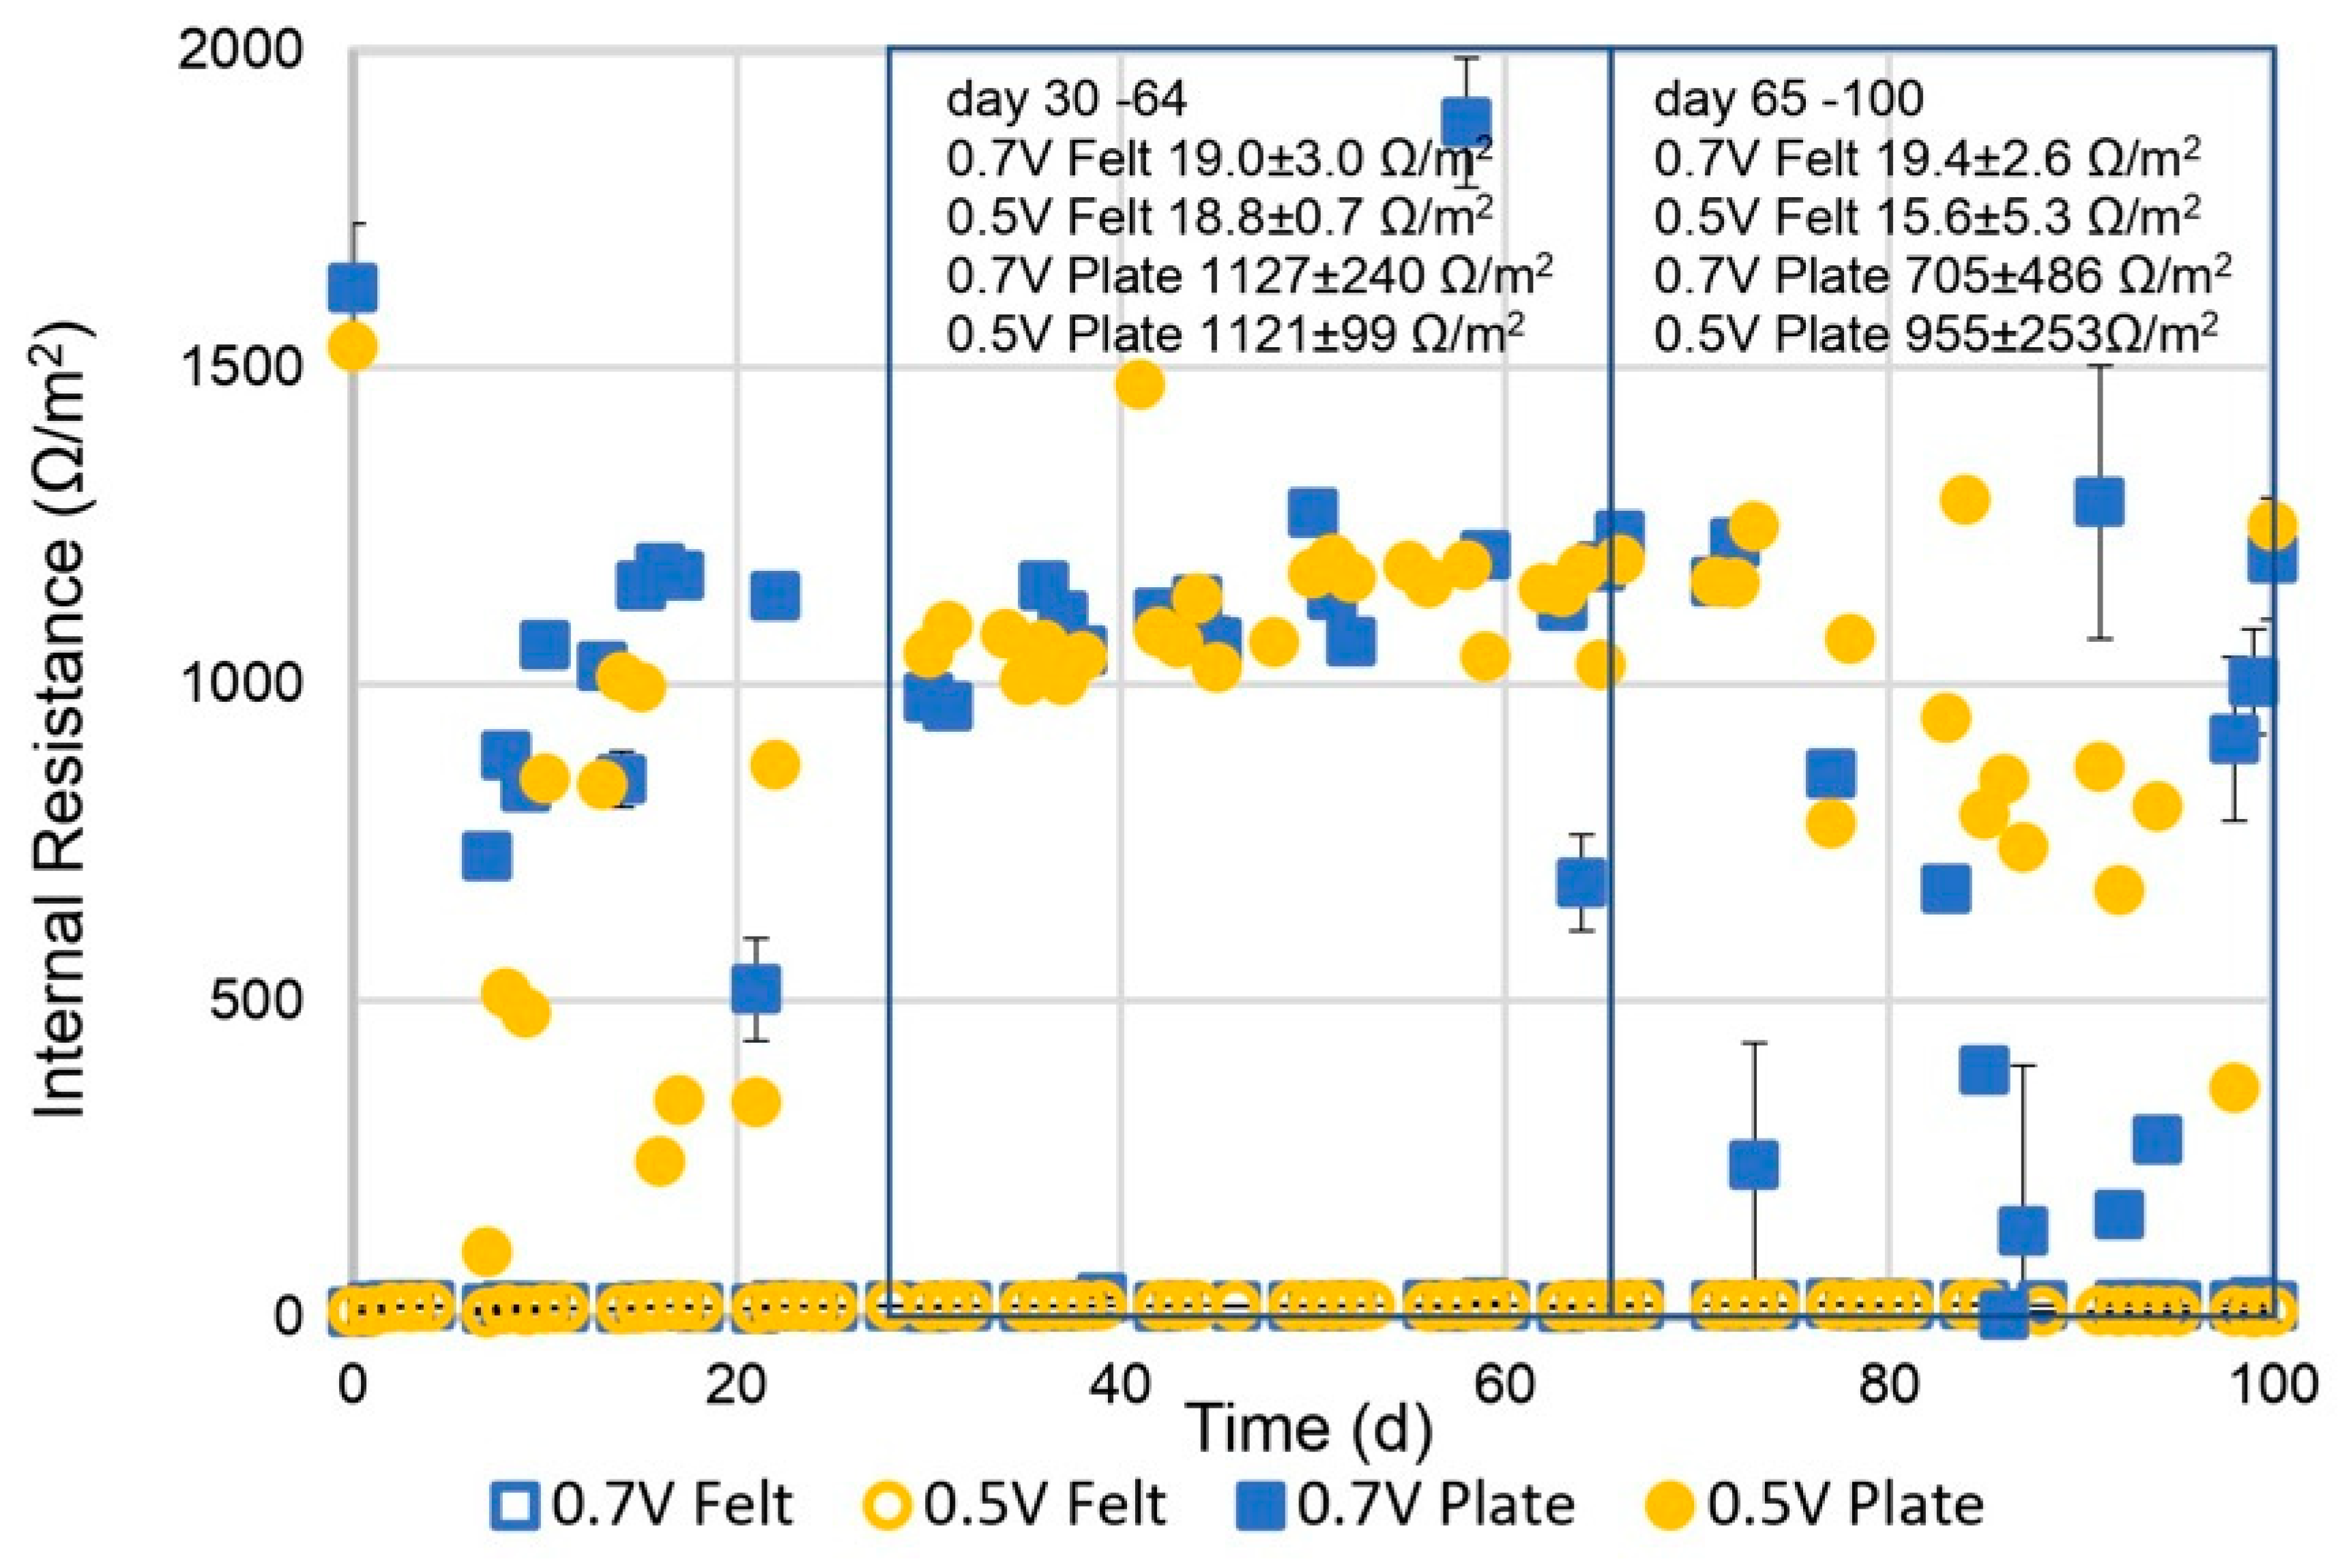
The internal resistance profiles (Ω/m2) under varying experimental conditions are presented in Figure 9, comparing the performance of graphite felt electrodes and graphite plate electrodes at applied potentials of 0.5 V and 0.7 V. Consistent with the findings of Colantoni et al. [21], the graphite felt electrodes demonstrated a lower internal resistance as compared to the graphite plate electrodes The application of the graphite felt reduced the internal resistance per unit of area approximately 50 times. In Phase 1 (Days 30–64), internal resistance differed significantly between the electrode materials. The graphite felt electrodes exhibited consistently low internal resistance, with average values of 19.0 ± 3.0 Ω/m2 at 0.7 V and 18.8 ± 0.7 Ω/m2 at 0.5 V. In contrast, the graphite plate electrodes showed substantially higher internal resistance, with averages of 1127 ± 240 Ω/m2 at 0.7 V and 1121 ± 99 Ω/m2 at 0.5 V. In Phase 2 (Days 65–100), the internal resistance of the graphite felt electrodes remained low and stable, with averages of 19.4 ± 2.6 Ω/m2 at 0.7 V and 15.6 ± 3.5 Ω/m2 at 0.5 V. For the graphite plate electrodes, the internal resistance decreased compared to Phase 1, averaging 705 ± 486 Ω/m2 at 0.7 V and 955 ± 253 Ω/m2 at 0.5 V. Despite this reduction, the internal resistance of the graphite plate electrodes remained significantly higher than that of the graphite felt electrodes. The decrease in internal resistance and the increase in the variability is likely related to decreased performance of the MEC–AD system in these conditions, indicating a decrease in electroactive bacteria.
Figure 9.
Internal resistance of the MEC–AD system with graphite felt electrodes and graphite plate electrodes.
The results revealed a clear distinction in internal resistance between the electrode materials. The graphite felt electrodes maintained consistently low and stable internal resistance throughout both phases, irrespective of the applied potential. In contrast, the graphite plate electrodes exhibited high internal resistance. These findings underscore the superior performance of graphite felt electrodes in minimizing internal resistance, which enhances the overall system efficiency in MEC–AD systems.
4. Discussion
4.1. Enhanced Biogas Production in MEC–AD Systems
This study demonstrates the efficacy of microbial electrolysis cell-assisted anaerobic digestion (MEC–AD) systems in enhancing biogas production. Applied potentials of 0.5 V and 0.7 V significantly increased the cumulative gas production in systems with both graphite plate and graphite felt electrodes, emphasizing the role of electroactive conditions in stabilizing and improving anaerobic digestion performance. Previous research supports these findings, indicating that applied potentials enhance DIET models—a thermodynamically favorable pathway that accelerates organic substrate breakdown and methane production [13].
The AD control experiment showed a decline in gas production starting around Days 40–45, underscoring the limitations of conventional anaerobic digestion [2,21]. This decline was followed by a pH drop around Day 50, likely caused by reduced methanogenesis, leading to VFA accumulation and microbial population imbalance. Methanogens, which convert VFAs to methane, are slower-growing and more sensitive to environmental changes than acidogenic bacteria [22]. The slow growth rate may have caused a washout of methanogens, evidenced by the observed decrease in VS concentration during the experiment. This reduction in methanogenesis initiated a positive feedback loop: diminished methanogenesis lowered the pH further, exacerbating the inhibition of methanogenic activity and ultimately leading to system collapse. In contrast, reactors with electrodes—whether electroactive (0.5 V and 0.7 V) or non-electroactive (OCV)—outperformed the AD control reactor, suggesting that even the mere presence of electrodes enhances AD performance. Baek et al. [15] identified electrode surface area as a critical factor for improved methane production in MEC–AD systems, as larger surface areas promote microbial adhesion and biomass retention, particularly for methanogens. This increased retention stabilizes and enhances methane production efficiency [4].
In Phase 1, no significant difference was observed in the average biogas production rates between electroactive and non-electroactive MEC–AD systems with graphite plate electrodes. However, the electroactive graphite felt electrodes showed slightly higher average production rates than the non-electroactive reactor (239 ± 3 mL/g/d for 0.5 V and 230 ± 3 mL/g/d for 0.7 V versus 209 ± 6 mL/g/d for OCV). In Phase 2, the differences in average biogas production rates became more pronounced. For graphite plate electrodes, electroactive reactors (0.5 V and 0.7 V) exhibited rates approximately 1.4 times higher than non-electroactive reactors (OCV). Similarly, for graphite felt electrodes, the electroactive reactors (0.5 V and 0.7 V) demonstrated rates 1.3 and 1.1 times higher, respectively, than non-electroactive reactors. These results highlight the positive impact of electroactive electrodes on biogas production in MEC–AD systems, likely due to the presence of electrochemically active biomass. This biomass mitigates VFA accumulation, enhancing AD stability [2,23].
4.2. Enhanced Stability in MEC–AD Systems
The stability of pH is a critical parameter for the effective performance of AD systems, as fluctuations can disrupt microbial communities and impede biogas production. The findings of this study reveal that MEC–AD systems, particularly those with applied potentials of 0.5 V and 0.7 V, effectively mitigated acidification and maintained OLR, and reduced HRT introduced challenging operational conditions. While all systems experienced a decline in pH during this phase, the MEC–AD systems exhibited less pronounced drops compared to the AD control reactor, which suffered severe acidification with pH values as low as 4.8 ± 1.1 [17,21]. The enhanced stability in MEC–AD systems can be attributed to the role of applied potentials in promoting DIET and buffering acidogenic activity [24]. The enhanced stability of TS and VS concentrations in MEC–AD systems can be attributed to the promotion of DIET pathways, which enhance the breakdown of organic solids and support efficient methanogenesis. Systems with applied potentials also demonstrated improved resilience against acidification, as stable TS and VS levels support a balanced microbial ecosystem even under stressed conditions [12].
The observed differences between graphite plate and graphite felt electrodes, in Phase 1, further suggest that electrode material influences pH stability, likely due to differences in surface area. The higher specific surface area of the graphite felt results in more electroactive bacteria and therefore a more stable pH and an enhanced stability of TS and VS concentrations. This is consistent with the findings of Baek et al. [15], demonstrating the electrode surface as a critical factor for the improvement of MEC–AD systems. Overall, these findings emphasize the potential of MEC–AD systems to mitigate the limitations of traditional anaerobic digestion, offering a more sustainable and robust solution for organic waste treatment. By stabilizing pH, TS, and VS concentrations, MEC–AD systems enhance process reliability, making them suitable for scaling up under varying operational challenges.
4.3. Cathode and Anode Potentials in MEC–AD Systems
Electrode potentials play a critical role in the performance of MEC–AD systems, directly influencing electron transfer efficiency and methane production. The cathode and anode potentials significantly affect electrochemical performance, microbial community structure, and the theoretical maximum energy gain of exoelectrogens for growth and maintenance [25,26]. Cathode potential determines the mechanism of biogas upgrading. At less negative cathode potentials (above −613 mV vs. Ag/AgCl), abiotic hydrogen evolution is thermodynamically limited. In such conditions, electrochemical CO2 reduction to CH4 is expected to occur primarily through direct electron transfer from the cathode to methanogens. Conversely, at cathode potentials more negative than −613 mV vs. Ag/AgCl, abiotic hydrogen evolution increases, enabling a combination of direct and indirect electron transfer, depending on the microbial community [27]. In this study, average cathode potentials were more negative than −613 mV vs. Ag/AgCl, indicating the possibility of combined direct and indirect electron transfer. An exception was observed in the MEC–AD system with graphite felt and an applied potential of 0.5 V, where the cathode potential was slightly above −613 mV vs. Ag/AgCl, suggesting a potential dominance of direct electron transfer for CO2 reduction by methanogens.
In conventional AD, the acetoclastic pathway typically dominates under stable, mesophilic conditions [22]. In MECs, the anode potential influences the methanogenic pathway: at more elevated anode potentials (≥0 mV vs. Ag/AgCl), hydrogenotrophic methanogenesis prevails, while at more reduced anode potentials (−250 mV vs. Ag/AgCl), acetoclastic methanogenesis contributes significantly [25]. Thermodynamically, under standard biochemical conditions, the oxidation of acetate to CH4 (ΔG° = −31 kJ/mol) [26] is more favorable than its direct oxidation to electrical current (ΔG° = −21.6 kJ/mol). Hence, at more negative anode potentials, the acetoclastic pathway is more likely to contribute to methanogenesis. In this study, the average anode potential of the MEC–AD system without an applied potential was significantly more negative (−500 to −400 mV vs. Ag/AgCl) than that of the system with an applied potential (−339 to −3 mV vs. Ag/AgCl). This indicates an enhanced contribution of the hydrogenotrophic pathway to methanogenesis in the latter setup. However, fully elucidating the pathways contributing to biogas upgrading in MEC–AD systems was beyond the scope of this investigation. Further research is required to deepen our understanding of the role of electrode potentials and determine the optimal cathode and anode potentials for influencing methanogenic pathways. Such insights are essential for improving energy recovery and enhancing the resilience of MEC–AD systems.
4.4. Internal Resistance in MEC–AD Systems
Internal resistance is a critical factor influencing the efficiency of microbial electrolysis cell-assisted anaerobic digestion (MEC–AD) systems, as it directly impacts electron flow and energy recovery. Internal resistance comprises three key components: ohmic, charge transfer, and mass transfer resistances [10]. This study revealed significant differences in internal resistance between graphite felt and graphite plate electrodes. Graphite felt electrodes consistently exhibited low and stable internal resistance across both applied potentials (0.5 V and 0.7 V) and operational phases. For example, at 0.7 V in Phase 1, graphite felt electrodes demonstrated an average internal resistance of 19.0 ± 3.0 Ω/m2, indicating optimal electron transfer and energy efficiency. In contrast, graphite plate electrodes displayed substantially higher internal resistance, averaging 1127 ± 240 Ω/m2 at 0.7 V during the same phase. The low internal resistance observed in graphite felt electrodes can be attributed to their superior specific surface area, which enhances electron transfer efficiency. These findings highlight the importance of selecting low-resistance materials, such as graphite felt, to minimize energy losses and enhance the overall performance of MEC–AD systems. Addressing internal resistance is essential for improving energy efficiency and scalability, thereby positioning MEC–AD systems as a sustainable solution for biogas production and waste treatment under various operational conditions.
4.5. Implications for Complex Substrates
Using more complex substrates such as sludge or food waste would shift the MEC–AD system from a fermentation-limited model substrate (glucose) toward hydrolysis- and inhibition-limited digestion. In contrast to readily degradable glucose, complex wastes require extensive hydrolysis and are more prone to ammonia and long-chain VFA accumulation, thereby slowing methane production kinetics and increasing process sensitivity to hydraulic retention time (HRT). Under such conditions, process stability becomes more dependent on effective VFA turnover and robust methanogenic activity.
Recent studies indicate that MEC integration can partially alleviate these limitations. In kitchen waste digestion, the incorporation of an MEC relieved ammonia and acid inhibition while enhancing methane yield through accelerated acid utilization during methanogenesis [28]. Similarly, in semi-continuous food waste digestion, MEC assistance reduced VFA accumulation and accelerated recovery after overloading, thereby mitigating pH-driven process failure [18]. These findings suggest that electroactive conditions may be particularly beneficial in systems treating complex, inhibition-prone substrates.
However, the application of MEC–AD to real waste streams also introduces additional operational challenges. Complex slurries promote solid deposition on electrode surfaces and the formation of thick extracellular polymeric substance layers, which can limit mass transfer and increase internal resistance over prolonged operation. During high-OLR protein-rich digestion, ammonia-induced biofilm cell death was shown to hinder electron transfer efficiency [29], indicating that long-term stability may be constrained by electrode fouling and microbial stress.
Conversely, electroactive electrodes can promote DIET and hydrogenotrophic methanogenesis, potentially enhancing resilience under inhibitory conditions. For example, stable methane production has been observed despite humic substance inhibition when hydrogenotrophic methanogens were enriched on conductive electrodes [2]. Nonetheless, successful scale-up of MEC–AD systems for real waste treatment will require long-term trials under realistic operating conditions, including the routine monitoring of VFA concentrations and dissolved H2, as well as systematic diagnostics of internal resistance to detect electrode fouling and performance decline.
5. Conclusions
This study highlights the significant potential of MEC–AD systems for enhancing biogas production and energy recovery.
Integrating MECs with AD increases methane yields and improves system stability during waste treatment. Applied potentials of 0.5 V and 0.7 V effectively stabilized pH levels, mitigated acidification risks, and enhanced biogas quality under diverse operational conditions. However, the precise mechanisms underpinning the synergy between AD and MEC systems remain unclear. Future research should prioritize elucidating the relationships between electrode potentials and microbial community dynamics, as well as exploring how electrode potentials can be utilized to optimize MEC–AD performance. Such insights will provide the rigorous mechanistic understanding needed to refine operational strategies, develop cost-effective electrode materials, and design more efficient configurations. Addressing these challenges will be critical for advancing the economic viability and scalability of MEC–AD systems. By overcoming these barriers, MEC–AD technology can play a transformative role in achieving circular bio-economy objectives and advancing renewable energy production, contributing meaningfully to global sustainability and carbon neutrality goals.
Author Contributions
Conceptualization, D.H. and R.A.T.; methodology, D.H. and R.A.T.; validation, R.A.T., E.P.Z., F.B.G., M.B.P. and M.Á.S.-G.; formal analysis, R.A.T.; investigation, R.A.T., E.P.Z., F.B.G. and M.B.P.; resources, R.A.T.; data curation, R.A.T.; writing—original draft preparation, R.A.T.; writing—review and editing, R.A.T. and D.H.; visualization, R.A.T.; supervision, D.H.; project administration, M.Á.S.-G.; funding acquisition, D.H. All authors have read and agreed to the published version of the manuscript.
Funding
This project received funding from the European Union’s Horizon 2020 research and innovation program under grant agreement no. 101084405 (CRONUS).
Institutional Review Board Statement
Not applicable.
Informed Consent Statement
Not applicable.
Data Availability Statement
The original contributions presented in this study are included in the article. Further inquiries can be directed to the corresponding author.
Acknowledgments
During the preparation of this work the authors used GPT/4o in order to improve the writing style. After using this tool/service, the authors reviewed and edited the content as needed and take full responsibility for the content of the published article.
Conflicts of Interest
The authors declare no conflicts of interest.
References
- Wang, W.; Lee, D.-J.; Lei, Z. Integrating Anaerobic Digestion with Microbial Electrolysis Cell for Performance Enhancement: A Review. Bioresour. Technol. 2022, 344, 126321. [Google Scholar] [CrossRef] [Scilit]
- Wang, X.-T.; Zhang, Y.-F.; Wang, B.; Wang, S.; Xing, X.; Xu, X.-J.; Liu, W.-Z.; Ren, N.-Q.; Lee, D.-J.; Chen, C. Enhancement of Methane Production from Waste Activated Sludge Using Hybrid Microbial Electrolysis Cells-Anaerobic Digestion (MEC-AD) Process—A Review. Bioresour. Technol. 2022, 346, 126641. [Google Scholar] [CrossRef] [Scilit]
- Yang, J.; Zhang, J.; Du, X.; Gao, T.; Cheng, Z.; Fu, W.; Wang, S. Ammonia Inhibition in Anaerobic Digestion of Organic Waste: A Review. Int. J. Environ. Sci. Technol. 2024, 22, 3927–3942. [Google Scholar] [CrossRef] [Scilit]
- Baek, G.; Rossi, R.; Saikaly, P.E.; Logan, B.E. The Impact of Different Types of High Surface Area Brush Fibers with Different Electrical Conductivity and Biocompatibility on the Rates of Methane Generation in Anaerobic Digestion. Sci. Total Environ. 2021, 787, 147683. [Google Scholar] [CrossRef] [Scilit]
- Sun, J.; Pan, F.; Zhu, H.; Wu, Q.; Pan, C.; Lu, F. Enhancing Low-Temperature Anaerobic Digestion of Low-Strength Organic Wastewater through Bio-Electrochemical Technology. Int. J. Hydrogen Energy 2024, 58, 1062–1074. [Google Scholar] [CrossRef] [Scilit]
- Zhang, Y.; Angelidaki, I. Microbial Electrolysis Cells Turning to Be Versatile Technology: Recent Advances and Future Challenges. Water Res. 2014, 56, 11–25. [Google Scholar] [CrossRef] [Scilit]
- Liu, D.; Zhang, L.; Chen, S.; Buisman, C.; Ter Heijne, A. Bioelectrochemical Enhancement of Methane Production in Low Temperature Anaerobic Digestion at 10 °C. Water Res. 2016, 99, 281–287. [Google Scholar] [CrossRef] [Scilit]
- Wang, H.; Liu, Y.; Du, H.; Zhu, J.; Peng, L.; Yang, C.; Luo, F. Exploring the Effect of Voltage on Biogas Production Performance and the Methanogenic Pathway of Microbial Electrosynthesis. Biochem. Eng. J. 2021, 171, 108028. [Google Scholar] [CrossRef] [Scilit]
- Wang, X.-T.; Zhao, L.; Chen, C.; Chen, K.-Y.; Yang, H.; Xu, X.-J.; Zhou, X.; Liu, W.-Z.; Xing, D.-F.; Ren, N.-Q.; et al. Microbial Electrolysis Cells (MEC) Accelerated Methane Production from the Enhanced Hydrolysis and Acidogenesis of Raw Waste Activated Sludge. Chem. Eng. J. 2021, 413, 127472. [Google Scholar] [CrossRef] [Scilit]
- Yu, Z.; Leng, X.; Zhao, S.; Ji, J.; Zhou, T.; Khan, A.; Kakde, A.; Liu, P.; Li, X. A Review on the Applications of Microbial Electrolysis Cells in Anaerobic Digestion. Bioresour. Technol. 2018, 255, 340–348. [Google Scholar] [CrossRef] [Scilit] [PubMed]
- Jiang, X.; Chen, D.; Mu, Y.; Pant, D.; Cheng, H.; Shen, J. Electricity-Stimulated Anaerobic System (ESAS) for Enhanced Energy Recovery and Pollutant Removal: A Critical Review. Chem. Eng. J. 2021, 411, 128548. [Google Scholar] [CrossRef] [Scilit]
- Yan, X.; Peng, P.; Li, X.; Miao, Y.; Chen, L.; Zhao, F. Bridging Energy and Microbes: How the Anodic Potential of Microbial Electrolysis Cell Improves Anaerobic Digestion. J. Power Sources 2024, 623, 235489. [Google Scholar] [CrossRef] [Scilit]
- Guo, M.; Wei, S.; Guo, M.; Li, M.; Qi, X.; Wang, Y.; Jia, X. Potential Mechanisms of Propionate Degradation and Methanogenesis in Anaerobic Digestion Coupled with Microbial Electrolysis Cell System: Importance of Biocathode. Bioresour. Technol. 2024, 400, 130695. [Google Scholar] [CrossRef] [Scilit] [PubMed]
- Amrut Pawar, A.; Karthic, A.; Lee, S.; Pandit, S.; Jung, S.P. Microbial Electrolysis Cells for Electromethanogenesis: Materials, Configurations and Operations. Environ. Eng. Res. 2020, 27, 200484. [Google Scholar] [CrossRef] [Scilit]
- Baek, G.; Kim, K.-Y.; Logan, B.E. Impact of Surface Area and Current Generation of Microbial Electrolysis Cell Electrodes Inserted into Anaerobic Digesters. Chem. Eng. J. 2021, 426, 131281. [Google Scholar] [CrossRef] [Scilit]
- Rousseau, R.; Etcheverry, L.; Roubaud, E.; Basséguy, R.; Délia, M.-L.; Bergel, A. Microbial Electrolysis Cell (MEC): Strengths, Weaknesses and Research Needs from Electrochemical Engineering Standpoint. Appl. Energy 2020, 257, 113938. [Google Scholar] [CrossRef] [Scilit]
- Azpitarte, I.; Eletxigerra, U.; Barros, A.; Aranzabe, E.; Cid, R. Electrochemical Evaluation of Different Graphite Felt Electrode Treatments in Full Vanadium Redox Flow Batteries. Batteries 2023, 9, 39. [Google Scholar] [CrossRef] [Scilit]
- Xiao, B.; Wang, X.; He, E.; Zuo, Y.; Wan, L.; Li, L. Effects of Microbial Electrolysis Cell on Anaerobic Digestion of Food Waste: Acidification and Recovery. Fuel 2024, 369, 131756. [Google Scholar] [CrossRef] [Scilit]
- Ao, T.-J.; Wu, J.; Li, K.; Chandra, R.; Zhao, X.-Q.; Tang, Y.-Q.; Liu, C.-G.; Bai, F.-W. Cellulosic Ethanol Stillage for Methane Production by Integrating Single-Chamber Anaerobic Digestion and Microbial Electrolysis Cell System. Sci. Total Environ. 2024, 951, 175814. [Google Scholar] [CrossRef] [Scilit]
- Molognoni, D.; Garcia, M.; Sánchez-Cueto, P.; Bosch-Jimenez, P.; Borràs, E.; Lladó, S.; Ghemis, R.; Karakachian, G.; Aemig, Q.; Bouteau, G. Electrochemical Optimization of Bioelectrochemically Improved Anaerobic Digestion for Agricultural Digestates’ Valorisation to Biomethane. J. Environ. Manag. 2025, 373, 123898. [Google Scholar] [CrossRef] [Scilit] [PubMed]
- Colantoni, S.; Santiago, Ó.; Weiler, J.R.; Knoll, M.T.; Lapp, C.J.; Gescher, J.; Kerzenmacher, S. Comparative Study of Bioanodes for Microbial Electrolysis Cells Operation in Anaerobic Digester Conditions. J. Environ. Chem. Eng. 2024, 12, 113071. [Google Scholar] [CrossRef] [Scilit]
- Chen, G.; Ekama, G.A.; Van Loosdrecht, M.C.M.; Brdjanovic, D. (Eds.) Anaerobic Wastewater Treatment. In Biological Wastewater Treatment: Principles, Modeling and Design; IWA Publishing: London, UK, 2020; pp. 701–756. ISBN 978-1-78906-036-2. [Google Scholar]
- Wang, D.; Hao, Z.; Tao, S.; Shi, Z.; Liu, Z.; Liu, E.; Long, S. Enhanced Methane Production from Waste Activated Sludge by Microbial Electrolysis Cell Assisted Anaerobic Digestion: Fate and Effect of Humic Substances. Bioresour. Technol. 2024, 403, 130872. [Google Scholar] [CrossRef] [Scilit] [PubMed]
- Peng, C.; Wang, T.; Feng, Y.; Fan, X.; Niu, J.; Wang, J.; Gao, W.; Zhou, Y.; Hu, W.; Zhang, Q. Enhanced Hydrolysis and Methane Yield of Temperature-Phased Dewatered Sludge Anaerobic Digestion by Microbial Electrolysis Cell. Bioresour. Technol. 2024, 400, 130682. [Google Scholar] [CrossRef] [Scilit]
- Hari, A.R.; Katuri, K.P.; Logan, B.E.; Saikaly, P.E. Set Anode Potentials Affect the Electron Fluxes and Microbial Community Structure in Propionate-Fed Microbial Electrolysis Cells. Sci. Rep. 2016, 6, 38690. [Google Scholar] [CrossRef] [Scilit]
- Stams, A.J.M.; Sousa, D.Z.; Kleerebezem, R.; Plugge, C.M. Role of Syntrophic Microbial Communities in High-Rate Methanogenic Bioreactors. Water Sci. Technol. 2012, 66, 352–362. [Google Scholar] [CrossRef] [Scilit] [PubMed]
- Ragab, A.; Shaw, D.R.; Katuri, K.P.; Saikaly, P.E. Effects of Set Cathode Potentials on Microbial Electrosynthesis System Performance and Biocathode Methanogen Function at a Metatranscriptional Level. Sci. Rep. 2020, 10, 19824. [Google Scholar] [CrossRef] [Scilit]
- Chen, Y.; Dai, X.; Wang, H.; Liu, X.; Gu, L. Insights into the Mitigative Effects of Microbial Electrolysis Cell on Anaerobic Digestion under High Ammonia Condition. Chem. Eng. J. 2023, 474, 145760. [Google Scholar] [CrossRef] [Scilit]
- Liu, C.; Cao, Q.; Luo, X.; Yan, S.; Sun, Q.; Zheng, Y.; Zhen, G. In-Depth Exploration of Microbial Electrolysis Cell Coupled with Anaerobic Digestion (MEC-AD) for Methanogenesis in Treating Protein Wastewater at High Organic Loading Rates. Energy Convers. Manag. 2025, 323, 119152. [Google Scholar] [CrossRef] [Scilit]
Disclaimer/Publisher’s Note: The statements, opinions and data contained in all publications are solely those of the individual author(s) and contributor(s) and not of MDPI and/or the editor(s). MDPI and/or the editor(s) disclaim responsibility for any injury to people or property resulting from any ideas, methods, instructions or products referred to in the content. |
© 2026 by the authors. Licensee MDPI, Basel, Switzerland. This article is an open access article distributed under the terms and conditions of the Creative Commons Attribution (CC BY) license.