


Abstract
Metanil Yellow (MY), a highly toxic azo dye used in food products, was removed from aqueous solution using a metal- and halide-free ordered mesoporous carbon (OMC) adsorbent. MY exhibited a strong affinity towards OMC in batch as well as column operations, and OMC performed much better than previously reported adsorbents. The pH, dye concentration, adsorbent dosage, and contact time were optimised, and detailed adsorption experiments were performed under these conditions. Several isotherm models were fitted to the adsorption data, showing that the Langmuir and the Freundlich adsorption models were followed. Adsorption was spontaneous and endothermic at all measurement temperatures. On the basis of pH studies, enthalpy data, and adsorption isotherm analysis, adsorption was determined to be by physisorption. In kinetics studies, the adsorption process was found to be pseudo-second order with interparticle diffusion as the rate-limiting step. Column experiments using a fixed bed of OMC resulted in almost 100% column efficiency and a fractional column capacity of 0.999. During adsorption/desorption cycles of the exhausted column, 99.71% of the dye was recovered after the first cycle and 97.66% after the eleventh. These findings indicate that OMC is a promising and efficient material for the adsorptive removal of toxic MY dye.
1. Introduction
Water contamination and the availability of safe drinking water are serious challenges to mankind. It is now well established that this problem is a direct consequence of increasing population [1]. With population growth, industrialisation is also increasing rapidly, and the consequent release of industrial effluents is an ever more serious threat to water quality. Synthetic organic dyes are present in a large proportion of industrial effluents because of their wide usage in inks, leather, paints, paper, household goods, textile materials, fabrics and pharmaceuticals [2]. Dye-containing wastewater harms aquatic ecosystems by introducing carcinogenic, mutagenic and toxic compounds, in addition to causing discolouration [3].
Most dyes are difficult to remove from wastewater using regular physical or biological treatments because of their complex structure and large molecular size. Oxidation/reduction of the dye molecules, possibly into smaller toxic byproducts, further complicates the issue. Therefore, wastewater treatment is a challenging task that should be tackled very carefully. In the last 20 years, globally many technologies have been developed, including absorption [4], advanced oxidation [5], coagulation [6], photocatalytic degradation [7], filtration [8] and ozonation [9]. Of these, adsorption is the best option, as it is versatile, low-cost, simple to use, effective and able to remove large organic molecules without fragmenting them into smaller harmful species. An effective adsorption process requires both an efficient adsorbent as well as an appropriate adsorbate [10,11].
In this paper, we attempt to develop a safe and fast method for the adsorptive removal of the azo dye, Metanil Yellow (MY), using metal- and halide-free ordered mesoporous carbon (OMC) as an adsorbent. Azo dyes, which possess at least one azo group (–N=N–) in their structures, exhibit various brilliant colours and are widely used in a range of industries [12]. MY is a yellow, synthetic, anionic azo dye commonly used as a food adulterant, particularly in modified turmeric, pulses and Asian sweets [13,14]. The dye is also used in various industrial applications, such as biological stains, cosmetics, detergents, inks, paper, nylon, silk and wool [15]. However, MY poses significant health risks, including carcinogenicity, mutagenicity, neurotoxicity, and organ toxicity. Long-term exposure to this dye is linked to gastrointestinal problems, liver damage, and kidney dysfunction in humans, while some individuals experience allergic reactions that range from mild skin irritation to severe complications, such as breathing difficulties and anaphylaxis [16]. Animal studies suggest that excessive exposure to MY may lead to malignant tumours, particularly in the liver and gallbladder, as well as cognitive and neurological disabilities [17].
For adsorptive dye removal, selection of the adsorbent is key. Adsorbents with the desired properties—such as high surface area, large pore volume, nanoscale pore size, fast reaction rates and strong adsorption capacity—are rare. Additionally, control of pore size, shape and surface chemistry of the adsorbent is always challenging. Over the past few decades, various carbon-based adsorbents—such as activated carbon [18], biochar [19], carbon aerogels [20], carbon black [21], carbon nanotubes and graphene oxide [22])—have been used as adsorbents to treat dye-contaminated wastewater. More recently, OMC has gained much attention as an effective adsorbent due to its tunable pore size, high surface area and versatility [23,24].
A survey of the literature reveals that attempts to adsorb the toxic dye, MY, using mesoporous or ordered mesoporous carbons have never been reported. As discussed below (Section 4), MY removal from aqueous solution has been carried out either using waste materials, carbonised agricultural products or costly synthetic materials like layered double hydroxides, polymer composites and chemically functionalized materials, and most of these are either contaminated or scarce and therefore unfit for the water treatment process. In the present work, we used a metal- and halide-free OMC as an adsorbent, which is completely uncontaminated and easy to prepare.
In previous research, attempts have been made to remove various other dyes by adsorption on OMCs. However, the OMCs used in these studies were produced through a hard-template method, which requires highly corrosive and hazardous reagents [25,26]. Although by introducing soft-template synthesis methods, some of these risks were reduced, the use of halide- and metal-containing catalysts during synthesis added complexity and raised environmental concerns [27,28]. The OMC used in the present study has been synthesised using alternative, halide- and metal-free catalysts, and therefore avoids these problems. In contrast to conventional mesoporous carbons, which typically have irregular pore structures and a broad range of pore sizes, the ordered mesoporous carbon (OMC) used in the present research features a well-defined and ordered arrangement of the pore network with higher surface area, leading to enhanced adsorption performance.
A further novelty of this study is the evaluation of the effectiveness of removing MY in batch experiments, but also using a fixed bed of OMC in column experiments. Importantly, once the exhaustion of the column is attained, by eluting with a suitable reagent, the dye can be safely retrieved through desorption. After washing the column, the OMC material can be reused in further column operations. Repeating such desorption cycles offers further insights into the material’s performance and its potential for repeated use in wastewater treatment.
The present paper includes details of the preparation and characterisation of metal- and halide-free OMC. Comprehensive batch studies include optimisation of various experimental parameters. Based on the results, detailed adsorption data were obtained, and several adsorption isotherm models were tested against these. To determine the order and dynamics of the process, kinetic measurements—considering factors such as intra- and interparticle diffusion—are also presented.
2. Materials and Methods
To synthesise OMC, formaldehyde, oxalic acid, Pluronic F–127 and resorcinol were purchased from Sigma Aldrich (Bangalore, India). MY and other A.R. grade chemicals (HCl and NaOH) were procured from Merck (Darmstadt, Germany). All the working solutions of the MY dye were prepared by diluting its stock solution (0.1 M) using doubly distilled water. The pH of the dye solutions was maintained using 0.1 M HCl and 0.1 M NaOH solutions, and the pH of each sample was determined with the help of a microprocessor-based pH meter, model no. 1013 (M/s Electronics, Panchkula, India). The dye concentration of the working samples was determined by recording absorbance at the λmax of 435 nm using a double-beam UV/Visible spectrophotometer (ESICO, Ambala, India). To agitate the solution, a mechanical water bath shaker (Remi RSB–12, REMI ELEKTROTECHNIK Ltd., Mumbai, India) was employed.
2.1. Synthesis and Characterisation of Metal– and Halide–Free OMC
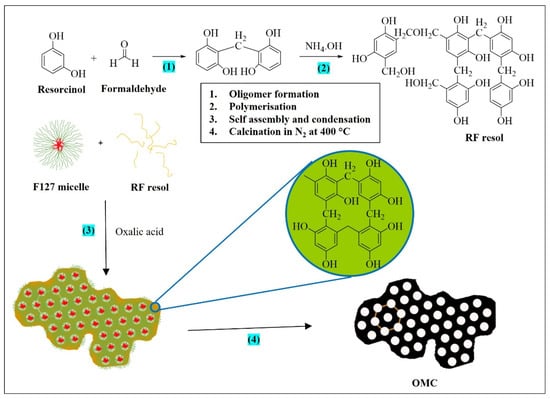
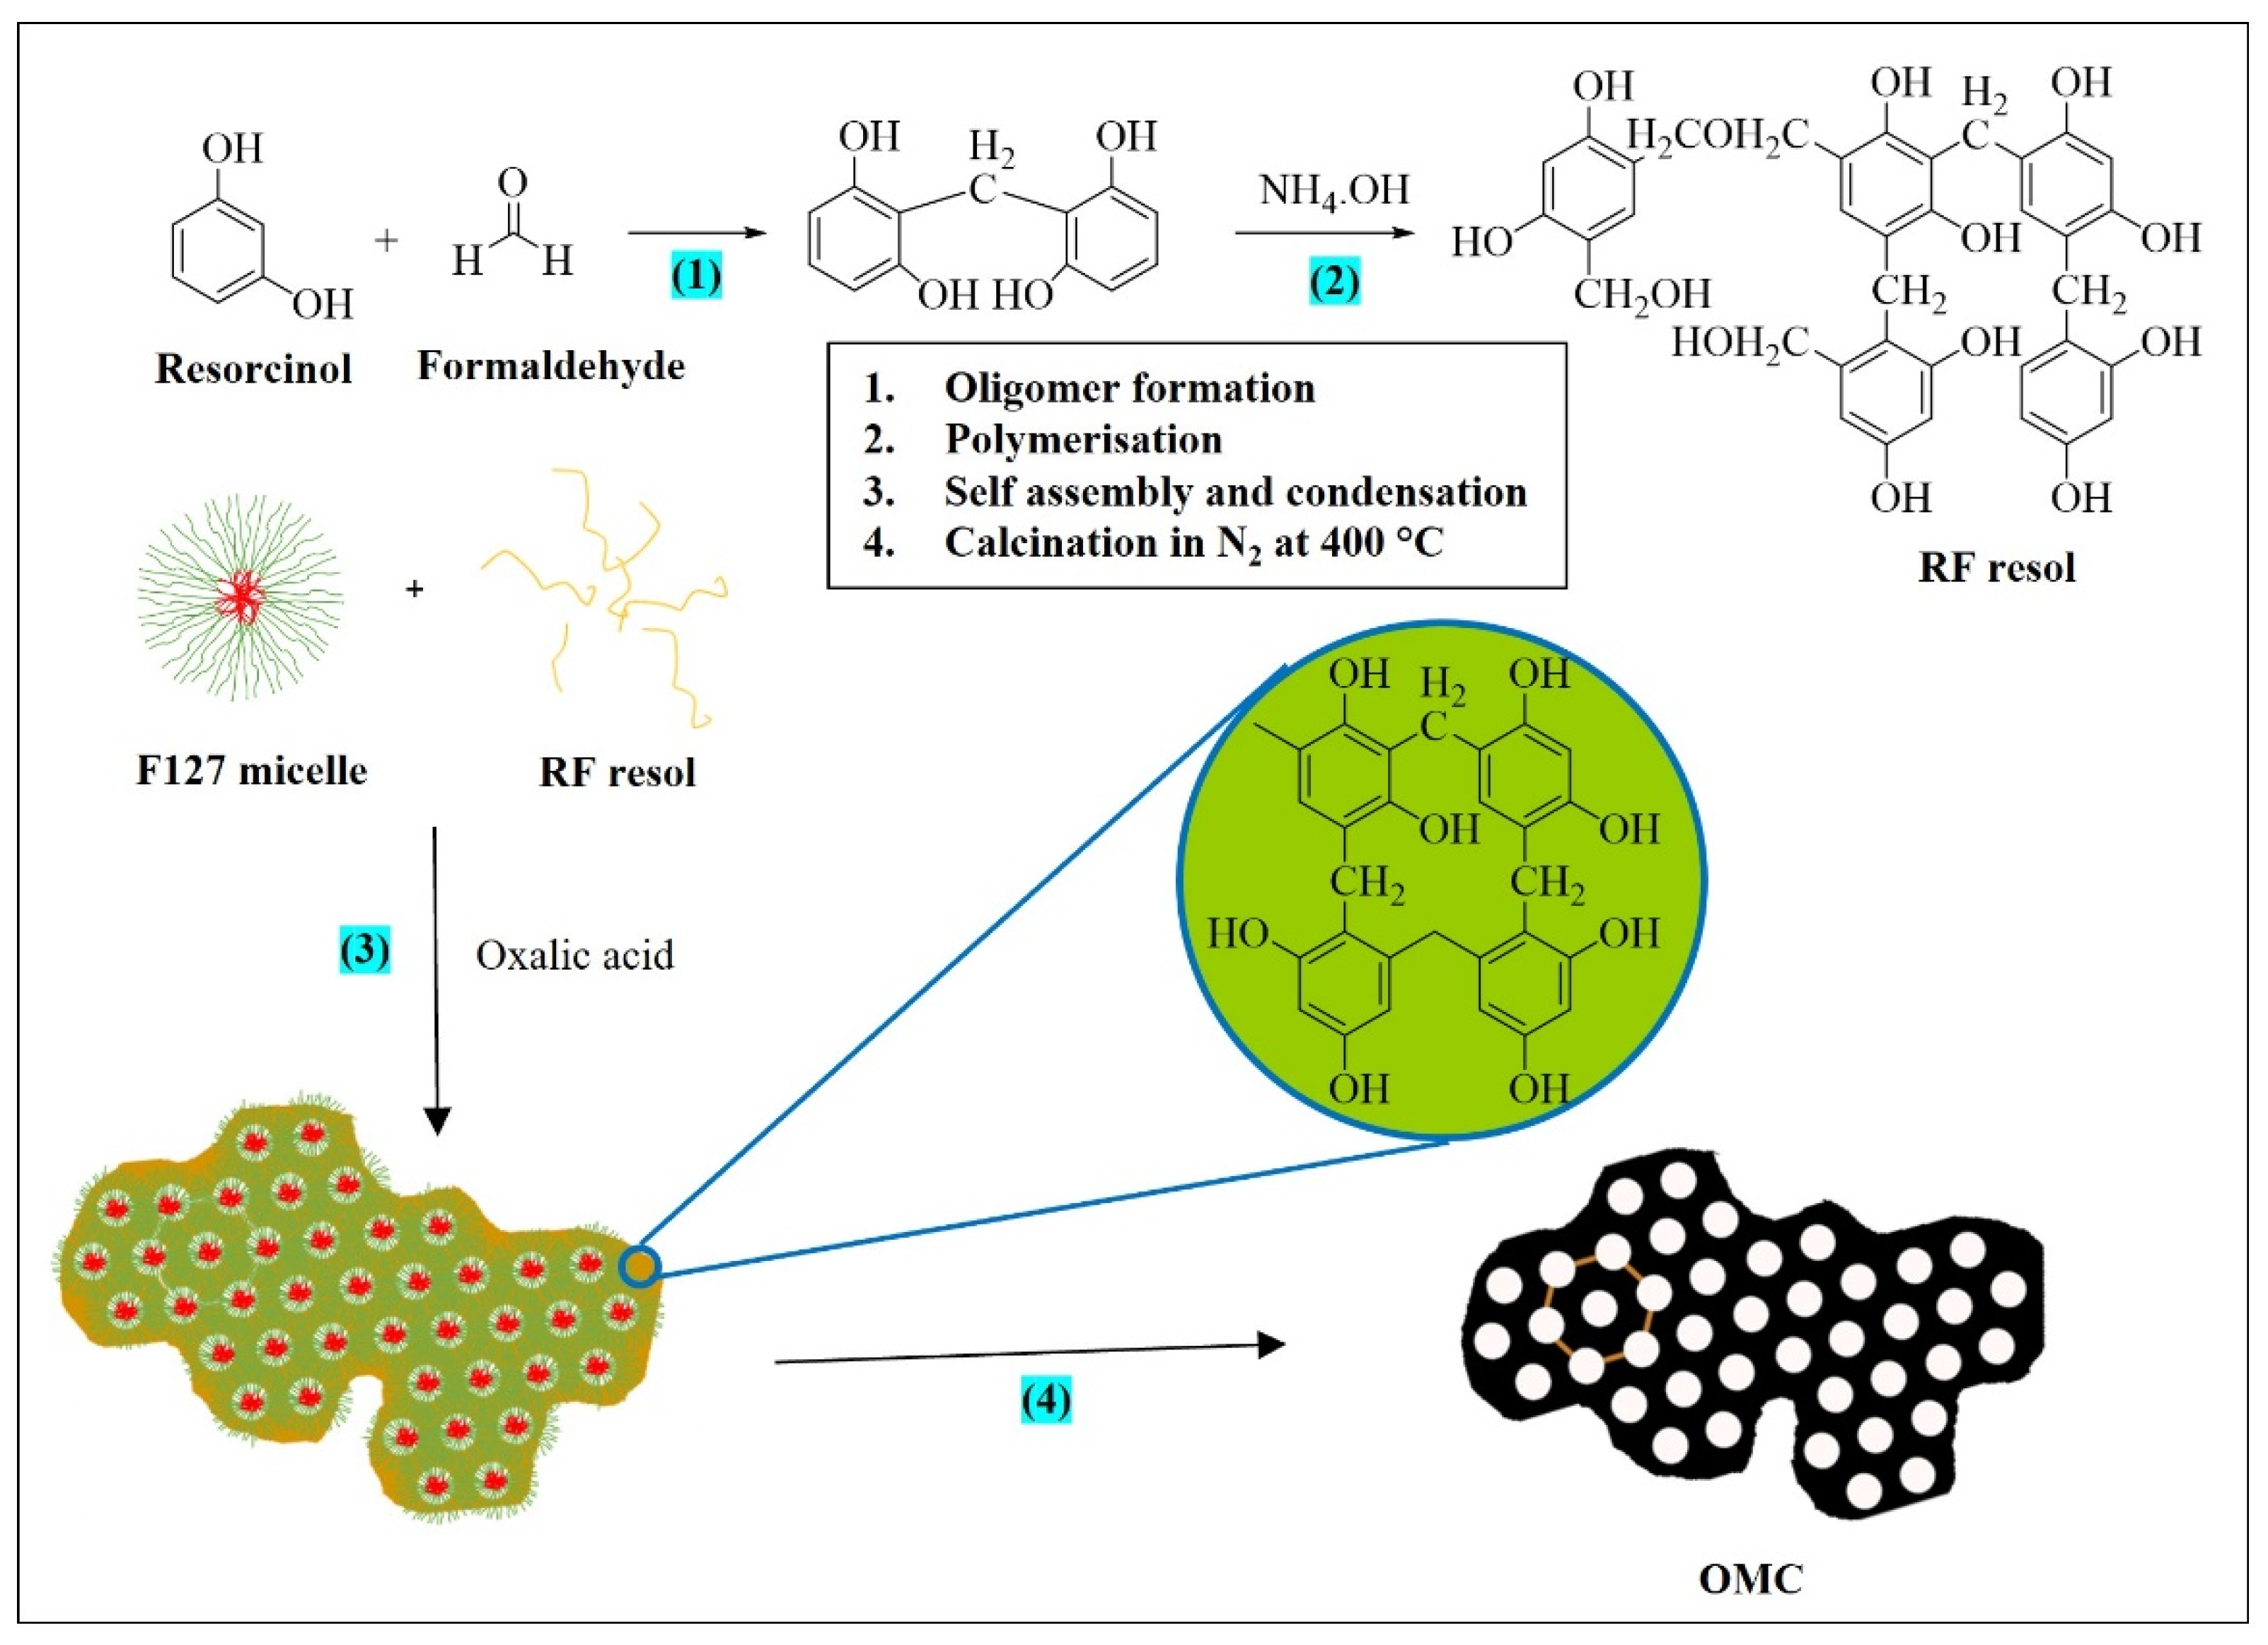
To prepare the OMC adsorbent, a soft templating approach, developed by Sakina and Baker (2019) [29] and summarised in Figure 1, was adopted. Importantly, this method avoided the use of halide and metal-containing inorganic catalysts, which might be retained as contaminants in the final product. Briefly, a thin resin, known as a ‘Resol’, is formed by the condensation polymerisation reaction between formaldehyde and resorcinol. This process is carried out in the presence of a self-organising assembly of stacked cylindrical micelles, formed from a solution of the block copolymer, Pluronic F127. Since the polymer then must form between these micelles, it takes on a mesoporous structure, which is the inverse of that of the soft template. On drying and heating, the copolymer is removed, leaving a rigid, ordered mesoporous structure. High-temperature heating in inert gas removed the majority of the functional groups, giving rise to the OMC product.
Figure 1.
Synthesis of the metal- and halide-free OMC material and chemical reactions.
Typically, formaldehyde (2.26 g in 37 wt % aqueous solution) and resorcinol (2.20 g) are mixed by stirring (1 h). Aqueous NH4OH (2 mL, 0.1 M) is then added to this, and the solution is mixed by stirring (1 h), forming the Resol. A solution in ethanol (10 g) and distilled water (8 g) of Pluronic F127 (1.60 g) was prepared and mixed with the Resol under constant stirring for 20 min. Oxalic acid (0.225 g) is then added with stirring (5–10 min.) to catalyse the condensation polymerisation reaction, which causes the solution to become slightly opaque. The mixture was further stirred (1 h) and kept untouched for about 12 h to allow formation of a gel. The gel thus formed was dried for another 12 h at ambient temperature and then allowed to cure (24 h at 80 °C). In the final step, the material was calcined in an inert atmosphere (100 mL·min−1 N2 at STP) in a tube furnace (3 h at 400 °C, with a heating rate of 1 °C·min−1). The resulting OMC product—a fine, black powder—was stored in a desiccator for further study.
The OMC product was characterised by X-ray Diffraction (XRD), Fourier Transform Infra-red (FTIR) spectroscopy and nitrogen gas physisorption, using an Empyrean diffractometer (PANalytical B.V., Almelo, The Netherlands), an IRAffinity 1S spectrometer (Shimadzu Corporation, Kyoto, Japan) and a TriStar II 3020 (M/s Micromeritics, Norcross, GA, USA), respectively. In XRD, Cu Kα radiation was used to record diffractograms over the angular range of 10–90°. In FTIR, background spectra were recorded prior to taking the spectra of the samples. Gas adsorption was carried out at −196 °C, and samples were heated at 120 °C for 12 h under vacuum to degas them prior to the study. OMC materials were also studied by scanning electron and transmission electron microscopy (SEM and TEM). For SEM, a powdered sample was deposited in a thin layer on an aluminium stub and imaged in secondary electron mode using a JSM–IT200 instrument (M/s JEOL, Tokyo, Japan). For TEM, a small amount of crushed OMC was suspended in acetone, ultrasonicated and deposited onto holey-carbon-coated copper grids. TEM imaging was performed using a probe-corrected Titan instrument (M/s FEI, Hillsboro, OR, USA) furnished with an X–FEG Schottky field emission gun and operating at 200 kV.
Gas physisorption confirmed that the mesopores present in the OMC material are numerous and uniform in diameter and that they are significantly larger than the micropores typically found in zeolites and MOFs. In addition, FTIR studies identified the presence of chemical functional groups, most of which are likely to reside at the pore surfaces. Such a mesopore structure is expected to allow efficient ingress of the relatively large dye molecules into the bulk of the OMC, while these functional groups should then interact strongly with these molecules, favouring adsorption.
2.2. Dye Adsorption Through Batch Process
To carry out dye removal using a batch process, a conical flask (100 mL) is filled with 20 mL of MY dye solution of a fixed concentration, and a predetermined amount of OMC is added to it. The mixture is stirred for a fixed time interval in the water bath mechanical shaker. The solution thus obtained was passed through Whatmann filter paper, and the absorbance of the filtrate was recorded using the UV–Vis spectrophotometer at λmax = 435 nm, and accordingly, the dye concentration in the final solution was determined, while the dye-adsorbed OMC was collected separately. The MY uptake was estimated using Equation (1):
The percentage yield is converted into the amount of dye adsorbed (mg/g) using the following mathematical expression:
Here, Co (mol/L) and Cf (mol/L) correspond to the absorbance before and after adsorption, respectively. V is the volume of dye solution in 1 L, Ce is the initial concentration in mol/L and m (g) is the mass of the dye used. The molar mass of the Metanil Yellow dye is 375.38 g/mol.
Optimisation of key parameters—pH, dye concentration, adsorbent dosage and contact time—was carried out under batch conditions. The effect of pH was monitored by varying the pH of the solution from 1 to 12 and keeping other factors the same: 0.01 g of adsorbent, dye concentration of 8 × 10⁻⁶ M and 60 min. of agitation. Variation in dye concentration was evaluated at pH 2 using 0.01 g of adsorbent and a contact time of 60 min. The variation in dosage of adsorbent was performed at pH 2, dye concentration of 8 × 10⁻⁶ M and with a mixing time of 60 min. The influence of contact time was determined at pH 2 with 0.01 g of adsorbent and a dye concentration of 8 × 10⁻⁶ M.
In the present study, four adsorption isotherm models, namely, Langmuir, Freundlich, Temkin and Dubinin–Radushkevitch (D-R), were tested against the experimental adsorption data. All the adsorption isotherm studies were carried out under the above-mentioned optimal conditions of pH, dye concentration, adsorbent dosage and contact time at temperatures of 303, 313 and 323 K. Thermodynamic parameters were also evaluated at 303, 313 and 323 K by using the value of the Langmuir constant, obtained from Langmuir adsorption isotherm studies.
The kinetic behaviour of the MY–OMC adsorption system was evaluated using the contact time data, which was analysed through two established kinetic models, the Lagergren pseudo-first-order and the Ho–McKay pseudo-second-order equations. Both these models were tested by obtaining experimental data at three temperatures (303, 313 and 323 K), taking 20 mL of 8 × 10⁻⁶ M dye solution with 0.01 g of OMC at pH 2 in a stoppered flask and varying the contact time from 15 to 105 min.
2.2.1. Theory of Kinetic Investigations
Determination of Order and Rate of the Adsorption Process
In order to ascertain the rate of the adsorption process, the data obtained in contact time studies is fitted to the Lagergren pseudo-first-order [30] and Ho–McKay pseudo-second-order [31] kinetic models. The linear mathematical forms of the two models are presented respectively in Equations (3) and (4).
In these equations, t denotes time (min), Qe and Qt (mg/g) represent the adsorption capacities at equilibrium and at time t, respectively, k1 (g/mol·min) is the pseudo-first-order rate constant, and k2 is the pseudo-second-order rate constant. Verification of the models was done by obtaining the best-fit straight lines of plots of t versus (Equation (3)) and t versus (Equation (4)).
Determination of Reaction Mechanism of the Adsorption Process
The rate-limiting step for the diffusion of adsorbate molecules on the surface of the adsorbent is defined through three processes, namely, film diffusion, particle diffusion and intraparticle diffusion. A detailed overview of these diffusion processes has been presented by Weber and colleagues [32]. To identify the applicable diffusion model, the kinetic data are fitted to the mathematical expressions given in Equations (5)–(8).
Here, Qt and Q∞ (mol/g) are adsorption capacities of the adsorbent at time, t, and infinity, respectively; Kid is the intraparticle diffusion constant, Ci is a constant corresponding to a value equal to the thickness of the layer between the adsorbate and adsorbent, F is the fractional degree of equilibrium, n is the Freundlich constant and Bt is the Reichenberg constant [33]. By using the corresponding value of F, the value of Bt is obtained from the Reichenberg table [34]. In Equation (8), Di (cm2/s) is the effective diffusion coefficient, and r is the radius of the adsorbent, which is assumed to be spherical and has r = 5 × 10⁻⁸ cm in the present case.
2.3. Dye Removal in a Continuous Process
2.3.1. Preparation of Fixed Bed Column
To develop a continuous dye removal process, a fixed bed of the adsorbent, OMC, was prepared in a 20 cm long glass column of 1 cm internal diameter. The column was supported on about 0.5 cm of glass wool. A slurry of 0.2 g OMC was prepared in 1000 mL of double-distilled water and kept for 24 h. The slurry was subsequently added to the column under a steady flow to avoid any air disturbance and entrapment. Thus, an approximately 1 cm long uniform deposit of OMC was obtained.
2.3.2. Adsorption of Dye on the Fixed Bed Column
After draining the water, a total of 700 mL of MY solution (1 × 10⁻⁴ M of pH 2) was very carefully passed through the OMC column at a flow rate of 8 mL/min. Samples of the exiting dye solution, each of 10 mL volume, were collected in test tubes, and their concentrations were determined using the UV/Visible spectrophotometer. Sample collection continued until the concentrations of the extracted samples matched the injected dye concentration, indicating exhaustion of the OMC bed. Breakthrough curves of the concentration of the dye versus the collected volume were plotted and used to determine various column parameters and the percentage saturation of the column.
On the basis of the values obtained from the breakthrough curve, various column parameters can be calculated [35] by using Equations (9)–(13):
Here, tx is time required for the complete establishment of the primary adsorption zone (min), Fm is mass flow rate (mg·cm–2·min–1), tδ is time required for the primary adsorption zone to move down its length (min), Vx indicates volume of dye at saturation, while Vb is the volume at the breakthrough point, tf is initial time to form the primary adsorption zone (min), δ is the length of primary adsorption zone (cm), D is the height of the glass wool bed (cm), f is the fractional capacity of the column (cm), Ms is the amount of the adsorbent dye in the primary adsorption zone (g), C is concentration of the dye travelling through the column (mol/L) and %S is the percentage saturation of the column.
2.3.3. Desorption of Dye from the Fixed Bed Column
For the bulk removal of dye for industrial applications, the efficiency of the adsorption column is evaluated by carrying out a series of adsorption–desorption cycles. The column, once exhausted, is regenerated. To remove MY from the exhausted OMC column, a dilute HCl solution (0.1 M) was passed through it in an uninterrupted flow at a rate of 10.5 mL/min. The concentrations of the exiting solution were recorded until the dye concentration in the solution fell to zero. In order to retrieve the dye, aliquots of the dye solution were retained and collectively freeze-dried. HCl is commonly used for desorbing MY dye from adsorbent columns. MY is an anionic dye, and HCl, being a strong acid, provides a low pH environment that disrupts the electrostatic forces binding the dye to the adsorbent material. This facilitates the release of the dye molecules, allowing for effective regeneration of the adsorbent for subsequent use. OMC is a robust material, and its structure and surface are not expected to be affected by dilute HCl.
2.3.4. Assessment of Column Capacity
After retrieving the MY dye, warm, double-distilled water (approximately 500 mL) was passed through the regenerated column, and the assembly was readied for another cycle of operation. To confirm the effectiveness of the column, this process was repeated multiple times, and on the basis of the dye material retrieved against the dye material applied, the efficiency of each column was determined. In the present study, eleven adsorption/desorption cycles were performed.
3. Results and Discussion
3.1. Characterisation of OMC
The structure and composition of the OMC adsorbent were examined by XRD, FT–IR, gas physisorption, SEM and TEM.
3.1.1. X-Ray Diffraction
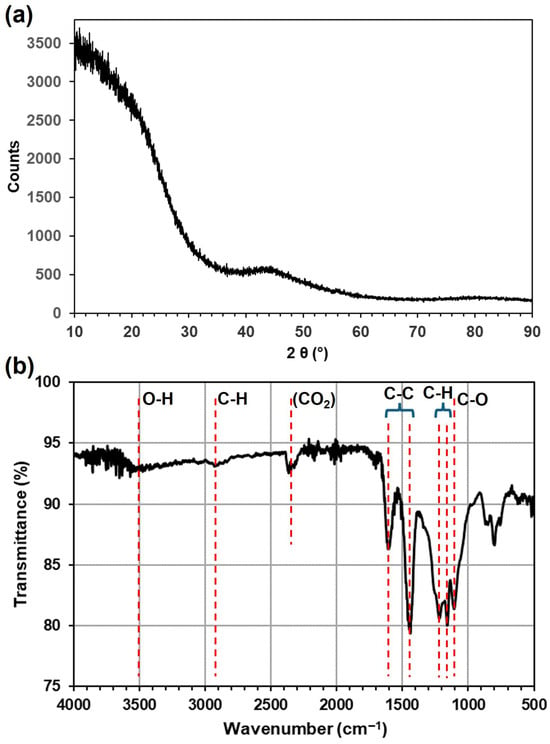
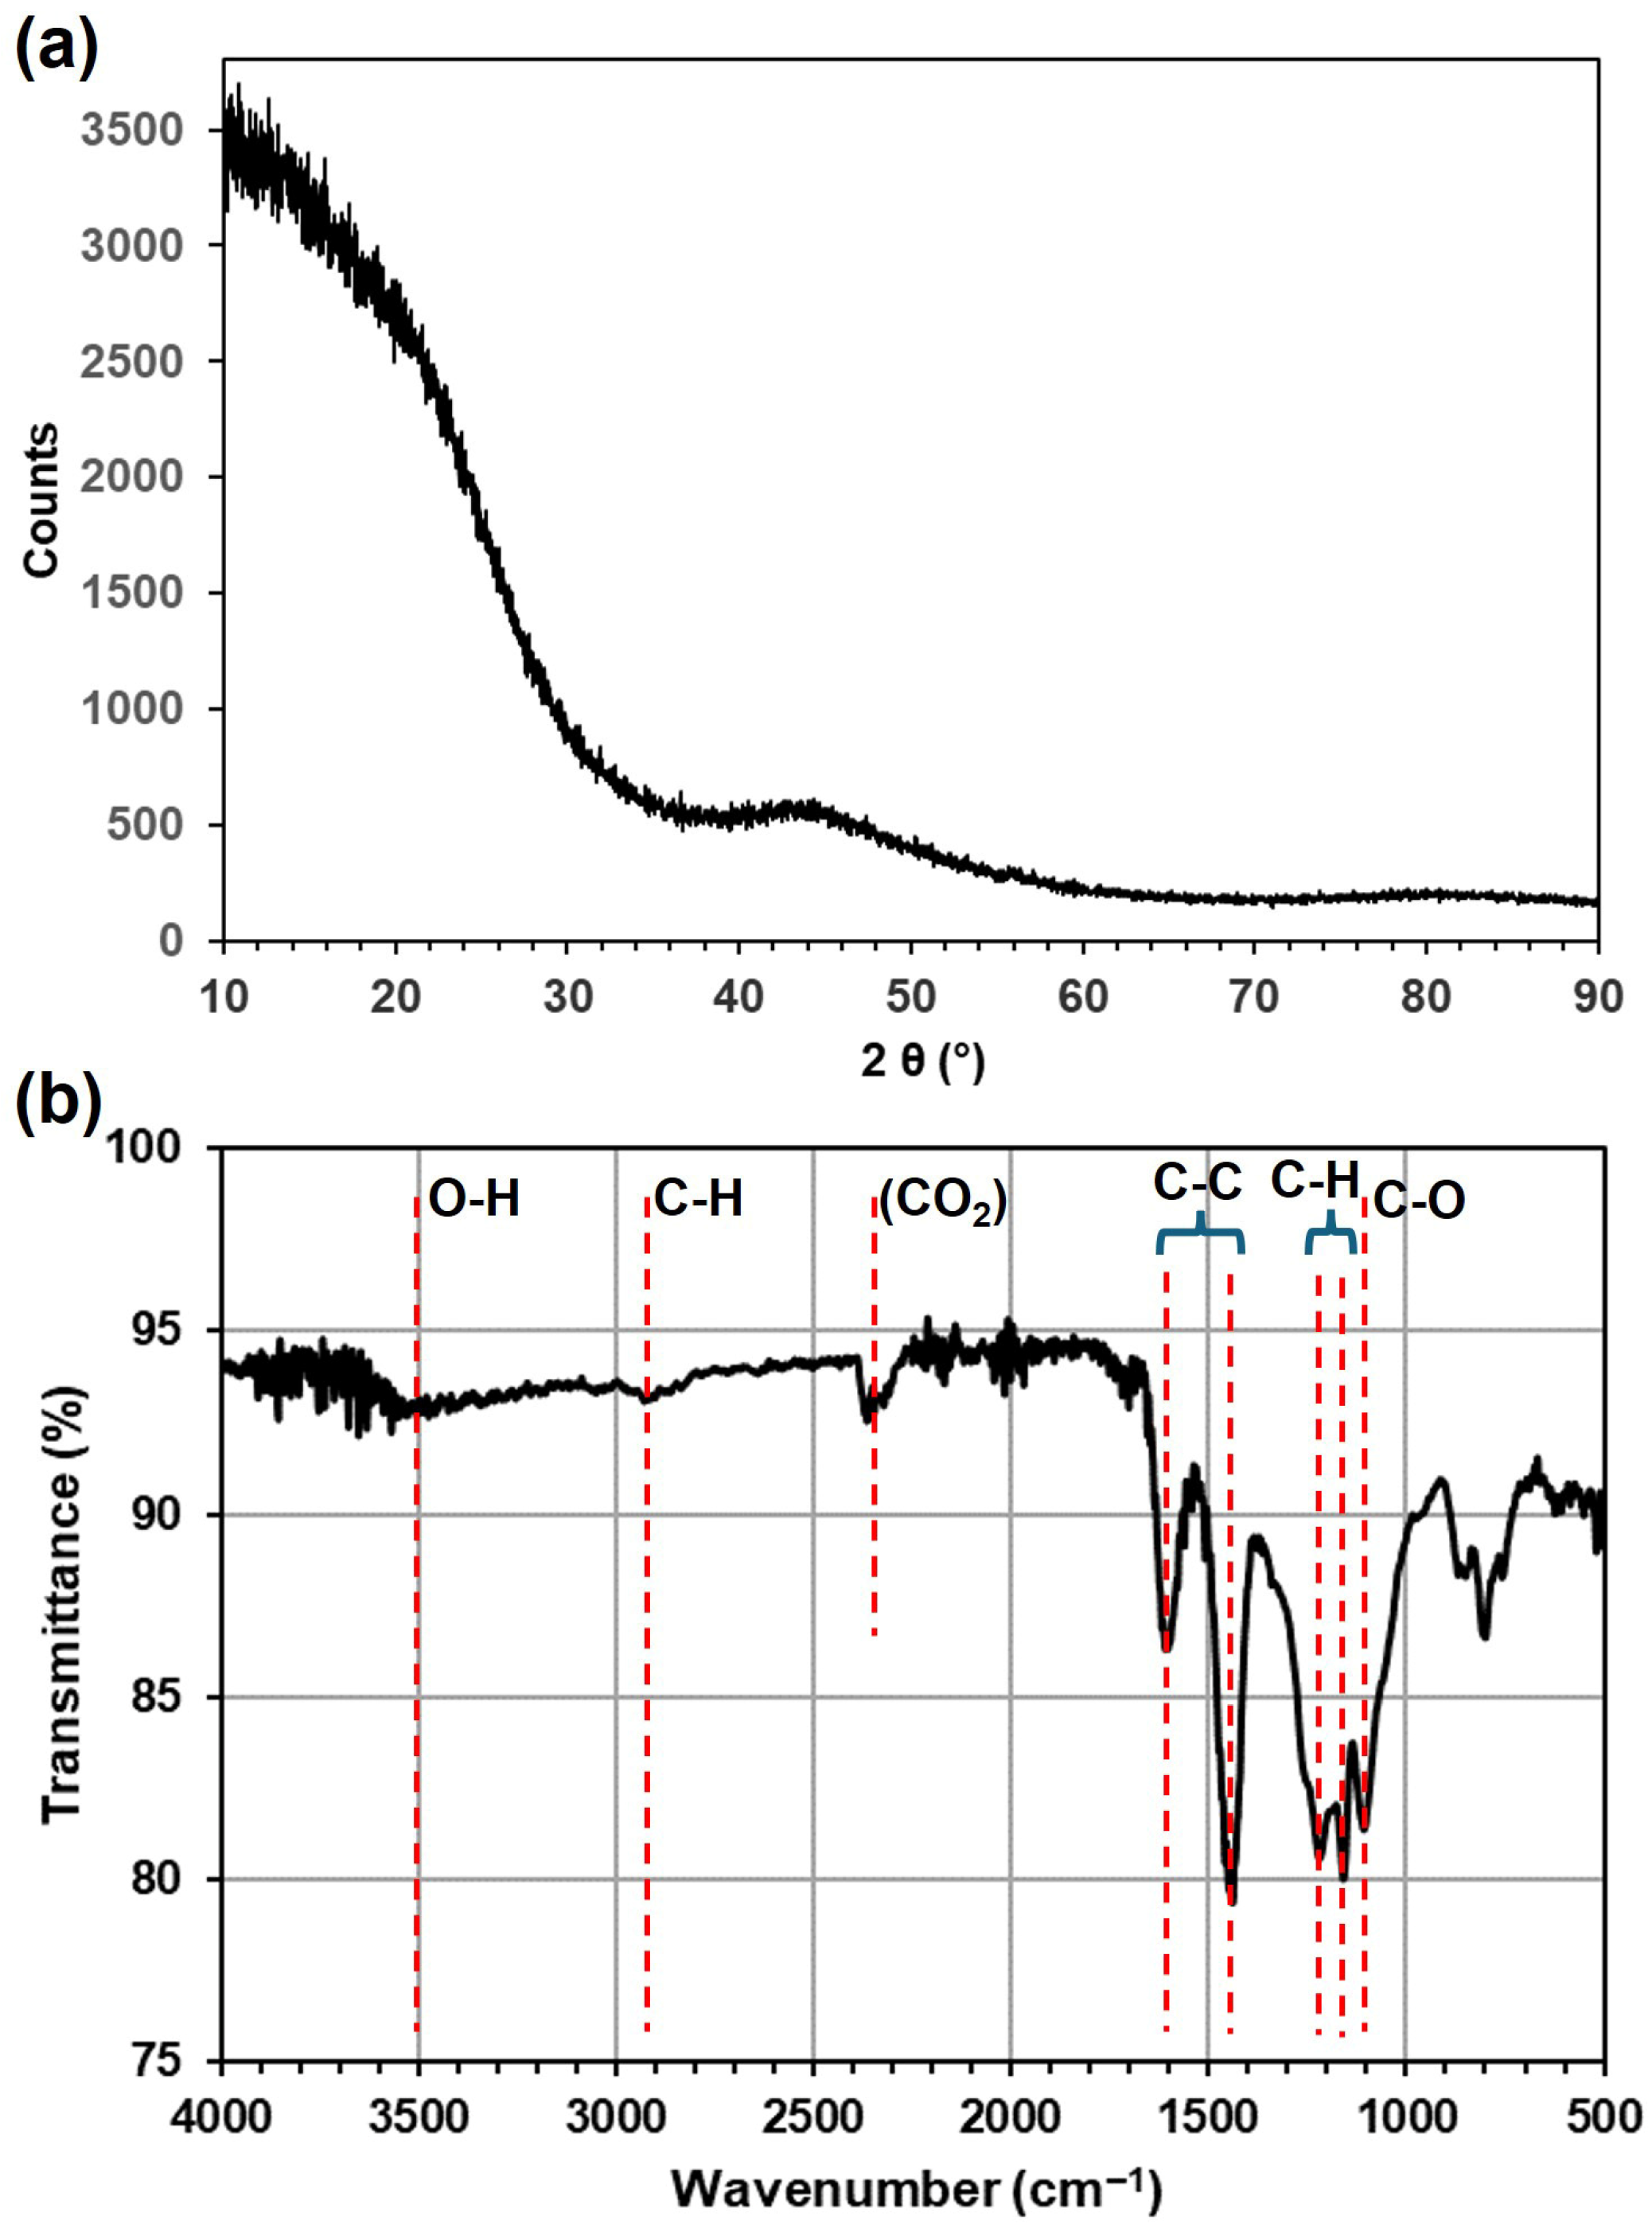
The XRD diffractogram of the OMC product is given in Figure 2a. This indicates a largely amorphous material since there are no well-defined peaks, only the broad features centred at around 10° and, much less intense, at 44°. The latter feature and the intensity around 24° are consistent with some graphitic character—the (100) and (002) reflections are expected at these values, respectively, and have been reported for OMCs prepared by other methods [36]. The intensity below 24° would suggest considerable amorphous sp3 hybridised carbon content, and the fact that the features at 44° and 24° are very broad would indicate graphite-like nanodomains consisting of clusters of just a few carbon planes. The importance of the graphitic component of these OMCs changes with preparation conditions, especially calcination temperature, as seen by Ma et al. [36] and in Raman studies on OMCs with cubic pore structures [37], where graphitic content passed through a maximum at a preparation temperature around 600 °C and declined progressively as it was increased to 1000 °C. Largely amorphous carbon material is expected for OMCs in which the pore arrangement is typically highly ordered, but the carbon-based material itself is non-crystalline.
Figure 2.
(a) XRD pattern and (b) FTIR spectrum of the OMC adsorbent material.
3.1.2. FTIR Spectroscopy
Considering the molecular structure of the OMC, its FTIR spectrum is shown in Figure 2b and confirms the presence of C–H, C–OH and C–O–C species as well as the presence of the benzene rings. As indicated in Figure 2b, bands can be assigned to the in-plane bending of C–H (1100–1300 cm−1), C–C stretching in the aromatic rings (1445–1609 cm−1), stretches of the phenolic C–O (1100 cm−1) and C–H (2870 cm−1) and of the –OH group (3500 cm−1). The bands corresponding to atmospheric CO2 (centred on 2450 cm−1) should be ignored. These results are in agreement with the detailed study—from which the preparation method used here is taken—by Sakina and Baker [29], of the effect of preparation temperature on the properties of OMC products. At preparation temperatures of 300 °C, the block copolymer was still evident in FTIR (and MAS C–13 NMR); after preparation at 350 and 400 °C, a rich FTIR spectrum was obtained, as is the case here, but at higher temperatures, loss of functional groups was seen in the FTIR spectra, and for preparation at 800 °C and above, the materials were essentially pure carbon [29].
3.1.3. Gas Physisorption
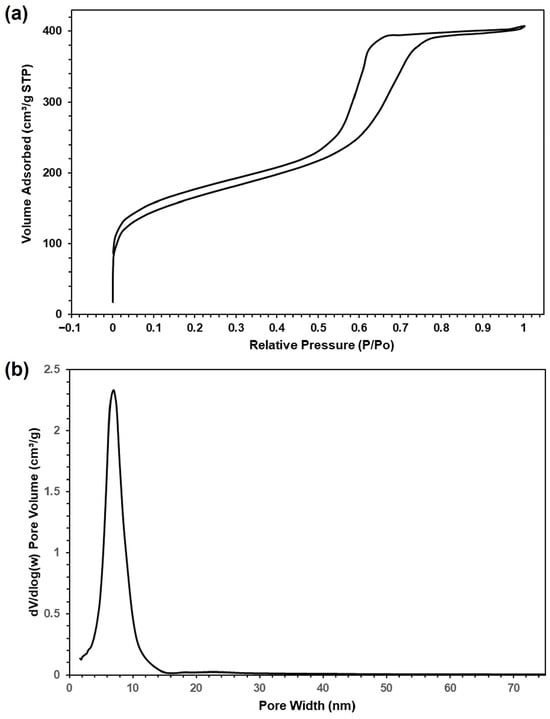
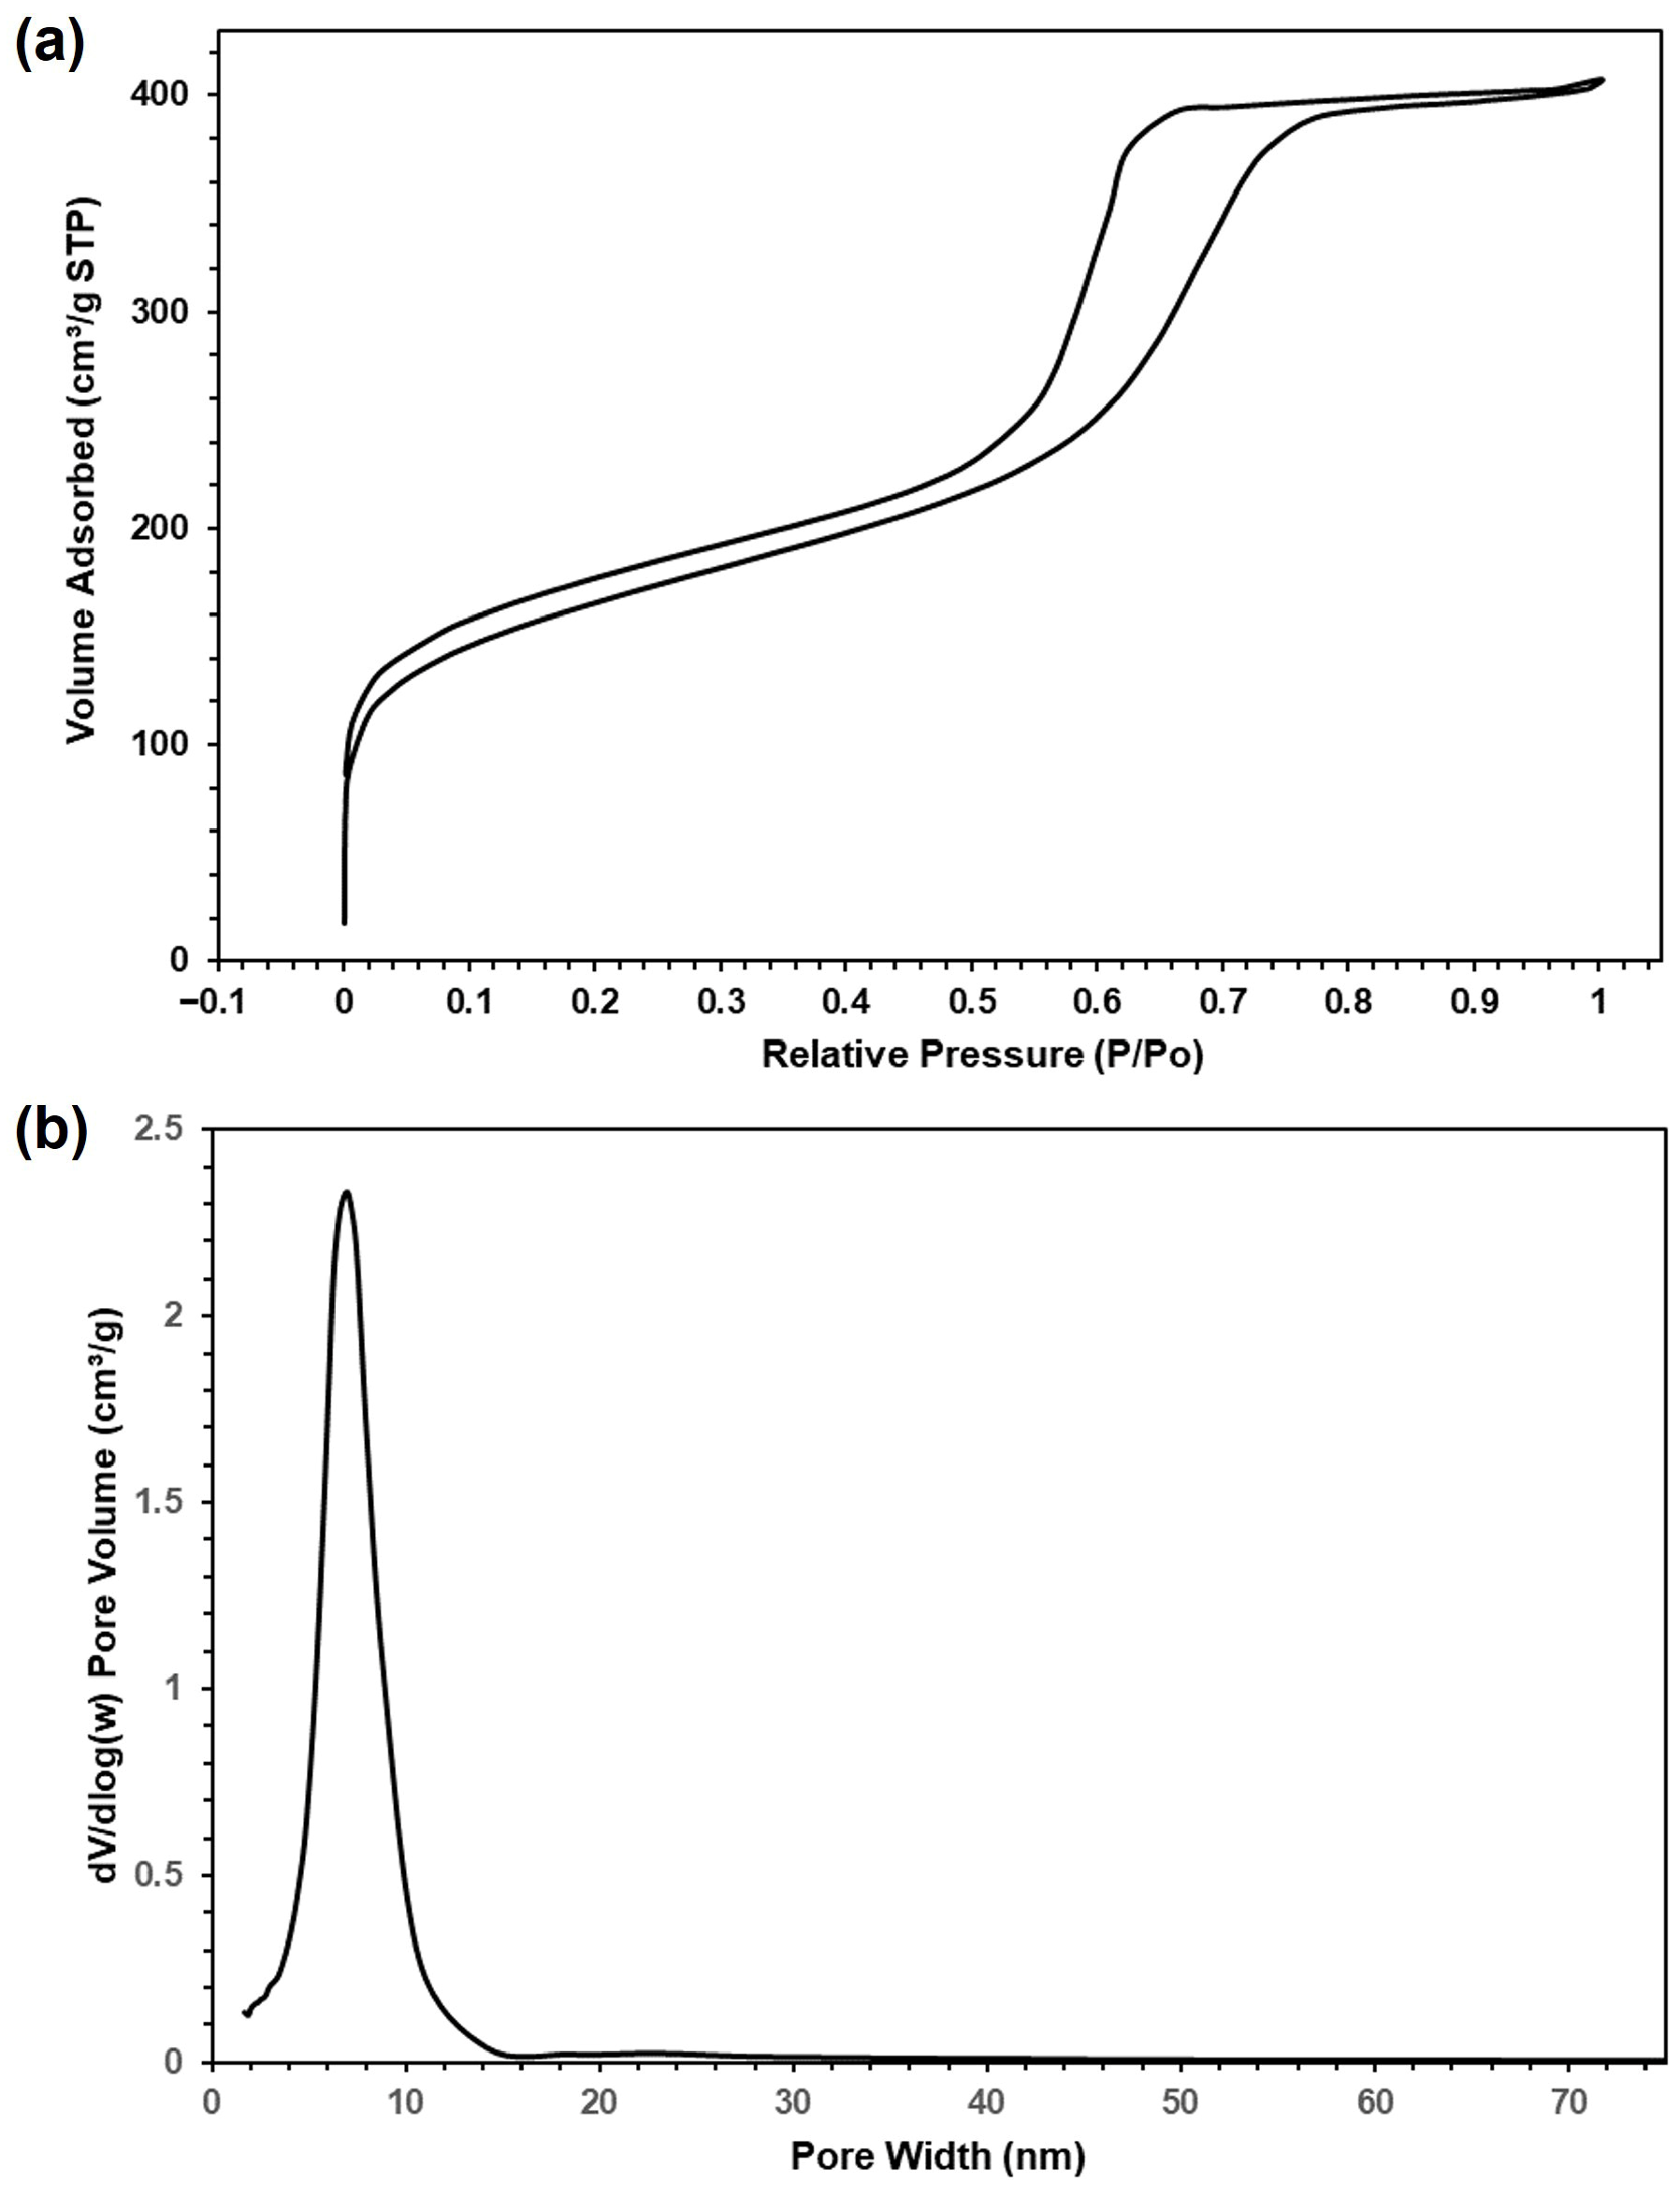
The Nitrogen gas adsorption isotherms were recorded, and the pore size distribution of the OMC was obtained from the adsorption isotherm. These are plotted in Figure 3. The form of the isotherms is characterised as Type IV with H1-type hysteresis, which confirms the presence in the material of cylindrical mesopores. The specific surface area and pore volume of the OMC material were determined from these physisorption data to be 586 m2·g−1 and 0.585 cm3·g−1, respectively, confirming successful preparation of the mesoporous OMC. This is further supported by the single, sharp peak observed in the pore size distribution plot, centred around a value of 7 nm. These properties are close to those obtained by Sakina [29], in which specific surface area, pore volume and pore diameter changed from values of 608 m2·g−1, 0.63 cm3·g−1 and 7.0 nm when prepared at 400 °C to 707, 0.52 and 5.7 nm, respectively, when prepared at 800 °C.
Figure 3.
(a) Nitrogen gas adsorption and desorption isotherms and (b) pore size distribution plot derived from the adsorption isotherm.
3.1.4. Electron Microscopy
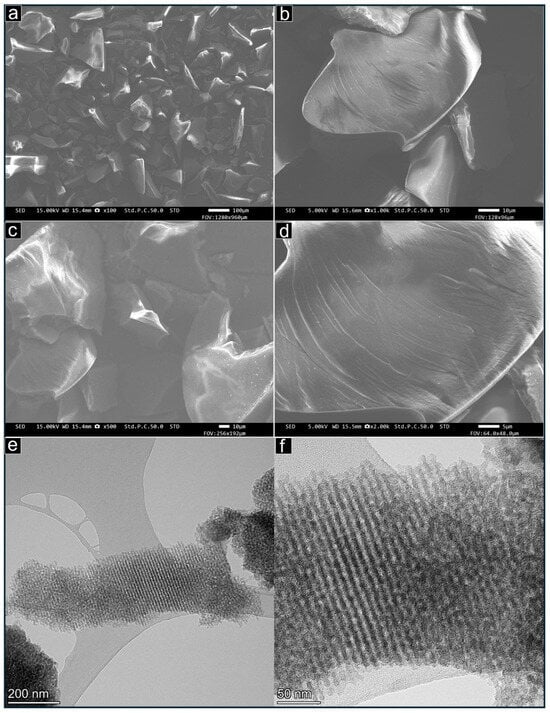
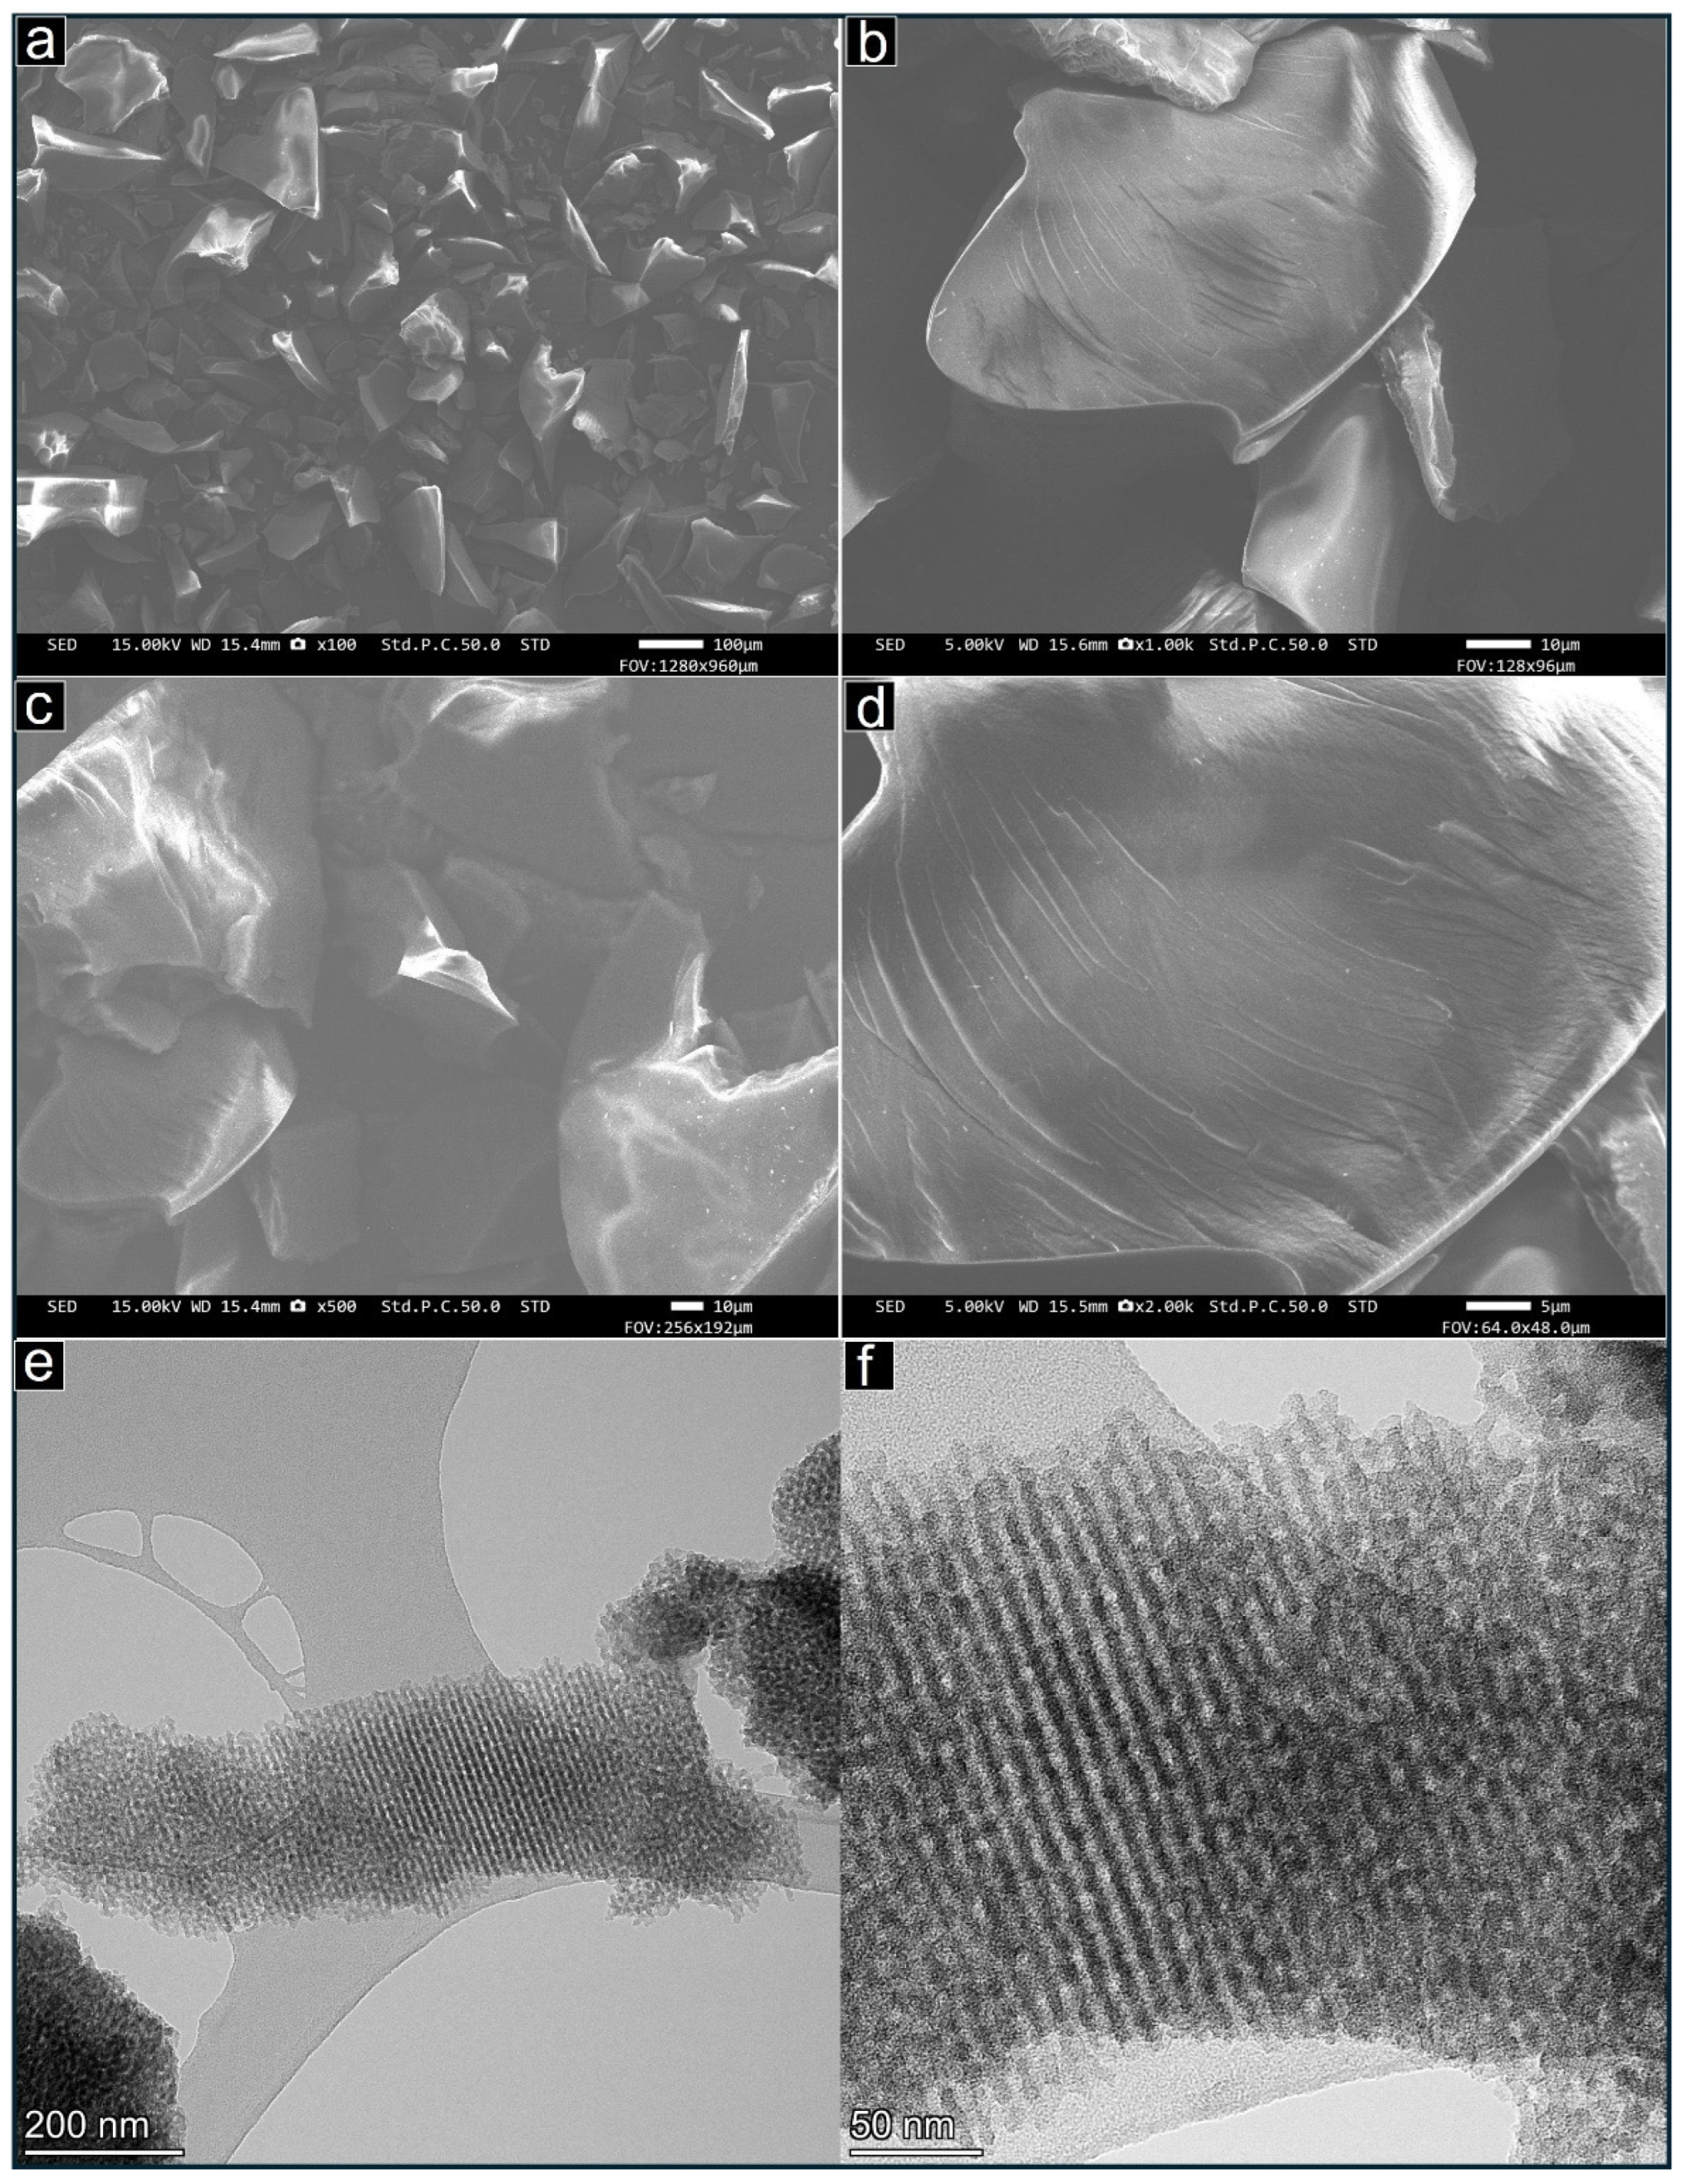
SEM and TEM images were recorded and are presented in Figure 4. The secondary electron images recorded in the SEM instrument show the multi-micron-sized particles (~5–200 µm) of the OMC within which the mesoporous structure resides. Moving to higher magnifications and the TEM images in Figure 4e,f, a single particle and its internal ordered, mesoporous structure are clearly seen. The yield of mesoporous material, as opposed to non-porous material, was found to be close to 100%. In the centre of Figure 4e and in Figure 4f, the pores (light contrast) and the pore walls (dark) are viewed side-on. The pores are long, cylindrical and parallel—with aspect ratios often far exceeding the value of 1:30 estimated for the particle in this image—and their diameter is seen in these images to be consistent with that of 7 nm estimated in the physisorption study, as expected. Since these are transmission images, the pore diameter usually appears slightly smaller because the ordered pore structure is often not exactly aligned with the electron beam, leading to some apparent overlap of the pore walls with the pores. Again, these results fit with those of the parametric study mentioned above [29] in which the pore structure is seen to shrink progressively with increasing calcination temperature, but persists even after treatment at 1200 °C.
Figure 4.
Electron microscopy analysis of OMC material: (a–d) SEM images obtained in secondary electron imaging mode at increasing magnifications; (e,f) TEM images of a particle of mesoporous material showing the arrangement of long, parallel cylindrical pores of around 6 nm diameter.
3.2. Dye Adsorption in the Batch Process
To determine the optimum values of various experimental parameters (pH, adsorbent dosage, dye concentration and contact time), batch adsorption experiments were performed. The optimum parameter values thus obtained were then used in setting up the subsequent experimental conditions to evaluate parameters from various adsorption isotherm models and also to investigate the adsorption kinetics of the MY–OMC system.
3.2.1. Optimisation of Parameters
Effect of pH
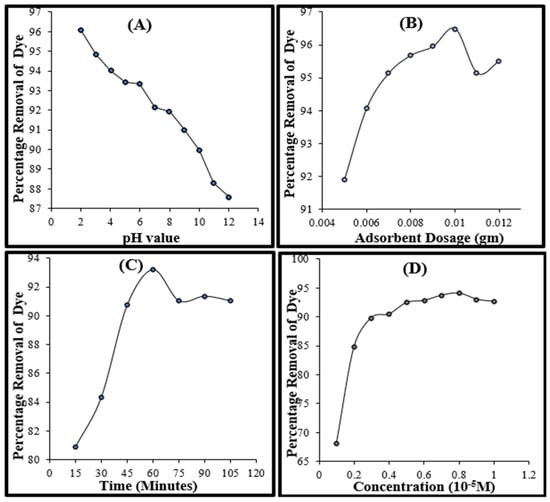
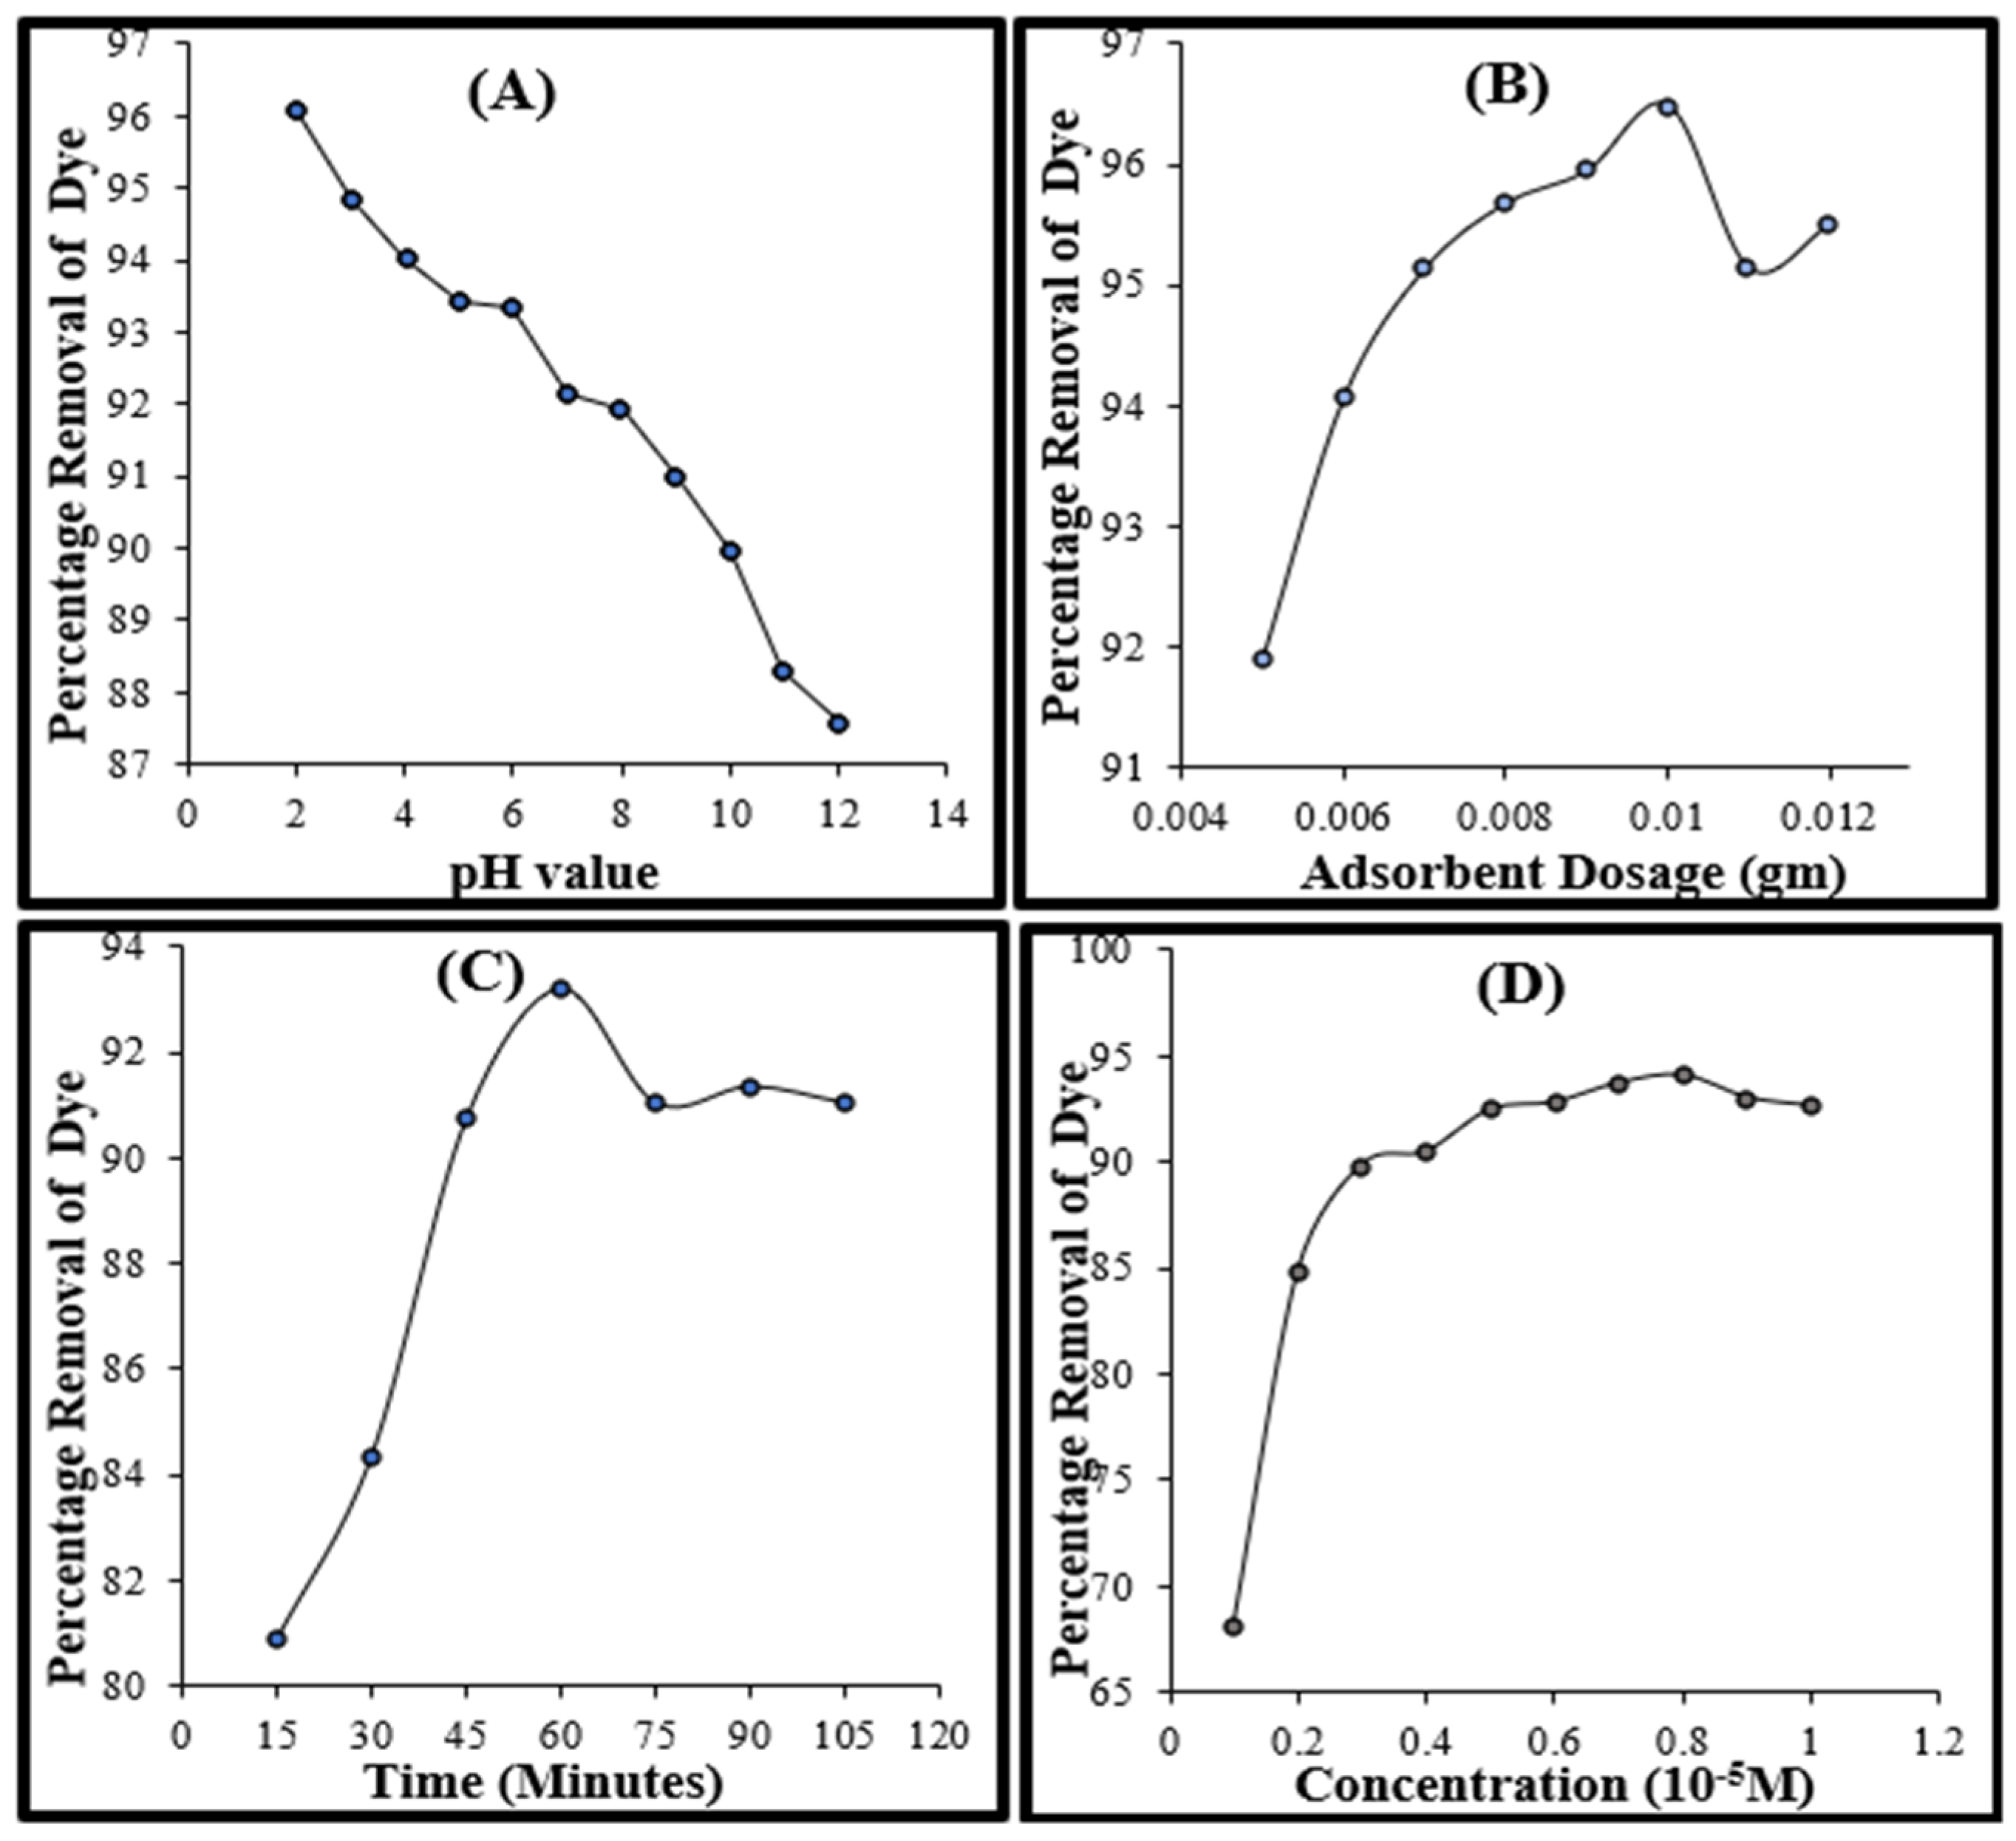
A pH vs. dye uptake plot {Figure 5A} clearly shows that by increasing the pH from 2 to 12, the amount of MY adsorbed over OMC decreases almost linearly. The highest adsorption is observed at pH 2, where the dye removal capacity reaches 1.5 × 10⁻⁵ mg/g or 96%, while at pH 12, it decreases to 1.4 × 10⁻⁵ mg/g (87.59%). This trend can be attributed to the fact that MY is readily converted to its anionic form in acidic media [38] and to the development of a positive charge at the OMC surface at low pH, due to its pHZPC of around 6. Mittal et al. [24] have established that, below pH 6, OMC develops a positive surface charge, while above pH 6, its surface is negatively charged. Thus, in acidic conditions, the high concentration of H+ ions enhances the ionic attraction between the negatively charged dye ions and the positively charged OMC surface, and an easy accumulation of the dye takes place, which results in the highest dye uptake occurring at pH 2. As pH increases and the concentration of H+ ions decreases, the MY–OMC interaction weakens, resulting in less dye uptake. In neutral and then alkaline medium, the concentration of OH− ions rises, OMC acquires a negative charge and repels the negatively charged dye ion [39,40]. Thus, the adsorption efficiency falls accordingly, and a continuous decrease in dye removal can be observed in Figure 5A.
Figure 5.
Effect of (A) pH, (B) OMC dosage, (C) contact time and (D) concentration on the adsorption of MY dye on the surface of OMC (adsorbent dosage = 0.01 g/0.02 L, contact time = 60 min., dye concentration = 0.8 × 10⁻⁵ M, pH = 2).
Effect of Adsorbent Dosage
Figure 5B indicates that on increasing the amount of OMC in the solution, the dye uptake systematically increases. That is, the corresponding increase in the availability of active adsorption sites allows removal of more dye. The maximum adsorption capacity is observed at an OMC dosage of 0.01 g/0.02 L, achieving a removal efficiency of 1.54 × 10⁻⁵ mg/g (96.49%). At higher dosages, no further increase in the adsorption is noted, and a plateau is attained. Thus, 0.01 g/0.02 L is identified as the optimal OMC dosage for maximum adsorption under the given experimental conditions.
This behaviour may be due to the fact that at lower adsorbent dosages, the available surface sites are more effectively occupied since the number of dye molecules in solution is relatively high as compared to the number of adsorption sites. This results in greater retention of dye per gram of adsorbent and a higher adsorption capacity. When the dosage is increased, the same quantity of dye is distributed over a larger mass of adsorbent, leaving many of these sites unoccupied. Consequently, the adsorption capacity (in mg/g) declines. In addition, the use of excess adsorbent may lead to particle crowding and aggregation, which can mask or block some of the active sites and reduce the overall efficiency of adsorption [41,42].
Effect of Contact Time
Figure 5C shows that the adsorption capacity of the adsorbent increases with increase in contact time, as prolonged interaction between the dye molecules and the OMC provides more opportunities for dye adsorption. Initially, after 15 min. of agitation, about 1.2 × 10⁻⁵ mg/g (80.92%) dye removal was recorded, and this value rises continuously to a maximum adsorption of 1.49 × 10⁻⁵ mg/g (93.23%) at 60 min. At 75 min., the adsorption capacity drops slightly to 1.45 × 10⁻⁵ mg/g, or 91.07%, and thereafter, it remains constant. The observed slight decline in adsorption beyond 60 min. can be attributed to the agglomeration of dye molecules. As the pores of OMC become saturated, additional dye molecules can no longer be effectively adsorbed, leading to a stabilisation of the adsorption capacity. Based on these findings, 60 min. was identified as the optimal contact time for achieving maximum adsorption under the given experimental conditions.
During the initial phase of adsorption, the rate of dye accumulation over the adsorbent is high, and as time progresses, the rate decreases, and eventually a dynamic equilibrium is attained, where the rate of adsorption becomes equal to the rate of desorption of the adsorbate molecule. It is well established that the initial rapid phase is due to surface adsorption, while the later stage may involve intraparticle diffusion [43,44,45].
Effect of Concentration of MY
It is found that the adsorption of the dye gradually increases from 1.09 × 10⁻⁵ mg/g (68.18%) at 1 × 10⁻⁶ M to 1.44 × 10⁻⁵ mg/g (90.47%) at 4 × 10⁻⁶ M, then slowly reaches a maximum of 1.50 × 10⁻⁵ mg/g (94.07%) at 8 × 10⁻⁶ M {Figure 5D}, beyond which no further increase is observed due to saturation of the adsorption sites on the OMC [46].
The high dye concentration gives a stronger driving force to the adsorbate molecules, which overcomes the mass transfer resistance between the solid and the aqueous phase, resulting in increased dye uptake. Hence, the initial rapid rise in adsorption is driven by a strong concentration gradient, enhancing mass transfer. At low dye concentrations, more adsorption sites are available per dye molecule, and higher removal efficiency is observed. Thus, a higher initial concentration of the dye often results in higher equilibrium adsorption capacity but lower percentage removal, as the fixed number of adsorption sites limits the maximum dye uptake [47,48].
3.2.2. Adsorption Isotherm Studies
The Langmuir model describes the adsorption of molecules onto a homogeneous surface, where the adsorbent provides identical sites for interaction [47]. It assumes the formation of a uniform monolayer of adsorbate molecules without interaction between them [48,49]. This model is widely applied not only to analyse adsorption behaviour but also to evaluate the favorability and thermodynamic nature of the adsorption process, including parameters such as spontaneity, enthalpy, and entropy. These thermodynamic parameters can be estimated from the Langmuir constant (b) using the relationships provided in Equations (14)–(16) [50].
Here, ΔG°, ΔH°, and ΔS° represent the changes in Gibbs free energy, enthalpy, and entropy, respectively, while R denotes the universal gas constant. In Equation (3), T1 and T2 are chosen from the experimental temperatures (303, 313, and 323 K), with T2 greater than T1, and b1 and b2 are the corresponding Langmuir constants at these temperatures.
The Langmuir model can also be used to assess the favourability of adsorption through a dimensionless parameter known as the separation factor (r), which is calculated from the Langmuir constant (b) using Equation (17).
where Co is the initial concentration.
The Freundlich isotherm describes adsorption on heterogeneous surfaces with sites of varying energies, allowing dye molecules to bind differently [51]. While the Temkin model assumes that the heat of adsorption decreases as surface coverage increases [52], the Dubinin–Radushkevitch (D–R) model, based on Polanyi potential theory, explains adsorption as a pore-filling process rather than surface coverage, mainly involving micropores with non-uniform energy distribution [53]. From plots of ε2 versus lnQe, the parameters Qm and β can be determined, and β is further used to calculate the mean adsorption energy (E) using Equation (18). To assess the validity of all the above-mentioned adsorption isotherms, the mathematical equations given in Table 1 have been used.
Table 1.
Various adsorption isotherms and their mathematical expressions.
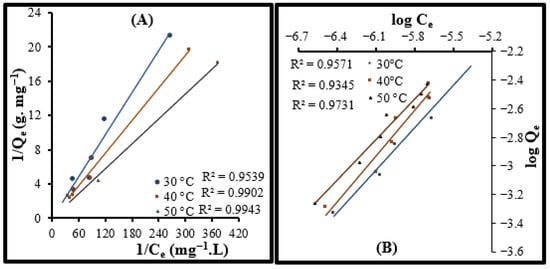
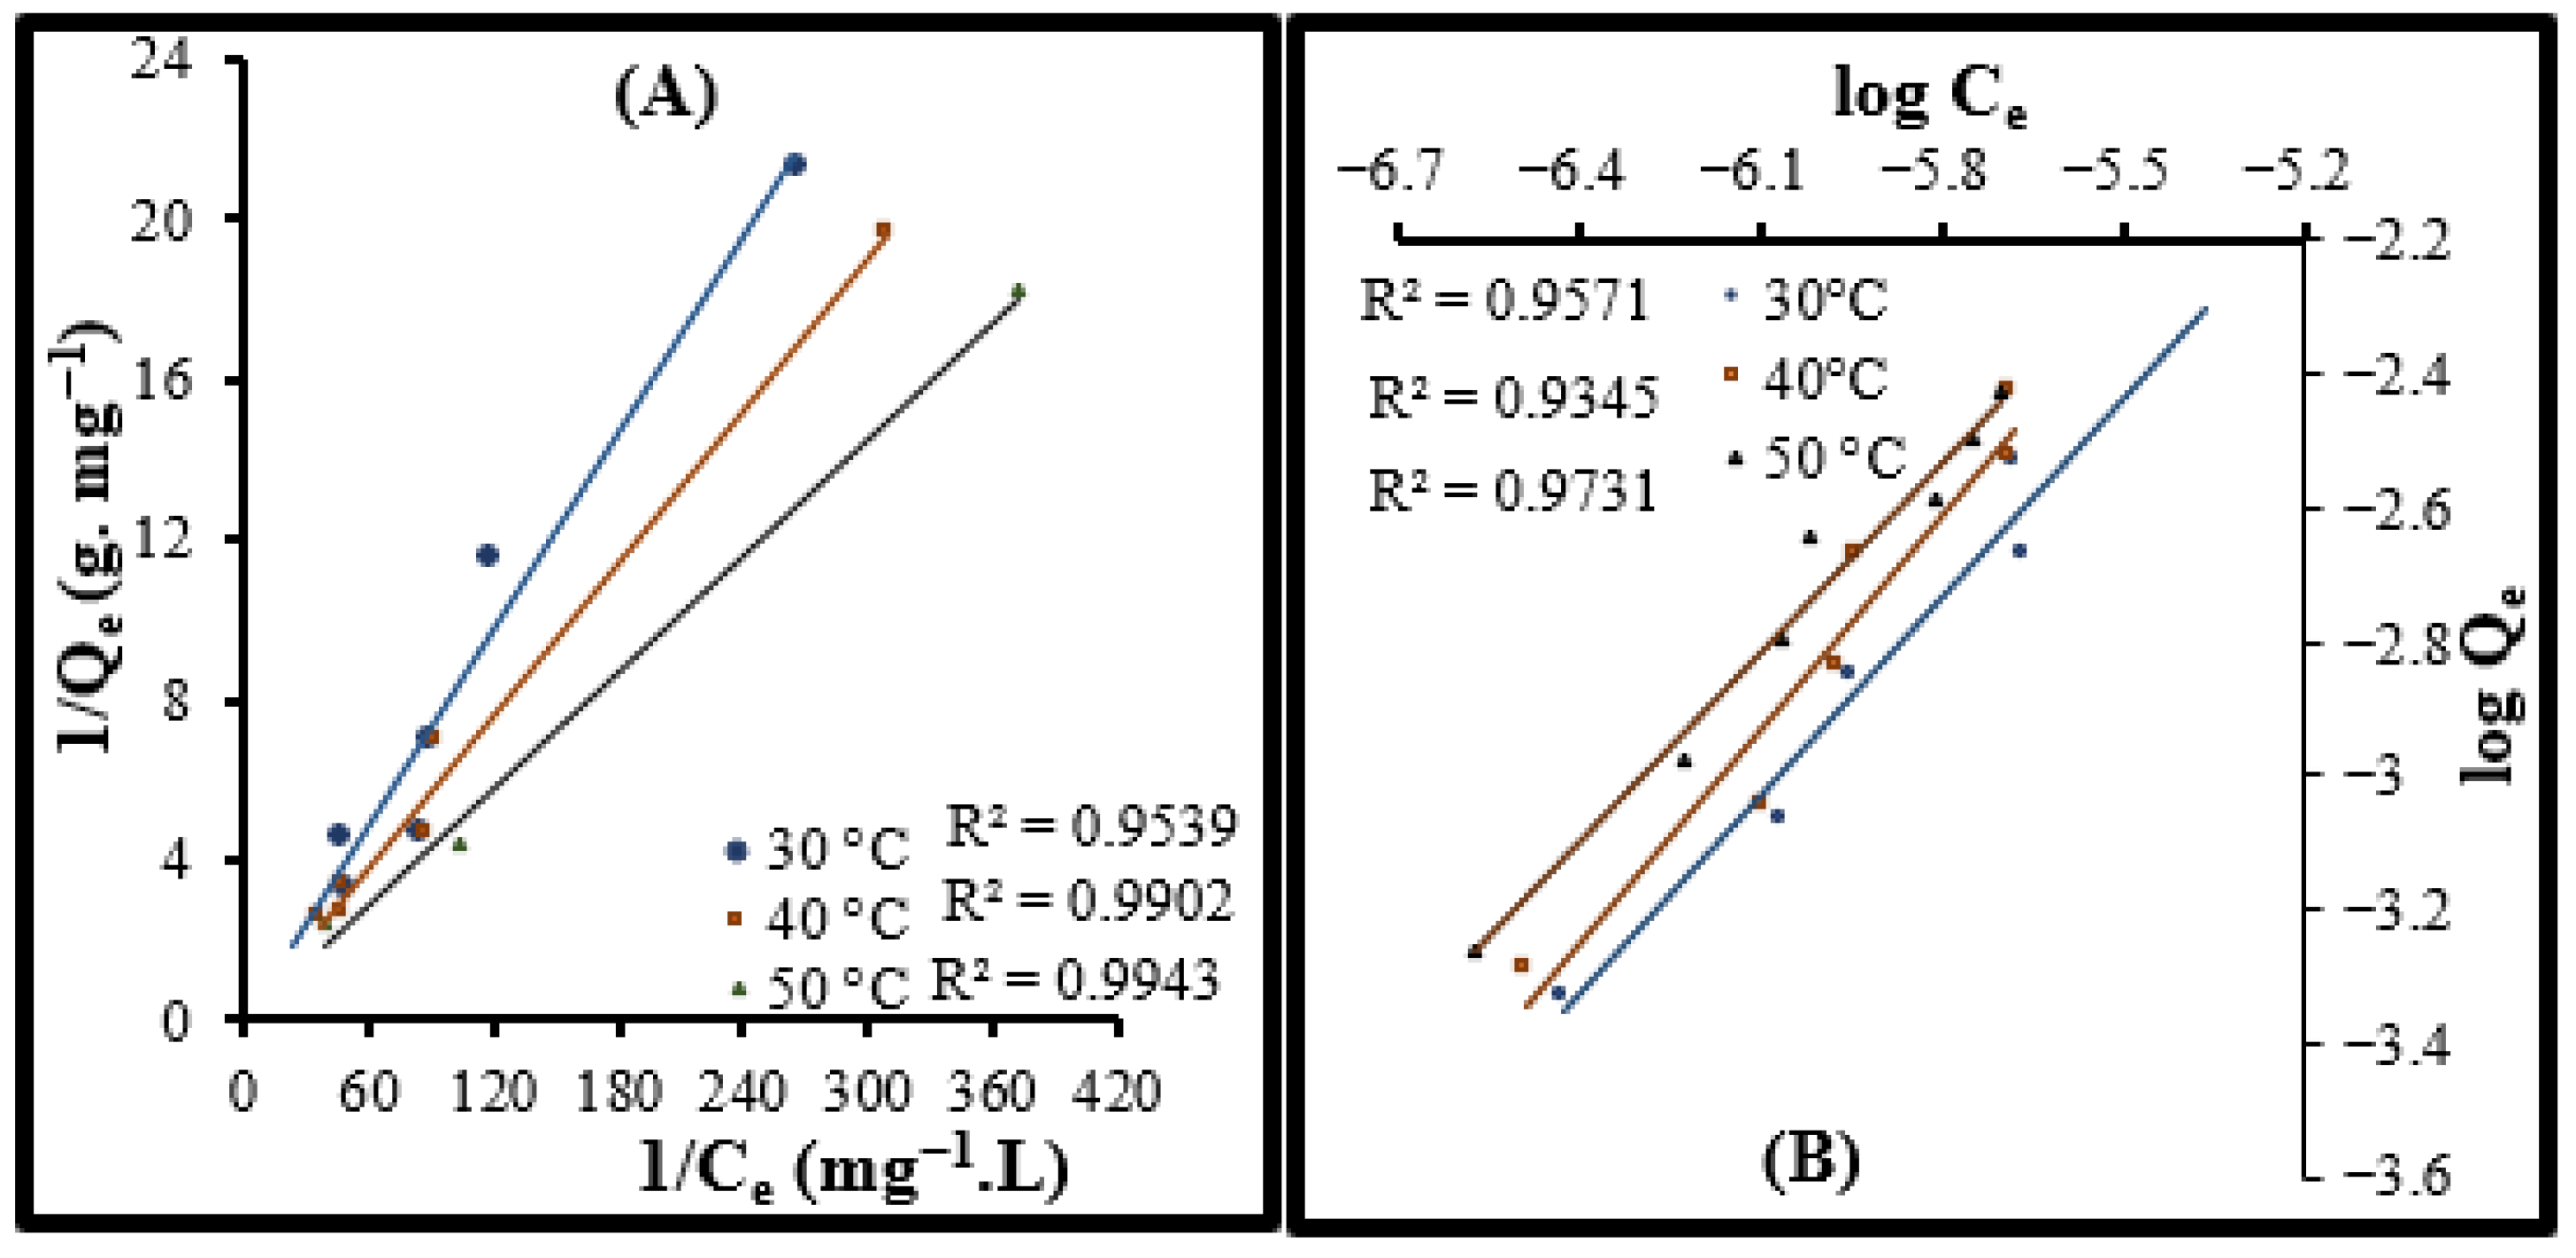
In Figure 6A, a graph derived from the Langmuir equation presented in Table 1 is plotted of 1/Ce against 1/Qe at the three experimental temperatures used (303, 313 and 323 K). At each temperature, a straight line with a regression coefficient close to unity is obtained. The Mean Absolute Percentage Error (MAPE) analysis of the obtained data is carried out as described by Kasemset et al. [54], and all three straight lines exhibit MAPE values below 10%, indicating their excellent reliability (Table 1). This suggests that MY adsorption on the surface of OMC closely follows the Langmuir model, whereby adsorption of MY on a homogeneous OMC surface as a monolayer takes place, and the adsorbed molecules have the same interaction capacity at all the adsorption sites [55].
Figure 6.
(A) Langmuir adsorption isotherms. (B) Freundlich adsorption isotherms for the MY–OMC system (OMC dosage = 0.01 g/0.02 L), pH = 2, contact time = 60 min).
Similarly, the applicability of the Freundlich adsorption isotherm model was determined by plotting a graph of logCe vs. logQe {Figure 6B} derived from the equation given in Table 1 at all three temperatures. Figure 6B shows that, for each temperature, a straight line with a high regression coefficient is obtained. Further verification of the data is carried out by MAPE analysis, and for all three straight lines, MAPE values (Table 1) are found to be in the lower percentage range, indicating the involvement of the Freundlich adsorption isotherm [56].
At all three temperatures, the applicability of the Temkin model was tested by plotting lnCe vs. Qe (Table 1) [57], and that of the Dubinin–Radushkevitch adsorption isotherm, by plotting ɛ2 vs. lnQe plot (Table 1) [58]. Though in each model, straight lines are obtained, the MAPE data presented in Table 2 show that values are either between 20% and 50%, suggesting moderate reliability, or more than 50%, reflecting poor predictive performance of these two adsorption isotherm models.
Table 2.
Data from various adsorption isotherm models for the MY–OMC system at the temperatures indicated.
Calculation of Thermodynamic Parameters
Change in enthalpy (ΔH°), change in entropy (ΔS°) and change in Gibbs’ energy (ΔG°) have been calculated on the basis of values of the Langmuir constant, b (Table 1), using Equations (14)–(16) for temperatures 303, 313 and 323 K. The positive values of ΔH° (43.40, 24.00 and 9.10 kJ.mol–1) and ΔS° (4.35 × 10⁴, 2.4 × 10⁴ and 0.92 × 10⁴ J.K–1mol–1) indicate endothermicity and increasing disorder in the system at 303, 313 and 323 K respectively, while at the same temperatures the negative ΔG° values (–19.25, –20.04 and –19.91 kJ·mol–1) imply that the reaction is spontaneous.
The values of the separation factor, r, obtained at all the initial dye concentrations used, i.e., 4 × 10⁻⁵ to 8 × 10⁻⁵ M, applying Equation (17) at the three temperatures (303, 313 and 323 K) were found to be between zero and unity, confirming that MY adsorption is feasible over OMC.
Suggested Mechanism of Adsorption
In order to ascertain the mechanism operating in the present case, a well-established and most reliable theory given by Gawande et al. [59] was adopted, which states that adsorption processes with low ΔH° (<80 kJ/mol) are driven by weak van der Waals forces and involve physisorption, while high ΔH° (80–240 kJ/mol) results from chemical bond formation between adsorbate and adsorbent, i.e., chemisorption. In the present case, low ΔH° was found for all three temperatures, implying that adsorption of MY on OMC is governed by physisorption and is a result of electrostatic attraction, as discussed above (section on Effect of pH). The applicability of Langmuir and Freundlich adsorption models in the present case clearly reveals that, firstly, a monolayer of the MY molecules occupies the OMC surface through van der Waals forces, followed by the formation of a multilayer of dye molecules. Similar observations have been obtained in a large number of comparable cases [60,61,62].
3.2.3. Kinetic Investigations
Determination of Order and Rate of the Adsorption Process
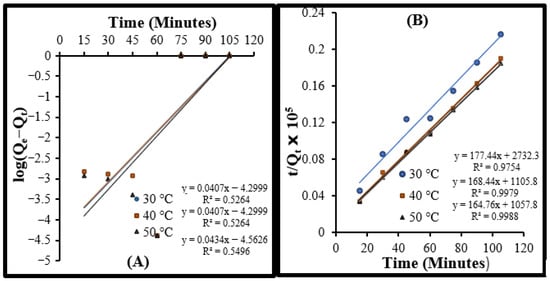
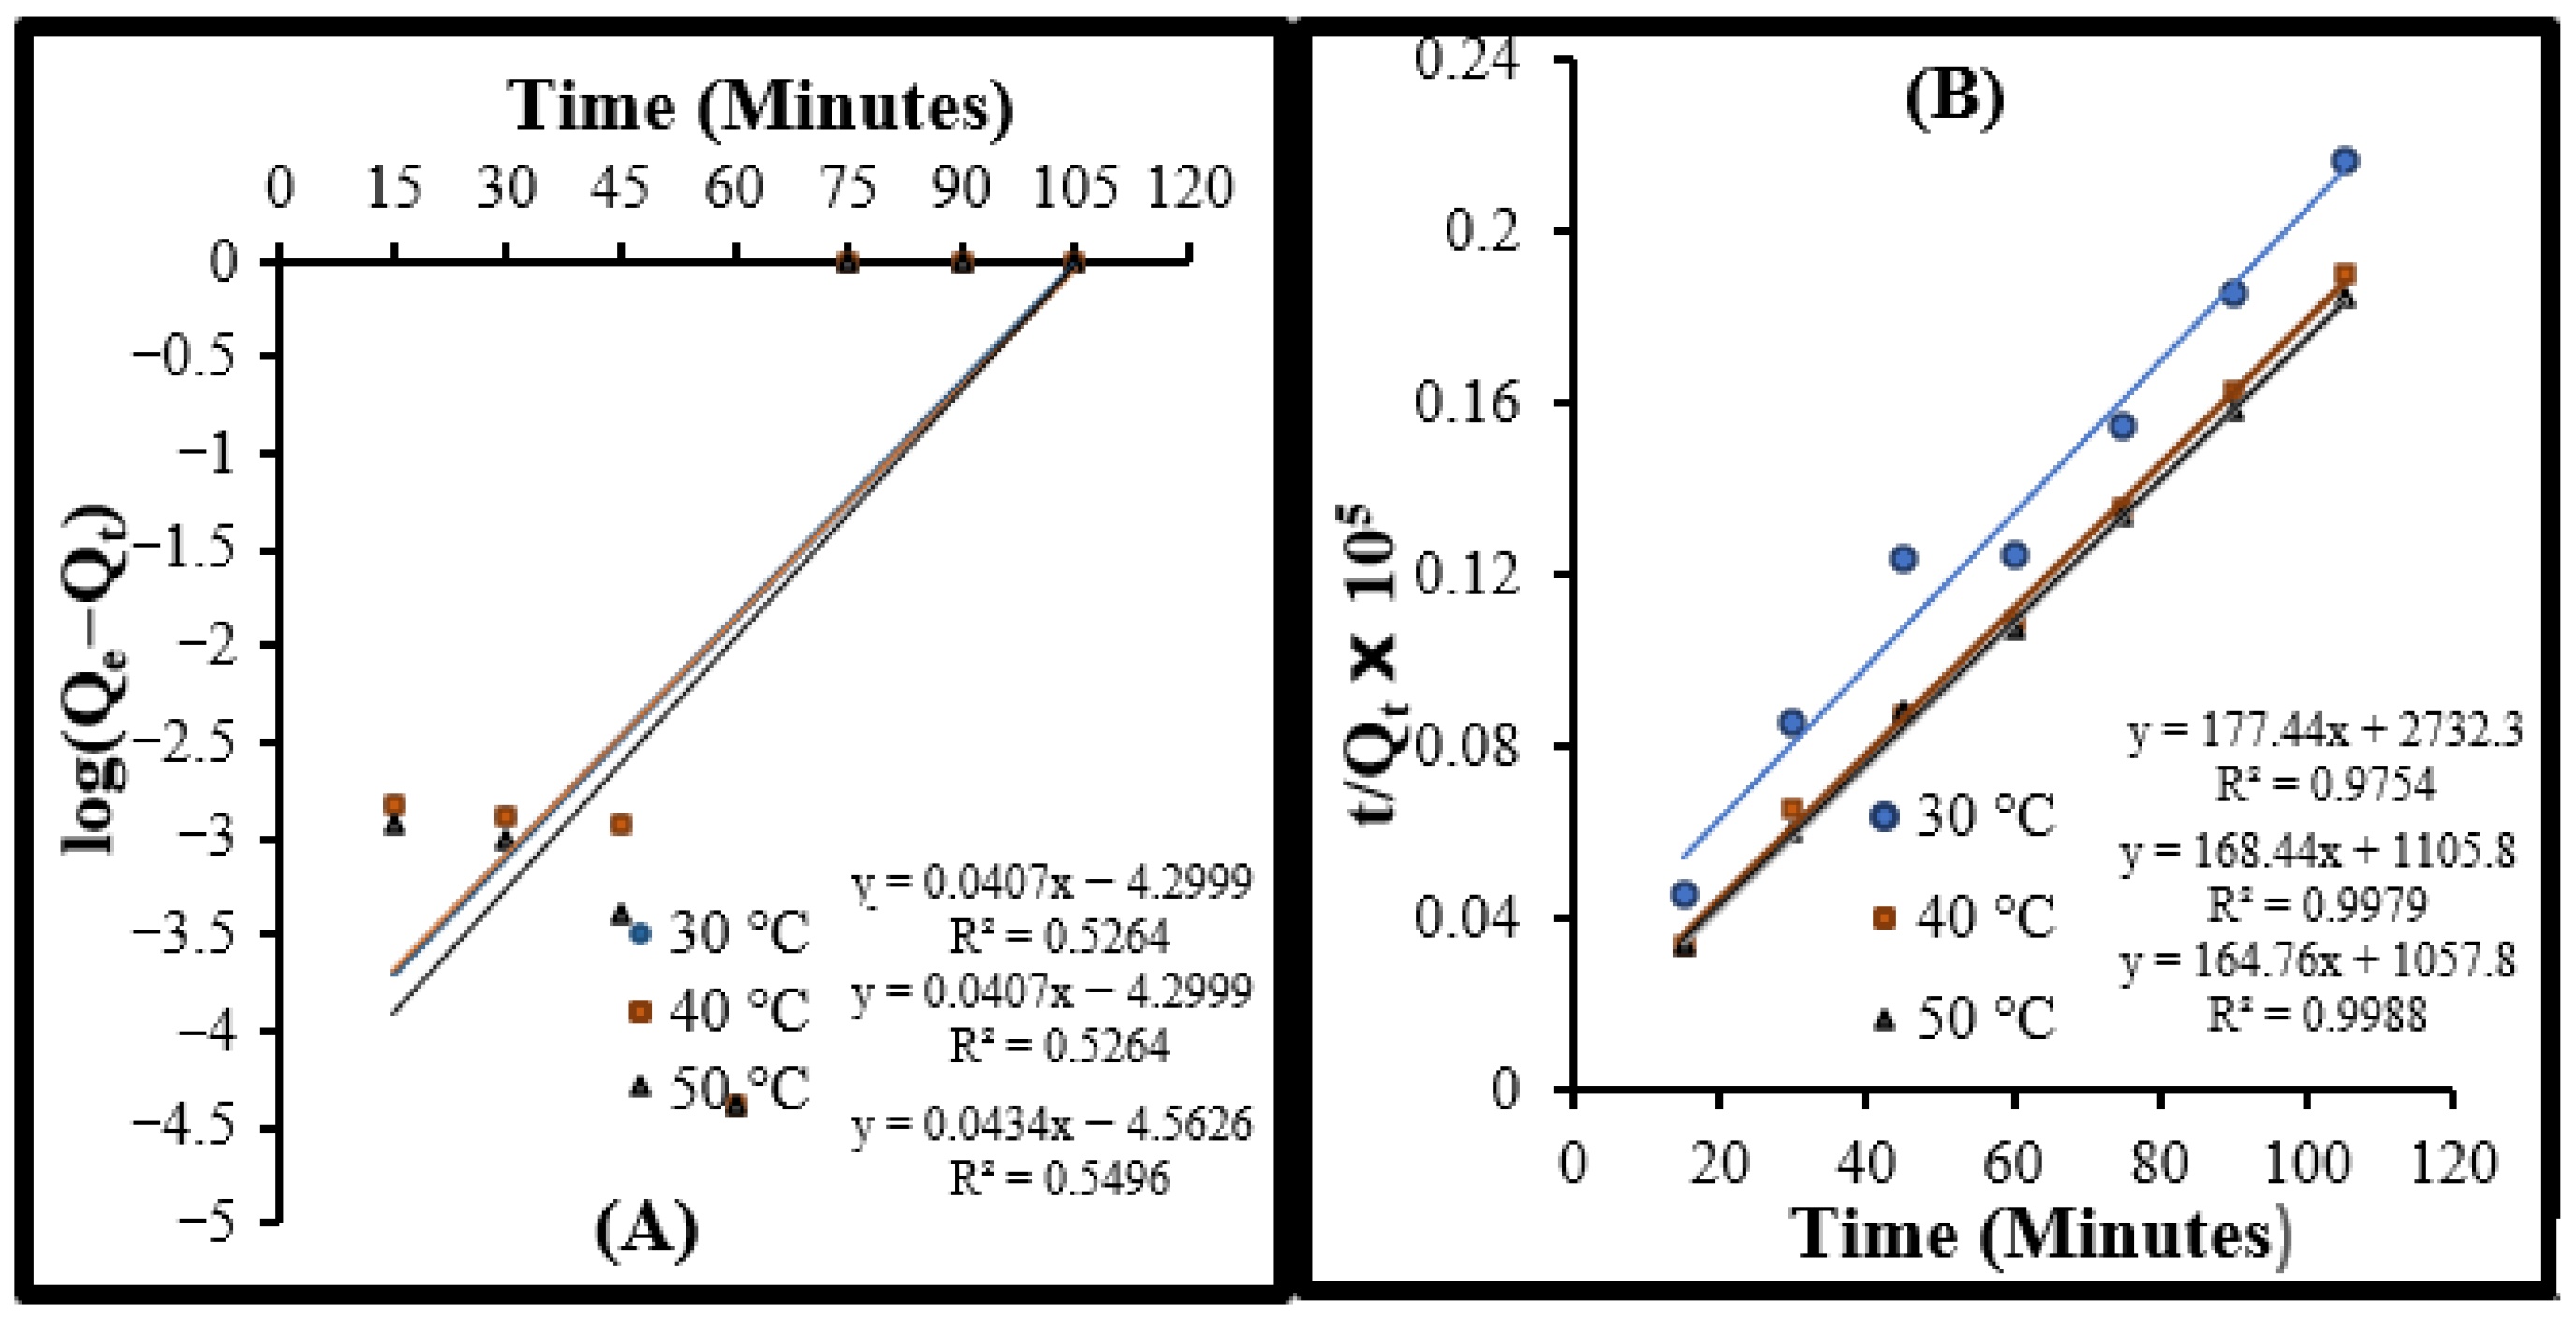
To evaluate the kinetics of the adsorption process, plots of t versus log(Qe−Qt) and t versus t/Qt were constructed using Equations (3) and (4), corresponding to the pseudo-first-order and pseudo-second-order models, respectively. Linear relationships were observed in pseudo-second order plots at all investigated temperatures (303, 313, and 323 K). However, a clear difference in the quality of fit was evident from the correlation coefficients.
The pseudo-first-order model showed relatively low R2 values (Figure 7A), indicating a poor agreement with the experimental data. In contrast, the pseudo-second-order model exhibited R2 values very close to unity (Figure 7B), suggesting an excellent fit across all temperatures. These findings were further supported by the mean absolute percentage error (MAPE) analysis, which also favoured the pseudo-second-order model.
Figure 7.
(A) Pseudo-first-order kinetic model. (B) Pseudo-second-order kinetic model for MY–OMC adsorption system (OMC dosage = 0.01 g/0.02 L; pH = 2; dye concentration = 0.8 × 10⁻⁵ M).
The suitability of the pseudo-second-order model suggests that chemisorption plays a significant role in the adsorption process. This implies that the rate-limiting step may involve chemical interactions such as electron sharing or exchange between the dye molecules and the surface of the ordered mesoporous carbon. Therefore, the adsorption of MY onto OMC is likely to be governed not only by surface availability but also by the strength of interaction between the adsorbate and the adsorbent.
Determination of Reaction Mechanism of the Adsorption Process
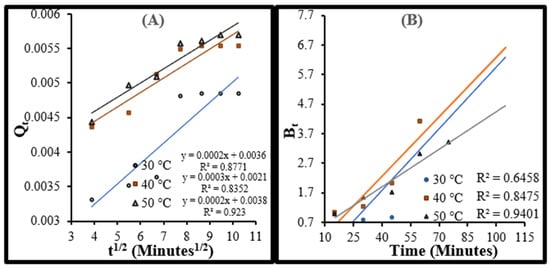
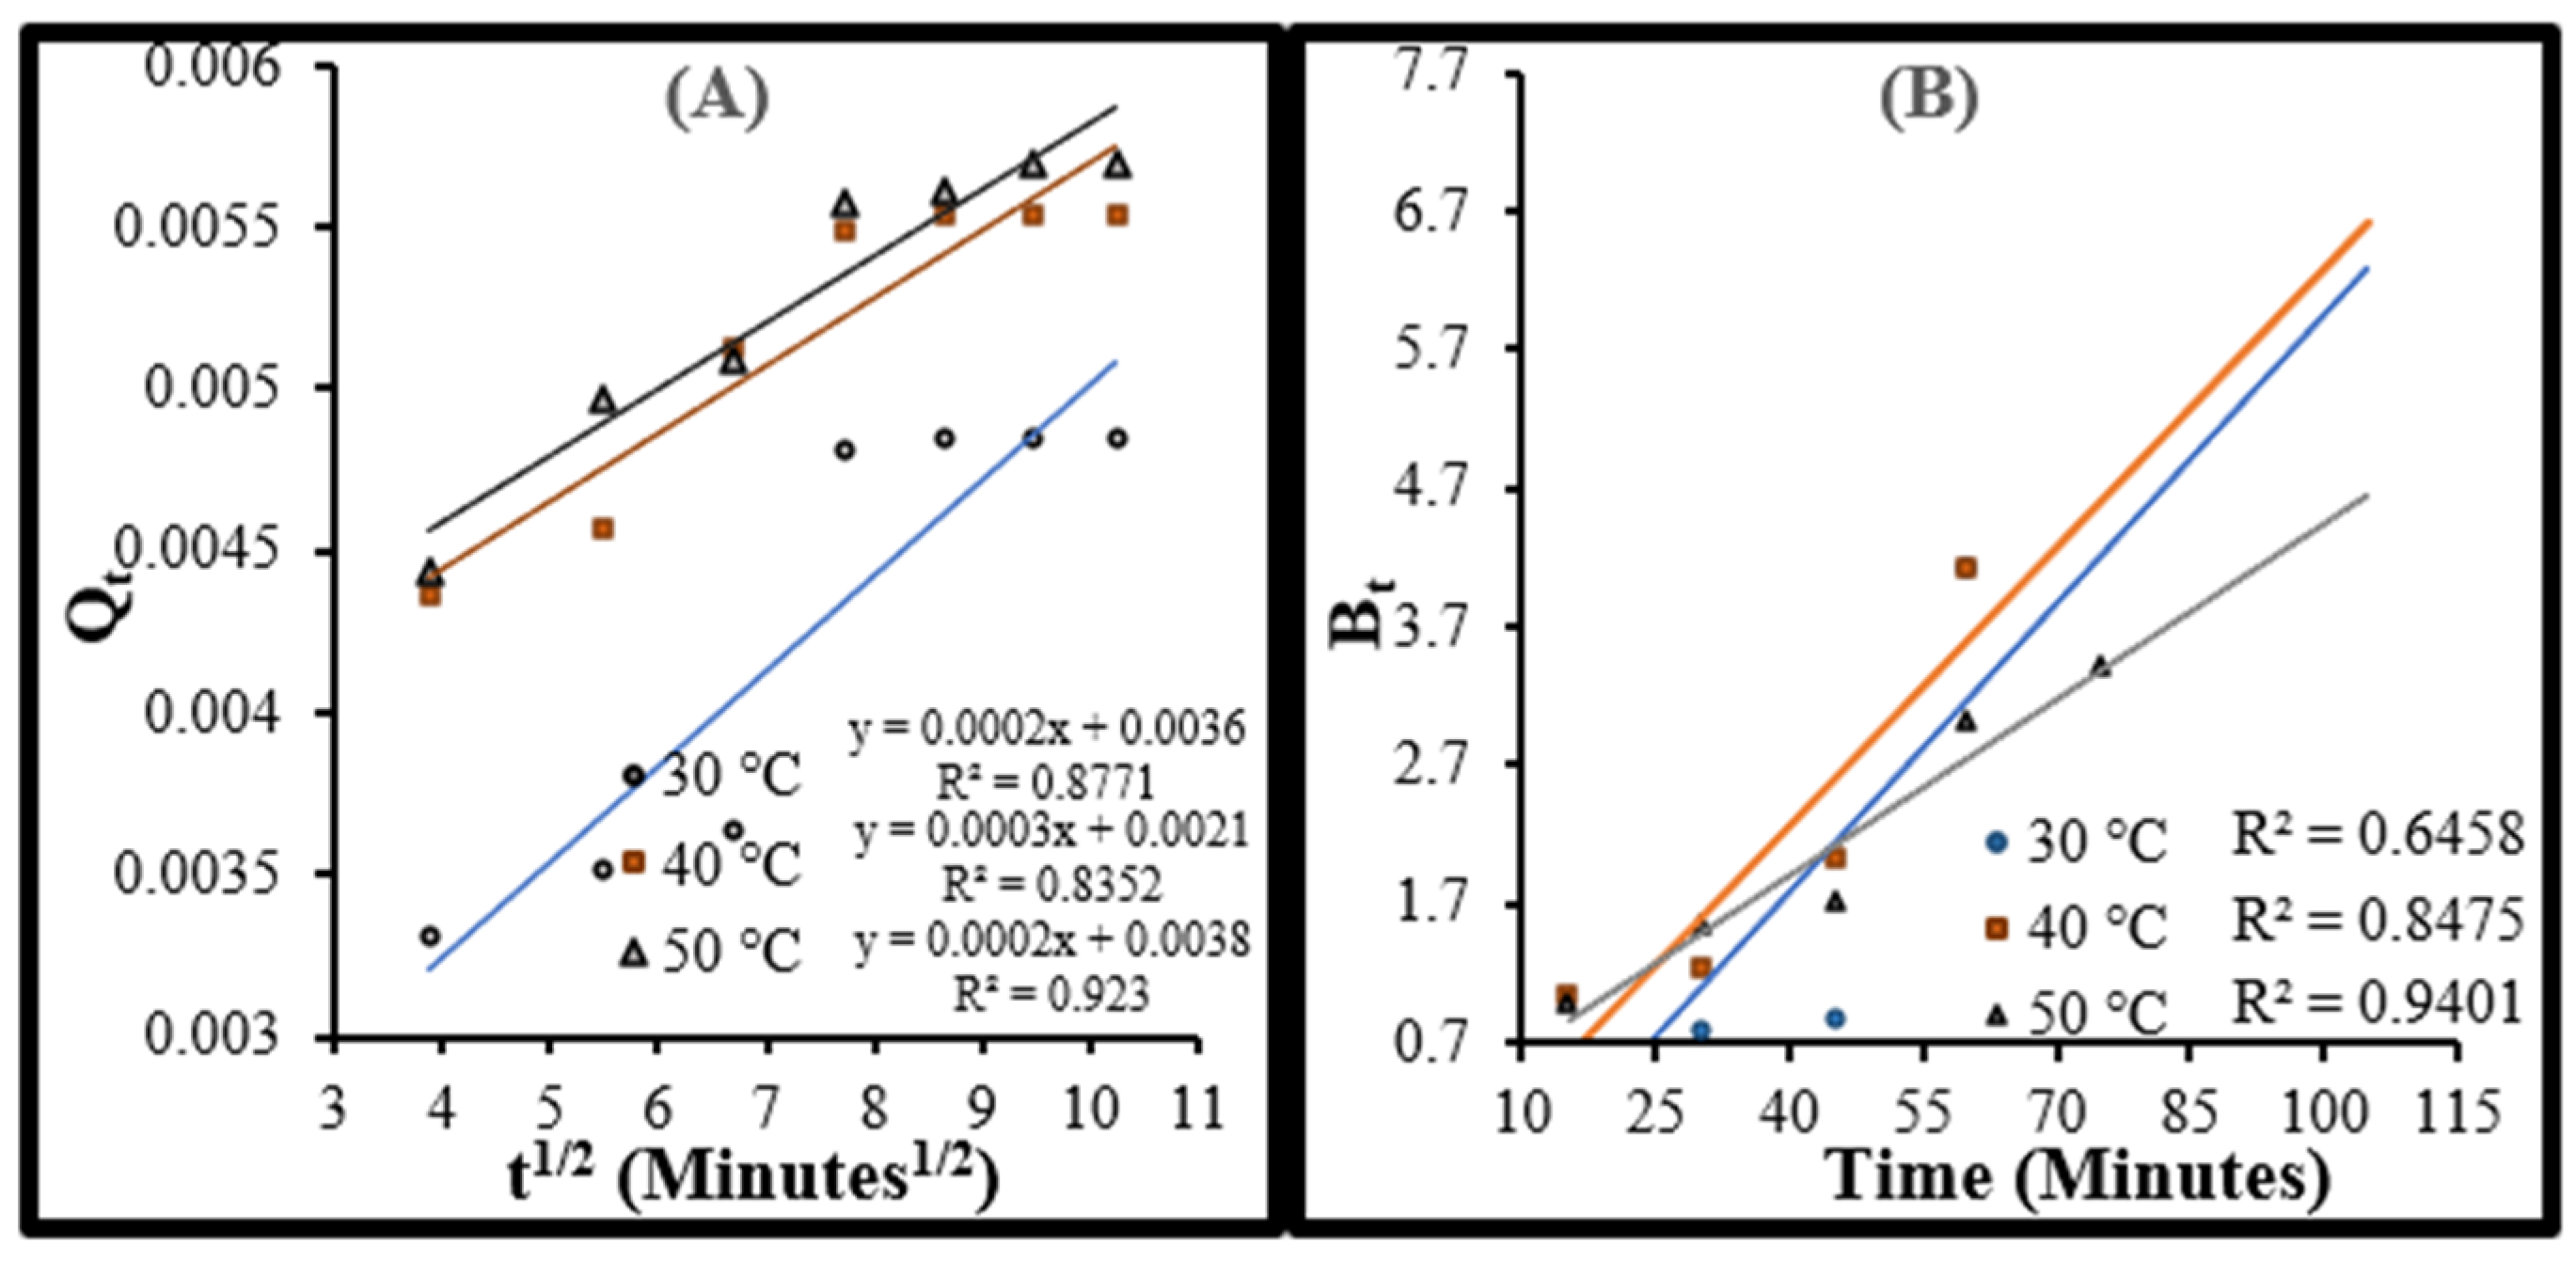
To determine whether intraparticle diffusion is the rate-limiting step, Equation (5) is used. It is well established that if a plot of t½ versus Qt gives a straight line passing through the origin, this confirms the intraparticle mechanism, while a non-zero intercept indicates the process proceeds either by film or interparticle diffusion. Furthermore, if a plot of t vs. Bt yields a straight line passing through the origin, this indicates that film diffusion is operating, whereas a nonlinear plot or a straight line not passing through the origin demonstrates that particle diffusion is the rate-limiting step [63,64].
To determine the rate-limiting step of adsorption of MY over OMC, firstly, t½ versus Qt (Equation (8)) is plotted {Figure 8A}. Figure 8A clearly indicates that straight lines with non-zero intercepts are obtained at all three temperatures, suggesting that intraparticle diffusion is not occurring in the MY–OMC system [23]. Figure 8B presents a plot of t vs. Bt, and from this it is clear that non-linear curves are obtained, indicating involvement of particle diffusion as the rate limiting step at all three temperatures.
Figure 8.
(A) Intraparticle diffusion plot. (B) Time vs. Bt plot for MY–OMC system at the temperatures indicated.
The effective diffusion coefficient (Di), calculated from the slope of the t’ versus ‘Bt plot, exhibited a declining trend with rising temperatures. The values of Di were found to be 0.069, 0.067, and 0.042 at 303, 313 and 323 K, respectively. This behaviour may be explained by the enhancement of resistive forces acting in opposition to dye transport, which restricts the movement of adsorbed ions.
3.3. The Continuous Process
3.3.1. Adsorption
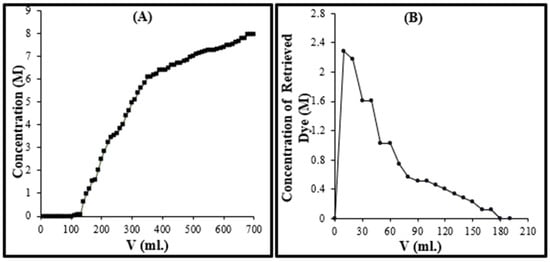
In a column experiment, a total of 26.277 mg of MY dye (in 700 mL, at a concentration of 1 × 10⁻⁴ M) was passed through the column, and 14.071 mg of dye was adsorbed by the OMC fixed bed, while 12.206 mg of dye drained out. The breakthrough curve given in Figure 9A clearly indicates that the dye concentration in the initially collected aliquots is negligible, and the increase in dye concentration starts after 130 mL of dye solution had passed through the column. The dye concentration of the exiting dye solution increases almost linearly and at 680 mL attains a plateau, where the exiting dye concentration becomes equal to the original dye concentration (1 × 10⁻⁴ M). Thus, from Figure 9A, Vb is found to be 130 mL, while Vx is 680 mL. During the column experiment, the rate of flow of dye solution in the column was kept at 8 mL/min.
Figure 9.
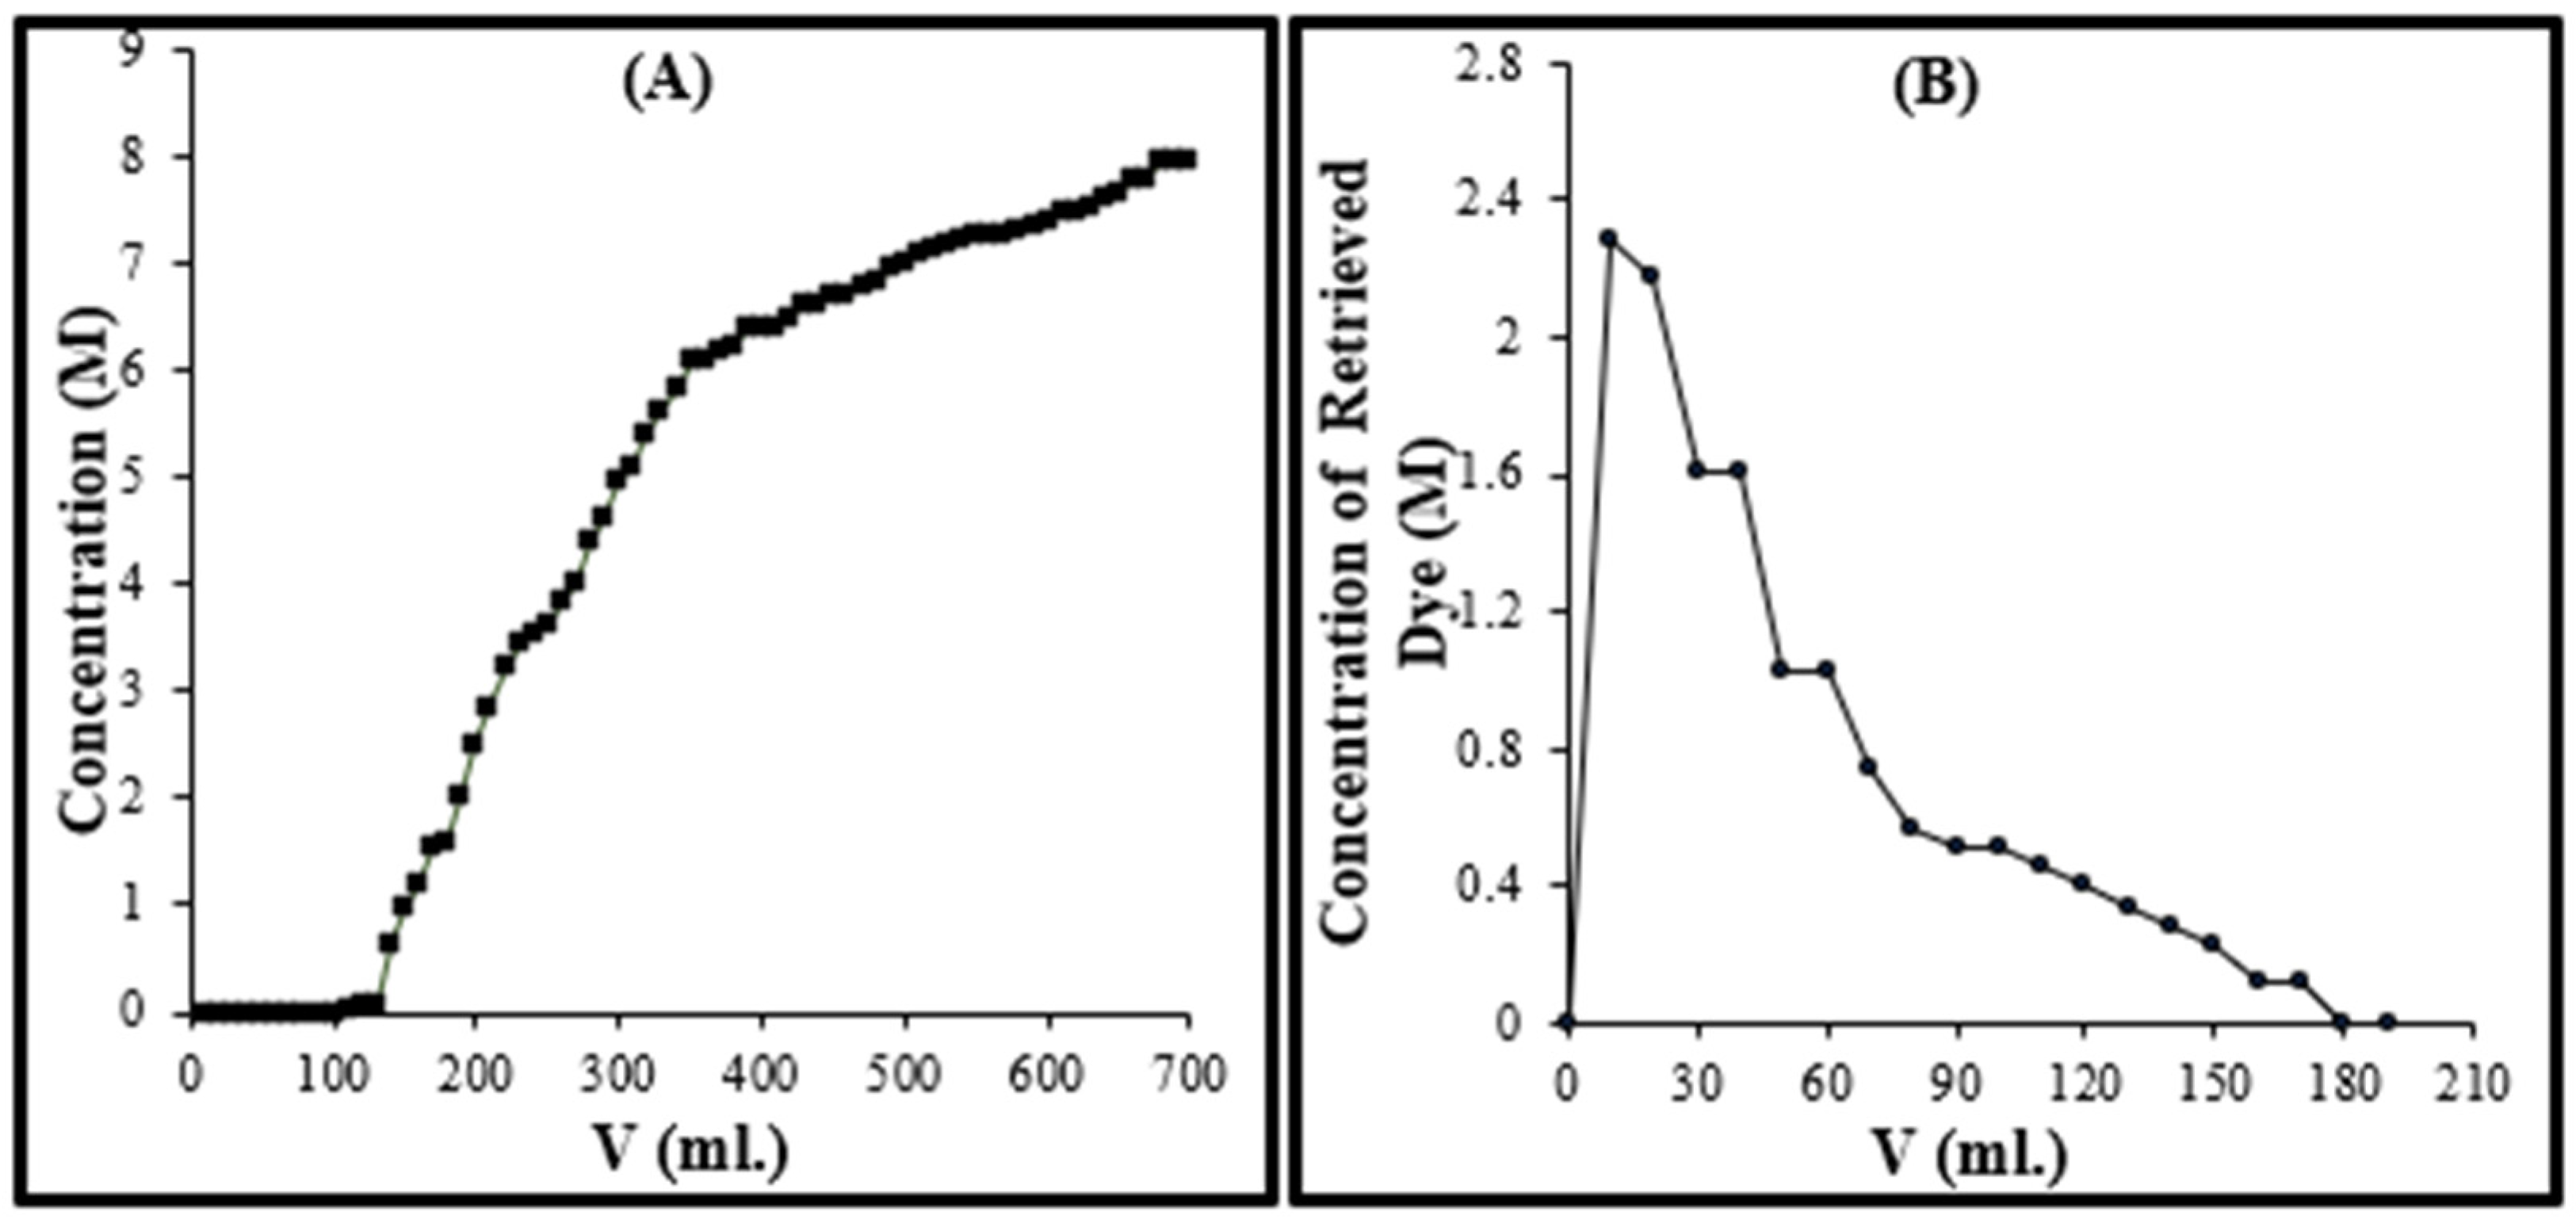
(A) Breakthrough curve, concentration versus collected volume (V) for the adsorption of MY over OMC in the fixed-bed column. (B) Desorption of MY dye from the exhausted fixed-bed column of OMC.
The parameters of column operation were calculated from Equations (9)–(13). The percentage saturation of the OMC column after adsorbing the MY dye is evaluated as 99.94%. The percentage saturation of a column is a measure of the capacity of the adsorbent to accumulate adsorbate (the dye). Initially, when the column is unused, the saturation is 0%. As the operation continues, more and more adsorption sites become occupied, and some part of the dye starts appearing in the eluent at the outlet of the column. Further elution of the solvent results in the complete saturation of the adsorbent bed, and as a result, the concentrations of the dye at the inlet and the outlet become equal. At this stage the operation is stopped and the column is thought to be completely saturated, or 100% exhausted. In simple terms, percentage saturation reflects how much of the capacity of the adsorbent bed has been used at a given stage of the experiment [65,66].
3.3.2. Desorption
Figure 9B indicates that, during the first cycle, a total of 170 mL of dilute HCl was sufficient to remove 99.713% of the adsorbed MY from the OMC column. The first 10 mL aliquot of dilute HCl eluted the most MY dye. The first 50 mL of eluent was enough to recover 55% of the adsorbed dye, while a total of 100 mL washed out 90% of the dye available in the column. After passing 170 mL of dilute acid, a total of 14.0310 mg of dye was collected out of 14.0717 mg of the dye initially adsorbed.
3.3.3. Column Efficiency
A total of eleven adsorption–desorption cycles were performed, and it was found that, in the first cycle, 99.713% of the dye was retrieved, while, in the 11th cycle, 97.660% was recovered. It is also found that for each of the first four cycles, 99.713% of the dye was eluted, after which there was a systematic, marginal decrease in the percentage of collected dye until the 11th cycle. From the 5th to 10th cycle, the percentages of dye obtained are 99.698%, 99.691%, 99.684%, 99.677%, 99.670%, and 99.663%, respectively. Considering the continuous, constant marginal drop of the column efficiency in the adsorption–desorption cycles, the operation was stopped, and it is expected that the same downward trend would be followed in subsequent cycles. This further shows that OMC is a robust adsorbent, and successful adsorption–desorption can be projected even for more than 100 cycles.
4. Comparative Account of OMC’s Efficiency
With the help of the available literature, attempts have been made to compare the maximum adsorption capacity of OMC with that of other adsorbents towards MY. The data presented in Table 3 presents the maximum adsorption capacity of OMC at 303, 313 and 323 K and compares these with the adsorption capacities of 15 other adsorbents. Of the synthetic adsorbents (synthesised Manganese Ferrite, mesoporous activated carbon from tomatoes using ZnCl2, polyaniline-bentonite composite, amine-functionalized rice husk silica, Mg–Fe–NO3 layered double hydroxide, amine-functionalized green nano-Ceria and bovine serum albumin-modified rice husk silica) and natural adsorbents (saw dust carbon, rice husk carbon, activated coconut shell, shrimp shell, peanut shell-based activated carbon and green nano-ceria) the OMC of the present study possesses the highest adsorption capacity towards MY at all temperatures studied, and showed the best results at 323 K. Thus it can be safely concluded that OMC exhibits higher MY uptake than the other adsorbents cited and can be considered the best adsorbent to remove MY from wastewater.
Table 3.
Maximum adsorption capacities of OMC and various other adsorbents at different temperatures.
5. Challenges of the Current Proposed Approach
The present work is a laboratory study of the potential for the removal of the hazardous dye, MY, using a metal- and halide-free OMC adsorbent. Actual industrial effluents are more complex than the feedstock used here. They will involve salinity, a different pH environment, possibly other dyes, and other chemical additives and impurities, depending upon the nature of the manufacturing unit. Therefore, a detailed pilot study on real samples addressing these variables and challenges is recommended to build on the findings of the present investigation and work towards an industrially applicable solution.
6. Conclusions
The present work was devoted to the adsorptive removal of a toxic anionic dye, MY, using OMC as the adsorbent material. A metal- and halide-free OMC was prepared using a soft template approach, and this material was characterised by electron microscopy, gas physisorption, FTIR and XRD. In batch studies, optimum values of key experimental parameters for the adsorption of MY were determined. On the basis of the Langmuir adsorption isotherm model, it was found that the MY adsorbs over the homogeneous surface of OMC as a monolayer, while the applicability of the Freundlich adsorption isotherm confirmed the subsequent formation of multilayers. Utilising the Langmuir constant, various thermodynamic parameters were calculated, and, on the basis of ΔHo values, it was ascertained that physisorption is operative in the present case. Kinetic measurements confirmed that the adsorption process follows pseudo-second-order kinetics with particle diffusion as the rate-determining step. Finally, continuous dye adsorption/desorption cycles using a fixed-bed column were carried out, and bulk adsorption and recovery of the MY dye were successfully achieved. In summary, it can be safely stated that the metal- and halide-free OMC used here is a sustainable, robust, safe and efficient adsorbent material for the removal of MY from wastewater.
Author Contributions
Conceptualisation, J.M., A.M. and R.T.B.; methodology, B.G.; formal analysis, H.H.; investigation, B.G. and H.H.; writing—original draft, B.G. and A.M.; writing—review and editing, J.M. and R.T.B.; supervision, J.M., A.M. and R.T.B. All authors have read and agreed to the published version of the manuscript.
Funding
The authors are grateful to the Ministry of Human Resource Development (presently Ministry of Education) of the Government of India for financial support through the SPARC initiative (project: SPARC/2018-2019/P307/SL). One of the authors (Bharti Gaur) is thankful to Maulana Azad National Institute of Technology, Bhopal, for providing financial assistance through a Senior Research Fellowship. HH is grateful for his PhD studentship funded by the Higher Education Commission, Pakistan and the University of St Andrews. We acknowledge recent funding for the characterisation facility from the Engineering and Physical Sciences Research Council (EPSRC) of the UK (EP/T019298/1, EP/L017008/1) and the EPSRC Strategic Resources Grant (EP/R023751/1).
Data Availability Statement
The data presented in this study are openly available in the PURE repository of the University of St Andrews and can be accessed at https://pure.st-andrews.ac.uk/admin/editor/dk/atira/pure/modules/datasets/external/model/dataset/editor/dataseteditor.xhtml?scheme=&type=&id=324169983 (accessed on 13 April 2026) and https://doi.org/10.17630/0b7938f0-eeb1-4fe0-bcbe-f9a4acee7301 (Gaur 2025).
Acknowledgments
Materials characterisation (gas physisorption, electron microscopy, XRD, and FTIR analysis) were carried out at the University of St Andrews.
Conflicts of Interest
The authors declare no conflicts of interest.
References
- Hunter, L.M.; Gray, C.; Veron, J. (Eds.) International Handbook of Population and Environment; Springer: Berlin/Heidelberg, Germany, 2022. [Google Scholar] [CrossRef] [Scilit]
- Belpaire, C.; Reyns, T.; Geeraerts, C.; Loco, J.V. Toxic textile dyes accumulate in wild European eel Anguilla Anguilla. Chemosphere 2015, 138, 784–791. [Google Scholar] [CrossRef] [Scilit]
- Carmen, Z.; Daniela, S. Textile organic dyes–characteristics, polluting effects and separation/elimination procedures from industrial effluents–A critical overview. In Organic Pollutants Ten Years After the Stockholm Convention—Environmental and Analytical Update; Puzyn, T., Mostrag-Szlichtyng, A., Eds.; IntechOpen: London, UK, 2012; Chapter 3; pp. 55–86. [Google Scholar] [CrossRef] [Scilit]
- Shabatine, T.I.; Gromova, Y. Adsorption-Fundamental Mechanisms and Applications; Intechopen: London, UK, 2025. [Google Scholar] [CrossRef] [Scilit]
- Peramune, D.; Manatunga, D.C.; Dassanayake, R.S.; Premalal, V.; Liyanage, R.N.; Gunathilake, C.; Abidi, N. Recent advances in biopolymer-based advanced oxidation processes for dye removal applications: A review. Environ. Res. 2012, 215, 114242. [Google Scholar] [CrossRef] [Scilit]
- Mcyotto, F.; Daniel, Q.W.; Macharia, K.; Huang, M.; Shen, C.; Chow, C.W.K. Effect of dye structure on color removal efficiency by coagulation. Chem. Eng. J. 2021, 405, 126674. [Google Scholar] [CrossRef] [Scilit]
- Packialakshmi, J.S.; Albeshr, M.F.; Alrefaei, A.F.; Zhang, F.; Liu, X.; Selvankumar, T.; Mythili, R. Development of ZnO/SnO2/rGO hybrid nanocomposites for effective photocatalytic degradation of toxic dye pollutants from aquatic ecosystems. Environ. Res. 2023, 225, 115602. [Google Scholar] [CrossRef] [Scilit]
- Rashidi, H.R.; Sulaiman, N.M.N.; Hashim, N.A.; Hassan, C.R.C.; Ramli, M.R. Synthetic reactive dye wastewater treatment by using nano-membrane filtration. Desalination Water Treat. 2015, 55, 86–95. [Google Scholar] [CrossRef] [Scilit]
- Soares, O.S.G.P.; Orfao, J.M.; Portela, D.; Vieira, A.; Pereira, M.F. Ozonation of textile effluents and dye solutions under continuous operation: Influence of operating parameters. J. Hazard. Mater. 2006, 137, 1664–1673. [Google Scholar] [CrossRef] [Scilit]
- Cooney, D.O. Adsorption Design for Wastewater Treatment; CRC Press: Boca Raton, FL, USA, 1998. Available online: https://lccn.loc.gov/98005694 (accessed on 31 December 1998).
- Yagub, M.T.; Sen, T.K.; Afroze, S.; Ang, H.M. Dye and its removal from aqueous solution by adsorption: A review. Adv. Colloid Interface Sci. 2014, 209, 172–184. [Google Scholar] [CrossRef] [Scilit] [PubMed]
- Benkhaya, S.; M’rabet, S.; Harfi, A.E. Classifications, properties, recent synthesis and applications of azo dyes. Heliyon 2020, 6, 03271. [Google Scholar] [CrossRef] [Scilit] [PubMed]
- Nath, P.P.; Sarkar, K.; Tarafder, P.; Mondal, M.; Das, K.; Paul, G. Practice of using MY as food colour to process food in unorganized sector of West Bengal—A case study. Int. Food Res. J. 2015, 22, 1424–1428. [Google Scholar]
- Ghosh, D.; Singha, P.S.; Firdaus, S.B.; Ghosh, S. MY: The toxic food colorant. Asian Pac. J. Health Sci. 2017, 4, 65–66. [Google Scholar] [CrossRef] [Scilit]
- Hunter, I.Q.; Grier, H.; Muscato, M. Enhancement of histological detail using MY as counterstain in periodic acid schiff’s hematoxylin staining of glycol methacrylate tissue sections. Biotech. Histochem. 2009, 66, 169–172. [Google Scholar] [CrossRef] [Scilit]
- Ramchandani, S.; Das, M.; Joshi, A.; Khanna, S.K. Effect of oral and parenteral administration of metanil yellow on some hepatic and intestinal biochemical parameters. J. Appl. Toxicol. 1997, 17, 85–91. [Google Scholar] [CrossRef] [Scilit]
- Khan, I.S.; Ali, M.N.; Hamid, R.; Ganie, S.A. Genotoxic effect of two commonly used food dyes MY and Carmoisine using Allium cepa L. as indicator. Toxicol. Rep. 2020, 7, 370–375. [Google Scholar] [CrossRef] [Scilit]
- Moosavi, S.; Lai, C.W.; Gan, S.; Zamiri, G.; Pivehzhani, O.A.; John, M.R. Application of efficient magnetic particles and activated carbon for dye removal from wastewater. ACS Omega 2020, 5, 20684–20697. [Google Scholar] [CrossRef] [Scilit]
- Goswami, L.; Kushwaha, A.; Kafle, S.R.; Kim, B.S. Surface modification of biochar for dye removal from wastewater. Catalysts 2022, 12, 817. [Google Scholar] [CrossRef] [Scilit]
- Wu, D.; Yang, M.; Yu, J.; Dyballa, M.; Yang, P.; Li, M.; Hou, G.; Hunger, M.; Dai, W. The role of adsorption and diffusion in improving the selectivity and reactivity of zeolite catalysts. Chem. Soc. Rev. 2025, 54, 9192–9244. [Google Scholar] [CrossRef] [Scilit]
- Gaminian, H.; Montazer, M. Carbon black enhanced conductivity, carbon yield and dye adsorption of sustainable cellulose derived carbon nanofibers. Cellulose 2018, 25, 5227–5240. [Google Scholar] [CrossRef] [Scilit]
- Liu, F.; Chung, S.; Oh, G.; Seo, T.S. Three-dimensional graphene oxide nanostructure for fast and efficient water-soluble dye removal. ACS Appl. Mater. Interfaces 2012, 4, 922–927. [Google Scholar] [CrossRef] [Scilit]
- Mariyam, A.; Mittal, J.; Sakina, F.; Baker, R.T.; Sharma, A.K.; Mittal, A. Efficient batch and Fixed-Bed sequestration of a basic dye using a novel variant of ordered mesoporous carbon as adsorbent. Arab. J. Chem. 2021, 14, 103186. [Google Scholar] [CrossRef] [Scilit]
- Mittal, J.; Mariyam, A.; Sakina, F.; Baker, R.T.; Sharma, A.K.; Mittal, A. Batch and bulk adsorptive removal of anionic dye using metal/halide–free ordered mesoporous carbon as adsorbent. J. Clean. Prod. 2021, 321, 129060. [Google Scholar] [CrossRef] [Scilit]
- P’yanova, L.G.; Likholobov, V.A.; Drozdov, V.A.; Baklanova, O.N.; Talzi, V.P.; Sedanova, A.V.; Drozdetskaya, M.S.; Kornienko, N.V. Synthesis and physicochemical properties of a biospecific carbon sorbent modified with lactic-acid oligomers. Prot. Met. Phys. Chem. Surf. 2017, 53, 639–644. [Google Scholar] [CrossRef] [Scilit]
- Sawant, S.Y.; Pawar, R.R.; Senthilkumar, S.; Somani, R.S.; Cho, M.H.; Bajaj, H.C. Pilot-scale produced super activated carbon with a nanoporous texture as an excellent adsorbent for the efficient removal of metanil yellow. Powder Technol. 2018, 333, 243–251. [Google Scholar] [CrossRef] [Scilit]
- Zhu, B.; Xu, J.; Xu, Z.; Wu, M.; Jiang, H. Soft-template solvent thermal method synthesis of magnetic mesoporous carbon-silica composite for adsorption of methyl orange from aqueous solution. Environ. Sci. Pollut. Res. 2022, 29, 40734–40744. [Google Scholar] [CrossRef] [Scilit]
- Choma, J.; Jedynak, K.; Gorka, J.; Jaroniec, M. Soft–templating synthesis and adsorption properties of mesoporous carbons with embedded silver nanoparticles. Adsorption 2011, 17, 461–466. [Google Scholar] [CrossRef] [Scilit]
- Sakina, F.; Baker, R.T. Metal-and halogen-free synthesis of ordered mesoporous carbon materials. Microporous Mesoporous Mater. 2019, 289, 109622. [Google Scholar] [CrossRef] [Scilit]
- Lagergren, S. About the theory of so-called adsorption of soluble substances. K. Sven. Vetenskapsakademiens Handl. 1998, 24, 1–39. [Google Scholar]
- Ho, Y.S.; Mckay, G. Kinetic models for the sorption of dye from aqueous solution by wood. Process Saf. Environ. Prot. 1998, 6, 183–191. [Google Scholar] [CrossRef] [Scilit]
- Weber, J.; Walter, J.; Marris, J.C. Kinetics of adsorption on carbon from solution. J. Sanit. Eng. Div. 1963, 89, 31–59. [Google Scholar] [CrossRef] [Scilit]
- Reichenberg, D. Properties of Ion-exchange resins in relation to their structure. III. Kinetics of exchange. J. Am. Chem. Soc. 1953, 75, 589–597. [Google Scholar] [CrossRef] [Scilit]
- Michaels, A.S. Simplified method of interpreting kinetic data in fixed-bed ion exchange. Ind. Eng. Chem. 1952, 44, 1922–1930. [Google Scholar] [CrossRef] [Scilit]
- Johnston, W.A. Designing fixed bed adsorbers. Chem. Eng. 1972, 79, 87–92. [Google Scholar]
- Ma, X.; Yuan, H.; Hu, M. A simple method for synthesis of ordered mesoporous carbon. Diam. Relat. Mater. 2019, 98, 107480. [Google Scholar] [CrossRef] [Scilit]
- Sakina, F.; Baker, R.T. Ordered mesoporous carbons witg body centred cubic pore structure. Carbon Trends 2021, 4, 100051. [Google Scholar] [CrossRef] [Scilit]
- Rozamliana, J.; Gurung, J.; Pulikkal, A.K. Interaction of Metanil Yellow dye with cationic surfactants: Conductometric and spectroscopic studies. J. Mol. Liq. 2022, 368, 120653. [Google Scholar] [CrossRef] [Scilit]
- Mittal, A.; Gupta, V.K.; Malviya, A.; Mittal, J. Process development for the batch and bulk removal and recovery of a hazardous, water-soluble azo dye (Metanil Yellow) by adsorption over waste materials (Bottom Ash and De-Oiled Soya). J. Hazard. Mater. 2008, 151, 821–832. [Google Scholar] [CrossRef] [Scilit] [PubMed]
- Gaur, B.; Mittal, J.; Shah, S.A.A.; Mittal, A.; Baker, R.T. Sequestration of an azo dye by a potential biosorbent: Characterization of biosorbent, adsorption isotherm and adsorption kinetic studies. Molecules 2024, 29, 2387. [Google Scholar] [CrossRef] [Scilit] [PubMed]
- Nwabanne, J.T.; Igbokwe, P.K. Mechanism of copper (II) removal from aqueous solution using activated carbon prepared from different agricultural materials. Int. J. Multidiscip. Sci. Eng. 2012, 3, 46–52. [Google Scholar]
- Rasheed, A.A.; Muhammad, H.S.; Jakada, Y.; Salahudeen, N. Effect of Adsorbent Dosage on the Kinetics and Isotherms of Lead (II) Removal from Aqueous Solution Using Corn Husk. Arid. Zone J. Eng. Technol. Environ. 2025, 21, 702–716. [Google Scholar]
- Crini, G.; Badot, P.M. Application of chitosan, a natural aminopolysaccharide, for dye removal from aqueous solutions by adsorption processes using batch studies: A review of recent literature. Prog. Polym. Sci. 2008, 33, 399–447. [Google Scholar] [CrossRef] [Scilit]
- Abd El–Latif, M.M.; Ibrahim, A.M.; El-Kady, M.F. Adsorption equilibrium, kinetics and thermodynamics of methylene blue from aqueous solutions using biopolymer oak sawdust composite. J. Am. Sci. 2010, 6, 267–283. [Google Scholar]
- Gebreslassie, Y.T. Equilibrium, kinetics, and thermodynamic studies of malachite green adsorption onto fig (Ficus cartia) leaves. J. Anal. Methods Chem. 2020, 2020, 7384675. [Google Scholar] [CrossRef] [Scilit] [PubMed]
- Mittal, A. Adsorption kinetics of removal of a toxic dye, Malachite Green, from wastewater by using hen feathers. J. Hazard. Mater. 2006, 133, 196–202. [Google Scholar] [CrossRef] [Scilit]
- Mittal, A.; Mittal, J.; Malviya, A. Adsorptive removal of hazardous dye Brilliant Green from aqueous solution by waste materials. J. Colloid Interface Sci. 2010, 343, 463–473. [Google Scholar] [CrossRef] [Scilit]
- Alafnan, S.; Awotunde, A.; Glatz, G.; Adjei, S.; Alrumaih, I.; Gowida, A. Langmuir adsorption isotherm in unconventional resources: Applicability and limitations. J. Pet. Sci. Eng. 2021, 207, 109172. [Google Scholar] [CrossRef] [Scilit]
- Latour, R.A. The Langmuir isotherm: A commonly applied but misleading approach for the analysis of protein adsorption behavior. J. Biomed. Mater. Res. Part A 2014, 103, 949–958. [Google Scholar] [CrossRef] [Scilit] [PubMed]
- Myers, A.L. Thermodynamics of adsorption in porous materials. AIChE J. 2002, 48, 145–160. [Google Scholar] [CrossRef] [Scilit]
- Mittal, A.; Kurup, L.; Mittal, J. Freundlich and Langmuir adsorption isotherms and kinetics for the removal of Tartrazine from aqueous solutions using hen feathers. J. Hazard. Mater. 2007, 146, 243–248. [Google Scholar] [CrossRef] [Scilit]
- Boudart, M. Kinetics and mechanism of ammonia synthesis. Catal. Rev.—Sci. Eng. 1981, 23, 1–15. [Google Scholar] [CrossRef] [Scilit]
- Bansal, R.C.; Goyal, M. Activated Carbon Adsorption; Taylor and Francis: London, UK, 2005; p. 520. [Google Scholar] [CrossRef] [Scilit]
- Kasemset, C.; Sae-Haew, N.; Sopadang, A. Multiple regression model for forecasting quantity of supply of off–season longan. Chiang Mai Univ. J. Nat. Sci. 2014, 13, 391–402. [Google Scholar] [CrossRef] [Scilit]
- Misak, N.Z. Langmuir isotherm and its application in ion-exchange reactions. React. Polym. 1993, 21, 53–64. [Google Scholar] [CrossRef] [Scilit]
- Proctor, A.U.O.A.; Toro-Vazquez, J.F. The Freundlich isotherm in studying adsorption in oil processing. J. Am. Oil Chem. Soc. 1996, 73, 1627–1633. [Google Scholar] [CrossRef] [Scilit]
- Johnson, R.D.; Arnold, F.H. The Temkin isotherm describes heterogeneous protein adsorption. Biochim. Et Biophys. Acta (BBA)-Protein Struct. Mol. Enzymol. 1995, 1247, 293–297. [Google Scholar] [CrossRef] [Scilit]
- Chen, S.G.; Yang, R.T. Theoretical basis for the potential theory adsorption isotherms. The Dubinin–Radushkevich and Dubinin–Astakhov equations. Langmuir 1994, 10, 4244–4249. [Google Scholar] [CrossRef] [Scilit]
- Gawande, S.M.; Belwalkar, N.S.; Mane, A.A. Adsorption and its isotherm–theory. Int. J. Eng. Res. 2017, 6, 312–316. [Google Scholar] [CrossRef] [Scilit]
- Idan, I.J.; Abdullah, L.C.; Choong, T.S.Y.; Jamil, S.N.A.B.M. Equilibrium, kinetics and thermodynamic adsorption studies of acid dyes on adsorbent developed from kenaf core fiber. Adsorpt. Sci. Technol. 2018, 36, 694–712. [Google Scholar] [CrossRef] [Scilit]
- Pang, Y.L.; Tan, J.H.; Lim, S.; Chong, W.C. A State-of-the-Art Review on Biowaste Derived Chitosan Biomaterials for Biosorption of Organic Dyes: Parameter Studies, Kinetics, Isotherms and Thermodynamics. Polymers 2021, 13, 3009. [Google Scholar] [CrossRef] [Scilit] [PubMed]
- Salman, M.; Demir, M.; Tang, K.H.D.; Cao, L.T.T.; Bunrith, S.; Chen, T.W.; Darwish, N.M.; AlMunqedhi, B.M.; Hadibarata, T. Removal of Cresol Red by Adsorption Using Wastepaper. Ind. Domest. Waste Manag. 2022, 2, 1–8. [Google Scholar] [CrossRef] [Scilit]
- Sutherland, C. A method of classifying the influence of intraparticle diffusion in adsorption systems: Characteristic curves of the diffusion-chemisorption kinetic model. Environ. Toxicol. Chem. 2025, 44, 1209–1221. [Google Scholar] [CrossRef] [Scilit]
- Wu, X.; Wu, D.; Fu, R.; Zeng, W. Preparation of carbon aerogels with different pore structures and their fixed bed adsorption properties for dye removal. Dye. Pigment. 2012, 95, 689–694. [Google Scholar] [CrossRef] [Scilit]
- Mavinkattimath, R.G.; Kodialbail, V.S.; Sriniketha, G. Continuous adsorption of Remazol Brilliant Blue dye on activated red mud in a fixed bed column. Environ. Sci. Pollut. Res. Int. 2023, 30, 57058–57075. [Google Scholar] [CrossRef] [Scilit]
- Estrada, R.J.R.; Tomon, T.R.B.; Fernandez, R.M.D.; Omisol, C.J.M.; Dumancas, G.G.; Alguno, A.C.; Ramos, M.S.K.; Malaluan, R.M.; Lubguban, A.A. Sequestration of methylene blue dye in a fixed-bed column using activated carbon-infused polyurethane composite adsorbent derived from coconut oil. Sustainability 2024, 16, 10757. [Google Scholar] [CrossRef] [Scilit]
- Sivashankar, R.; Sivasubramanian, V.; Kishore, K.A.; Sathya, A.B.; Thirunavukkarasu, A.; Nithya, R.; Deepanraj, B. Metanil Yellow dye adsorption using green and chemical mediated synthesized manganese ferrite: An insight into equilibrium, kinetics and thermodynamics. Chemosphere 2022, 307, 136218. [Google Scholar] [CrossRef] [Scilit]
- Saygili, H.; Güzel, F. High surface area mesoporous activated carbon from tomato processing solid waste by zinc chloride activation: Process optimization, characterization and dyes adsorption. J. Clean. Prod. 2016, 113, 995–1004. [Google Scholar] [CrossRef] [Scilit]
- Meng, F.; Wang, L.; Pei, M.; Guo, W.; Liu, G. Adsorption of metanil yellow from aqueous solution using polyaniline–bentonite composite. Colloid Polym. Sci. 2017, 295, 1165–1175. [Google Scholar] [CrossRef] [Scilit]
- Malik, P.K. Use of activated carbons prepared from sawdust and rice-husk for adsorption of acid dyes: A case study of Acid Yellow 36. Dye. Pigment. 2003, 56, 239–249. [Google Scholar] [CrossRef] [Scilit]
- Zein, R.; Tomi, Z.B.; Fauzia, S.; Zilfa, Z. Modification of rice husk silica with bovine serum albumin (BSA) for improvement in adsorption of metanil yellow dye. J. Iran. Chem. Soc. 2020, 17, 2599–2612. [Google Scholar] [CrossRef] [Scilit]
- Ramadhani, P.; Chaidir, Z.; Tomi, Z.B.; Rahmiarti, D.; Zein, R. Shrimp shell (Metapenaeus monoceros) waste as a low-cost adsorbent for metanil yellow dye removal in aqueous solution. Desalination Water Treat. 2020, 197, 413–423. [Google Scholar] [CrossRef] [Scilit]
- Garg, D.; Kumar, S.; Sharma, K.; Majumder, C.B. Application of waste peanut shells to form activated carbon and its utilization for the removal of Acid Yellow 36 from wastewater. Groundw. Sustain. Dev. 2019, 8, 512–519. [Google Scholar] [CrossRef] [Scilit]
- Nejati, K.; Rezvani, Z.; Mansurfar, M.; Mirzaee, A.; Mahkam, M. Adsorption of metanil yellow azoic dye from aqueous solution onto Mg-Fe-NO3 layered double hydroxide. Z. Für Anorg. Und Allg. Chem. 2011, 637, 1573–1579. [Google Scholar] [CrossRef] [Scilit]
- Thirunavukkarasu, A.; Muthukumaran, K.; Nithya, R. Adsorption of acid yellow 36 onto green nanoceria and amine functionalized green nanoceria: Comparative studies on kinetics, isotherm, thermodynamics, and diffusion analysis. J. Taiwan Inst. Chem. Eng. 2018, 93, 211–225. [Google Scholar] [CrossRef] [Scilit]
- Santra, A.K.; Pal, T.K.; Datta, S. Removal of Metanil Yellow from its aqueous solution by fly ash and activated carbon produced from different sources. Sep. Sci. Technol. 2008, 43, 1434–1458. [Google Scholar] [CrossRef] [Scilit]

Disclaimer/Publisher’s Note: The statements, opinions and data contained in all publications are solely those of the individual author(s) and contributor(s) and not of MDPI and/or the editor(s). MDPI and/or the editor(s) disclaim responsibility for any injury to people or property resulting from any ideas, methods, instructions or products referred to in the content. |
© 2026 by the authors. Licensee MDPI, Basel, Switzerland. This article is an open access article distributed under the terms and conditions of the Creative Commons Attribution (CC BY) license.