


Abstract
Diabetic retinopathy is associated with early microvascular dysfunction that may alter retinal capillary pressure and promote fluid accumulation in retinal tissue. This study develops a computational model to quantify how the lack of vasomotion affects transcapillary fluid transport and interstitial fluid pressure in the retina. A five-generation retinal arteriole network is first constructed. By introducing vasoconstriction in selected arterioles, the model first simulates the total flow resistance, flow rates, and resulting pressure distribution in the network affected by vasomotion. Starling’s equation was then used to calculate transcapillary fluid filtration, and Darcy’s law was applied to simulate interstitial fluid transport in a cylindrical retinal tissue region. For a simplified two-phase vasomotion cycle, loss of vasomotion increases the average capillary blood pressure by approximately 14%. Over an oscillation cycle, impaired vasomotion increases the required fluid-removal rate at the tissue boundary by approximately 83% in the modeled condition. If the baseline effective retinal fluid-clearance rate is treated as the maximum available clearance capacity, the boundary interstitial pressure must increase by approximately 2.72 mmHg to maintain steady state. Additional simulations examine the effect of increased capillary permeability, which can further enhance fluid leakage into the surrounding tissue. To manage this, the required retinal fluid-clearance rate must increase approximately three- to four-fold, or interstitial fluid pressure must rise by up to 7.52 mmHg. These results suggest that impaired vasomotion may contribute to increased retinal fluid accumulation or elevated interstitial fluid pressure in the retina, and this process may be aggravated as diabetes advances.
1. Introduction
Diabetic retinopathy (DR) is a major microvascular complication of diabetes. It was reported that it remains a leading cause of vision impairment and blindness among working-age adults worldwide [1]. This progressive condition threatens the neuronal retinal tissue with permanent damage and results in symptoms ranging from compromised visual acuity to total blindness [2]. In its early non-proliferative stage, DR is often asymptomatic. Patients face severe, disabling vision loss once the disease advances to proliferative diabetic retinopathy (PDR). Because the resulting vision loss is irreversible, timely screening and proactive risk management are critical to saving patients’ sight.
Early microvascular dysfunction in diabetic retinopathy alters the regulation of retinal blood pressure and flow [3]. This rising capillary blood pressure shifts the hydrostatic and oncotic balance, driving fluid migration into the retinal tissue [4]. Proliferative diabetic retinopathy is characterized by retinal neovascularization [5]. Because these fragile new vessels leak easily, they frequently cause spontaneous hemorrhages into the vitreous humor [3]. Eventually, the scar tissue associated with this neovascularization can contract, pulling on the retina and causing tractional retinal detachment.
Vasomotion refers to the rhythmic oscillation of vascular tone driven by localized constriction and dilation of arteriolar smooth muscle, occurring independently of cardiac, respiratory, or neural mechanisms [6,7]. These cyclic variations operate across a broad temporal spectrum, spanning from rapid cycles of 2–3 s to slower frequencies exceeding 30 s [8]. By dynamically modulating arteriolar diameter, vasomotion regulates downstream capillary perfusion and consequently influences transcapillary fluid dynamics [7,9]. Clinical interest has recently focused on the retinal vasculature, where impaired vasomotion is proposed as an early physiological marker of diabetes. Under normal conditions, this mechanism drives vasoconstriction to shield delicate capillaries from excessive blood flow [4,9]. This protective function is further highlighted by strong experimental evidence linking reduced sympathetic modulation to impaired low-frequency vasomotion in pre-capillary arterioles. It correlates with an increased capillary fluid filtration burden in diabetic patients suffering from neuropathy [10,11,12].
Several studies have explored the physiological consequences of vasomotion, yet their scope is largely limited to individual arterioles [9,12,13]. Consequently, there is a lack of comprehensive theoretical models that account for complex vascular networks and fluid dynamics in the interstitial fluid space of the retina. Furthermore, the literature does not clearly distinguish healthy retinal vasomotion from the impaired or attenuated vasomotion associated with diabetic retinopathy, a condition characterized by reduced or absent rhythmic vessel contractions. This deficiency is critical because absent vasoconstriction leaves the retinal capillary bed in a sustained, high-pressure state, critically increasing the hydrodynamic driving force for fluid filtration into the retina. Previous measurements of the retina provide limited baseline capillary blood pressure values, but they do not directly quantify how cyclic vasomotion alters capillary blood pressure over time [12]. Since transcapillary filtration depends strongly on capillary hydrostatic pressure according to Starling’s law, an increase in time-averaged capillary blood pressure can increase fluid transport into the retinal interstitial fluid space [4]. Therefore, a network-level model that links vasomotion-induced blood pressure changes with Starling-driven fluid transport in retinal tissue is needed to evaluate this mechanism.
The objective of this study is to quantify how vasomotion regulates retinal fluid balance by comparing fluid transport in healthy and diabetic retinopathy conditions. We hypothesize that healthy vasomotion lowers the average capillary blood pressure by alternating between vasodilation and vasoconstriction. To test the hypothesis, we developed a coupled framework combining a five-generation retinal arteriole network with a transcapillary flow model to quantify net fluid transport with or without vasomotion. By introducing vasoconstrictions into select network arterioles, we first simulate total flow resistance using the Hagen–Poiseuille equation, and then determine generation-specific flow rates and the resulting vasomotion-induced pressure distribution. Conversely, diabetic retinopathy is modeled as abolished vasomotion, leading to sustained vasodilation in those arterioles. The calculated pre-capillary arteriole pressures are then coupled to a retinal capillary-tissue model. This model utilizes Darcy’s law for porous retinal tissue and a Starling-type fluid source term to govern fluid exchange between the capillaries and the interstitial space, to further evaluate the role played by vasomotion on the interstitial fluid pressure distribution in the retina.
2. Materials and Methods
2.1. Model Overview
To evaluate how vasomotion affects transcapillary fluid transport in diabetic retinopathy, we develop a coupled vascular-network and retinal tissue-fluid transport model. The model integrates two interconnected components. First, a vascular network mapping the final five arteriole generations determines blood pressure distribution across vessel branches; this specifically highlights how arteriole radius influences pre-capillary blood pressure. Second, this pre-capillary pressure is used to calculate the average capillary blood pressure. This value is then applied to a porous retinal tissue model to simulate transcapillary fluid flow and map interstitial fluid pressure distribution in the retina.
2.2. Construction of a Vascular Network
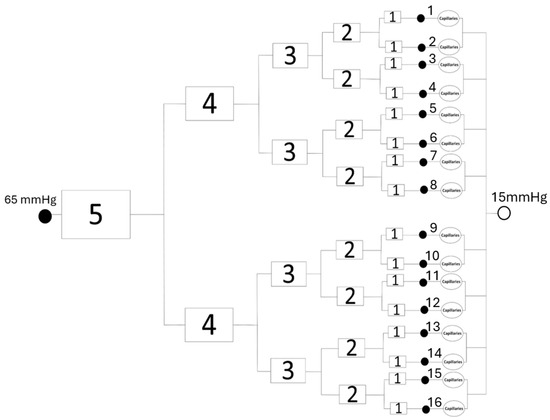
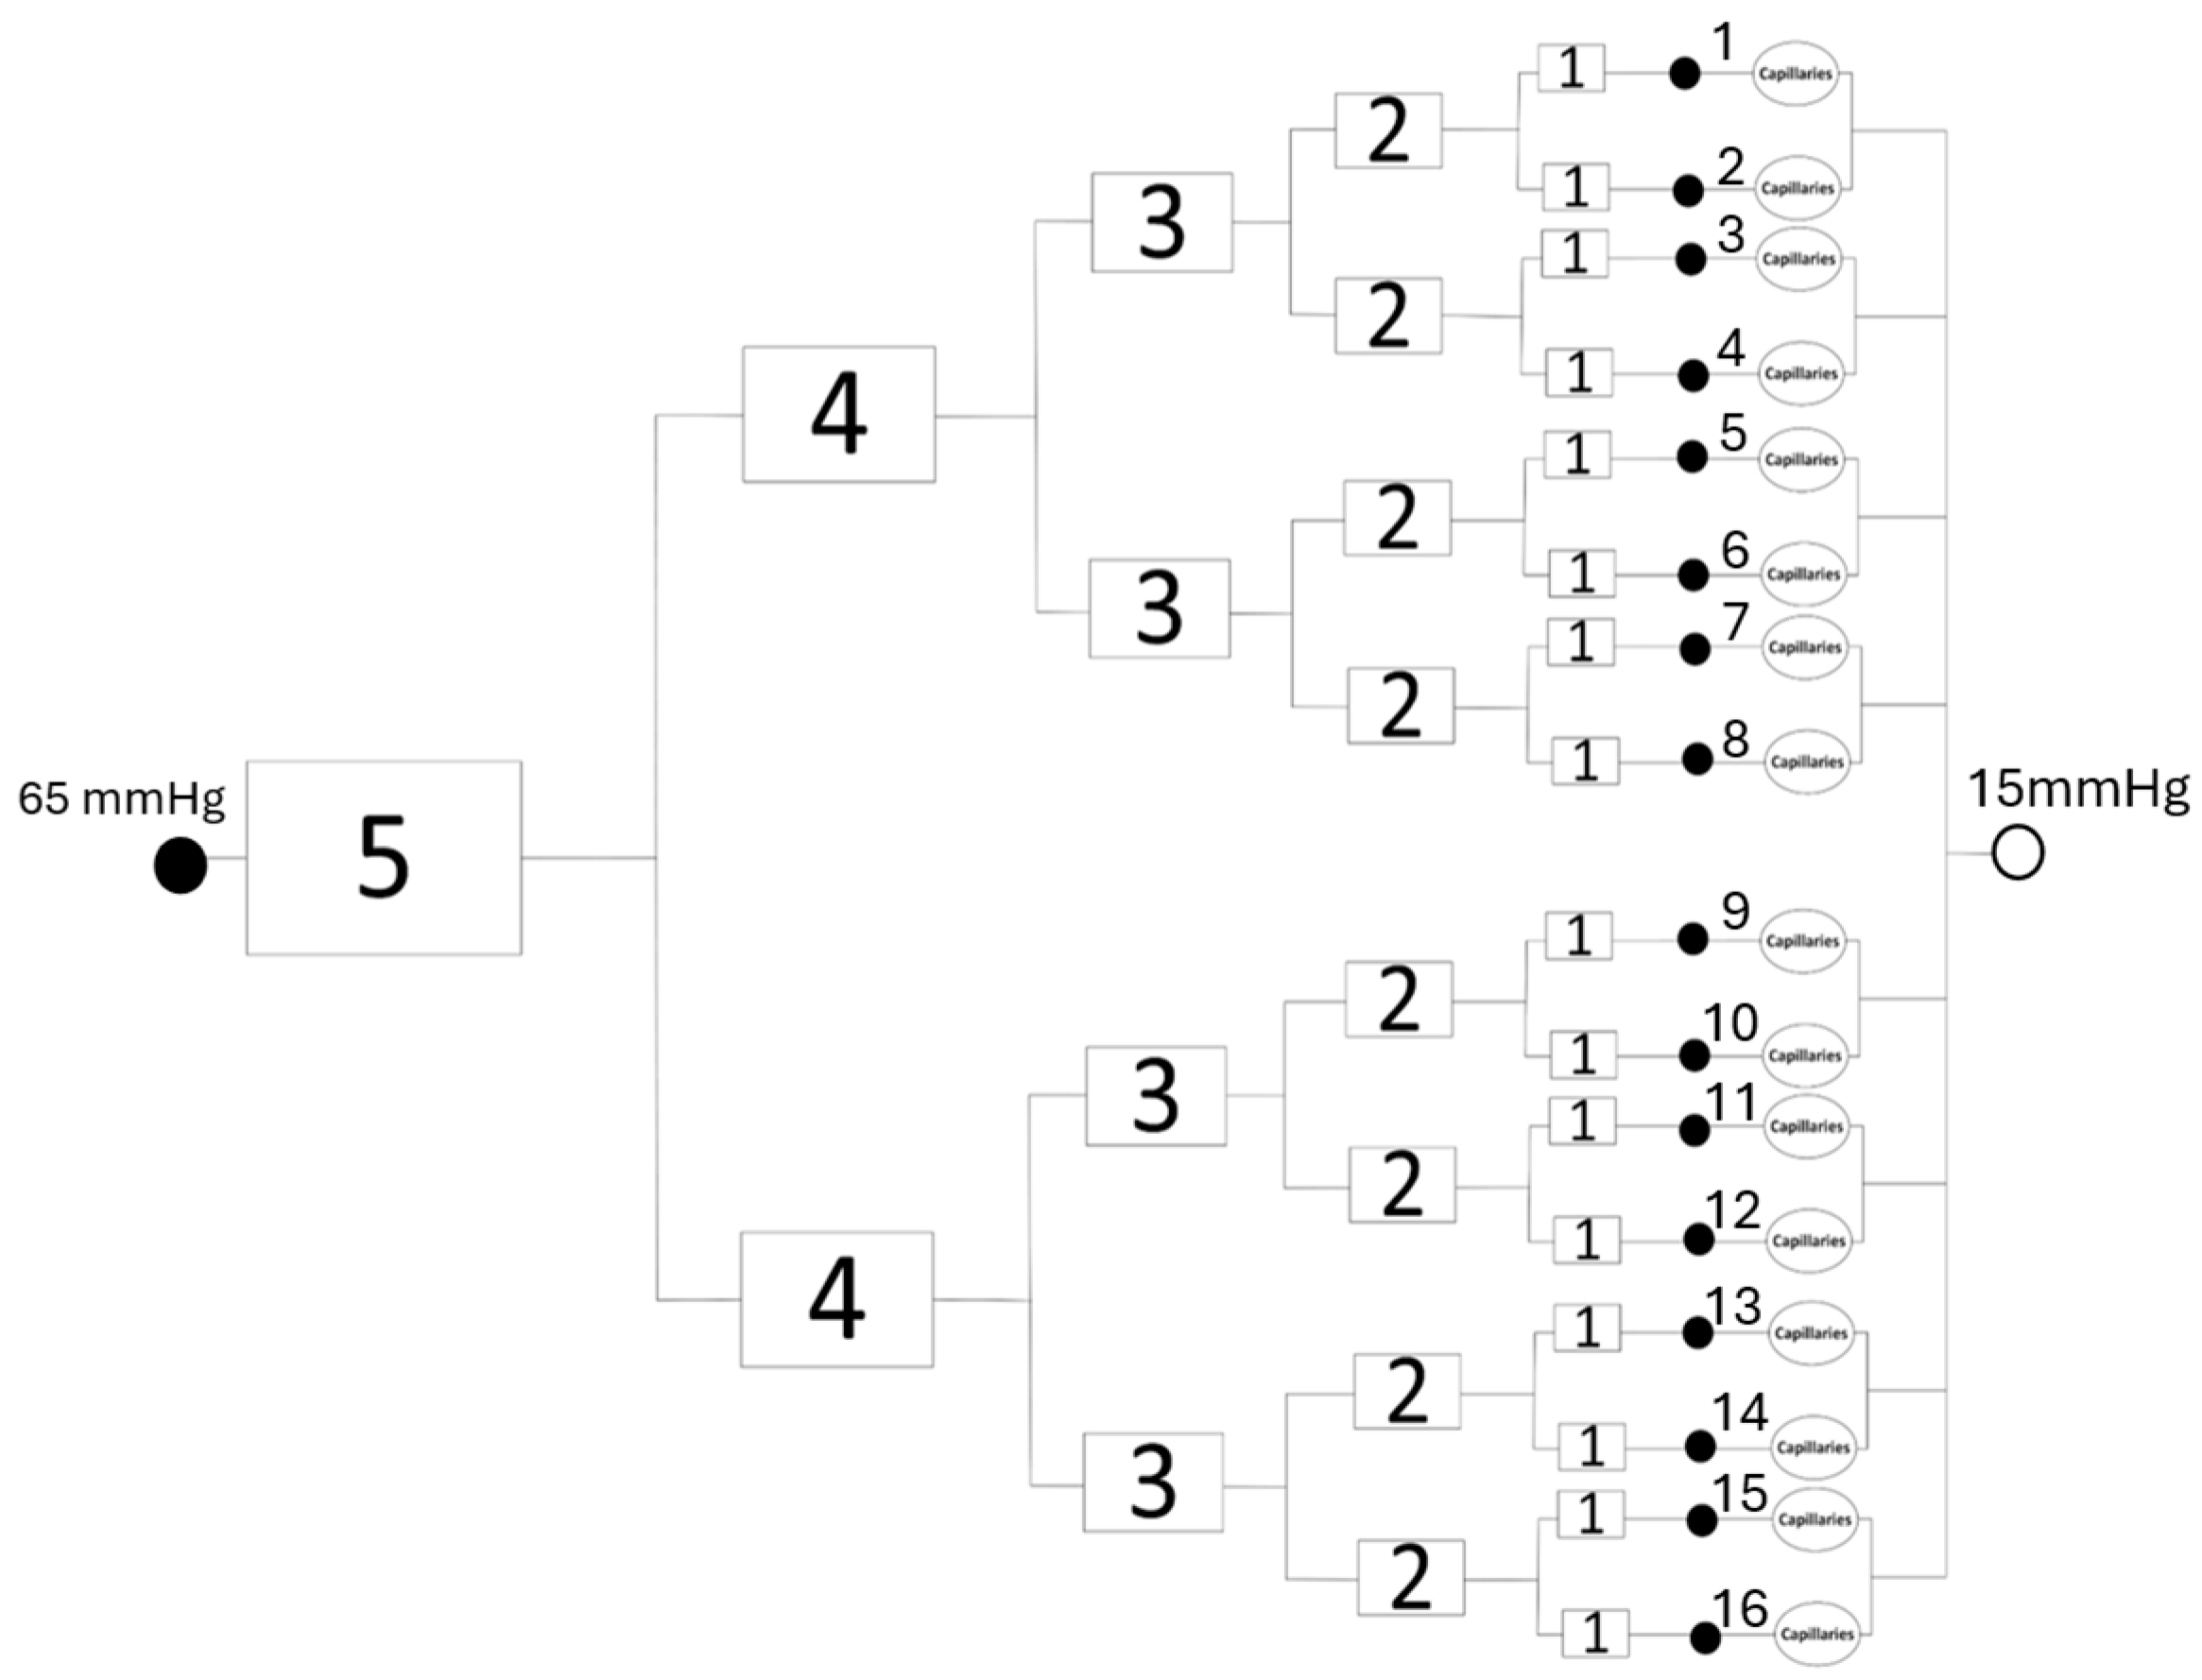
Capillary blood pressure is generally non-uniform because of high flow resistance. Consequently, the mean capillary blood pressure pblood is typically calculated as the average blood pressure value of the pre-capillary arteriole (pa) and the post-capillary venule (pv). Both pa and pv could be influenced by their upstream and downstream blood flow. This study introduces a simplified vascular network comprising the capillaries and the final five generations of pre-capillary arterioles. Based on microvascular measurements reported by Lapi et al. [13], we construct a network in Figure 1 utilizing a binary bifurcation rule, i.e., each arteriole bifurcates into two identical daughter vessels. In this model, generation-5 acts as the upstream parent arteriole, leading to 16 terminal generation-1 arterioles that connect directly to the capillary bed. Because the precise arrangement and quantity of downstream capillaries are unavailable, the capillary bed is represented as a single lumped hydraulic flow resistance. Based on clinical literature, the boundary conditions assume an initial pressure of 65 mmHg at the start of the generation-5 arteriole and a terminal pressure of pv = 15 mmHg at the post-capillary venules.
Figure 1.
A simplified five-generation terminal arteriolar network with the lumped capillary bundle starts with 1 generation-5 arteriole and ends with 16 generation-1 arterioles and 16 capillary bundles. The blood pressure at the inlet of the network is 65 mmHg, and its value at the post-capillary venous side is 15 mmHg.
The variation in blood vessel radius between successive branching generations is described by Murray’s law [14]:
where Rp is the radius of the parent vessel and Rd,1 and Rd,2 are the radii of the daughter vessels. Originally derived from experimental observations, this relationship was subsequently proven to represent the optimal vascular network geometry required to minimize the energy spent on maintaining blood flow and structural integrity. Furthermore, under constant blood viscosity, adherence to Murray’s law ensures a uniform wall shear stress acting on the endothelium throughout the branching network. As illustrated in Figure 1, this study assumes symmetric branching where both daughter vessels share identical radii. Consequently, Equation (1) is utilized to iteratively determine subsequent arteriole sizes, initialized by a generation-5 arteriole radius of 19.8 µm. Following the experimental data from Lapi et al., [13], the lengths of the arterioles within each specific branching generation are also assumed to be uniform.
In this study, the assumption that all arterioles in the network are rigid tubes allows us to calculate the hydraulic resistance of each arteriole using the Hagen–Poiseuille relation [15]:
where is the blood pressure drop across the vessel, is the blood volumetric flow rate, is the effective whole-blood dynamic viscosity used in the vascular network [16], L is the vessel length, and is the vessel radius. Table 1 summarizes the length, radius, the effective whole-blood viscosity, and the flow resistance. The hydraulic flow resistance of a single arteriole in a specific branching generation is given in the last column of Table 1. Generation 0 represents the effective lumped resistance of the capillary bundle downstream of each Generation-1 arteriole (Figure 1). Due to the absence of specific morphological and rheological data, including capillary density, dimensions, local hematocrit, and parallel network topology, this resistance is calibrated against a baseline pre-capillary pressure target of 36.3 mmHg. This value lies within the range of arteriolar and precapillary pressures in the retina used in previous studies, approximately 32–40 mmHg [17,18,19].
Table 1.
Geometric and hydraulic parameters of individual arterioles and the lumped capillary bundle.
2.3. Vasomotion Representation
Accurately modeling vasoconstriction during vasomotion requires characterizing how vessel diameter dictates constriction magnitude. A major challenge arises from experimental limitations; conventional fundus photography and isolated vessel techniques restrict retinal arteriole observation to radii exceeding 50 µm [13,20,21]. Conversely, dynamics for smaller, pre-capillary arterioles (<20 µm in radius) are documented exclusively in skeletal muscle tissue [13].
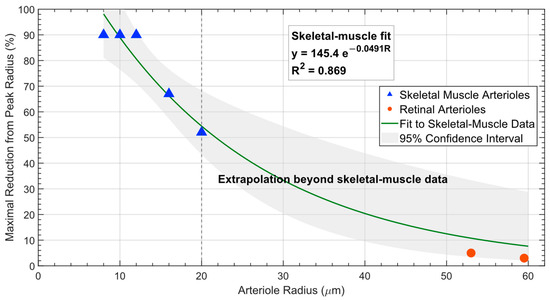
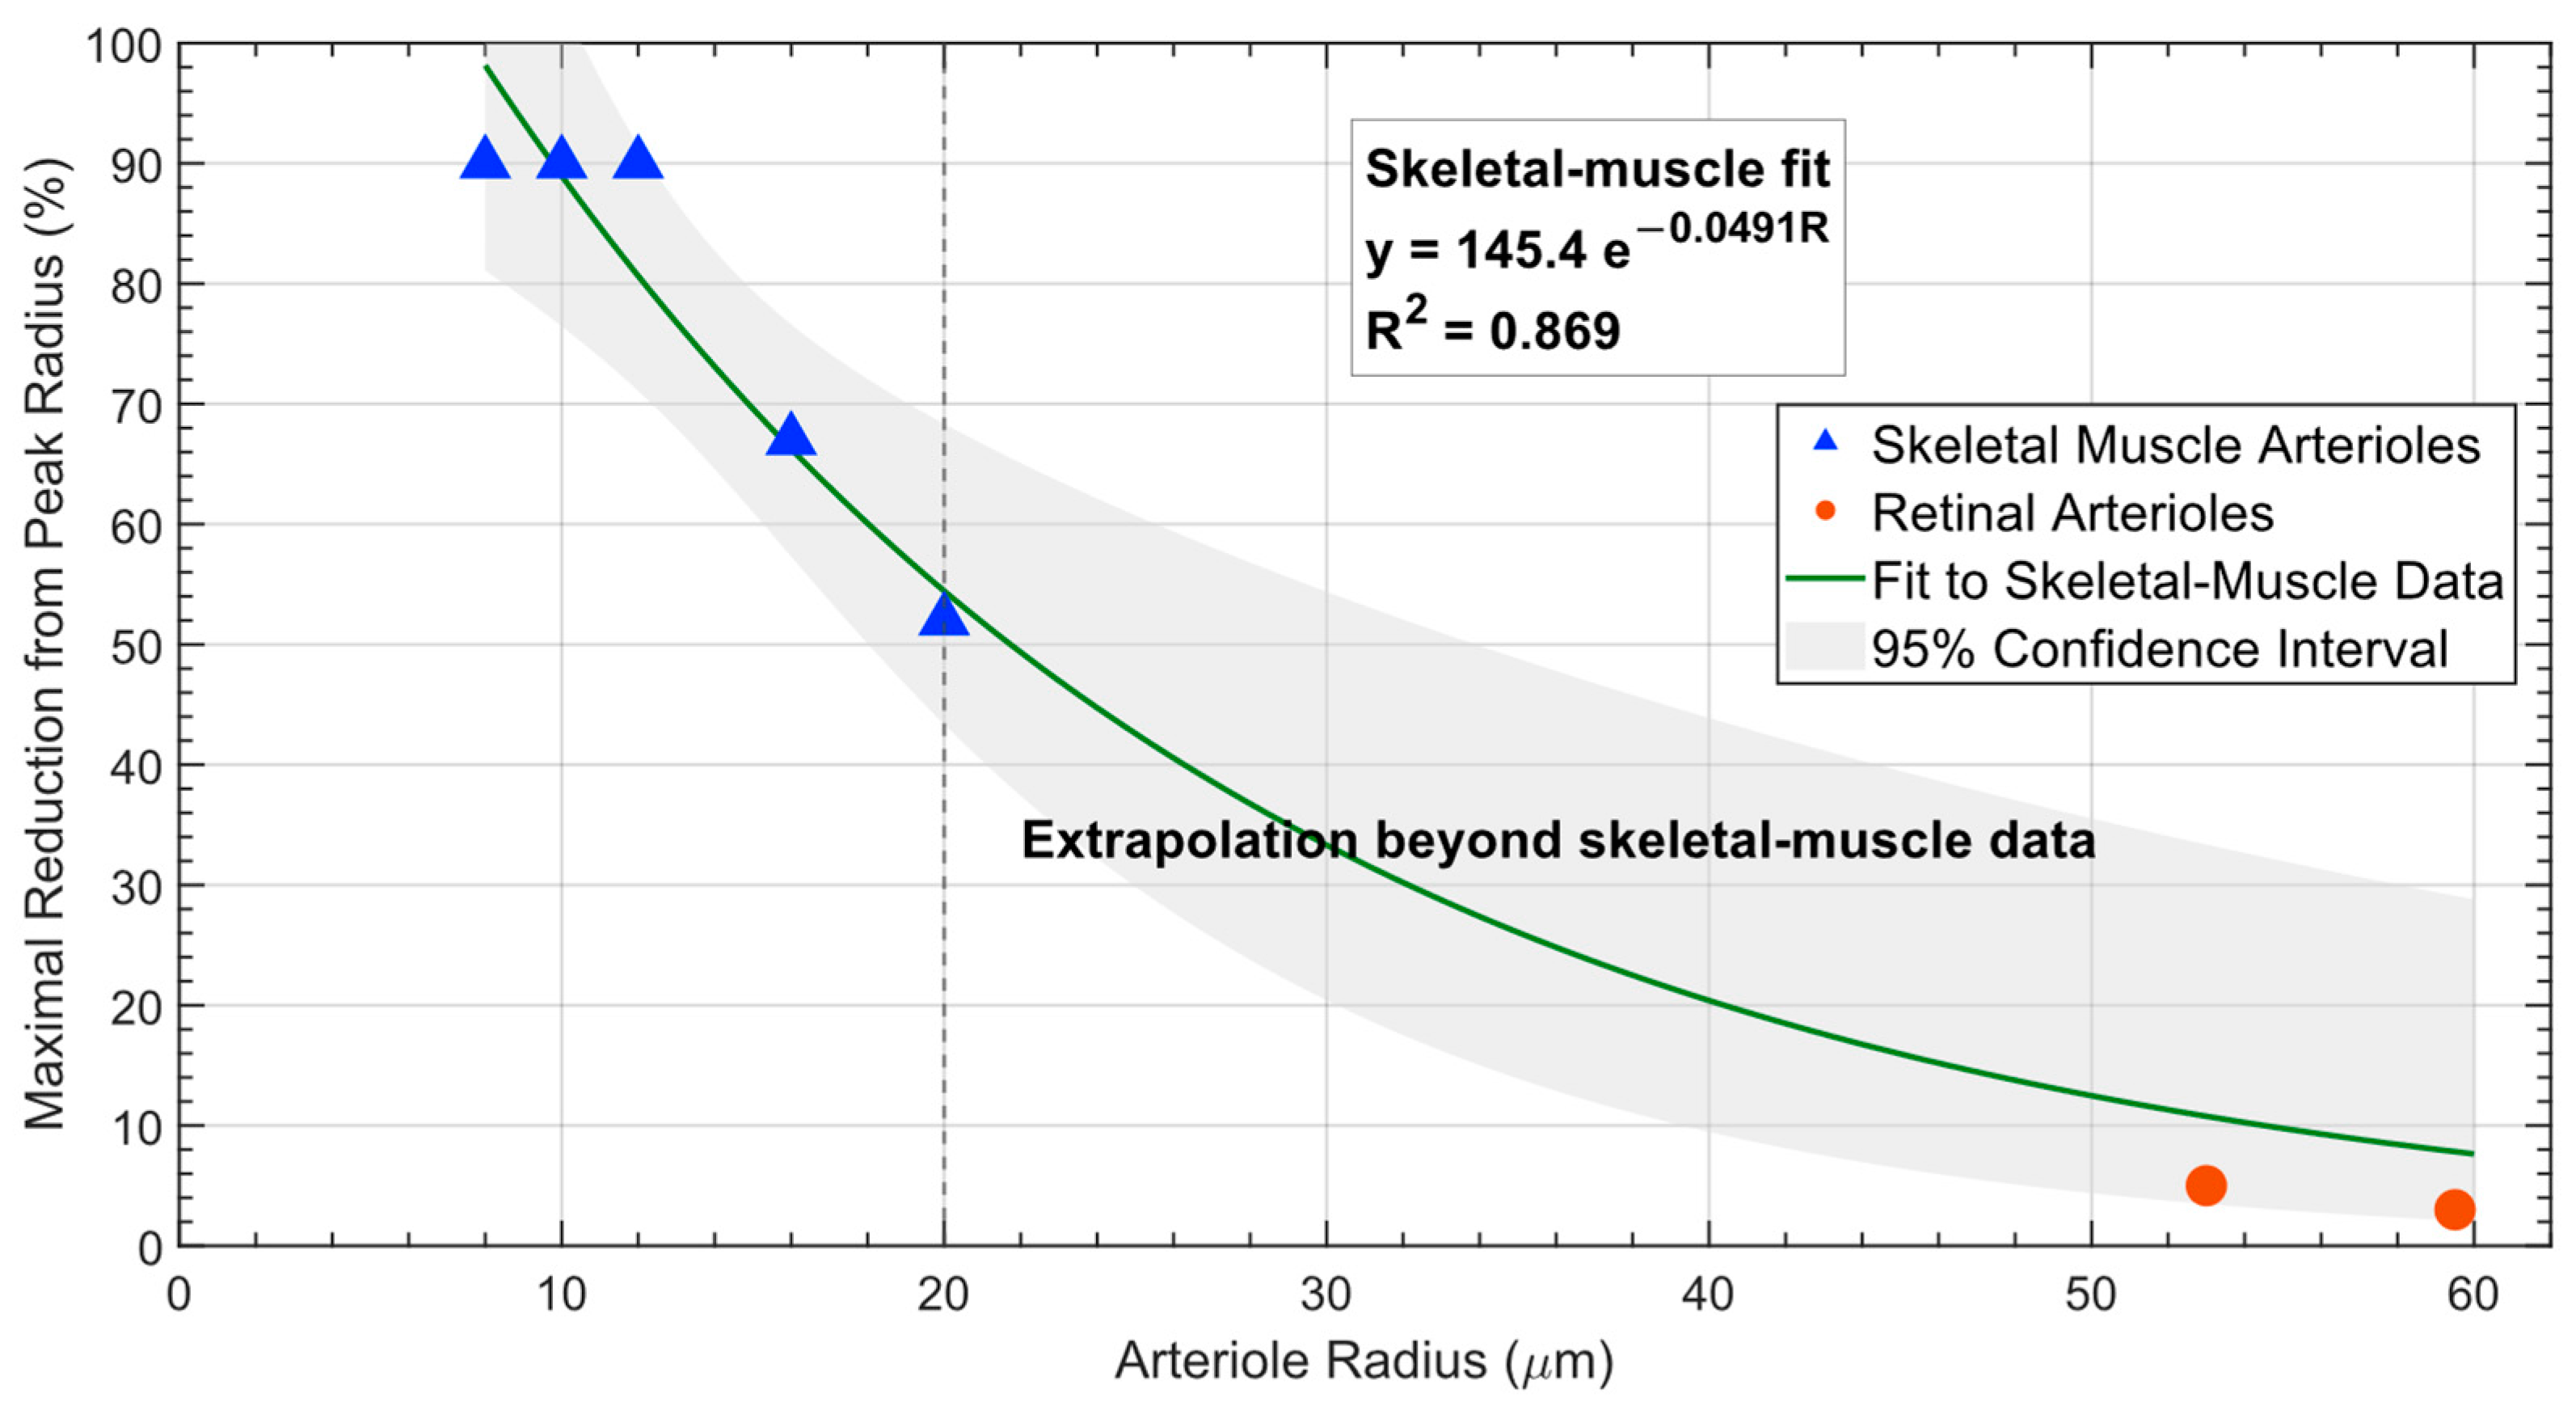
Because direct vasomotion measurements in small retinal precapillary arterioles are unavailable, the size-dependent relationship shown by the curve in Figure 2 is obtained by fitting the available skeletal-muscle arteriole data. Figure 2 also provides the 95% confidence interval of the fitted curve. As shown in Figure 2, the measurements from larger retinal arterioles fall within the 95% confidence interval. This suggests that the measured low-amplitude oscillation in a larger retinal arteriole is qualitatively consistent with the small-vessel portion of the skeletal-muscle relationship. However, the fitted relationship is used here as a skeletal-muscle-based modeling scenario rather than as an experimentally established retinal physiological relationship. The available retinal measurements involve substantially larger arterioles and therefore do not validate the fitted relationship for the terminal retinal arterioles (<20 µm radius) modeled here.
Figure 2.
Maximal reduction in arteriole radius from its peak value during vasomotion. Blue triangles represent skeletal-muscle arteriole data [13], which are used exclusively for curve fitting, with the 95% confidence interval of the fitted curve shown in gray. The red circles represent retinal arteriole measurements from previous experiments [11,20]. The retinal arteriole data are not used for curve fitting.
In the absence of direct measurements of vasomotion from small retinal arterioles, the skeletal-muscle-derived relationship in Figure 2 is assumed to be applicable as one modeling scenario to estimate the magnitude of vasoconstriction in the retinal network. One or more arterioles are decreased in radius to mimic the vasoconstriction phase of vasomotion. Rather than representing vasomotion with a continuous time-dependent vessel-radius function, the present model simplifies each oscillation cycle into two discrete phases: vasodilation and vasoconstriction. The two phases are assumed to occupy equal durations of the cycle (50% each). Experimental studies have demonstrated oscillatory changes in retinal arteriole diameter [11,20]. We assume the 50% and 50% weighting to compare the two limiting phases rather than an experimentally measured retinal vasomotion cycle. In the present model, absent vasomotion is represented by maintaining the vessel radius at the vasodilated value during both phases. This is a simplifying upper-bound assumption used to isolate the effect of removing the vasoconstriction phase and is not intended to imply that diabetic retinal arterioles remain physiologically maximally dilated.
There have been limited experimental studies of vasomotion in the retina to cover the entire range of arterioles. It is not clear how many arterioles exhibit vasomotion simultaneously in the retinal tissue. In theory, occurrences of vasomotion in multiple arterioles would result in oscillations of the overall blood perfusion rate in the tissue region. One previous in vivo experimental study using laser Doppler flowmetry has demonstrated that during vasomotion in healthy human fingers, the minimal local blood perfusion rate in the tissue dropped to approximately 43% of its peak value [8]. In that study, 20 healthy and 20 diabetic patients were recruited for the laser-Doppler measurements. One figure in that paper provided pronounced rhythmic perfusion oscillations that are consistent with strong vasomotion at low frequency in healthy subjects. We manually calculated and averaged the ratios of successive perfusion valleys from their corresponding peaks [8], to obtain the average value of 43%. In this study, we assume that vasomotion in the human retina exhibits similar dynamic behaviors to the human fingers. Using the arterial network, we identify representative vasoconstriction configurations that produce the prescribed reduction in local blood perfusion. A representative configuration allows calculation of pre-capillary blood pressures after the 16 generation-1 branches and evaluation of how vasoconstriction redistributes blood flow across the terminal arteriole network. Conversely, impaired or absent vasomotion maintains the network in a vasodilated state, thereby increasing the average capillary blood pressure and the driving force for transcapillary fluid filtration.
2.4. Fluid Transport Model in the Retina
The human retina contains an extensive vascular network, but it lacks conventional lymphatic drainage vessels. Retinal fluid homeostasis involves multiple transport and clearance mechanisms, including transport across the retinal pigment epithelium, glial and aquaporin-mediated water movement, transvascular exchange, choroidal clearance, vitreoretinal fluid exchange, and proposed glymphatic pathways. In this study, a cylindrical porous tissue unit is modeled to evaluate fluid transport in the retinal tissue. Because the present model does not explicitly resolve these individual mechanisms, fluid leaving a modeled tissue region is represented by an effective retinal fluid-clearance boundary condition rather than being attributed to a specific drainage pathway.
The repeated units of the retinal tissue region are modeled as a representative cylindrical porous domain surrounding the capillary exchange region. The cylindrical tissue domain is defined using a characteristic retinal microvascular spacing of approximately 68 µm reported in previous imaging studies [21] and is intended as a representative computational tissue unit rather than a distinct anatomical glymphatic unit. Retinal thickness varies with anatomical location; the value of 500 µm in height is selected as an approximate upper retinal thickness reported in anatomical descriptions in a previous study [22]. Because the present formulation models fluid transport only in the radial direction, the cylinder height does not affect the calculated pressure and velocity distributions.
The interstitial fluid is approximated as a water-like, Newtonian, and incompressible fluid with a dynamic viscosity of 0.001 Pa·s, consistent with values used in previous porous biological-tissue transport models [23,24]. The porous retinal tissue is assumed to be homogeneous and isotropic with respect to interstitial fluid transport. This simplification permits a one-dimensional radial formulation in the absence of layer-specific retinal hydraulic properties. The transcapillary source term is distributed uniformly throughout the modeled tissue domain; therefore, the present model does not separately resolve the vascularized inner retina, avascular outer retina, or individual superficial, intermediate, and deep capillary plexuses.
In this study, the Reynolds number is estimated using the characteristic interstitial velocity, tissue length scale, interstitial fluid density, and dynamic viscosity, and it remains below for all simulated conditions. This very small value confirms that inertial effects are negligible and that the interstitial fluid operates in the creeping-flow regime. Accordingly, the present study treats the coupling between the vascular and tissue-fluid models using a quasi-steady approximation, in which the vasodilation and vasoconstriction phases are solved separately as steady-state conditions. Further, transcapillary fluid flow is modeled as a distributed fluid source within the porous tissue, while fluid removal is represented by the net outward flow rate across the outer surface of the tissue cylinder as an effective retinal fluid-clearance condition.
Interstitial fluid transport through the retinal tissue is modeled using Darcy’s law. The Darcy velocity u is related to the gradient of the interstitial fluid pressure p as
where Κ is the intrinsic permeability of the porous tissue, which is related to the flow resistance in the porous medium. In Darcy’s law, the Darcy velocity may be written as , where Vf is the interstitial fluid velocity, and ε is the porosity of the porous tissue.
The continuity equation for fluid transport in the porous retinal tissue is written as
where is the volumetric fluid source term due to transcapillary filtration. Substituting Darcy’s law into the continuity equation gives
Transcapillary fluid filtration is represented using Starling’s law,
where is the hydraulic conductivity of the capillary membrane, S/V is the capillary surface area per unit tissue volume, is the average capillary blood pressure, is the reflection coefficient for proteins, and and are the capillary and interstitial oncotic pressures, respectively. Equation (6) provides a simplified phenomenological representation of transcapillary filtration across the retinal capillaries. The capillary and interstitial oncotic pressures are assumed to remain spatially uniform and constant, while capillary-wall properties are represented by the hydraulic conductivity Lp and reflection coefficient σ. The formulation does not resolve localized blood–retinal barrier disruption, protein accumulation, microaneurysm-associated leakage, or spatial variations in capillary permeability.
The average capillary blood pressure is then estimated using the pre-capillary arteriole blood pressure and the fixed post-capillary venule blood pressure,
In this study, is fixed at 15 mmHg, and pa is determined by the arteriole network described in Section 2.2.
Two boundary conditions are needed to solve for the field of the interstitial fluid pressure. At the centerline of the cylindrical tissue domain, a symmetry boundary condition is applied as
which indicates that there is no radial pressure gradient at the axis of symmetry. At the outer tissue boundary, the interstitial pressure is prescribed as p0,
Once the interstitial fluid pressure and Darcy velocity fields are calculated, the total volumetric flow rate of the fluid at the outer surface of the cylinder is determined from the integration of the Darcy velocity on the cylinder surface.
where is the Darcy velocity and is the outward normal unit vector.
The retinal interstitial fluid-transport simulations were performed in COMSOL Multiphysics® (v. 6.2, COMSOL AB, Stockholm, Sweden) using the Darcy’s Law physics interface with an axisymmetric porous-medium formulation. Separate stationary solutions were obtained for the vasodilation and vasoconstriction conditions using a fully coupled solver with a direct linear solver and a relative convergence tolerance of . The mesh sensitivity analysis is conducted to ensure that the simulation results converge with the refined mesh grid. As shown in Table 2, the maximal value of the simulated pressure field changes slightly as the mesh is refined and becomes nearly constant at the finest mesh level. The relative difference between the setting of Finer Meshes and the setting of Extra Fine Meshes is 0.01%. indicating that additional refinement does not affect the predicted pressure. Therefore, the Extra Fine mesh setting is used for the final simulations in this study.
Table 2.
Mesh independent analysis.
3. Results
3.1. Hemodynamic Effects of the Retinal Arteriole Network with or Without Vasomotion
We assume that blood pressure decreases from 65 mmHg at the beginning of generation 5 of the arterioles to 15 mmHg at the post-capillary venules (Figure 1).
Table 3 illustrates geometric data, blood flow resistances, and blood flow rates in successive vessel generations. With all the arterioles in the full vasodilation state, Table 3 shows how the blood pressure starts at 65 mmHg in the generation-5 arteriole, decreases to 36.3 mmHg at the end of the pre-capillary arterioles, and finally reaches 15 mmHg at the post-capillary venous side. One can see a decrease of 50% in the blood flow rate in the daughter arterioles from their parent arteriole. The total blood flow rate in the entire arteriole network, i.e., that in the generation-5 arteriole, is found to be m3/s. With pv at 15 mmHg, the average blood pressure in the capillary can be calculated as pblood = 25.65 mmHg.
Table 3.
Hemodynamic parameters and blood pressure distribution across the retinal arteriolar network when all the arterioles in the network are in the vasodilation state.
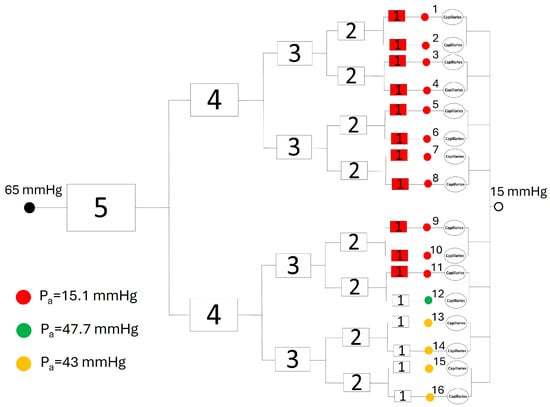
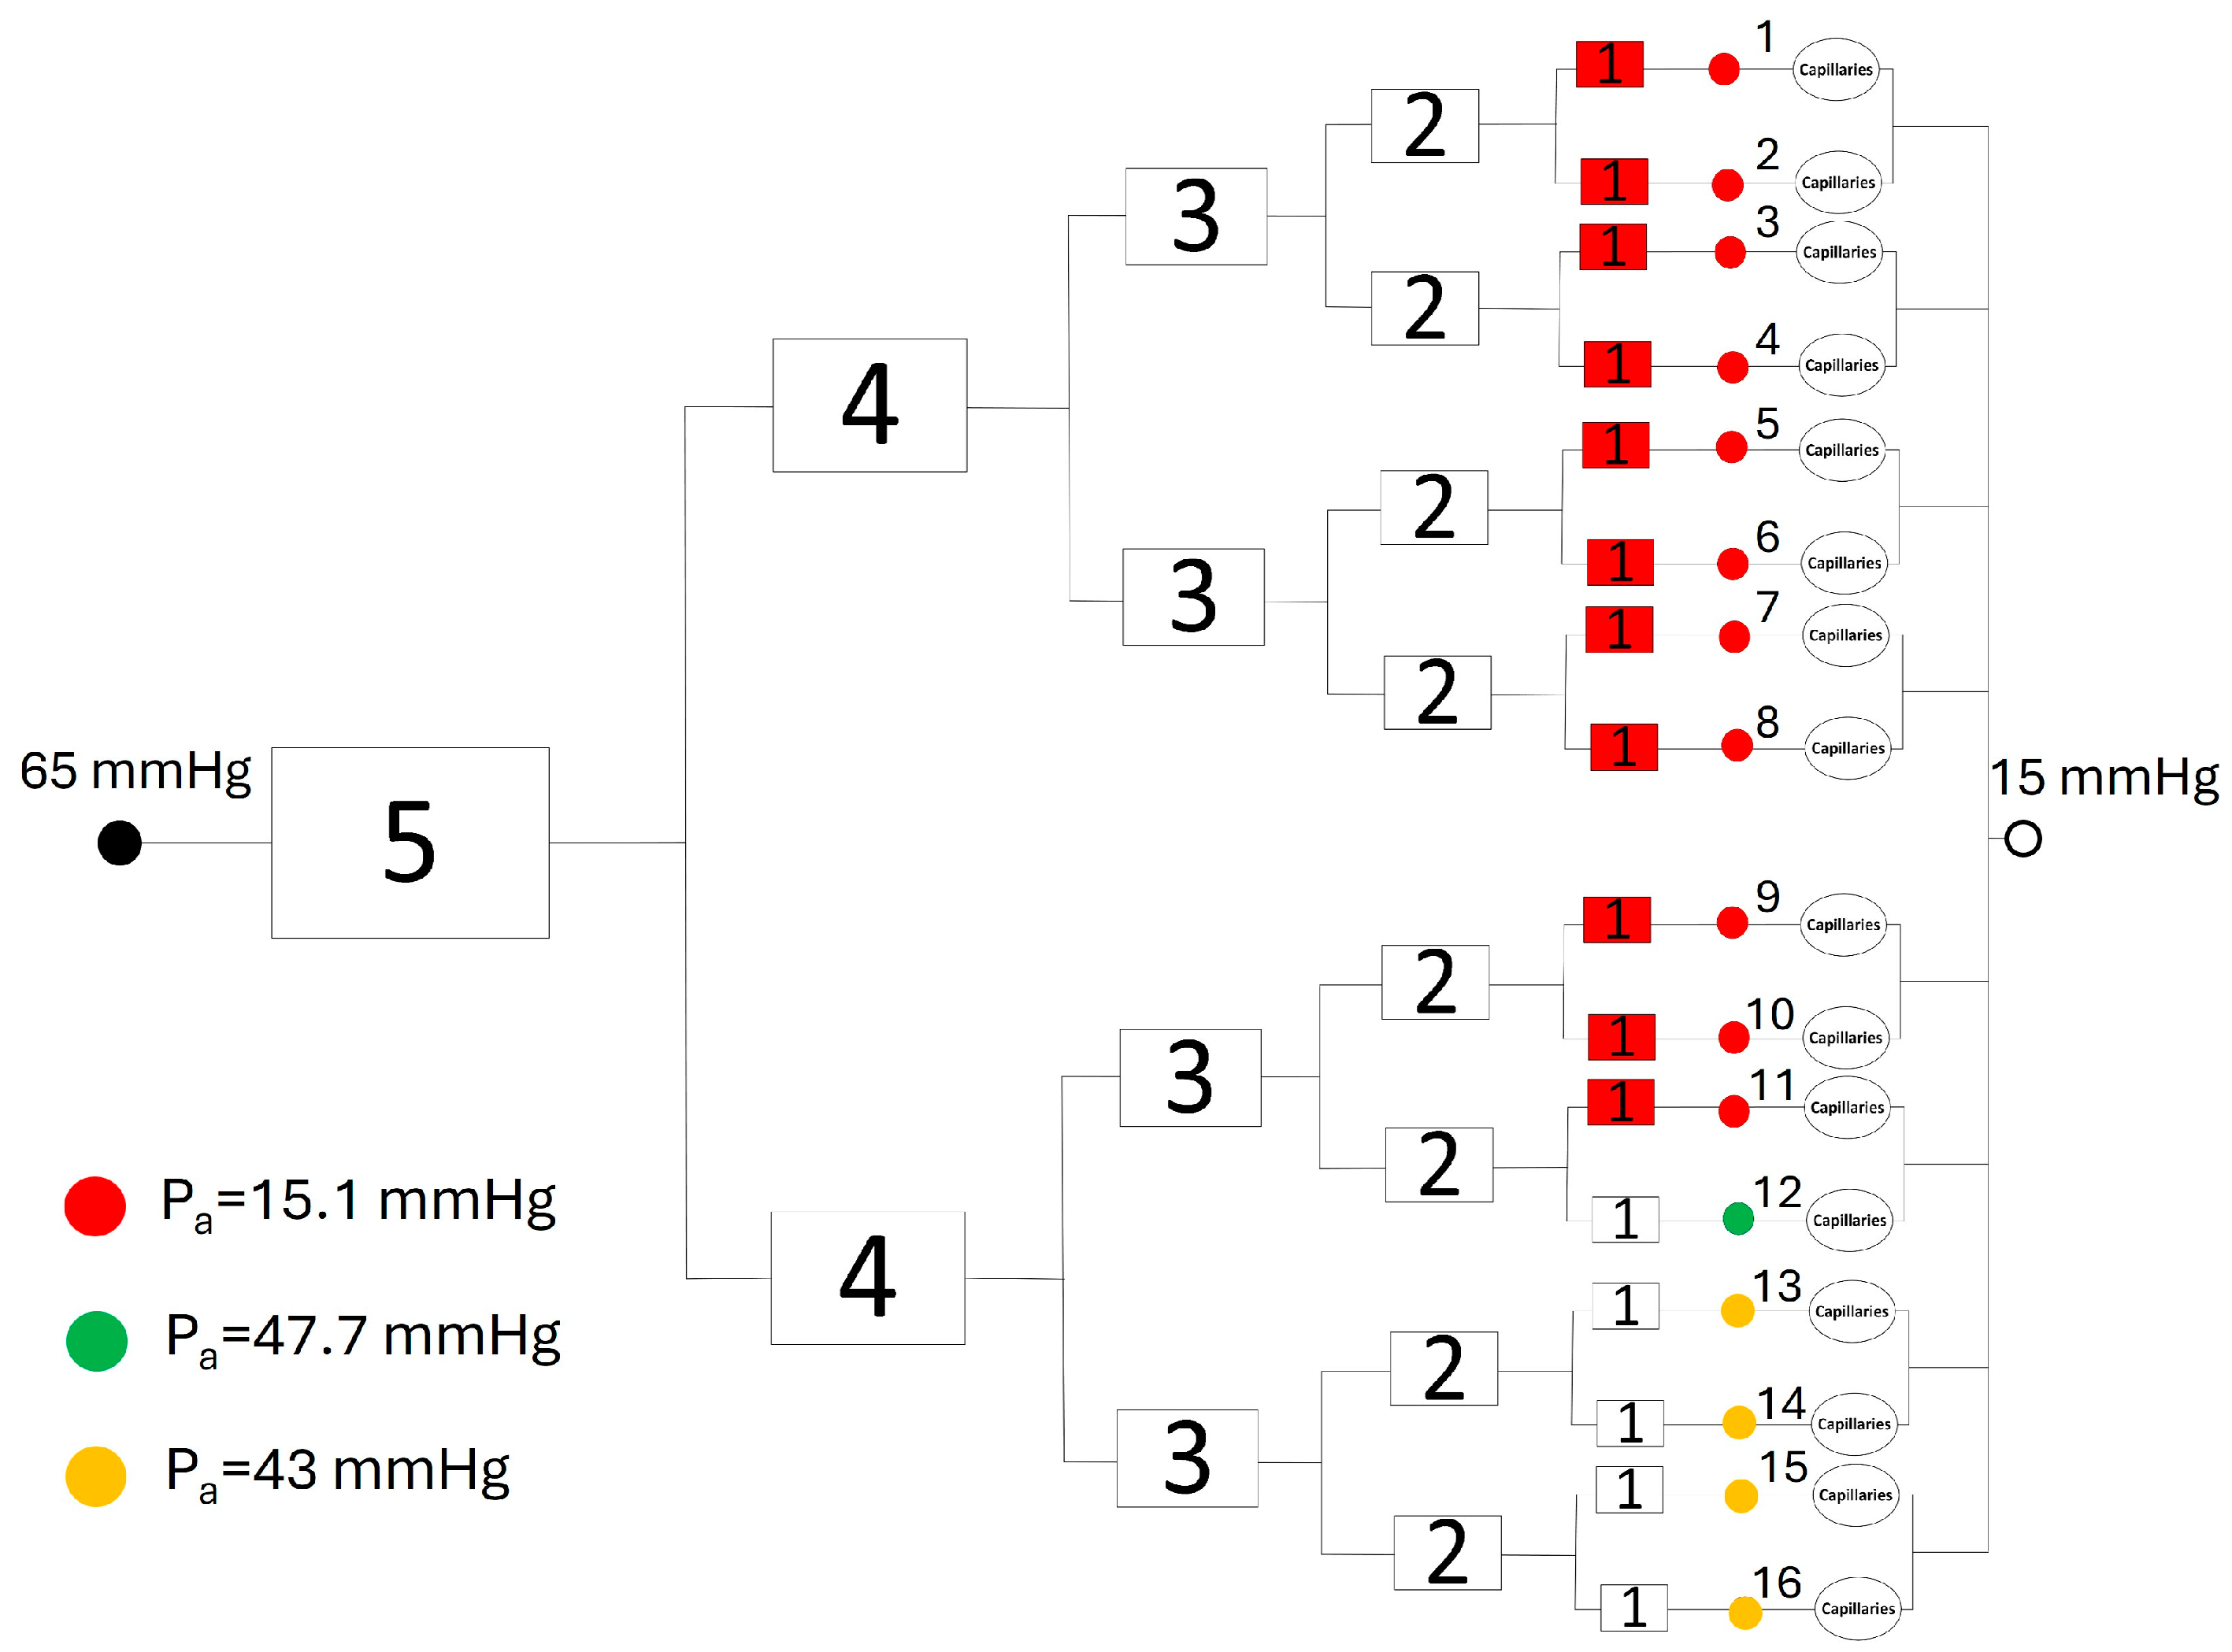
Due to the scarcity of empirical data on retinal vasomotion, we model a representative vasoconstriction scenario using a 43% low-perfusion target, adapted from reported human finger microcirculation measurements [8]. Given the absence of direct retinal measurements, this target serves as a baseline computational parameter rather than a retina-specific physiological response. In this modeled state, only 11 of the 16 generation-1 arterioles are constricted, with their radii decreasing from 7.9 µm (vasodilation) to 0.87 µm (vasoconstriction), as illustrated in Figure 3. Driven by this elevated terminal arteriolar resistance, the total blood flow rate in the network decreases to , approximately 43% of the fully dilated baseline value. Consequently, this configuration serves as a representative low-perfusion state to explore the hemodynamic impacts of vasomotion, rather than a definitive profile of retinal vasoconstriction.
Figure 3.
Representative low-perfusion state of the network configuration, in which 11 of the 16 Generation-1 arterioles are constricted. The numbers from 1 to 16 shown in the figure represent the individual branches in generation-1 arterioles. The solid circles indicate the locations of pre-capillary blood pressures. Representative pre-capillary blood pressures at the end of the generation-1 arterioles are given in the figure. This vasoconstrictive configuration was selected to reproduce the prescribed 43% low-perfusion target.
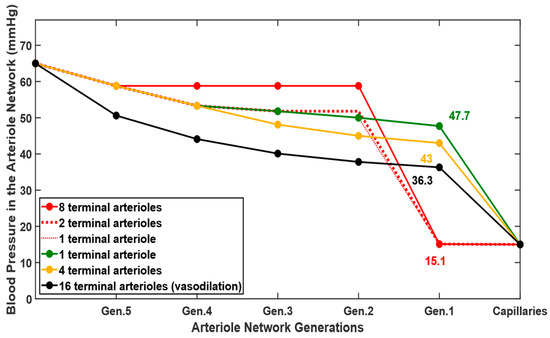
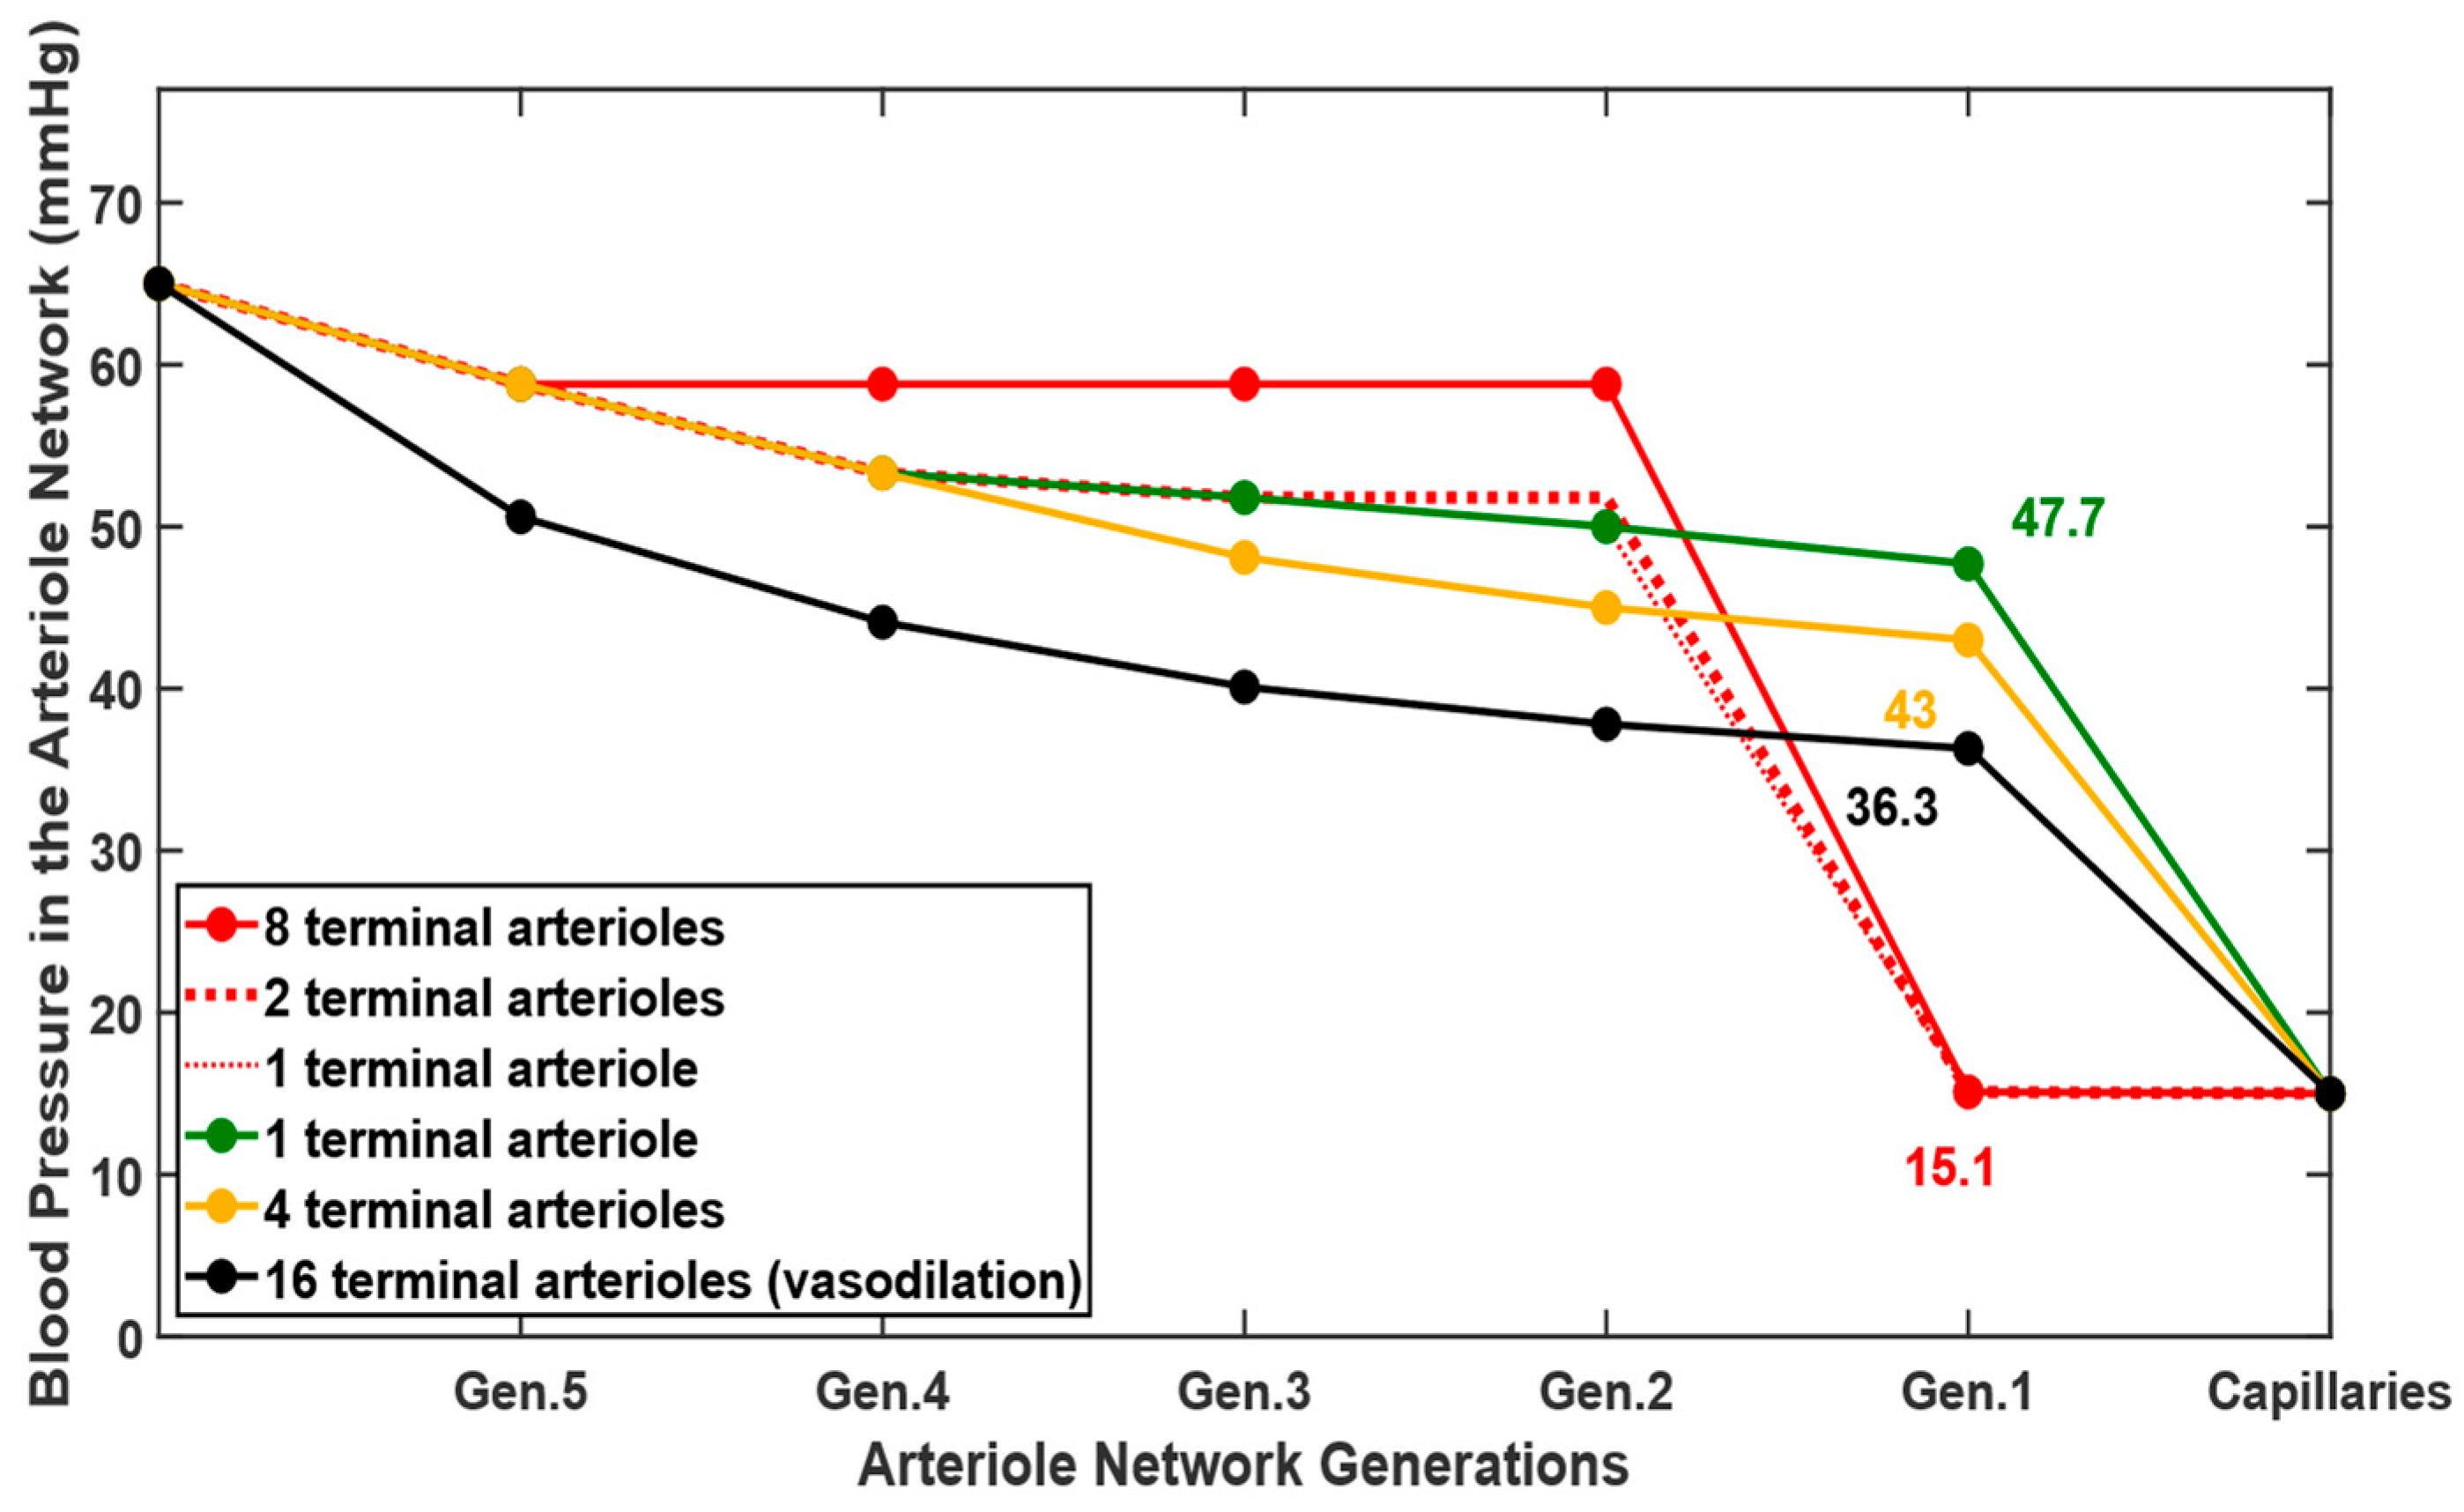
When all the arterioles in the network are in the vasodilation state (Figure 1), the blood pressure drops across branches of the same generation remain uniform. As shown by the solid black curve in Figure 4, the blood pressure distributes evenly from the generation-5 arteriole to the capillary bundle, yielding the pre-capillary arteriole pressure of 36.3 mmHg. However, the introduction of vasoconstriction in 11 of the 16 generation-1 arterioles disrupts this uniformity within the terminal branches. The red curves in Figure 4 highlight this shift, revealing minimal pressure drops in upstream arterioles contrasted with severe blood pressure drops along the constricted segments. Consequently, these constricted branches experience a sharp decline in pre-capillary pressure down to 15.1 mmHg, only slightly higher than the post-capillary venule pressure of 15 mmHg. Illustrated by the green and orange lines in Figure 4, the non-constricted branches maintain higher pressures by redirecting flow through lower-resistance pathways. The pre-capillary blood pressures in the unconstricted arteriole branches rise, ranging between 43 mmHg and 47.7 mmHg. These dynamics demonstrate how localized vasoconstriction tightly regulates both total tissue perfusion and the pressure transmitted to downstream capillary beds. The branch pressures were spatially averaged by assuming that each generation-1 arteriole supplies an equivalent downstream tissue region; this weighting represents a tissue coverage rather than blood flow. Under this assumption, the representative average pre-capillary blood pressure pa is calculated as 24.11 mmHg. Under these conditions, and with pv set at 15 mmHg, the average capillary pressure pblood drops to 19.56 mmHg. The network configuration in Figure 3 represents an idealized low-perfusion scenario used to investigate the potential hemodynamic effect of vasoconstriction in the retinal microvasculature.
Figure 4.
Pressure distributions across the arteriole network during vasodilation and the representative vasoconstriction condition. The black curve represents the fully vasodilated arteriole network, while the remaining curves show pressure drops through constricted and non-constricted terminal pathways in the network.
Under the assumed equal-duration two-phase representation, the cycle-averaged capillary blood pressure is approximately mmHg. In contrast, the modeled non-vasomotion condition maintains an average capillary blood pressure of 25.65 mmHg, approximately 14% higher than the cycle-averaged vasomotion value. This increase suggests a larger hydrostatic driving force for transcapillary filtration in diabetic retinopathy.
3.2. COMSOL Simulation of Interstitial Fluid Pressure and Fluid Removal
Fluid transport simulation in the porous tissue region is carried out in COMSOL Multiphysics. The material properties and transport parameters used in the simulation are obtained from the literature and are summarized in Table 4. Note that some properties are retina-related, while some others are obtained from other tissues due to a lack of available experimental data. The reflection coefficient σ and hydraulic conductivity Lp are assigned variable ranges to account for structural capillary membrane degradation during diabetic retinopathy progression.
Table 4.
Parameters and properties used in the retinal fluid transport simulations.
3.2.1. Baseline Model
Our first task is to evaluate how the capillary blood pressure alone affects the interstitial fluid pressure distribution in the retina. The capillary blood pressure obtained from the arteriolar network model is applied here, based on Starling transcapillary filtration. In the vasodilated state, the average capillary blood pressure (pblood) is 25.65 mmHg. For the healthy retina, the interstitial pressure at the outer tissue boundary is assumed to be close to 0 mmHg [2]. Therefore, the initial simulations are performed with p0 = 0 mmHg to represent normal fluid drainage at the tissue boundary. In this baseline model, we also assumed the intact capillary membrane (Lp = 1.97 × 10⁻¹¹ m/Pa·s and σ = 0.95).
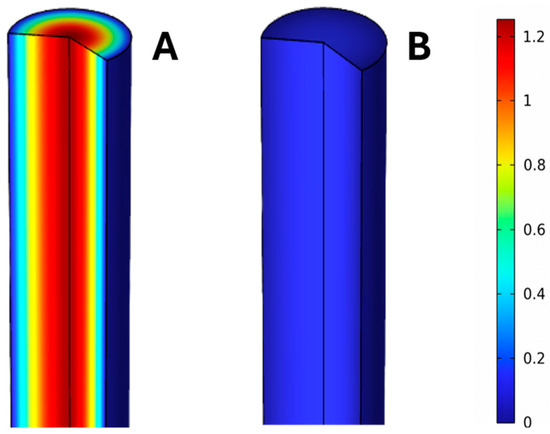
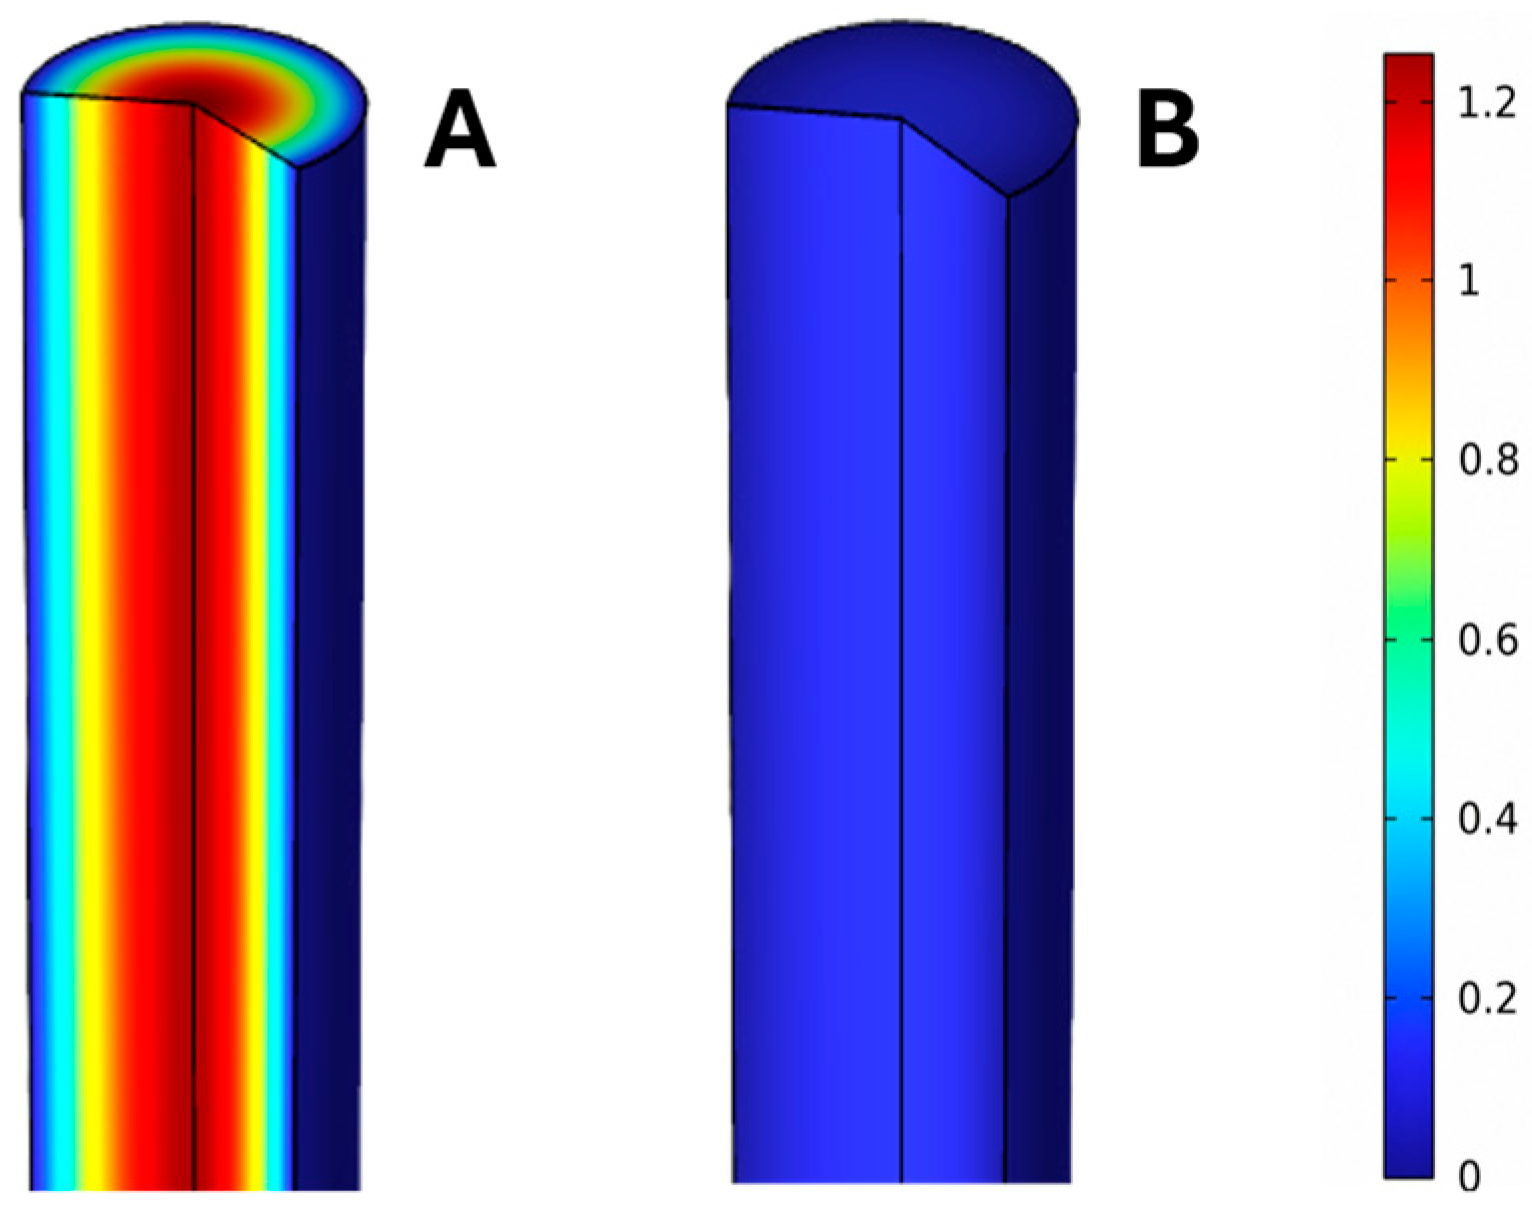
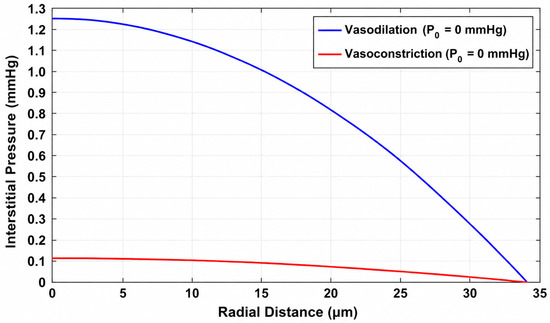
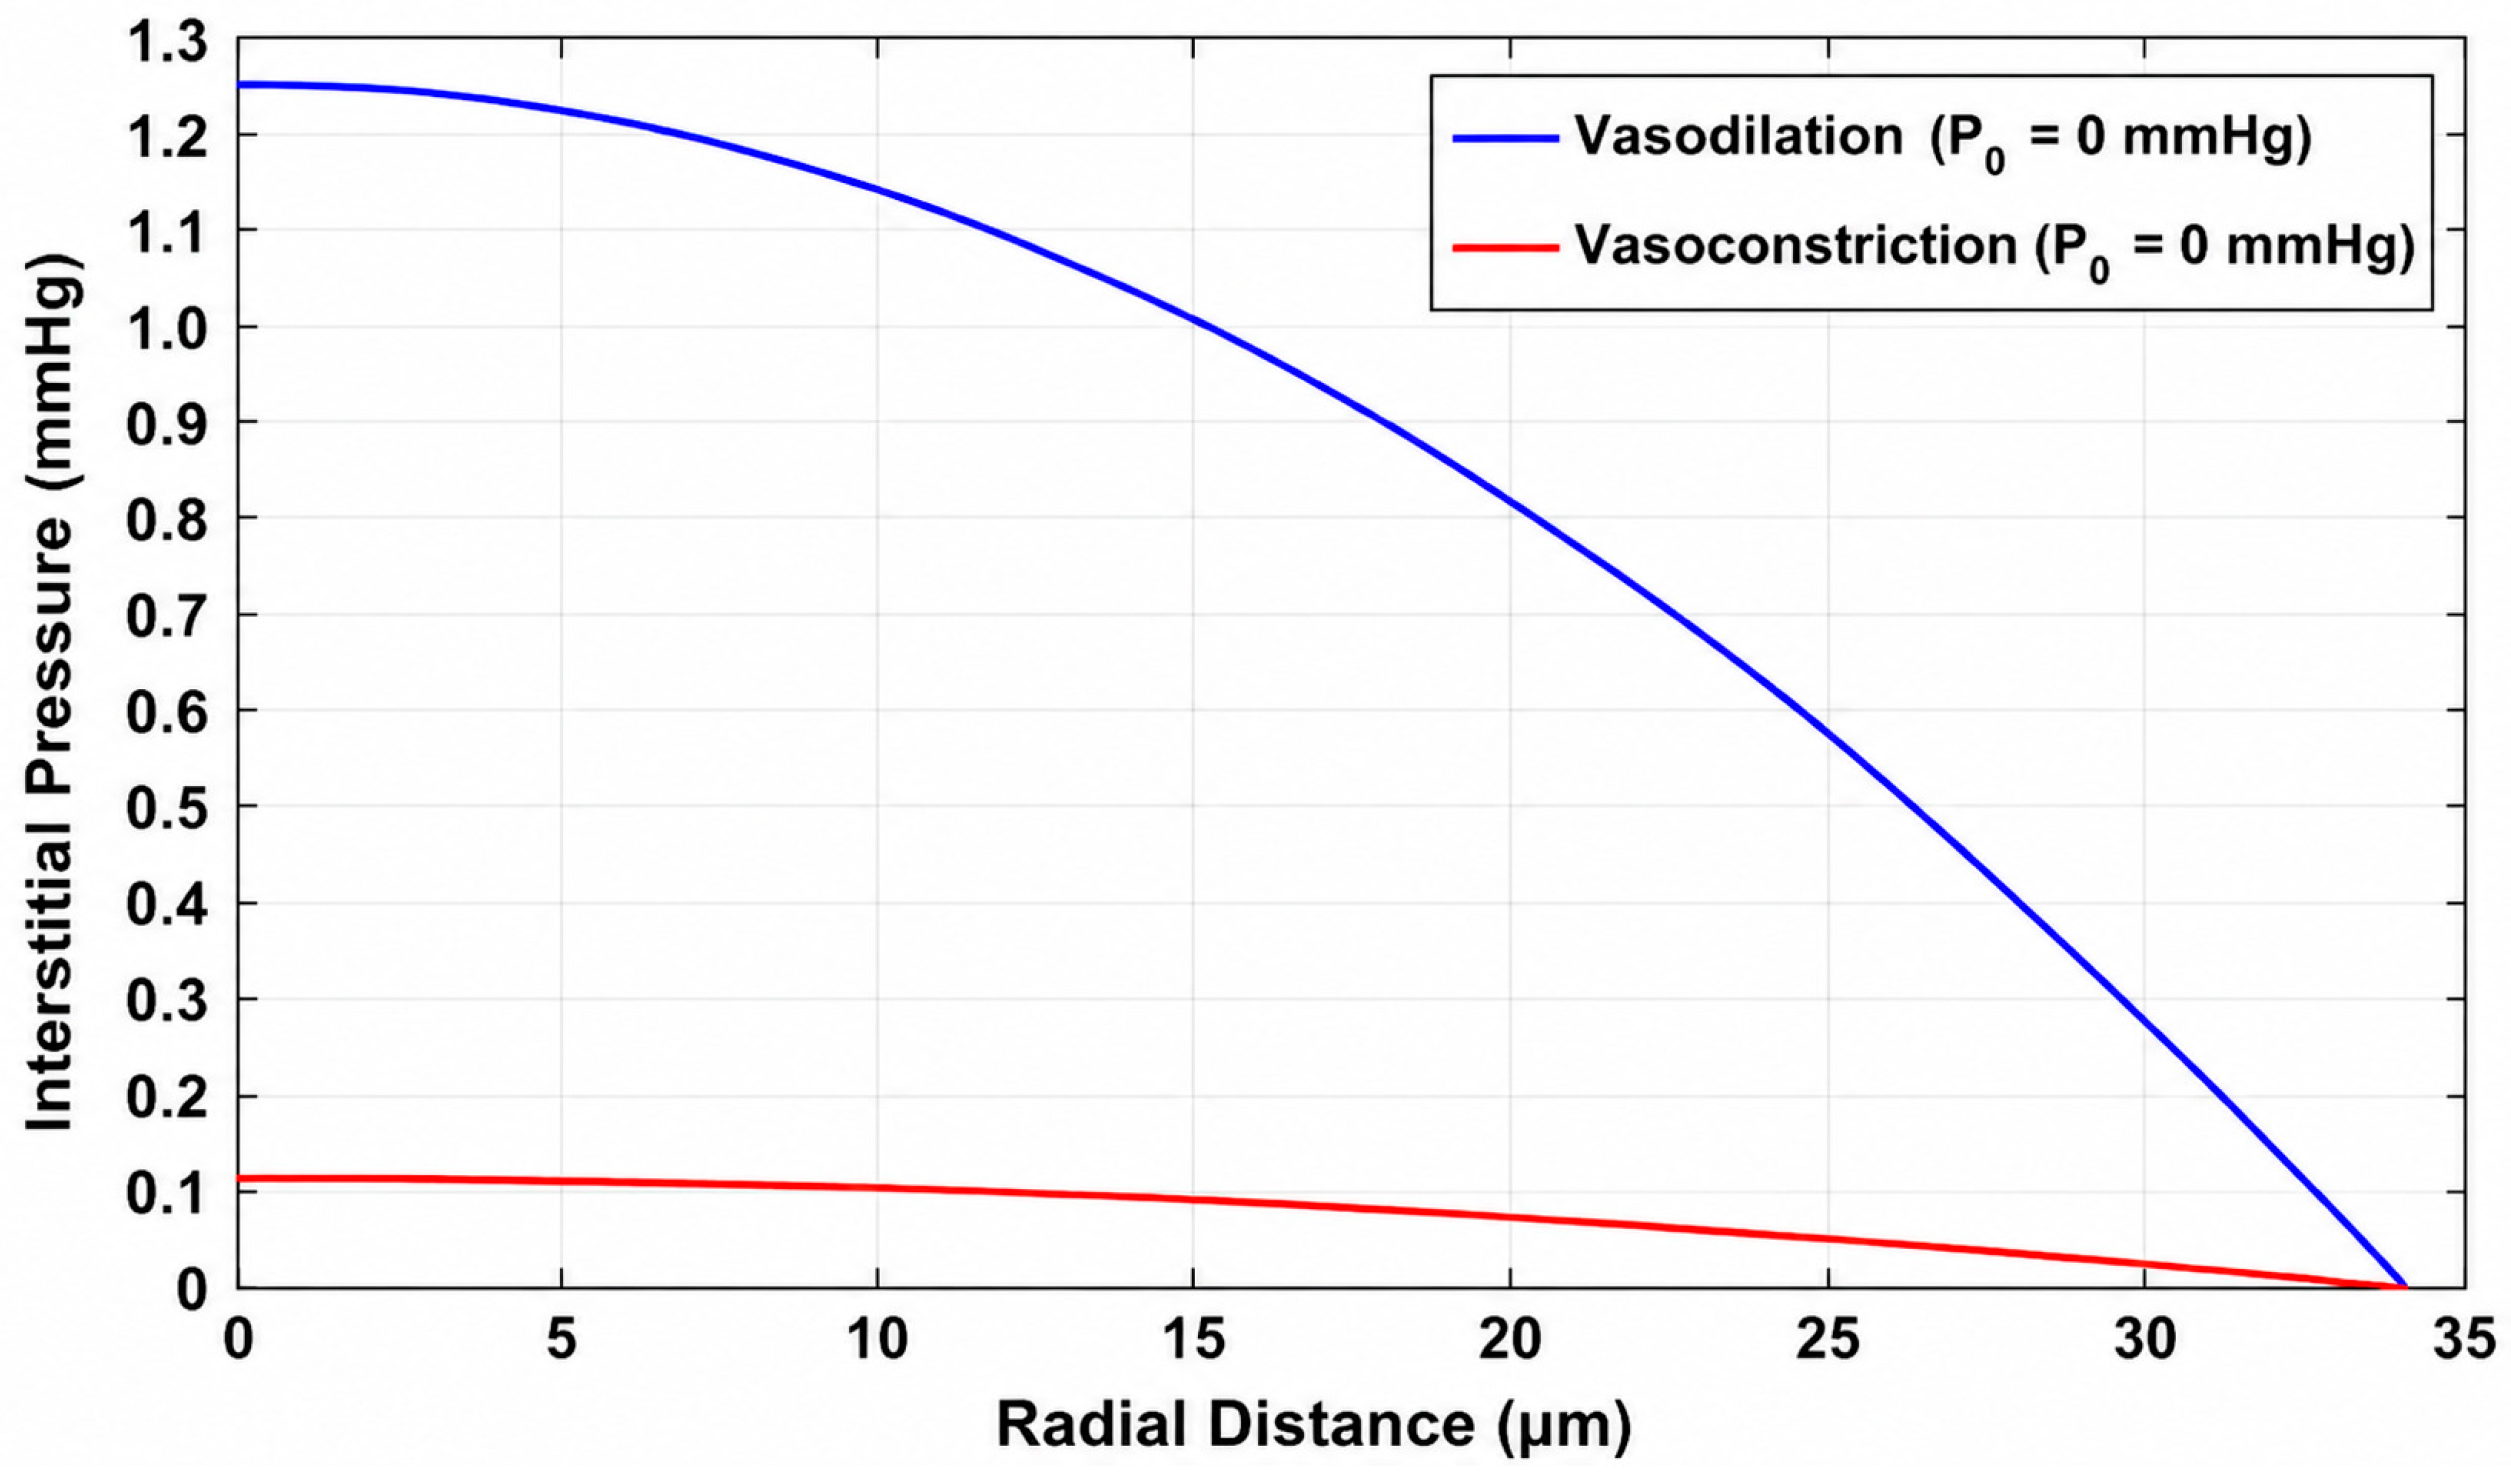
Under this condition, the simulated interstitial pressure decreases radially from approximately 1.26 mmHg at the center of the cylindrical tissue domain to 0 mmHg at the outer boundary, as shown in Figure 5 and Figure 6. This corresponding fluid removal rate through the outer tissue boundary is 2.225 × 10⁻¹⁴ m3/s. This value represents the filtered volume that the retinal fluid-clearance pathway must remove during vasodilation.
Figure 5.
Contours of the interstitial pressure distribution in the retinal tissue when all the blood vessels in the network are in the vasodilation state (A) or some of the arterioles are in the vasoconstriction state (B). The prescribed interstitial pressure at the cylinder surface is 0 mmHg.
Figure 6.
Interstitial fluid pressure distribution in the radial direction of the tissue cylinder.
When specific terminal arterioles undergo vasoconstriction, the average capillary blood pressure falls to pblood = 19.56 mmHg. As a result, the hydrostatic driving force for transcapillary filtration is reduced. The interstitial pressure distribution becomes nearly uniform (Figure 5 and Figure 6), peaking at just 0.12 mmHg at the center before reaching 0 mmHg at the tissue boundary. The calculated boundary fluid flow rate drops significantly to 2.058 × 10⁻¹⁵ m3/s, which is less than 10% of the value obtained in the vasodilated state.
Under the assumed equal-duration vasomotion cycle, the cycle-averaged fluid-removal rate is calculated by assigning equal weight to the vasodilation and vasoconstriction phases. As shown in Table 5, this gives an average fluid-removal rate of m3/s. Conversely, a lack of arteriole vasomotion, characterized by two static vasodilation phases, demands a removal rate of 2.225 × 10⁻¹⁴ m3/s. Consequently, in diabetic retinopathy patients who lack retinal vasomotion, the effective retinal fluid-clearance pathway must accommodate an approximately 83% greater fluid burden to maintain a steady state and keep interstitial pressure at its baseline of 0 mmHg.
Table 5.
Fluid removal rate at the tissue cylinder surface under various conditions.
This baseline study also evaluates how a potential limitation in fluid removal capability impacts the fluid fields. As an exploratory zero-reserve condition, the healthy cycle-averaged fluid-removal rate of m3/s is treated as the maximum effective clearance rate available to the modeled tissue region. Thus, the prescribed interstitial fluid pressure at the cylinder surface must increase to restrict transcapillary flow. As demonstrated in Table 5, p0 must rise from 0 mmHg to 2.72 mmHg to mathematically match the fluid removal rate of patients lacking vasomotion, to maintain a steady-state fluid balance. Consequently, the fluid pressure in the entire tissue region is higher, producing a calculated center pressure of 3.41 mmHg. These findings suggest that limited retinal fluid-clearance capacity could contribute to elevated interstitial fluid pressure.
3.2.2. Sensitivity to Increased Capillary Permeability
To examine the effect of progressive barrier impairment, capillary hydraulic conductivity and/or reflection coefficient are varied over the ranges listed in Table 4. Retinal endothelial studies support increased hydraulic permeability under diabetic or high-glucose conditions [29,30]. In contrast, retinal-specific measurements describing changes in the albumin reflection coefficient are limited; therefore, the lower value is adopted from a non-retinal glomerular study [28] as an exploratory permeability condition. These parameter variations are used to evaluate the sensitivity of fluid transport to increasing barrier dysfunction and are not intended to define a specific stage of diabetic retinopathy.
The parameter variations in Table 6 provide a local sensitivity assessment of the fluid-transport model. Increasing Lp, decreasing σ, or combining both changes progressively increases the required fluid-clearance rate. This sensitivity analysis illustrates the consequences of altering these two transport properties. When the baseline pressure p0 is maintained at 0 mmHg, independent or concurrent variations in hydraulic conductivity Lp and the reflection coefficient σ cause the fluid removal rate to rise significantly, spanning a range from 3.1772 × 10⁻¹⁴ to 5.189 × 10⁻¹⁴ m3/s. This increase requires the effective retinal fluid-clearance rate to reach approximately three to four times its baseline value. Conversely, when the effective fluid-clearance rate is constrained to the baseline value of m3/s, the boundary pressure required to maintain a steady-state fluid balance increases from 0 mmHg, varying approximately from 3.71 to 7.52 mmHg as the prescribed capillary permeability increases. These values are theoretical simulation predictions intended to illustrate the potential consequences of absent vasomotion.
Table 6.
Fluid removal rate at the tissue cylinder surface under different conditions.
4. Discussion
The study bridges two scales of diabetic retinopathy: arteriolar hemodynamics and tissue-level fluid transport. Previous studies have often isolated vasomotion (blood-flow regulation) from retinal edema (vascular leakage). The present model mechanistically links these phenomena by showing how functional changes in pre-capillary terminal arterioles can alter capillary blood pressure and subsequently affect interstitial fluid transport. This framework may be useful for future studies that investigate how early microvascular dysfunction manifests as advanced structural and clinical pathology.
Within the assumptions of the present model, the vasomotion condition produces a lower cycle-averaged capillary pressure and transcapillary fluid filtration than the sustained-vasodilation condition. The vascular-network model showed that vasoconstriction in selected terminal arterioles increases the overall flow resistance and shields downstream capillary beds from high pressure. When this blood pressure in the retinal capillary was coupled with the retinal tissue-fluid model, vasoconstriction produces a much lower interstitial pressure or a smaller fluid removal rate than that in the vasodilated condition. These results suggest that attenuation of terminal arteriolar diameter oscillations may increase the averaged capillary hydrostatic pressure and the associated retinal fluid-clearance requirement. In contrast, the modeled non-vasomotion condition produces a sustained higher capillary-pressure state, illustrating the potential hemodynamic consequence of removing the vasoconstriction phase. If retinal fluid-clearance capacity is insufficient to accommodate the additional filtration, interstitial pressure may rise. This burden could become greater when impaired vasomotion is accompanied by increased capillary permeability. This relationship is conditional on the simplified two-phase representation and should not be interpreted as evidence that impaired vasomotion directly causes retinal edema.
Reductions in terminal arteriole radius can markedly increase vascular resistance and alter downstream blood pressure, because of the strong fourth-power dependence of Hagen–Poiseuille resistance on vessel radius. In the representative near-occlusion scenario considered in this study, severe constriction of selected terminal arterioles produces very high hydraulic resistance and substantially reduces flow and pressure transmitted to their downstream capillary beds. When averaged over the full cycle, a lack of vasomotion results in an increase of approximately 83% in the fluid-clearance requirement of the modeled retinal tissue region. For the combined permeability-change condition, an approximately 327% reserve above the healthy operating rate would be required to accommodate the calculated fluid load. If the available fluid-clearance capacity is constrained, the model requires an increase in the prescribed boundary pressure to maintain a steady-state fluid balance. Depending on the capillary transport parameters, the required boundary pressure ranges from approximately 2.72 to 7.52 mmHg. However, we caution that these predicted values should be interpreted as mathematical requirements of the imposed clearance constraint rather than direct estimates of retinal interstitial pressure in patients. The predicted pressure requirements may be mathematically plausible within the assumptions of the model; however, independent validation will require retinal pressure, flow, or fluid-transport measurements not used in model parameterization. The lack of geometry and transport properties would require future studies to validate the predictions in this study.
The Starling formulation used in this study simplifies fluid exchange across the inner blood–retinal barrier. The capillary and interstitial oncotic pressures are held constant in the model without capturing changes in local oncotic forces caused by albumin extravasation or protein accumulation. Some transport properties used in the baseline case and later progressive cases are largely extrapolated from other organs, due to limited data in the human retina. Thus, the parameters used to represent increased capillary permeability carry uncertainty. For example, the transcapillary hydraulic conductivity value was from a previous study [29] that investigated the conductivity of bovine retinal endothelial cells in normal and elevated glucose. The reduced reflection coefficient is extrapolated from non-retinal glomerular data [2,28]. Although it is not ideal, we believe that the transport properties used in the model agree with the general trend of progressive damage to capillary membranes in the retina by diabetes. However, these property values should be interpreted as exploratory ranges rather than established parameters of progressive diabetic retinopathy. Location-specific property probability distributions are also unavailable in the retina, preventing a physiologically grounded probabilistic or global sensitivity analysis. Accordingly, the present results describe the mechanistic behavior of a simplified vascularized retinal tissue domain. They should not be interpreted as a spatially resolved model of fluid transport in diabetic retinopathy.
Several limitations in the theoretical simulations should be acknowledged. Firstly, equal durations are assigned to the vasodilation and vasoconstriction phases, although retinal vasomotion is a continuous oscillatory process rather than a two-phase process. Experimental studies have demonstrated that retinal vasomotion is oscillatory in nature. Hessellund et al. [11] recorded periodic diameter oscillations in isolated porcine retinal arterioles, with representative oscillatory traces shown in their study. More recently, Petersen et al. [20] quantified spontaneous diameter oscillations in human retinal arterioles using Fourier analysis and demonstrated distinct oscillatory frequency components in retinal vasomotion. Due to the irregular oscillations of the observed retinal arterioles during vasomotion, equal weighting of the two phases represents a simplifying approximation rather than a measured retinal duty cycle. However, the objective of the present theoretical study is to investigate the potential influence of the presence versus absence of vasomotion on retinal capillary blood pressure and fluid transport, rather than to reproduce the exact temporal waveform of retinal vasomotion. Accordingly, the vasodilation and vasoconstriction phases are used to represent the two limiting conditions of the simplified vasomotion cycle. In our model, the tissue-fluid response is also treated as a quasi-steady state. Although the very small Reynolds number supports neglecting inertia, it may not establish an instantaneous equilibrium between the interstitial fluid pressure and Darcy velocity within each vasomotion cycle. The present model also does not include transient fluid storage, tissue compliance, or clearance timescales; therefore, the hydraulic equilibration remains unresolved.
Second, because detailed retinal vasomotion data for small terminal arterioles are limited, some vessel-diameter changes were estimated using available microvascular data from skeletal muscle. Direct measurements of vasomotion amplitude in retinal terminal arterioles used in the present network are not currently available, as current methods used to quantify vasomotion in the retinal tissue are limited to either using a fundus camera or isolating and cannulating a large retinal arteriole. Both methods only work for large arterioles with a radius larger than 50 µm. Although the retinal vasomotion data fall within the 95% confidence interval of the fitted curve based on the skeletal data, this extrapolation represents a key modeling assumption. It introduces inherent uncertainty, as retinal and skeletal muscle microvasculature may exhibit distinct structural and regulatory characteristics. As a result, the predicted vascular resistance, pressure redistribution, and downstream fluid transport remain strictly conditional on the assumed vasoconstriction mechanics.
Third, a vascular network was constructed, assuming symmetric binary branching and rigid vessel walls, with blood viscosity treated as constant. Realistic retinal arterioles exhibit viscoelastic behavior, and blood viscosity varies with vessel diameter due to the Fåhraeus–Lindquist effect. More specifically, treating blood as a Newtonian fluid with a constant viscosity of 0.0035 Pa·s neglects the non-Newtonian rheological behavior and the non-uniform distribution of red blood cells in small-diameter vessels. In addition, phase separation and plasma skimming at vascular bifurcations may produce unequal hematocrit distributions among daughter vessels and consequently alter their effective viscosities [31]. These effects are not explicitly incorporated in the present network model. The extreme vasoconstriction condition of µm corresponds to a lumen diameter of approximately 1.74 µm, which is substantially smaller than the typical erythrocyte diameter of approximately 7.5 µm reported by Agrawal et al. [32]. Therefore, the continuum Hagen–Poiseuille approximation becomes questionable at this scale, and this condition is interpreted as an idealized near-occlusion, high-resistance state rather than a literal representation of erythrocyte flow. Additionally, the capillary bed was represented by an equivalent lumped hydraulic resistance because the exact number and arrangement of downstream capillary bundles were not available. This simplification allowed the model to estimate capillary pressure, but it does not capture local heterogeneity in capillary perfusion, capillary dropout, or preferential shunting.
Finally, other limitations include the absence of autoregulatory mechanisms—such as myogenic responses and metabolic feedback—that could modulate arteriolar diameter in response to pressure or flow changes. Incorporating these regulatory pathways would allow the model to simulate dynamic adaptations to chronic hypertension or ischemia, which are common in diabetic retinopathy.
While these limitations may influence the direct quantitative interpretation of our findings, they do not compromise the model’s core mechanistic objective: to evaluate the interplay between vasomotion, capillary pressure, and transcapillary fluid filtration. Accordingly, the predicted values serve as scenario-dependent theoretical estimates rather than definitive physiological bounds. The present work should therefore be regarded as a hypothesis-generating theoretical study rather than a validated predictive model. Incorporating future retinal-specific empirical data regarding vasomotion amplitude, spatial distribution, and temporal dynamics will be essential to refine the model’s physiological fidelity and predictive capability.
Author Contributions
Conceptualization, L.Z. and Z.Z.; methodology, L.Z.; software, Z.Z.; formal analysis, L.Z. and Z.Z.; resources, L.Z.; writing—original draft preparation, Z.Z.; writing—review and editing, L.Z. and Z.Z.; funding acquisition, L.Z. All authors have read and agreed to the published version of the manuscript.
Funding
This research was supported by NSF (DUE-2518774).
Institutional Review Board Statement
Not applicable.
Informed Consent Statement
Not applicable.
Data Availability Statement
The COMSOL model, model geometry, parameter definitions, and computational files supporting this study are available from the corresponding author upon reasonable request.
Conflicts of Interest
The authors declare no conflicts of interest.
References
- Li, H.; Jia, W.; Vujosevic, S.; Sabanayagam, C.; Grauslund, J.; Sivaprasad, S.; Wong, T.Y. Current Research and Future Strategies for the Management of Vision-Threatening Diabetic Retinopathy. Asia-Pac. J. Ophthalmol. 2024, 13, 100109. [Google Scholar] [CrossRef] [Scilit] [PubMed]
- Ruffini, A.; Dvoriashyna, M.; Govetto, A.; Romano, M.R.; Repetto, R. A Mathematical Model of Interstitial Fluid Flow and Retinal Tissue Deformation in Macular Edema. Investig. Ophthalmol. Vis. Sci. 2024, 65, 19. [Google Scholar] [CrossRef] [Scilit] [PubMed]
- Kusuhara, S.; Fukushima, Y.; Ogura, S.; Inoue, N.; Uemura, A. Pathophysiology of Diabetic Retinopathy: The Old and the New. Diabetes Metab. J. 2018, 42, 364–376. [Google Scholar] [CrossRef] [Scilit] [PubMed]
- Cunha-Vaz, J. Mechanisms of Retinal Fluid Accumulation and Blood-Retinal Barrier Breakdown. Dev. Ophthalmol. 2017, 58, 11–20. [Google Scholar] [CrossRef] [Scilit] [PubMed]
- Bek, T. Diabetic Maculopathy Caused by Disturbances in Retinal Vasomotion. A New Hypothesis. Acta Ophthalmol. Scand. 1999, 77, 376–380. [Google Scholar] [CrossRef] [Scilit] [PubMed]
- Farina, A.; Fasano, A.; Rosso, F. Modeling of Vasomotion in Arterioles. J. Theor. Biol. 2022, 544, 111124. [Google Scholar] [CrossRef] [Scilit] [PubMed]
- Bek, T. Diameter Changes of Retinal Vessels in Diabetic Retinopathy. Curr. Diab. Rep. 2017, 17, 82. [Google Scholar] [CrossRef] [Scilit] [PubMed]
- Stansberry, K.B.; Shapiro, S.A.; Hill, M.A.; Mcnirr, P.M.; Meyer, M.D.; Vinik, A.I. Impaired Peripheral Vasomotion in Diabetes. Diabetes Care 1996, 19, 715–721. [Google Scholar] [CrossRef] [Scilit] [PubMed]
- Schmiedel, O.; Schroeter, M.L.; Harvey, J.N. Microalbuminuria in Type 2 Diabetes Indicates Impaired Microvascular Vasomotion and Perfusion. Am. J. Physiol.—Hear. Circ. Physiol. 2007, 293, H3424–H3431. [Google Scholar] [CrossRef] [Scilit] [PubMed][Green Version]
- Gratton, R.J.; Gandley, R.E.; McCarthy, J.F.; Michaluk, W.K.; Slinker, B.K.; McLaughlin, M.K. Contribution of Vasomotion to Vascular Resistance: A Comparison of Arteries from Virgin and Pregnant Rats. J. Appl. Physiol. 1998, 85, 2255–2260. [Google Scholar] [CrossRef] [Scilit] [PubMed]
- Hessellund, A.; Jeppesen, P.; Aalkjaer, C.; Bek, T. Characterization of Vasomotion in Porcine Retinal Arterioles. Acta Ophthalmol. Scand. 2003, 81, 278–282. [Google Scholar] [CrossRef] [Scilit] [PubMed]
- Takahashi, T.; Nagaoka, T.; Yanagida, H.; Saitoh, T.; Kamiya, A.; Hein, T.; Kuo, L.; Yoshida, A. A Mathematical Model for the Distribution of Hemodynamic Parameters in the Human Retinal Microvascular Network. J. Biorheol. 2009, 23, 77–86. [Google Scholar] [CrossRef] [Scilit]
- Lapi, D.; Di Maro, M.; Mastantuono, T.; Starita, N.; Ursino, M.; Colantuoni, A. Arterial Network Geometric Characteristics and Regulation of Capillary Blood Flow in Hamster Skeletal Muscle Microcirculation. Front. Physiol. 2019, 10, 1953. [Google Scholar] [CrossRef] [Scilit] [PubMed]
- Sherman, T.F. On Connecting Large Vessels to Small. J. Gen. Physiol. 1981, 78, 431–453. [Google Scholar] [CrossRef] [Scilit] [PubMed]
- Arciero, J.; Harris, A.; Siesky, B.; Amireskandari, A.; Gershuny, V.; Pickrell, A.; Guidoboni, G. Theoretical Analysis of Vascular Regulatory Mechanisms Contributing to Retinal Blood Flow Autoregulation. Investig. Ophthalmol. Vis. Sci. 2013, 54, 5584–5593. [Google Scholar] [CrossRef] [Scilit] [PubMed]
- Nagaoka, T.; Yoshida, A. Noninvasive Evaluation of Wall Shear Stress on Retinal Microcirculation in Humans. Investig. Ophthalmol. Vis. Sci. 2006, 47, 1113–1119. [Google Scholar] [CrossRef] [Scilit] [PubMed]
- Guidoboni, G.; Harris, A.; Cassani, S.; Arciero, J.; Siesky, B.; Amireskandari, A.; Tobe, L.; Egan, P.; Januleviciene, I.; Park, J. Intraocular Pressure, Blood Pressure, and Retinal Blood Flow Autoregulation: A Mathematical Model to Clarify Their Relationship and Clinical Relevance. Investig. Ophthalmol. Vis. Sci. 2014, 55, 4105–4118. [Google Scholar] [CrossRef] [Scilit] [PubMed]
- Arciero, J.; Fry, B.; Albright, A.; Mattingly, G.; Scanlon, H.; Abernathy, M.; Siesky, B.; Vercellin, A.V.; Harris, A. Metabolic Signaling in a Theoretical Model of the Human Retinal Microcirculation. Photonics 2021, 8, 409. [Google Scholar] [CrossRef] [Scilit] [PubMed]
- Salerni, F.; Repetto, R.; Harris, A.; Pinsky, P.; Prud’homme, C.; Szopos, M.; Guidoboni, G. Biofluid Modeling of the Coupled Eye-Brain System and Insights into Simulated Microgravity Conditions. PLoS ONE 2019, 14, e0216012. [Google Scholar] [CrossRef] [Scilit] [PubMed]
- Petersen, L.; Aalkjaer, C.; Bek, T. Vasomotion in Retinal Arterioles Is Modified by Exercise and Flicker Stimulation. Investig. Ophthalmol. Vis. Sci. 2022, 63, 7. [Google Scholar] [CrossRef] [Scilit] [PubMed]
- Arthur, E.; Elsner, A.E.; Sapoznik, K.A.; Papay, J.A.; Muller, M.S.; Burns, S.A. Distances from Capillaries to Arterioles or Venules Measured Using OCTA and AOSLO. Investig. Ophthalmol. Vis. Sci. 2019, 60, 1833–1844. [Google Scholar] [CrossRef] [Scilit] [PubMed]
- Kolb, H. Simple Anatomy of the Retina. In Webvision: The Organization of the Retina and Visual System [Internet]; Kolb, H., Fernandez, E., Jones, B., Nelson, R., Eds.; University of Utah Health Sciences Center: Salt Lake City, UT, USA, 1995. [Google Scholar] [PubMed]
- Fan, L.; Pei, S.; Lucas Lu, X.; Wang, L. A Multiscale 3D Finite Element Analysis of Fluid/Solute Transport in Mechanically Loaded Bone. Bone Res. 2016, 4, 16032. [Google Scholar] [CrossRef] [Scilit] [PubMed]
- Leng, Y.; Wang, H.; de Lucio, M.; Gomez, H. Mixed-Dimensional Multi-Scale Poroelastic Modeling of Adipose Tissue for Subcutaneous Injection. Biomech. Model. Mechanobiol. 2022, 21, 1825–1840. [Google Scholar] [CrossRef] [Scilit] [PubMed]
- Bill, A. Capillary Permeability to and Extravascular Dynamics of Myoglobin, Albumin and Gammaglobulin in the Uvea. Acta Physiol. Scand. 1968, 73, 204–219. [Google Scholar] [CrossRef] [Scilit] [PubMed]
- Cunha-Vaz, J. The Blood-Retinal Barrier in the Management of Retinal Disease: EURETINA Award Lecture. Ophthalmologica 2017, 237, 1–10. [Google Scholar] [CrossRef] [Scilit] [PubMed]
- Smith, A.F.; Doyeux, V.; Berg, M.; Peyrounette, M.; Haft-Javaherian, M.; Larue, A.-E.; Slater, J.H.; Lauwers, F.; Blinder, P.; Tsai, P.; et al. Brain Capillary Networks Across Species: A Few Simple Organizational Requirements Are Sufficient to Reproduce Both Structure and Function. Front. Physiol. 2019, 10, 233. [Google Scholar] [CrossRef] [Scilit] [PubMed]
- Fan, F.; Chen, C.C.A.; Zhang, J.; Schreck, C.M.N.; Roman, E.A.; Williams, J.M.; Hirata, T.; Sharma, M.; Beard, D.A.; Savin, V.J.; et al. Fluorescence Dilution Technique for Measurement of Albumin Reflection Coefficient in Isolated Glomeruli. Am. J. Physiol.—Ren. Physiol. 2015, 309, F1049–F1059. [Google Scholar] [CrossRef] [Scilit] [PubMed]
- Lopez-Quintero, S.V.; Ji, X.Y.; Antonetti, D.A.; Tarbell, J.M. A Three-Pore Model Describes Transport Properties of Bovine Retinal Endothelial Cells in Normal and Elevated Glucose. Investig. Ophthalmol. Vis. Sci. 2011, 52, 1171–1180. [Google Scholar] [CrossRef] [Scilit] [PubMed]
- Lopez-Quintero, S.V.; Cancel, L.M.; Pierides, A.; Antonetti, D.; Spray, D.C.; Tarbell, J.M. High Glucose Attenuates Shear-Induced Changes in Endothelial Hydraulic Conductivity by Degrading the Glycocalyx. PLoS ONE 2013, 8, e78954. [Google Scholar] [CrossRef] [Scilit] [PubMed]
- Mantegazza, A.; Clavica, F.; Obrist, D. In Vitro Investigations of Red Blood Cell Phase Separation in a Complex Microchannel Network. Biomicrofluidics 2020, 14, 014101. [Google Scholar] [CrossRef] [Scilit] [PubMed]
- Agrawal, R.; Smart, T.; Nobre-Cardoso, J.; Richards, C.; Bhatnagar, R.; Tufail, A.; Shima, D.; Jones, P.H.; Pavesio, C. Assessment of Red Blood Cell Deformability in Type 2 Diabetes Mellitus and Diabetic Retinopathy by Dual Optical Tweezers Stretching Technique. Sci. Rep. 2016, 6, srep15873. [Google Scholar] [CrossRef] [Scilit] [PubMed]

Disclaimer/Publisher’s Note: The statements, opinions and data contained in all publications are solely those of the individual author(s) and contributor(s) and not of MDPI and/or the editor(s). MDPI and/or the editor(s) disclaim responsibility for any injury to people or property resulting from any ideas, methods, instructions or products referred to in the content. |
© 2026 by the authors. Licensee MDPI, Basel, Switzerland. This article is an open access article distributed under the terms and conditions of the Creative Commons Attribution (CC BY) license.