


Abstract
The effect of water on the dynamics and ionic conductivity of the ionic liquids 1-ethyl-1-methylpyrrolidinium levulinate ([C2C1Pyr]Lev) and 1-butyl-1-methylpyrrolidinium levulinate ([C4C1Pyr]Lev) was investigated using differential scanning calorimetry (DSC) and broadband dielectric spectroscopy (BDS) over a wide temperature range. Although both ILs share the same levulinate anion, water induces markedly different dynamical responses depending on cation structure. In both systems, water acts as a plasticizer, lowering the glass transition temperature; however, the extent of plasticization and the resulting relaxation dynamics are cation-dependent. Stronger water–cation interactions are observed in [C2C1Pyr]Lev, whereas in [C4C1Pyr]Lev, water primarily disrupts alkyl-chain packing, enhancing ionic mobility. Increasing hydration shifts the main relaxation to higher frequencies and increases liquid fragility, while translational ionic motion remains decoupled from structural relaxation. These results demonstrate that water plays a cation-specific and mechanistically distinct role in levulinate-based ILs, providing new insights into hydration-controlled glassy dynamics and charge transport relevant to the design of IL-based electrolytes under non-anhydrous conditions.
1. Introduction
Ionic liquids (ILs) are salts composed entirely of ions, characterized by negligible vapor pressure, wide electrochemical windows, and high thermal and chemical stability [1]. These properties, combined with the ability to tailor cation and anion structures, make ILs attractive for diverse applications [2], particularly in energy-related devices where they function as electrolytes in batteries, supercapacitors, and other electrochemical systems [3,4,5,6,7,8,9,10]. Structural tunability allows rational design of ILs with optimized macroscopic properties for specific technological needs.
A critical factor affecting IL performance is water, which is often present due to the hygroscopic nature of most ILs [11,12,13]. Even small amounts of water can significantly influence viscosity, glass transition temperature (Tg) and ionic conductivity [14,15,16,17,18,19,20,21,22,23,24,25,26]. Water can act as a plasticizer, lowering Tg and enhancing ionic mobility, but the microscopic effects depend on its organization within the ionic matrix, including ion hydration, cluster formation, or partitioning into polar and nonpolar domains [23,25,27]. This complex interplay often leads to system-dependent behavior, including acceleration of ionic motion or partial decoupling of translational ionic motion from structural relaxation.
In this study, we investigate the impact of absorbed moisture on Tg, ionic conductivity, and molecular dynamics in two levulinate based ILs: 1-ethyl-1-methylpyrrolidinium levulinate and 1-butyl-1-methylpyrrolidinium levulinate. Levulinate-based ILs have recently started to receive growing attention in the frame of bio-based ILs and DESs, levulinic acid being a carboxylic acid obtainable from the transformation of polysaccharides like cellulose and hemicellulose [28]. Pyrrolidinium cations were selected due to their wide use in the ionic liquid panorama. Levulinate ILs have been studied in different applications such as for the extraction of pharmaceuticals via aqueous biphasic systems (ABS) [29] as potential media for CO2 absorption [30] and for cellulose dissolution and modification, to name but a few [31,32]. Besides the well-known hygroscopic behavior typically exhibited by ILs, many extraction processes see the presence of water as an additive or as an extracting solvent [33,34]. The study of the effect of the presence of water on IL properties therefore represents an important insight from both a physico-chemical and an applicative point of view [35].
Because, in the considered ILs, the cations differ only in the length of the alkyl chain attached to the pyrrolidinium nitrogen, while the anion remains the same, we can directly assess how this variation influences water–ion interactions and structural organization within the ionic matrix. By combining differential scanning calorimetry (DSC) with broadband dielectric spectroscopy (BDS), we aim to establish clear correlations between cation structure, water-induced plasticization, and ionic mobility, providing insight into the molecular mechanisms governing hydrated ILs and informing the design of IL-based electrolytes for energy applications. To the best of our knowledge, no systematic BDS study on the effects of water in levulinate-based pyrrolidinium ILs has been reported, highlighting the novelty of the present work.
2. Materials and Methods
2.1. Materials and Sample Preparation
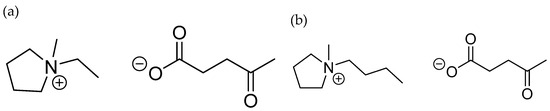
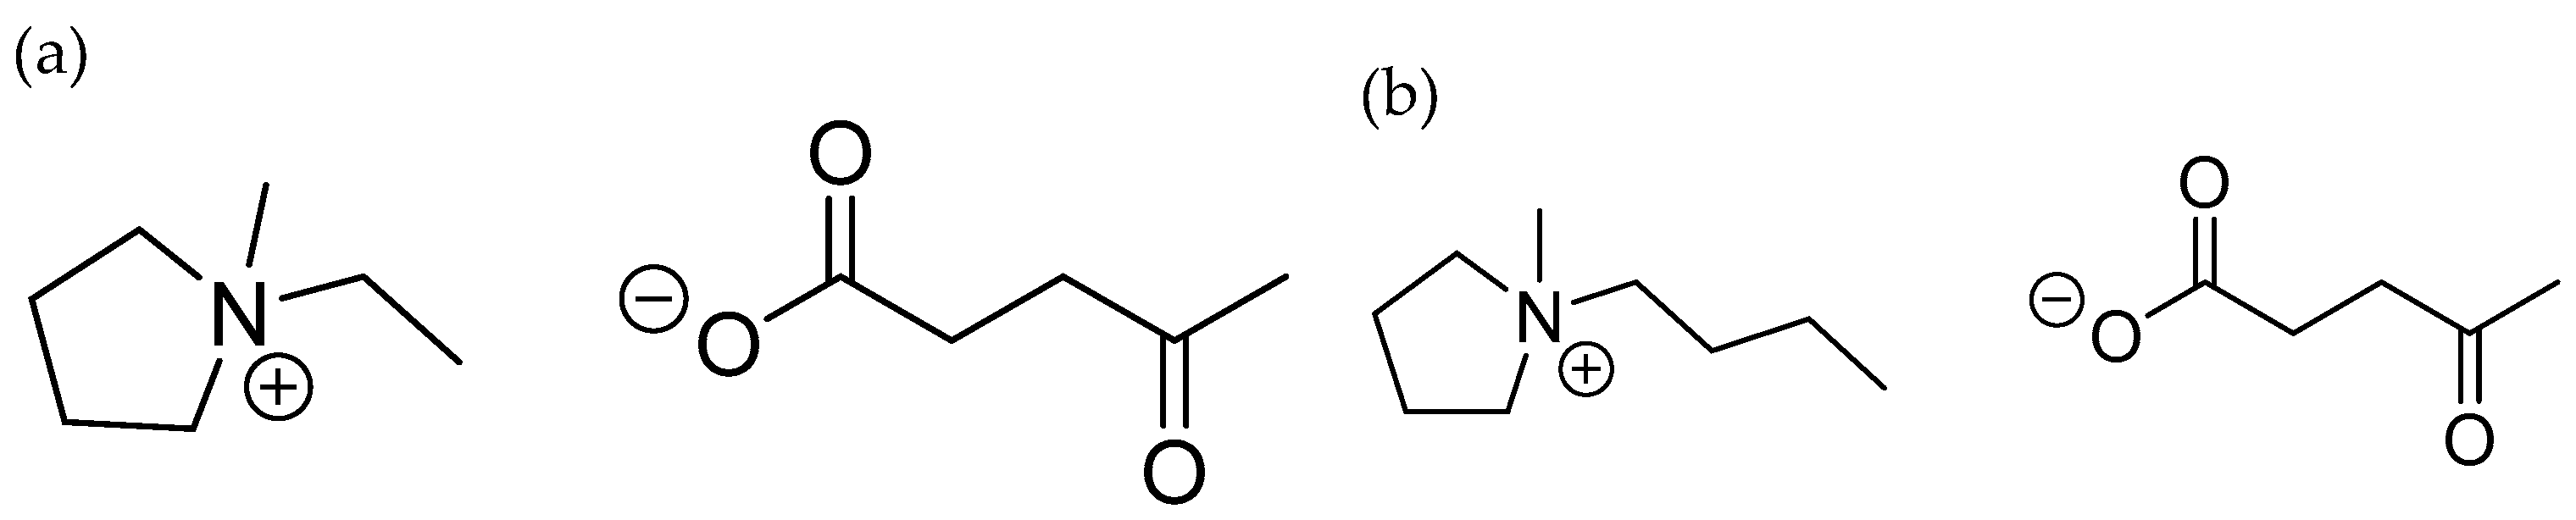
The ionic liquids studied are 1-ethyl-1-methylpyrrolidinium levulinate, [C2C1Pyr]Lev, and 1-butyl-1-methylpyrrolidinium levulinate, [C4C1Pyr]Lev (Figure 1).
Figure 1.
(a) Structure of 1-ethyl-1-methylpyrrolidinium levulinate ([C2C1Pyr]Lev); (b) structure of 1-butyl-1-methylpyrrolidinium levulinate ([C4C1Pyr]Lev).
These ionic liquids share a common levulinate (Lev) anion, while their cations differ in the length of the alkyl chain attached to the nitrogen atom of the pyrrolidinium ring. The chain consists of two carbons (C2C1Pyr) in the first case and four carbons (C4C1Pyr) in the second. The preparation of the materials is described in [28]. The complete removal of halide anions during the synthetic procedure was checked by silver assay. A few drops of a solution of AgNO3 were added to a sample of the hydroxyl IL intermediate (prepared by ion metathesis through anion exchange resin) previously acidified with diluted nitric acid [36]. The absence of the formation of AgBr precipitate indicated the complete substitution of bromide anions with hydroxyl anions, excluding the presence of residual bromide above a concentration of about 10−7 M [28].
Two sets of samples were prepared: those maintained in a desiccator over P2O5 for an extended period, and those exposed to ambient conditions (temperature 25–30 °C and relative humidity 50–60%) for five days. The water content of each sample was determined by weighing the sample before and after the differential scanning calorimetry measurements, during which water evaporation was observed. The water percentages reported hereafter refer to the water content relative to the dry mass and were calculated using the following equation:
where mh is the mass of the sample before water evaporation and md is the mass of the sample after.
The assumption that the observed mass loss is primarily associated with water evaporation is supported by the thermal behavior of similar systems. Previous thermogravimetric (TGA) studies on the same ionic liquids have shown a small mass loss event around 100 °C, attributed to the release of absorbed water due to their hygroscopic nature, followed by a significantly larger mass loss at higher temperatures associated with thermal decomposition, thus providing a general separation between water evaporation and degradation processes.
In the present DSC experiments, the selected temperature range was intended to predominantly capture the low-temperature mass loss. However, since the upper limit of the DSC measurements slightly exceeds the reported onset of decomposition (~184 °C), a minor contribution from early-stage thermal degradation cannot be completely excluded. As a result, the calculated water content may be slightly overestimated.
Nevertheless, the applied approach provides a consistent and reproducible estimation of mass loss across all samples. Therefore, while the absolute values of water content should be interpreted with some caution, the relative differences and trends between samples remain reliable and meaningful for comparative analysis.
While techniques such as Karl Fischer titration could provide a more specific quantification of water content, the present method offers a practical and internally consistent estimation that is sufficient for the comparative purposes of this study.
Hereafter, the samples will be referred to as hw%, where hw represents the water percentage by weight. For the ionic liquid [C2C1Pyr]Lev, samples with water concentrations of 9% and 59% were prepared, while for [C4C1Pyr]Lev, samples with water concentrations of 10% and 44% were prepared.
2.2. Differential Scanning Calorimetry (DSC)
Differential scanning calorimetry (DSC) measurements were conducted using a TA Q200 instrument (TA Instruments). The samples were placed in aluminum pans and sealed with a crimp press. The mass of both the samples and the pans was measured using a high-precision balance. Subsequently, the pans were pierced to allow for water evaporation and placed into the calorimeter. The experimental protocol involved cooling the sample from ambient temperature down to −150 °C at a rate of −10 °C/min, followed by an isothermal hold for 2 min and subsequent heating at a rate of 10 °C/min. Although the heating program was defined up to 200 °C, in practice, the measurement was terminated at lower temperatures for each sample in order to avoid the onset of thermal decomposition, as indicated by a deviation in the heat flow signal at higher temperatures.
Specifically, the final temperature ranged between approximately 180 and 190 °C depending on the sample, ensuring completion of the evaporation process while minimizing contributions from degradation. This approach allows the recorded mass loss to be predominantly attributed to water evaporation, although a minor contribution from early-stage decomposition cannot be entirely excluded as has been discussed above.
2.3. Broadband Dielectric Spectroscopy (BDS)
Dielectric measurements were performed using an experimental setup consisting of an Alpha-Analyzer frequency response analyzer and a Novocool temperature control system (Novocontrol Technologies). The samples were placed in a liquid dielectric cell, consisting of a Teflon cylinder with metal electrodes at the top and bottom. The cell had a thickness of 2 mm and an electrode diameter of 11 mm. An alternating voltage of 1 Vrms was applied across the electrodes. Isothermal measurements were carried out in the frequency range of 0.1 Hz to 1 MHz and over a temperature range of −100 °C to 60 °C, with a temperature step of 10 °C.
3. Results and Discussion
3.1. DSC Results
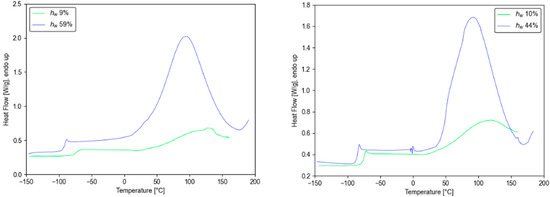
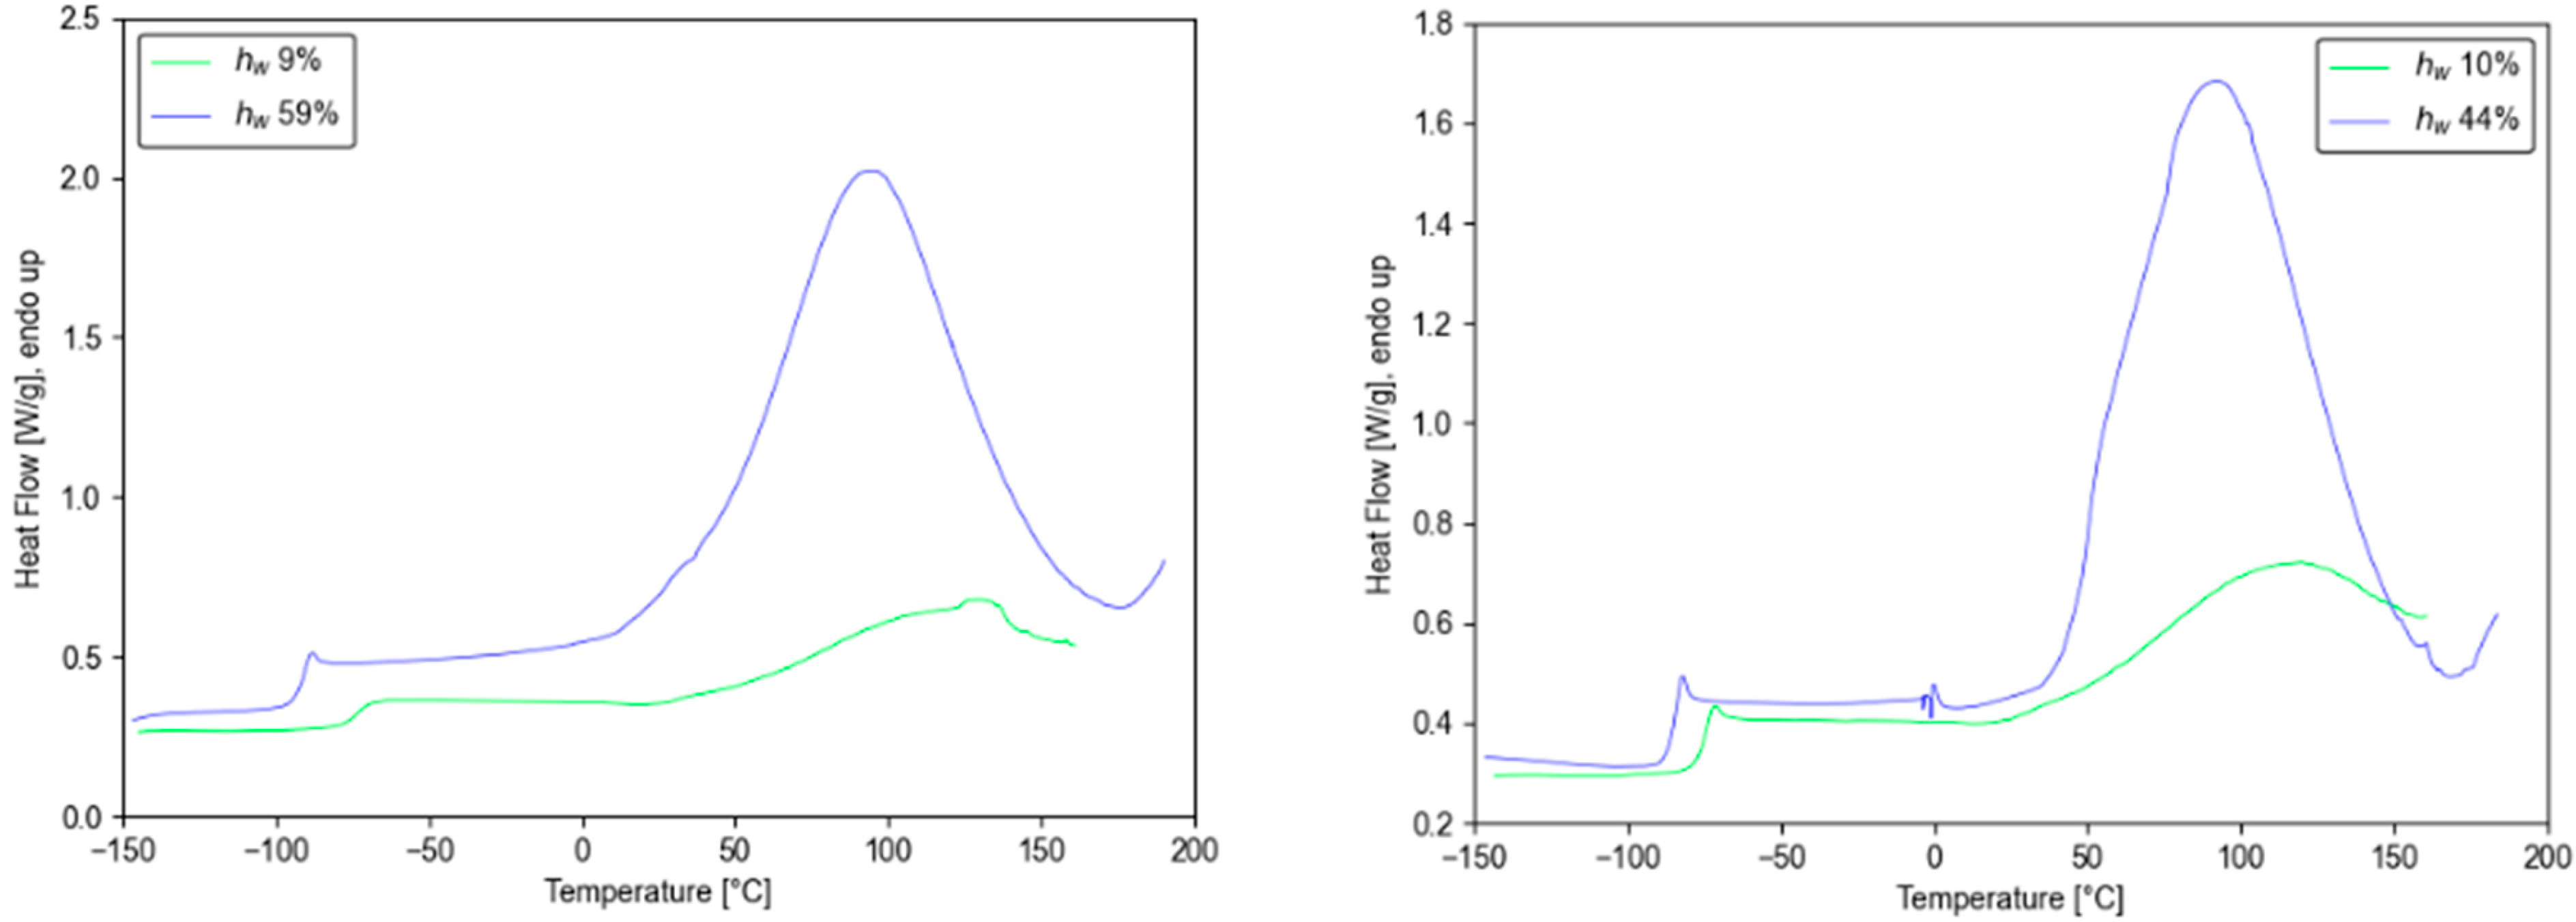
Figure 2 presents the DSC thermograms of [C2C1Pyr]Lev and [C4C1Pyr]Lev at different hydration levels. Upon heating, all samples exhibit a step-like change in the heat flow in the low-temperature region (−100 to −50 °C), attributed to the glass transition. At higher temperatures (around 100 °C), a pronounced endothermic peak corresponding to water evaporation is observed. In both ionic liquids, increasing water content shifts the glass transition to lower temperatures, indicating a clear plasticizing effect of water. Simultaneously, the evaporation peak shifts to lower temperatures and increases in magnitude with increasing hydration, reflecting the higher amount of absorbed water and its modified thermal stability within the ionic matrix.
Figure 2.
DSC thermograms for the ionic liquids [C2C1Pyr]Lev (left) and [C4C1Pyr]Lev (right).
Table 1 summarizes the glass transition temperature (Tg), determined from the midpoint of the step observed in DSC thermograms, along with the heat capacity change at Tg (ΔCp), the enthalpy of water evaporation (ΔH), and the peak evaporation temperature (Tmax). For [C2C1Pyr]Lev, Tg decreases from −73 °C to −92 °C as the water content increases from 9 wt% to 59 wt% confirming the pronounced plasticizing effect of water. A corresponding increase in ΔCp is observed, consistent with enhanced molecular mobility and increased configurational freedom in the hydrated samples. ΔH increases with water content, reflecting the larger amount of absorbed water, while Tmax decreases from 130 °C to 95 °C. The reduction in Tmax suggests stronger water–ionic liquid interactions at lower hydration levels and progressively weaker binding as the water content increases.
Table 1.
Thermal results of DSC measurements of hydrated ionic liquids.
A similar trend is observed for [C4C1Pyr]Lev, where Tg decreases from −76 °C to −85 °C as the water content increases from 10 wt% to 44 wt%. The corresponding decrease in Tmax from 119 °C to 92 °C again indicates a weakening of specific water–ionic liquid interactions at higher hydration levels. Notably, the magnitude of Tg depression is smaller, and the Tmax of the dry sample is lower compared to [C2C1Pyr]Lev, suggesting differences in the manner by which water interacts with the cation structure and modifies the local organization of the ionic matrix.
It should be noted here that a previous study on [C4C1Pyr]Lev (solid at room temperature) reported melting and crystallization at 41.6 °C and −33.3 °C, respectively, with a glass transition observed only during the first heating cycle and disappearing after dehydration at elevated temperatures [28]. In contrast, the hydrated samples (both liquids at room temperatures) investigated in the present work exhibit exclusively glass transitions, with no evidence of crystallization. This behavior displays how the presence of a sufficient amount of water can effectively suppress crystallization by disrupting the regular packing of ions and modifying intermolecular interactions within the ionic matrix, coherently with literature data. In detail, it has been reported that, when the water content is very low, the water molecules preferentially interact with the charged portions of the ionic liquids and are trapped, as single molecules, in the polar network forming H-bond driven complexes preferentially with the anions. As the water content increases, micelles can develop, forming complex interactions involving anions, cations and water molecules capable of altering even more profoundly the physico-chemical behavior of the IL [35].
For both ionic liquids investigated, water acts as a plasticizer, progressively lowering the glass transition temperature. Such Tg depression upon hydration has been widely reported for ionic liquids and is generally associated with reduced viscosity and weakened ion–ion interactions [16,25,26,37,38], although opposite trends can occur in systems with less hydrophilic anions [39]. DSC measurements reveal that the structure of the cation strongly influences the degree of plasticization, with Tg depression being more pronounced for [C2C1Pyr]Lev than for [C4C1Pyr]Lev. The heat capacity change at Tg (ΔCp) increases with rising water content in both ILs, showing no significant cation dependence. In contrast, the peak evaporation temperature (Tmax) is consistently lower for [C4C1Pyr]Lev than for [C2C1Pyr]Lev across all hydration levels, indicating stronger water–ionic liquid interactions in [C2C1Pyr]Lev. Spectroscopic evidence further indicates that water induces microstructural heterogeneity rather than acting as a simple diluent, and that alkyl-chain length modulates water accommodation, influencing both polar and nonpolar domains [37,40]. In line with these observations, the stronger Tg depression in [C2C1Pyr]Lev arises from direct water–cation interactions, whereas in [C4C1Pyr]Lev, water primarily perturbs alkyl-chain packing, leading to a smaller Tg decrease. Therefore, the observed difference in Tg depression cannot be attributed solely to the absolute water content. Even if the hydration of [C4C1Pyr]Lev were increased beyond 44 wt%, Tg would likely decrease further, but the overall plasticizing effect would still remain smaller than that of [C2C1Pyr]Lev at comparable water contents. Overall, the combined effect of network softening and hydration-induced structural reorganization underlies the observed cation-dependent thermal behavior of these levulinate-based ionic liquids.
3.2. BDS Results
3.2.1. Dielectric Spectra
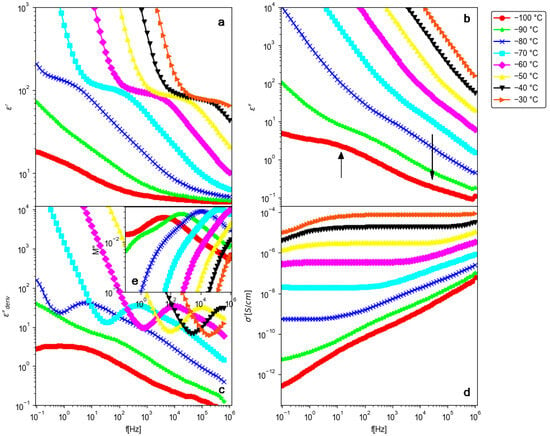
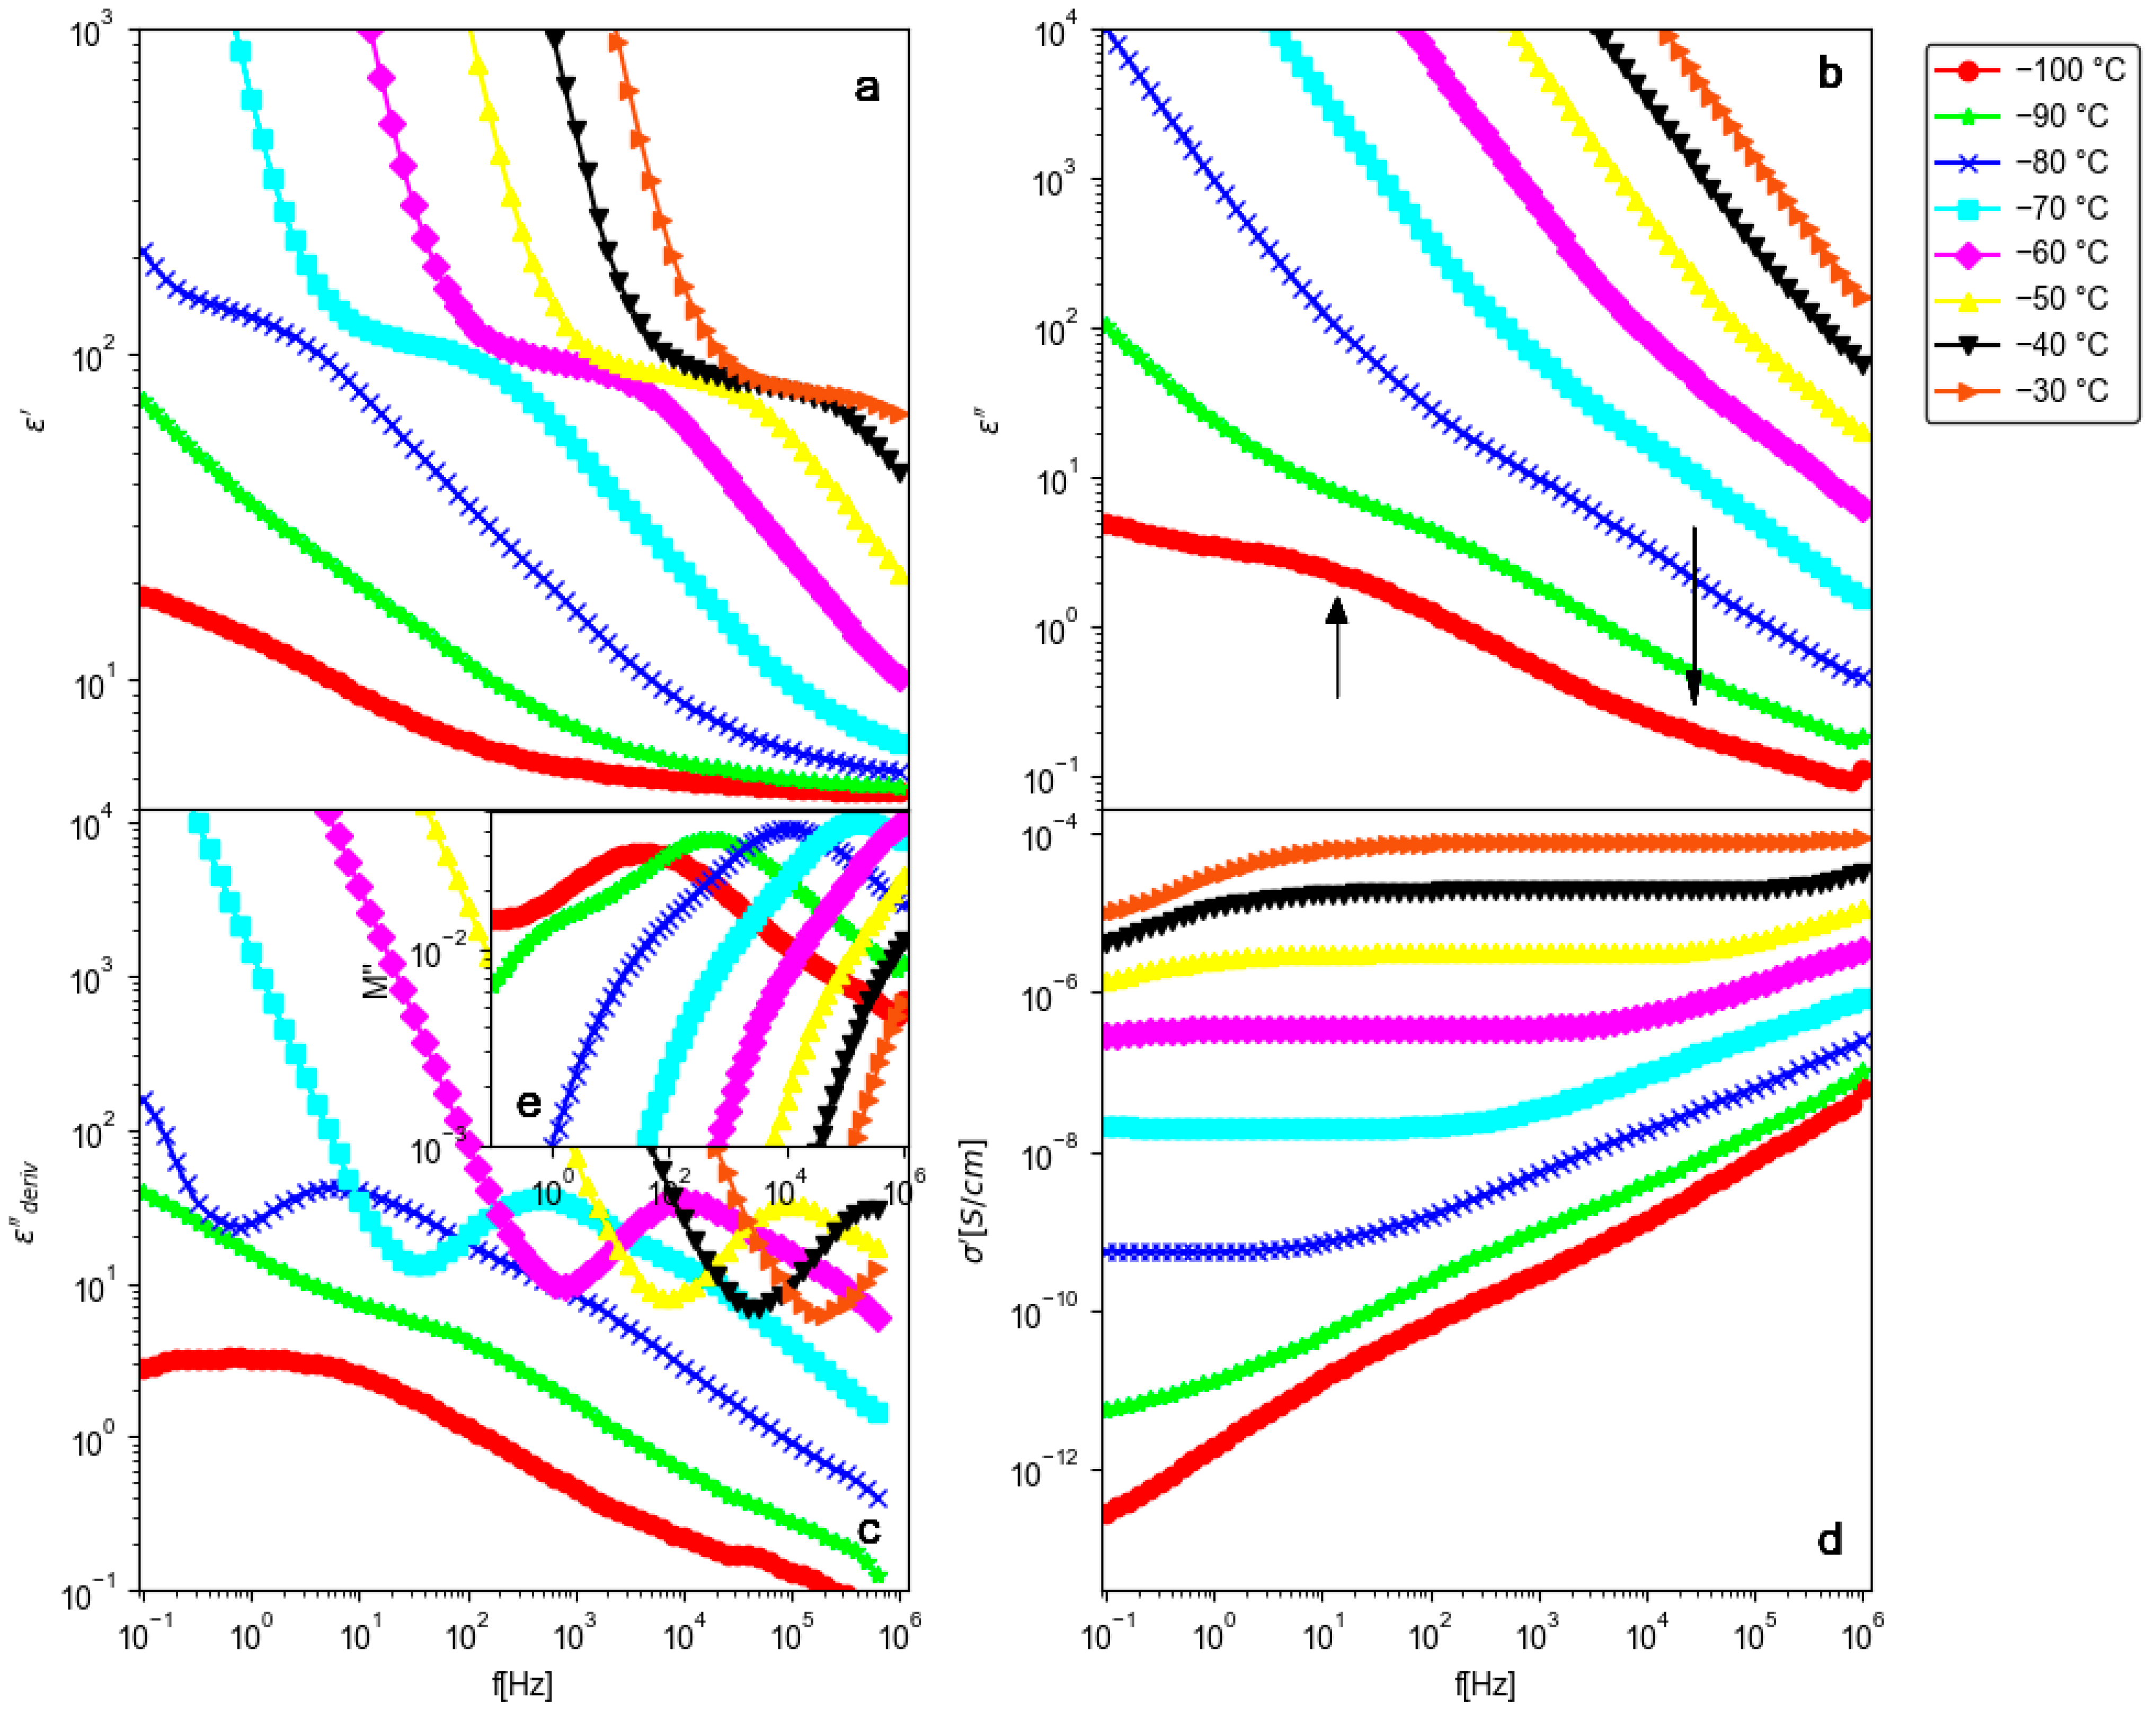
Figure 3 presents representative dielectric spectra for [C2C1Pyr]Lev at 59% water content over the temperature range from −100 to −30 °C. Panels (a–e) show the real (ε′) and imaginary (ε″) parts of the dielectric function, the derivative of the real part, free from DC conductivity contributions [41], the real conductivity (σ′), and the imaginary part of the electric modulus (M″), all plotted as a function of frequency f.
Figure 3.
Dielectric measurement plots for the [C2C1Pyr]Lev ionic liquid with a water content of 59%, over a temperature range from −100 to −30 °C. The real part of the dielectric function ε′ (a), the imaginary part of the dielectric function ε″ (b), the derivative of the real part of the dielectric function, ε″deriv (c), the real part of complex conductivity σ′ (d) and the imaginary part of the electric modulus M″ ((e), inset within (c)) are shown as a function of frequency f.
At −100 °C, a temperature below Tg, two peaks are observed in the imaginary part of the dielectric function ε″ (Figure 3b), indicated by arrows on the corresponding plot.
These peaks correspond to two secondary dielectric relaxation processes. The contribution of each mechanism is manifested as a step-like change in the real part of the dielectric function ε′ (Figure 3a) and as a shoulder or peak in the plots of the derivative (Figure 3c) and the imaginary part of the electric modulus M″ (Figure 3e). As the temperature increases, these mechanisms shift toward higher frequencies. The faster process, also visible in the dry sample, is attributed to localized ion motions, consistent with previous reports in the literature [42,43], whereas the slower process appears only in the hydrated sample and is associated with water. A detailed analysis of these secondary relaxations, however, lies beyond the scope of the present study.
As the temperature increases above Tg (>−90 °C), a strong increase in σ′ (Figure 3d) is observed at low frequencies, forming a nearly frequency-independent plateau that grows with temperature. Simultaneously, a pronounced step in ε′, a peak in , and a shoulder in M″ appear in the same frequency range, also shifting to higher frequencies with temperature. This process corresponds to the main relaxation (α-relaxation or conductivity relaxation), associated with the motion of ions. In ε″, the α-relaxation is masked at low frequencies by the linear increase due to DC conductivity, whereas in the derivative representation, it becomes clearly identifiable as a distinct peak. At frequencies lower than those, the main relaxation deviations in ε′ and σ′ are attributed to electrode polarization [44].
At higher temperatures, the dielectric spectra become increasingly dominated by DC conductivity and electrode polarization. A similar pattern is observed for hydrated [C4C1Pyr]Lev, with secondary relaxations below Tg (with the exception that only a single process is detected at the lowest water content) and a dominant α-relaxation above Tg, although the characteristics of these processes differ from those of [C2C1Pyr]Lev, indicating that the underlying ionic dynamics and charge transport mechanisms are preserved across both systems.
3.2.2. Temperature–Water Dependence of Dynamics and Conductivity
The main focus of the present work is the investigation of the effect of water on the DC conductivity and the primary α-relaxation of [C2C1Pyr]Lev and [C4C1Pyr]Lev ionic liquids. To extract the peak frequencies and relaxation strengths of the α-relaxation, fitting procedures were applied to the ε″ vs. frequency, f, plots in selected regions surrounding the corresponding peaks. For this purpose, the following equation was used to model the data:
The first term of Equation (1), where A is a constant, accounts for the contribution of DC conductivity to ε″, while the second term corresponds to the imaginary part of the Havriliak–Negami equation [45] and describes the contribution of the main α-relaxation. Δε is the dielectric strength (dielectric increment) of the main relaxation, is the dielectric constant at the high-frequency limit, fHN = 1/2πτ, where τ is the characteristic relaxation time, is related to the peak frequency of ε″, and α, β (0 < α, β ≤ 1) are shape parameters describing the symmetric and asymmetric broadening of the relaxation peak. It should be noted that alternative data analysis approaches in broadband dielectric spectroscopy (BDS), such as numerical deconvolution techniques for resolving complex dielectric responses, have also been proposed in the literature [46].
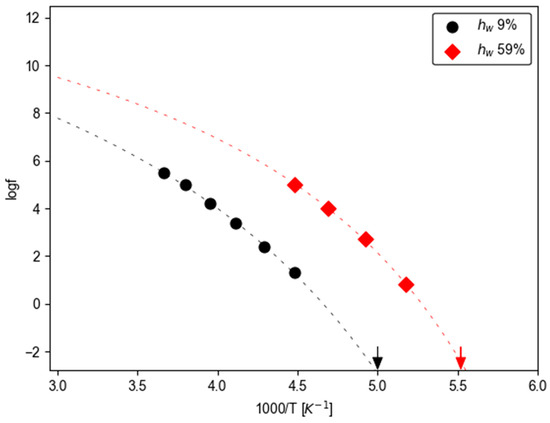
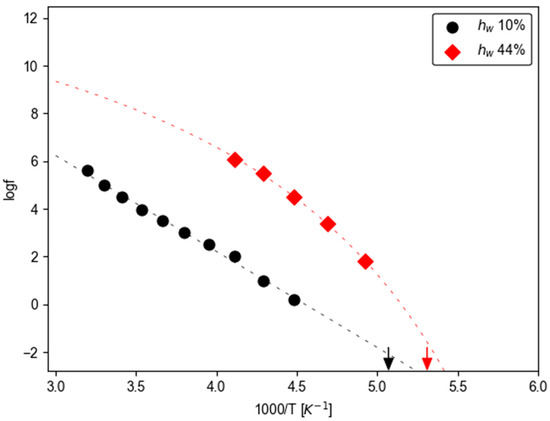
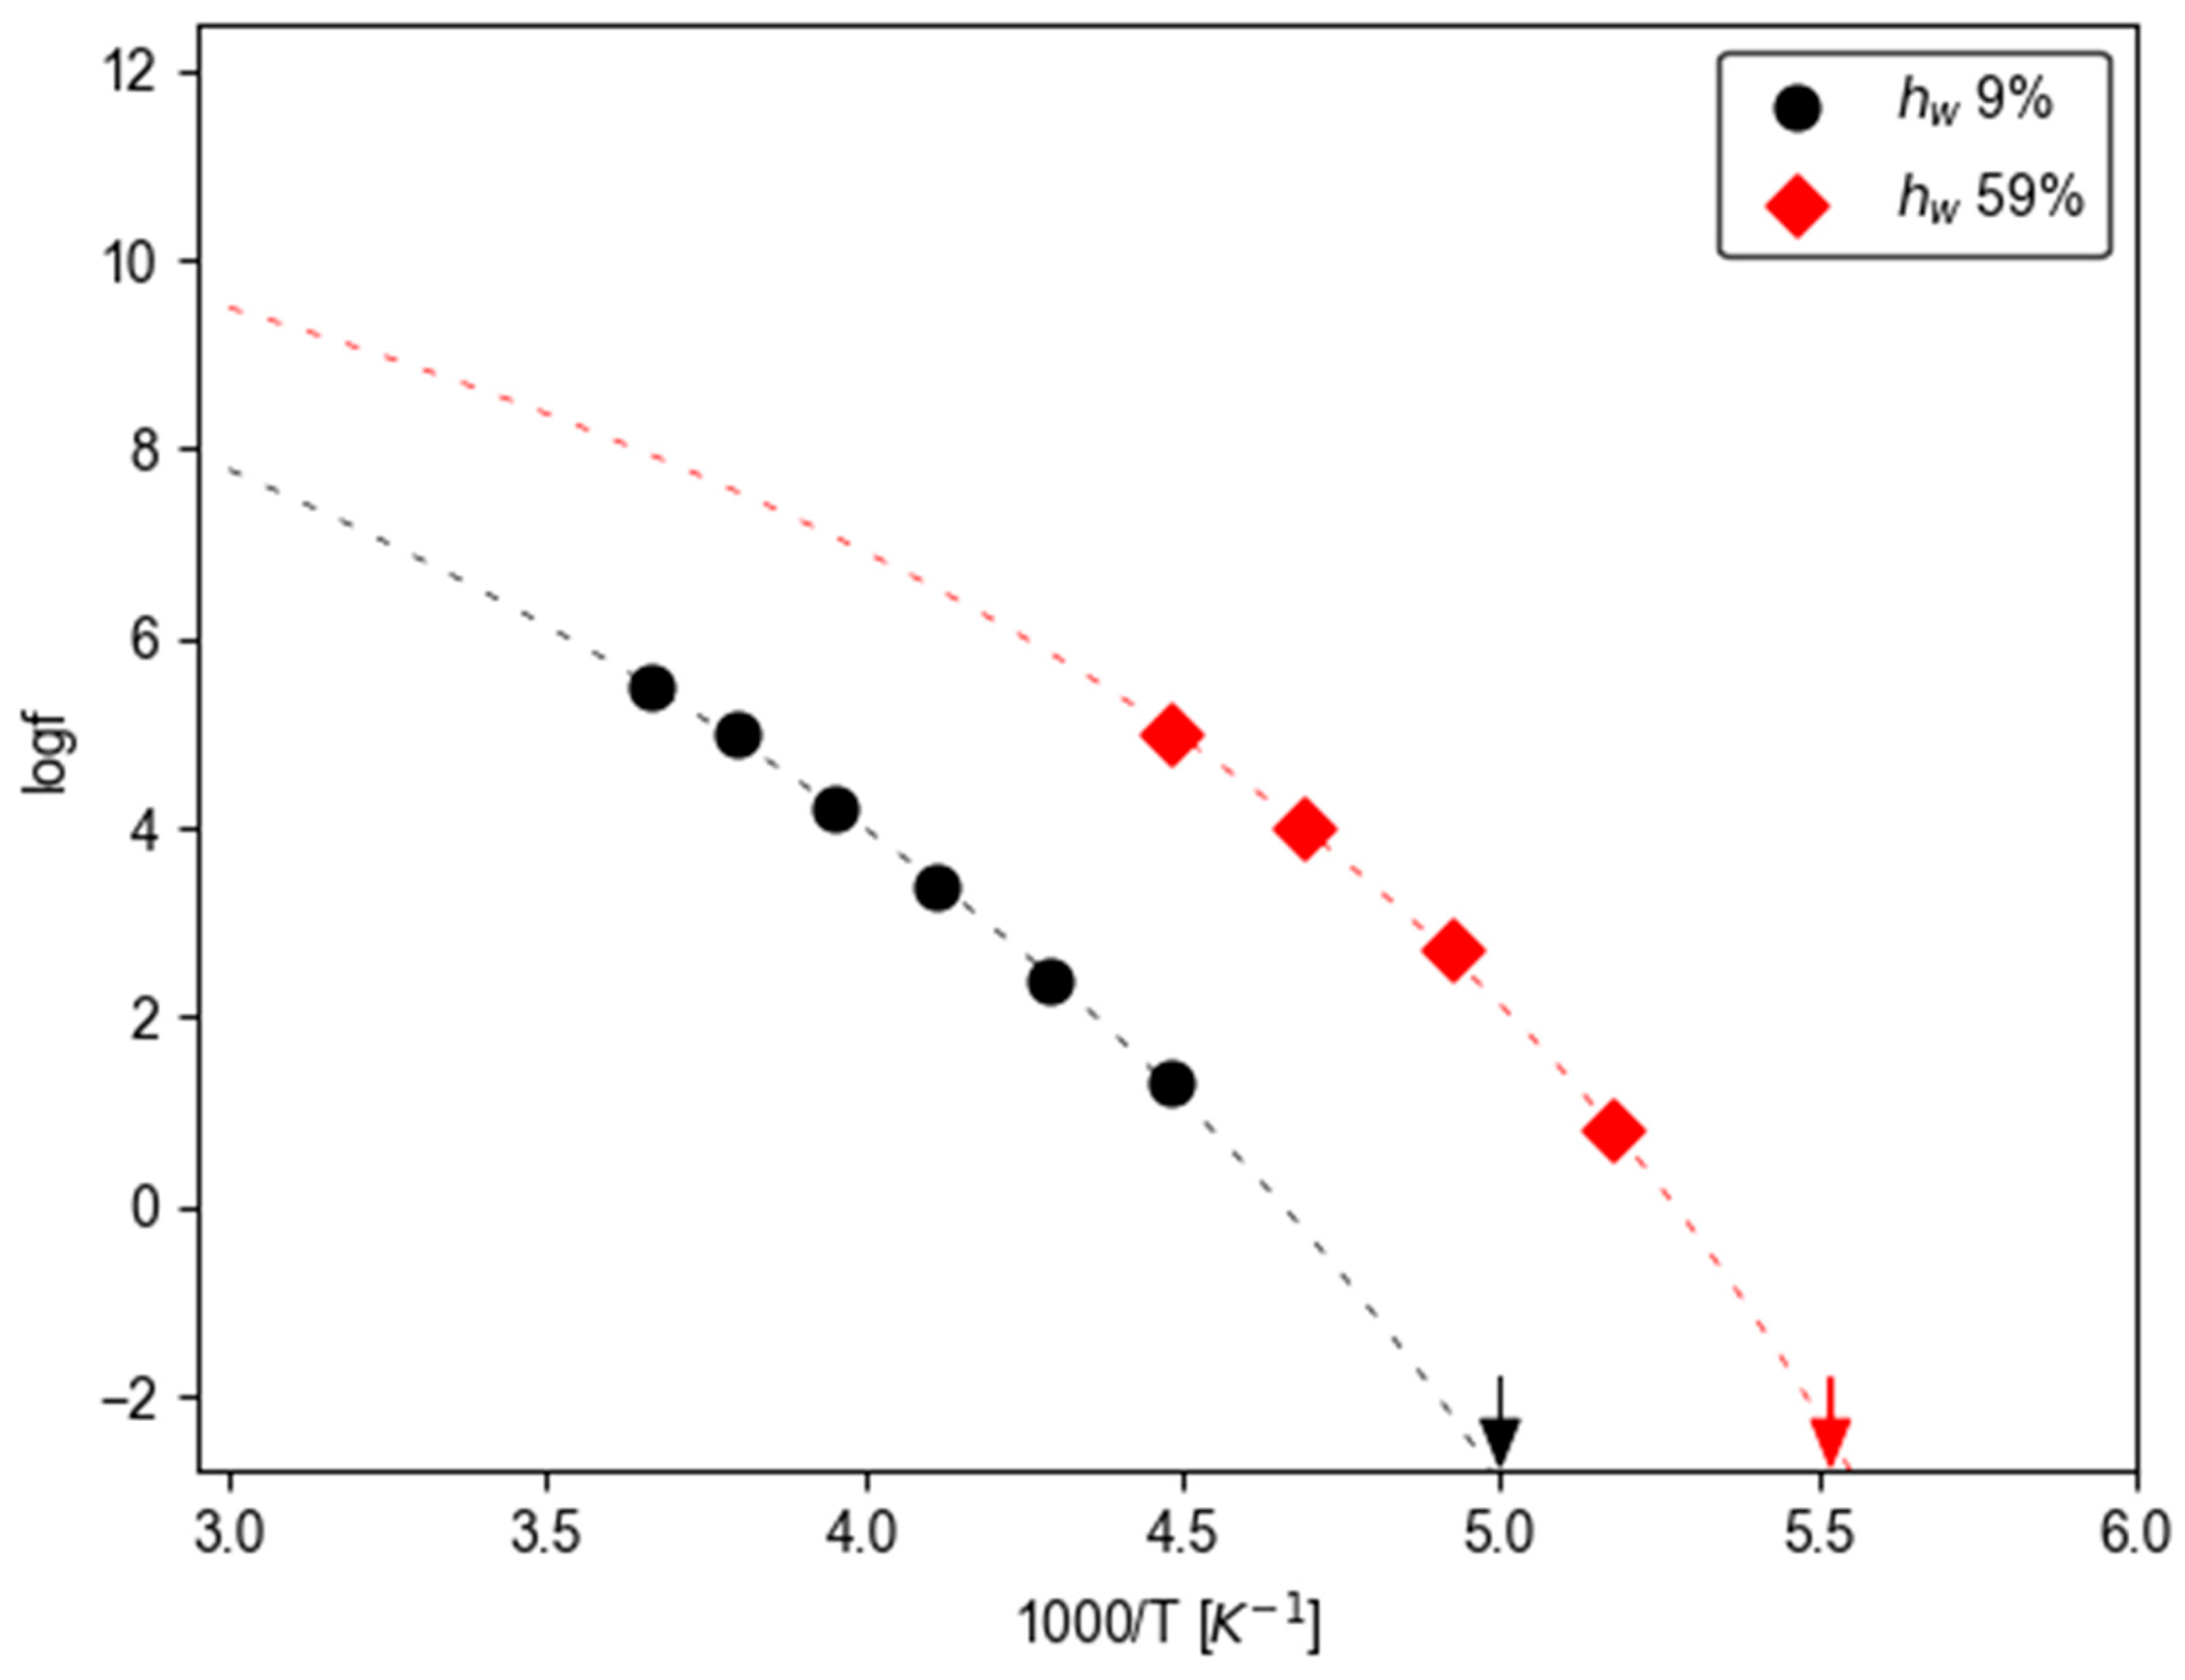
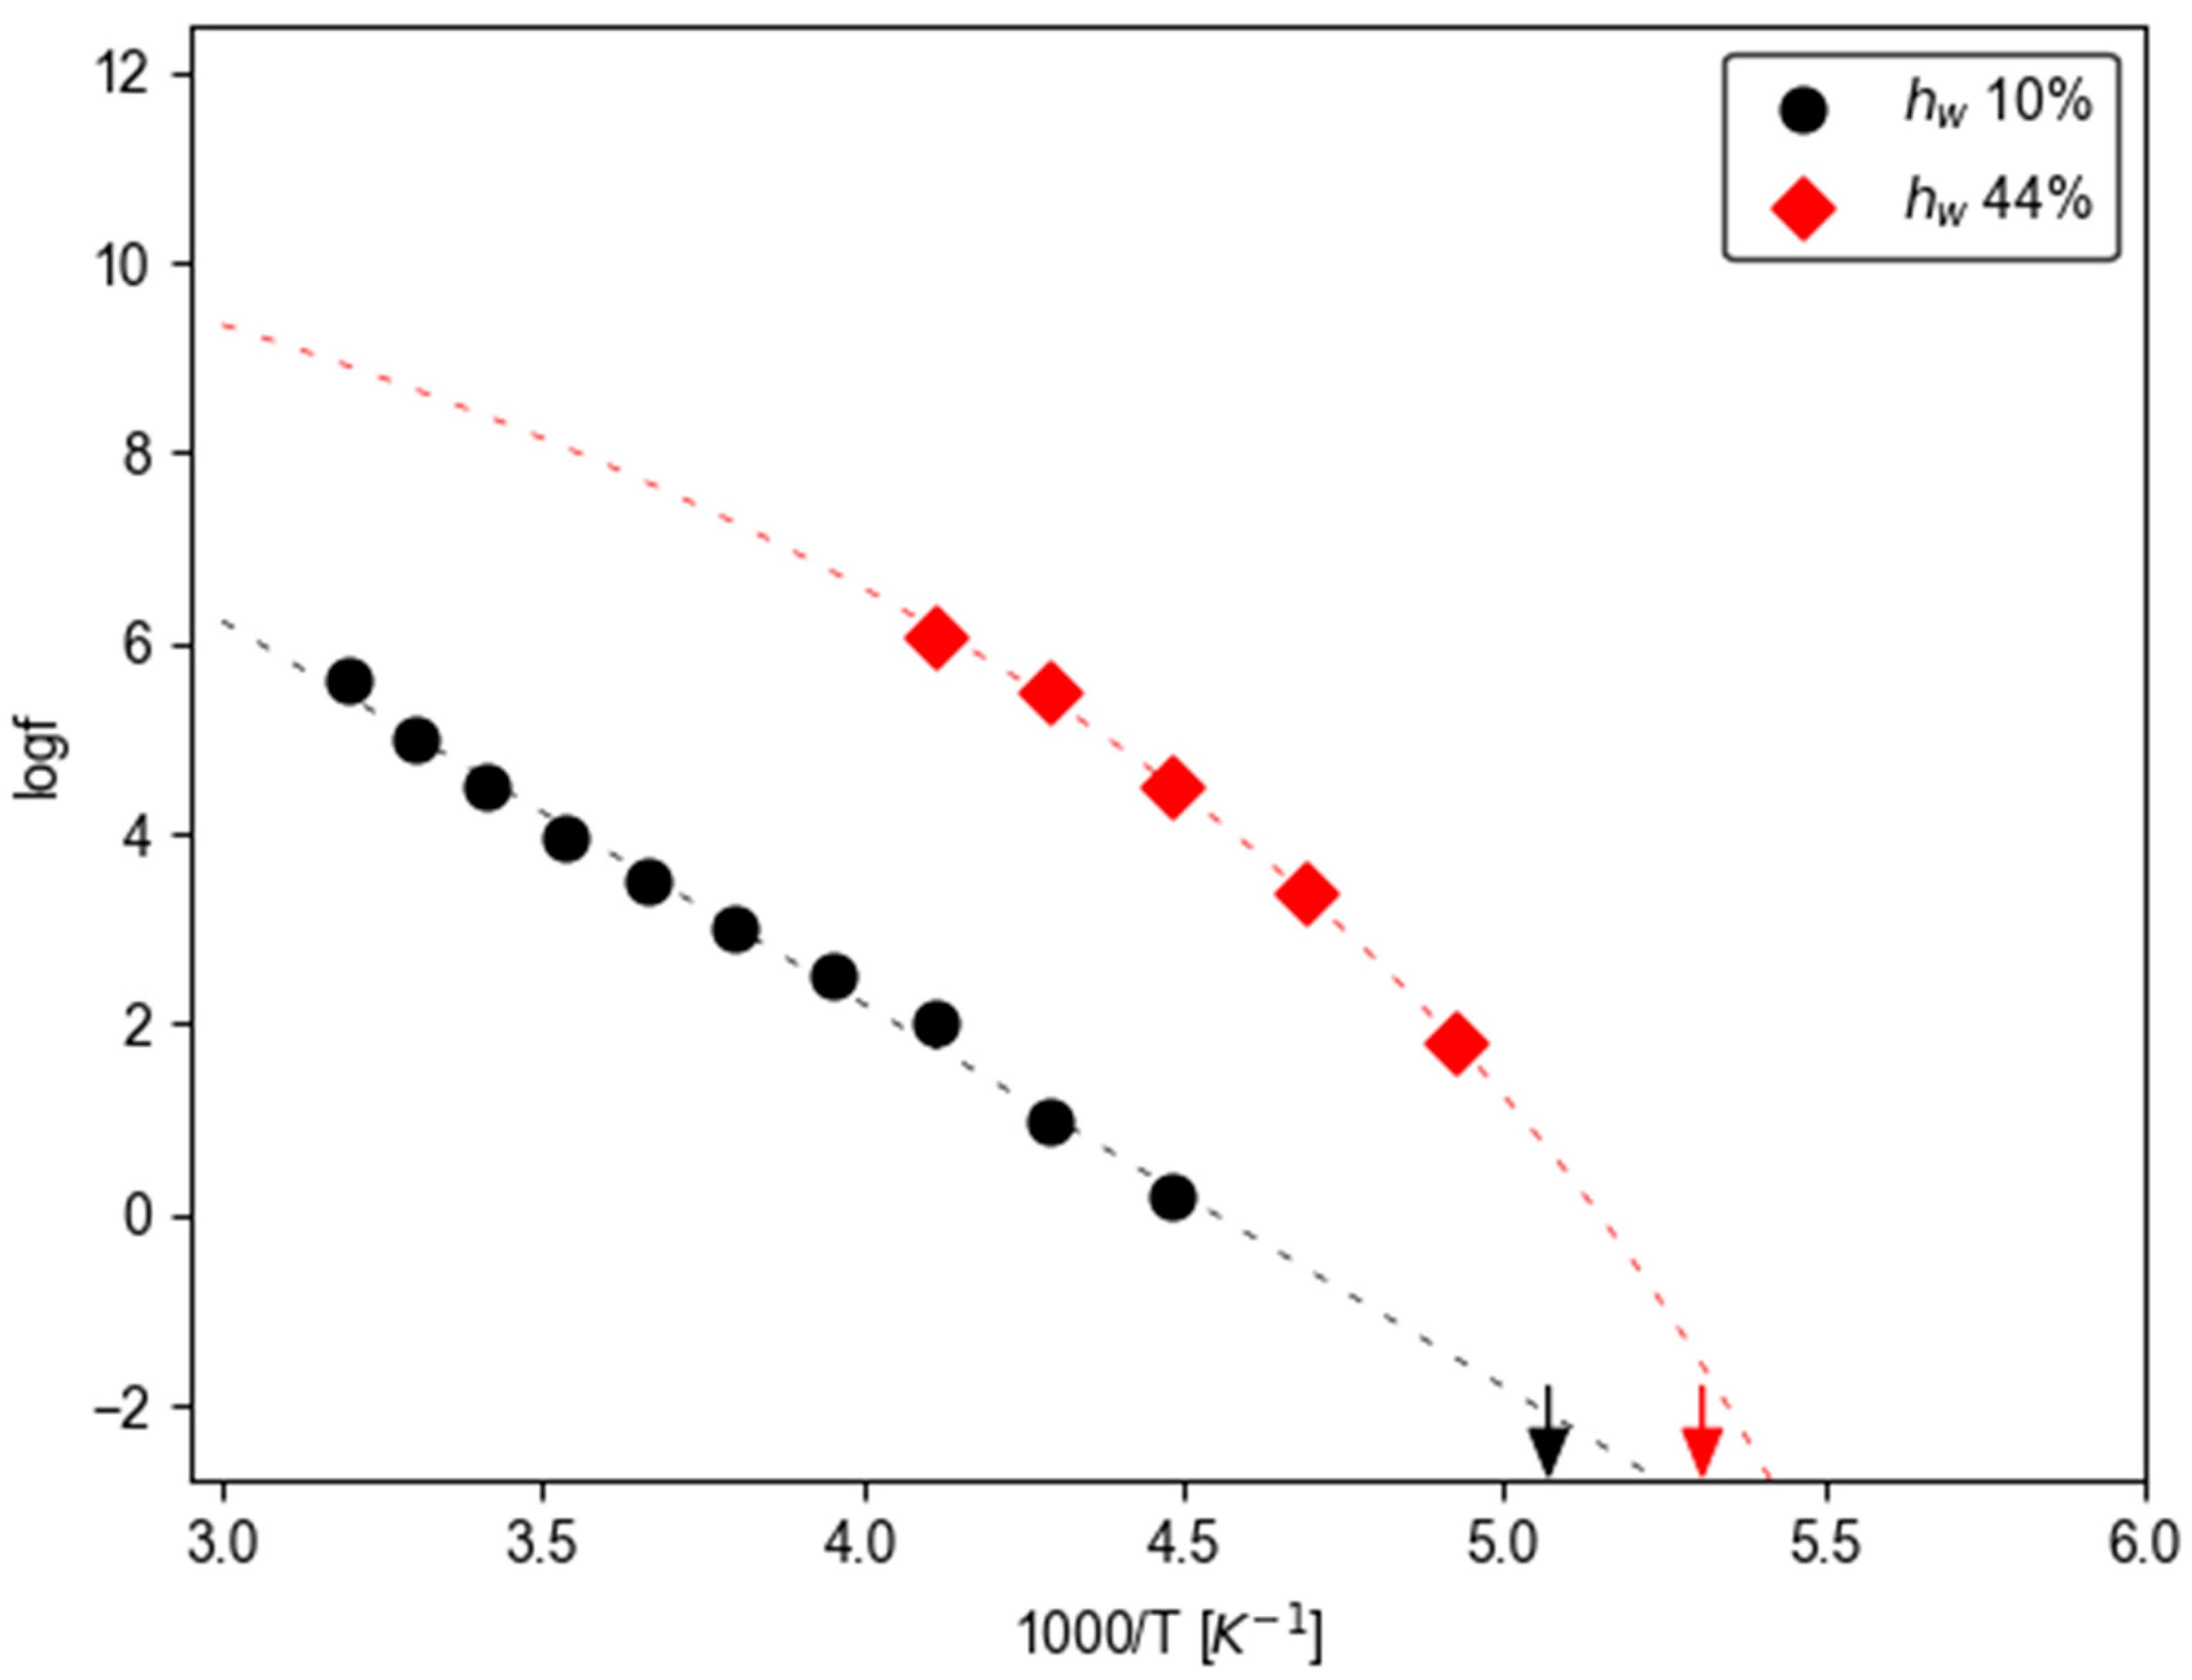
Figure 4 presents the Arrhenius plots of the main relaxation, illustrating its temperature dependence for the ionic liquids [C2C1Pyr]Lev and [C4C1Pyr]Lev. The frequencies (fm) of the ε″ peaks at various temperatures, obtained from the best fit of Equation (1), as described above, were used to construct the plots. As shown in Figure 4, the main relaxation of [C2C1Pyr]Lev samples with 9% and 59% water content, as well as [C4C1Pyr]Lev with 44% water content, follows Vogel–Fulcher–Tammann (VFT) behavior [47,48,49]. An exception is observed for [C4C1Pyr]Lev with 10% water content, which exhibits Arrhenius-type behavior.
Figure 4.
Arrhenius plots of the main α-relaxation, illustrating its temperature dependence for the ionic liquids [C2C1Pyr]Lev (upper panel) and [C4C1Pyr]Lev (lower panel). Arrows indicate the Tg values determined from DSC measurements.
For both ionic liquids at different hydration levels, the main relaxation shifts to higher frequencies at a given temperature as the water content increases across the entire temperature range. This plasticizing effect of water on the main relaxation is likely related to changes in the viscosity of the samples. According to the Debye–Stokes–Einstein relation, the rotational relaxation time of a particle in a liquid medium is directly proportional to viscosity. Although deviations from this relationship have been reported in ionic liquids [50], it has been shown to hold approximately in similar systems [51,52]. Therefore, the observed increase in the peak frequency fm of the main relaxation with increasing water content may be attributed to the corresponding decrease in viscosity.
For the ionic liquid samples exhibiting VFT behavior (Figure 4), the best fit to the experimental results was performed using the empirical VFT equation:
which often describes the non-Arrhenius temperature dependence dynamics of glassy systems. In Equation (2), To is the Vogel temperature, typically located a few tens of Kelvin below the material’s glass transition temperature. fo is the pre-exponential factor, which corresponds to an inverse attempt frequency, and B = DΤο where D is the so-called strength parameter [53]. Parameter D is used to distinguish between strong and fragile glass formers and serves as a measure of the deviation from Arrhenius behavior. Alternatively, the fragility index m is also used for the classification of glass formers. Both parameters are connected via the relation m = 16 + 590/D [54]. Higher values of m (lower values of D) correspond to more fragile temperature characteristics and stronger deviations from Arrhenius behavior. The fits in Figure 3 are extrapolated to logfm = −2.79, which corresponds to the characteristic time τ = 100 s. The temperature at which the relaxation time of the main α-relaxation reaches 100 s is commonly defined as the dielectric glass transition temperature (Tgdiel) [55].
As shown in Figure 4, the Tgdiel values for the [C2C1Pyr]Lev samples are nearly identical to the corresponding Tg values obtained from DSC, whereas those for [C4C1Pyr]Lev are slightly higher (by approximately 3–4 K) compared to the calorimetric Tg. This indicates that, in [C2C1Pyr]Lev, the mobility of the ions involved in the main relaxation closely follows the structural dynamics of the bulk ionic liquid. In contrast, the small shift observed for [C4C1Pyr]Lev points to a slight decoupling between reorientational motion (main relaxation) and the structural relaxation. Consequently, the observed increase in main relaxation’s mobility with increasing hydration is primarily attributed to the corresponding decrease in Tg. Moreover, for [C4C1Pyr]Lev, increasing the water content from 10% to 44% has a more pronounced effect on the shift in the main relaxation frequency fm than the corresponding shift observed for [C2C1Pyr]Lev, despite DSC measurements indicating a larger change in Tg for the latter. This apparent discrepancy suggests that the shift in fm is not governed solely by changes in Tg. Instead, it reflects differences in the temperature dependence of the relaxation dynamics between the two systems. In particular, [C4C1Pyr]Lev exhibits a change in dynamic behavior depending on water content. For the [C4C1Pyr]Lev sample with 10% water content, the experimental data were best described using the Arrhenius equation:
where fo is a pre-exponential factor and E is the activation energy.
Table 2 summarizes the parameters obtained from fitting Equation (2) to the experimental data. The parameters B and To were obtained by nonlinear least-squares fitting of the experimental fm(T) data using Equation (2), while D and m were subsequently calculated using the relations described above. The uncertainties reported in Table 2 correspond to standard errors derived from the regression analysis, combined with error propagation where applicable. The Vogel temperature, To, falls within a narrow range of 135–140 K for all three samples: 9% and 59% water content in [C2C1Pyr]Lev, and 44% water content in [C4C1Pyr]Lev. The lowest fragility index, m = 49, is observed for the sample with the lowest water content (9% [C2C1Pyr]Lev). In contrast, the two samples with higher water contents exhibit larger and nearly identical fragility indices (m = 66 and 67), indicating a stronger deviation from Arrhenius behavior. For the [C4C1Pyr]Lev sample containing 10 wt% water, the activation energy associated with the main relaxation process was determined using Equation (3), yielding a value of E = 0.80 eV.
Table 2.
Parameter values from the VTF equation fits for main relaxation and dc conductivity.
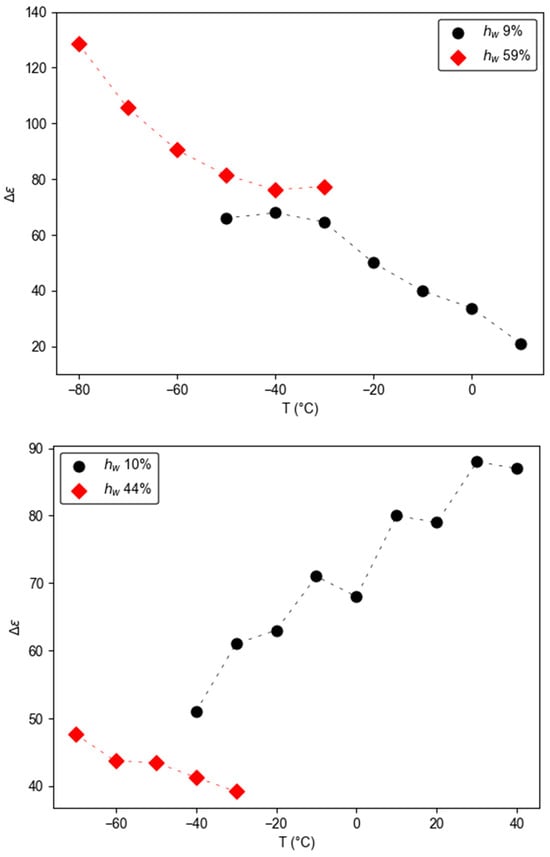
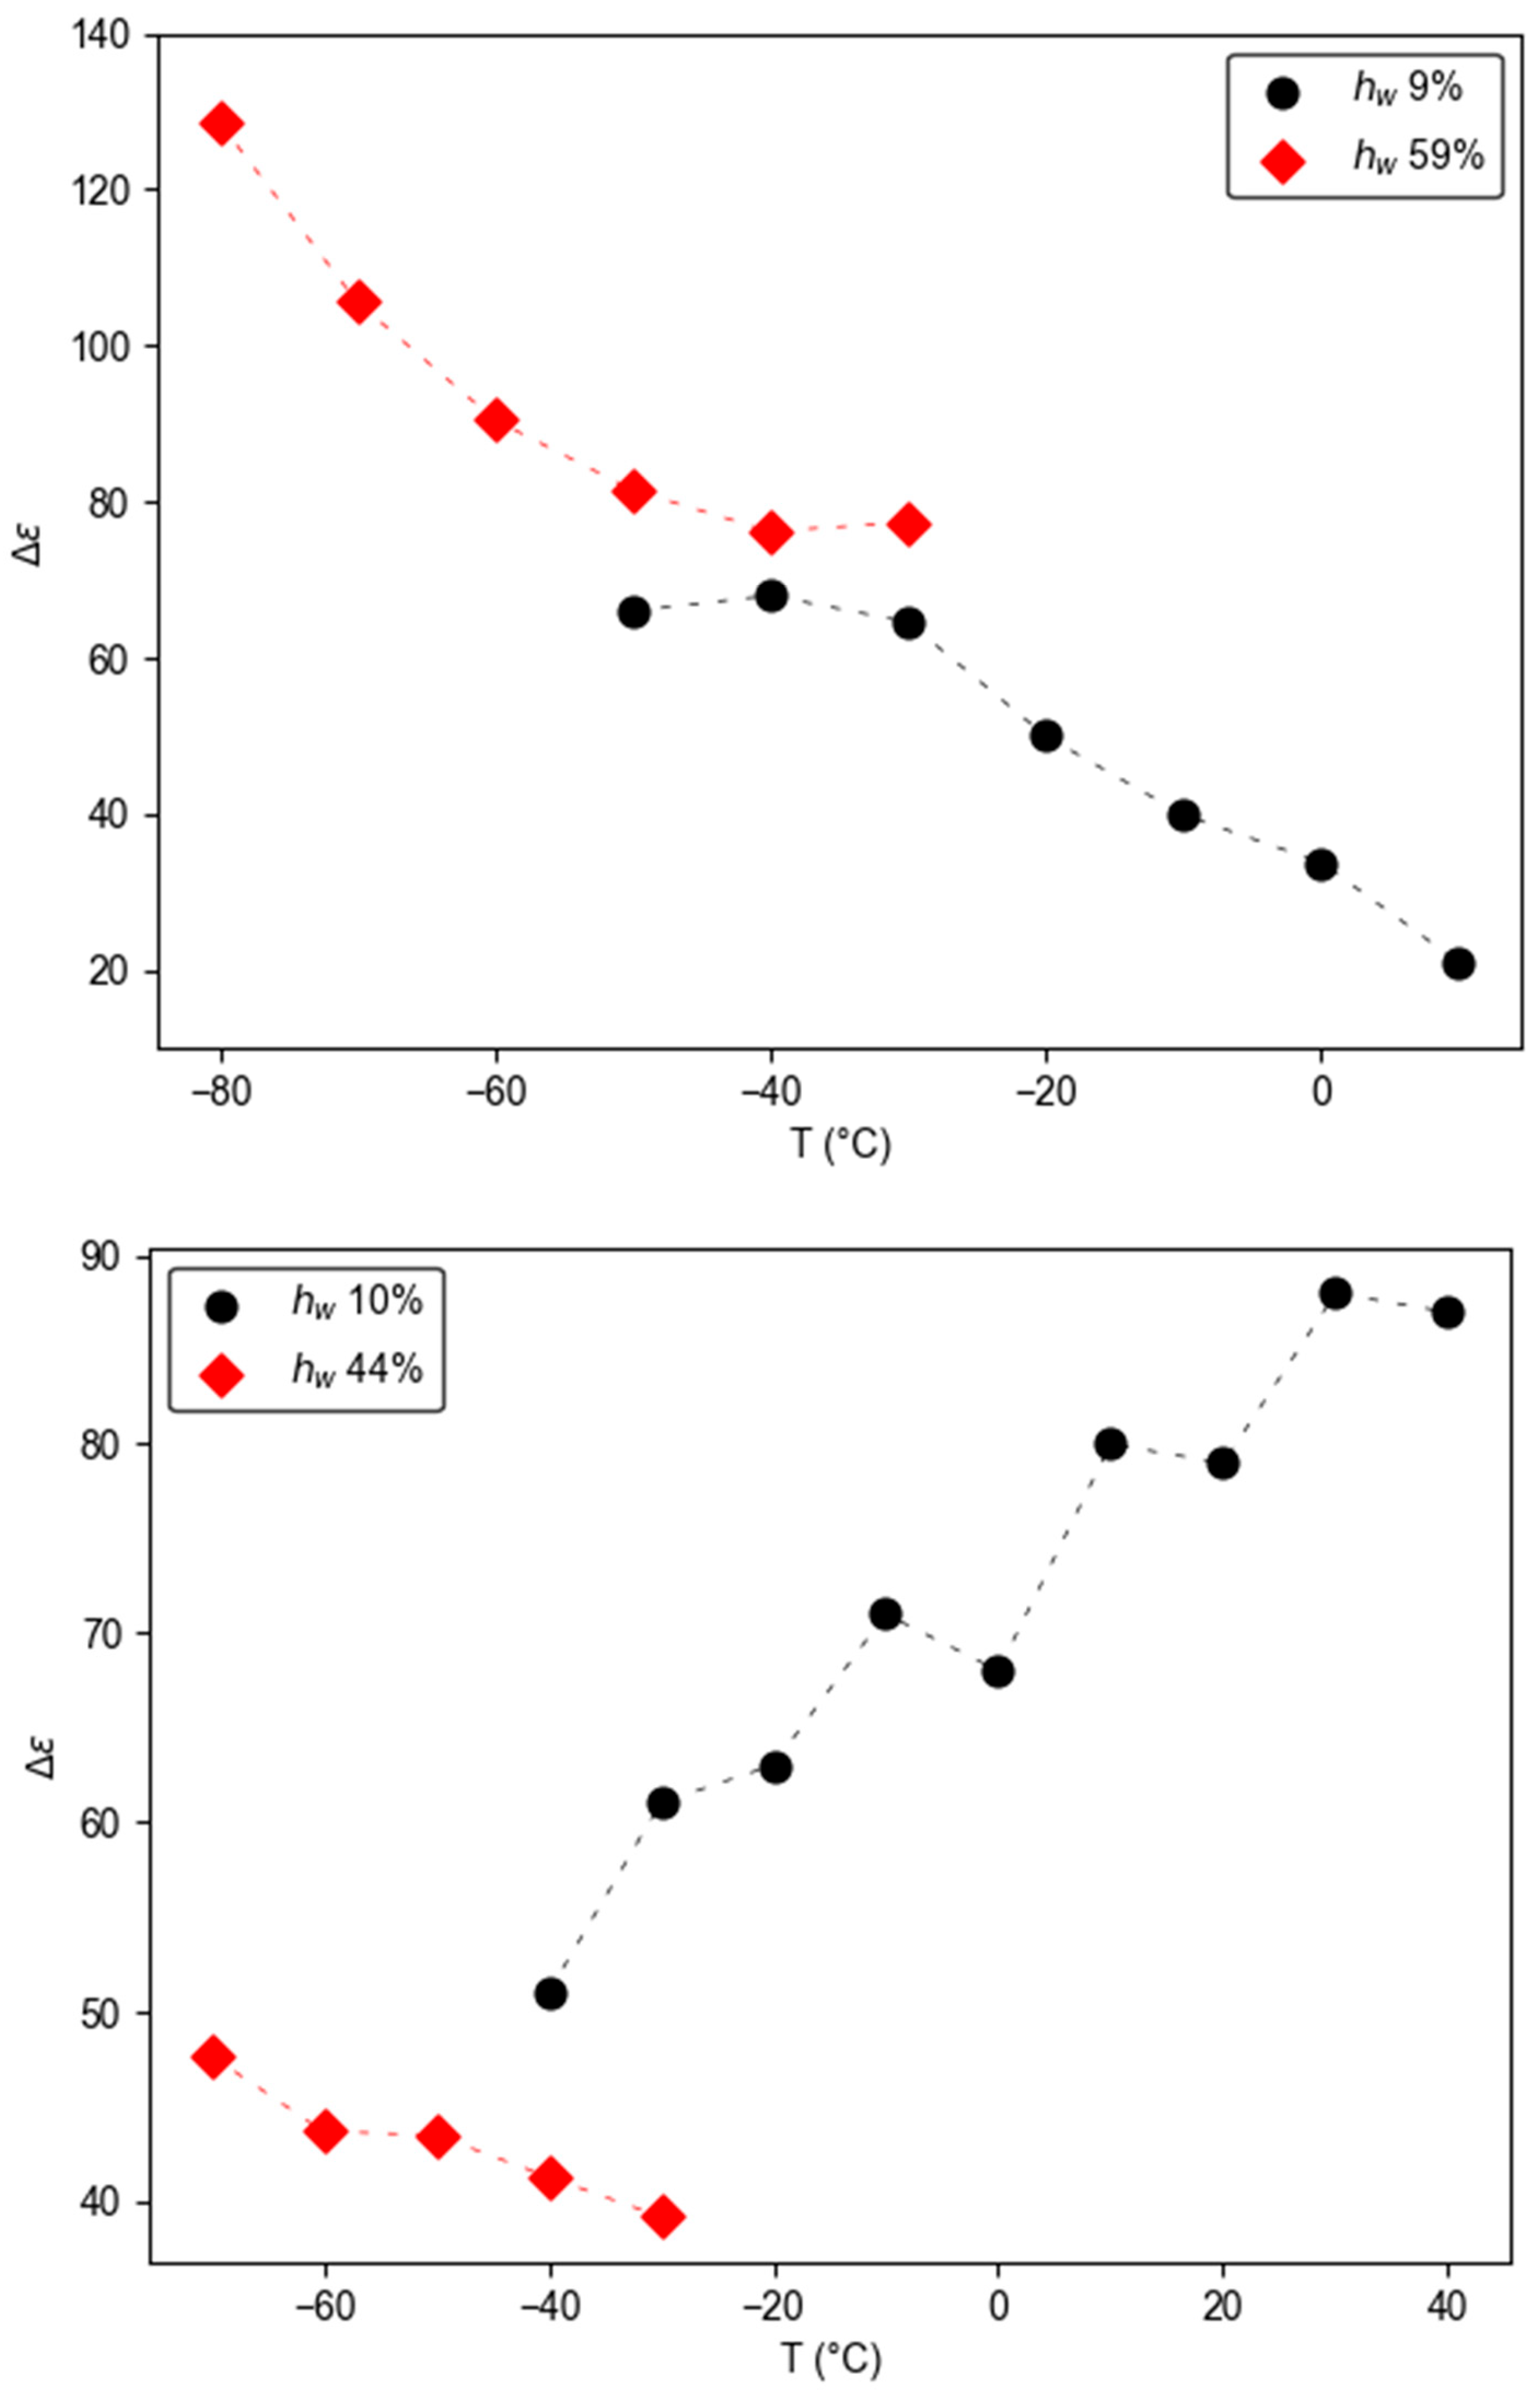
Figure 5 presents the dielectric relaxation strength, Δε, of the main relaxation as a function of temperature for the [C2C1Pyr]Lev and [C4C1Pyr]Lev samples at different hydration levels. For the [C2C1Pyr]Lev samples, Δε decreases with increasing temperature. In contrast, the [C4C1Pyr]Lev sample containing 10 wt% water exhibits an increase in Δε with rising temperature. Moreover, the absolute values of Δε in this sample are significantly higher than those of the 44 wt% [C4C1Pyr]Lev sample, where Δε decreases with temperature, following the same trend observed for the [C2C1Pyr]Lev systems. It should be noted that the dielectric relaxation strength, Δε, is related to the number density of mobile ions and therefore provides insight into changes in ionic mobility and charge carrier concentration [56].
Figure 5.
Dielectric relaxation strength, Δε, of the main relaxation as a function of temperature for the [C2C1Pyr]Lev (upper panel) and [C4C1Pyr]Lev (lower panel) samples.
Regarding the shape of the main relaxation peak, distinct differences are observed depending on the ionic liquid and hydration level. For [C4C1Pyr]Lev at low water content (10 wt%), the peak is nearly symmetric, with β values close to 1, and relatively broad, with α increasing from 0.55 to 0.67 as temperature increases. In contrast, [C2C1Pyr]Lev at 9 wt% water exhibits a more asymmetric peak, with β ≈ 0.6 and α ≈ 0.65. For [C4C1Pyr]Lev at higher hydration (44 wt%), the peak becomes more asymmetric (β ≈ 0.5) and narrower, with α ≈ 0.8. An even stronger asymmetry is observed for [C2C1Pyr]Lev at 59 wt% water, where β decreases to ~0.4 and α approaches 1, indicating a very narrow but highly skewed relaxation peak. The nearly symmetric peak observed for [C4C1Pyr]Lev at low hydration is consistent with its Arrhenius behavior, suggesting a more localized relaxation process. In contrast, the asymmetric peak shapes observed for the other samples are in line with their VFT behavior, indicating broader distributions of relaxation times and more cooperative dynamics.
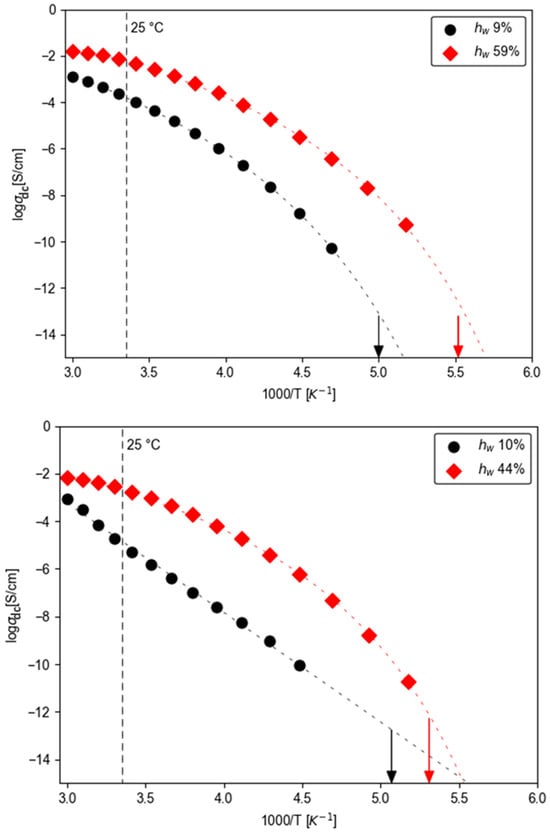
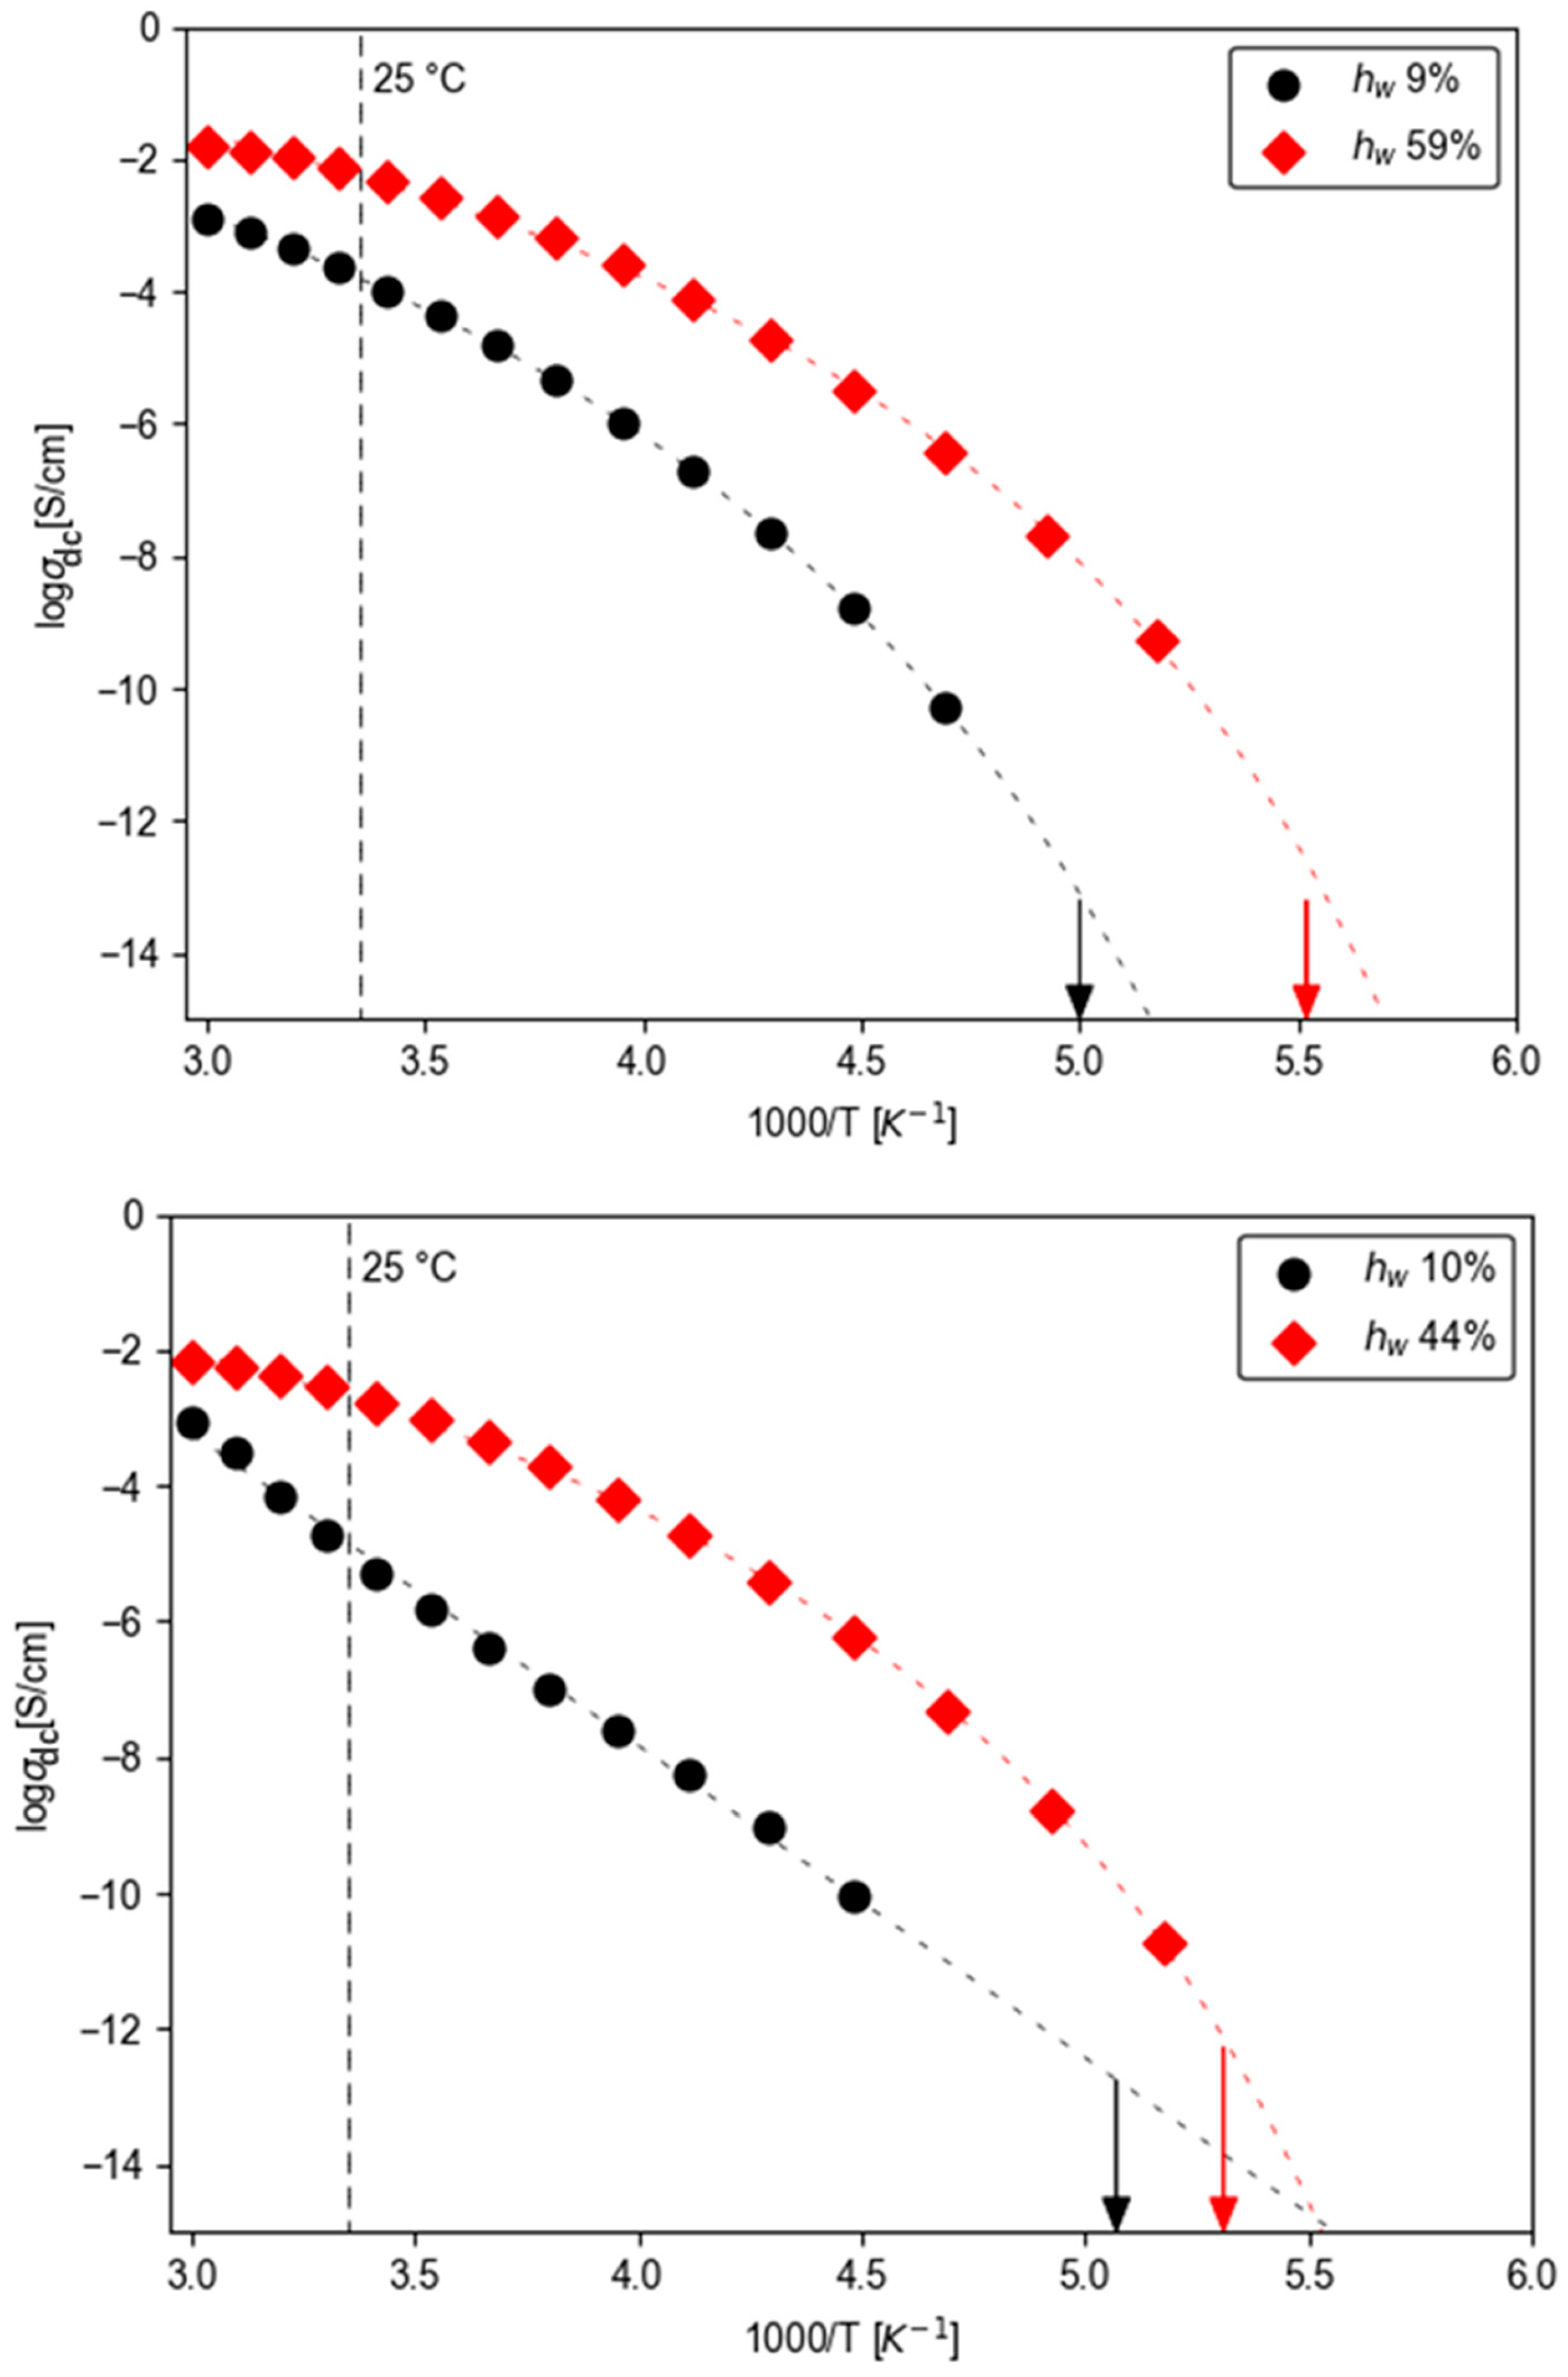
Figure 6 shows the Arrhenius representations of the dc conductivity, highlighting its temperature dependence for the [C2C1Pyr]Lev and [C4C1Pyr]Lev ionic liquids. The dc conductivity values, σdc, were determined directly from the frequency-independent plateaus observed in the real part of the complex conductivity, σ′(f) at each temperature. No fitting procedure was applied; the plateau values were read directly from the experimental data. This approach is commonly used in dielectric studies of ionic liquids and provides a reliable estimation of σdc. With the exception of the 10 wt% [C4C1Pyr]Lev sample, which follows Arrhenius behavior, the remaining three ionic liquid samples exhibit a non-Arrhenius temperature dependence that is well described by the empirical VFT equation:
Figure 6.
Arrhenius plots of dc conductivity, illustrating its temperature dependence for the [C2C1Pyr]Lev (upper panel) and [C4C1Pyr]Lev (lower panel) ionic liquids. The arrows show the Tg values from DSC measurements.
Figure 6 includes the corresponding fits of Equation (4) for the three samples displaying VFT behavior, while for the 10 wt% [C4C1Pyr]Lev sample, the best fit using the Arrhenius expression is presented. The fits (shown in Figure 6) are extrapolated to σdc = 10−15 S/cm. When the conducting species all move at the same rate as the species controlling the structural relaxation, the conductivity at the Tg would be, by the Stokes–Einstein and Nernst–Einstein relations, about σdc = 10−15 S/cm [57].
Table 2 summarizes the parameters obtained from fitting Equation (4) to the experimental data of temperature-dependent conductivity σdc(T) data with the associated errors determined in the same manner as in the case of fm(T) data, described above. The Vogel temperature, To, lies in the range 143–147 K for the three samples: 9% and 59% water content in [C2C1Pyr]Lev and 44% water content in [C4C1Pyr]Lev. The fragility indices (m) calculated from Equation (4) (Table 2) are higher for all ionic liquids than the corresponding m values derived from Equation (2) for the main relaxation dynamics. The lowest fragility index is observed for the sample with the lowest water content (9% [C2C1Pyr]Lev), with m = 64. The two samples with higher water contents exhibit larger and nearly identical fragility values (m = 85 and 86). For the 10 wt% [C4C1Pyr]Lev sample, the activation energy associated with dc conductivity, σdc, was determined to be E = 0.90 eV. In the hydrated ionic liquids examined in the present study, increasing water content results in higher fragility values. In contrast, the opposite trend has been reported for hydrated BMIMCl systems, where higher fragility values were observed at lower water contents [58]. This difference suggests distinct modes of water interaction and structural organization across different ionic liquid systems.
The ionic liquid samples [C2C1Pyr]Lev containing 9% and 59% water and [C4C1Pyr]Lev containing 10% and 44% water exhibit dc conductivity values at their respective glass transition temperatures of 0.8 × 10⁻¹³ S/cm, 2.4 × 10⁻¹³ S/cm, 1.8 × 10⁻¹³ S/cm, and 7.4 × 10⁻¹³ S/cm, respectively. These values are significantly higher than the characteristic value of ~10−15 S/cm expected when ionic motion is coupled to structural relaxation. This finding indicates that although structural mobility is effectively frozen at Tg (as determined by DSC), a residual ionic mobility persists and continues to contribute to charge transport. Therefore, the translational ionic motion in the hydrated ionic liquids studied here appears to be decoupled from the structural relaxation process.
Similar decoupling behavior between ionic transport and structural relaxation has been reported in several ionic liquid systems [50,58,59,60]. It should be noted, however, that in lidocaine-based ionic liquids, no decoupling between ionic motion and structural relaxation was observed over a range of water contents [25]. These contrasting findings further emphasize that the interaction and structural organization of water within ionic liquids are highly system-dependent, leading to distinct coupling or decoupling behaviors between translational ionic motion and structural relaxation.
The dc conductivity at 25 °C, a key parameter for practical ionic liquid applications, increases with increasing water content in both ionic liquid systems. For the [C2C1Pyr]Lev ionic liquid, the conductivity rises by approximately one order of magnitude as the water content increases from 9% to 59%, reaching values on the order of 10−4 S/cm (9% sample) and 10−3 S/cm (59% sample). In the case of the [C4C1Pyr]Lev ionic liquid, the effect of water is even more pronounced. The 44% sample exhibits a conductivity at 25 °C of about 10−3 S/cm, nearly two orders of magnitude higher than that of the 10% sample (≈10−5 S/cm). Thus, the enhancement of conductivity induced by water is significantly stronger in [C4C1Pyr]Lev than in [C2C1Pyr]Lev. As discussed in [61] the conductivity at 25 °C is governed by both the glass transition temperature (Tg) and the fragility index (m). In agreement with this relationship, the 10% [C4C1Pyr]Lev sample—characterized by a relatively high Tg, Arrhenius-type temperature dependence, and consequently a low m value—exhibits the lowest dc conductivity at 25 °C. In contrast, the 59% [C2C1Pyr]Lev sample, which combines a lower Tg with a higher fragility index, shows the highest dc conductivity at the same temperature.
4. Conclusions
In the present work, the effect of water on the dynamics and conductivity of [C2C1Pyr]Lev and [C4C1Pyr]Lev ionic liquids was investigated. It was found that the water content is a key factor controlling the dynamics and conductivity of ionic liquids, with effects that depend critically on the cation structure. The main results are summarized as follows:
Plasticizing Effect: For both ionic liquids, water acts as a plasticizer, effectively decreasing the glass transition temperature (Tg). The cation structure significantly influences the degree of Tg plasticization, which is more pronounced in the [C2C1Pyr] cation compared to [C4C1Pyr]. This suggests that the alkyl-chain length of the cation plays a critical role in water organization and its interaction with the ionic liquid matrix.
Relaxation Dynamics: The temperature dynamics of the main relaxation and DC conductivity exhibit Vogel–Fulcher–Tammann (VFT) behavior in all samples, with the exception of the [C4C1Pyr]Lev sample with 10% water content, which follows Arrhenius behavior.
Dielectric Strength: The dielectric strength (Δε) of the main relaxation decreases with increasing temperature for most samples. However, the [C4C1Pyr]Lev sample with 10% water content exhibits an increase in Δε with temperature.
Ion Mobility and Coupling: At Tg, as extracted from DSC measurements, the DC conductivity values for all samples are noticeably higher than the expected value of 10−15 S/cm. This discrepancy indicates that while structural mobility is frozen at Tg, there is still notable ionic movement, proving that translational ionic motion in these hydrated systems is decoupled to the structural relaxation measured by DSC.
Fragility Index: In all studied samples, higher water content leads to increased fragility index (m) values.
Conductivity at 25 °C: The DC conductivity at room temperature is determined by the synergy between Tg and the fragility index m. The 10% [C4C1Pyr]Lev sample (high Tg, Arrhenius behavior, lowest m) exhibits the lowest conductivity at 25 °C, whereas the 59% [C2C1Pyr]Lev sample (low Tg, high m) shows the highest conductivity.
These results can be explained by the differing roles of water in the two ionic liquids. In [C2C1Pyr]Lev, water integrates into the ionic network, supporting structural integrity and enabling efficient ion transport. In [C4C1Pyr]Lev, water disrupts the packing of the long alkyl chains, reducing the number of ions actively participating in the main relaxation and decoupling ionic motion. This molecular-level distinction accounts for the observed differences in Δε, Tg, fragility, and conductivity, highlighting the crucial influence of cation architecture on hydration effects. These insights provide mechanistic guidance for the rational design of IL-based electrolytes under non-anhydrous conditions.
In conclusion, water content is a critical parameter that drastically affects the dielectric and electrical properties of ionic liquids. The molecular structure of the ionic liquid components plays a decisive role in both the organization of water and the nature of the resulting interactions.
Author Contributions
Conceptualization and visualization were the responsibility of G.T., G.M. and S.K.; investigation and methodology were performed by G.T., G.M., S.K., L.G. (Lorenzo Guazzelli), L.G. (Luca Guglielmero), I.S., K.M. and C.T.; validation and data analysis were performed by G.T., G.M. and S.K.; writing and editing were performed by G.T. and S.K. All authors have read and agreed to the published version of the manuscript.
Funding
This research received no external funding.
Institutional Review Board Statement
Not applicable.
Informed Consent Statement
Not applicable.
Data Availability Statement
Data are available upon reasonable request.
Conflicts of Interest
The authors declare no conflicts of interest.
References
- Lei, Z.; Chen, B.; Koo, Y.-M.; MacFarlane, D.R. Introduction: Ionic Liquids. Chem. Rev. 2017, 117, 6633–6635. [Google Scholar] [CrossRef] [Scilit]
- Lei, Z.; Dai, C.; Hallet, J.; Shiflett, M. Introduction: Ionic Liquids for Diverse Applications. Chem. Rev. 2024, 124, 7533–7535. [Google Scholar] [CrossRef] [Scilit]
- Watanabe, M.; Thomas, M.L.; Zhang, S.; Ueno, K.; Yasuda, T.; Dokko, K. Application of Ionic Liquids to Energy Storage and Conversion Materials. Electrochim. Acta 2017, 235, 633–642. [Google Scholar] [CrossRef] [Scilit] [PubMed]
- Tang, X.; Lv, S.; Jiang, K.; Zhou, G.; Liu, X. Recent Development of Ionic Liquid-Based Electrolytes in Lithium-Ion Batteries. J. Power Sources 2022, 542, 231792. [Google Scholar] [CrossRef] [Scilit]
- Matuszek, K.; Piper, S.L.; Brzeczek-Szafran, A.; Roy, B.; Saher, S.; Pringle, J.M.; MacFarlane, D.R. Unexpected Energy Applications of Ionic Liquids. Adv. Mater. 2024, 36, 2313023. [Google Scholar] [CrossRef] [Scilit]
- Noda, A.; Susan, M.A.B.H.; Kudo, K.; Mitsushima, S.; Hayamizu, K.; Watanabe, M. Brønsted Acid–Base Ionic Liquids as Proton-Conducting Nonaqueous Electrolytes. J. Phys. Chem. B 2003, 107, 4024–4033. [Google Scholar] [CrossRef] [Scilit]
- Armand, M.; Endres, F.; MacFarlane, D.R.; Ohno, H.; Scrosati, B. Ionic-Liquid Materials for the Electrochemical Challenges of the Future. Nat. Mater. 2009, 8, 621–629. [Google Scholar] [CrossRef] [Scilit]
- MacFarlane, D.R.; Tachikawa, N.; Forsyth, M.; Pringle, J.M.; Howlett, P.C.; Elliott, G.D.; Davis, J.H.; Watanabe, M.; Simon, P.; Angell, C.A. Energy Applications of Ionic Liquids. Energy Environ. Sci. 2014, 7, 232–250. [Google Scholar] [CrossRef] [Scilit]
- Gao, X.; Wu, F.; Mariani, A.; Passerini, S. Concentrated Ionic-Liquid-Based Electrolytes for High-Voltage Lithium Batteries with Improved Performance at Room Temperature. ChemSusChem 2019, 12, 4185–4193. [Google Scholar] [CrossRef] [Scilit] [PubMed]
- Ma, Χ.; Yu, J.; Hu, Y.; Texter, J.; Yan, F. Ionic liquid/poly(ionic liquid)-based electrolytes for lithium batteries. Ind. Chem. Mater. 2023, 1, 39–59. [Google Scholar] [CrossRef] [Scilit]
- Cao, Y.; Chena, Y.; Sun, X.; Zhanga, Z.; Mu, T. Water sorption in ionic liquids: Kinetics, mechanisms and hydrophilicity. Phys. Chem. Chem. Phys. 2012, 14, 12252–12262. [Google Scholar] [CrossRef] [Scilit]
- Di Francesco, F.; Calisi, N.; Creatini, M.; Melai, B.; Salvo, P.; Chiappe, C. Water sorption by anhydrous ionic liquids. Green Chem. 2011, 13, 1712–1717. [Google Scholar] [CrossRef] [Scilit]
- Freire, M.G.; Neves, C.M.S.S.; Marrucho, I.M.; Coutinho, J.A.P.; Fernandes, A.M. Hydrolysis of Tetrafluoroborate and Hexafluorophosphate Counterions in Imidazolium-Based Ionic Liquids. J. Phys. Chem. A 2010, 114, 3744–3749. [Google Scholar] [CrossRef] [Scilit]
- Ma, C.; Laaksonen, A.; Liu, C.; Lu, X.; Ji, X. The peculiar effect of water on ionic liquids and deep eutectic solvents. Chem. Soc. Rev. 2018, 47, 8685–8720. [Google Scholar] [CrossRef] [Scilit]
- Ausín, D.; Parajó, J.J.; Trenzado, J.L.; Varela, L.M.; Cabeza, O.; Segade, L. Influence of Small Quantities of Water on the Physical Properties of Alkylammonium Nitrate Ionic Liquids. Int. J. Mol. Sci. 2021, 22, 7334. [Google Scholar] [CrossRef] [Scilit] [PubMed]
- Rodriguez, H.; Brennecke, J.F. Temperature and composition dependence of the density and viscosity of binary mixtures of water plus ionic liquid. J. Chem. Eng. Data 2006, 51, 2145–2155. [Google Scholar] [CrossRef] [Scilit]
- Andanson, J.-M.; Meng, X.; Traïkia, M.; Husson, P. Quantification of the impact of water as an impurity on standard physico-chemical properties of ionic liquids. J. Chem. Thermodyn. 2016, 94, 169–176. [Google Scholar] [CrossRef] [Scilit]
- Grishina, E.P.; Ramenskaya, L.M.; Gruzdev, M.S.; Kraeva, O.V. Water effect on physicochemical properties of 1-butyl-3-methylimidazolium based ionic liquids with inorganic anions. J. Mol. Liq. 2013, 177, 267–272. [Google Scholar] [CrossRef] [Scilit]
- Widegren, J.A.; Laesecke, A.; Magee, J.W. The effect of dissolved water on the viscosities of hydrophobic room-temperature ionic liquids. Chem. Commun. 2005, 12, 1610–1612. [Google Scholar] [CrossRef] [Scilit] [PubMed]
- Domańska, U.; Królikowska, M. Density and viscosity of binary mixtures of thiocyanate ionic liquids plus water as a function of temperature. J. Solut. Chem. 2012, 41, 1422–1445. [Google Scholar] [CrossRef] [Scilit]
- Liu, W.W.; Cheng, L.Y.; Zhang, Y.M.; Wang, H.P.; Yu, M.F. The physical properties of aqueous solution of room-temperature ionic liquids based on imidazolium: Database and evaluation. J. Mol. Liq. 2008, 140, 68–72. [Google Scholar] [CrossRef] [Scilit]
- Lopes, J.N.C.; Gomes, M.F.C.; Husson, P.; Padua, A.A.H.; Rebelo, L.P.N.; Sarraute, S.; Tariq, M. Polarity, viscosity, and ionic conductivity of liquid mixtures containing [C4C1im][Ntf2] and a molecular component. J. Phys. Chem. B 2011, 115, 6088–6099. [Google Scholar] [CrossRef] [Scilit]
- Danten, Y.; Cabaco, M.I.; Besnard, M. Interaction of water diluted in 1-butyl-3-methyl imidazolium ionic liquids by vibrational spectroscopy modeling. J. Mol. Liq. 2010, 153, 57–66. [Google Scholar] [CrossRef] [Scilit]
- Shekaari, H.; Mousavi, S.S.; Mansoori, Y. Thermophysical properties of ionic liquid, 1-pentyl-3-methylimidazolium chloride in water at different temperatures. Int. J. Thermophys. 2009, 30, 499–514. [Google Scholar] [CrossRef] [Scilit]
- Wojnarowska, Z.; Grzybowska, K.; Hawelek, L.; Święty-Pośpiech, A.; Masiewicz, E.; Paluch, M.; Sawicki, W.; Chmielewska, A.; Bujak, P.; Markowski, J. Molecular Dynamics and Glass Transition Behavior in Ionic Liquids. Mol. Pharm. 2012, 9, 1250–1261. [Google Scholar] [CrossRef] [Scilit]
- Sippel, P.; Dietrich, V.; Reuter, D.; Aumüller, M.; Lunkenheimer, P.; Loidl, A.; Krohns, S. Impact of water on the charge transport of a glass-forming ionic liquid. J. Mol. Liq. 2016, 223, 635–642. [Google Scholar] [CrossRef] [Scilit]
- Bester-Rogac, M.; Stoppa, A.; Hunger, J.; Hefter, G.; Buchner, R. Electrical Conductivity and Permittivity of Ionic Liquids. Phys. Chem. Chem. Phys. 2011, 13, 17588–17598. [Google Scholar] [PubMed]
- Mero, A.; Guglielmero, L.; D’Andrea, F.; Pomelli, C.S.; Guazzelli, L.; Koutsoumpos, S.; Tsonos, G.; Stavrakas, I.; Moutzouris, K.; Mezzetta, A. Influence of the cation partner on levulinate ionic liquids properties. J. Mol. Liq. 2022, 354, 118850. [Google Scholar] [CrossRef] [Scilit]
- Shahriari, S.; Tomé, L.C.; Araújo, J.M.M.; Rebelo, L.P.N.; Coutinho, J.A.P.; Marrucho, I.M.; Freire, M.G. Aqueous biphasic systems: A benign route using cholinium-based ionic liquids. RSC Adv. 2013, 3, 1835–1843. [Google Scholar] [CrossRef] [Scilit]
- Avila, J.; Lepre, L.F.; Santini, C.C.; Tiano, M.; Denis-Quanquin, S.; Szeto, K.C.; Padua, A.A.H.; Gomes, M.C. High-Performance Porous Ionic Liquids for Low-Pressure CO2 Capture. Angew. Chem. Int. Ed. 2021, 60, 12876–12882. [Google Scholar] [CrossRef] [Scilit]
- Mezzetta, A.; Becherini, S.; Pretti, C.; Monni, G.; Casu, V.; Chiappe, C.; Guazzelli, L. Insights into the levulinate-based ionic liquid class: Synthesis, cellulose dissolution evaluation and ecotoxicity assessment. New J. Chem. 2019, 43, 13010. [Google Scholar] [CrossRef] [Scilit]
- Boissou, F.; Mühlbauer, A.; Vigier, K.D.O.; Leclercq, L.; Kunz, W.; Marinkovic, S.; Estrine, B.; Nardello-Rataj, V.; Jérôme, F. Transition of cellulose crystalline structure in biodegradable mixtures of renewably-sourced levulinate alkyl ammonium ionic liquids, γ-valerolactone and water. Green Chem. 2014, 16, 2463–2471. [Google Scholar] [CrossRef] [Scilit]
- Saha, D.; Mukherjee, A. Effect of water and ionic liquids on biomolecules. Biophys. Rev. 2018, 10, 795–808. [Google Scholar] [CrossRef] [Scilit] [PubMed]
- Lim, J.R.; Chua, L.S.; Mustaffa, A.A. Ionic liquids as green solvent and their applications in bioactive compounds extraction from plants. Process Biochem. 2022, 122, 292–306. [Google Scholar] [CrossRef] [Scilit]
- Palumbo, O.; Trequattrini, F.; Brubach, J.-B.; Roy, P.; Paolone, A. Crystallization of mixtures of hydrophilic ionic liquids and water: Evidence of microscopic inhomogeneities. J. Colloid Interface Sci. 2019, 552, 43–50. [Google Scholar] [CrossRef] [Scilit]
- Gomes, G.C.; Ferdeghini, C.; Guglielmero, L.; D’Andrea, F.; Guazzelli, L.; Mezzetta, A.; Pomelli, C.S. A Combined Experimental/Computational Study of Dicationic Ionic Liquids with Bromide and Tungstate Anions. Molecules 2024, 29, 2131. [Google Scholar] [CrossRef] [Scilit] [PubMed]
- Sturlaugson, A.L.; Fruchey, K.S.; Fayer, M.D. Orientational Dynamics of Room Temperature Ionic Liquid/Water Mixtures: Water-Induced Structure. J. Phys. Chem. B 2012, 116, 1777–1787. [Google Scholar] [CrossRef] [Scilit] [PubMed]
- Jacquemin, J.; Husson, P.; Padua, A.A.H.; Majer, V. Density and Viscosity of Several Pure and Water-Saturated Ionic Liquids. Green Chem. 2006, 8, 172–180. [Google Scholar] [CrossRef] [Scilit]
- Huddleston, J.G.; Visser, A.E.; Reichert, W.M.; Willauer, H.D.; Broker, G.A.; Rogers, R.D. Characterization and Comparison of Hydrophilic and Hydrophobic Room Temperature Ionic Liquids Incorporating the Imidazolium Cation. Green Chem. 2001, 3, 156–164. [Google Scholar] [CrossRef] [Scilit]
- Thomaz, J.E.; Lawler, C.M.; Fayeret, M.D. The influence of water on the alkyl region structure in variable chain length imidazolium-based ionic liquid/water mixtures. J. Phys. Chem. B 2016, 120, 10350–10357. [Google Scholar] [CrossRef] [Scilit]
- Wuebbenhorst, M.; van Turnhout, J. Analysis of complex dielectric spectra. I. one-dimensional derivative techniques and three-dimensional modelling. J. Non-Cryst. Solids. 2002, 305, 40–49. [Google Scholar] [CrossRef] [Scilit]
- Johari, G.P.; Goldstein, M. Viscous liquids and the glass transition. II. Secondary relaxations in glasses of rigid molecules. J. Chem. Phys. 1970, 53, 2372–2388. [Google Scholar] [CrossRef] [Scilit]
- Kastner, S.; Köhler, M.; Goncharov, Y.; Lunkenheimer, P.; Loidl, A. High-frequency dynamics of type-B glass formers investigated by broadband dielectric spectroscopy. J. Non-Cryst. Solids. 2011, 357, 510–514. [Google Scholar] [CrossRef] [Scilit]
- Lunkenheimer, P.; Bobnar, V.; Pronin, A.V.; Ritus, A.I.; Volkov, A.A.; Loidl, A. Origin of apparent colossal dielectric constants. Phys. Rev. B 2002, 66, 052105. [Google Scholar] [CrossRef] [Scilit]
- Havriliak, S.; Negami, S. A complex plane representation of dielectric and mechanical relaxation processes in some polymers. Polymer 1967, 8, 161–210. [Google Scholar] [CrossRef] [Scilit]
- Ganea, C.P.; Zgura, I.; Frunza, L. Numerical deconvolution approaches for dielectric characteristics of complex composite materials based on liquid crystals and oxide nanopowders. Mater. Chem. Phys. 2023, 309, 128372. [Google Scholar] [CrossRef] [Scilit]
- Vogel, H. The temperature dependence law of the viscosity of fluids. Phys. Z. 1921, 22, 645–646. [Google Scholar]
- Fulcher, G.S. Analysis of Recent Measurements of the Viscosity of Glasses. J. Am. Ceram. Soc. 1925, 8, 339–355. [Google Scholar] [CrossRef] [Scilit]
- Tammann, G.; Hesse, W. Die Abhängigkeit der Viscosität von der Temperatur bie unterkühlten Flüssigkeiten. Z. Anorg. Allg. Chem. 1926, 156, 245–257. [Google Scholar] [CrossRef] [Scilit]
- Ito, N.; Richert, R. Solvation dynamics and electric field relaxation in an imidazolium-PF6 ionic liquid: From room temperature to the glass transition. J. Phys. Chem. B. 2007, 111, 5016–5022. [Google Scholar] [CrossRef] [Scilit]
- Daguenet, C.; Dyson, J.P.; Krossing, I.; Oleinikova, A.; Slattery, J.; Wakai, C.; Weingaertner, H. Dielectric response of imidazolium-based room-temperature ionic liquids. J. Phys. Chem. B. 2006, 110, 12682–12688. [Google Scholar] [CrossRef] [Scilit] [PubMed]
- Nakamura, K.; Shikata, T. Systematic Dielectric and NMR Study of the Ionic Liquid 1-Alkyl-3-Methyl Imidazolium. ChemPhysChem 2010, 11, 285–294. [Google Scholar] [CrossRef] [Scilit] [PubMed]
- Angell, C.A. Strong and fragile liquids. In Relaxations in Complex Systems; Ngai, K.L., Wright, G.B., Eds.; NRL: Washington, DC, USA, 1985; pp. 3–11. [Google Scholar]
- Boehmer, R.; Ngai, K.L.; Angell, C.A.; Plazek, D.J. Nonexponential relaxations in strong and fragile glass formers. J. Chem. Phys. 1993, 99, 4201–4209. [Google Scholar] [CrossRef] [Scilit]
- Lunkenheimer, P.; Loidl, A. Glassy Dynamics Beyond the α-Relaxation. In Broadband Dielectric Spectroscopy; Kremer, F., Schönhals, A., Eds.; Springer: Berlin/Heidelberg, Germany, 2003; pp. 131–169. [Google Scholar]
- Gainaru, C.; Stacy, E.W.; Bocharova, V.; Gobet, M.; Holt, A.P.; Saito, T.; Greenbaum, S.; Sokolov, A.P. Mechanism of Conductivity Relaxation in Liquid and Polymeric Electrolytes: Direct Link between Conductivity and Diffusivity. J. Phys. Chem. B 2016, 120, 11074–11083. [Google Scholar] [CrossRef] [Scilit]
- Mizuno, F.; Belieres, J.P.; Kuwata, N.; Pradel, A.; Ribes, A.; Angell, C.A. Highly decoupled ionic and protonic solid electrolyte systems, in relation to other relaxing systems and their energy landscapes. J. Non-Cryst. Solids 2006, 352, 5147–5155. [Google Scholar] [CrossRef] [Scilit]
- Ueno, K.; Zhao, T.; Watanabe, M.; Angell, C.A. Protic ionic liquids based on decahydroisoquinoline: Lost superfragility and ionicity-fragility correlation. Phys. Chem. B 2012, 116, 63–70. [Google Scholar] [CrossRef] [Scilit]
- Griffin, P.J.; Agapov, A.L.; Sokolov, A.P. Translation-rotation decoupling and nonexponentiality in room temperature ionic liquids. Phys. Rev. E 2012, 86, 021508. [Google Scholar] [CrossRef] [Scilit]
- Wojnarowska, Z.; Kołodziejczyk, K.; Paluch, K.J.; Tajber, L.; Grzybowska, K.; Ngai, K.L.; Paluch, M. Decoupling of conductivity relaxation from structural relaxation in protic ionic liquids and general properties. Phys. Chem. Chem. Phys. 2013, 15, 9205–9211. [Google Scholar] [CrossRef] [Scilit]
- Sippel, P.; Lunkenheimer, P.; Krohns, S.; Thoms, E.; Loidl, A. Importance of liquid fragility for energy applications of ionic liquids. Sci. Rep. 2015, 5, 13922. [Google Scholar] [CrossRef] [Scilit]

Disclaimer/Publisher’s Note: The statements, opinions and data contained in all publications are solely those of the individual author(s) and contributor(s) and not of MDPI and/or the editor(s). MDPI and/or the editor(s) disclaim responsibility for any injury to people or property resulting from any ideas, methods, instructions or products referred to in the content. |
© 2026 by the authors. Licensee MDPI, Basel, Switzerland. This article is an open access article distributed under the terms and conditions of the Creative Commons Attribution (CC BY) license.