


Abstract
In unconventional reservoirs, the flowback efficiency of fracturing fluid is relatively low, resulting in the lower recovery rate of hydrocarbons. This work proposes a new method to improve the flowback of fracturing fluid by using cross-linked polymer nano-emulsion. Using the semi-continuous emulsion polymerization process, a core–shell polymer nano-emulsion was prepared with cross-linked core layer, namely FRACFLOW-WA. Through dynamic light scattering and transmission electron microscopy analysis, it was found that the average particle size of the nano-emulsion was 91.7 nanometers, with a narrow particle size distribution and excellent dispersion. The product can quickly adsorb on the pore surface and spontaneously form a uniform and stable hydrophobic film. The results showed that the contact angle of the core sample treated by the nano-emulsion at 1% concentration can increase to 108°. The hydrophobic film structure was confirmed by scanning electron microscopy coupled with energy-dispersive X-ray spectroscopy (SEM-EDS). The core gas flooding experiment showed that introducing 1% FRACFLOW-WA into the fracturing fluid increases the flowback efficiency to 72.3%, and the permeability recovery rate reaches 70.2%, which is better than the commonly used commercial surfactants. The Brunauer–Emmett–Teller (BET) and Barrett–Joyner–Halenda (BJH) analysis results showed that the thickness of formed hydrophobic film is approximately only 2.34 nm, suggesting that this is a “lower damage” method to the pore structure. Based on the analysis of the mechanism, it is believed that the hydrophobic modification changes the surface of the pores from strong hydrophilicity to hydrophobicity, thereby converting the capillary pressure from resistance to a driving force that promotes fluid discharge.
1. Introduction
Hydraulic fracturing evolved from nitroglycerin “shooting” in the 1860s and acid pressure-parting treatments in the 1930s to the first modern hydraulic fracturing treatment introduced by Stanolind Oil in 1949 [1,2]. Since then, hydraulic fracturing has become an indispensable technology for the economic development of unconventional reservoirs, including tight sandstone, shale, and coalbed methane formations [3,4]. During the fracturing process, large volumes of fracturing fluids are injected into the formation to create and propagate fractures, thereby enhancing hydrocarbon production [5,6].
However, the flowback efficiency of fracturing fluids in unconventional reservoirs is often remarkably low, which significantly impairs matrix permeability and reduces hydrocarbon recovery [7,8]. The primary reason for the difficulty in fracturing fluid flowback lies in the strong capillary forces within the nanoporous networks of unconventional reservoirs [9,10]. Additionally, the Jamin effect, which is caused by the interfacial tension between fluid phases at pore constrictions further exacerbates fluid trapping [11]. Therefore, the wettability of reservoir pore surfaces is a critical factor governing fluid displacement at the pore scale [12].
To mitigate water blockage and enhance fracturing fluid flowback, various chemical additives, commonly known as flowback aids or cleanup additives, have been developed. The most widely used flowback aids are surfactants, which function primarily through two mechanisms: reducing the oil–water interfacial tension (IFT) and altering the rock wettability [13,14,15,16,17,18]. However, the efficacy of conventional surfactant-based flowback aids is often compromised by surfactant adsorption onto reservoir rock surfaces, which reduces chemical efficiency and causes water retention in the formation [19]. Moreover, reservoir lithology and formation brine can further undermine the durability of low interfacial tension achieved by surfactants alone [20]. Consequently, there is a growing need for more robust and durable approaches to wettability regulation.
Wettability alteration of reservoir pore surfaces has emerged as a promising strategy to overcome the limitations of conventional surfactants [21]. By modifying the pore surface from strongly water-wet to weakly water-wet or even hydrophobic, the direction of capillary pressure can be reversed [22]. It has been demonstrated that tuning the salinity and ionic composition of fracturing fluids can effectively alter shale wettability from oil-wet to water-wet [23]. Chen demonstrated that rhamnolipid reduces oil–glass adhesion by adsorbing onto the oil film with hydrophilic heads outward [24]. These findings underscore the critical importance of wettability control in facilitating fracturing fluid flowback [25]. Although surfactants have been widely employed in enhanced oil recovery (EOR) for decades owing to their excellent wettability modification and interfacial tension reduction capabilities, their performance deteriorates significantly under harsh reservoir conditions such as high salinity and elevated temperature. To overcome this limitation, nanofluid-based waterflooding has attracted considerable attention because of its potential applicability under harsh reservoir conditions. In recent years, nano-emulsions have attracted considerable attention in petroleum engineering due to their unique properties, including ultra-small droplet sizes, high interfacial activity, and excellent stability [26]. Nano-emulsions incorporated into fracturing fluids play a crucial role in maximizing the imbibition effect within the reservoir matrix, thereby enhancing sweep volume and oil recovery efficiency [27]. The droplet size of nano-emulsions typically ranges from 10 to 100 nm, allowing them to penetrate nanoscale pore throats [28]. Systematic studies have revealed that nano-emulsions achieve enhanced oil recovery through three primary mechanisms: reduction in interfacial tension, reversal of wettability, and emulsification [29]. For instance, Li demonstrates that a thermally triggered nanoemulsion, which polymerizes and forms a superhydrophobic film in situ on shale surfaces at temperatures above 150 °C, effectively seals microfractures and reduces fluid invasion by over 90% [30]. Nano-emulsions can rapidly alter wettability, enhancing sweep efficiency, imbibition displacement, and flowback efficiency. Furthermore, compared to conventional surfactants, nano-emulsions exhibit minimized adsorption losses on rock surfaces, ensuring more durable performance [31].
In this study, a core–shell nano-emulsion with a cross-linked structure in the core layer was synthesized by a semi-continuous emulsion polymerization method. By introducing KH550 (a silane coupling agent), reactive silane groups were introduced onto the surface of the nanoparticles, enhancing their affinity and anchoring ability to the rock surface. After treatment, the nano-emulsion could quickly adsorb onto the pore surface and spontaneously form a uniform and stable hydrophobic film. The aim of this study is to clarify the performance and mechanism of the synthesized nano-emulsion as a new wetting modifier agent in improving the recovery efficiency in tight sandstone gas reservoirs.
2. Results and Discussion
2.1. Characterization of the Synthesized Nano-Emulsion
2.1.1. FTIR Spectra
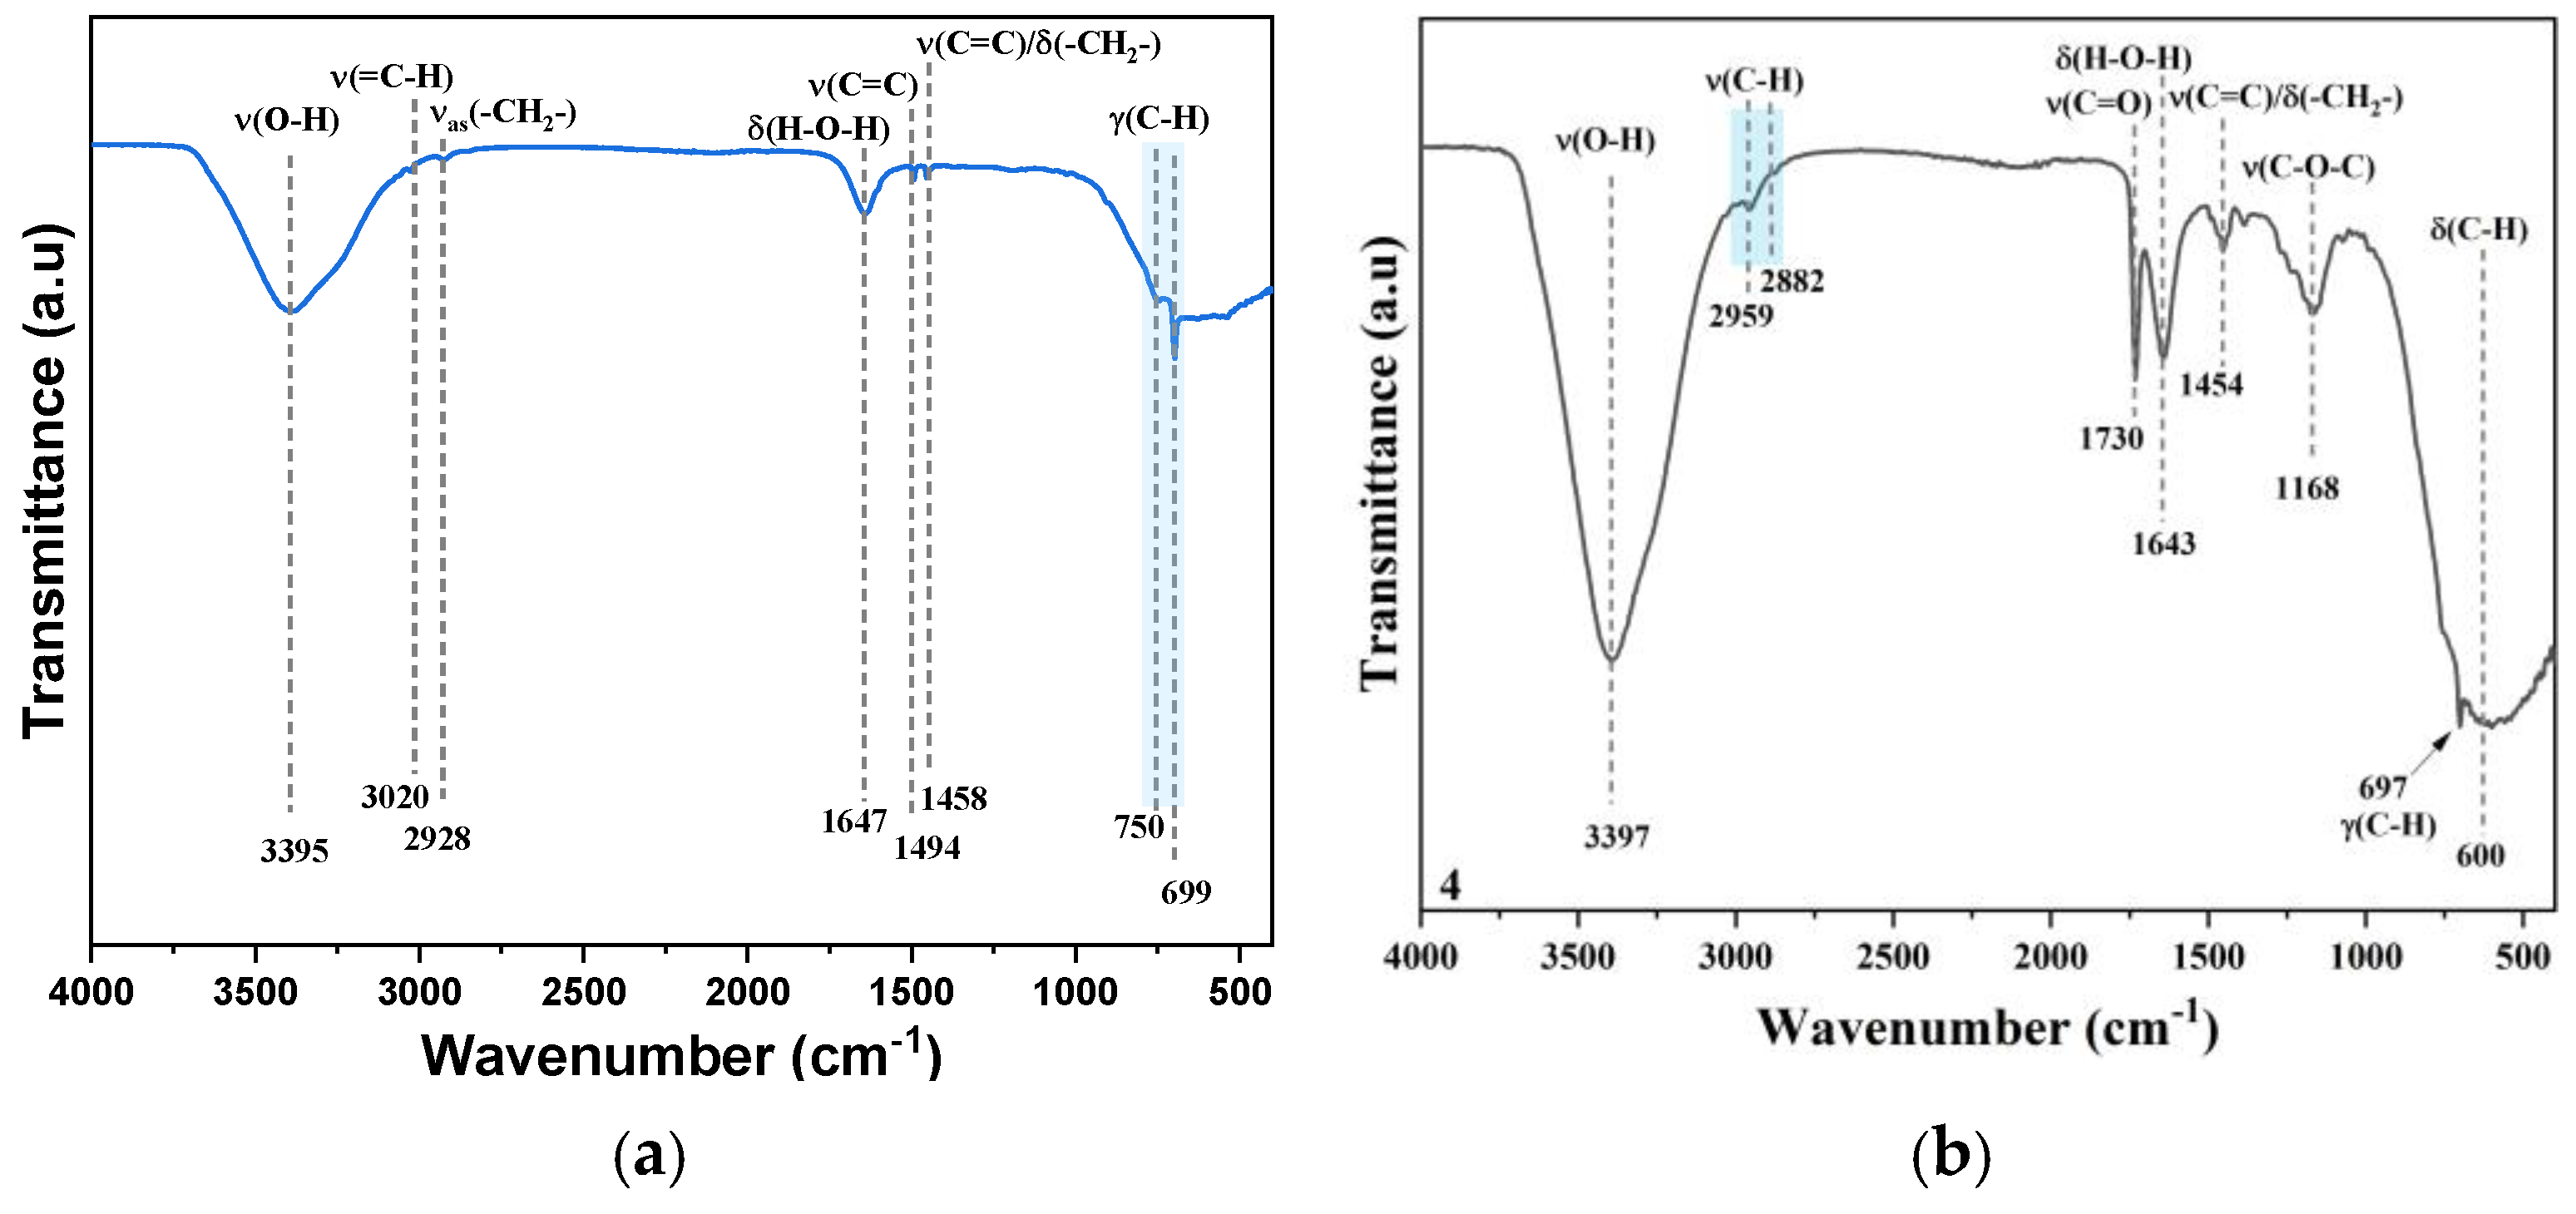
The chemical structures of the synthesized core-stage and core–shell particles were characterized by Fourier transform infrared (FTIR) spectroscopy, and the corresponding spectra are presented in Figure 1.
Figure 1.
(a) The FT-IR spectra of core layer; (b) FT-IR spectra of FRACFLOW-WA.
For the core-stage copolymer (P(St-DVB)), the FTIR spectrum exhibits several characteristic absorption bands that confirm the successful polymerization of St and DVB. A broad absorption band centered at 3395 cm−1 is attributed to the O–H stretching vibration [ν(O–H)] of adsorbed water molecules within the polymer network, with the corresponding bending vibration [δ(H–O–H)] appearing at 1647 cm−1. The characteristic peaks at 3020 cm−1 and 2928 cm−1 are assigned to the C–H stretching vibration of the aromatic ring [ν(=C–H)] and the asymmetric stretching vibration of aliphatic methylene groups [νas(–CH2–)] in the polymer backbone, respectively. Furthermore, the sharp absorption bands at 1494 cm−1 and 1458 cm−1 originate from the C=C stretching vibration of the benzene ring skeleton, with a superimposed signal from the methylene bending vibration [δ(–CH2–)]. The strong absorption bands observed at 750 cm−1 and 699 cm−1 are characteristic of the out-of-plane C–H bending vibration [γ(C–H)], which serves as a definitive marker for the incorporation of styrene units. These spectral features collectively confirm that the core-stage polymerization successfully yielded a crosslinked copolymer network with the desired aromatic and aliphatic structural units.
During shell polymerization, the FTIR spectrum of the core–shell particles (P(St-DVB)-g-BA/KH550) reveals several distinct changes that confirm the successful grafting of the shell layer. The intensified absorption band at 3397 cm−1 arises from the N–H stretching vibration of the primary amino group (–NH2) from the KH550 and the O–H stretching vibration of hydroxyl groups within the polymer network. In the high-frequency region, the dual absorption bands at 2959 cm−1 and 2882 cm−1 are assigned to the C–H stretching vibrations [ν(C–H)] of the alkyl groups in the polymer chain. A strong characteristic peak appears at 1730 cm−1, corresponding to the carbonyl stretching vibration [ν(C=O)] of the ester groups, accompanied by the asymmetric C–O–C stretching vibration [ν(C–O–C)] of the ester linkage at 1168 cm−1. The simultaneous presence of these two peaks provides unequivocal evidence for the successful incorporation of butyl acrylate (BA) monomers into the shell layer. The absorption band at 1454 cm−1 encompasses both the C=C stretching vibration [ν(C=C)] of the benzene ring skeleton and the bending vibration [δ(–CH2–)] of aliphatic methylene groups.
The FTIR results thus confirm the successful synthesis of a well-defined core–shell structure: the core provides the desired mechanical strength through the crosslinked aromatic network, while the shell incorporates reactive amino and siloxane functional groups that are essential for subsequent chemical anchoring onto rock surfaces.
2.1.2. Particle Dispersibility
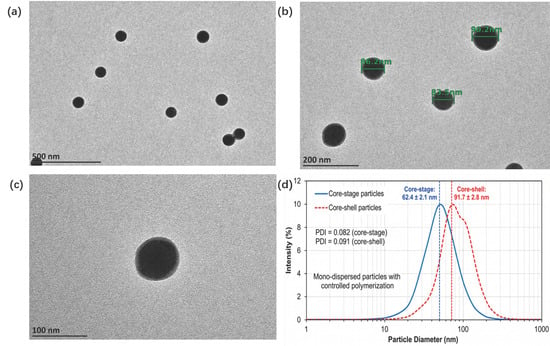
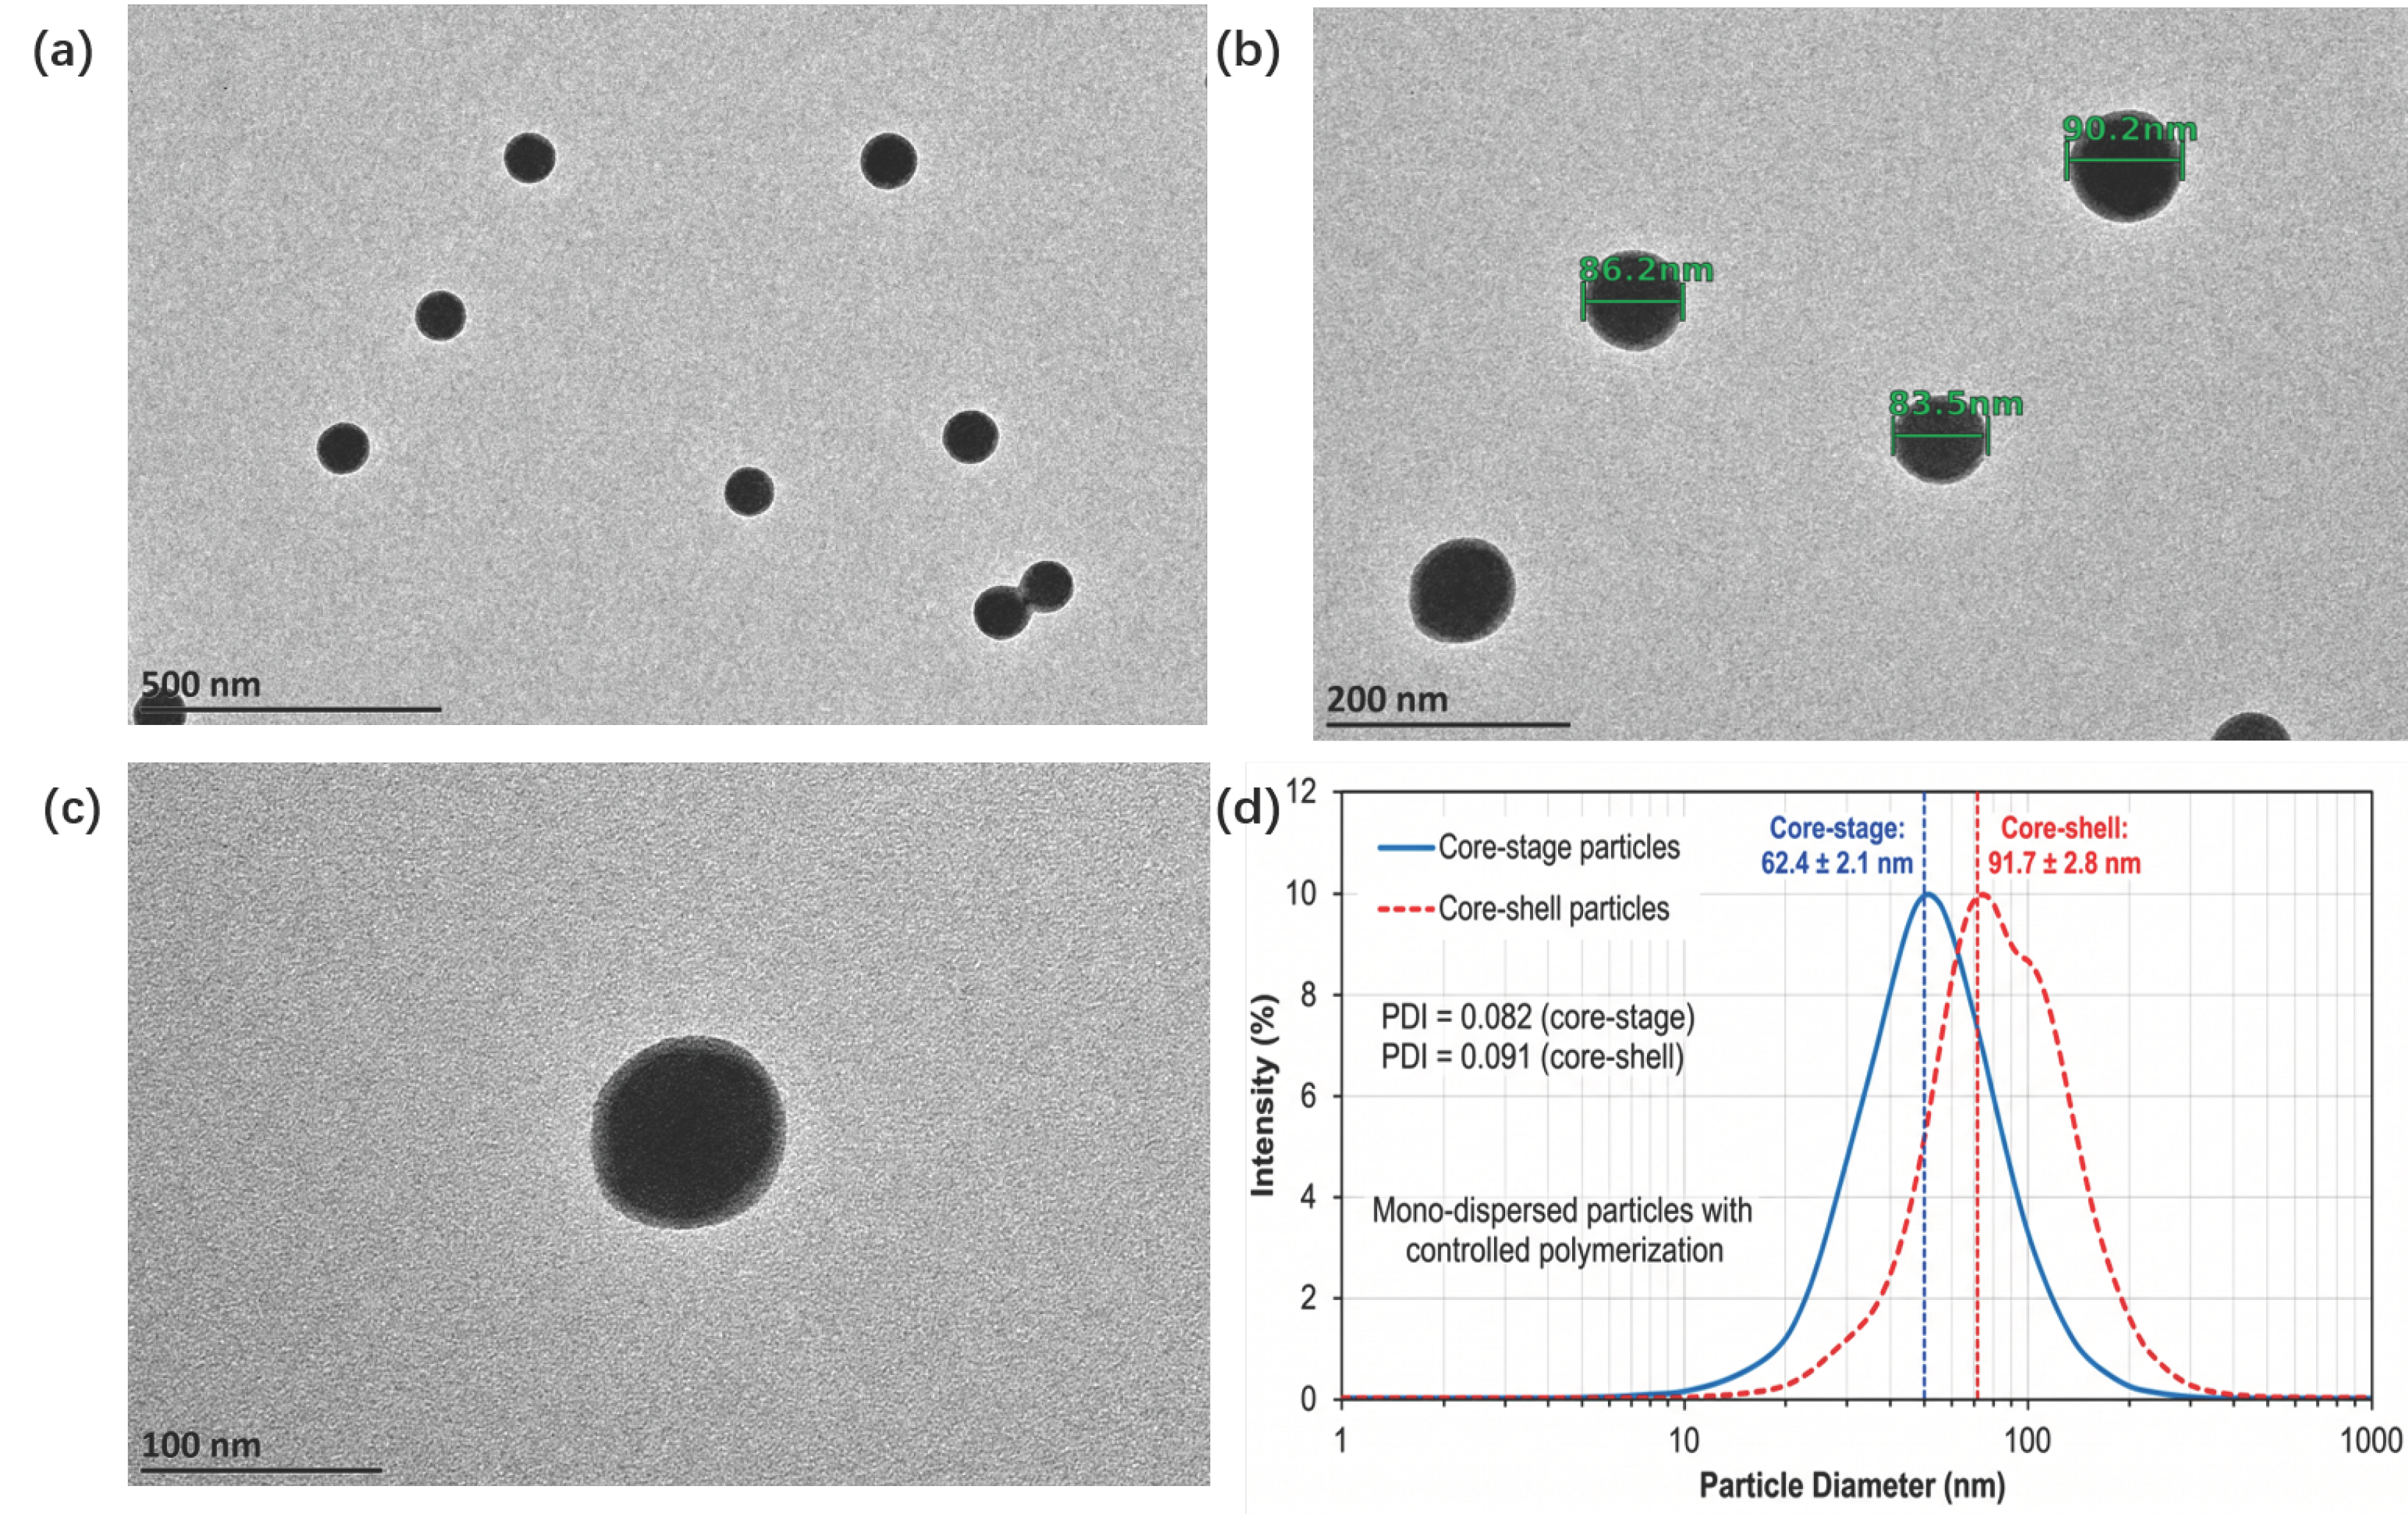
The core–shell structure morphology of the synthesized FRACFLOW-WA nano-emulsion were directly visualized by transmission electron microscopy (TEM).
In the transmission electron microscope (TEM) images, a distinct core–shell interface can be clearly observed. Due to the higher electron density, the core region rich in hydrophobic styrene and divinylbenzene segments appears darker, while the shell layer rich in butyl acrylate and KH550-derived siloxane components presents a relatively lighter edge diffusion zone. This clearly defined core–shell structure indicates that the shell layer containing KH550 has successfully grown on the hydrophobic core. From the TEM results, it can be seen that the emulsion particles exhibit good dispersion. Within a single field of view, the particle sizes are uniform, ranging from 83.5 to 90.2 nm.
The dynamic light scattering (DLS) measurement was used to monitor the changes in hydrodynamic diameter during the polymerization process and to evaluate the uniformity of particle dispersion. As shown in Figure 2d, the average hydrodynamic diameter of the particles at the core stage was 60.4 nm. After the shell layer polymerization, the average hydrodynamic diameter increased to 91.7 nm, which was slightly higher than the particle diameter observed by TEM. The slight difference between the DLS and TEM data was attributed to the hydration layer around the particles in the aqueous dispersion system. This layer could be detected by DLS, but could not be observed by dry-state TEM imaging. DLS confirmed that the emulsion particles had excellent dispersity, and the narrow particle size distribution proved the high stability of the polymerization system.
Figure 2.
Particle dispersibility and particle size of FRACFLOW-WA: (a–c) TEM images of FRACFLOW-WA nano-emulsion; (d) DLS particle size distributions of core-stage and core–shell FRACFLOW-WA nano-emulsion.
2.1.3. Zeta Potential
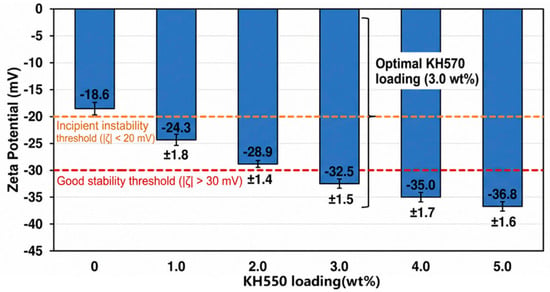
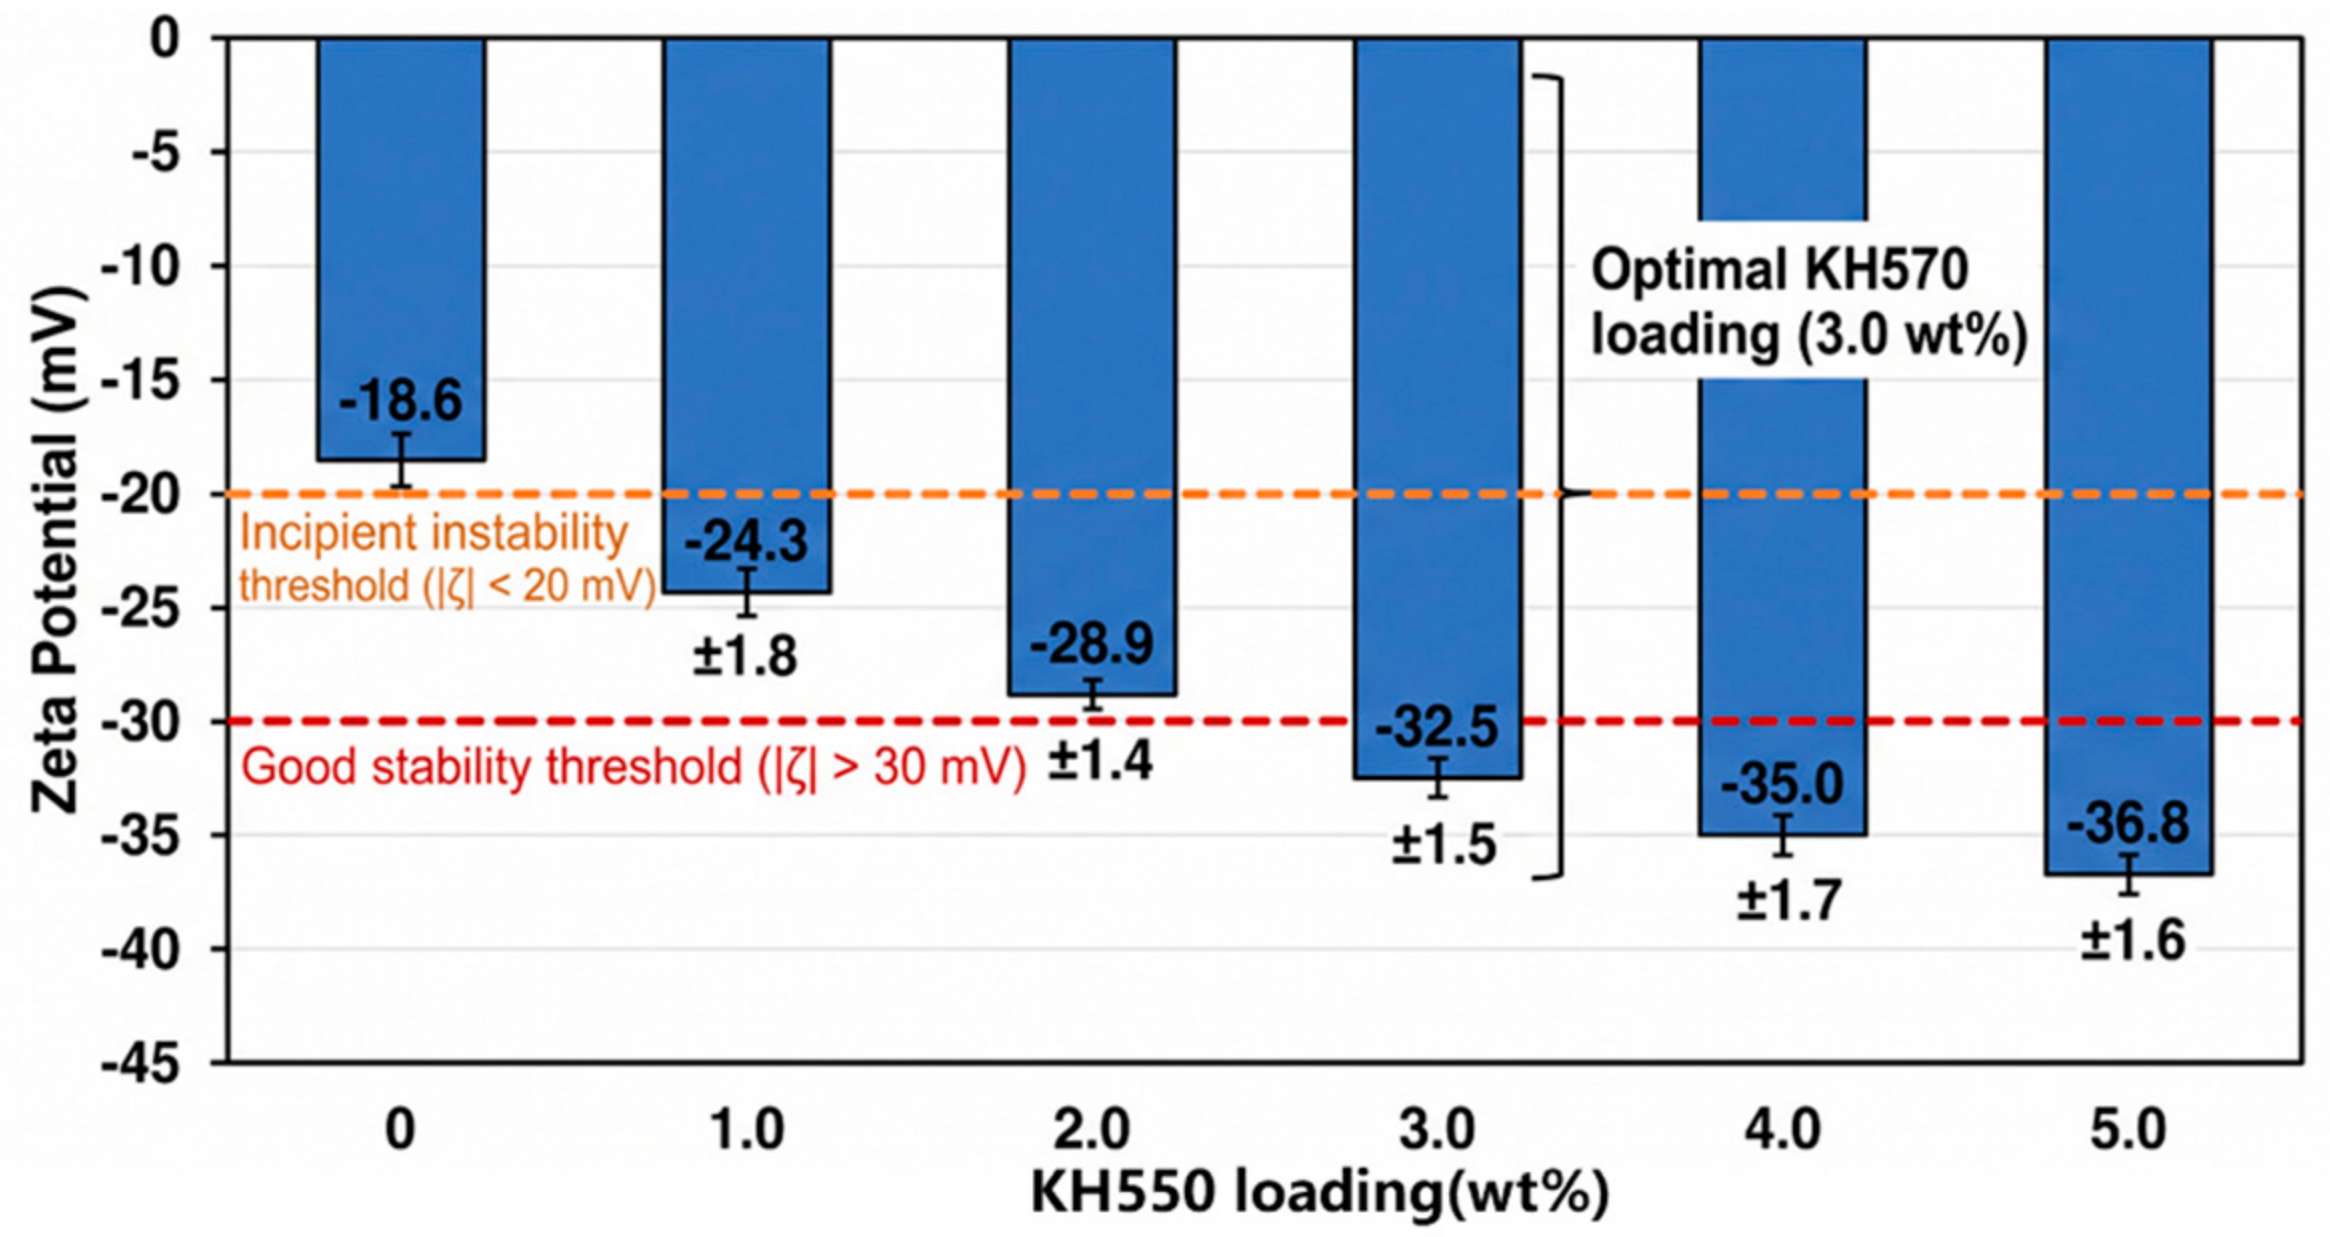
The Zeta potential of the nano-emulsion particles was measured at varying KH550 feed ratios to elucidate the role of the silane coupling agent in determining surface charge characteristics and colloidal stability. As presented in Figure 3, the Zeta potential of the nano-emulsion increases in magnitude with increasing KH550 content. For the control sample without KH550, the Zeta potential is measured at −18.6 ± 2.1 mV, which originates primarily from the anionic initiator fragments and the inherent surface charge of the copolymer chains. Upon incorporation of 1.0 wt% KH550 (relative to total monomer mass), the Zeta potential increases in magnitude to −24.3 ± 1.8 mV, and further increases to −32.5 ± 1.5 mV at a KH550 loading of 3.0 wt%. When the KH550 content reaches 5.0 wt%, the Zeta potential attains a value of −36.8 ± 1.6 mV, indicating a substantial enhancement in surface negative charge density. As the content of KH550 increases, the amplitude of the ζ potential significantly increases. This is attributed to the hydrolysis of the alkoxy silane groups (-Si(OR)3) in water and subsequent ionization, which leads to the formation of negatively charged groups (-SiO−) on the particle surface. The abundant negatively charged groups create a strong electrostatic double-layer repulsion between adjacent particles, effectively preventing aggregation and coalescence. Notably, when the KH550 loading exceeds 5.0 wt%, the Zeta potential shows no significant further increase, suggesting that the particle surface approaches saturation coverage with siloxane moieties. The optimal KH550 loading of 3.0 wt% was selected for subsequent experiments, as it provides a sufficiently high Zeta potential (−32.5 mV) to ensure robust colloidal stability while maintaining economic feasibility. Therefore, the nano-emulsion prepared with 3.0 wt% KH550 comfortably meets this stability criterion.
Figure 3.
Zeta Potential of FRACFLOW-WA Nano-Emulsion as a Function of KH550.
2.1.4. Surface Activity
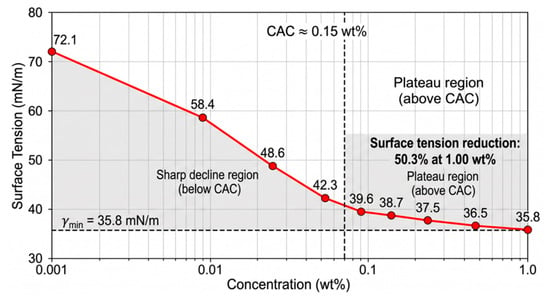
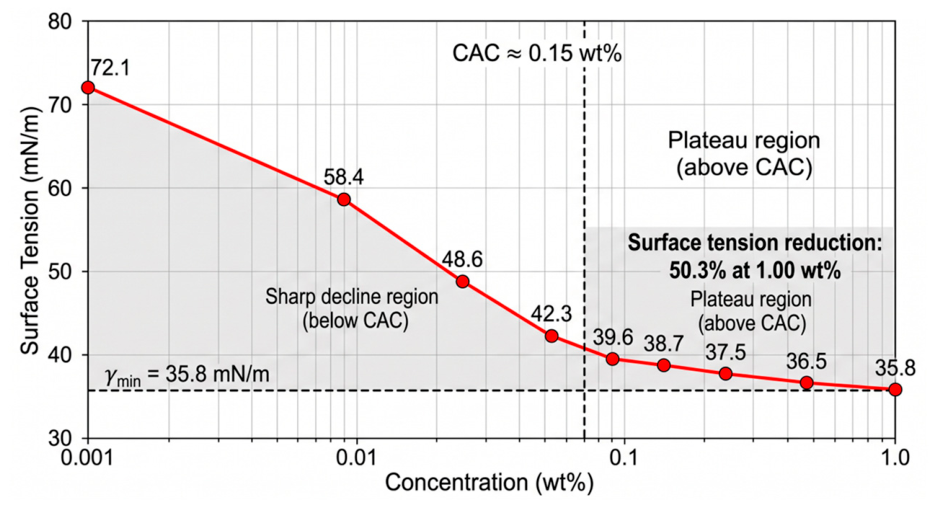
The surface activity of the synthesized FRACFLOW-WA nano-emulsion was evaluated by measuring the equilibrium surface tension of aqueous dispersions at varying concentrations. As a fluid additive for fracturing applications, the ability to reduce surface tension is beneficial for flowback. The surface tension-concentration profile is presented in Figure 4.
Figure 4.
Surface tension of aqueous dispersions of FRACFLOW-WA nano-emulsion as a function of concentration at 25 °C.
With increasing nano-emulsion concentration, the surface tension of the aqueous dispersion decreases progressively from 72.1 mN/m (pure deionized water) to 35.8 mN/m at 1.00 wt%. The reduction is most pronounced at low concentrations. At 0.01 wt%, the surface tension drops to 58.4 mN/m, representing a 19.0% reduction relative to pure water. As the concentration increases to 0.05 wt% and 0.10 wt%, the surface tension further decreases to 48.6 mN/m and 42.3 mN/m, corresponding to reduction rates of 32.6% and 41.3%, respectively. Beyond 0.20 wt%, the rate of surface tension reduction diminishes considerably. This concentration-dependent behavior indicates that the nano-emulsion has good surface activity, thereby reducing the interfacial free energy. The inflection point in the surface tension curve, approximately at 0.15 wt%, represents the critical aggregation concentration (CAC), which is similar to the critical micelle concentration (CMC) of conventional surfactants. At concentrations below the CAC, individual nano-emulsion particles adsorb at the interface, and the surface tension decreases sharply with increasing concentration. Once the CAC is exceeded, the interface can be saturated with adsorbed particles. As the concentration further increases, the particles in the bulk phase to form aggregates or multilayer structures, rather than additional interface adsorption, resulting in the observed plateau phenomenon.
2.2. Wettability Alteration
2.2.1. Static Contact Angle Measurements
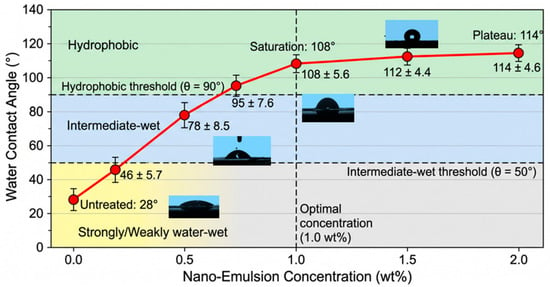
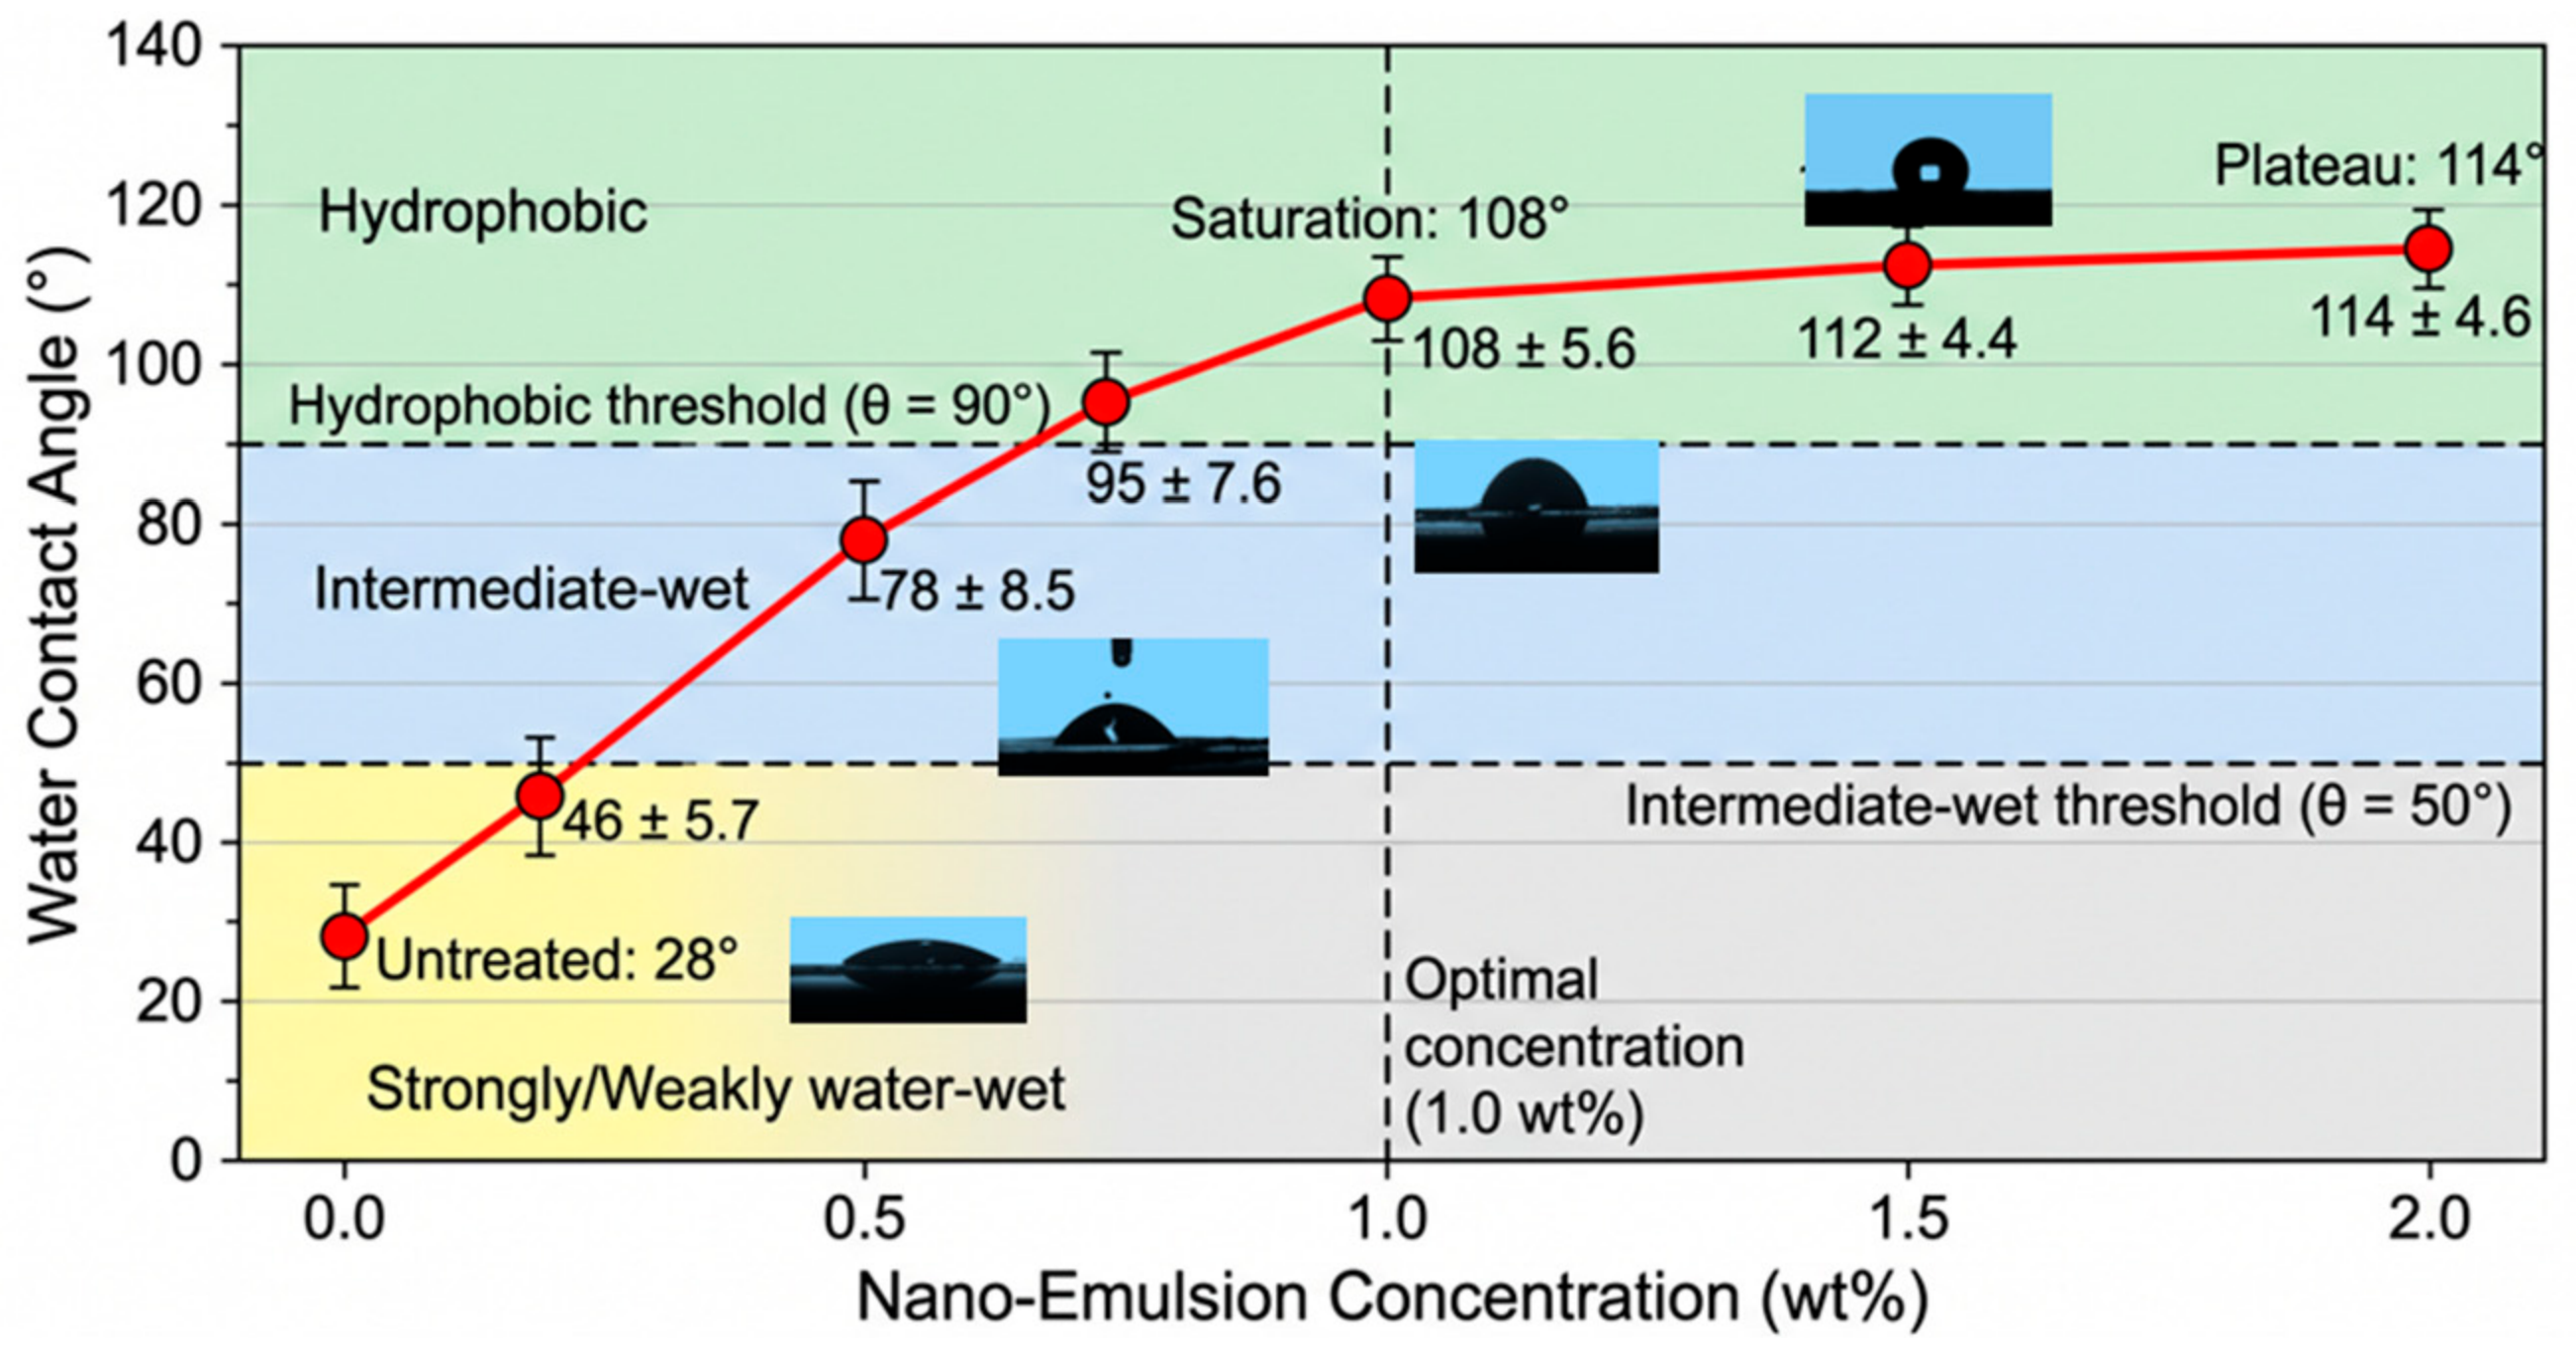
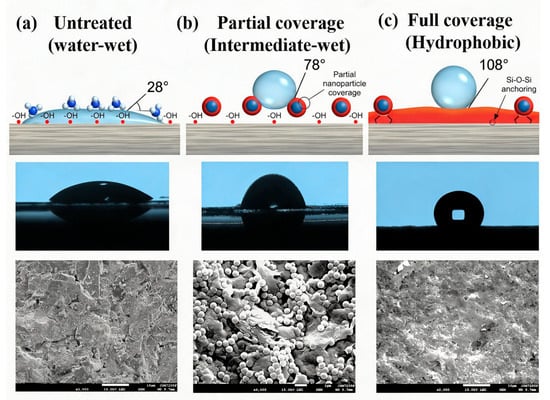
The wettability alteration capability of the FRACFLOW-WA was systematically evaluated by measuring static water contact angles on fresh tight sandstone sample surfaces treated with varying concentrations of the nano-emulsion. As summarized in Figure 5, the untreated rock surface exhibits a water contact angle of 28°, exhibiting strongly water-wet sandstone surfaces. With increasing concentrations of the nano-emulsion, a dramatic and progressive increase in contact angle is observed, indicating a gradual transition from hydrophilic to hydrophobic surface. At 0.1 wt%, the contact angle increases to 46°, representing a transition from strongly water-wet to weakly water-wet. Increasing the concentration to 0.5 wt% yields a contact angle of 78°, placing the surface in the intermediate-wet regime. The threshold for hydrophobic surface character (θ > 90°) is achieved at a concentration of 0.70 wt%, where the contact angle reaches 95°. At 1.0 wt%, the contact angle attains a value of 108°, firmly in the hydrophobic regime. Further increasing the concentration to 1.50 wt% and 2.00 wt% yields contact angles of 112° and 114°, respectively, indicating no significant additional improvement beyond 1.0 wt%.
Figure 5.
Water contact angles of core samples treated by different concentration of nano-emulsion.
2.2.2. Wettability Alteration for Different Rock Lithologies
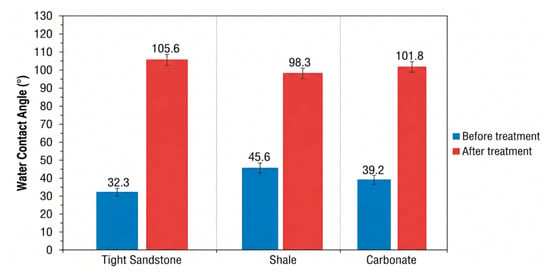
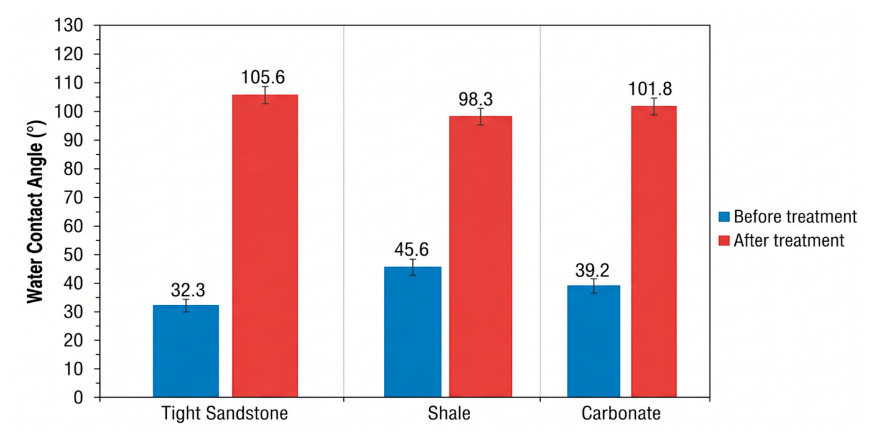
To assess the general applicability of the nano-emulsion, wettability alteration experiments were also conducted on different rock lithologies in unconventional reservoirs. As shown in Figure 6, the 1.0 wt% nano-emulsion treatment consistently induces wettability alteration across all rock types. For tight sandstone core, the contact angle increases from 32.3° to 105.6°. Shale samples, which initially exhibit a contact angle of 45.6° due to the presence of organic matter, show an increase to 98.3° after treatment. The smaller wettability alteration observed for shale is expected, as the organic-rich domains in shale are inherently more hydrophobic than siliceous surfaces and may provide fewer anchoring sites for the silane groups. Carbonate rocks, despite their different surface chemistry (predominantly calcium carbonate surfaces rather than silica), still exhibit a substantial contact angle increase from 39.2° to 101.8°, indicating that the nano-emulsion also interacts effectively with carbonate surfaces. These results confirm that the FRACFLOW-WA nano-emulsion possesses broad lithological applicability, making it suitable for diverse unconventional reservoir types including tight sandstone, shale, and carbonate formations.
Figure 6.
Results of wettability alteration of FRACFLOW-WA on different rock lithologies.
2.3. Flowback Performance
2.3.1. Effect of Nano-Emulsion Concentration on Flowback Efficiency
The influence of nano-emulsion concentration on fracturing fluid flowback efficiency was first investigated over a concentration range of 0 to 2.00 wt%. All experiments in this series were conducted with a fixed shut-in time of 12 h. The cumulative flowback curves for different treatments are presented in Figure 7.
Figure 7.
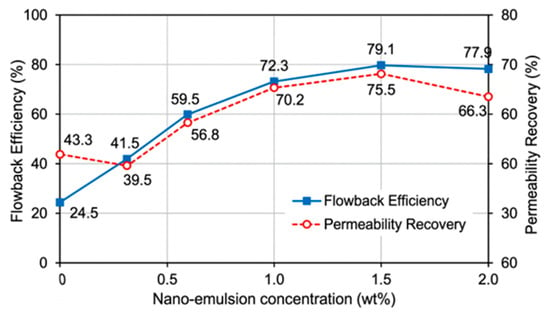
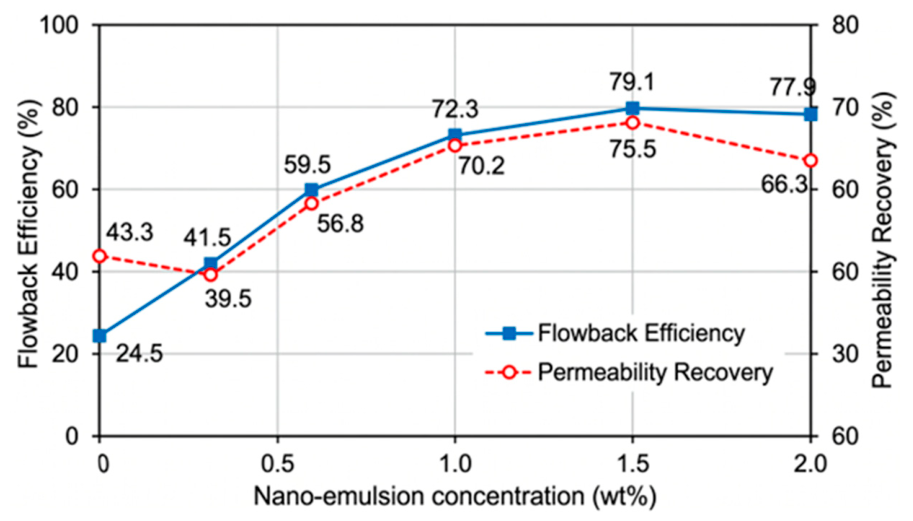
Correlation between flowback efficiency and permeability recovery as a function of nano-emulsion concentration.
Based on the results, as the concentration of FRACFLOW-WA in the fracturing fluid increases, the flowback rate gradually increases. The untreated core exhibits a final flowback efficiency of only 24.5%, which is typical for tight sandstone reservoirs where strong capillary forces, high water-blocking resistance, and the Jamin effect collectively cause significant fluid retention. It indicates that a substantial fraction of the injected fluid remains permanently trapped in the pore network. With increasing concentrations of the nano-emulsion, a progressive and marked improvement in flowback performance is observed. At 0.3 wt% concentration, the final flowback efficiency increases to 41.5%, indicating that even at low concentration, the nano-emulsion begins to reduce capillary retention forces. At 0.5 wt%, the flowback efficiency reaches 59.5%. At a concentration of 1.0 wt%, the final flowback efficiency reached 72.3%. Further increasing the concentration to 1.5% and 2.0 wt% yields only marginal additional improvements, with final flowback efficiencies of 79.1% and 77.9%, respectively. This indicates that a considerable amount of fracturing fluid has been expelled from the pore space. As the concentration continues to increase, the trend of the flowback rate gradually flattens.
Figure 7 also shows the recovery of permeability after flowback. In this experiment, tight sandstone core samples were used with low permeability of less than 1 mD. As the concentration of FRACFLOW-WA increases, the recovery rate of core permeability after flowback shows a gradually increasing trend. After fluid with 1% FRACFLOW-WA, the recovery rate of permeability after flowback reaches 70.2%, but it should be noted that due to the heterogeneity of the core, this variation is not a completely linear increase. For example, when the concentration of FRACFLOW-WA is 0.3%, the recovery rate of permeability is less than that without FRACFLOW-WA. The recovery degree of core permeability is not only related to the concentration of FRACFLOW-WA, but also greatly affected by the characteristics of the core samples.
2.3.2. Effect of Shut-In Time on Flowback Efficiency
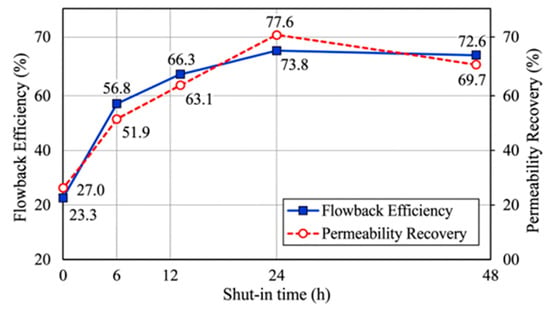
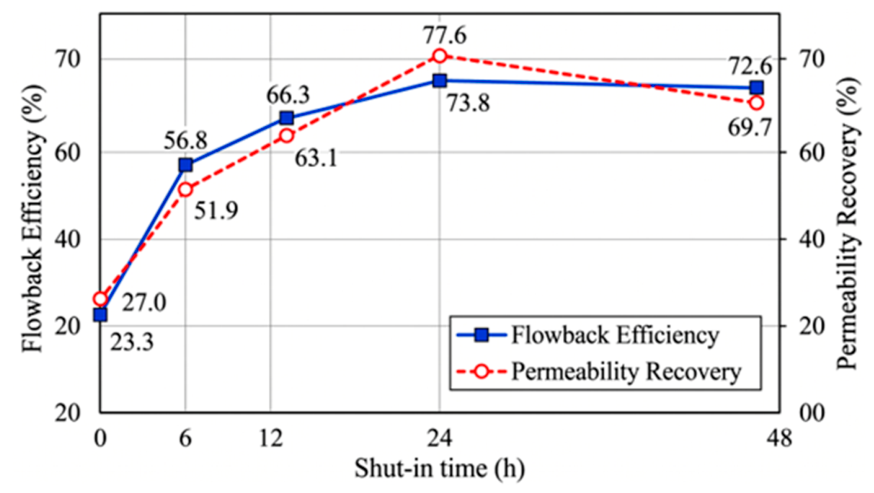
The shut-in time after the injection of fracturing fluid determines the adsorption degree of the nano-emulsion on the pore surface and the formation of the hydrophobic film. To optimize the shut-in time to achieve the best flowback performance, a series of core gas flooding experiments with shut-in times of 0, 6, 12, 24, and 48 h were conducted. During the tests, a fixed nano-emulsion concentration of 1 wt% was adopted. The results are shown in Figure 8.
Figure 8.
Flowback performance and permeability recovery with shut-in times ranging from 0 to 48 h.
For the experiment with no shut-in time (0 h), the final flowback efficiency is only 23.3%, and the permeability recovery was 27%. This result suggests that without adequate aging time, the nano-emulsion particles have insufficient opportunity to adsorb onto pore surfaces and form the hydrophobic film. It means that the majority of the emulsion particles are easily expelled during the initial flowback without exerting its beneficial effect.
At 6 h of shut-in, a substantial improvement is observed with flowback efficiency reaching 56.8%. The permeability recovery reaches 51.9%. The optimal shut-in time is clearly identified as 12 h, where the flowback efficiency reaches its maximum value of 66.3%. At this point, the permeability recovery was 63.1%. Extending the shut-in time to 24 h and 48 h yields no statistically significant improvement, with flowback efficiencies of 73.8% and 72.6%, respectively. The permeability recovery reached 77.6% and 69.7%, respectively. The slight increases confirmed that the system reaches equilibrium at approximately 12 h. The expected increase in permeability recovery rate at a 2% concentration did not occur, which was due to the inherent differences in permeability of the core samples. The improvement from 12 h to 24 h is significantly smaller than that from 6 h to 12 h, indicating a diminishing marginal return.
The practical implication of the shut-in optimization is significant. The recommended well shut-in time is 12 h, as a cost–benefit compromise solution between flowback performance and operating costs. By adopting the nano-emulsion treatment with a 12-h shut-in schedule, operators can achieve near-maximum flowback benefits while reducing the non-productive time, thereby improving overall operational economics. It should be noted that the 12 h value reported in this study is a laboratory-based recommendation under controlled conditions. It should not be regarded as a universal optimum. In actual field operations, the shut-in time should be re-evaluated based on specific reservoir properties, economic evaluation, and production data.
2.3.3. Comparison with Conventional Flowback Aids
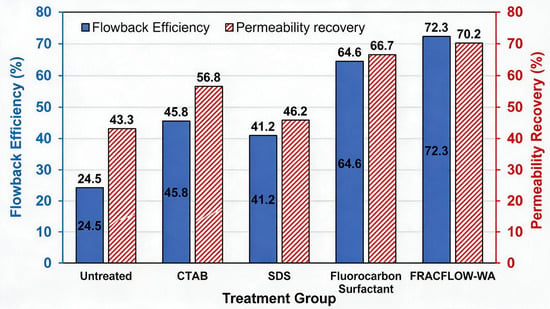
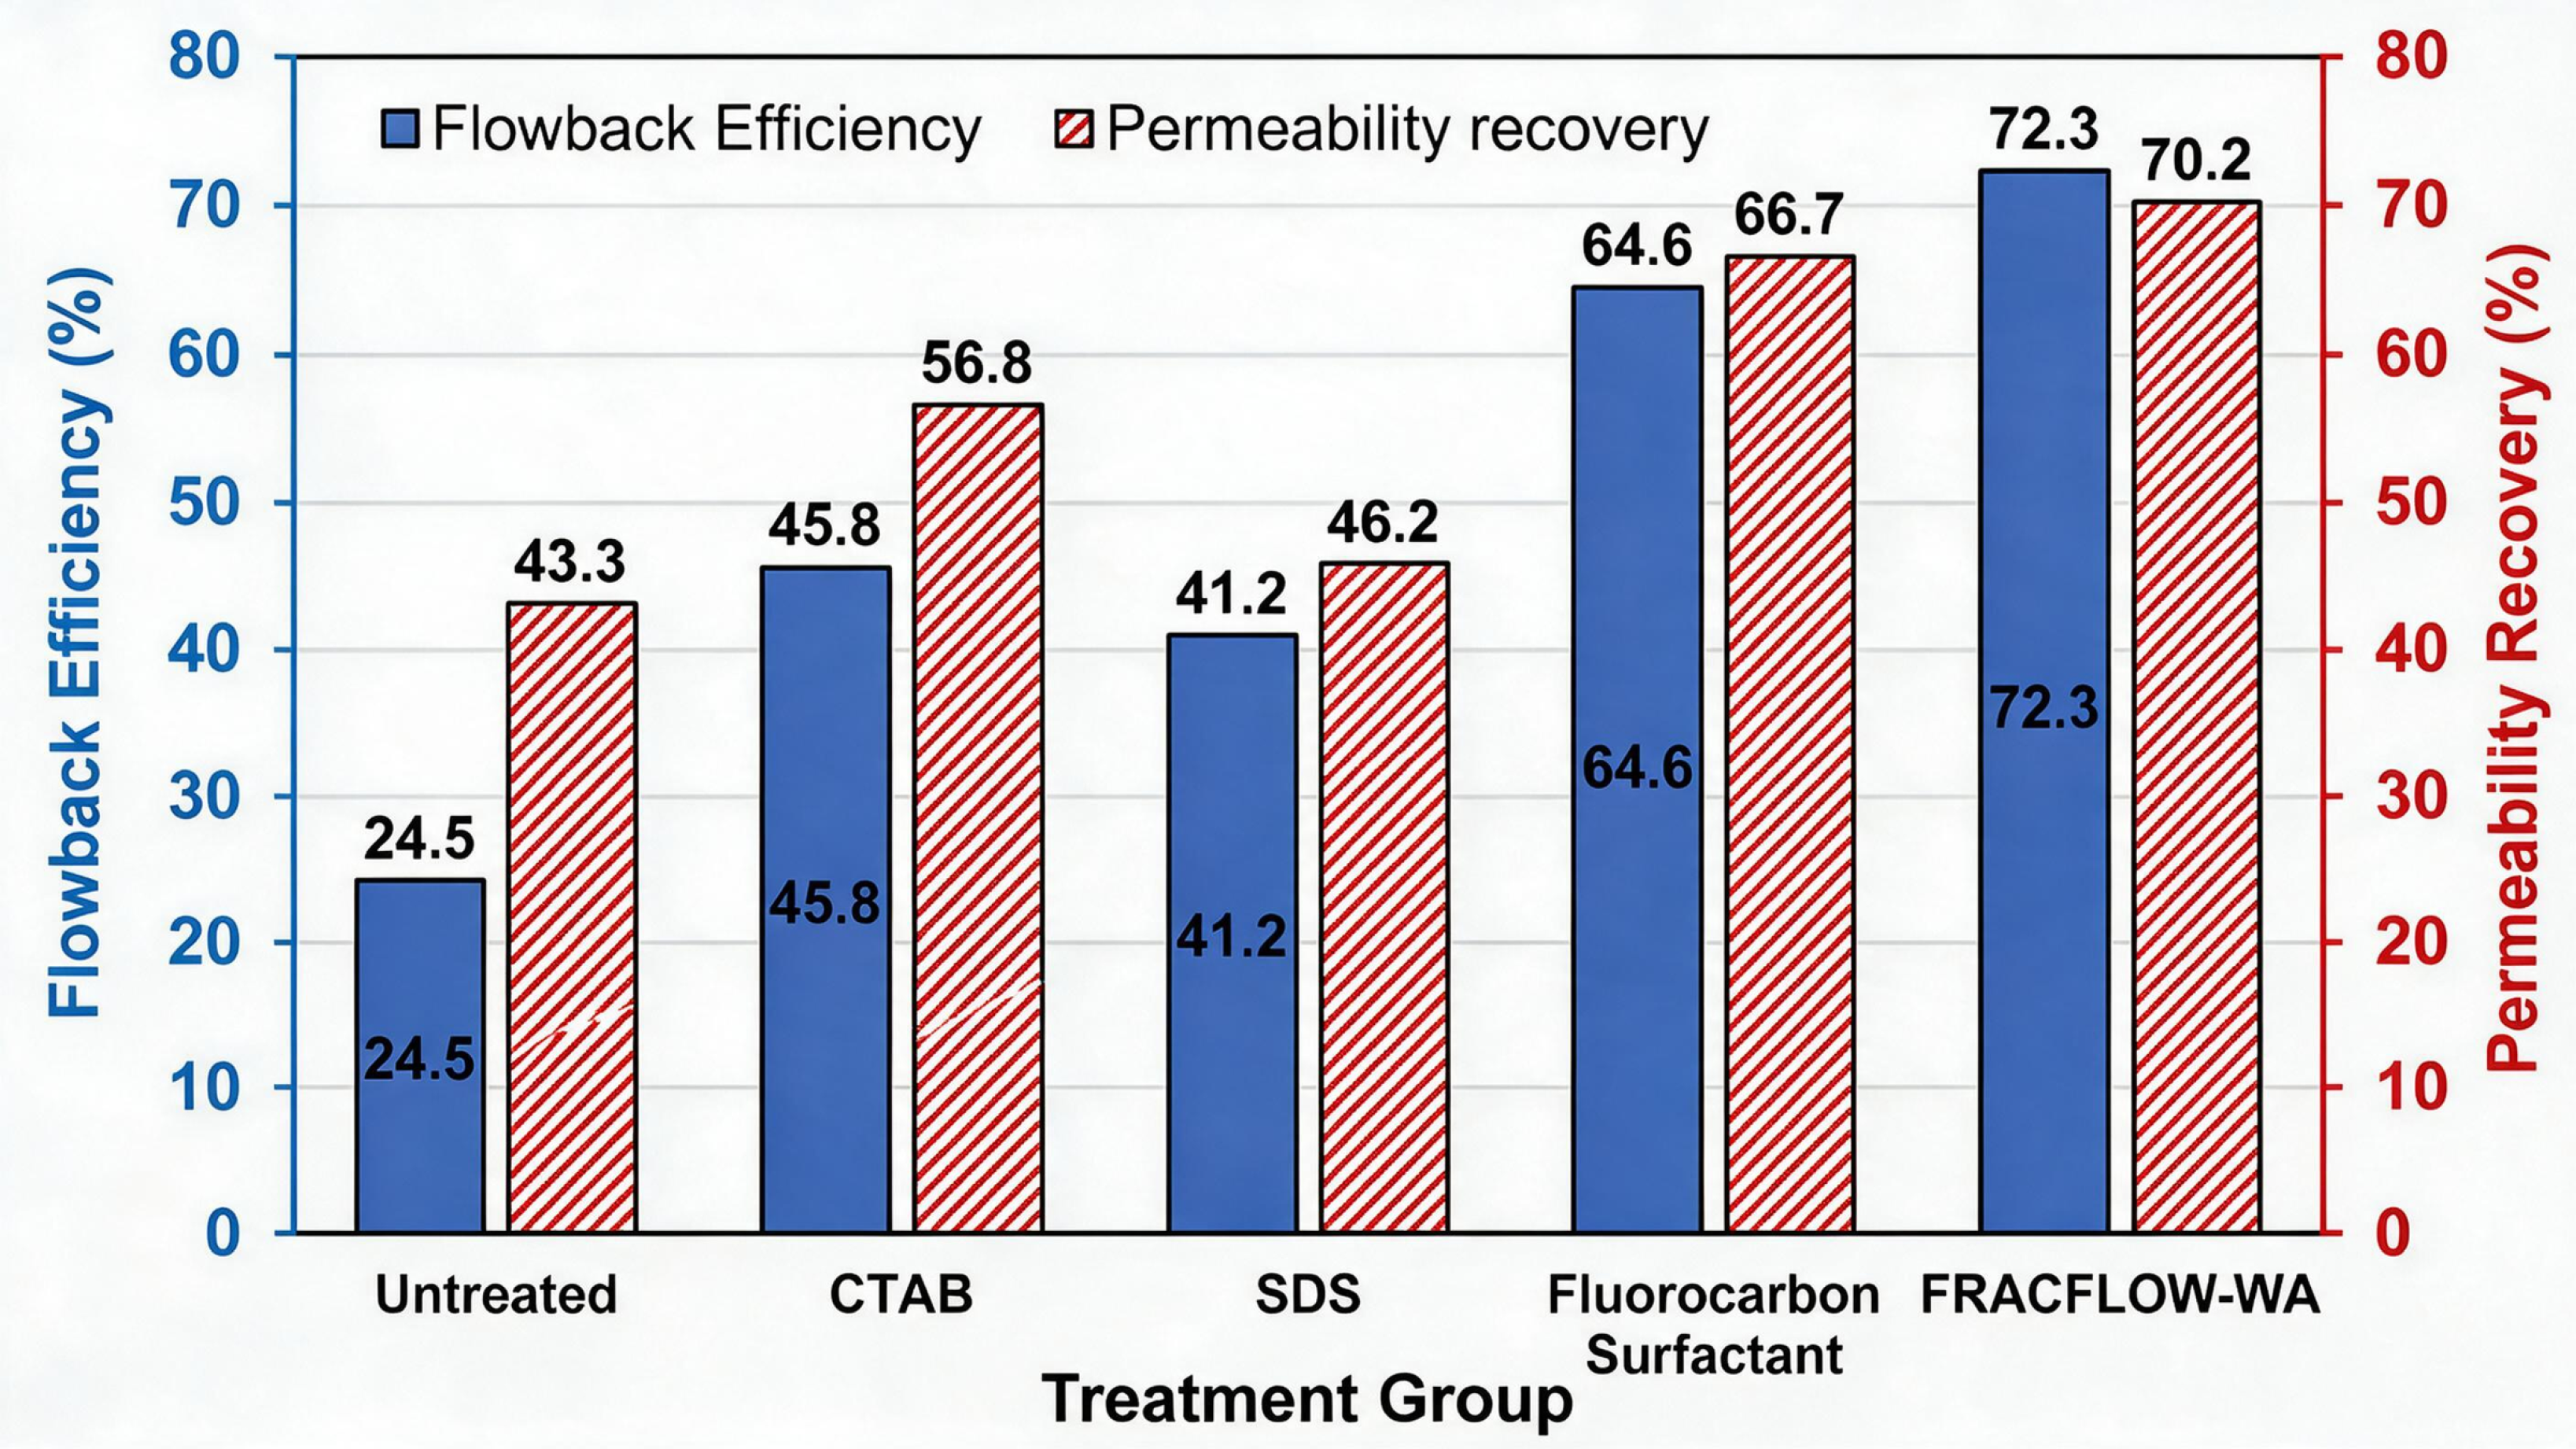
To compare the performance of the FRACFLOW-WA nano-emulsion against existing technologies, core flooding experiments were conducted using three conventional flowback aids. All experiments were performed under identical conditions. The results are presented in Figure 9.
Figure 9.
The performance of the FRACFLOW-WA nano-emulsion against widely used surfactants for improving flowback using the same experiments.
The cationic surfactant CTAB improves flowback efficiency to 45.8%. The gas permeability recovery reaches 56.8% after CTAB treatment. The limited effectiveness of CTAB is attributed to its adsorption mechanism. During flow-back, a significant portion of the adsorbed CTAB is desorbed by the flowing fluid, di-minishing its effectiveness over time. The anionic surfactant SDS performs even less effectively, with a final flowback efficiency of only 41.2% and a permeability recovery of 46.2%. The poor performance is due to the electrostatic repulsion between the negatively charged SDS molecules and the negatively charged sandstone surface, which inhibits adsorption. The fluorocarbon surfactant, widely considered one of the most effective flowback aids currently available, achieves a final flowback efficiency of 64.6%. The permeability recovery reaches 66.7%, significantly better than both CTAB and SDS. However, the performance of the fluorocarbon surfactant is still inferior to that of the FRACFLOW-WA nano-emulsion, which achieves a 72.3% flowback efficiency, and the permeability recovery can be improved to 70.2%.
2.4. Mechanism of FRACFLOW-WA Improving the Flowback Efficiency of Fracturing Fluids
The effects of FRACFLOW-WA on shale wettability, capillary force and microstructure were analyzed by capillary imbibition experiments, N2 adsorption experiments, SEM-EDS and capillary force experiment. Based on the above experimental results, the mechanism of FRACFLOW-WA improving the flowback efficiency of fracturing fluids is proposed.
2.4.1. Capillary Imbibition Experiments
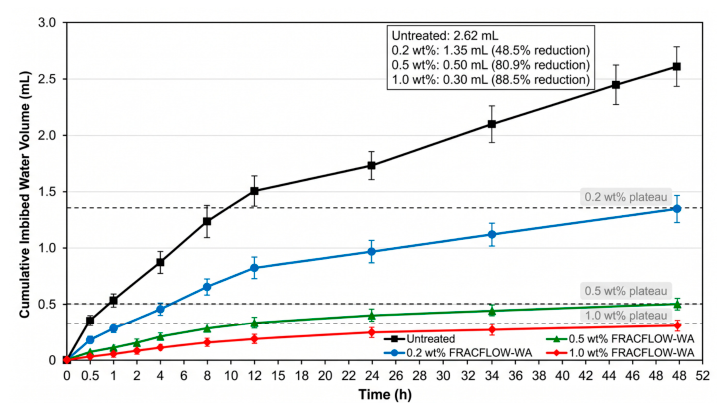
Capillary imbibition, the spontaneous uptake of wetting fluid into porous media driven by capillary pressure, is a classic experimental method for quantifying rock wettability. Figure 10 shows the capillary imbibition data of core samples treated by different concentrations. The untreated core exhibits significant spontaneous water imbibition, with rapidly increasing imbibed water volume during the first 12 h and gradually approaching a plateau of 2.62 ± 0.13 mL at 48 h. This behavior is characteristic of strongly water-wet porous media, indicating that the majority of the pore network is highly water-wet and readily imbibes water.
After treatment with 0.2 wt% FRACFLOW-WA, the total imbibed volume at 48 h is reduced to 1.35 ± 0.11 mL, representing a 48.5% reduction compared to the untreated core. This indicates that the hydrophobic film formed at this concentration partially covers the pore surfaces. The contact angle at this concentration places the surface in the weakly water-wet to intermediate-wet regime, which is consistent with the observed moderate reduction in capillary-driven imbibition. At 0.5 wt%, a substantially greater suppression of imbibition can be seen with the total imbibed volume decreasing to 0.50 ± 0.07 mL at 48 h, corresponding to an 80.9% reduction. This dramatic improvement reflects the more complete surface coverage at higher concentration. An amount of 1.0 wt% FRACFLOW-WA further suppresses imbibition to 0.30 ± 0.05 mL, achieving an 88.5% reduction relative to the untreated core, suggesting that the surface approaches saturation at approximately 0.5–1.0 wt%.
The concentration-dependent of imbibition reveals that higher FRACFLOW-WA concentrations yield progressively lower imbibition volumes, with the effect approaching a plateau at concentrations above 0.5 wt%. The capillary imbibition experiments demonstrated that the FRACFLOW-WA nano-emulsion progressively transforms the rock surface from water-attracting to water-repelling as the treatment concentration increases, thereby fundamentally altering the fluid retention behavior at the core scale.
Figure 10.
Capillary imbibition data of core samples treated by different concentrations.
2.4.2. N2 Adsorption–Desorption Isotherms and Pore Structure Analysis
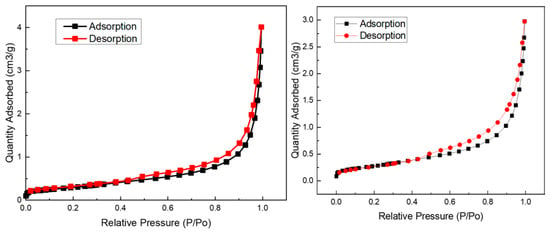
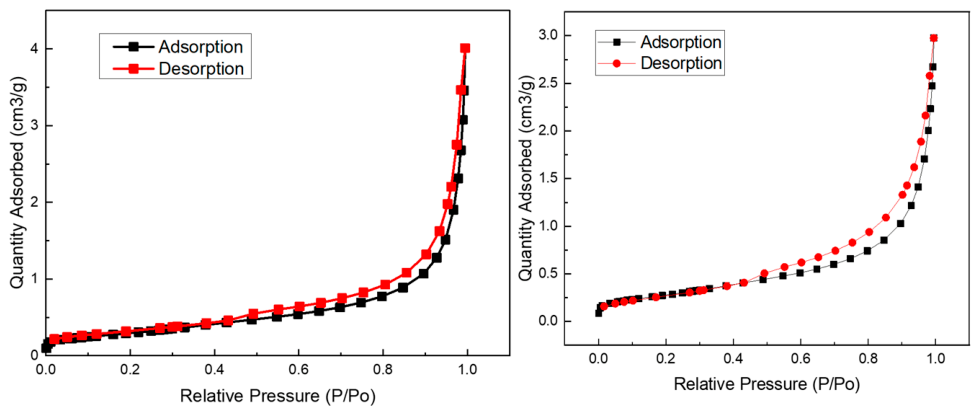
To rigorously evaluate whether the nano-emulsion treatment causes pore blockage or alters the original pore characteristic, low-temperature N2 physisorption was performed on the same core sample before (sample #1) and after (sample #2) treatment with 0.50 wt% FRACFLOW-WA nano-emulsion. The N2 adsorption–desorption isotherms presented in Figure 11 provide a qualitative insight into the pore geometry.
Figure 11.
N2 adsorption–desorption isotherms comparing Sample 1# (before treatment) and Sample 2# (after treatment with 0.50 wt% FRACFLOW-WA nano-emulsion).
Both the untreated and treated cores exhibit Type IV isotherms according to the IUPAC classification, characterized by a distinct capillary condensation step at intermediate relative pressures (P/P0 ≈ 0.4–0.9) and a well-defined H3-type hysteresis loop. This isotherm type is typical of mesoporous materials with slit-shaped pores, which is the dominant pore geometry in tight sandstone reservoirs. The hysteresis loop originates from the difference between the adsorption and desorption mechanisms in porous networks; a H3 loop is characteristic of slit-shaped pores formed by plate-like particles, where capillary condensation and evaporation occur through different mechanisms. Critically, the adsorption–desorption hysteresis loops maintain the characteristic Type H3 shape, indicating that the slit-shaped pore geometry is unaltered by the treatment. However, the treated core shows a lower total N2 uptake than the untreated core, consistent with the reduction in BJH pore volume (26%). The difference is most pronounced at high relative pressures (P/P0 > 0.8), where capillary condensation in larger mesopores and macropores occurs. This reduction is attributed to the hydrophobic film occupying a portion of the pore volume in the larger pores, while micropores and small mesopores remain largely unaffected, as confirmed by the nearly unchanged BET surface area.
The original data calculated based on BET/BJH, including BET specific surface area, BJH adsorption pore volume, BJH desorption pore volume, BJH average adsorption pore diameter, and BJH average desorption pore diameter, are shown in Table 1. The BET surface areas calculated from the isotherms are 1.0415 m2/g (untreated) and 1.0345 m2/g (treated), showing a negligible variation of only −0.67%. This near-identical surface area provides the most decisive quantitative evidence that the nano-emulsion does not deposit as thick aggregates or block the pore entrances.
Table 1.
The BET/BJH data from N2 adsorption–desorption isotherms.
From BET surface area and pore volume reduction, assuming uniform film coverage over the entire pore surface, the film thickness is given by
where ΔD represents the reductions in BJH average desorption pore diameter before and after treatment.
According to the calculation results of BET/BJH, the estimated thickness of the film is approximately 2.34 nm. This thickness can be considered to have no significant impact on the pore size of the core. Therefore, we can reasonably assume that the membrane formed by the nano-emulsion in the pore space does not affect the pore structure of the core based on the results of BET/BJH.
Critically, the nearly identical BET surface area and the overlapping pore size distribution curves confirm that the observed volume reduction is attributable to surface-confined film formation rather than pore-filling deposition or structural damage.
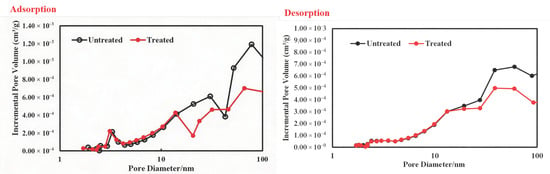
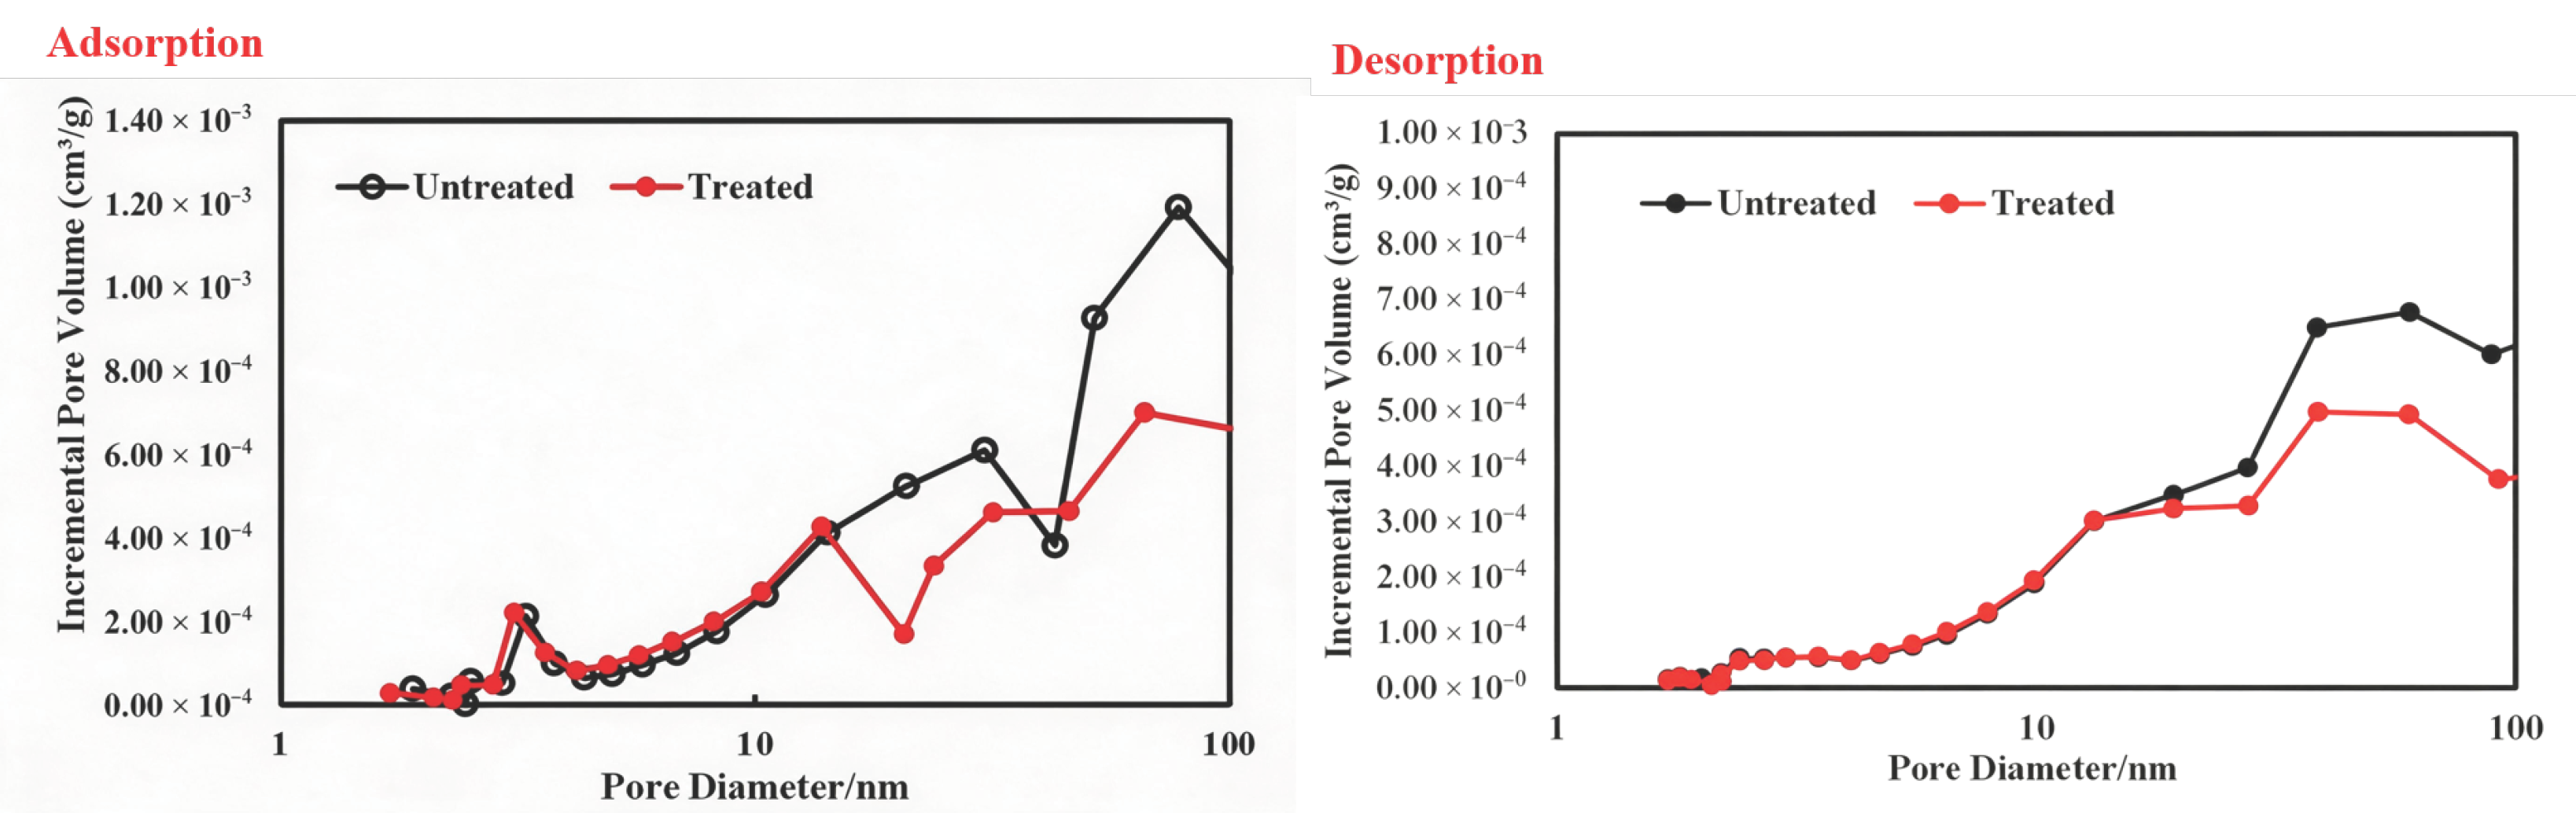
The apparent discrepancy between the negligible change in BET surface area and the moderate reduction in BJH pore volume is attributed to the selective coverage of pores by the nano-emulsion. Because the nano-emulsion particles cannot access micropores and small mesopores, the surface area contributed by these pores remains unchanged. Since larger pores dominate the total pore volume but contribute little to the total surface area, the pore volume decreases noticeably while the BET surface area remains nearly constant. The BJH pore size distribution curves (Figure 12) support this interpretation. In the small-pore region, the curves for untreated and treated cores are nearly superimposable, confirming that micropores and small mesopores are unaffected. In the large-pore region, the treated core shows a clear reduction in incremental pore volume, consistent with film formation on the walls of these larger pores.
Figure 12.
BJH pore size distribution of the same core before and after nano-emulsion treatment.
Taken together, the N2 physisorption analysis unequivocally demonstrates that the FRACFLOW-WA nano-emulsion can modify wettability through film formation on the pore walls, rather than pore-filling deposition or pore-throat blocking. The negligible change in BET surface area, the preservation of the Type IV/H3 isotherm characteristics, and the unchanged hysteresis loop shape collectively confirm that the fundamental pore characteristic and flow pathways of the tight sandstone reservoir are intact after treatment. These findings are critical because they establish that the substantial flowback enhancement observed in core flooding experiments is achieved without compromising the reservoir’s storage and permeability capacity.
2.4.3. Micromorphology Analysis
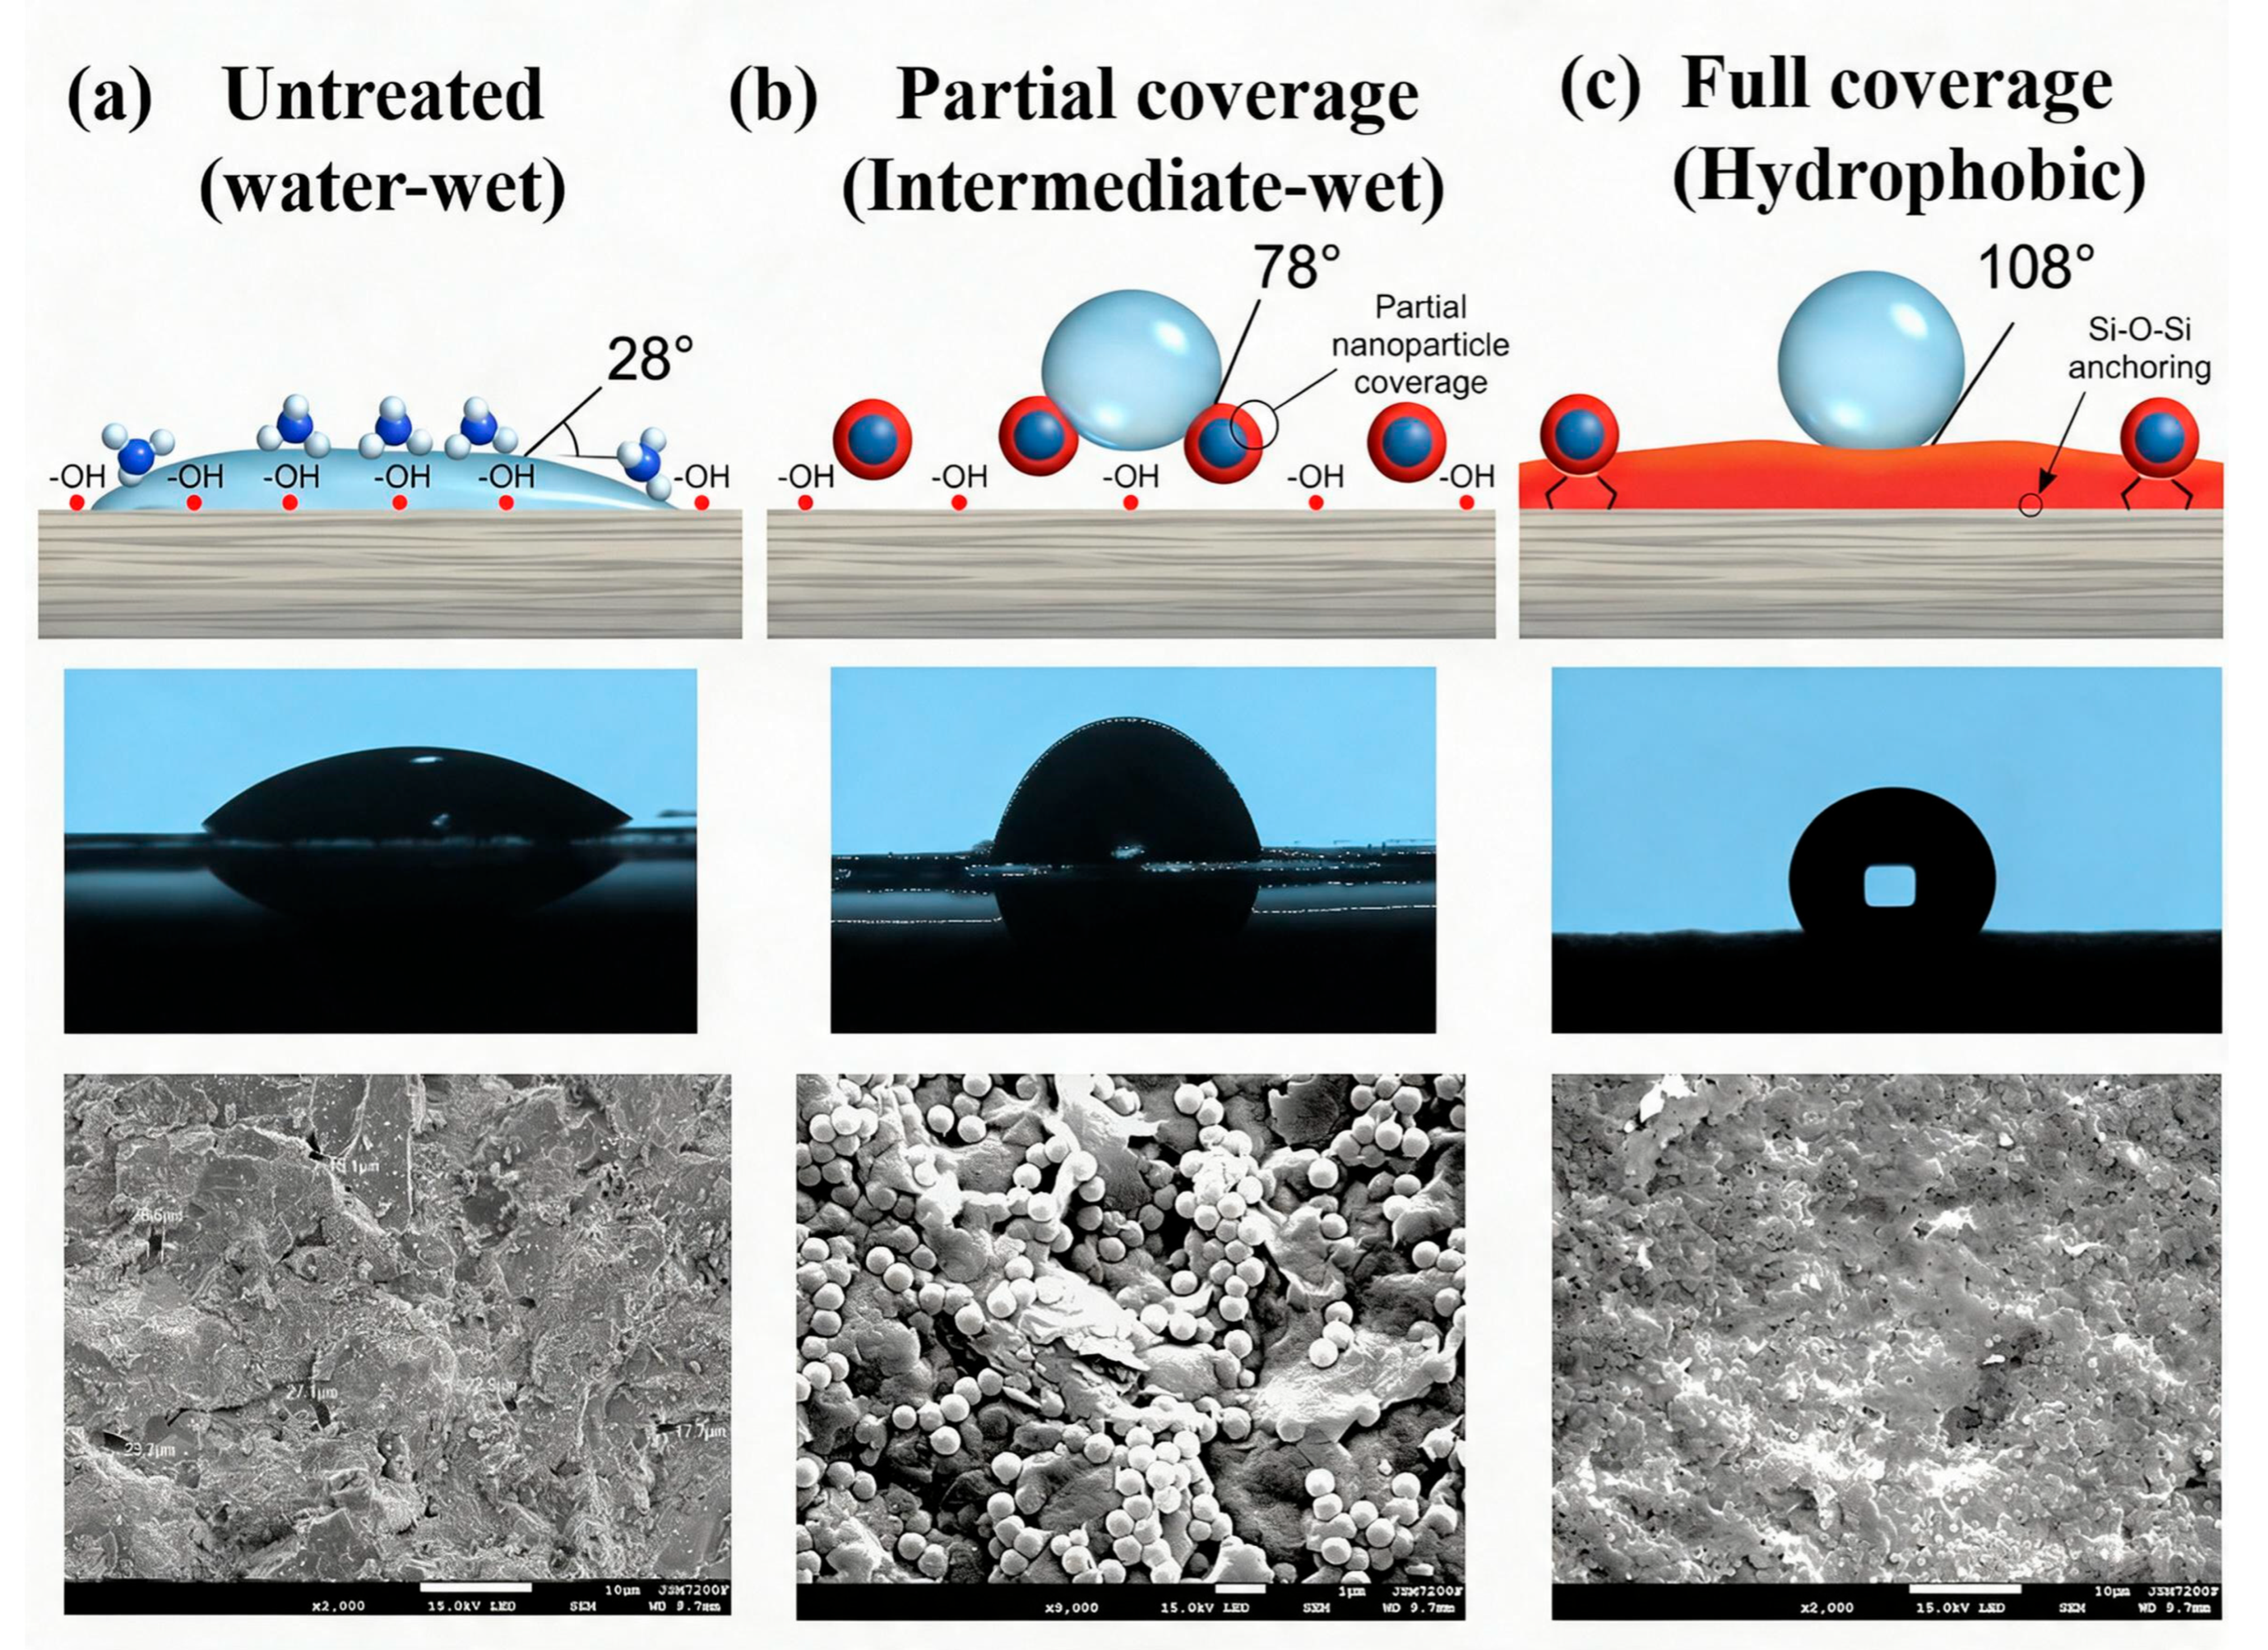
The concentration-dependent wettability transition follows a progressive surface coverage mechanism, which is elucidated by the schematic illustration and directly supported by the SEM images in Figure 13. The untreated rock surface displays a bare, rough mineral morphology. After treatment with 0.5 wt% FRACFLOW-WA, the number of FRACFLOW-WA nanoparticles available for adsorption is insufficient to achieve complete surface coverage. Consequently, the rock surface remains predominantly hydrophilic with only isolated patches of hydrophobic domains, resulting in a low contact angle. When the concentration reaches 1.0 wt%, sufficient nanoparticles are adsorbed to achieve complete coalescence into a continuous, dense hydrophobic film, fully shielding the underlying hydrophilic rock surface and yielding a high contact angle of 108°. It can be directly confirmed by the SEM images that after treatment with 1.0 wt% FRACFLOW-WA, a uniform, continuous film covers the entire rock surface, with no visible bare mineral patches, confirming complete surface modification.
Figure 13.
Mechanism of concentration-dependent wettability alteration with FRACFLOW-WA. The particle size and morphology were captured using SEM-EDS.
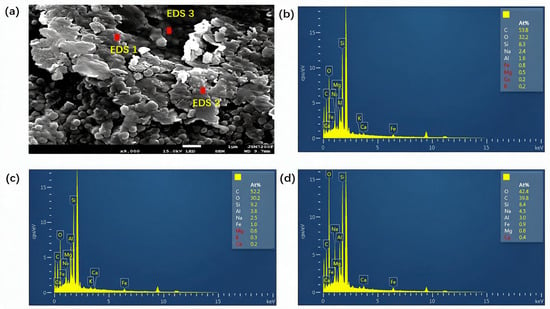
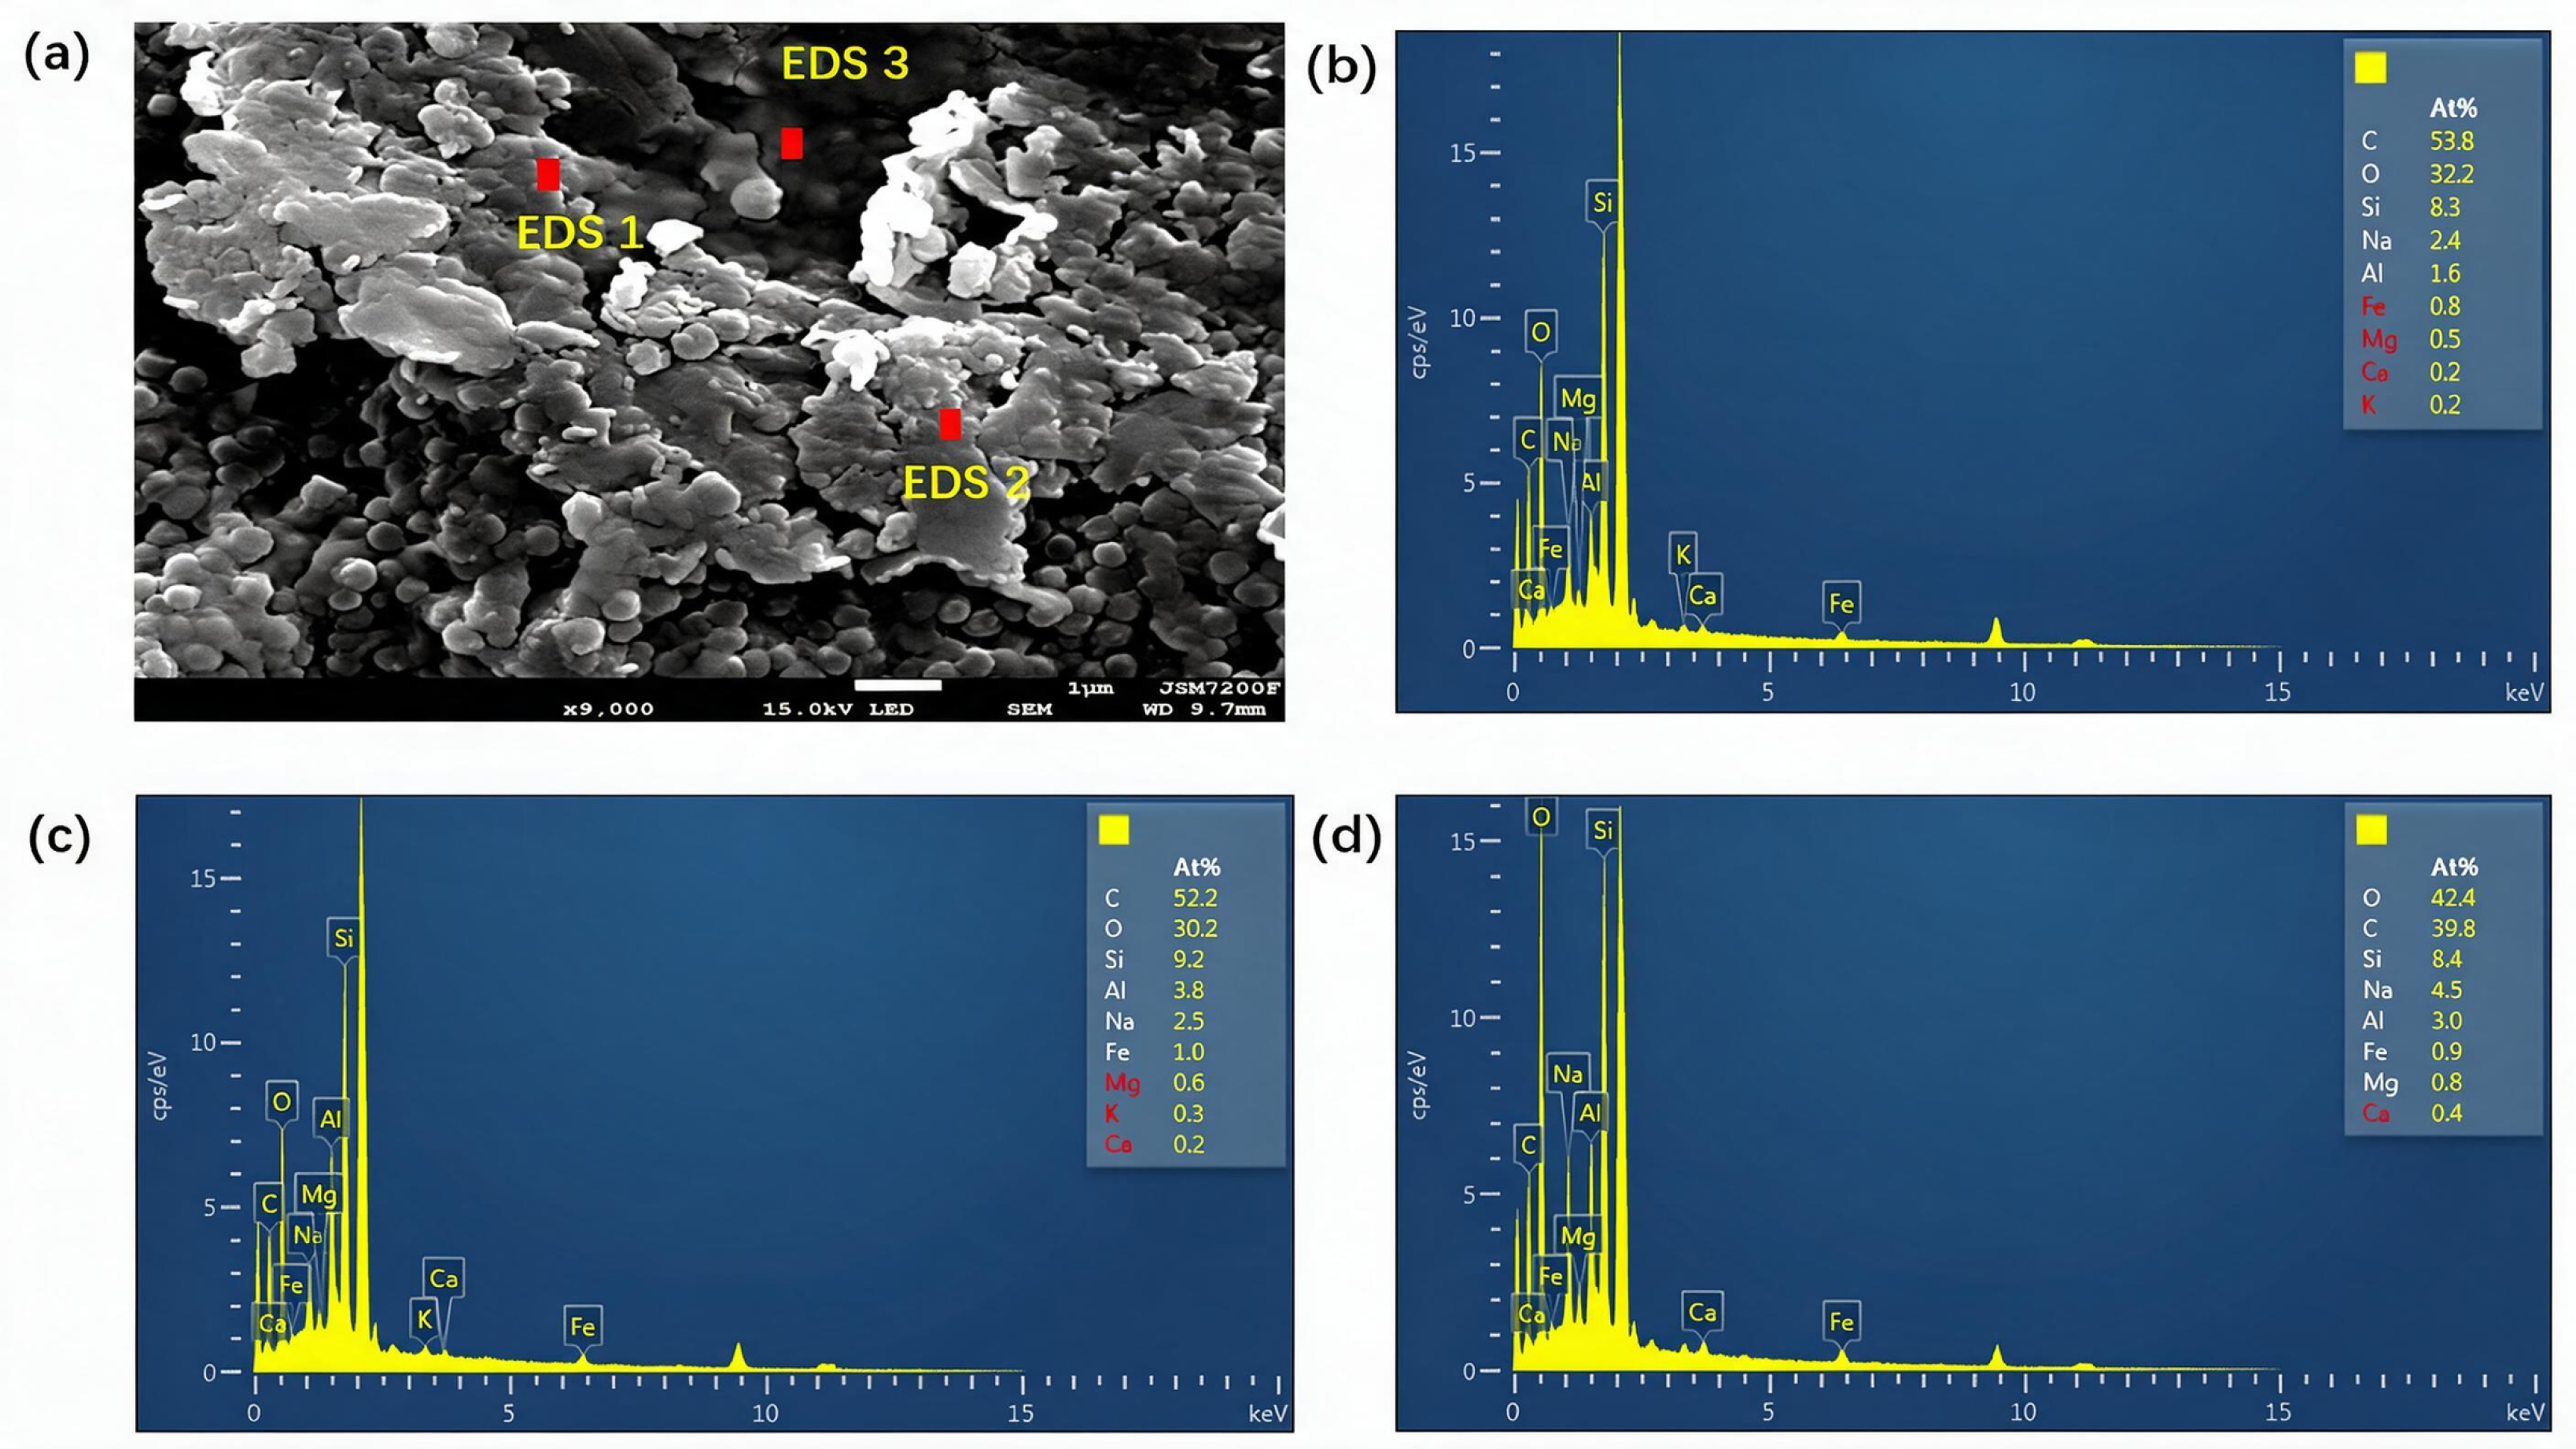
EDS analysis was performed on visually identified film-covered areas, which exhibited a smooth and continuous coating morphology, as shown in Figure 14. These regions showed prominent C, O, and Si signals. Because the polymer film is organic in nature, the presence of carbon on the coated areas, together with the morphological evidence, supports the formation of a hydrophobic film. This film-forming behavior is attributed to the unique core–shell structure of FRACFLOW-WA. The soft P(BA-KH550) shell enables particle deformation and lateral fusion under reservoir temperature, allowing the initially discrete nanoparticles to merge into a contiguous film, while the crosslinked PSt-DVB core provides mechanical integrity to the film structure. The chemical anchoring of the KH550 silane groups to surface hydroxyls (Si–O–Si covalent bonding) ensures the film remains firmly attached to the rock surface.
Figure 14.
SEM-EDS results of core sample surface treated by FRACFLOW-WA. (a) SEM image; (b) The element distribution of point EDS1 in core sample surface; (c) The element distribution of point EDS2 in core sample surface; (d) The element distribution of point EDS3 in core sample surface.
2.4.4. Capillary Height
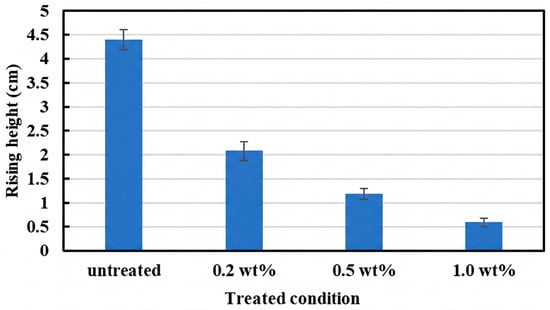
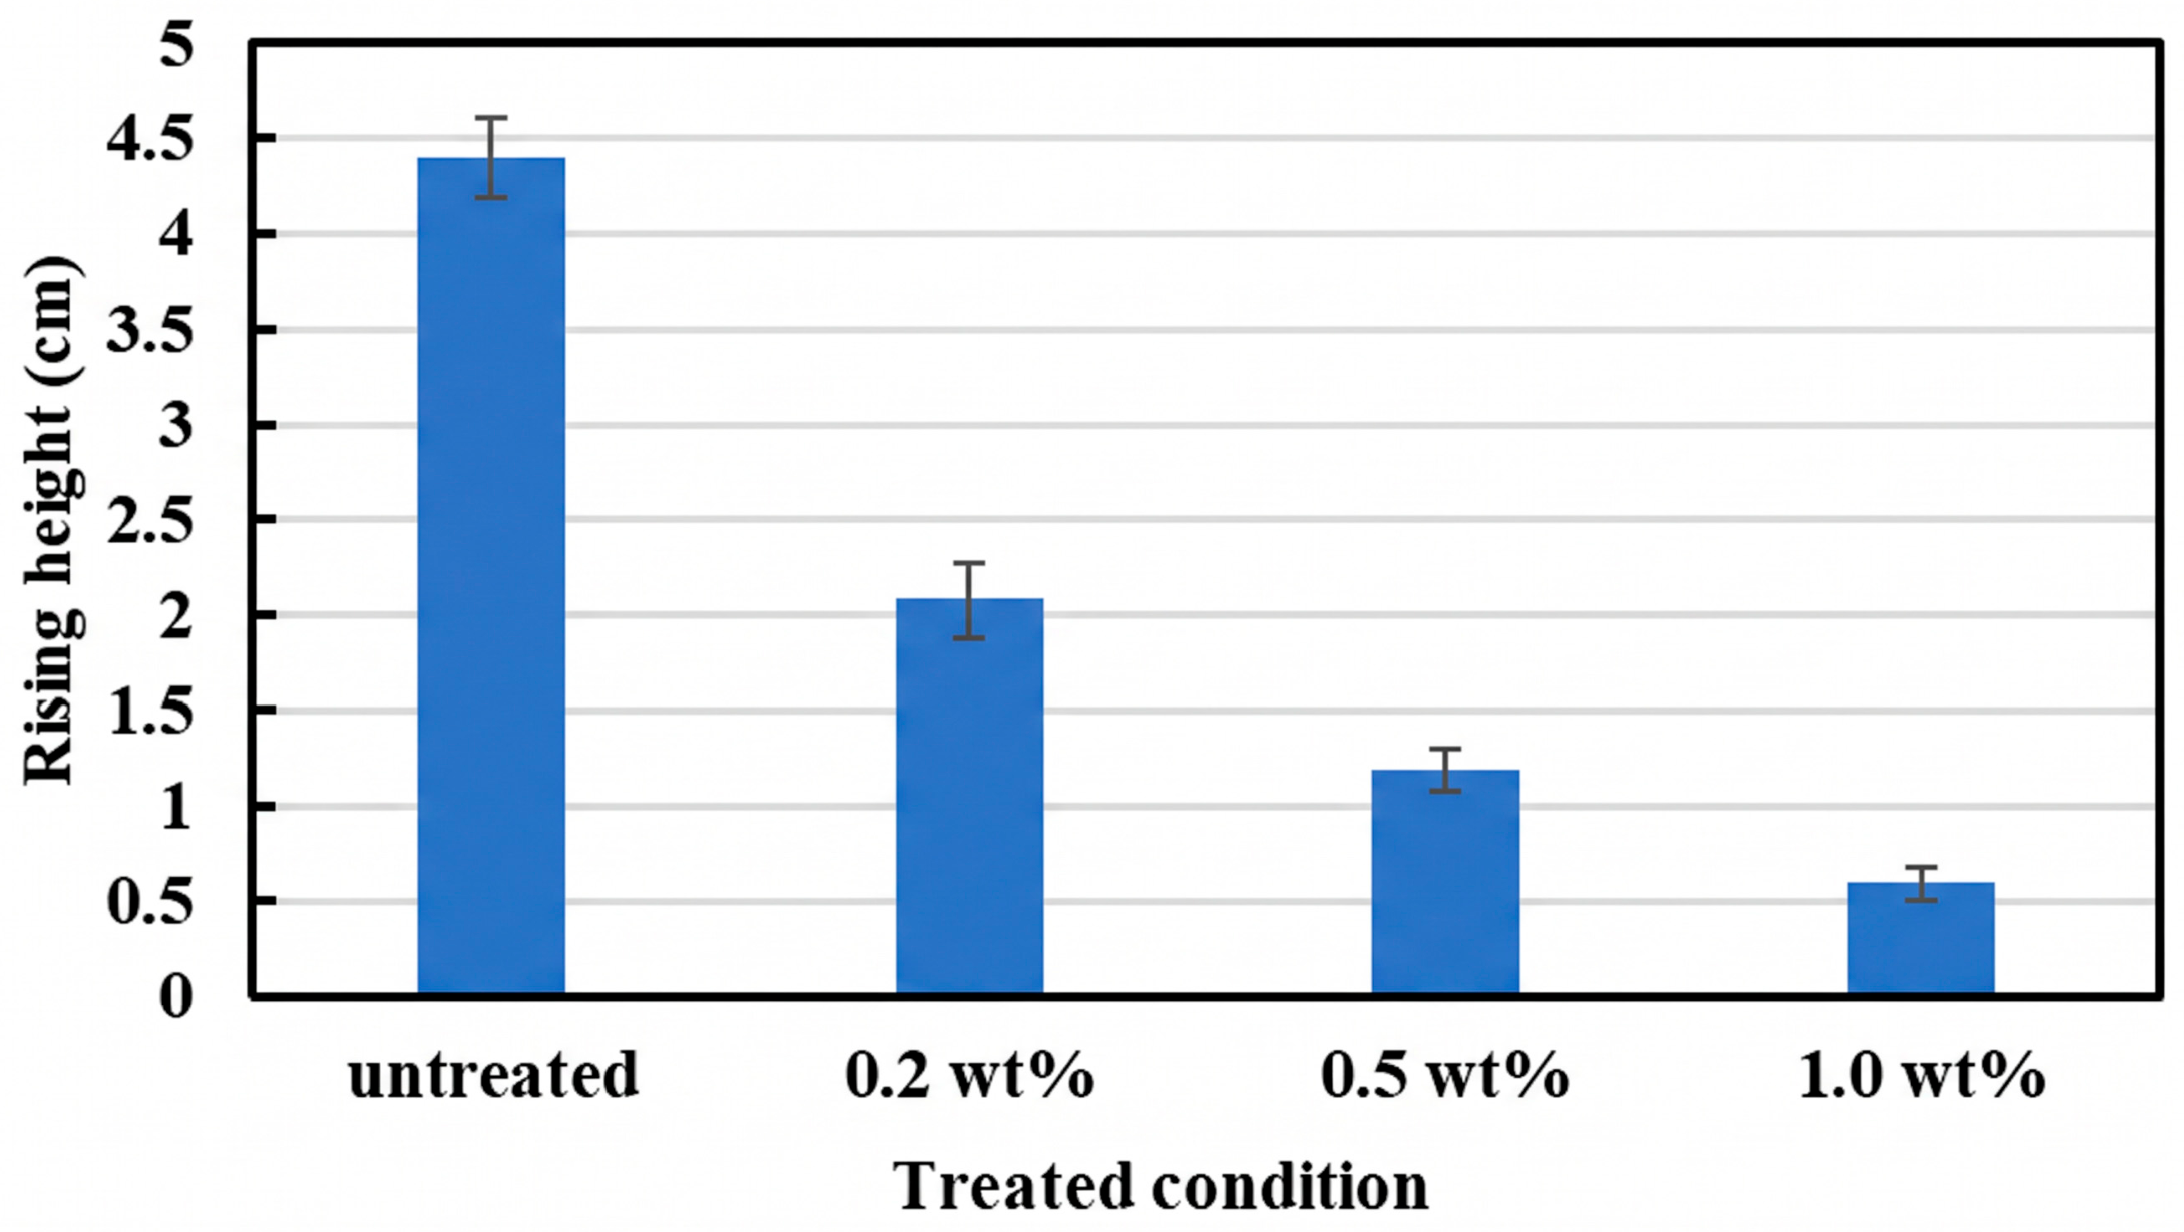
Figure 15 demonstrates the rising height of the water in the glass capillary tube after soaking with different concentrations of FRACFLOW-WA. The experimental results demonstrate that the equilibrium water rise height in the untreated capillary is 4.40 cm, indicating that the inner surface of the untreated capillary exhibits strong hydrophilicity, and the capillary force is substantia. For hydrophilic surfaces, water molecules form extensive hydrogen bonds with the silanol groups (-OH) present on the glass surface, resulting in a low effective contact angle and a large positive capillary pressure.
Figure 15.
The rising height of the water in the glass capillary tube after soaking with different concentrations of FRACFLOW-WA.
After treatment with FRACFLOW-WA nano-emulsion at different concentrations, the equilibrium water rise height decreased significantly in a concentration-dependent manner. In the capillary treated with 0.2 wt% FRACFLOW-WA, the water rise height was reduced to 2.10 cm, representing a 52.3% reduction compared to the untreated control. When the concentration of FRACFLOW-WA was increased to 0.5 wt%, the rising height of water further decreased to 1.20 cm. At the highest tested concentration of 1.0 wt%, the water rise height decreased to only 0.60 cm with an 86.4% reduction.
The magnitude of capillary force is fundamentally governed by the wettability of the capillary surface. Untreated capillary surfaces are highly hydrophilic due to the abundance of surface silanol groups (-Si-OH), which interact strongly with water molecules through hydrogen bonding. This strong water–surface interaction results in a large positive capillary pressure.
Following FRACFLOW-WA treatment, the inner surface of the capillary is modified by the adsorption of nanoparticles and the subsequent formation of a hydrophobic film. The KH550 silane groups on the shell layer of the nanoparticles form covalent Si-O-Si bonds with the surface silanol groups, anchoring the nanoparticles firmly to the glass surface. Upon coalescence during the treatment and drying process, these nanoparticles form a continuous hydrophobic film that effectively shields the underlying hydrophilic glass surface from direct contact with water molecules. The reduction in water rise height directly reflects the progressive surface coverage by the hydrophobic film.
2.4.5. Mechanism Analysis
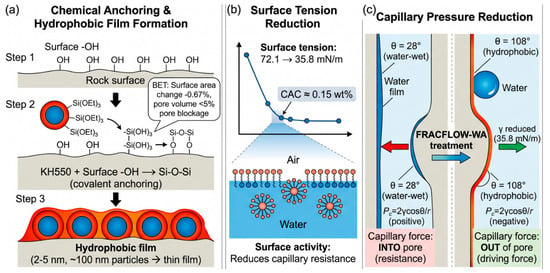
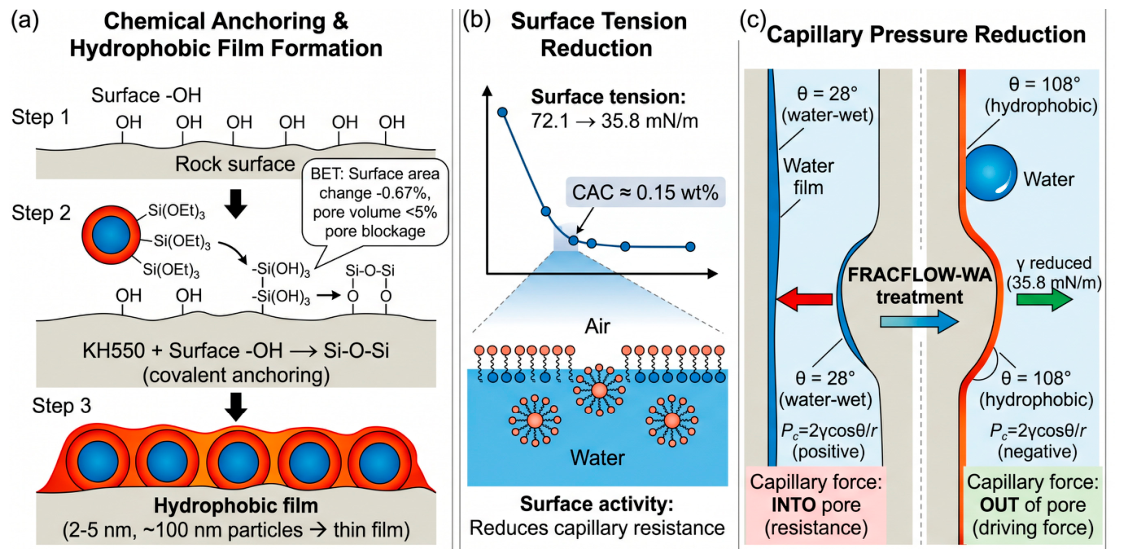
Based on the above results, the mechanism by which FRACFLOW-WA nano-emulsion enhances fracturing fluid flowback can be summarized as shown in Figure 16.
Figure 16.
Schematic diagram of the mechanism by which FRACFLOW-WA nano-emulsion enhances fracturing fluid flowback.
Firstly, the silanol groups (-Si(OH)3) formed after the hydrolysis of the KH550 silane groups of the nanoparticles react with the surface silanol (Si-OH) on the rock pore walls, resulting in the formation of stable covalent Si-O-Si bonds. After adsorption, the soft copolymer particles fuse at reservoir temperatures, forming a continuous hydrophobic film on the pore surface.
Secondly, the FRACFLOW-WA nano-emulsion exhibits surface activity, reducing the surface tension of aqueous dispersions from 72.1 mN/m (pure water) to 35.8 mN/m at 1.0 wt% concentration. This surface tension reduction further contributes to the decrease in capillary pressure, as described by the Young–Laplace equation. The combined effect of surface tension reduction and wettability alteration from hydrophilic to hydrophobic synergistically lowers the capillary retention force.
In summary, FRACFLOW-WA enhances fracturing fluid flowback through a synergistic mechanism of wettability alteration (hydrophobic film formation via chemical anchoring without pore structure alteration), surface tension reduction, and consequent capillary pressure reduction. These mechanisms jointly transform the pores from a highly hydrophilic surface to a hydrophobic surface, thereby achieving superior flowback performance.
Unlike previously reported core–shell nanohybrids that rely on inorganic silica cores with post-grafted polymer shells, the present FRACFLOW-WA nano-emulsion employs a crosslinked organic core (PSt–DVB) that provides mechanical robustness without an inorganic scaffold, while KH550 is copolymerized directly into the shell layer. This design enables the silane groups to form covalent Si–O–Si bonds with rock surfaces, rather than relying on reversible physical adsorption. In contrast to silane-functionalized nanoparticles, which alter wettability through discrete particle adsorption, FRACFLOW-WA undergoes a particle-to-film transition, coalescing into a continuous hydrophobic film with a thickness of only 2.34 nm—thin enough to avoid pore-throat blockage yet durable enough to resist fluid flushing. Conventional nano-emulsion flowback aids, which function primarily by reducing surface tension and reversible wettability alteration, typically lose effectiveness within a few pore volumes. This dual functionality enables durable wettability alteration without compromising reservoir permeability, a combination not available in existing core–shell, silane-functionalized, or nano-emulsion systems.
3. Conclusions
In this study, a crosslinked core–shell polymer nano-emulsion (FRACFLOW-WA) was successfully synthesized via semi-continuous emulsion polymerization and evaluated for enhancing fracturing fluid flowback in tight sandstone reservoirs. The nano-emulsion exhibited a well-defined core–shell structure with an average particle size of 91.7 nm and excellent colloidal stability. Treatment effectively altered rock wettability from strongly water-wet to hydrophobic, with the water contact angle increasing from 28° to 108°. This was achieved through chemical anchoring of KH550 silane groups to surface hydroxyls via Si–O–Si covalent bonds, followed by particle coalescence into a continuous hydrophobic film of 2.34 nm thickness without pore-throat blockage, as confirmed by BET/BJH analysis. Core flooding results showed that at 1.0 wt%, FRACFLOW-WA increased the flowback efficiency from 34.2% to 72.3%, with a permeability recovery of ~70%, indicating minimal formation damage. The enhanced performance is attributed to the synergistic effects of wettability reversal, surface tension reduction, and capillary pressure reversal. Compared with conventional surfactants, FRACFLOW-WA offers a clear durability advantage due to its covalently anchored film. These findings demonstrate the practical potential of this nano-emulsion for improving fracturing fluid recovery in tight reservoirs.
4. Materials and Methods
4.1. Materials
Styrene (St, ≥99%), butyl acrylate (BA, ≥99%), divinylbenzene (DVB, 80%), γ-Aminopropyl triethoxysilane (KH550, ≥98%), ammonium persulfate (APS, ≥98%), sodium dodecyl sulfate (SDS, ≥99%), and sodium bicarbonate (NaHCO3, ≥99.5%) were purchased from Macklin Biochemical Technology Co., Ltd. (Shanghai, China) and used as received without further purification. Deionized water (resistivity > 18.2 MΩ·cm) was used throughout all experiments.
The core samples used in this study were from tight sandstone cores from the Ordos Basin in China, and their rock physical properties are summarized in Table 2. Before each experiment, the core sample was treated with the Soxhlet extraction method using toluene/methanol (70:30 v/v) for 48 h to remove residual hydrocarbons and salts, and then dried in a vacuum oven at 80 °C for 24 h until constant weight was achieved. Porosity was measured using a helium porosimeter, and permeability was measured according to the steady-state gas flow under Darcy’s law [32].
Table 2.
The parameters and uses of core samples.
4.2. Preparation of FRACFLOW-WA
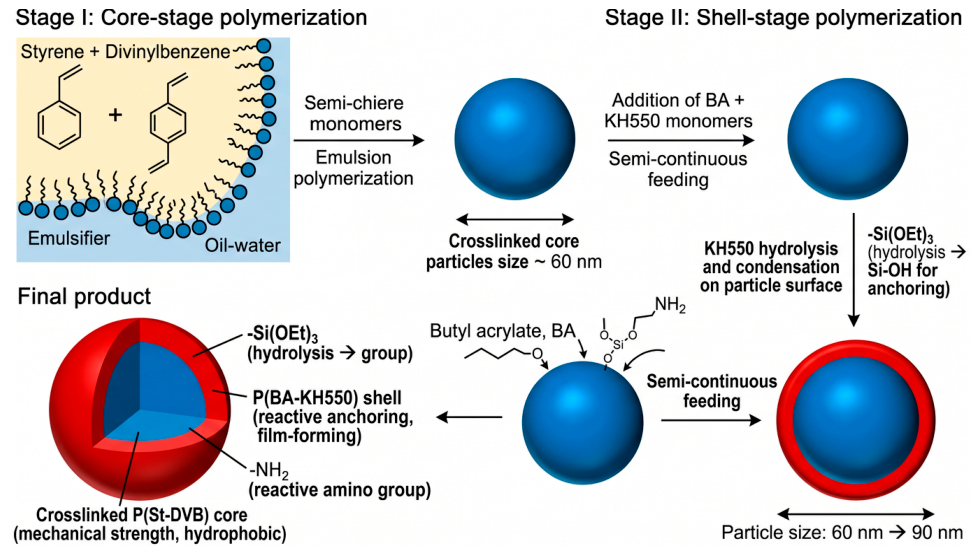
The core–shell P(St-DVB)-g-P(BA-KH550) nano-emulsion, designated as FRACFLOW-WA, was synthesized via a semi-continuous emulsion polymerization method. The synthesis proceeded in two stages: core-stage polymerization and shell-stage polymerization, showing in Figure 17 [33]. Table 3 gives the list of components for preparing FRACFLOW-WA.
Table 3.
The list of components for preparing FRACFLOW-WA.
Core-Stage Polymerization: The core-stage polymerization was carried out in a 500 mL four-necked round-bottom flask equipped with a mechanical stirrer, a reflux condenser, a nitrogen inlet, and a thermocouple. The reactor was placed in a temperature-controlled water bath maintained at 75 ± 0.5 °C. First, 200 mL of deionized water was poured into the reactor, followed by the addition of 2.0 g of SDS as the emulsifier and 0.3 g of NaHCO3 as the pH buffer. The solution was stirred at 300 rpm for 30 min under nitrogen purging to remove dissolved oxygen. Subsequently, a monomer mixture consisting of 30.0 g of styrene and 3.0 g of divinylbenzene (DVB) was added dropwise into the reactor over a period of 30 min. After pre-emulsification for 1 h, the temperature was raised to 75 °C, and 0.25 g of APS (dissolved in 10 mL of deionized water) was injected into the system to initiate polymerization. The reaction was allowed to proceed for 6 h under continuous stirring (400 rpm) and nitrogen atmosphere to obtain the crosslinked core-stage latex particles.
Shell-Stage Polymerization: Following the completion of core-stage polymerization, the temperature was maintained at 75 °C. A monomer emulsion of shell-stage was separately prepared by mixing 10.0 g of butyl acrylate (BA), a certain amount of KH550, 1.0 g of SDS, and 50 mL of deionized water under vigorous stirring for 30 min. This shell monomer emulsion was slowly dropped into the reactor over a period of 3 h. Simultaneously, a second initiator solution (0.10 g of APS in 5 mL of water) was added dropwise to maintain the polymerization. After the complete addition of the shell monomers, the reaction was continued for an additional 3 h to ensure complete monomer conversion. The core–shell nano-emulsion was cooled to room temperature and filtered through a 200-mesh nylon filter to remove any coagulum. The product was designated as FRACFLOW-WA.
Figure 17.
The synthesis proceeded in two stages: core-stage polymerization and shell-stage polymerization.
4.3. Structural Characterizations of FRACFLOW-WA
The chemical structure, electrification and microstructure of FRACFLOW-WA were analyzed by Fourier infrared spectroscopy (FT-IR), potential analysis, scanning electron microscopy (SEM) and transmission electron microscopy (TEM).
- (1)
- FT-IR
Fourier transform infrared (FTIR) spectroscopy was employed to characterize the molecular structure of FRACFLOW-WA. The spectrum was recorded on a Nicolet 6700 FTIR spectrometer (Thermo Fisher Scientific, Waltham, MA, USA) using the KBr pellet method, with a wavenumber range of 4000–400 cm−1 and a resolution of 4 cm−1.
- (2)
- Particle size and Zeta potential
The FRACFLOW-WA dispersion was diluted with deionized water and ultrasonicated for 10 min to ensure uniform dispersion. Dynamic light scattering (DLS) and zeta potential measurements were performed on a Zetasizer Nano ZS90 (Malvern Instruments, Malvern, UK). Each sample was measured in triplicate to confirm data reproducibility and reliability [26].
- (3)
- Microscopic morphology observation
The microscopic morphology of FRACFLOW-WA was examined using a JEM-2100F transmission electron microscope (JEOL, Tokyo, Japan).
4.4. Method of Flowback Evaluation
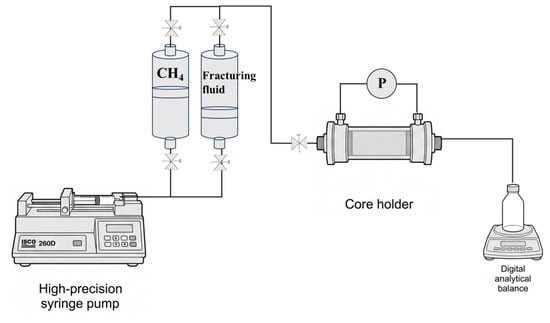
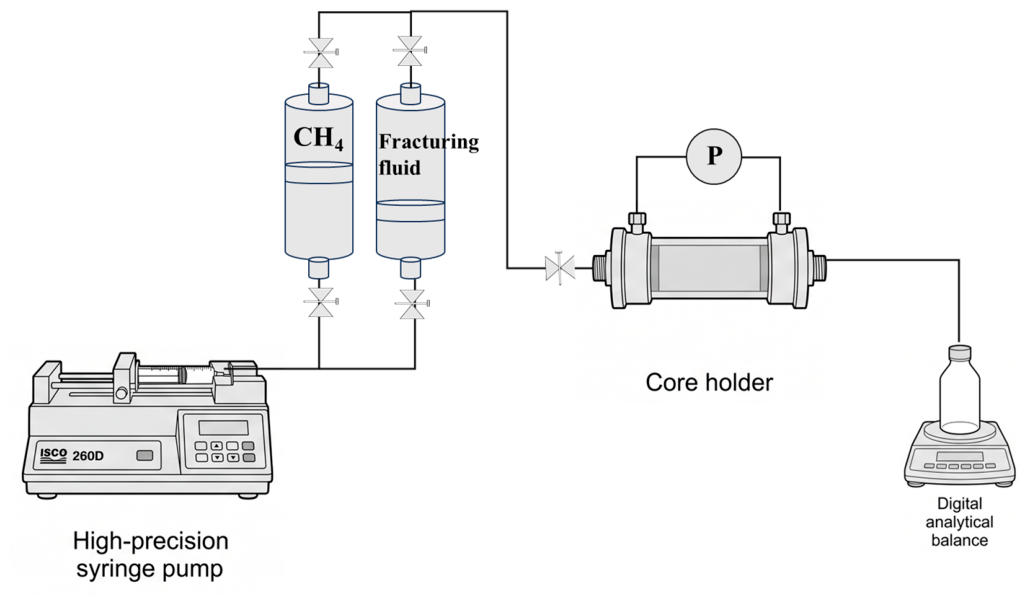
To quantitatively evaluate the effect of FRACFLOW-WA nano-emulsion in improving the flowback of fracturing fluid, a series of core gas displacement experiments were conducted. The experimental setup included a core holder, a precision injection pump (ISCO 260D) for fluid injection, a back pressure regulator, a beaker, a balance, and a differential pressure sensor for real-time pressure monitoring. The setup was manufactured from the Jiangsu Tuochuang Scientific Instruments Co., Ltd.The schematic diagram of the core gas flooding experimental setup can be seen in Figure 18.
Figure 18.
The schematic diagram of the core gas flooding experimental setup.
The core flooding experiments consisted of the following sequential steps:
- (1)
- Initial gas permeability measurement: The dried core was placed in the core holder, and the steady-state gas permeability of the core was measured using methane for testing.
- (2)
- Fracturing fluid injection (simulated fracturing stage): A simulated fracturing fluid was prepared by dissolving 0.5 wt% hydroxypropyl guar gum (Jiangsu Tuochuang Scientific Instruments Co., Ltd) (as a viscosifier) and 0.1 wt% borate crosslinker in synthetic brine, and the nano-emulsion (pre-mixed at the specified concentration) was mixed with the fracturing fluid and injected together. The fracturing fluid was injected at a flow rate of 0.20 mL/min to simulate the fluid invasion during the fracturing operation. During the injection process, the back pressure was maintained at 5 MPa, and the inlet pressure gradually increased as the fluid was injected. When the injection pressure reached 5 MPa, the fracturing fluid was injected into the core at a flow rate of 0.2 mL/min until the flow rate of the fluid flowing out from the outlet end reached a stable state. At this point, the fracturing fluid was considered to be fully saturated with the core pores, and the injected fracturing fluid volume was equal to the pore volume.
- (3)
- Shut-in period: After injection, the core was left to be shut down (without flow) for a period of time at 150 °C to reach the predetermined stable aging period.
- (4)
- Flowback stage: The piston container filled with methane was pressurized to 5 MPa using the injection pump, and then the injection valve of the container was opened to inject the gas into the core. Meanwhile, the back pressure was released to atmospheric pressure. At this point, under the pressure difference, the fracturing fluid in the pore space of the core was displaced by the methane gas. When no extra liquid was displaced from the outlet end, the flowback stage could be considered stable [32].
Then the core sample was taken out and weighed as W1. The difference between the weight of the W1 and the weight of the dry sample (W0) is recorded as the residual fracturing fluid mass.
where ηf is the flowback efficiency, and Vpore is the pore volume of the core sample.
The permeability recovery ratio was defined as the ratio of the gas permeability measured after flowback to the initial gas permeability measured before fracturing fluid injection, both determined under identical conditions.
4.5. Mechanism Analysis Methods
4.5.1. SEM-EDS
The morphology and element distribution of core samples surface before and after core flooding experiments were detected by filed scanning electron microscopy (HITACHI UHR FE-SEM SU8010, Hitachi, Tokyo, Japan) [20,23].
4.5.2. Contact Angle
The core pieces are cut to 25 mm in diameter and 0.5 cm in thickness. The 1200-mesh sandpaper sandstone core sheet was used for polishing to avoid the influence of the heterogeneity of the core sample on the experimental repeatability. The prepared sandstone samples were put into the aging tank, soaked in FRACFLOW-WA dispersion with different concentrations (0.1%, 0.5%, 0.7%,1.0%,1.5%, 2.0%), and then the container was sealed and heated in the incubator at 150 °C for 16 h. After that, the core sheet is removed and dried, and the contact angle is determined using a contact angle meter (JC2000D5M, Shanghai Zhongchen Digital Technic Apparatus Co., Ltd., Shanghai, China). Each sample was tested three times, and the mean and error bars were calculated [19,20,34,35].
4.5.3. Low-Temperature Nitrogen Adsorption–Desorption (BET/BJH)
Low-temperature nitrogen adsorption–desorption measurements were performed to evaluate the specific surface area, pore volume, and pore size distribution of the tight sandstone core samples before and after FRACFLOW-WA treatment. The measurements were conducted using a Micromeritics surface area and porosity analyzer (Micromeritics, Norcross, GA, USA). Prior to analysis, approximately 1.0 g of crushed core sample (particle size fraction: 0.25–0.50 mm) was degassed at 105 °C for 12 h under vacuum to remove adsorbed moisture and volatiles. Nitrogen adsorption–desorption isotherms were measured at −196 °C (liquid nitrogen bath) over a relative pressure (P/P0) range of 0.005 to 0.995. The specific surface area was calculated using the Brunauer–Emmett–Teller (BET) method. The pore size distribution and pore volume were derived from the desorption branch of the isotherm using the Barrett–Joyner–Halenda (BJH) method. The total pore volume was determined from the amount of nitrogen adsorbed at P/P0 = 0.995. To isolate the effect of the hydrophobic film from lithological heterogeneity, the same core sample was analyzed before and after treatment, and the results were compared directly.
4.5.4. Capillary Force Test
The capillary rise test was conducted to evaluate the capillary force and the equilibrium height of water rise in a glass capillary, which reflects the wettability of the treated surface and the behavior of liquids in confined channels. The procedure was as follows [20,36]:
- (1)
- The capillary tube was cleaned with cotton moistened with ethanol to remove grease and impurities.
- (2)
- The cleaned capillary was immersed in FRACFLOW-WA dispersions of different concentrations for 24 h to ensure sufficient surface treatment, after which it was dried in an oven to remove any residual liquid.
- (3)
- The capillary was mounted vertically on a support using a clamp to prevent tilting when the lower end was immersed in liquid. A beaker was filled with an appropriate amount of deionized water, and the capillary was inserted vertically into the water slowly to avoid bubble entrapment.
- (4)
- The liquid column height was measured after the water level became stable. The height difference between the water level outside the capillary and that inside the capillary was recorded using a graduated scale. Each measurement was repeated three times and averaged to minimize error.
Author Contributions
Conceptualization, J.G. and X.D.; Data Curation, J.G. and X.D.; Formal Analysis, J.G. and X.D.; Funding Acquisition, X.D.; Investigation, H.M.; Methodology, J.G. and X.D.; Project Administration, H.M.; Resources, H.M.; Software, H.M.; Supervision, H.M.; Validation, X.D. and H.M.; Visualization, X.D. and H.M.; Writing—Original Draft, J.G.; Writing—Review & Editing, X.D. and H.M. All authors have read and agreed to the published version of the manuscript.
Funding
This research received no external funding.
Institutional Review Board Statement
Not applicable.
Informed Consent Statement
Not applicable.
Data Availability Statement
The original contributions presented in this study are included in the article. Further inquiries can be directed to the corresponding author.
Conflicts of Interest
The authors declare no conflicts of interest.
Abbreviations
| St | Styrene |
| DVB | Divinylbenzene |
| BA | Butyl acrylate |
| KH550 | γ-Aminopropyl triethoxysilane |
| SEM-EDS | Scanning Electron Microscope: Energy Dispersive Spectroscopy |
| TEM | Transmission electron microscope |
| FRACFLOW-WA | Core–shell polymer nano-emulsion |
| BET/BJH | Brunauer–Emmett–Teller and Barrett–Joyner–Halenda |
References
- Hubbert, M.K.; Willis, D.G. Mechanics of Hydraulic Fracturing. Trans. AIME 1957, 210, 153–168. [Google Scholar] [CrossRef] [Scilit]
- Montgomery, C.T.; Smith, M.B. Hydraulic Fracturing: History of an Enduring Technology. J. Pet. Technol. 2010, 62, 26–40. [Google Scholar] [CrossRef] [Scilit]
- Lu, C.; Zeng, Q.; Li, Q.; Wang, S.; Xu, S.; Guo, J. A review of hydraulic fracture propagation simulation using displacement discontinuity method. Eng. Anal. Bound. Elem. 2026, 188, 106752. [Google Scholar] [CrossRef] [Scilit]
- Chen, B.; Barboza, B.R.; Sun, Y.; Bai, J.; Thomas, H.R.; Dutko, M.; Li, C. A review of hydraulic fracturing simulation. Arch. Comput. Methods Eng. 2022, 29, 1–58. [Google Scholar] [CrossRef] [Scilit]
- Barati, R.; Liang, J.T. A review of fracturing fluid systems used for hydraulic fracturing of oil and gas wells. J. Appl. Polym. Sci. 2014, 131, 40735. [Google Scholar] [CrossRef] [Scilit]
- Arthur, J.D.; Bohm, B.K.; Coughlin, B.J.; Layne, M.A.; Cornue, D. Evaluating the environmental implications of hydraulic fracturing in shale gas reservoirs. In Proceedings of the SPE Health, Safety, Security, Environment, & Social Responsibility Conference, San Antonio, TX, USA, 23–25 March 2009; p. SPE-121038. [Google Scholar]
- Chen, M.; Ning, X.; Kang, Y.; Wu, J.; Li, B.; Shi, Y.; Lai, Z.; Bai, J.; Yan, M. Effect of fracturing fluid properties on the flowback efficiency of marine and continental transitional shale gas reservoirs in Ordos basin. Processes 2025, 13, 1398. [Google Scholar] [CrossRef] [Scilit]
- Abdelgawad, K.; Essam, A.; Sakthivel, S.; Ibrahim, A.F. Optimizing recovery of fracturing fluid in unconventional and tight gas reservoirs through innovative environmentally friendly flowback additives. J. Mol. Liq. 2024, 403, 124877. [Google Scholar] [CrossRef] [Scilit]
- Dutta, R.; Lee, C.H.; Odumabo, S.; Ye, P.; Walker, S.C.; Karpyn, Z.T.; Ayala, H.L.F. Experimental investigation of fracturing-fluid migration caused by spontaneous imbibition in fractured low-permeability sands. SPE Reserv. Eval. Eng. 2014, 17, 74–81. [Google Scholar] [CrossRef] [Scilit]
- Hu, Y.; Zhao, C.; Zhao, J.; Wang, Q.; Zhao, J.; Gao, D.; Fu, C. Mechanisms of fracturing fluid spontaneous imbibition behavior in shale reservoir: A review. J. Nat. Gas Sci. Eng. 2020, 82, 103498. [Google Scholar] [CrossRef] [Scilit]
- Wright, R. Jamin effect in oil production. AAPG Bull. 1933, 17, 1521–1526. [Google Scholar] [CrossRef] [Scilit]
- Kathel, P.; Mohanty, K.K. Wettability alteration in a tight oil reservoir. Energy Fuels 2013, 27, 6460–6468. [Google Scholar] [CrossRef] [Scilit]
- Yang, X.; Liu, Y.; He, F.; Du, C.; Zheng, J.; Zhou, D. Synergistic Mechanisms of Surfactants and Monovalent Ions for Enhanced Oil Recovery Through Interfacial Properties and Microfluidic Study. Gels 2026, 12, 435. [Google Scholar] [CrossRef] [Scilit]
- Deng, X.; Kamal, M.S.; Patil, S.; Hussain, S.M.S.; Zhou, X. A review on wettability alteration in carbonate rocks: Wettability modifiers. Energy Fuels 2019, 34, 31–54. [Google Scholar] [CrossRef] [Scilit]
- Karimi, M.; Al-Maamari, R.S.; Ayatollahi, S.; Mehranbod, N. Mechanistic study of wettability alteration of oil-wet calcite: The effect of magnesium ions in the presence and absence of cationic surfactant. Colloids Surf. A Physicochem. Eng. Asp. 2015, 482, 403–415. [Google Scholar] [CrossRef] [Scilit]
- Ratanpara, A.; Kim, M. Wettability alteration mechanisms in enhanced oil recovery with surfactants and nanofluids: A review with microfluidic applications. Energies 2023, 16, 8003. [Google Scholar] [CrossRef] [Scilit]
- Liu, R.; Li, H.; Li, Z.; Yu, X.; He, L.; Guo, X.; Zhao, F.; Shi, H.; Sun, W. Fluorocarbon Interfacial Modifier: Wettability Alteration in Reservoir Rocks for Enhanced Oil Recovery and Field Application. Energies 2025, 18, 5463. [Google Scholar] [CrossRef] [Scilit]
- Pu, E.; Wang, X.; Zhong, C.; He, X.; Zhu, X. Modification of a hybrid fluoro-surfactant containing double fluorocarbon chains on the carbonate and shale rocks for the wettability reduction of water and oil. Geoenergy Sci. Eng. 2024, 240, 213009. [Google Scholar] [CrossRef] [Scilit]
- Gogoi, S.B. Adsorption–Desorption of Surfactant for Enhanced Oil Recovery. Transp. Porous Media 2011, 90, 589–604. [Google Scholar] [CrossRef] [Scilit]
- Tang, W.; Wu, P.; Da, C.; Alzobaidi, S.; Harris, J.; Hallaman, B.; Johnston, K.P. Synergy of surface modified nanoparticles and surfactant in wettability alteration of calcite at high salinity and temperature. Fuel 2023, 331, 125752. [Google Scholar] [CrossRef] [Scilit]
- Liang, T.; Zhou, F.; Lu, J.; DiCarlo, D.; Nguyen, Q. Evaluation of wettability alteration and IFT reduction on mitigating water blocking for low-permeability oil-wet rocks after hydraulic fracturing. Fuel 2017, 209, 650–660. [Google Scholar] [CrossRef] [Scilit]
- Nazari Moghaddam, R.; Bahramian, A.; Fakhroueian, Z.; Karimi, A.; Arya, S. Comparative study of using nanoparticles for enhanced oil recovery: Wettability alteration of carbonate rocks. Energy Fuels 2015, 29, 2111–2119. [Google Scholar] [CrossRef] [Scilit]
- Rego, F.B.; Eltahan, E.; Sepehrnoori, K. Wettability alteration and improved oil recovery in unconventional resources. J. Pet. Sci. Eng. 2022, 212, 110292. [Google Scholar] [CrossRef] [Scilit]
- Chen, Z.; Lin, J.; Wang, W.; Wang, L.; Chang, J. Insights into wettability alteration mechanisms of microbial enhanced oil recovery by different biosurfactants in sandstone oil reservoir. Colloids Surf. A Physicochem. Eng. Asp. 2024, 691, 133889. [Google Scholar] [CrossRef] [Scilit]
- Chen, C.; Zhuo, S.; Li, S.; Yin, N.; Luo, C.; Ren, H.; Jia, M.; Wang, X.; Cheng, Q. Wettability modification of a nano-silica/fluoro surfactant composite system for reducing the damage of water blocking in tight sandstone reservoirs. RSC Adv. 2025, 15, 5264–5276. [Google Scholar] [CrossRef] [Scilit]
- Kazemi, F.; Khlyupin, A.; Azin, R.; Osfouri, S.; Khosravi, A.; Sedaghat, M.; Kazemzadeh, Y.; Gerke, K.M.; Karsanina, M.V. Wettability alteration in gas condensate reservoirs: A critical review of the opportunities and challenges. Energy Fuels 2024, 38, 1539–1565. [Google Scholar] [CrossRef] [Scilit]
- Gao, C.; Miska, S.; Yu, M.; Dokhani, V.; Ozbayoglu, E.; Takach, N. Experimental and numerical analysis of effective enhancement of wellbore stability in shales with nanoparticles. J. Nat. Gas Sci. Eng. 2021, 95, 104197. [Google Scholar] [CrossRef] [Scilit]
- Liu, Y.F.; Zhou, L.; Wan, X.C.; Tang, Y.F.; Liu, Q.; Li, W.; Liao, J.B. Synthesis and characterization of a temperature sensitive microcapsule gelling agent for high-temperature acid release. ACS Omega 2024, 9, 20849–20858. [Google Scholar] [CrossRef] [Scilit]
- Alvarez, J.O.; Schechter, D.S. Wettability Alteration and Spontaneous Imbibition in Unconventional Liquid Reservoirs by Surfactant Additives. SPE Reserv. Eval. Eng. 2017, 20, 107–117. [Google Scholar] [CrossRef] [Scilit]
- Li, Y.; Wang, M.; Wei, Z.; An, Y.; Qin, W.; Bo, K.; Cao, P.; Guo, M. A novel oil-in-water nanoemulsion as a high-temperature plugging agent for wellbore wettability alteration and strengthening. J. Mol. Liq. 2023, 384, 122273. [Google Scholar] [CrossRef] [Scilit]
- Hou, X.; Sheng, J.J. Properties, preparation, stability of nanoemulsions, their improving oil recovery mechanisms, and challenges for oil field applications—A critical review. Geoenergy Sci. Eng. 2023, 221, 211360. [Google Scholar] [CrossRef] [Scilit]
- Pini, R.; Benson, S.M. Simultaneous determination of capillary pressure and relative permeability curves from core-flooding experiments with various fluid pairs. Water Resour. Res. 2013, 49, 3516–3530. [Google Scholar] [CrossRef] [Scilit]
- Zhao, Y.; Yu, C.; Lan, H.; Cao, M.; Jiang, L. Improved interfacial floatability of superhydrophobic/superhydrophilic Janus sheet inspired by lotus leaf. Adv. Funct. Mater. 2017, 27, 1701466. [Google Scholar] [CrossRef] [Scilit]
- Li, Q.; Fan, Z.; Liu, Q.; Ma, W.; Li, J.; Li, N.; Ma, P.; Zhang, H. Synthesis of a superhydrophobic fluorinated nano-emulsion and its modification on the wettability of tight sandstone. Materials 2022, 15, 4015. [Google Scholar] [CrossRef] [Scilit]
- Liu, Y.F.; Li, W.; Xiao, Z.H.; Ji, S.W.; Liu, Q.; Tang, Y.F.; Zhang, Y.; Wang, J.M. Recent Progress in Organic Inhibitors for Anticorrosion in Complex Acid Environments. Coatings 2026, 16, 150. [Google Scholar] [CrossRef] [Scilit]
- Ghosh Chaudhuri, R.; Paria, S. Core/shell nanoparticles: Classes, properties, synthesis mechanisms, characterization, and applications. Chem. Rev. 2012, 112, 2373–2433. [Google Scholar] [CrossRef] [Scilit]

Disclaimer/Publisher’s Note: The statements, opinions and data contained in all publications are solely those of the individual author(s) and contributor(s) and not of MDPI and/or the editor(s). MDPI and/or the editor(s) disclaim responsibility for any injury to people or property resulting from any ideas, methods, instructions or products referred to in the content. |
© 2026 by the authors. Licensee MDPI, Basel, Switzerland. This article is an open access article distributed under the terms and conditions of the Creative Commons Attribution (CC BY) license.