


Abstract
Preclinical drug screening for non-small cell lung cancer (NSCLC) is limited by the inadequate recapitulation of the tumor microenvironment in conventional two-dimensional (2D) culture systems. Here, using PC-9 cells as a proof of concept, we constructed a three-dimensional (3D) cell culture platform based on self-assembling peptides (SAPs) Sciobio-II and evaluated its utility for NSCLC drug sensitivity testing. Structural and mechanical characterization indicates that Sciobio-II self-assembles upon ionic triggering into an ordered, highly interconnected nanofibrous scaffold with long-term stability and hydrogel mechanics. PC-9 cells spontaneously formed spheroids of 50–150 μm in diameter within this 3D system and maintained high proliferative activity for at least 14 days. Drug sensitivity testing to 17 antitumor drugs demonstrated that the 3D culture system exhibits a clear dose-dependent response while yielding quantifiable and comparable values of the area under the curve (AUC), thereby mitigating the evaluation bias associated with the absence of an extracellular matrix (ECM) barrier in 2D culture. This proof-of-concept platform provides a promising in vitro tool that reconstructs tumor ECM structural features for preclinical drug screening and candidate prioritization in NSCLC.
1. Introduction
Non-small cell lung cancer (NSCLC) accounts for approximately 85% of all lung cancer cases worldwide [1,2]. Recent advances in the clinical application of molecularly targeted therapies and immune checkpoint inhibitors have substantially improved progression-free survival in patient populations with specific molecular profiles [3]. However, tumor microenvironment heterogeneity, acquired drug resistance mechanisms, and the limitations of current preclinical models remain key bottlenecks that constrain treatment response rates and clinical benefit [4,5]. In particular, the limited ability of current preclinical drug screening models to recapitulate the three-dimensional (3D) spatial architecture of the tumor microenvironment directly contributes to a marked discrepancy between in vitro drug response evaluation and in vivo therapeutic efficacy, representing a major contributor to the high attrition rate in new drug development [6].
Conventional two-dimensional (2D) cell culture systems have long dominated tumor biology research and drug screening, yet this paradigm harbors intrinsic limitations. First, cells in 2D culture grow as flat, adherent monolayers on rigid substrates; the resulting mechanotransduction patterns differ profoundly from those in the in vivo microenvironment, which can lead to loss of cell polarity, altered gene expression profiles, and aberrant activation of signaling pathways [7,8]. Second, 2D culture fails to reproduce the 3D gradients that tumor cells experience in vivo, including the diffusion constraints of oxygen, nutrients, and metabolic waste, as well as physical barriers that limit drug penetration. Furthermore, the absence of an extracellular matrix (ECM) limits the complex cell–cell and cell–matrix interactions present in vivo, making it difficult to recapitulate the ECM-mediated biochemical signals and physical support functions of the native tumor microenvironment [9]. Owing to these limitations, drug sensitivity testing results derived from 2D systems often overestimate drug cytotoxicity, resulting in an apparent “supersensitivity” phenotype and thereby compromising the accurate assessment of drug candidates [10].
In recent years, self-assembling peptides (SAPs) have emerged as promising candidate materials for 3D cell culture because of their programmable molecular structures, excellent biocompatibility, and ECM-mimicking properties. In addition to cell culture, peptide-based hydrogels have been widely explored as matrices for the encapsulation and sustained release of active pharmaceutical ingredients (APIs), including antitumor drugs, antimicrobial drugs, and therapeutic proteins, further supporting the feasibility of using peptide nanofibrous networks as drug-screening microenvironments [11,12,13,14]. Composed of natural amino acids, these peptides can spontaneously form hydrogels with nanofibrous network architectures upon stimulation with specific ions. Monovalent ions in PBS trigger self-assembly by shielding electrostatic repulsion between charged peptide residues. The self-assembly process is driven by multiple noncovalent forces, including hydrogen bonds, hydrophobic interactions, electrostatic interactions, and π–π stacking, ultimately leading to the formation of a 3D porous scaffold [15,16]. The nanotopography of this scaffold resembles the fibrous structure of native ECM, providing structural support that recapitulates features of the ECM microenvironment while allowing efficient diffusion of oxygen, nutrients, and metabolites [17,18]. Critically, the amino acid sequences of these peptides can be rationally designed to meet specific requirements, while their well-defined compositions and excellent batch-to-batch consistency ensure high reproducibility. Moreover, they can be degraded into amino acid monomers that are non-toxic to cells [15,19,20]. For instance, Luo et al. designed the D-form SAP EAK16, which can self-assemble into a stable nanofiber scaffold [21,22]; Wan et al. combined the SAP DRF3 with collagen to construct SAP-Matrix, which mimics the cellular microenvironment and supports 3D culture of colorectal cancer cells [23]; Su et al. constructed a bronchial inflammation model based on Sciobio-III that recapitulates the pathological features of airway epithelial cells [24]; and Gao et al. utilized the SAP Sciobio-III to establish a 3D culture model that supports the growth of colorectal adenocarcinoma cells and applied it to antitumor drug sensitivity screening [25]. Although the cell types and specific applications examined in these studies vary, their success in recapitulating in vivo cellular microstructures demonstrates the potential of this class of materials. However, the applicability of Sciobio-II for 3D culture of NSCLC cells and the systematic differences in drug response profiles between Sciobio-II-based 3D culture and conventional 2D culture have not yet been reported. Collectively, the existing studies highlight the potential of such materials for constructing more physiologically relevant drug screening models and provide a theoretical foundation for the development of standardized 3D drug screening platforms [26,27].
Sciobio-II is a SAP composed of 16 amino acids, with a C-terminal amidation modification that enhances its molecular stability [28]. Upon stimulation with specific ions, this peptide self-assembles through multiple intermolecular forces to form a highly ordered 3D nanofibrous network scaffold [15,29]. It has the potential to provide a more standardized microenvironment for in vitro 3D tumor cell culture and drug sensitivity assessment [24,28]. Nevertheless, its applicability for constructing in vitro 3D culture systems for NSCLC and its performance in sensitivity testing of clinically used antitumor drugs have yet to be systematically validated.
Against this background, the present study aims to systematically evaluate the feasibility of using Sciobio-II matrix gel as a 3D cell culture platform for NSCLC and its application value in drug sensitivity testing [18]. Specifically, we first perform multi-scale structural and mechanical characterization of the nanofibrous network scaffold formed by Sciobio-II self-assembly using atomic force microscopy (AFM), cryo-scanning electron microscopy (Cryo-SEM), chemical staining, and rheological testing. Next, using NSCLC PC-9 cells as a model, we systematically compare cell morphology, proliferative activity, and long-term viability between conventional 2D culture and the Sciobio-II matrix gel-based 3D culture system. Building on these analyses, we further conduct drug sensitivity testing using a panel of 17 antitumor drugs and compare dose–response profiles and area under the curve (AUC) under the two culture systems to reveal the impact of culture dimensionality on drug response patterns. By integrating these experimental evaluations, this study aims to provide a foundation for developing a standardized and physiologically relevant in vitro drug screening platform for NSCLC, while offering insights into future precision oncology research.
2. Results and Discussion
2.1. Structural and Mechanical Characterization of Sciobio-II
2.1.1. Structure and Preparation of Sciobio-II
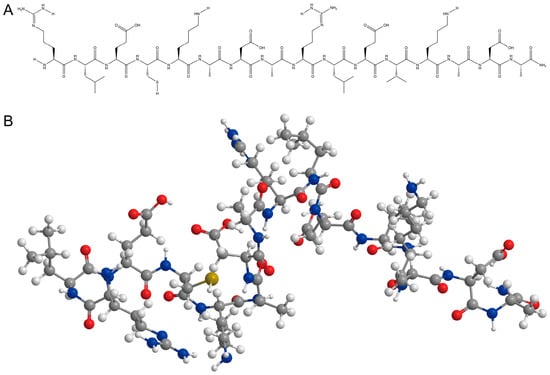
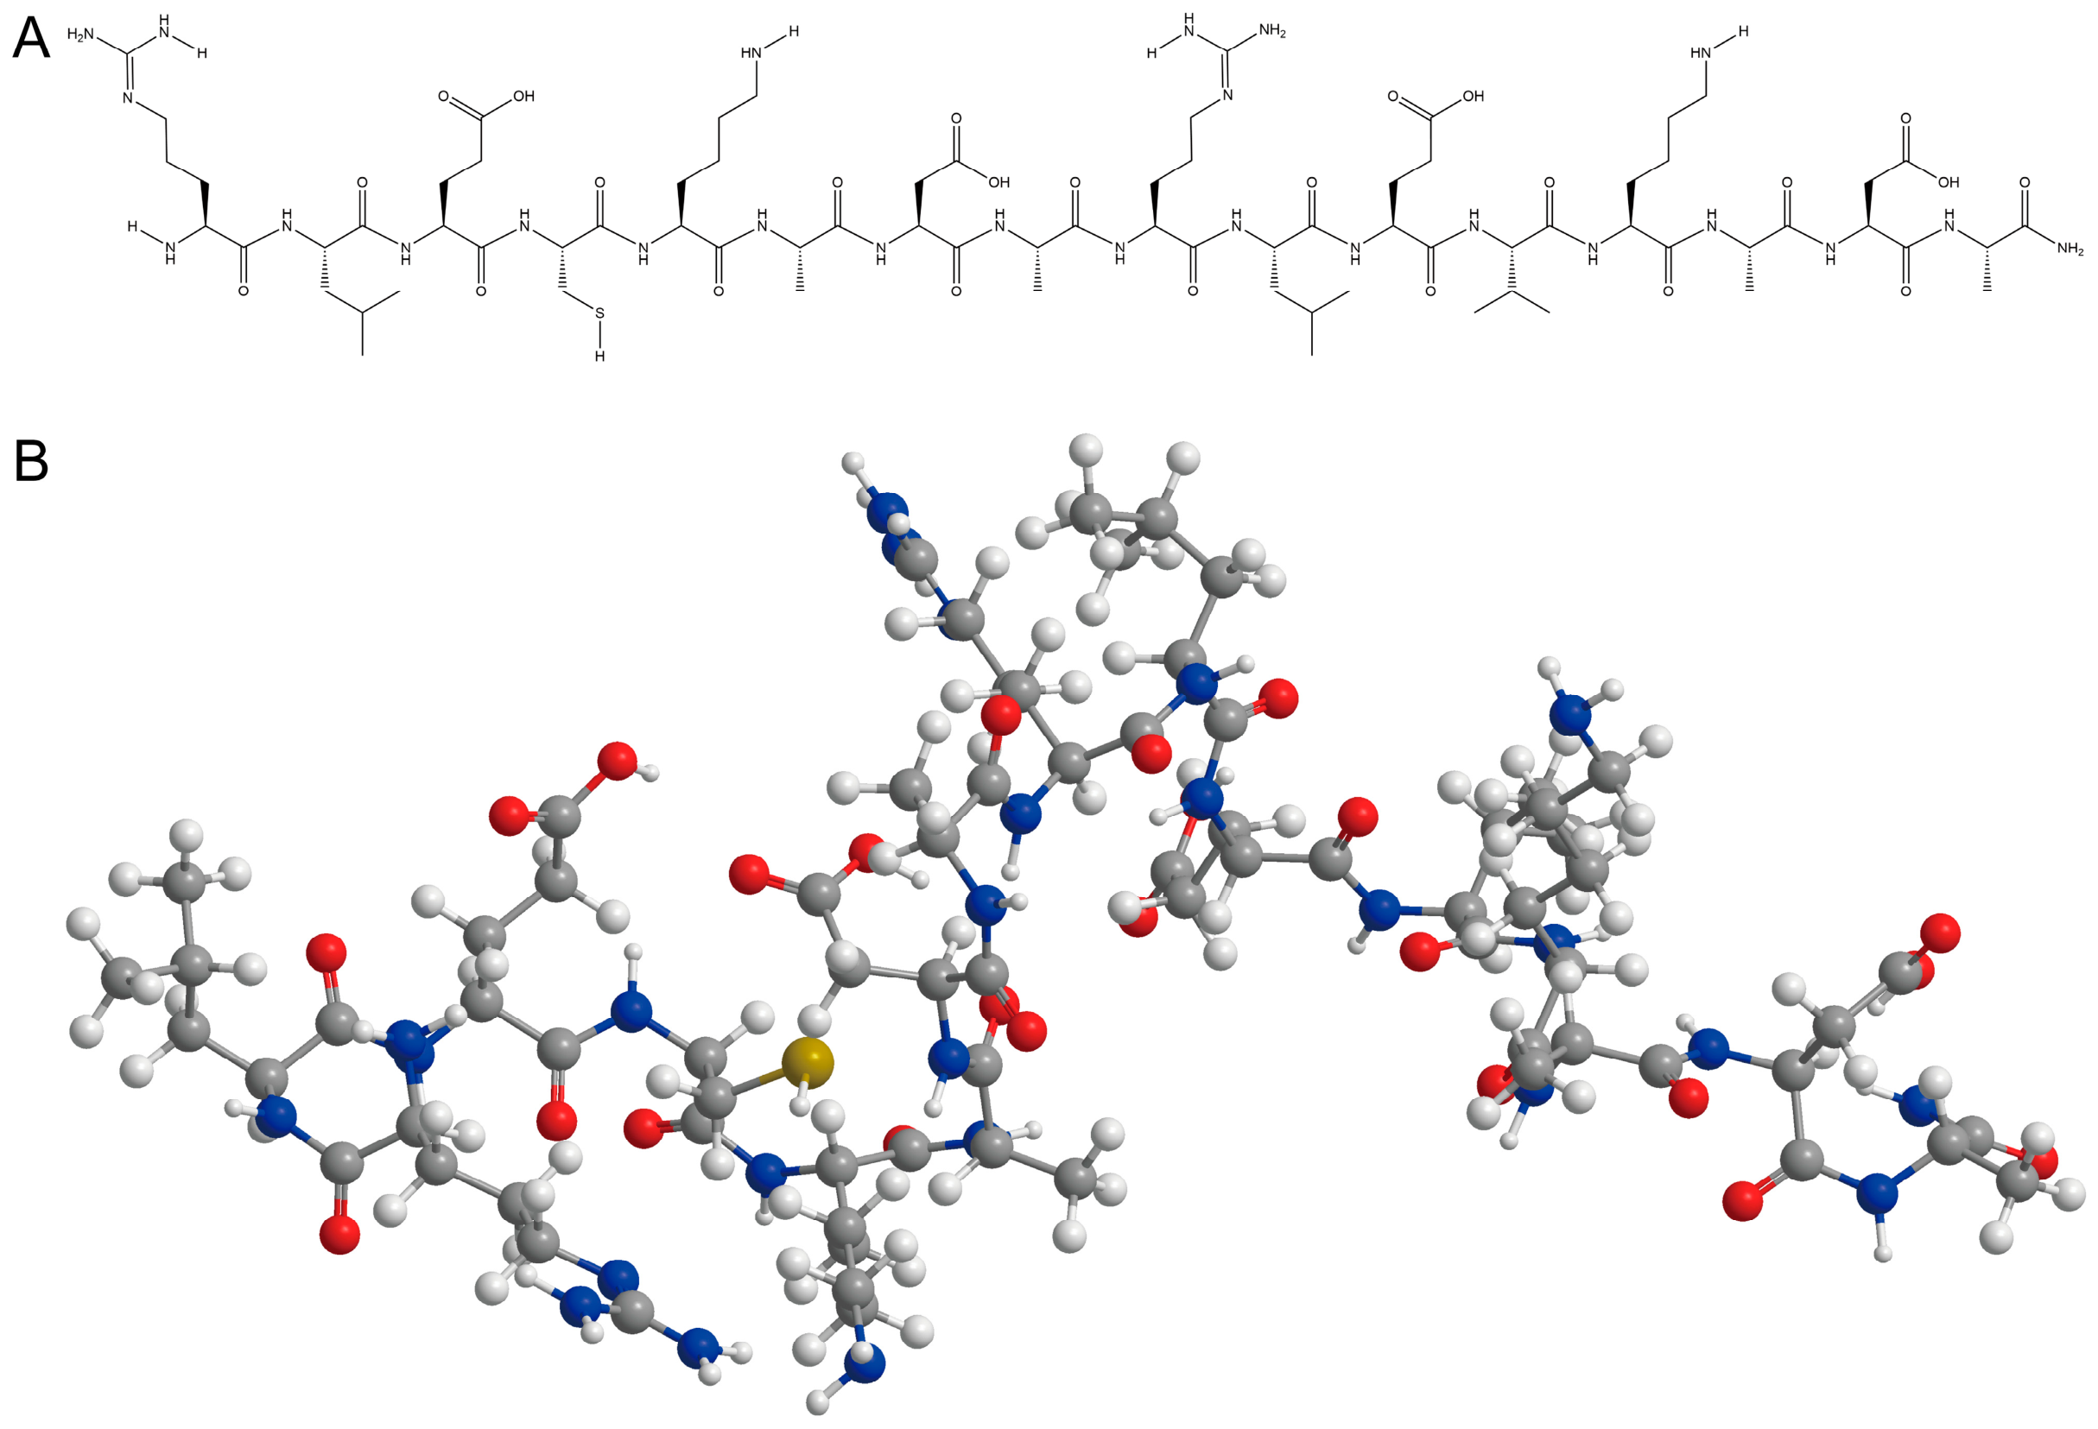
Sciobio-II is a 16-amino-acid chiral SAP (Arg-Leu-Glu-Cys-Lys-Ala-Asp-Ala-Arg-Leu-Glu-Val-Lys-Ala-Asp-Ala-NH2), with C-terminal amidation enhancing its stability. The charged residues (Arg+, Lys+, and Glu−, Asp−) are arranged in an alternating pattern along the sequence. When the lyophilized peptide is dissolved in ultrapure water and exposed to physiological ionic strength (1× PBS, containing Na+, K+, Cl−, and HPO42−), these ions screen the electrostatic repulsion between charged side chains, allowing backbone hydrogen bonding and hydrophobic interactions among Leu/Val/Ala side chains to drive the transition from soluble monomers to a β-sheet-rich 3D nanofiber network scaffold that provides a supportive microenvironment for cell growth, proliferation, and differentiation (Figure 1).
Figure 1.
Molecular structure and 3D structural model of Sciobio-II: (A) Molecular structure formula of Sciobio-II. (B) 3D structural model of Sciobio-II.
2.1.2. AFM Characterization of the Sciobio-II Matrix Gel
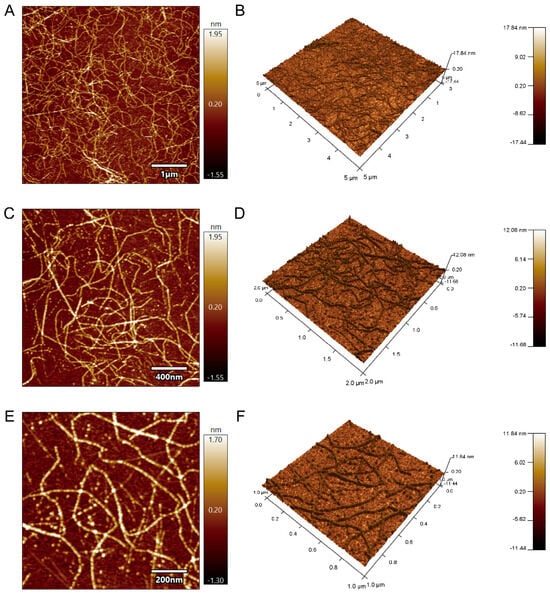
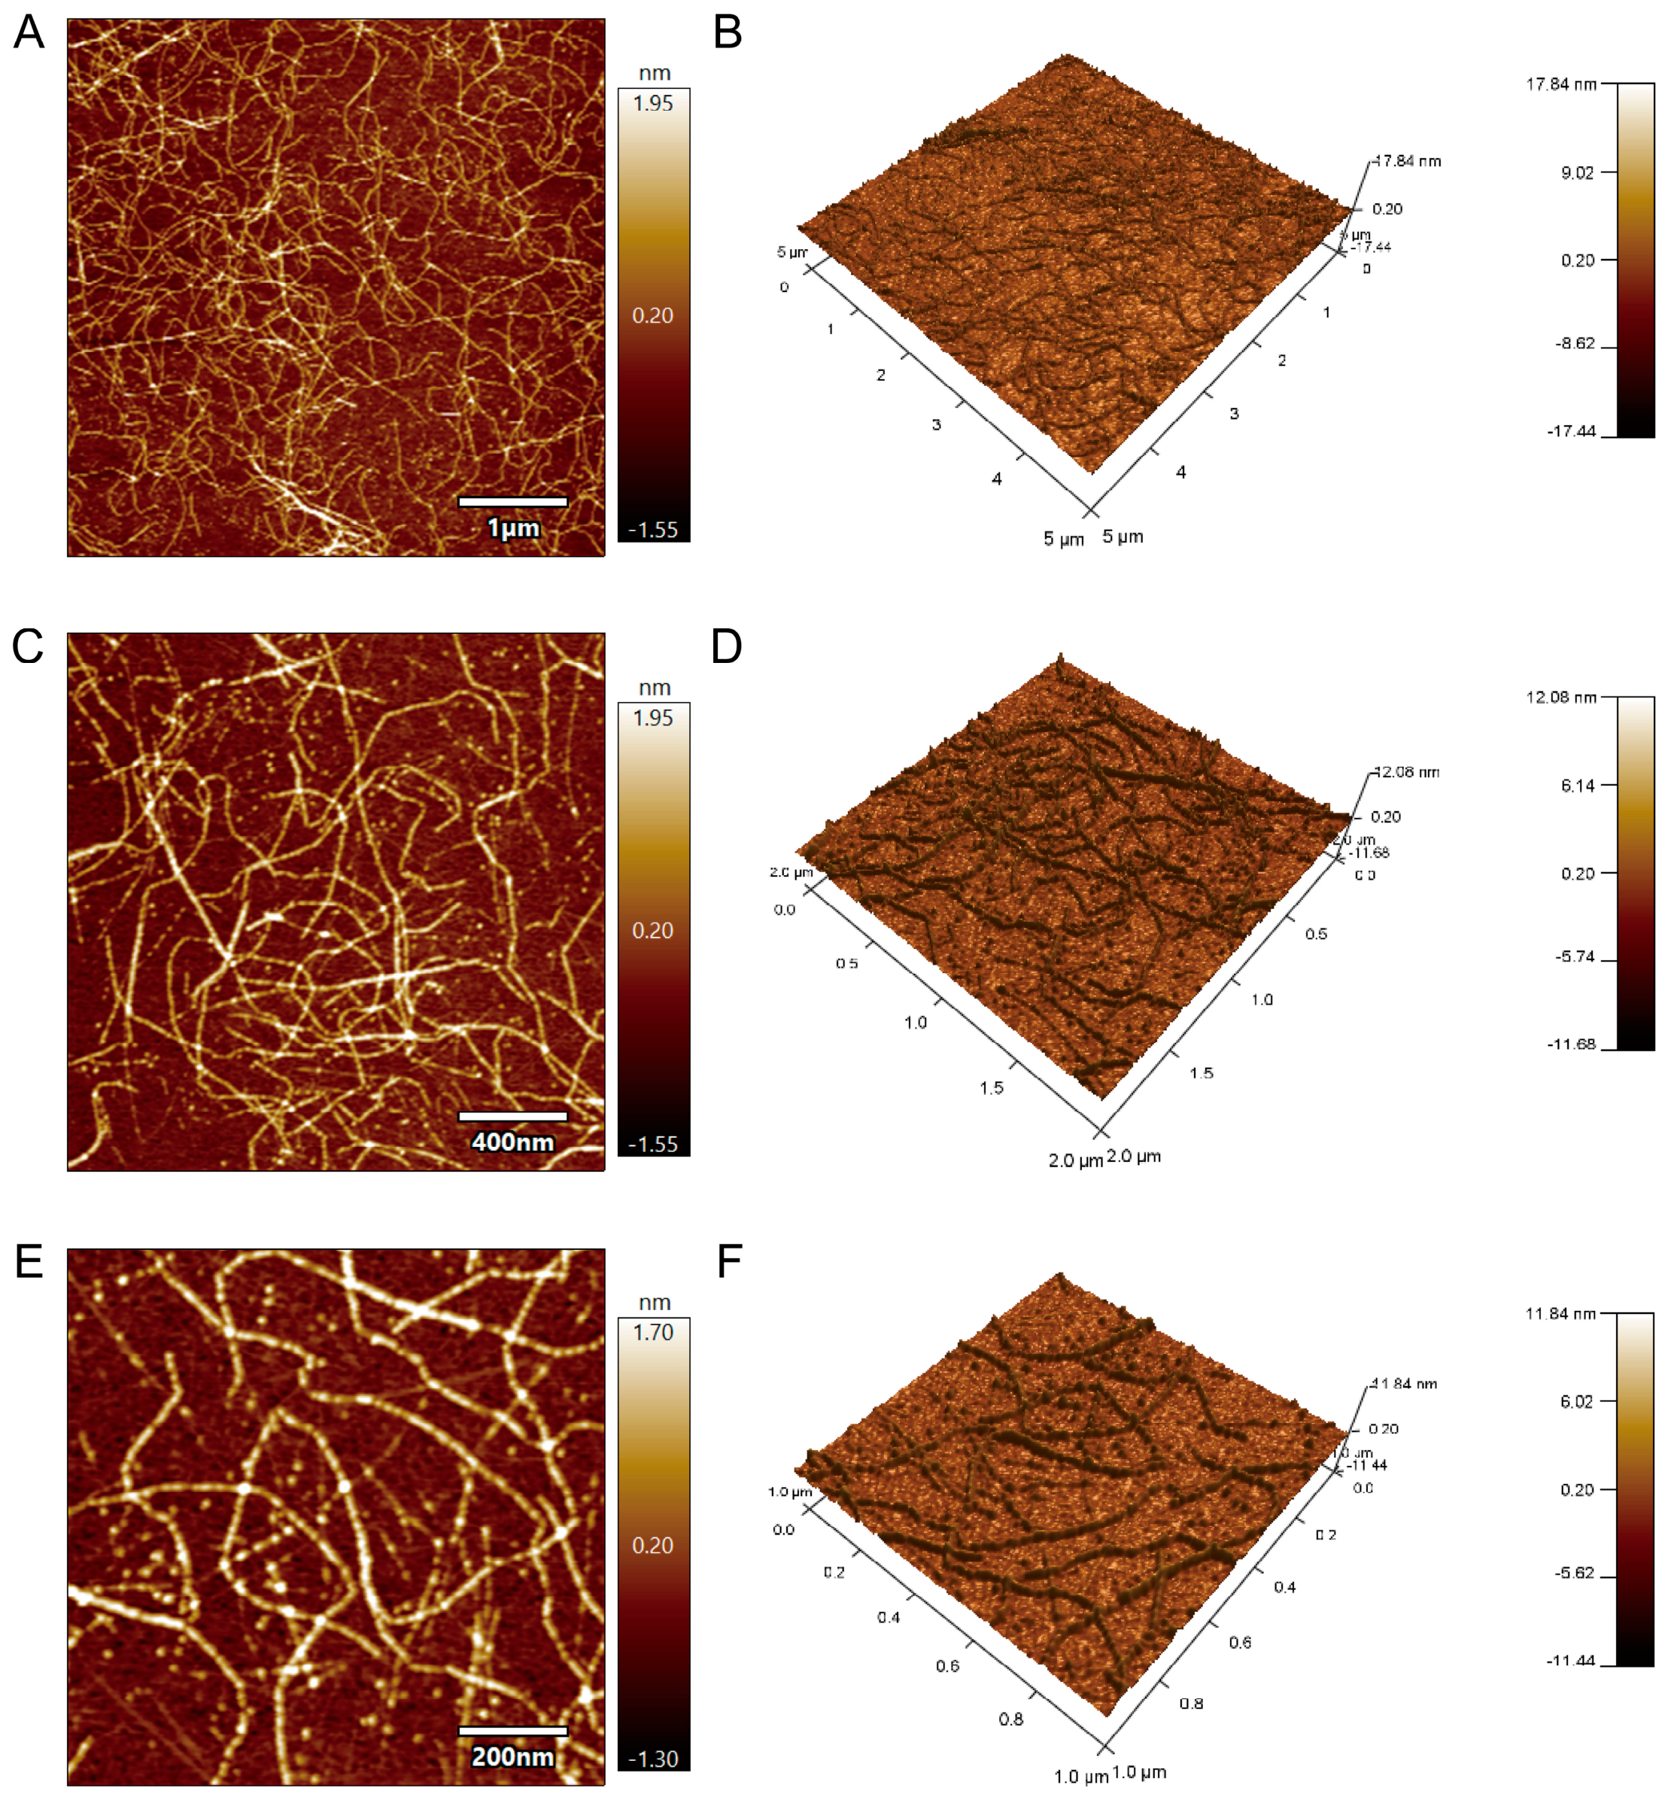
AFM analysis revealed that Sciobio-II self-assembled into a well-organized and densely packed nanoscale network structure. The resulting nanofibers were approximately 300–400 nm in length and were extensively interconnected to form a 3D nanofibrous network scaffold. These fibers generate submicrometer interstitial pores, which resemble the mesh size of native collagen/proteoglycan networks; this architecture offers high surface area for cell–matrix contacts while permitting free diffusion of nutrients, oxygen, and metabolites (Figure 2).
Figure 2.
AFM characterization of the Sciobio-II matrix gel: (A,C,E) 2D height topography images at different magnifications, with scale bars of 1 μm, 400 nm, and 200 nm, respectively. (B,D,F) Corresponding 3D reconstructed images, with scan areas of 5 μm × 5 μm, 2 μm × 2 μm, and 1 μm × 1 μm, respectively.
2.1.3. Cryo-SEM Characterization of the Sciobio-II Matrix Gel
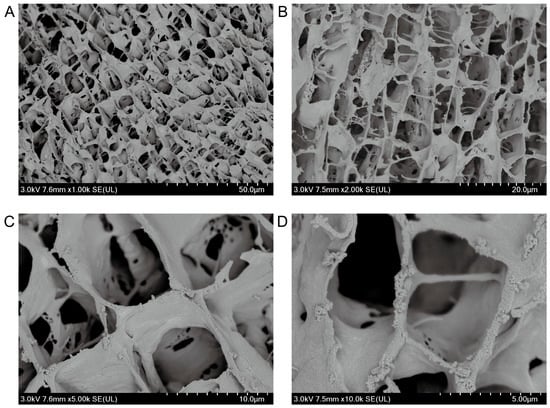
Cryo-SEM analysis revealed that Sciobio-II self-assembled into a highly ordered nanofibrous network scaffold with relatively uniform fiber diameters ranging from 17 to 24 nm. The nanofibers were interconnected to form a well-organized porous scaffold architecture. The pore diameter distribution is within the nanoscale range reported for native ECM porous structures, and the open, interconnected 3D porosity enables a microenvironment that provides mechanical support and space for cell growth (Figure 3).
Figure 3.
Cryo-SEM characterization of the Sciobio-II matrix gel: (A) Magnification: 1000×, scale bar: 50 μm. (B) Magnification: 2000×, scale bar: 20 μm. (C) Magnification: 5000×, scale bar: 10 μm. (D) Magnification: 10,000×, scale bar: 5 μm.
2.1.4. Microscope Characterization of the Sciobio-II Matrix Gel
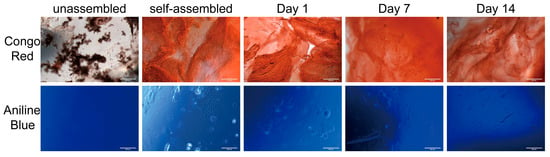
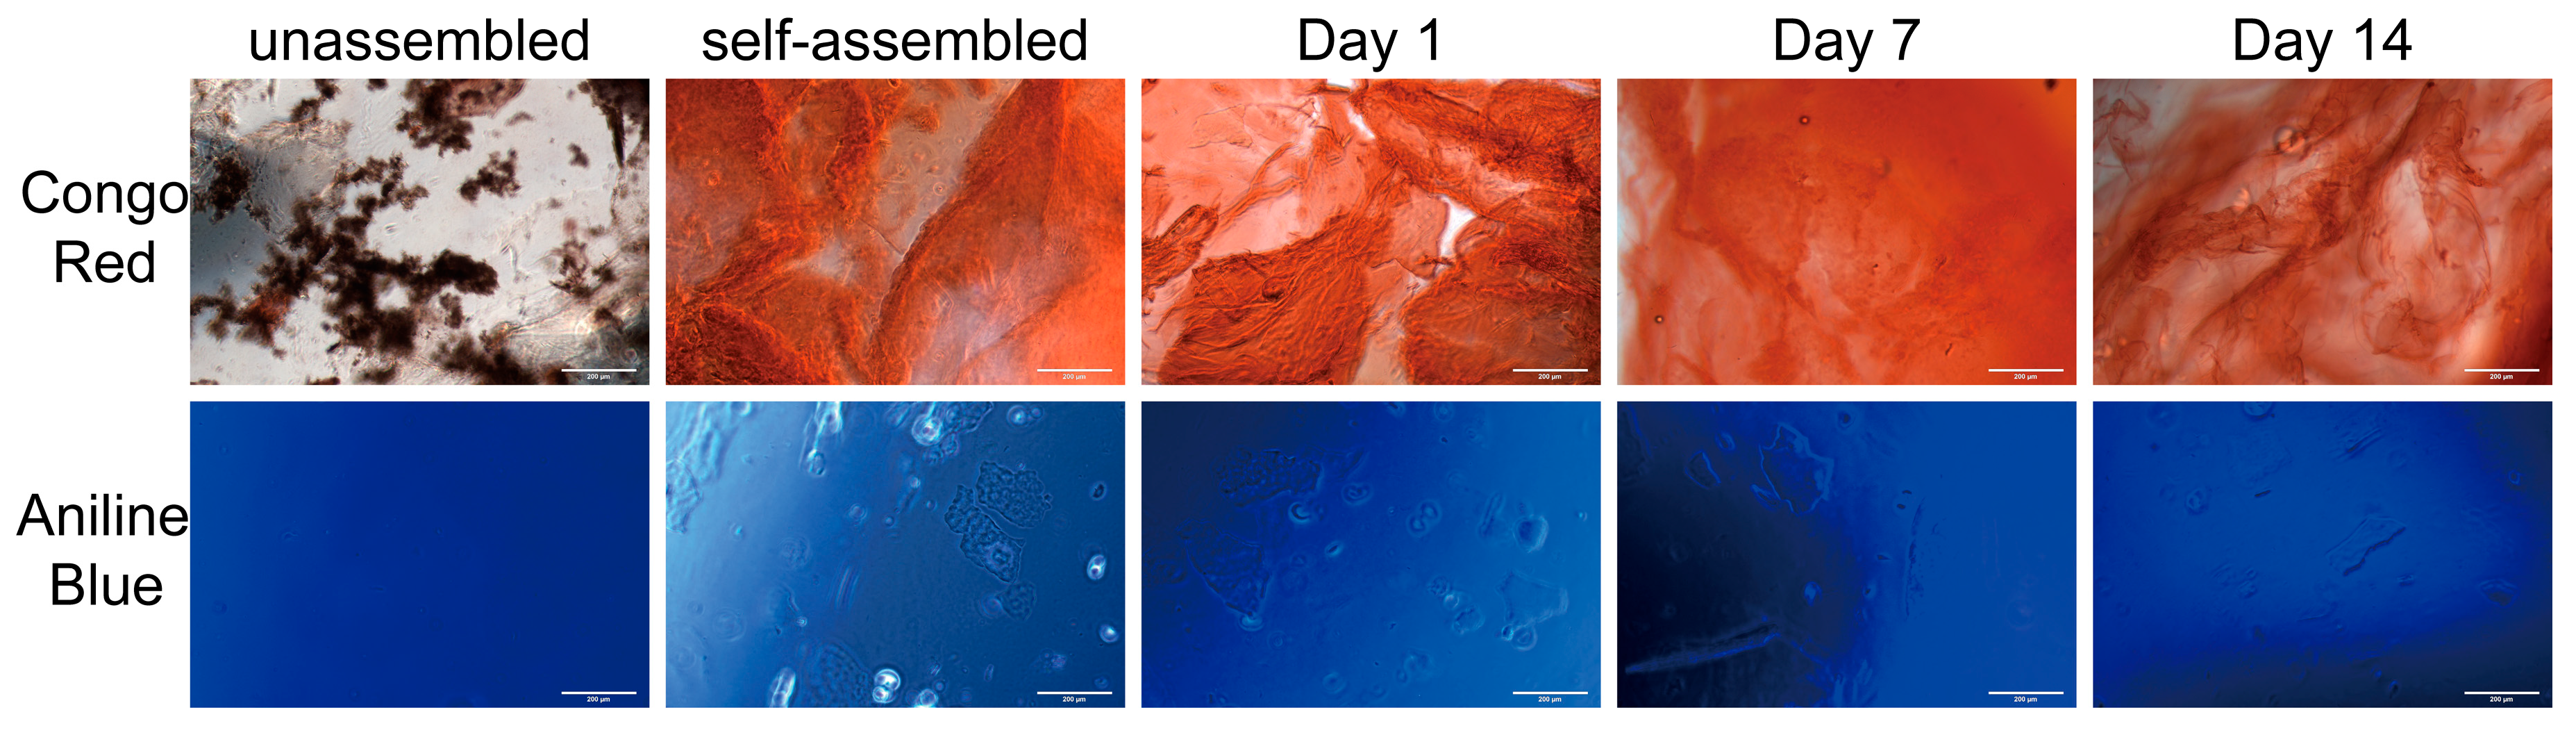
Congo red detects β-sheet secondary structures characteristic of SAP, while aniline blue visualizes the overall fibrous network morphology and structural integrity. The results showed that, in its unassembled state, Sciobio-II exhibited a loose morphology. Upon exposure to specific ions, Sciobio-II underwent self-assembly, forming a continuous, uniform, and dense fibrous network. To confirm stability and structural integrity, three readouts were evaluated. Macroscopically, all assembled gels remained self-supporting at 37 °C, holding their shape after vial inversion without dissolution, flow, or liquefaction. At the microscope level, Congo Red staining confirmed the characteristic β-sheet-rich secondary structure of the scaffold, in agreement with previously reported circular dichroism data for Sciobio-II [28]. Aniline blue staining verified that the nanofibrous network morphology was preserved throughout the gel. These properties collectively provide a suitable microenvironment for 3D cell culture (Figure 4).
Figure 4.
Microscope characterization of the Sciobio-II matrix gel, scale bar: 200 μm.
2.1.5. Rheological Characterization of the Sciobio-II Matrix Gel
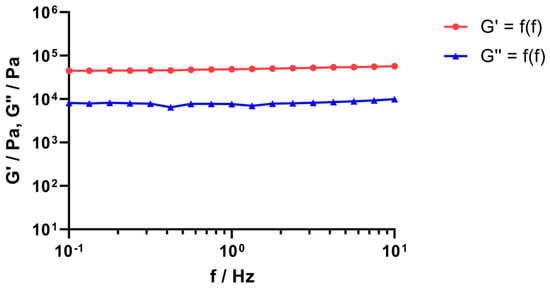
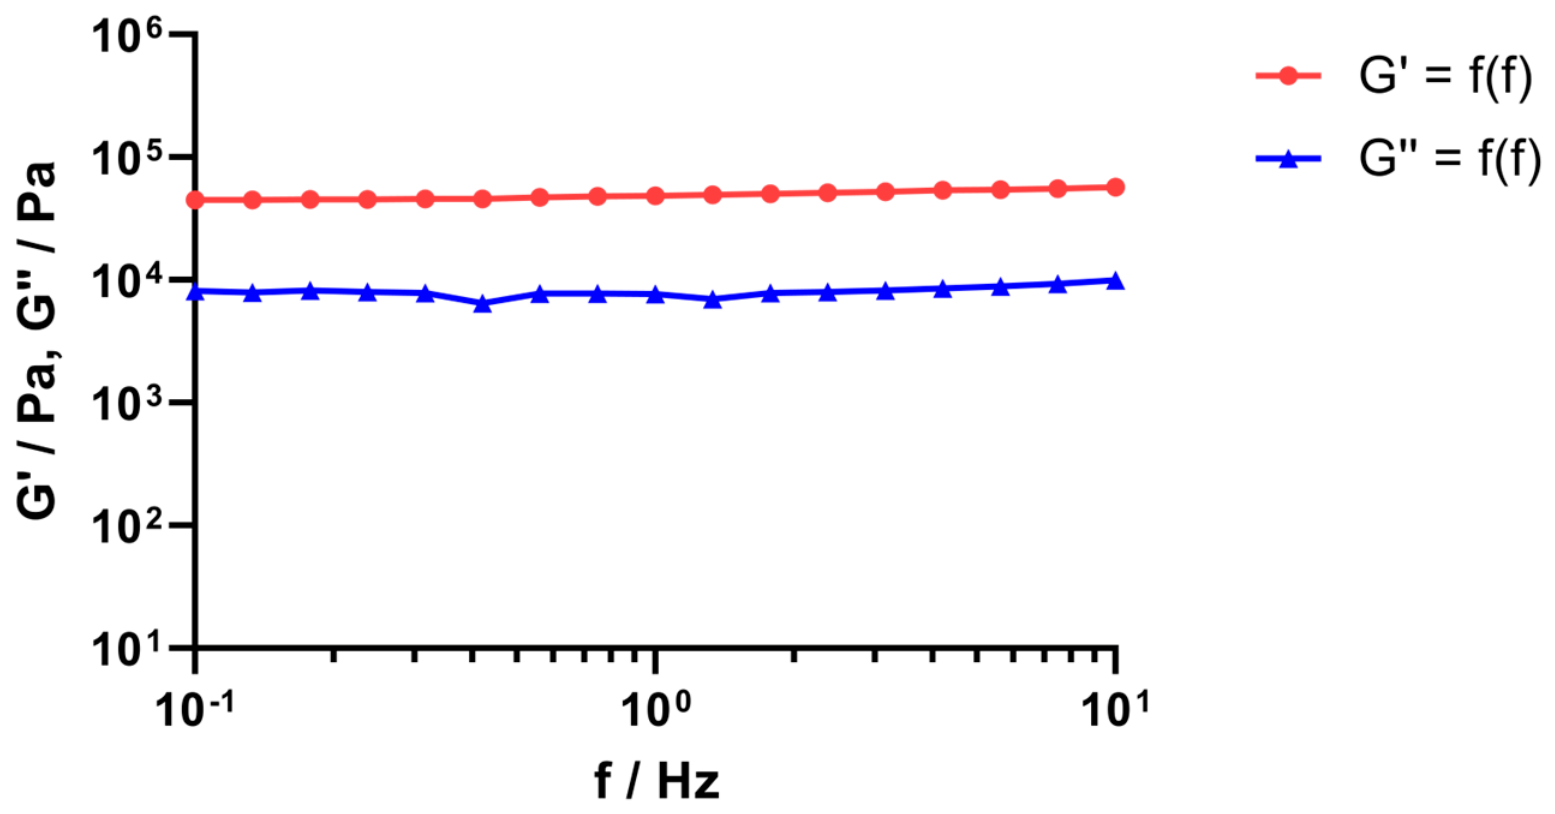
An oscillatory frequency sweep was performed to verify the gel state and mechanical stability of the Sciobio-II matrix gel. The results showed that the storage modulus G′ consistently exceeded the loss modulus G″ across the entire 0.1–10 Hz frequency range, indicating dominant elastic, solid-like behavior typical of a physically cross-linked hydrogel. At 1 Hz, G′ reached 48,677 Pa and G″ reached 7714 Pa, with a G′/G″ ratio of approximately 6.3. The G′ curve showed only weak frequency dependence and maintained a flat elastic plateau, confirming a stable, well-established nanofibrous network that resists structural rearrangement under physiological conditions (Figure 5).
Figure 5.
Rheological characterization of the Sciobio-II matrix gel.
2.2. Biocompatibility of Sciobio-II Matrix Gel
2.2.1. Cell Growth Characteristics in Different Culture Modes
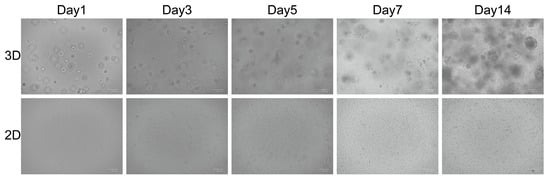
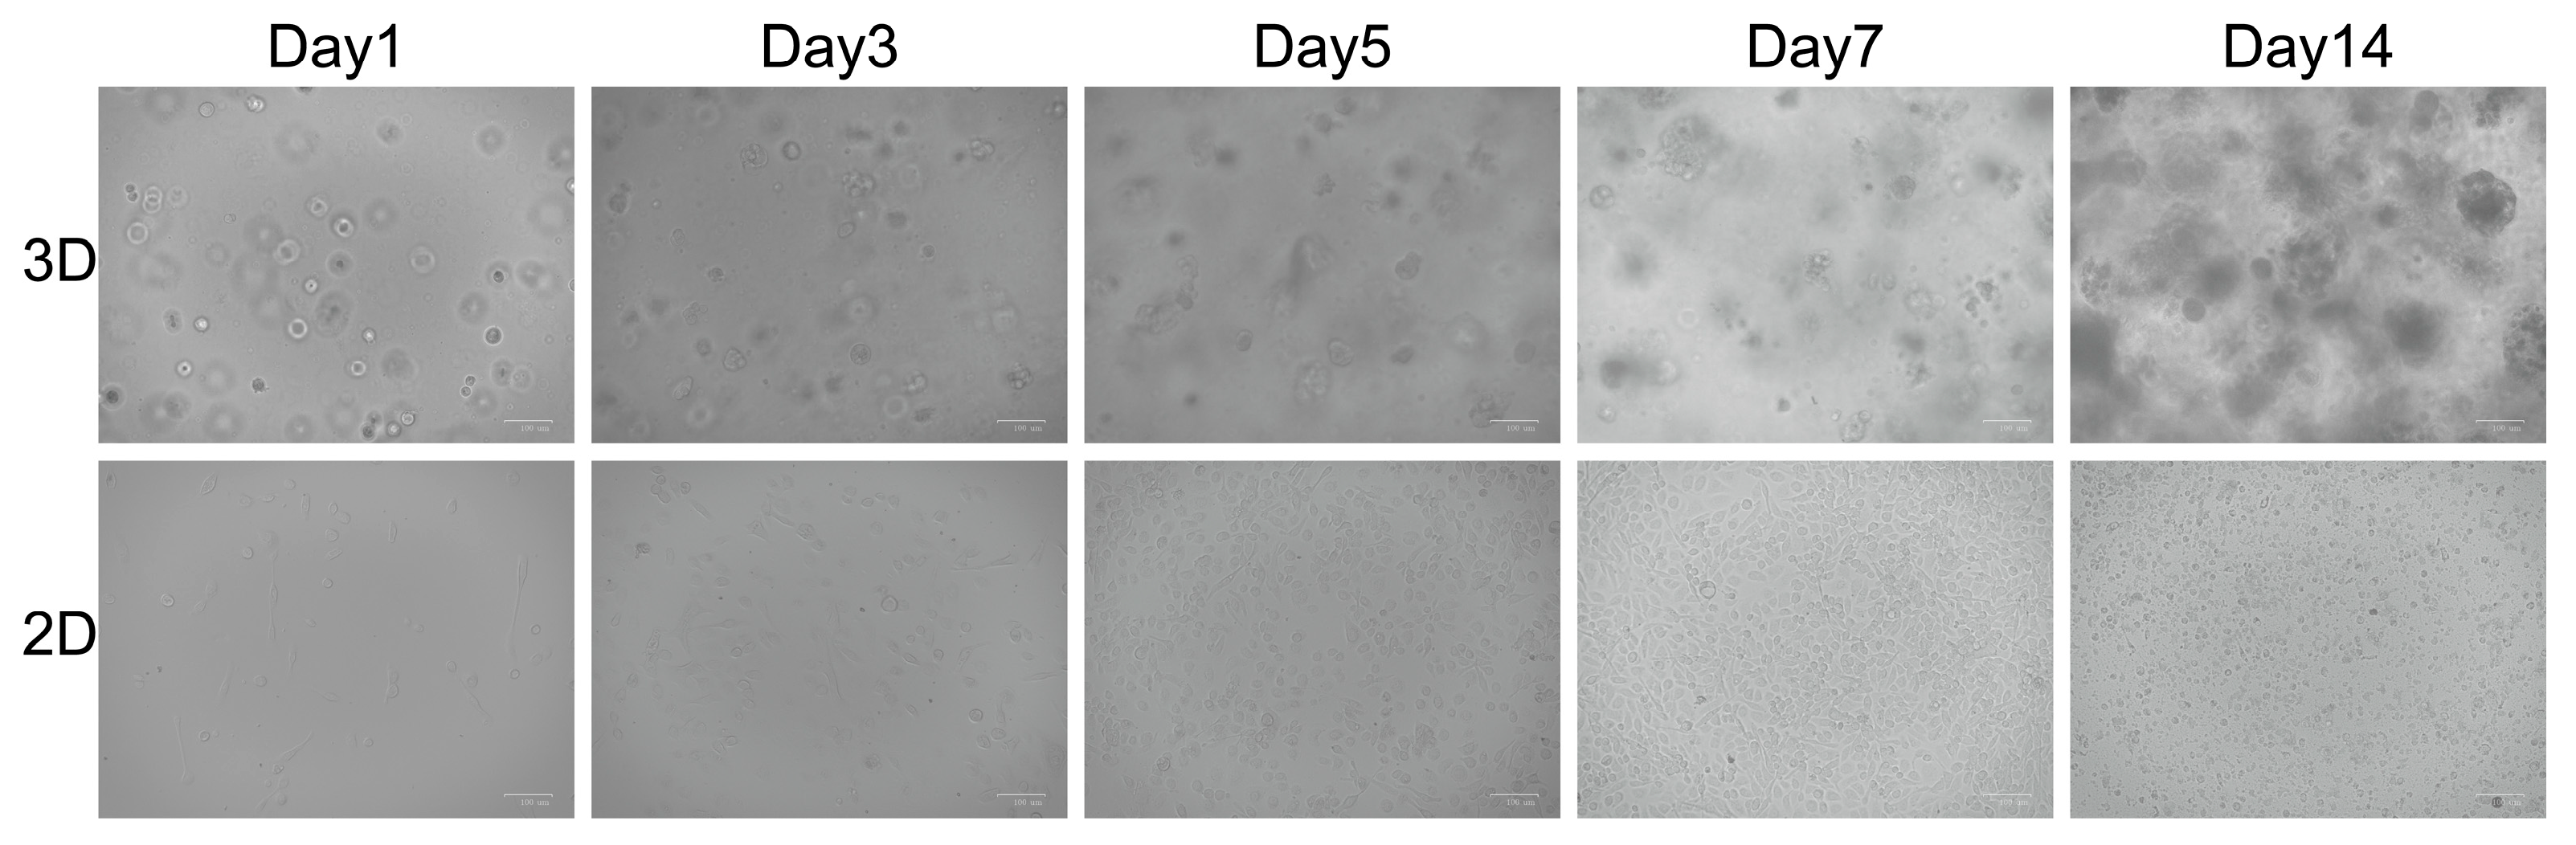
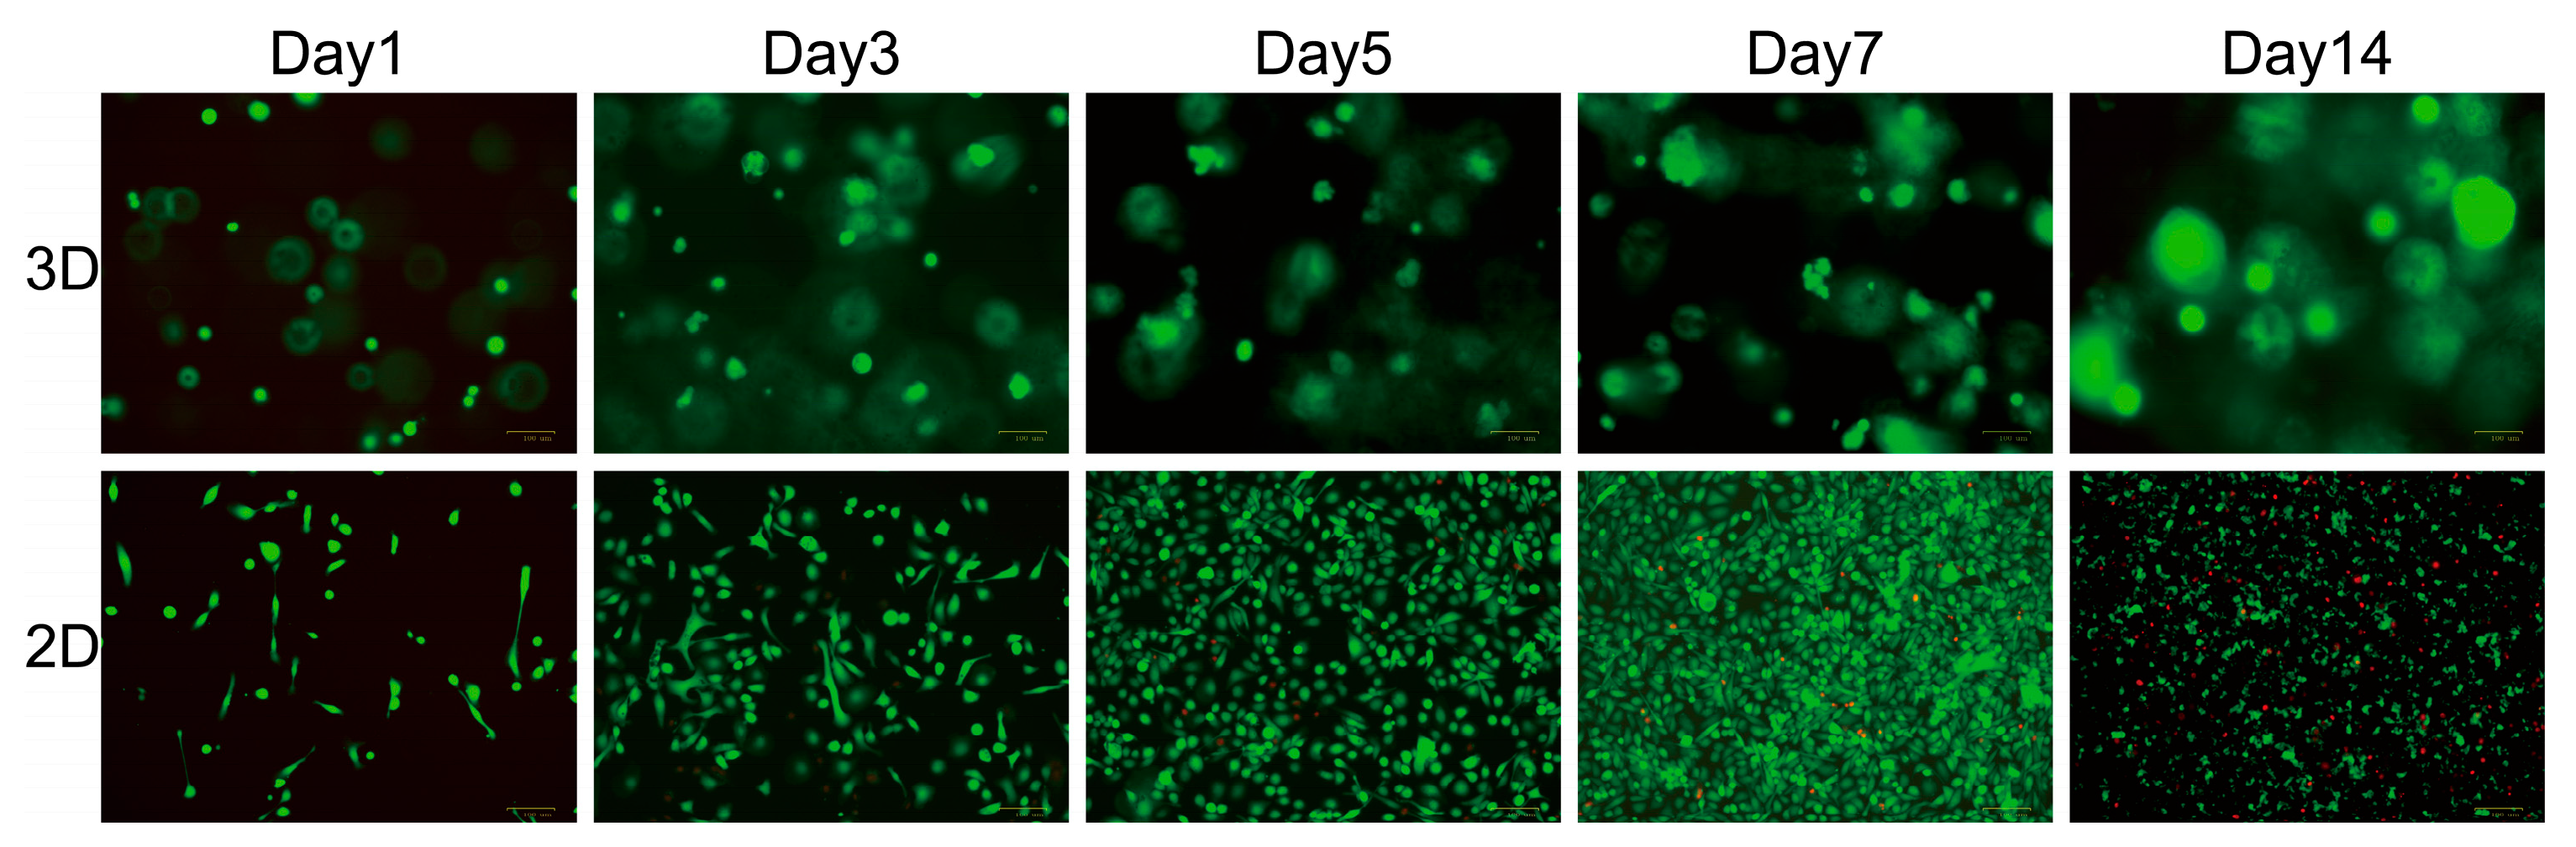
PC-9 cells exhibited marked morphological differences between the different culture modes. Under conventional 2D culture conditions, PC-9 cells displayed a typical adherent growth pattern. In 3D culture within the matrix gel, PC-9 cells formed cell clusters with diameters ranging from 50 to 150 μm. The morphological differences observed between the two culture modes may be associated with matrix architecture and dimensionality. In 2D culture, the growth and morphology of PC-9 cells were guided by the rigidity of the underlying substrate, whereas the 3D culture environment provides a biomimetic matrix microenvironment relative to rigid planar substrates (Figure 6).
Figure 6.
Cell growth characteristics in different culture modes, scale bar: 100 μm.
2.2.2. Live/Dead Staining of Cells in Different Culture Modes
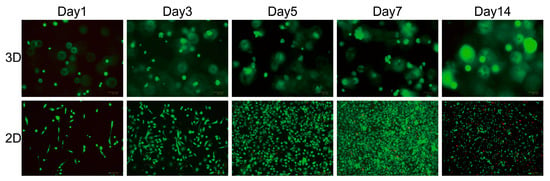
Calcein AM can penetrate the membranes of living cells and is hydrolyzed by endogenous esterases to produce green fluorescence, whereas PI can enter only dead or membrane-damaged cells, where it binds to nuclear DNA and produces red fluorescence. Based on this principle, cells cultured under 2D and 3D conditions were stained and observed. On Day 1, green fluorescence was observed in both culture modes, indicating good cell viability. On Days 3 and 5, a small amount of red fluorescence appeared in the 2D group, suggesting cell death, whereas the 3D group exhibited vigorous cell growth without obvious red fluorescence. On Day 7, the 2D group reached nearly 100% confluence, accompanied by contact inhibition and a reduced growth rate, whereas the 3D group formed cell clusters with diameters ranging from 50 to 100 μm. On Day 14, extensive areas of red fluorescence were observed in the 2D group, indicating substantial cell death caused by overconfluence. In addition, cell morphology changed from round and spindle-shaped to irregular, which may compromise normal physiological functions. In contrast, the diameter of the cell clusters in the 3D group increased to 100–150 μm. These results demonstrate that the 3D culture environment established using the Sciobio-II matrix gel supports long-term cell proliferation (Figure 7).
Figure 7.
Live/Dead staining of cells in different culture modes. Calcein-AM (green, indicates live cells). PI (red, indicates dead cells), scale bar: 100 μm.
2.2.3. Assessment of Cell Viability in Different Culture Modes
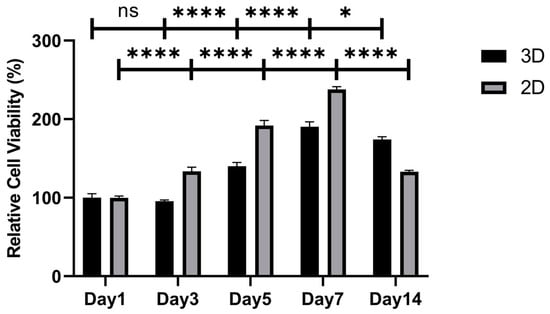
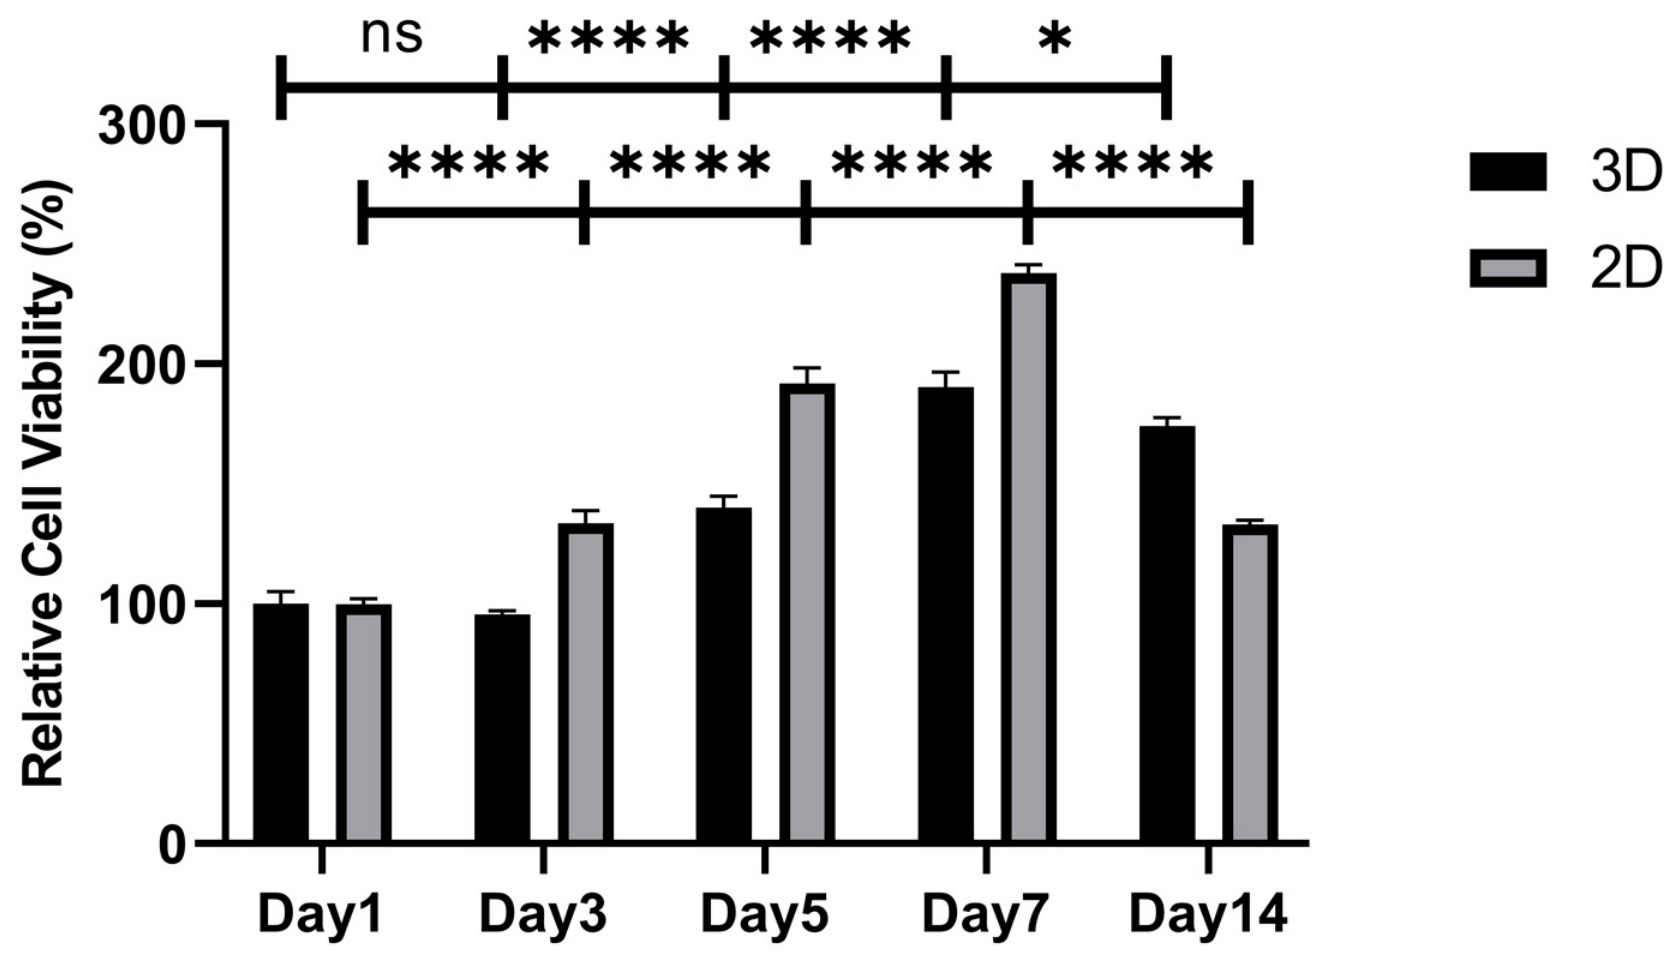
Cell viability in 2D and 3D cultures was assessed by measuring ATP content using the CellTiter-Lumi™ assay kit. An identical initial seeding density of 2000 cells/well was applied to both culture modes to enable direct comparison of native growth kinetics under matched starting conditions. The results showed that on Day 1, cell viability was set to 100% for normalization. On Days 3 to 7, cells in 2D culture exhibited rapid proliferation, with an approximately 240% increase relative to Day 1, whereas cells cultured in 3D within the nanofibrous scaffold exhibited a slower but sustained growth pattern. This difference is explained by unobstructed nutrient access and the absence of matrix constraint in 2D culture, which drives faster exponential proliferation, while 3D cells require adaptation to the matrix microenvironment and establishment of cell–matrix interactions before sustained growth. On Day 14, cells in 2D culture exhibited a marked decline in viability and extensive cell death associated with contact inhibition. In contrast, no significant decline in cell viability was observed in the 3D culture, as the porous nanofibrous scaffold provides sufficient 3D growth space to support sustained cell proliferation. These results demonstrate that the 3D environment constructed with Sciobio-II matrix gel can support the long-term maintenance of favorable cell viability and growth (Figure 8).
Figure 8.
Assessment of cell viability in different culture modes. ns, no significance, * p < 0.05, and **** p < 0.0001.
2.3. Drug Sensitivity Testing in Different Culture Modes
2.3.1. Drug Sensitivity Testing in 3D-Cultured PC-9 Cells Based on Sciobio-II Matrix Gel
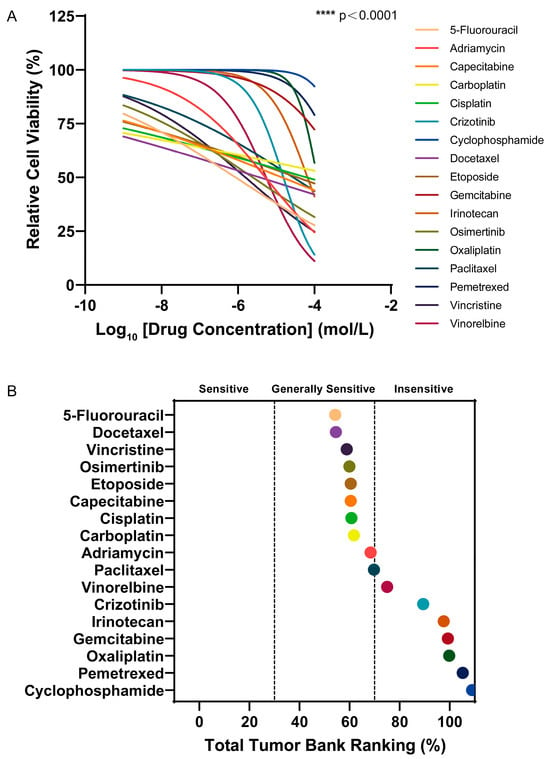
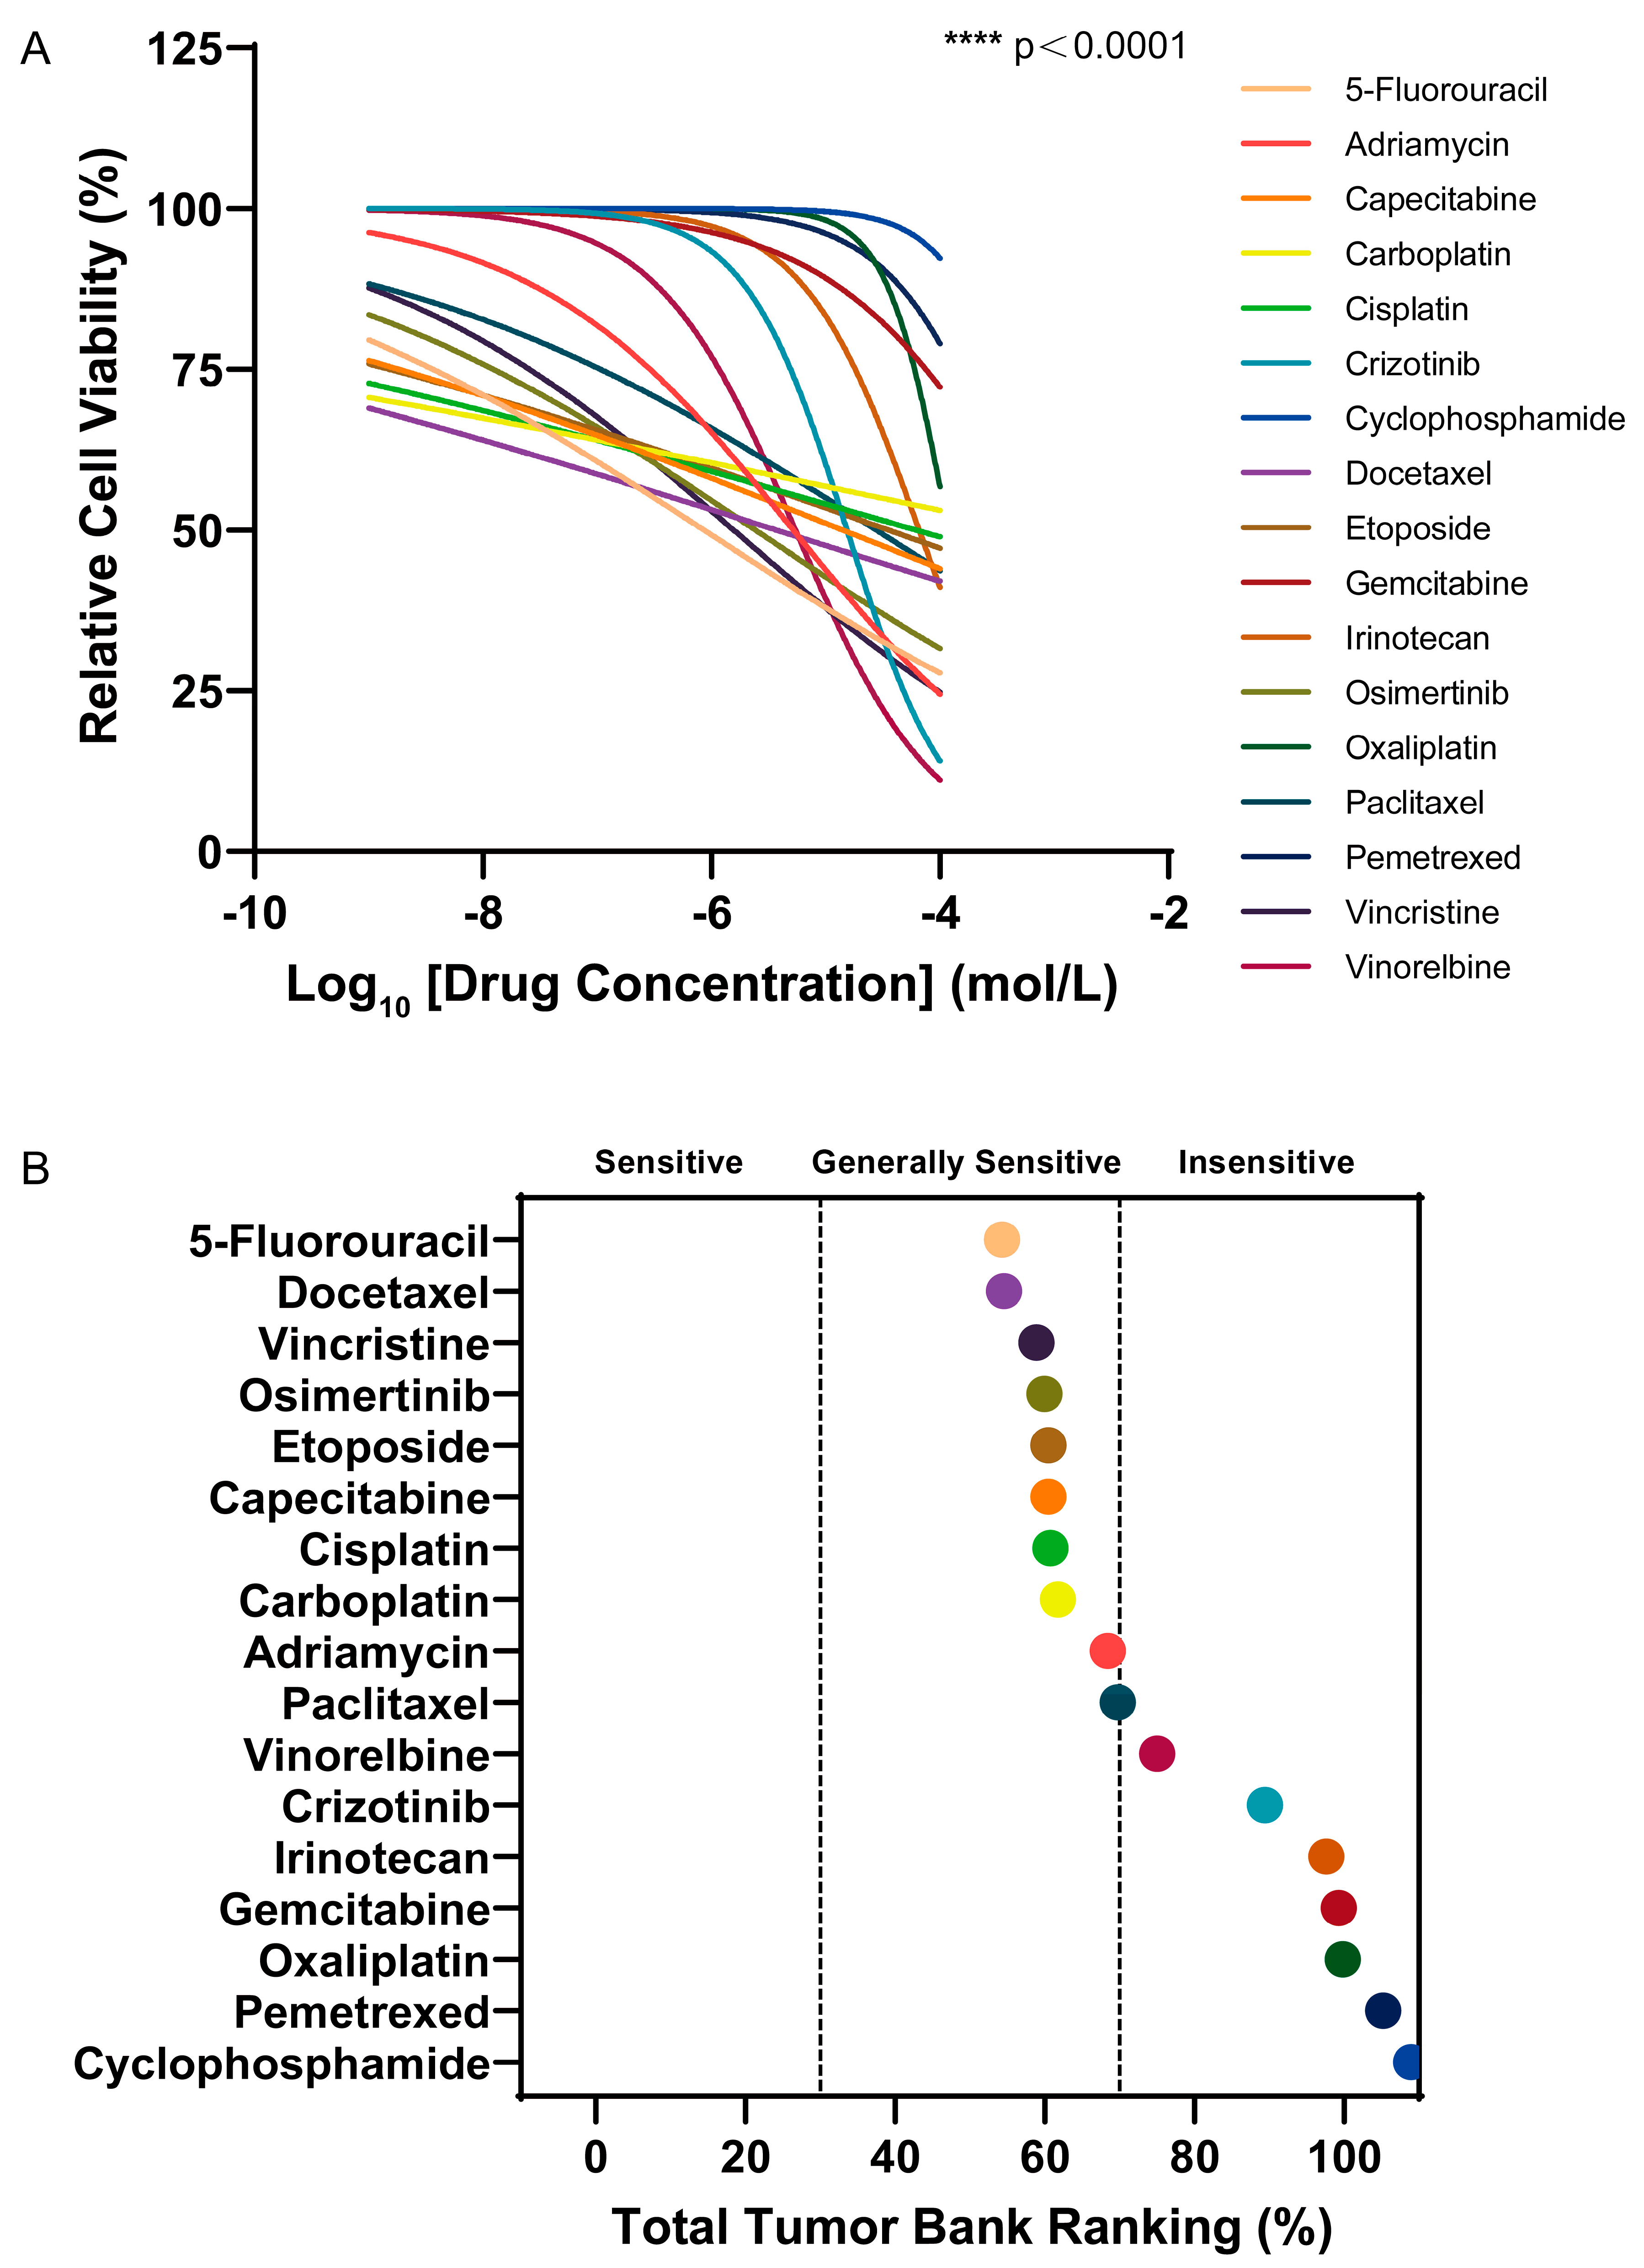
In the 3D culture model based on Sciobio-II matrix gel, the relative viability of PC-9 lung cancer cells following drug treatment was assessed by measuring ATP content using the CellTiter-Lumi™ luminescence assay (Figure 9A). The results showed that the relative viability of PC-9 cells gradually decreased with increasing drug concentrations. Using GraphPad Prism 9.1, the area under the concentration-response curve (AUC) was calculated based on the relative cell viability data, and an AUC ranking plot was generated (Figure 9B). Based on the AUC values, the efficacy ranking and relative position of each drug in the 3D screening system for PC-9 cells were determined (Table 1). The analysis indicated that AUC values were negatively correlated with drug sensitivity: the lower the AUC value, the higher the potency of the corresponding antitumor drugs within the tested drug library, indicating greater sensitivity and more pronounced cytotoxic effects against PC-9 lung cancer cells.
Figure 9.
Drug sensitivity testing in 3D-cultured PC-9 cells based on Sciobio-II matrix gel: (A) Relative viability of PC-9 cells after drug treatment (Mean ± SD, n = 3 independent biological replicates, each with 3 technical replicate wells), **** p < 0.0001 (one-way ANOVA with Dunnett’s post hoc test, compared with untreated control). (B) AUC ranking of drugs in PC-9 cells.
Table 1.
Drug sensitivity of PC-9 cells in 3D culture based on Sciobio-II matrix gel (AUC values are reported as the Mean ± SD of n = 3 independent biological replicates).
In the 3D culture model constructed with Sciobio-II matrix gel, multiple antitumor drugs, including 5-Fluorouracil, Docetaxel, Vincristine, Osimertinib, Capecitabine, Etoposide, Cisplatin, Carboplatin, Adriamycin, and Paclitaxel, exhibited favorable cytotoxic effects, with AUC values consistently falling within the relatively low range of 54.32–69.74. These drugs were therefore assessed as “generally sensitive”.
2.3.2. Drug Sensitivity Testing in 2D-Cultured PC-9 Cells
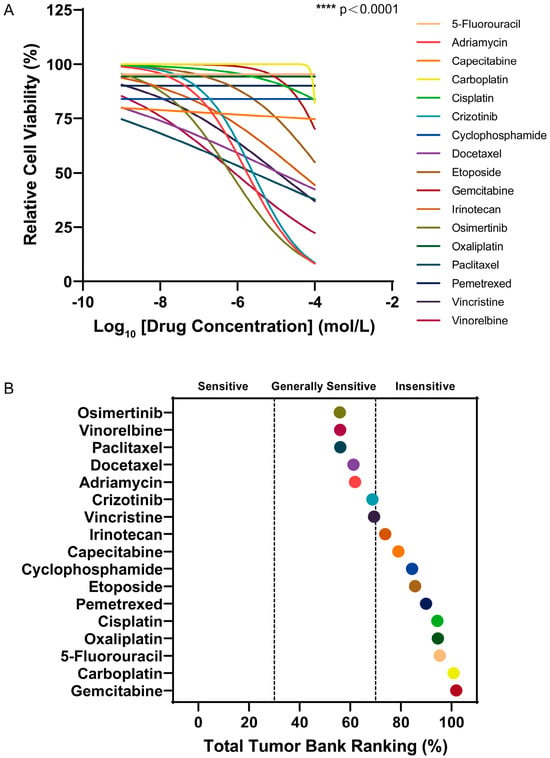
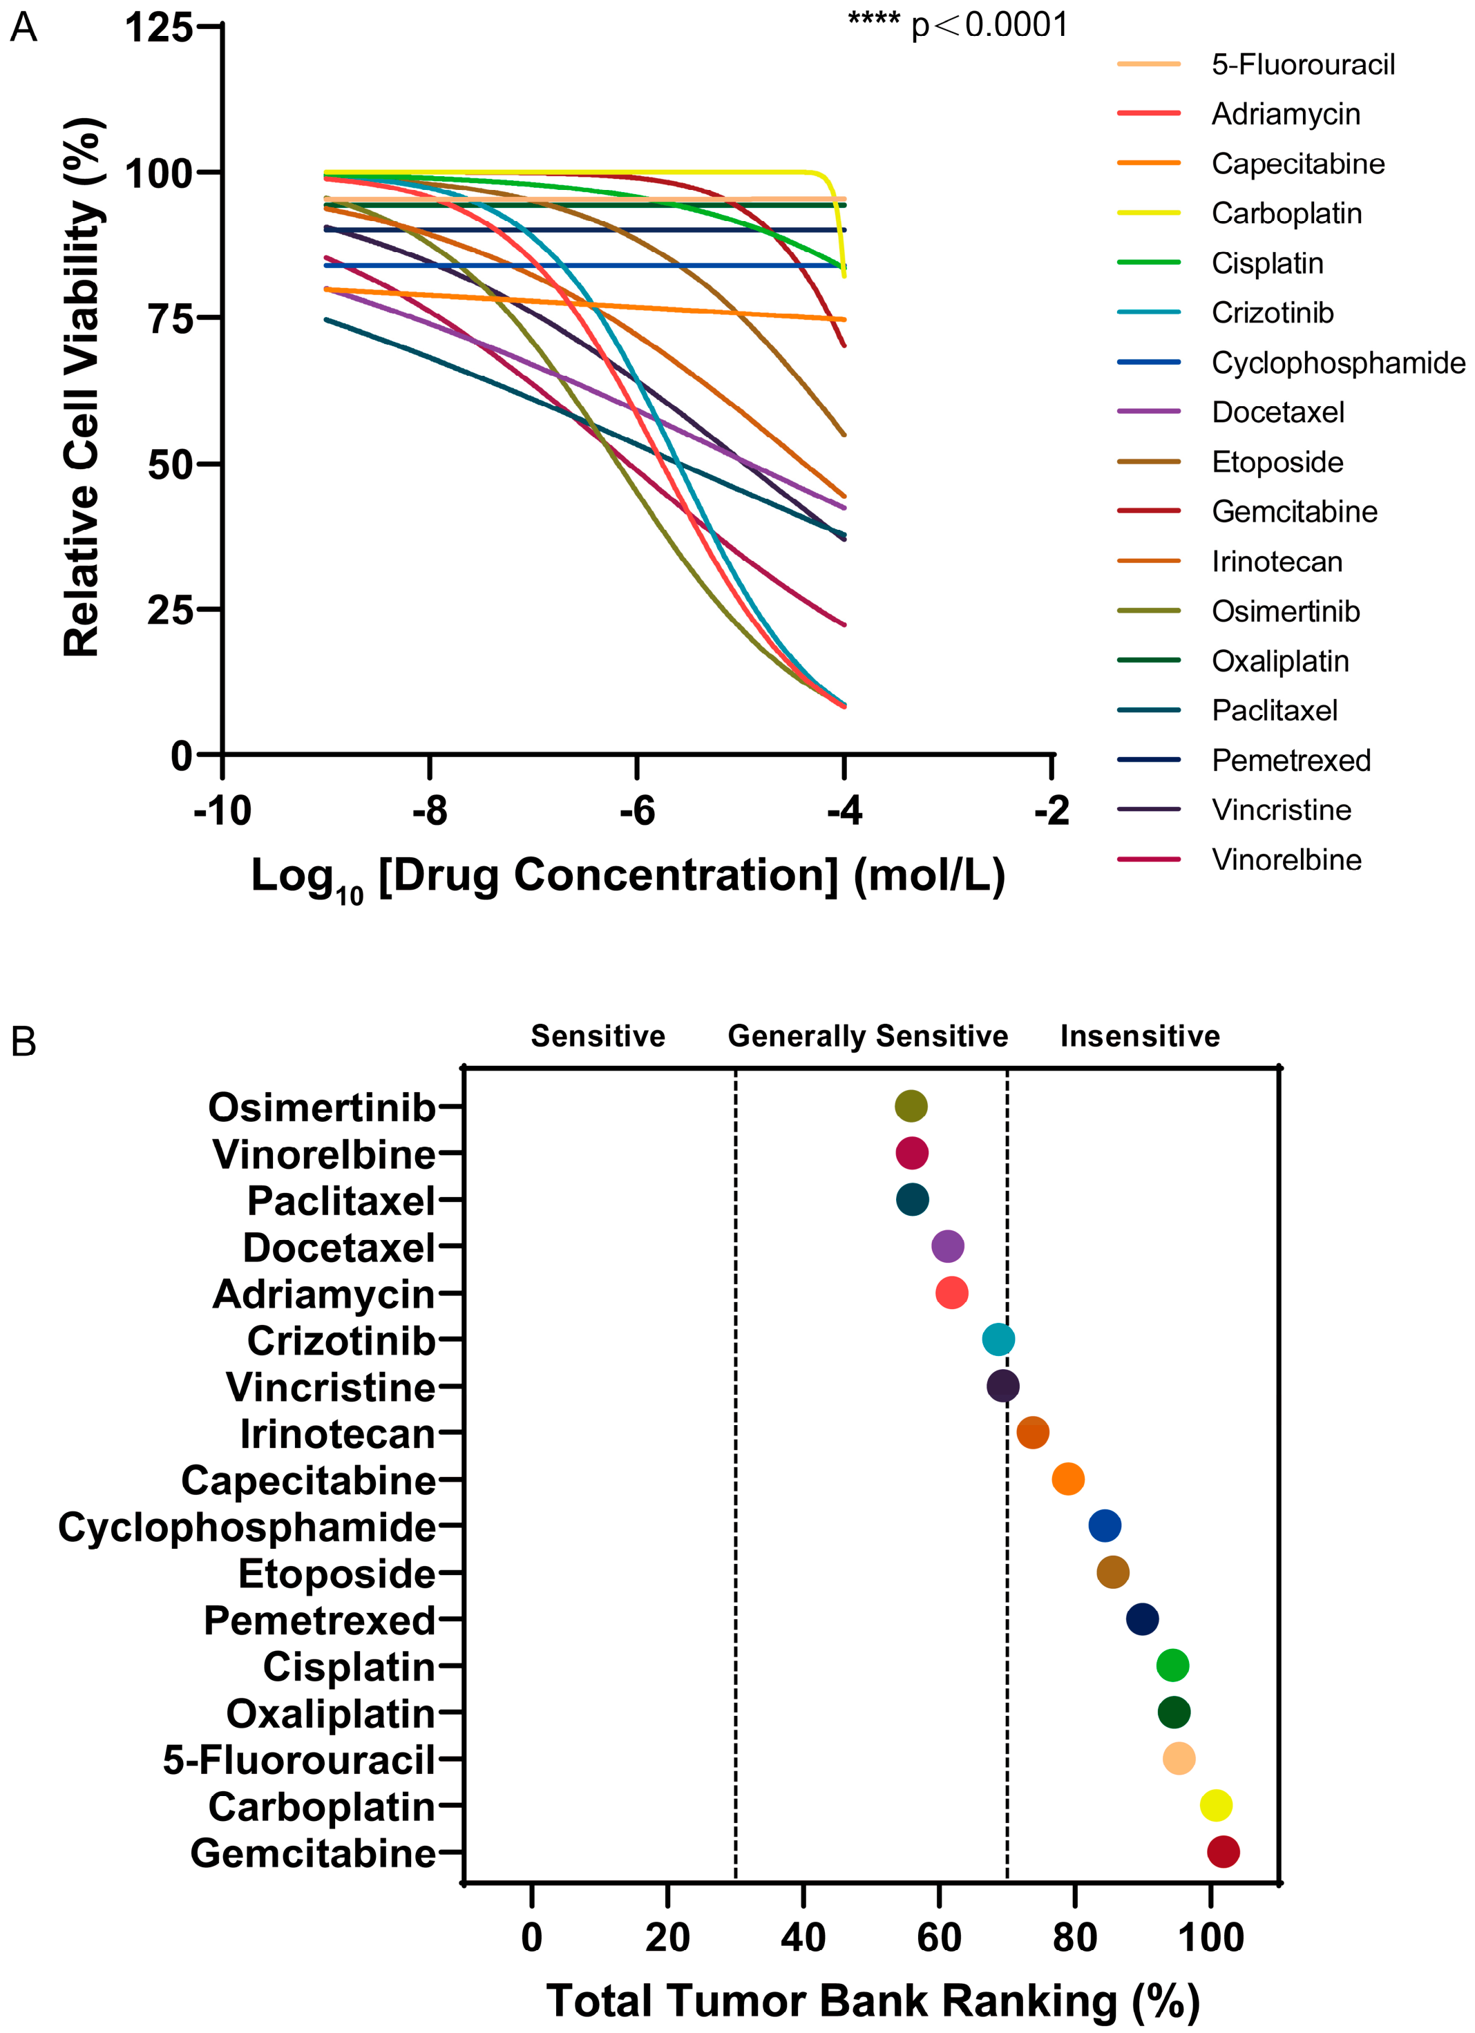
Drug sensitivity testing and AUC ranking analysis for 2D culture were performed using the same assay and calculation pipeline described above (Figure 10; Table 2), with AUC values remaining inversely correlated with drug cytotoxic potency.
Figure 10.
Drug sensitivity testing in 2D-cultured PC-9 cells: (A) Relative viability of PC-9 cells after drug treatment (Mean ± SD, n = 3 independent biological replicates, each with 3 technical replicate wells), **** p < 0.0001 (one-way ANOVA with Dunnett’s post hoc test, compared with untreated control). (B) AUC ranking of drugs in PC-9 cells.
Table 2.
Drug sensitivity of PC-9 cells in 2D culture (AUC values are reported as the Mean ± SD of n = 3 independent biological replicates).
Compared with the 3D culture model, Vinorelbine and Crizotinib exhibited relatively low AUC values under 2D culture conditions, with values of 56.04 and 68.74, respectively, and both were rated as “generally sensitive.” In the 3D culture system, however, the AUC values of both drugs increased markedly, reaching 75.06 and 89.46, respectively, and their sensitivity ratings shifted to “insensitive.” This difference indicates that, under 2D culture conditions, cells grow as flat, adherent monolayers without an ECM barrier, allowing most drugs to directly access the cells and consequently making the cells appear more sensitive to drug treatment. In contrast, 3D culture introduces an ECM-like barrier, while cell aggregation further limits drug penetration, thereby producing a drug-response environment that more closely recapitulates the in vivo situation.
2.4. Discussion
A central challenge in drug development and clinical translation lies in the fact that conventional 2D culture systems fail to faithfully recapitulate the complex in vivo tumor microenvironment, resulting in substantial discrepancies between preclinical efficacy assessments and actual clinical response [30]. In this study, we established a 3D culture system based on the chemically synthesized, well-defined SAP Sciobio-II and systematically evaluated its application potential for the in vitro culture of NSCLC PC-9 cells as well as drug sensitivity testing [31]. Experimental data demonstrated that, by reproducing certain structural features of the native ECM, this matrix gel reshaped the growth patterns and drug response profiles of tumor cells, thereby providing technical support for preclinical drug candidate prioritization and high-throughput drug screening [26,32].
Sciobio-II consists of 16 amino acids, and its C-terminal amidation modification enhances its overall structural stability (Figure 1). AFM and Cryo-SEM observations confirmed that Sciobio-II self-assembled into a well-organized 3D nanofibrous network scaffold. Fibers measured 300–400 nm long and 17–24 nm wide, forming interconnected submicrometer pores resembling native ECM. This architecture offers high surface area for cell–matrix contacts, permits nutrient and metabolite diffusion, and provides structural support for cell growth (Figure 2 and Figure 3) [16]. Congo red staining confirmed the β-sheet structure, consistent with previous circular dichroism results [28]. Aniline blue staining revealed that the assembled matrix gel possessed a continuous, uniform, and dense fibrous network (Figure 4). Rheological data confirm the stable hydrogel nature of Sciobio-II (Figure 5). Combined with its nanofibrous topography, this provides ECM-like mechanical support that modulates cell–matrix interactions and reconstructs physicochemical features of the tumor ECM [33]. Notably, controlled ionic-strength and buffer-composition conditions that deconvolve the individual contributions of Na+, K+, Cl−, and HPO42− to assembly were not tested here and will be addressed in future studies.
In the biocompatibility assessment, PC-9 cells cultured in the Sciobio-II-based 3D model displayed pronounced morphological heterogeneity. Unlike the flat, adherent monolayer growth pattern characteristic of conventional 2D culture, PC-9 cells in the 3D environment spontaneously aggregated into cellular spheroids with diameters ranging from 50 to 150 μm (Figure 6). Live/Dead staining and cell viability assays showed that during Days 7–14, 2D cultures underwent a sharp viability decline with extensive cell death, whereas 3D cultures sustained high viability and stable long-term proliferation (Figure 7 and Figure 8) [30]. Given matched seeding densities and twice-weekly medium refreshment, this late decline is attributable to overconfluence and nutrient depletion under monolayer conditions, not to an intrinsic limitation of the 2D format. This comparison highlights the critical role of culture dimensionality in dictating cellular behavior. Rigid substrates in 2D culture can induce aberrant mechanotransduction, thereby accelerating cellular senescence and necrosis under contact -inhibited conditions [34]. Conversely, the 3D microenvironment constructed with Sciobio-II may better preserve PC-9 cell polarity, proliferative homeostasis, and functional heterogeneity by providing a biomimetic matrix microenvironment relative to rigid planar substrates [35].
Further drug sensitivity testing confirmed that differences in culture modalities exert a decisive impact on efficacy evaluation [36]. The AUC is inversely correlated with in vitro drug potency; it serves as an intuitive metric for illustrating how culture dimensionality influences antitumor drug screening outcomes. In the 3D culture model constructed with the Sciobio-II matrix gel, PC-9 cells exhibited clear dose-dependent response curves across all 17 tested drugs, enabling quantitative comparison and ranking based on their respective AUC values (Figure 9 and Figure 10) [27]. In contrast, the 2D culture model revealed substantial limitations in drug efficacy evaluation. Although Osimertinib (AUC = 55.92), Paclitaxel (AUC = 56.10), and Adriamycin (AUC = 61.90) exhibited low AUC values, the sensitivity of PC-9 cells to these drugs in culture systems is consistent with the results reported in published PC-9 studies, supporting the baseline reliability of our experimental setup [37,38]. However, no definitive cytotoxic effects were observed for multiple other routinely effective clinical drugs. The sensitivity shifts in Vinorelbine and Crizotinib are consistent with mechanistic evidence. Vinorelbine, a microtubule-targeting drug, relies on tissue penetration for cytotoxicity; the ECM barrier and compact spheroid architecture in 3D recapitulate the penetration limitation observed in solid tumors, explaining its reduced sensitivity in this 3D NSCLC model [39,40]. For Crizotinib, an ALK/ROS1 inhibitor, low 3D sensitivity better reflects PC-9′s molecular profile (EGFR-mutant, ALK-wildtype), whereas its apparent 2D activity likely reflects unobstructed, non-specific cytotoxicity in the absence of matrix barriers [41]. This 2D “supersensitivity” bias arises from the lack of ECM-mediated physical barriers and spatial steric hindrance, which allows near-direct drug access and thereby underestimates AUC values [42]. It thus creates a false impression of heightened sensitivity while failing to reproduce in vivo penetration and microenvironment-mediated resistance [26,43,44]. Such biases arising from the inherent constraints of 2D culture systems may represent a key driver behind the high failure rates observed in new drug discovery [26,45]. Compared with highly simplified 2D systems, the matrix gel-based 3D culture system offers a more comprehensive reflection of the drug-resistant biological features of tumor cells growing in a 3D growth state. This dimensional divergence in drug sensitivity profiles suggests that, during preclinical drug evaluation, relying exclusively on conventional 2D screening platforms can substantially misestimate the actual in vivo efficacy of specific antitumor drugs [46]. Therefore, utilizing AUC parameters derived from Sciobio-II matrix gel-based 3D drug sensitivity results as a reference may provide a more rational basis for preclinical drug candidate prioritization. Notably, drug diffusion through the gel was achieved by overlaying drug-containing medium on the matrix; however, peptide-mediated drug sequestration or binding was not quantified. The clinical predictive value of this model remains unestablished; further validation with clinical samples and in vivo models is required before clinical translation [26,47,48,49].
In summary, through multidimensional evaluations encompassing material characterization, biocompatibility assays, and drug sensitivity testing, this study demonstrates that the Sciobio-II matrix gel reconstructs structural features of the tumor ECM, thereby mitigating the inherent limitations of conventional culture systems [50]. Its well-defined chemical composition and exceptional stability render it a promising platform for standardized drug screening [47].
3. Conclusions
In conclusion, this study developed a 3D cell culture platform based on the SAP Sciobio-II. Upon stimulation with specific ions, Sciobio-II rapidly self-assembles into a 3D nanofibrous network scaffold with uniform fiber diameters and a stable network architecture. This scaffold exhibits an ECM-like nanofibrous architecture of the native ECM and excellent biocompatibility, not only supporting the long-term proliferation and viability of NSCLC PC-9 cells but also promoting the formation of cell spheroids with morphologies that more closely resemble those observed in vivo [27,30]. In drug sensitivity testing, this 3D platform enabled the screening of multiple antitumor drugs, demonstrating clear dose-dependent responses and quantifiable and comparable AUC values, and reducing the bias in drug sensitivity caused by the absence of an in vivo microenvironment in conventional 2D culture [26,44]. Therefore, the compositionally defined Sciobio-II matrix gel serves as a promising preclinical screening tool for reconstructing tumor ECM structural features [47]. Additional quantitative characterization of scaffold porosity and drug permeability will be performed in subsequent work to further verify the biomimetic performance of the platform. As this proof-of-concept study is exclusively based on the EGFR-mutant PC-9 cell line, the generalizability of this platform across NSCLC subtypes with distinct molecular profiles requires further validation. Future work will extend validation to NSCLC cell lines with diverse molecular backgrounds (e.g., KRAS-mutant A549, EGFR wild-type H1299, TKI-resistant sublines) and patient-derived organoids, expand its application to a broader spectrum of tumor types, and explore its integration with immune co-culture and vascularized tissue models to refine the predictive accuracy of preclinical drug screening [51,52,53].
4. Materials and Methods
4.1. Structure and Preparation of Sciobio-II
Sciobio-II was designed and synthesized by Chengdu Sciobio Biotechnology Co., Ltd. (Chengdu, China) according to previous research with HPLC purity > 98%, molecular weight confirmed by mass spectrometry, and stored dry at −20 °C [28]. The molecular formula was generated using ChemDraw 22.2.0, and the 3D structural model was built with Chem3D based on the Sciobio-II sequence. To optimize the final peptide concentration, gel shrinkage, network architecture, cell viability, and cell spheroid formation rate were tuned across a range of 1–5 mg/mL. Gel shrinkage was assessed by vial inversion; the optimal gel concentration was determined through cell viability assessment, and independent preparations were checked for batch-to-batch consistency in the matrix gel. Since lower concentrations yielded highly flowing gels while higher concentrations produced overly dense fiber networks restricting cell growth, 3 mg/mL was chosen as the working concentration, forming a self-supporting, stable hydrogel with optimal nanofiber density suitable for 3D cell culture. At room temperature, ultrapure water was added to Sciobio-II and gently pipetted until it was completely dissolved to prepare a 6 mg/mL Sciobio-II stock solution. An appropriate volume of the stock solution was mixed with 1× PBS at a 1:1 volume ratio. This 1:1 dilution halves the 6 mg/mL stock to the optimal 3 mg/mL working concentration while providing the physiological ionic strength required to trigger peptide self-assembly. It was left to stand at room temperature for 10 min to form a working solution of Sciobio-II matrix gel at 3 mg/mL. The assembled matrix gel was stored at 4 °C until further use.
4.2. AFM Characterization of the Sciobio-II Matrix Gel
A 10 μL aliquot of the Sciobio-II matrix gel working solution was deposited on a mica substrate, and scanning imaging was performed in contact mode. For quantitative analysis, 3 independently prepared Sciobio-II matrix gel samples were analyzed, and 3 representative fields per sample were acquired at each magnification. Nanofiber length and width were measured using Gwyddion 2.68 and NanoScope Analysis 1.40, with at least 30 individual fibers quantified per sample.
4.3. Cryo-SEM Characterization of the Sciobio-II Matrix Gel
The Sciobio-II matrix gel was rapidly frozen for fixation, then transferred to a high-vacuum cryo-preparation chamber and fractured to expose flat internal cross-sections. Freeze-etching was performed to sublime the superficial ice layer and reveal the intrinsic 3D nanofibrous network. Finally, the samples were sputter-coated with a thin film at low temperature to enhance surface electrical conductivity. The scanning electron microscopy parameters were set as follows: an acceleration voltage of 3 kV, a working distance of 7.5–7.6 mm, and a magnification range of 1000–10,000× for observation and imaging, with the sample maintained at cryogenic temperature throughout the entire imaging process. Imaging was performed on 3 independent Sciobio-II matrix gel preparations, with 4 representative fields captured per sample at each magnification. Fiber diameter measurements were conducted using ImageJ 1.54d, with a minimum of 30 fibers counted per sample for statistical analysis.
4.4. Microscope Characterization of the Sciobio-II Matrix Gel
10 μL of Sciobio-II matrix gel working solution was placed on a glass slide, and 10 μL of Congo red or aniline blue staining solution was added to the gel and allowed to stain for 30 s. The morphology of the Sciobio-II matrix gel before self-assembly and on days 0, 1, 7, and 14 after self-assembly was observed and recorded under a conventional optical microscope. All observations were performed on 3 independent Sciobio-II matrix gel preparations, with 3 representative fields imaged at each time point to ensure reproducibility.
4.5. Rheological Characterization of the Sciobio-II Matrix Gel
Oscillatory rheological measurements were performed on a rotational rheometer with a 20 mm diameter parallel-plate geometry. Sciobio-II matrix gel was loaded onto the lower plate. The upper plate was lowered to a 500 μm gap, and excess sample was trimmed from the edge. A solvent trap was applied to prevent evaporation. A frequency sweep was conducted at a constant strain of 0.5%, over 0.1–10 Hz at 37 °C. The storage modulus (G′) and loss modulus (G″) were recorded as functions of frequency.
4.6. Cell Culture Methods in Different Culture Modes
4.6.1. 3D Culture Mode Based on Sciobio-II Matrix Gel
The human NSCLC PC-9 cell line was originally established from a human lung adenocarcinoma specimen by Dr. I. Hayata and colleagues at Tokyo Medical and Dental University (Tokyo, Japan) and obtained from the Cell Bank of the Chinese Academy of Sciences (Shanghai, China; catalog number: SCSP-5085). Cells were maintained in our laboratory. Mycoplasma testing was negative, and cells with passage numbers below 20 were used in all experiments. PBS was added to the cell pellet, and a single-cell suspension was obtained by gentle pipetting. After cell counting, the cell density was adjusted according to specific experimental requirements. An appropriate volume of Sciobio-II stock solution was thoroughly mixed with an equal volume of the cell suspension. The mixture was seeded into a cell culture plate, and complete culture medium was then gently added along the walls of the wells. The cell culture plate was placed in a cell culture incubator at 37 °C with 5% CO2. The complete medium was replaced twice a week, and cell growth was observed under a microscope at regular intervals.
4.6.2. 2D Culture Mode
The complete culture medium was added to the cell pellet, and a single-cell suspension was obtained by gentle pipetting. After cell counting, the cell density was adjusted according to specific experimental requirements. The cell suspension was seeded into a cell culture plate, which was then placed in a cell culture incubator at 37 °C with 5% CO2. The complete medium was replaced twice a week, and cell growth was observed under a microscope at regular intervals.
4.7. Live/Dead Staining of Cells in Different Culture Modes
PC-9 cells were seeded into 96-well cell culture plates at approximately 2000 cells/well in different culture modes as described above. The same initial seeding density was used for both 2D and 3D cultures to ensure consistent starting conditions for comparative analysis of growth kinetics and long-term viability. To prevent over-confluence, 2000 cells/well were used for long-term viability tracking. Fluorescence microscopy was performed on Day 1, Day 3, Day 5, Day 7, and Day 14 after seeding. Calcein AM/PI working solution was freshly prepared and thoroughly mixed by vortexing. The old medium was discarded, cells were washed with PBS, and residual PBS was removed. Then 100 μL of Calcein AM/PI working solution was added to each well of the 96-well plate and incubated at 37 °C in the dark for 30 min. After incubation, the staining status was examined under a fluorescence microscope and photographed for documentation.
4.8. Assessment of Cell Viability in Different Culture Modes
PC-9 cells were seeded into white-walled, clear-bottom 96-well plates suitable for chemiluminescence detection at approximately 2000 cells/well in different culture modes as described above. An identical seeding density was applied to both culture modes to enable head-to-head comparison of cell proliferation kinetics under matched initial conditions. For 3D culture, wells containing Sciobio-II matrix gel without cells were set as blank controls to exclude matrix-derived effects. For 2D culture, wells without cells were set as blank controls. Cell viability was assessed on Day 1, Day 3, Day 5, Day 7, and Day 14 after seeding. ATP standards at serial concentrations were encapsulated in the Sciobio-II matrix gel to verify that the matrix does not interfere with the ATP-based luminescence assay. An appropriate volume of cell viability detection reagent was equilibrated to room temperature, and the 96-well plate was removed and allowed to equilibrate to room temperature. Then 100 μL of cell viability detection reagent was added to each well, and the plate was shaken for 5 min to fully lyse cells and release ATP. After incubation at room temperature for 25 min to stabilize the luminescence signal, chemiluminescence was measured using a microplate reader, and cell viability was calculated based on the luminescence signals. The cell viability of the Day 1 group was set as 100%, and the relative cell viability of each group was calculated by comparison.
4.9. Drug Sensitivity Testing in Different Culture Modes
PC-9 cells were seeded into white-walled, clear-bottom 96-well plates suitable for chemiluminescence detection at approximately 10,000 cells/well in different culture modes as described above. Furthermore, 10,000 cells/well were employed for drug sensitivity assays to ensure sufficient luminescent signal output following a 48-h drug incubation period. For 3D culture, wells containing Sciobio-II matrix gel without cells were set as blank controls to exclude matrix-derived luminescence background, and wells without drugs served as negative controls. For 2D culture, wells without cells were set as blank controls, and wells without drugs served as negative controls. The panel of 17 antitumor drugs was selected to cover major classes of systemic therapeutics used clinically for NSCLC, including platinum-based chemotherapies, antimetabolites, taxanes, vinca alkaloids, topoisomerase inhibitors, tyrosine kinase inhibitors, and alkylating agents. This broad coverage enables cross-class comparison of how culture dimensionality influences drug response profiles. Stock solutions were prepared according to the solvents and concentrations recommended by each drug manufacturer and stored at −80 °C. For drugs dissolved in DMSO, stock solutions were diluted to working concentrations with complete medium before use, ensuring a final DMSO concentration ≤ 0.1% (v/v) in all wells. The control group containing an equivalent amount of drug solvent was included for all concentration gradients. On the following day, drugs were added to the complete medium of the experimental groups to achieve final concentrations ranging from 1 × 10⁻⁹ to 1 × 10⁻⁴ M. This concentration range was selected to span clinically achievable systemic drug concentrations and standard in vitro screening ranges, enabling full sigmoidal dose–response curve fitting for most drugs. For drugs with limited cytotoxic effects at the highest tested concentration, AUC-based ranking still allows relative potency comparison and identification of low-sensitivity compounds. The 96-well plates were then placed in a cell culture incubator and incubated continuously for 48 h. After drug incubation, cell viability was assessed using the same method as described above. The cell viability of the negative control group was set as 100%, and the relative cell viability of each drug-treated group was calculated by comparison. Specifically, raw luminescence values were first blank-subtracted using cell-free control wells before normalization to the untreated negative control to derive relative viability values. The experiment was independently repeated three times, with three replicate wells per experiment. Experimental data were processed using the log(inhibitor) vs. normalized response—variable slope in GraphPad Prism 9.1. The AUC was calculated based on the fitted dose–response curves, with integration limits set from 1 × 10⁻⁹ to 1 × 10⁻⁴ M on a log10 molar concentration axis covering the full tested concentration range. Drugs were classified into three sensitivity tiers based on their AUC values. The definition of the threshold is based on established conventions in the literature on 3D tumour screening: AUC < 30 = Sensitive; 30 ≤ AUC ≤ 70 = Generally sensitive; AUC > 70 = Insensitive [25].
4.10. Data Analysis
Data are presented as mean ± standard deviation (Mean ± SD) from three independent biological replicates (n = 3). Each biological replicate was performed with cells from different passages, independently prepared Sciobio-II matrix gel, and separately prepared drug dilutions. Three technical replicate wells were included within each biological replicate, and the mean of technical replicates was used for biological replicate-level analysis. This sample size represents standard and statistically justified practice for in vitro dose–response drug screening, consistent with established 3D culture pharmacology protocols [27,43]. Statistical analysis was performed using GraphPad Prism 9.1. For comparisons between two independent groups, an unpaired two-tailed Student’s t-test was used. For comparisons among three or more independent groups, one-way ANOVA followed by Dunnett’s multiple comparisons test was used when each treatment group was compared with a common control group. * p < 0.05, ** p < 0.01, *** p < 0.001, and **** p < 0.0001 were considered statistically significant.
Author Contributions
Conceptualization, J.Z. and Z.L.; methodology, D.S.; software, J.Z.; validation, J.Z., X.Z., D.S. and Y.G.; formal analysis, J.Z.; investigation, J.Z.; resources, Z.L.; data curation, J.Z.; writing—original draft preparation, J.Z.; writing—review and editing, J.Z., X.Z. and Z.L.; visualization, J.Z.; supervision, Z.L.; project administration, D.S.; funding acquisition, Z.L. All authors have read and agreed to the published version of the manuscript.
Funding
This research was funded by the National Natural Science Foundation of China, grant number 31771101.
Institutional Review Board Statement
Not applicable.
Informed Consent Statement
Not applicable.
Data Availability Statement
The data presented in this study are available in the article.
Acknowledgments
Thanks to Chengdu Sciobio Surgery Institute, China, for supporting materials used for experiments and financial support.
Conflicts of Interest
The authors declare no conflicts of interest.
References
- Hendriks, L.E.L.; Remon, J.; Faivre-Finn, C.; Garassino, M.C.; Heymach, J.V.; Kerr, K.M.; Tan, D.S.W.; Veronesi, G.; Reck, M. Non-small-cell lung cancer. Nat. Rev. Dis. Primers 2024, 10, 71. [Google Scholar] [CrossRef] [Scilit]
- Kocarnik, J.M.; Compton, K.; Dean, F.E.; Fu, W.; Gaw, B.L.; Harvey, J.D.; Henrikson, H.J.; Lu, D.; Pennini, A.; Xu, R.; et al. Cancer Incidence, Mortality, Years of Life Lost, Years Lived With Disability, and Disability-Adjusted Life Years for 29 Cancer Groups From 2010 to 2019: A Systematic Analysis for the Global Burden of Disease Study 2019. JAMA Oncol. 2022, 8, 420–444. [Google Scholar] [PubMed]
- Meyer, M.L.; Fitzgerald, B.G.; Paz-Ares, L.; Cappuzzo, F.; Jänne, P.A.; Peters, S.; Hirsch, F.R. New promises and challenges in the treatment of advanced non-small-cell lung cancer. Lancet 2024, 404, 803–822. [Google Scholar] [CrossRef] [Scilit] [PubMed]
- Reck, M.; Frost, N.; Peters, S.; Fox, B.A.; Ferrara, R.; Savai, R.; Barlesi, F. Treatment of NSCLC after chemoimmunotherapy—Are we making headway? Nat. Rev. Clin. Oncol. 2025, 22, 806–830. [Google Scholar] [CrossRef] [Scilit] [PubMed]
- McGranahan, N.; Swanton, C. Clonal Heterogeneity and Tumor Evolution: Past, Present, and the Future. Cell 2017, 168, 613–628. [Google Scholar] [CrossRef] [Scilit] [PubMed]
- Peng, Z.; Lv, X.; Sun, H.; Zhao, L.; Huang, S. 3D tumor cultures for drug resistance and screening development in clinical applications. Mol. Cancer 2025, 24, 93. [Google Scholar] [CrossRef] [Scilit] [PubMed]
- Duval, K.; Grover, H.; Han, L.H.; Mou, Y.; Pegoraro, A.F.; Fredberg, J.; Chen, Z. Modeling Physiological Events in 2D vs. 3D Cell Culture. Physiology 2017, 32, 266–277. [Google Scholar] [CrossRef] [Scilit] [PubMed]
- Ravi, M.; Paramesh, V.; Kaviya, S.R.; Anuradha, E.; Solomon, F.D. 3D cell culture systems: Advantages and applications. J. Cell. Physiol. 2015, 230, 16–26. [Google Scholar] [CrossRef] [Scilit] [PubMed]
- Kapałczyńska, M.; Kolenda, T.; Przybyła, W.; Zajączkowska, M.; Teresiak, A.; Filas, V.; Ibbs, M.; Bliźniak, R.; Łuczewski, Ł.; Lamperska, K. 2D and 3D cell cultures—A comparison of different types of cancer cell cultures. Arch. Med. Sci. 2018, 14, 910–919. [Google Scholar] [PubMed]
- Imamura, Y.; Mukohara, T.; Shimono, Y.; Funakoshi, Y.; Chayahara, N.; Toyoda, M.; Kiyota, N.; Takao, S.; Kono, S.; Nakatsura, T.; et al. Comparison of 2D- and 3D-culture models as drug-testing platforms in breast cancer. Oncol. Rep. 2015, 33, 1837–1843. [Google Scholar] [CrossRef] [Scilit] [PubMed]
- Guilbaud-Chéreau, C.; Dinesh, B.; Wagner, L.; Chaloin, O.; Ménard-Moyon, C.; Bianco, A. Aromatic Dipeptide Homologue-Based Hydrogels for Photocontrolled Drug Release. Nanomaterials 2022, 12, 1643. [Google Scholar] [CrossRef] [Scilit] [PubMed]
- Scognamiglio, P.L.; Diaferia, C.; Pizzella, M.; Accardo, A.; Morelli, G.; Tesauro, D. Mechanically Enhanced Ultrashort Peptide Hydrogels for pH-Triggered Release. ACS Polym. Au 2026, 6, 906–917. [Google Scholar] [CrossRef] [Scilit] [PubMed]
- Yamamoto, S.; Nishimura, K.; Morita, K.; Kanemitsu, S.; Nishida, Y.; Morimoto, T.; Aoi, T.; Tamura, A.; Maruyama, T. Microenvironment pH-Induced Selective Cell Death for Potential Cancer Therapy Using Nanofibrous Self-Assembly of a Peptide Amphiphile. Biomacromolecules 2021, 22, 2524–2531. [Google Scholar] [CrossRef] [Scilit] [PubMed]
- Jervis, P.J.; Hilliou, L.; Pereira, R.B.; Pereira, D.M.; Martins, J.A.; Ferreira, P.M.T. Evaluation of a Model Photo-Caged Dehydropeptide as a Stimuli-Responsive Supramolecular Hydrogel. Nanomaterials 2021, 11, 704. [Google Scholar] [CrossRef] [Scilit] [PubMed]
- Luo, Y.; Liu, X.; Dong, Z.; Song, Y. Molecular-Level Design Principles and Strategies of Peptide Self-Assembly Nanomaterials: From Sequence Engineering to Functional Applications. Int. J. Nanomed. 2025, 20, 15277–15312. [Google Scholar] [CrossRef] [Scilit] [PubMed]
- Zhang, S. Fabrication of novel biomaterials through molecular self-assembly. Nat. Biotechnol. 2003, 21, 1171–1178. [Google Scholar] [CrossRef] [Scilit] [PubMed]
- Yaguchi, A.; Oshikawa, M.; Watanabe, G.; Hiramatsu, H.; Uchida, N.; Hara, C.; Kaneko, N.; Sawamoto, K.; Muraoka, T.; Ajioka, I. Efficient protein incorporation and release by a jigsaw-shaped self-assembling peptide hydrogel for injured brain regeneration. Nat. Commun. 2021, 12, 6623. [Google Scholar] [CrossRef] [Scilit] [PubMed]
- Fu, K.; Wu, H.; Su, Z. Self-assembling peptide-based hydrogels: Fabrication, properties, and applications. Biotechnol. Adv. 2021, 49, 107752. [Google Scholar] [CrossRef] [Scilit] [PubMed]
- Ramirez-Labrada, A.; Santiago, L.; Pesini, C.; Arrieta, M.; Arias, M.; Calvo Pérez, A.; Ciulla, M.G.; Forouharshad, M.; Pardo, J.; Gálvez, E.M.; et al. Multiparametric in vitro and in vivo analysis of the safety profile of self-assembling peptides. Sci. Rep. 2024, 14, 4395. [Google Scholar] [CrossRef] [Scilit] [PubMed]
- Bakhtiary, N.; Ghalandari, B.; Ghorbani, F.; Varma, S.N.; Liu, C. Advances in Peptide-Based Hydrogel for Tissue Engineering. Polymers 2023, 15, 1068. [Google Scholar] [CrossRef] [Scilit] [PubMed]
- Luo, Z.; Wang, S.; Zhang, S. Fabrication of self-assembling D-form peptide nanofiber scaffold d-EAK16 for rapid hemostasis. Biomaterials 2011, 32, 2013–2020. [Google Scholar] [CrossRef] [Scilit] [PubMed]
- Luo, Z.; Zhao, X.; Zhang, S. Self-organization of a chiral D-EAK16 designer peptide into a 3D nanofiber scaffold. Macromol. Biosci. 2008, 8, 785–791. [Google Scholar] [CrossRef] [Scilit] [PubMed]
- Wan, Y.; Luo, R.; Chen, J.; Luo, X.; Liu, G.; Su, D.; Lu, N.; Liu, Q.; Luo, Z. A Self-Assembling Peptide as a Model for Detection of Colorectal Cancer. Gels 2022, 8, 770. [Google Scholar] [CrossRef] [Scilit] [PubMed]
- Su, D.; Luo, X.; Chen, J.; Lu, N.; Zhao, J.; Wan, Y.; Gao, Y.; Liu, Q.; Luo, Z. Construction of a three-dimensional inflammation model of human bronchial epithelial cells BEAS-2B by using the self-assembling D-form peptide Sciobio-III. Biochem. Biophys. Res. Commun. 2024, 704, 149701. [Google Scholar] [CrossRef] [Scilit] [PubMed]
- Gao, Y.; Su, D.; Zhao, J.; Luo, Z.; Lin, X. Study on the Feasibility of Self-Assembling Peptides as a Three-Dimensional Culture Tool for Drug Screening of Colorectal Adenocarcinoma Cells. Gels 2025, 11, 394. [Google Scholar] [CrossRef] [Scilit] [PubMed]
- Horvath, P.; Aulner, N.; Bickle, M.; Davies, A.M.; Nery, E.D.; Ebner, D.; Montoya, M.C.; Östling, P.; Pietiäinen, V.; Price, L.S.; et al. Screening out irrelevant cell-based models of disease. Nat. Rev. Drug Discov. 2016, 15, 751–769. [Google Scholar] [CrossRef] [Scilit] [PubMed]
- Friedrich, J.; Seidel, C.; Ebner, R.; Kunz-Schughart, L.A. Spheroid-based drug screen: Considerations and practical approach. Nat. Protoc. 2009, 4, 309–324. [Google Scholar] [CrossRef] [Scilit] [PubMed]
- Huang, L.; Lan, S.; Luo, R.; Luo, X.; Liu, G.; Wan, Y.; Wen, J.; Luo, Z. Chiral self-assembled peptides Sciobio II and Sciobio IV for 3D cell culture and repair of anterior cruciate ligament injury in rabbit. Xi Bao Yu Fen Zi Mian Yi Xue Za Zhi 2022, 38, 54–59. [Google Scholar] [PubMed]
- Zhang, S. Designer self-assembling Peptide nanofiber scaffolds for study of 3-d cell biology and beyond. Adv. Cancer Res. 2008, 99, 335–362. [Google Scholar] [CrossRef] [Scilit] [PubMed]
- Pampaloni, F.; Reynaud, E.G.; Stelzer, E.H. The third dimension bridges the gap between cell culture and live tissue. Nat. Rev. Mol. Cell Biol. 2007, 8, 839–845. [Google Scholar] [CrossRef] [Scilit] [PubMed]
- Xue, W.; Wang, T.; Yao, J.; Wu, W.; Chen, D.; Yan, B.; Dong, X.; Tang, Y.; Zeng, Y.; He, Y.; et al. Use of patient-derived tumor organoid platform to predict the benefit of postoperative adjuvant chemotherapy for poor responders to neoadjuvant chemoradiotherapy in locally advanced rectal cancer. Bioeng. Transl. Med. 2023, 8, e10586. [Google Scholar] [CrossRef] [Scilit] [PubMed]
- McMillin, D.W.; Negri, J.M.; Mitsiades, C.S. The role of tumour-stromal interactions in modifying drug response: Challenges and opportunities. Nat. Rev. Drug Discov. 2013, 12, 217–228. [Google Scholar] [CrossRef] [Scilit] [PubMed]
- Engler, A.J.; Sen, S.; Sweeney, H.L.; Discher, D.E. Matrix elasticity directs stem cell lineage specification. Cell 2006, 126, 677–689. [Google Scholar] [CrossRef] [Scilit] [PubMed]
- Discher, D.E.; Janmey, P.; Wang, Y.L. Tissue cells feel and respond to the stiffness of their substrate. Science 2005, 310, 1139–1143. [Google Scholar] [CrossRef] [Scilit] [PubMed]
- Chaudhuri, O.; Cooper-White, J.; Janmey, P.A.; Mooney, D.J.; Shenoy, V.B. Effects of extracellular matrix viscoelasticity on cellular behaviour. Nature 2020, 584, 535–546. [Google Scholar] [CrossRef] [Scilit] [PubMed]
- Mittler, F.; Obeïd, P.; Rulina, A.V.; Haguet, V.; Gidrol, X.; Balakirev, M.Y. High-Content Monitoring of Drug Effects in a 3D Spheroid Model. Front. Oncol. 2017, 7, 293. [Google Scholar] [CrossRef] [Scilit] [PubMed]
- Oguri, T.; Ozasa, H.; Uemura, T.; Bessho, Y.; Miyazaki, M.; Maeno, K.; Maeda, H.; Sato, S.; Ueda, R. MRP7/ABCC10 expression is a predictive biomarker for the resistance to paclitaxel in non-small cell lung cancer. Mol. Cancer Ther. 2008, 7, 1150–1155. [Google Scholar] [CrossRef] [Scilit] [PubMed]
- Chen, Z.; Vallega, K.A.; Wang, D.; Quan, Z.; Fan, S.; Wang, Q.; Leal, T.; Ramalingam, S.S.; Sun, S.Y. DNA topoisomerase II inhibition potentiates osimertinib’s therapeutic efficacy in EGFR-mutant non-small cell lung cancer models. J. Clin. Investig. 2024, 134, e172716. [Google Scholar] [CrossRef] [Scilit] [PubMed]
- Mehta, G.; Hsiao, A.Y.; Ingram, M.; Luker, G.D.; Takayama, S. Opportunities and challenges for use of tumor spheroids as models to test drug delivery and efficacy. J. Control. Release 2012, 164, 192–204. [Google Scholar] [CrossRef] [Scilit] [PubMed]
- Nunes, A.S.; Barros, A.S.; Costa, E.C.; Moreira, A.F.; Correia, I.J. 3D tumor spheroids as in vitro models to mimic in vivo human solid tumors resistance to therapeutic drugs. Biotechnol. Bioeng. 2019, 116, 206–226. [Google Scholar] [CrossRef] [Scilit] [PubMed]
- Gridelli, C.; Peters, S.; Sgambato, A.; Casaluce, F.; Adjei, A.A.; Ciardiello, F. ALK inhibitors in the treatment of advanced NSCLC. Cancer Treat. Rev. 2014, 40, 300–306. [Google Scholar] [CrossRef] [Scilit] [PubMed]
- Schütze, F.; Röhrig, F.; Vorlová, S.; Gätzner, S.; Kuhn, A.; Ergün, S.; Henke, E. Inhibition of Lysyl Oxidases Improves Drug Diffusion and Increases Efficacy of Cytotoxic Treatment in 3D Tumor Models. Sci. Rep. 2015, 5, 17576. [Google Scholar] [CrossRef] [Scilit] [PubMed]
- Fang, Y.; Eglen, R.M. Three-Dimensional Cell Cultures in Drug Discovery and Development. SLAS Discov. 2017, 22, 456–472. [Google Scholar] [CrossRef] [Scilit] [PubMed]
- Minchinton, A.I.; Tannock, I.F. Drug penetration in solid tumours. Nat. Rev. Cancer 2006, 6, 583–592. [Google Scholar] [CrossRef] [Scilit] [PubMed]
- Wong, C.H.; Siah, K.W.; Lo, A.W. Estimation of clinical trial success rates and related parameters. Biostatistics 2019, 20, 273–286. [Google Scholar] [CrossRef] [Scilit] [PubMed]
- Breslin, S.; O’Driscoll, L. Three-dimensional cell culture: The missing link in drug discovery. Drug Discov. Today 2013, 18, 240–249. [Google Scholar] [CrossRef] [Scilit] [PubMed]
- Gjorevski, N.; Sachs, N.; Manfrin, A.; Giger, S.; Bragina, M.E.; Ordóñez-Morán, P.; Clevers, H.; Lutolf, M.P. Designer matrices for intestinal stem cell and organoid culture. Nature 2016, 539, 560–564. [Google Scholar] [CrossRef] [Scilit] [PubMed]
- Pauli, C.; Hopkins, B.D.; Prandi, D.; Shaw, R.; Fedrizzi, T.; Sboner, A.; Sailer, V.; Augello, M.; Puca, L.; Rosati, R.; et al. Personalized In Vitro and In Vivo Cancer Models to Guide Precision Medicine. Cancer Discov. 2017, 7, 462–477. [Google Scholar] [CrossRef] [Scilit] [PubMed]
- Vlachogiannis, G.; Hedayat, S.; Vatsiou, A.; Jamin, Y.; Fernández-Mateos, J.; Khan, K.; Lampis, A.; Eason, K.; Huntingford, I.; Burke, R.; et al. Patient-derived organoids model treatment response of metastatic gastrointestinal cancers. Science 2018, 359, 920–926. [Google Scholar] [CrossRef] [Scilit] [PubMed]
- Caliari, S.R.; Burdick, J.A. A practical guide to hydrogels for cell culture. Nat. Methods 2016, 13, 405–414. [Google Scholar] [CrossRef] [Scilit] [PubMed]
- Sachs, N.; de Ligt, J.; Kopper, O.; Gogola, E.; Bounova, G.; Weeber, F.; Balgobind, A.V.; Wind, K.; Gracanin, A.; Begthel, H.; et al. A Living Biobank of Breast Cancer Organoids Captures Disease Heterogeneity. Cell 2018, 172, 373–386.e310. [Google Scholar] [CrossRef] [Scilit] [PubMed]
- Neal, J.T.; Li, X.; Zhu, J.; Giangarra, V.; Grzeskowiak, C.L.; Ju, J.; Liu, I.H.; Chiou, S.H.; Salahudeen, A.A.; Smith, A.R.; et al. Organoid Modeling of the Tumor Immune Microenvironment. Cell 2018, 175, 1972–1988.e1916. [Google Scholar] [CrossRef] [Scilit] [PubMed]
- Hassell, B.A.; Goyal, G.; Lee, E.; Sontheimer-Phelps, A.; Levy, O.; Chen, C.S.; Ingber, D.E. Human Organ Chip Models Recapitulate Orthotopic Lung Cancer Growth, Therapeutic Responses, and Tumor Dormancy In Vitro. Cell Rep. 2017, 21, 508–516. [Google Scholar] [CrossRef] [Scilit] [PubMed]

Disclaimer/Publisher’s Note: The statements, opinions and data contained in all publications are solely those of the individual author(s) and contributor(s) and not of MDPI and/or the editor(s). MDPI and/or the editor(s) disclaim responsibility for any injury to people or property resulting from any ideas, methods, instructions or products referred to in the content. |
© 2026 by the authors. Licensee MDPI, Basel, Switzerland. This article is an open access article distributed under the terms and conditions of the Creative Commons Attribution (CC BY) license.