


Abstract
Soil contamination by petroleum hydrocarbons in the Ecuadorian Amazon represents a persistent environmental challenge, with many sites exhibiting contamination aged 30–40 years. This study evaluated eight native white-rot fungal (WRF) strains isolated from Yasuní National Park for the degradation of total petroleum hydrocarbons (TPH) and pyrene in a heavily polluted, aged soil from the Sacha Oil Field (Orellana Province, Ecuador). Treatments included Porogramme epimiltina QCAM7782, Trametes menziesii QCAM7783 and QCAM7790, Bjerkandera sp. QCAM7784, Phlebiopsis sp. QCAM7787, Ganoderma cf. parvulum QCAM7791, Trametes villosa QCAM7793 and Lentinus crinitus QCAM7796, as well as a dual-strain consortium (G. cf. parvulum + T. menziesii). All fungal treatments achieved 42–64% TPH C8–C40 removal in 60 days, outperforming natural attenuation (15 ± 1%) and substrate-amended controls without fungi (14 ± 7%) (Tukey HSD, p < 0.05). T. menziesii QCAM7783 exhibited the highest mean TPH removal (64 ± 3%), although differences among fungal treatments were not statistically significant. Removals measured by GC-FID (TPH C8–C40) and by gravimetry ranked the treatments consistently. In the carbon mass balance, total fungal biomass was a minor carbon pool. The dual-strain consortium did not significantly outperform its individual strains. These results support native Amazonian WRF as promising bioaugmentation agents for mycoremediation of aged petroleum-contaminated soils and provide a foundation for future field-scale validation.
1. Introduction
Soil contamination by hydrocarbons has emerged as a global environmental challenge, whose complexity and persistence threaten ecosystem stability and public health [1]. The severity of this issue is exacerbated where accidental hydrocarbon releases from oil spills lead to devastating consequences, including a network of impacts ranging from biodiversity loss to deep, long-term impacts on the health of local communities [2,3].
Soil contamination in Ecuador, particularly in the northeastern Amazon region, is largely due to oil spills. According to Durango-Cordero et al. (2018), between 2001 and 2011, an estimated 10,000 tons of petroleum were spilled in this area [4]. Despite remediation efforts by EP Petroecuador through the “Amazonía Viva” project, which had remediated 1095 of an estimated 2550 pollution sources by July 2022 [5], oil spills remain a critical issue. Ecuador’s northeastern Amazon has borne the brunt of oil contamination over decades [6].
The Ecuadorian Amazon is one of the most biodiverse regions on the planet, harboring an extraordinary richness of flora, fauna, and aquatic ecosystems that depend on the delicate balance of its soils, climate, and waterways. Its unique geographical position, where Andean rivers descend into vast lowland plains, means that any contamination event does not remain localized; pollutants can migrate rapidly across the floodplain, threatening interconnected ecosystems far beyond the original spill site [6]. Oil spill contamination events are exacerbated by the area’s geological instability, characterized by soil erosion and landslides. Additionally, Amazonian soils are nutrient-poor, acidic, and experience high leaching due to heavy rainfall, complicating containment and cleanup efforts [7]. As contact time between contaminants and soil increases, a process known as aging occurs, whereby the chemical and biological availability of pollutants is reduced. Aged soils act as a major sink for hydrophobic organic contaminants (HOCs), which include compounds like polycyclic aromatic hydrocarbons (PAHs) [8]. These contaminants are characterized by their low solubility in water and resistance to degradation, leading to long-term persistence in the soil environment. The bioavailability of these contaminants is influenced by several factors, including soil organic matter and the chemical structure of the contaminants. Over time, HOCs become more strongly bound to soil particles, reducing their availability to microorganisms, and thus their potential for biodegradation [9].
To date, a wide variety of soil remediation approaches have been developed, broadly classified into physical, chemical, and biological methods. Physical techniques such as soil vapor extraction, soil washing and thermal desorption are generally rapid and effective; however, they are associated with high operational costs, generation of secondary toxic residues, and often leave the treated soil in inadequate conditions for further use. Similarly, chemical methods, such as surfactant-enhanced soil flushing, in situ chemical oxidation, and solidification/stabilization, share similar drawbacks: while they are effective for specific contaminants (e.g., hydrocarbons, solvents or heavy metals), they remain costly, may alter soil properties, and frequently lead to the formation of hazardous byproducts [10,11].
In Ecuador, soil washing is the most widely applied remediation technique [12]. However, this approach faces significant challenges when dealing with the region’s contaminated sites. A substantial proportion of contaminated sites in the Ecuadorian Amazon constitute long-term environmental liabilities, with contamination dating back more than 20 years ago [13]. The specific characteristics of these aged soils present several obstacles for conventional soil washing; heavy hydrocarbon fractions are often resistant to removal using conventional surfactants; physical and biological properties of the soil are altered during treatment; and the predominance of clay with low permeability in Amazonian soils hinders the effectiveness of in situ washing.
In contrast, biological remediation approaches, including bioventing, landfarming, composting, phytoremediation, and mycoremediation, are generally cost-effective and environmentally sustainable. These strategies preserve soil integrity and promote ecological restoration, although they are typically slower and strongly influenced by environmental conditions such as pH, nutrient availability, and temperature [14]. Among them, fungal-based approaches have gained increasing attention due to the unique enzymatic capabilities of fungi. White-rot fungi (WRF) represent a specialized group of saprotrophic organisms that play crucial ecological roles as primary decomposers in forest ecosystems [15]. Within this group, different genera exhibit distinct ecological strategies. For example, Ganoderma species function as both plant pathogens causing enzymatic wood decay in living trees and subsequently as saprotrophic decomposers of woody debris. Trametes species specialize primarily as saprotrophic decomposers causing massive degradation of dead wood and forming mycelial networks between decomposing branches, logs and stumps on the forest floor [16]. As saprotrophs, these fungi obtain nutrients by breaking down dead organic matter, particularly the complex lignin polymers found in wood and plant cell walls [17]. Most WRF belong to the Basidiomycota and, by mineralizing organic matter, contribute to biogeochemical cycles [18].
The ligninolytic lifestyle of WRF has equipped them with powerful extracellular oxidative enzymes, including lignin peroxidase, manganese peroxidase, and laccase, which can degrade lignin and other complex aromatic polymers [19]. The same enzymatic systems, based on radical oxidation, demonstrate exceptional capability in degrading persistent organic pollutants, including polycyclic aromatic hydrocarbons (PAHs) and petroleum hydrocarbons [20]. Within the WRF group, genera such as Trametes, Pleurotus, Bjerkandera, and Phanerochaete are widely studied for their bioremediation potential [21]. WRF are particularly suitable for remediation of long-term contaminated soils, such as those found in the Ecuadorian Amazon, due to their unique growth characteristics. The hyphal growth patterns allow these fungi to penetrate dense, low-permeability soils and access hydrophobic contaminants that are often unavailable to other microorganisms [22]. This ability to grow through challenging soil matrices, combined with their powerful enzymatic arsenal, makes WRF ideal candidates for addressing aged contamination in difficult to treat environments.
No single remediation strategy provides a universally optimal solution. In recent years, research has focused on integrating multiple remediation approaches, obtaining promising results [10]. Beyond well-documented combinations of physical and biological methods, the application of microbial consortia has gained significant attention in the scientific literature [23]. While research has predominantly examined bacteria-fungi consortia [24], fewer studies have specifically investigated the potential of fungal consortia for bioremediation applications.
The present study assesses the capacity of eight native Ecuadorian fungal strains to degrade petroleum hydrocarbons and PAHs in aged, heavily polluted soil: Porogramme epimiltina QCAM7782, Trametes menziesii QCAM7783 and QCAM7790, Bjerkandera sp. QCAM7784, Phlebiopsis sp. QCAM7787, Ganoderma cf. parvulum QCAM7791, Trametes villosa QCAM7793 and Lentinus crinitus QCAM7796. Additionally, this study evaluates the effectiveness of a dual fungal species consortium, comprising two fungi with distinct ecological roles, to determine whether synergistic interactions can enhance remediation efficiency. Specifically, G. cf. parvulum QCAM7791 (functioning both as a wood-decay agent on living trees and as a saprotroph) and T. menziesii QCAM7783 (specialized saprotroph) were tested both individually and in consortium. All strains used in this study were isolated from Yasuní National Park, located in the Ecuadorian Amazon. This region exhibits ecological conditions comparable to those found at most oil contamination sites in Ecuador, making it an ideal source for bioremediation-relevant microorganisms.
2. Materials and Methods
2.1. Study Site Description
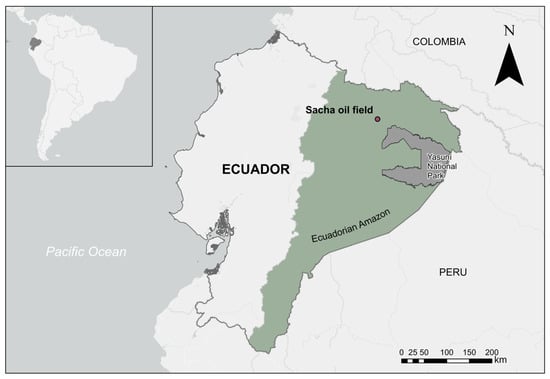
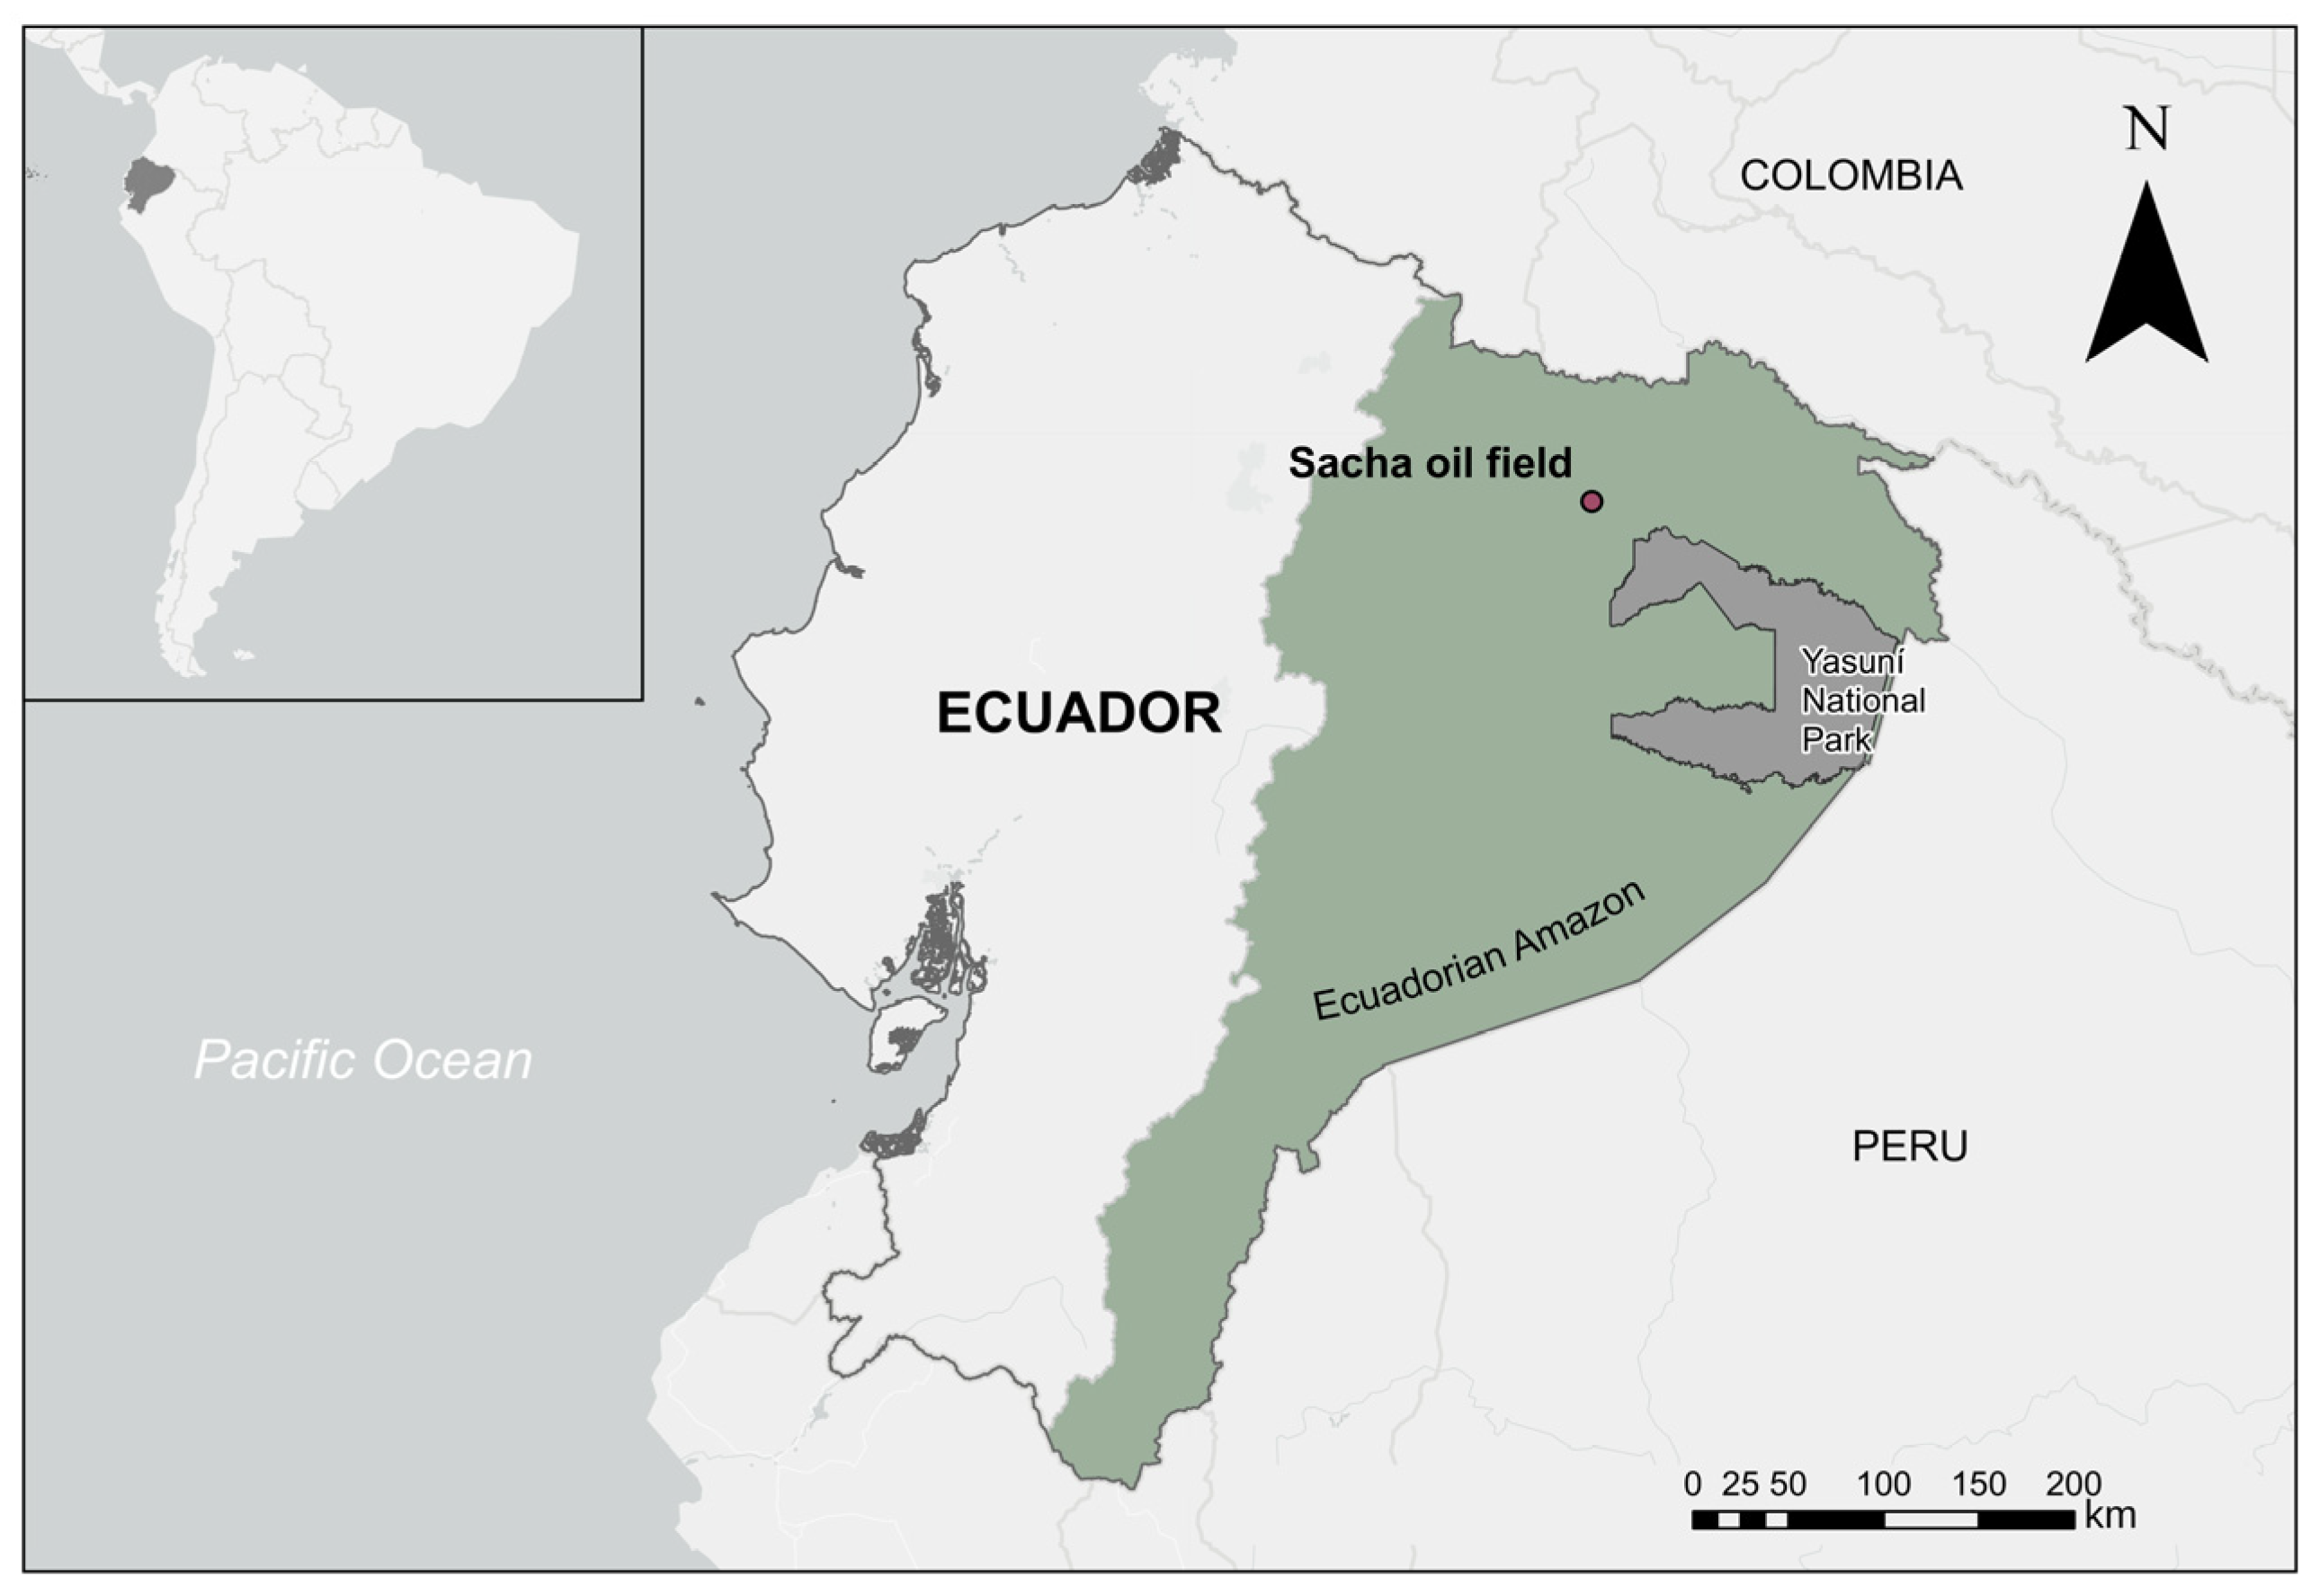
The soil sample was collected from a containment berm with an estimated contamination age of 30 to 40 years located within the Sacha Oil Field, in the Orellana Province of the Ecuadorian Amazon (Figure 1). The Sacha Oil Field is among the most heavily impacted areas in the region, concentrating one of the highest densities of oil spill events recorded in the northeastern Ecuadorian Amazon, with numerous contamination points remaining unremediated [6]. The soil presented a uniformly dark black coloration, homogeneous texture, visible hydrocarbon residues, strong petroleum odor, and signs of compaction.
Figure 1.
Location of the Sacha oil field in the Ecuadorian Amazon (intermediate shading). The study area is situated in Orellana province, near Yasuní National Park (darkest shading). Map created by the authors in ArcGIS Pro 3.7 (Esri, Redlands, CA, USA); boundaries: INEC, MAATE, basemap: Esri, OpenStreetMap contributors.
2.2. Chemicals
Malt extract agar (2% MEA, Difco, BD, Franklin Lakes, NJ, USA; cat. N° 211220) was used as solid culture medium, and malt extract broth (Difco cat. N° 211320) was used for liquid culture. Ergosterol (Sigma-Aldrich, St. Louis, MO, USA; cat. N° E6510), PAHs standard (AccuStandard, New Haven, CT, USA; cat. N° ASM-098-5x) and TPH standards (Absolute Standards, Hamden, CT, USA; cat. N° 91942 and 51006) were used for analytical calibration. Surrogate and internal standards were o-terphenyl (Sigma-Aldrich cat. N° T2800) and 4-terphenyl-d14 (Accustandard cat. N°CLP-BNS-3-2X). All the chemicals used for extraction were of analytical grade (Merck KGaA, Darmstadt, Germany): hexane, acetone, cyclohexane, sodium chloride and KOH.
2.3. Fungal Strains
The fungal strains used in this study were collected from Yasuní National Park in August 2022 and deposited at the Pontifical Catholic University of Ecuador (PUCE) Fungarium (Table 1). For the mycoremediation assay, a mycelium suspension was prepared following Haroune et al. (2014) [25]. Five 8 mm plugs of each strain, previously grown for 14 days on 2% MEA Petri dishes, were inoculated into 500 mL Erlenmeyer flasks containing 250 mL of 2% malt extract broth. After 7 days at 28 °C and 135 rpm, the culture was filtered through a sterile 100 µm cell strainer (352360, Corning Inc., Corning, NY, USA). Then, the biomass was rinsed and blended in sterile saline solution (0.89%) and stored at 4 °C as “clumps suspension”. Two mL of this suspension were transferred into fresh flasks with 250 mL of 2% malt extract broth. After 7 days of growth under the same conditions, the biomass was again filtered, rinsed with sterile saline solution (0.89%), blended and stored at 4 °C as “mycelium suspension”. This second liquid culture yielded a homogeneous, agar-free suspension of young, actively growing mycelium, ensuring an inoculum of comparable age and physiological state among strains. Pre-cultures on solid biodegradable substrate were performed in 100 mL glass bottles with blue GL45 caps (Boeco, Hamburg, Germany), using 30 g of sterile rabbit feed (Cuy/Conejos Engorde LB Bioalimentar Ecuador) as a substrate, moistened with 30 mL of sterile water and 10 mL of mycelium suspension of the tested individual strain (T1–T8 and PC). For the dual species consortium (T9), the substrate was inoculated with 5 mL of mycelium suspension of each strain. These solid-state cultures on solid biodegradable substrate were incubated under static conditions at room temperature for seven days.
Table 1.
List of strains used for the mycoremediation treatments. NA: not applicable. Soil d60 (C60) and Negative Control (NC) correspond to soil without organic substrate or inoculum, and soil with non-colonized solid biodegradable substrate, respectively.
2.4. Mycoremediation Assay
Nine treatments were evaluated (Table 1), including the eight Basidiomycota strains listed in Table 1, used individually, plus a dual-strain consortium of G. cf. parvulum QCAM7791 and T. menziesii QCAM7783 to test for potential synergistic effects.
For inoculation, 90 g of contaminated soil (4% water content) were mixed with the whole content of one pre-culture bottle (30 g of rabbit feed colonized by the tested strain) in a 500 mL transparent circular plastic container (125 × 55 mm, diameter × height, Plásticos Ecuador) covered with a vented lid (25 cm2 covered with sterile, gas-permeable gauze). Cultures were incubated at 28 °C in a laboratory incubator under static conditions in the dark. Each treatment was run in three to six independent microcosms (biological replicates), each inoculated from its own pre-culture bottle; the exact number of replicates per treatment is given in Table S1. Moisture was not adjusted during incubation. Controls included soil without substrate or inoculum (C60), soil with non-colonized solid biodegradable substrate (negative control NC) and soil inoculated with Trametes versicolor QCAM7778 (positive control PC). The system evaluated therefore combines fungal inoculation with an organic amendment (substrate-borne bioaugmentation). NC controls the effect of the amendment itself, but not for the transformation of the substrate by the fungus during the 7-day pre-culture. After two months, cultures were homogenized and sampled for analysis. For the determination of TPH and pyrene removal efficiencies, the final concentrations measured in the homogenized soil-substrate mixture of substrate-amended treatments were recalculated and normalized to the initial dry mass of substrate-free contaminated soil following Cipriani-Avila et al. (2025) [26]. This normalization corrects for the dilution introduced by the added substrate and ensures that removal efficiency can be directly compared with the initial TPH levels and with the controls without added substrate (C60). The final concentration per kg of initial dry soil was calculated as Cf,soil = Cf,mix × (msoil + msub)/msoil, where Cf,mix is the concentration measured in the soil-substrate mixture at day 60 (mg kg−1 dry mixture), msoil the initial dry mass of soil and msub the mass of substrate added (30 g of rabbit feed, as-fed weight), giving a correction factor of 1.3485 for all substrate-amended microcosms (NC, PC, T1–T9) and 1 for C60. Removal (%) was then calculated as (C0 − Cf,soil)/C0 × 100. This calculation assumes that (i) all C8–C40 hydrocarbons originate from the soil; (ii) soil and substrate were homogeneously mixed; and (iii) the dry mass of the mixture at day 60 equals its initial dry mass. The substrate was not analyzed separately for TPH, but any hydrocarbon-range compounds it contributed would raise the final concentration and therefore lead to an underestimation, not an overestimation, of removal; the similar removal in NC and C60 suggests that such a contribution was small. Likewise, the moisture content of the feed was not determined, and part of the substrate was mineralized during incubation; both make the true dilution smaller than assumed, so the reported removals are conservative (slightly lower than the actual ones).
2.5. Analytical Methods
2.5.1. Soil Characterization
The soil was characterized before and after the 60-day treatment for the following parameters: granulometry (ASTM C136/C136M-19) [27], pH (EPA 9045D) [28], conductivity (SM 2510) [29]; moisture content (ASTM D2216-98) [30]; organic matter (ASTM F1647-11) [31]; nitrogen (EN 13342/DIN ISO 11261) [32]; ergosterol, total petroleum hydrocarbons (EPA 8015D and 1664B) [33,34]; and polycyclic aromatic hydrocarbons PAHs (EPA 8270E) [35].
2.5.2. Total Petroleum Hydrocarbons TPH
TPH concentration was analyzed by two methods: GC-FID following EPA 8015D (TPH C8–C40) and the gravimetric method following EPA 1664B (TPH gravimetric). A homogenized wet soil sample of 10.0 ± 0.2 g was extracted with 10 mL acetone on a horizontal shaker for 20 min, followed by the addition of 10 mL hexane containing o-terphenyl (100 mg/L) as surrogate standard and further agitation for 30 min. Moreover, 20 mL of deionized water were added to promote phase separation, driving the non-polar TPH fraction quantitatively into the hexane layer. o-terphenyl was used to monitor overall extraction efficiency, its recovery accounts for any matrix-related or phase-distribution losses across the entire procedure [36], with an acceptance criterion of 70–130% in line with the specifications of method EPA 8015D. The organic layer was passed through a silica gel cartridge (Bond Elut Si 14256018, Agilent Technologies, Santa Clara, CA, USA) to remove interfering polar substances. The purified extract was collected into 2 mL amber glass vials for chromatographic analysis. Method blanks and diesel-fortified soils were processed as quality controls. Limits of quantification, method blank results, surrogate recoveries and recoveries from diesel-fortified soil are reported in Table S2. Quantification was performed by external calibration in hexane using a GC-FID Agilent Technologies 7890A GC system equipped with a fused silica DB-TPH column (Agilent 123.1632. 30 m × 320 µm × 0.25 µm). The inlet was operated at 280 °C in pulsed splitless mode with an injection volume of 2 µL. The column temperature program began at 40 °C and was held for 2 min, then increased at 40 °C min−1 to 150 °C, followed by a second ramp at 30 °C min−1 to 250 °C, and a third ramp at 15 °C min−1 to 310 °C, where it was maintained for 20 min.
For the gravimetric method, 1 mL of the purified hexane extract was transferred into a pre-weighed round-bottom flask. The flasks were dried in an oven at 60 °C and weighed again to determine TPH concentration by difference. Residues were weighed on an analytical balance with a resolution of 0.1 mg, and the residue masses obtained were well above its resolution. The gravimetric result corresponds to silica-gel-treated n-hexane extractable material (SGT-HEM) and includes, besides petroleum hydrocarbons outside the C8–C40 range, polar petroleum constituents not retained by silica gel and co-extracted non-petroleum organic matter; it is referred to as TPH gravimetric hereafter for brevity. As a fixed volume of 10 mL hexane was added to each sample under controlled conditions, the 1 mL aliquot was considered representative of 1/10 of the total extract, assuming negligible solvent losses during extraction given hexane’s low water miscibility and low volatility at ambient temperature. The validity of this assumption was confirmed by diesel-spiked soil controls processed in parallel.
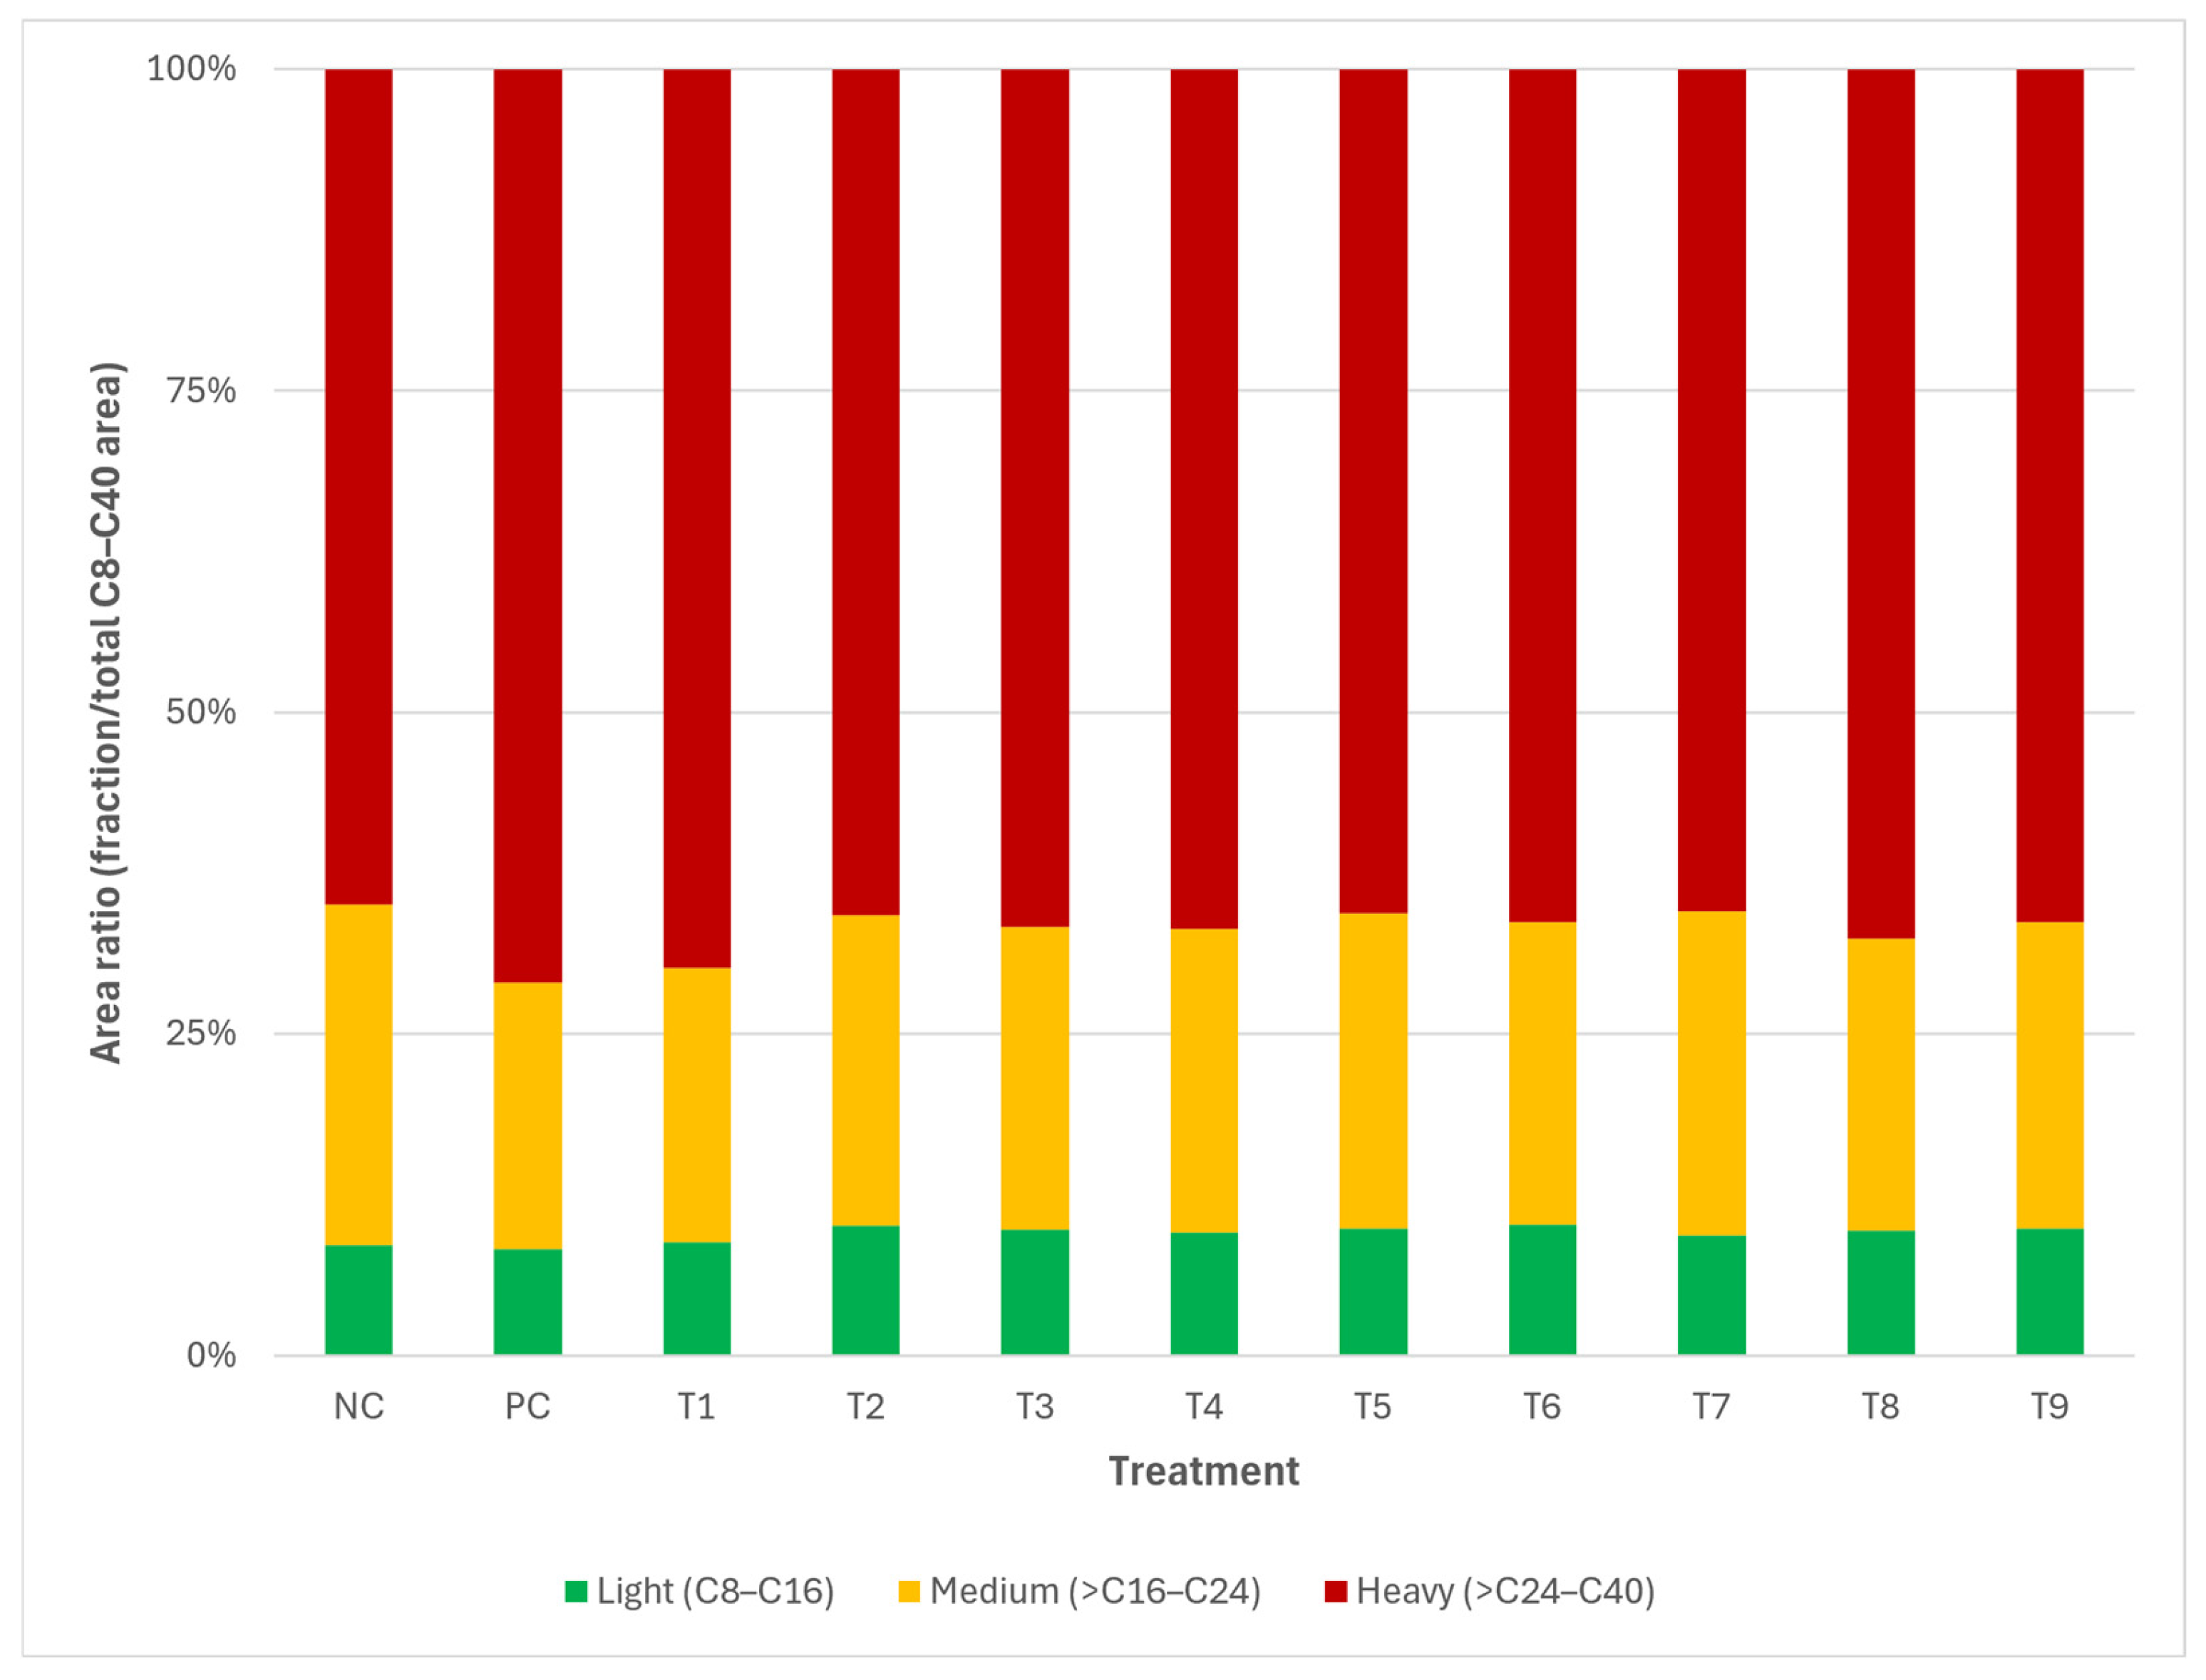
To assess whether hydrocarbon removal extended across the whole chain-length range, each GC-FID chromatogram (C8–C40 range) was divided into three n-alkane-defined windows: light (C8–C16), medium (>C16–C24) and heavy (>C24–C40), delimited by the retention times of the corresponding n-alkanes in the calibration standard. The C16 boundary corresponds to the limit between the F2 (>C10–C16) and F3 (>C16–C34) fractions of the Canada-Wide Standard for petroleum hydrocarbons in soil [37], separating the lighter, more volatile hydrocarbons from heavier ones; the C24 boundary divides the remaining range so that the medium window captures the rising part of the unresolved complex mixture, which peaked near C24 (Figure S1); and C40 is the upper limit of the calibration standard. The o-terphenyl surrogate elutes within the medium window, so its peak area was subtracted. For each window, we calculated the ratio of its area to the total C8–C40 area of the same chromatogram, and its reduction relative to the non-inoculated control (NC), as (Area fraction NC − Area fraction FT)/(Area fraction NC × 100), where Area fraction NC and Area fraction FT are the mean areas of the corresponding fraction in NC and in the fungal treatment (FT), respectively (Figure S2). As NC and the fungal treatments were supplied with the same amount of substrate, the dilution factors were the same and their raw areas were compared directly. These reduction percentages are not directly comparable in magnitude with the moisture- and dilution- normalized removal efficiencies of Section 2.4.
2.5.3. Polycyclic Aromatic Hydrocarbons (PAHs)
PAHs were analyzed by GC-MS following EPA 8270E. The PAHs measured were naphthalene, acenaphthylene, acenaphthene, fluorene, phenanthrene, anthracene, fluoranthene, methyl-naphthalene, pyrene, benzo(a)anthracene, chrysene, benzo(b)fluoranthene, benzo(a)pyrene, indeno(1,2,3-cd)pyrene, dibenzo(ah)anthracene and benzo(g,h,i)perylene. 10.0 ± 0.2 g of wet soil were weighed into 40 mL Teflon-capped vials. Ten mL of acetone were added, and the slurry was shaken for 30 min on a horizontal shaker, followed by the addition of 10 mL of hexane and shaken for an additional 30 min. The samples were centrifuged, then 20 mL of deionized water was added to separate the phases. One mL of the organic phase was transferred into a 2 mL amber glass vial for chromatographic analysis. The chromatographic analysis was performed using a DB-5MS column Agilent 122-5532E (30 m × 0.25 mm × 0.25 µm film thickness) under constant flow conditions 1.1 mLmin−1, operated in pulsed splitless mode with inlet and transfer line temperatures of 300 °C and 280 °C, respectively. The oven program began at 75 °C (0.5 min hold), ramped at 25 °C min−1 to 310 °C, then at 8 °C min−1 to 330 °C (2 min hold). Detection was performed using a mass selective detector (MSD) in selected ion monitoring (SIM) mode with a 3-min solvent delay.
2.5.4. Ergosterol Determination
Ergosterol extraction was conducted following Borràs et al. (2010) [38]. For each sample, 0.5–0.8 g moist soil was mixed with 1 mL cyclohexane and 3 mL KOH/methanol (10% w/v) in 15 mL centrifuge tubes (Falcon, Corning) with screw-top caps, sonicated for 15 min, and incubated sealed at 70 °C for 90 min. After incubation, 1 mL of distilled water and 2 mL of cyclohexane were added, vortexed for 30 s, and centrifuged. The organic phase was collected, while the aqueous layer was washed twice with 2 mL of cyclohexane, and the organic fractions were pooled in a PYREX borosilicate glass screw-cap culture tube (10 mL, Corning 99449). Combined extracts were dried using a SpeedVac (SPD140DDA, Thermo Fisher Scientific, Waltham, MA, USA), reconstituted in 0.5 mL methanol, incubated sealed at 40 °C for 15 min, vortexed for 30 s, and centrifuged at 6000 rpm for 3 min. The supernatant was filtered through a 0.22 µm PVDF membrane into amber glass vials for HPLC analysis (Waters 1525, HPLC system, Waters Corporation, Milford, MA, USA; UV detection at 282 nm, XBridge C18 column 4.6 × 150 mm, 5 µm, methanol mobile phase; 1.4 mL min−1). Ergosterol recovery was assessed in soil spiked at 0.01–0.05 g kg−1 before extraction (Table S2).
2.6. Carbon Mass Balance Calculation
The carbon balance in the treatments was established through the quantification of soil organic carbon, TPH (GC-FID and gravimetric) and ergosterol, according to the protocol of Cipriani-Avila et al. (2025) [26]. The carbon content of petroleum hydrocarbons was estimated to be 85% of the total TPH fractions, based on the typical elemental composition of crude oil hydrocarbons [39]. The ergosterol concentrations measured in each treatment, together with the soil organic carbon and TPH (GC-FID and gravimetric) values used to derive each carbon pool, are provided in Table S3 (Supplementary Materials).
Six carbon pools were distinguished: (i) hydrocarbons as C TPH C8–C40, (ii) non-C8–C40 TPH gravimetric as C, (iii) non-TPH organic C, calculated as total organic carbon minus TPH gravimetric and fungal biomass, (iv) added biodegradable substrate as C, only at Soil d0, (v) total fungal biomass as C (indigenous and inoculated fungi), estimated from ergosterol as biomass C = ergosterol × 0.46/0.005 (both in g kg−1) [26,40], (vi) unaccounted C, obtained by difference between initial and final carbon. The unaccounted pool is expected to consist mainly of mineralized C (CO2), but it also includes volatilization, physical losses and the accumulated analytical error of the other pools; CO2 was not measured directly. Organic carbon was estimated by loss on ignition, which can overestimate organic matter in clay-bearing soils, and converted with a factor of 1.724 that assumes 58% C in organic matter [41], whereas petroleum hydrocarbons contain about 85% C. The carbon balance is therefore semi-quantitative. Carbon pool values in the fungal treatments and the negative control include contributions from both the contaminated soil and the residues of the added biodegradable substrate; in Soil d0 and Soil d60, where no substrate was added, values reflect soil carbon only. Absolute values across treatments and controls are therefore not directly comparable. Within each treatment, carbon redistribution was evaluated by comparing d0 and d60 time points; between treatments, comparisons were made using the proportion of each carbon pool relative to the corresponding total initial carbon content, or in absolute terms among substrate-amended treatments, which share equivalent initial carbon inputs.
2.7. Statistical Analysis
Statistical analyses were performed using R (v4.4.1) with the RStudio (version 2026.11.0) interface. Normality was tested on the residuals of the one-way model (Shapiro–Wilk test) and homogeneity of variances with the Brown–Forsythe version of Levene’s test (for TPH C8–C40 removal: W = 0.987, p = 0.72; F = 1.36, p = 0.22). When assumptions for parametric analysis were met, significant differences among treatments were evaluated by unbalanced one-way ANOVA followed by Tukey’s HSD post hoc test (α = 0.05). The 95% confidence intervals of all pairwise differences in TPH C8–C40 removal are given in Table S4, and the minimum difference detectable by the Tukey test is reported to indicate statistical power. The correlation between TPH C8–C40 and TPH gravimetric quantification methods was assessed using Pearson’s correlation coefficient (r). The relative abundance of each fraction was compared among treatments by one-way ANOVA followed by Tukey’s HSD. Fraction-level differences from NC (Figure S2) were tested on replicate-level chromatographic areas, using Dunnett’s test (each fungal treatment vs. NC; R package multcomp (version 1.4-32)) and a linear mixed-effects model with inoculation (fungal vs. NC) as fixed effect and treatment as random effect (R packages lme4 (v2.1-0) and lmerTest (v3.2-1), Satterthwaite degrees of freedom). All results are reported as mean ± standard error of the mean (SE), with n = 3–6 replicates per treatment (Table S1).
3. Results
Based on its granulometric properties, the soil was classified as a clayey sand. The initial characteristics of the soil prior to treatment were as follows: pH 7.0, conductivity 361 µS cm−1 (both measured in aqueous suspension); and on a dry weight basis: 6.8% organic carbon, 0.01% nitrogen, TPHs (C8–C40) 8.5 g kg−1, TPHs gravimetric 32.3 g kg−1, pyrene 1.2 mg kg−1; all other PAHs measured were below the detection limit of the analytical method.
TPH removal was assessed by two complementary methods, GC-FID (EPA 8015D), which quantifies the C8–C40 fraction (TPH C8–C40), and the gravimetric method (EPA 1664B), which captures total extractable material, including hydrocarbons outside the C8–C40 range (TPH gravimetric). TPH C8–C40 represented only 26% (8.5 ± 0.4 g kg−1) of the initial TPH gravimetric value (32.3 g kg−1). The remainder (24 ± 2 g kg−1, 74%) was not resolved by GC-FID and is expected to include heavier and polar petroleum constituents as well as co-extracted organic matter.
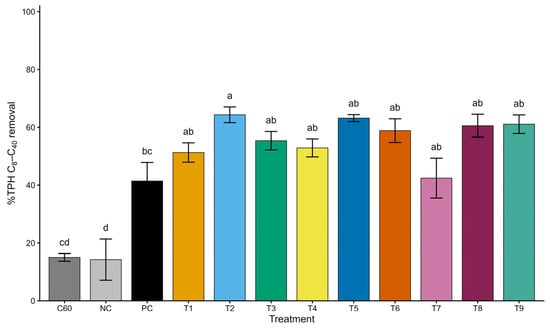
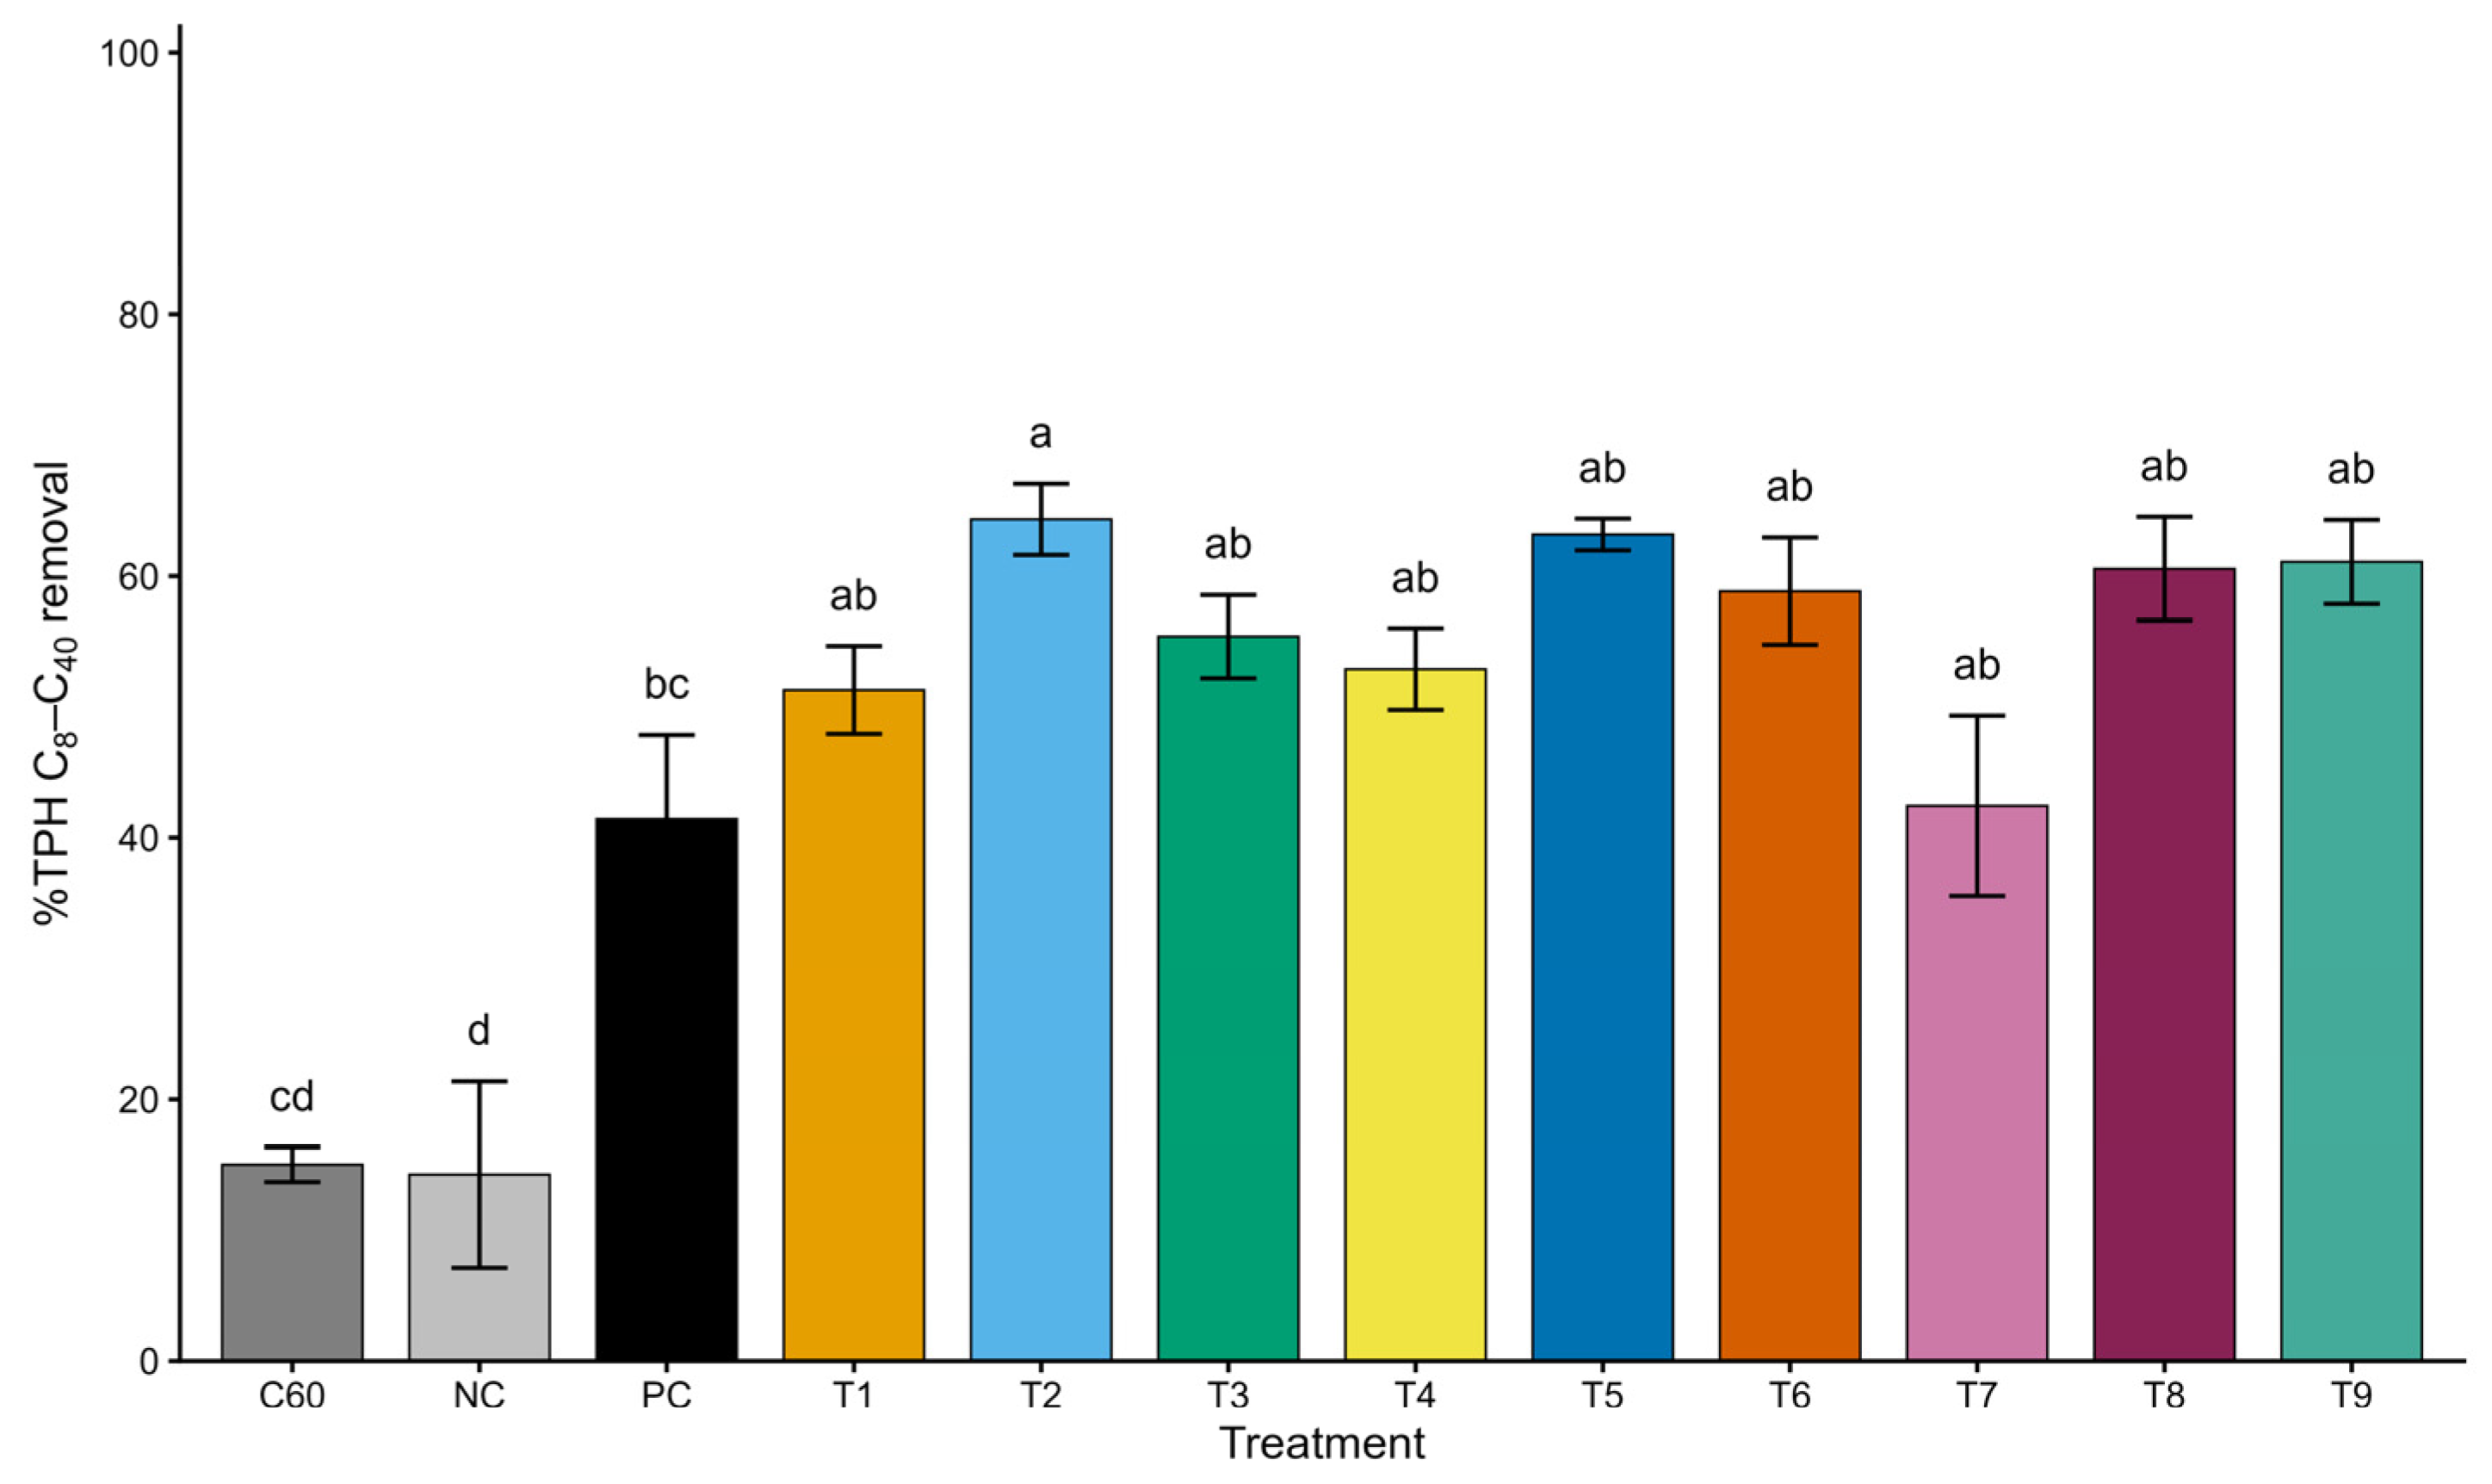
As summarized in Figure 2, all fungal treatments (T1–T9) removed significantly more TPH C8–C40 (Tukey HSD, p < 0.05) than both the non-supplemented C60 (15 ± 1%) and the non-inoculated substrate control NC (14 ± 7%). The positive control PC (41 ± 6%) removed significantly more than NC (p = 0.004) but did not differ significantly from C60 (p = 0.054); among the fungal treatments, only T2 removed significantly more than PC (p = 0.049). Significant differences in TPH C8–C40 removal were observed among treatments (unbalanced one-way ANOVA, F(11,54) = 11.88, p < 0.001). Treatment T2 (T. menziesii QCAM7783) achieved the highest mean removal (64 ± 3%), followed by T5 (63 ± 1%) (T. menziesii QCAM7790), the consortium T9 (61 ± 3%) G. cf. parvulum QCAM7791 and T. menziesii QCAM7783, T8 (L. crinitus QCAM7796, 61 ± 4%) and T6 (G. cf. parvulum, 59 ± 4%), also ranked among the top five treatments. By contrast, T7 (T. villosa) showed the lowest removal among the fungal treatments (42 ± 7%), comparable to the positive control. Differences among fungal treatments were not statistically significant. With the present replication, differences smaller than about 22 percentage points could not be detected (minimum detectable difference in the Tukey test for n = 6), so differences in this size, such as T2 vs. T7 (22 points; 95% CI −1 to 45, p = 0.07), cannot be excluded (Figure 2; Table S4).
Figure 2.
TPH C8–C40 removal efficiency of different mycoremediation treatments after 60 days. Removal percentage was calculated as: % Removal = ((Ci − Cf)/Ci) × 100, where Ci is the initial TPH C8–C40 concentration (day 0) and Cf is the final concentration. Bars represent mean ± SE (n = 3–6 replicates per treatment; see Table S1). Different letters indicate significant differences (unbalanced one-way ANOVA followed by Tukey’s HSD, α = 0.05). C60: 60-day control (non-supplemented soil); NC: Negative control (supplementation with autoclaved organic substrate but no fungal inoculum); PC: Positive control (organic substrate supplementation + inoculation with T. versicolor); T1–T9: fungal treatments.
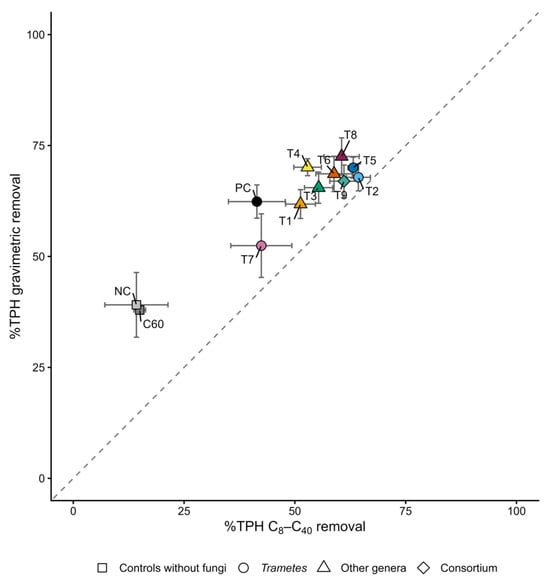
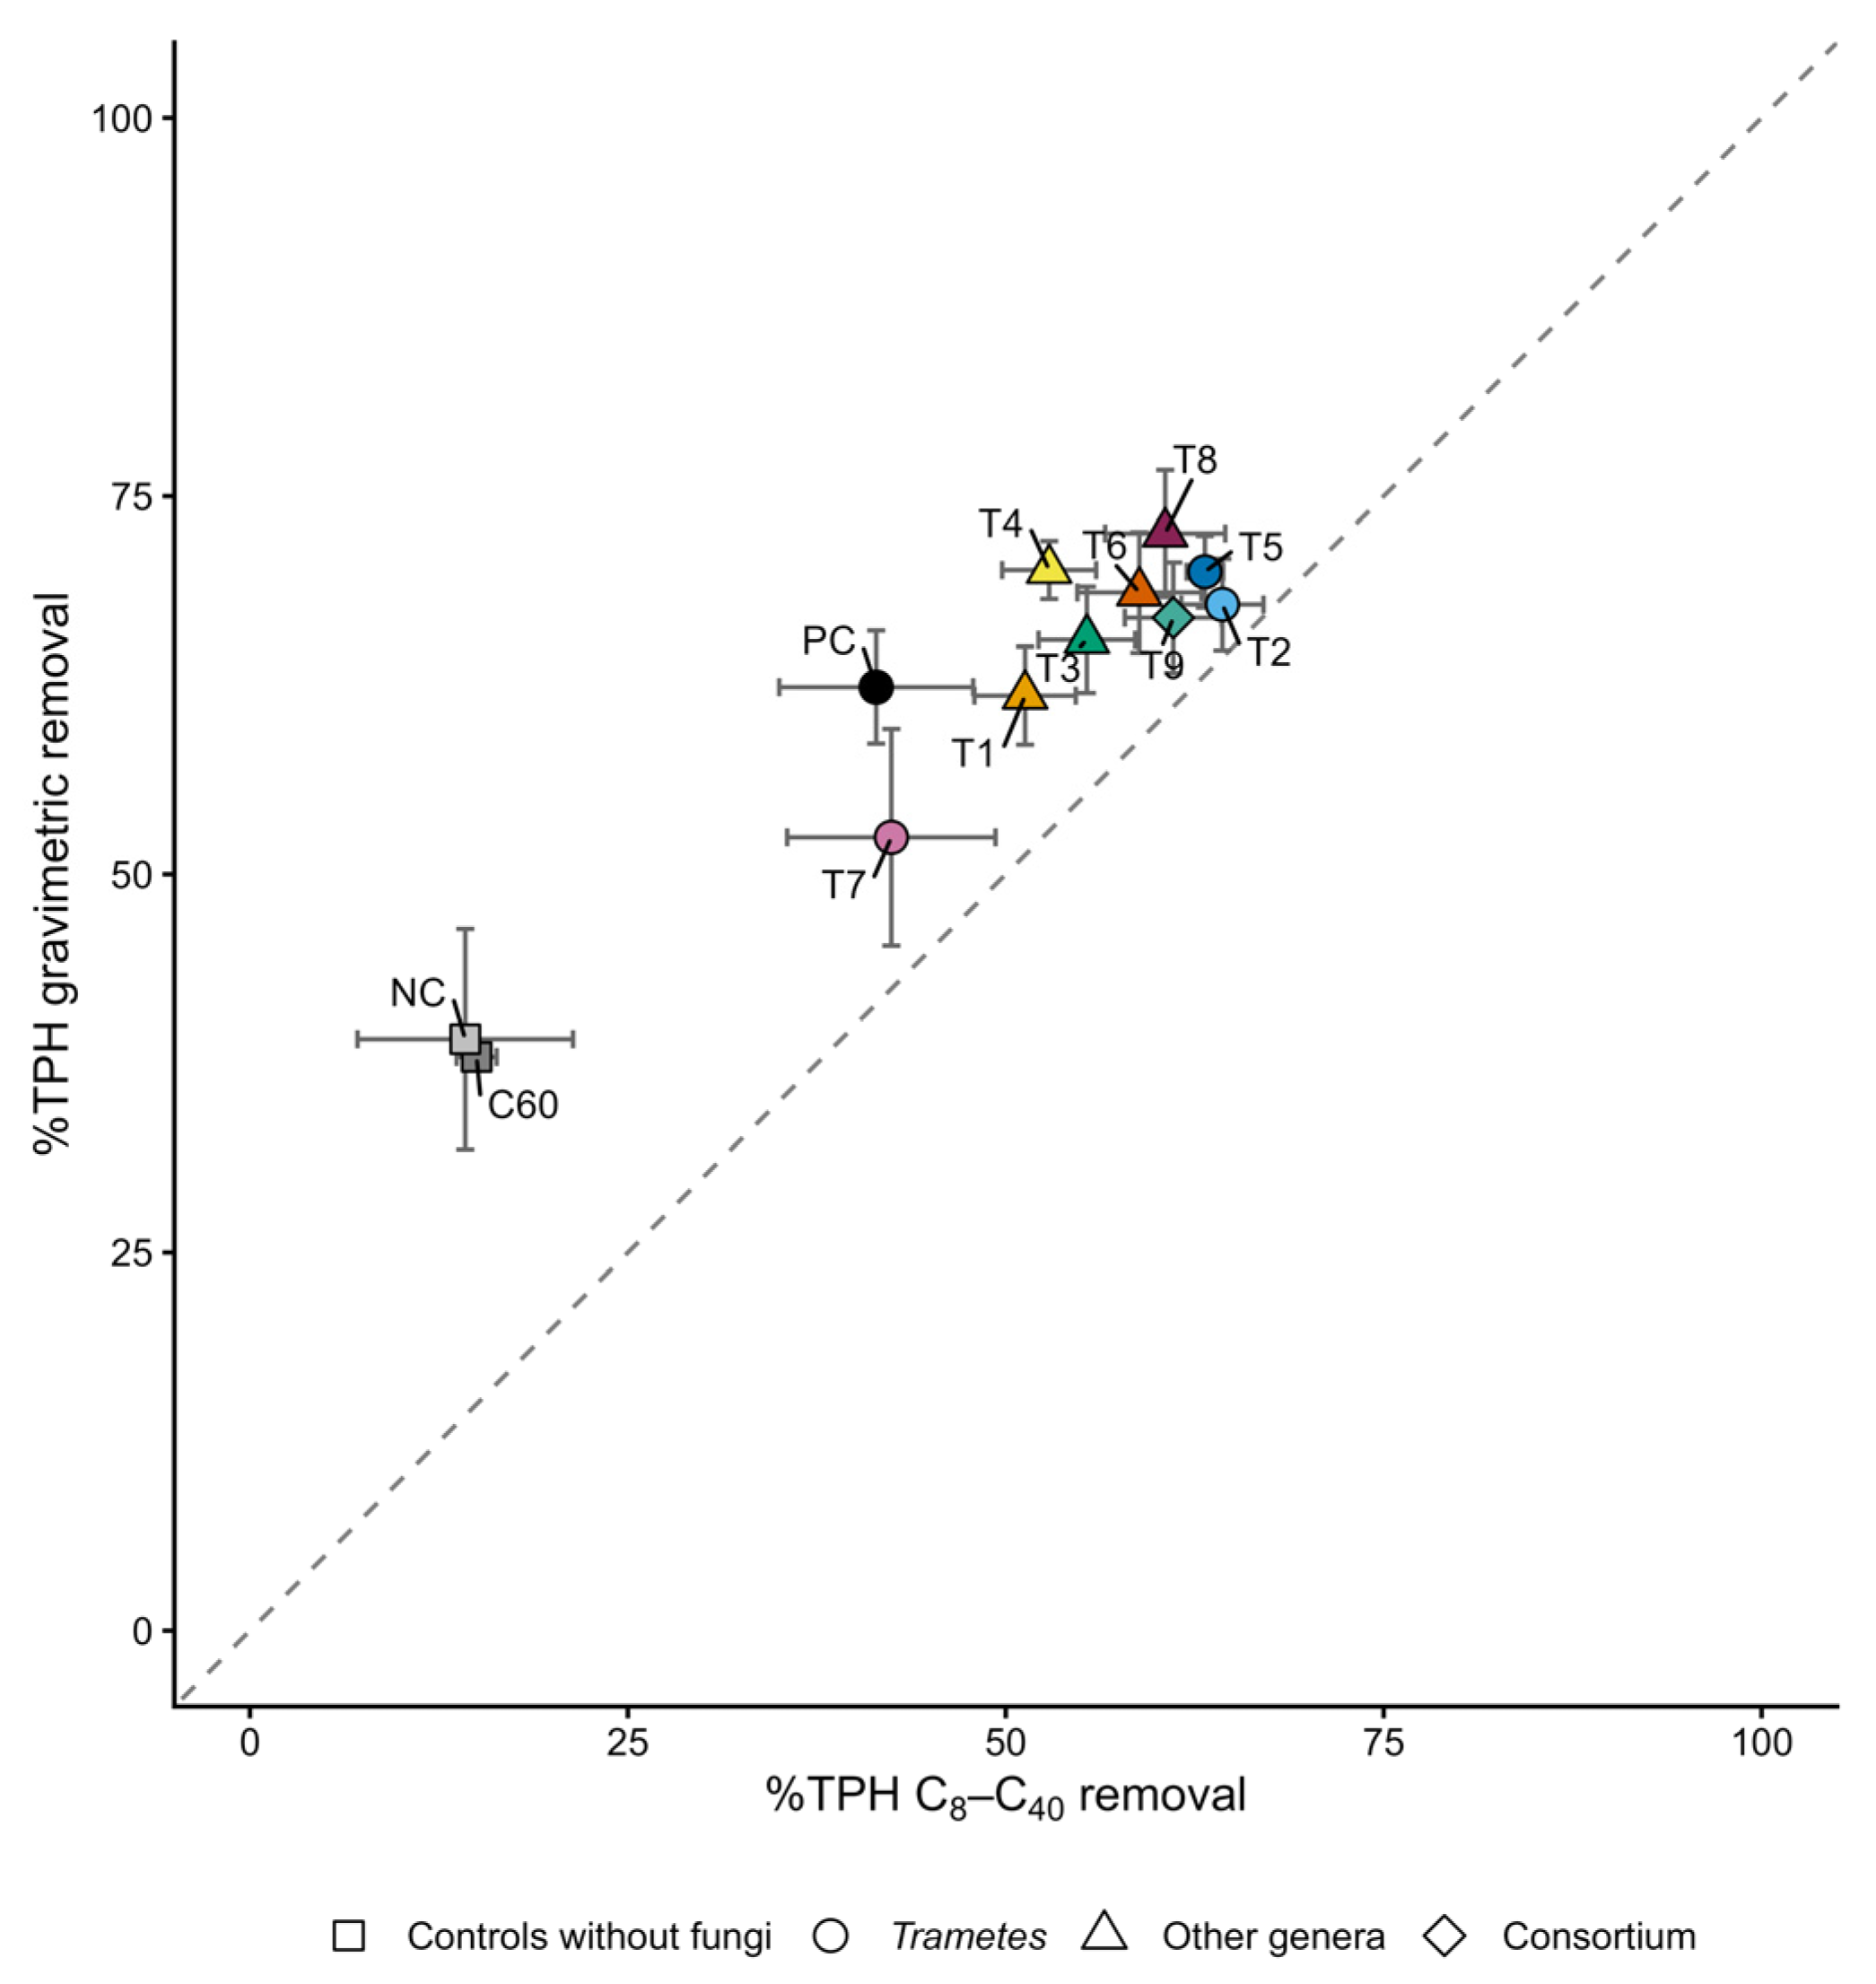
The relationship between TPH removal measured by both methods is shown in Figure 3. All treatments fell above the 1:1 line, indicating that TPH gravimetric consistently exceeded TPH C8–C40 removal efficiency. Treatment ranking was consistent across both quantification methods (Pearson’s r = 0.94, p < 0.001), and the fungal treatments achieved 42–64% TPH C8–C40 removal and 53–73% total TPH gravimetric removal. The difference between methods (vertical distance from the diagonal: removed TPH as measured by gravimetry but not accounted for by GC-FID) was smaller for fungal treatments (mean difference: 10 ± 1% removal) than for no-fungus controls, C60 and NC (23–25% removal).
Figure 3.
Relationship between %TPH C8–C40 removal and %TPH gravimetric removal after 60 days of treatment. Each point represents the mean of replicates (n = 3–6, depending on treatment); error bars indicate standard error of the mean on both axes. The dashed line indicates the 1:1 relationship. All treatment points are above the diagonal, indicating higher removal measured by gravimetry than by TPH C8–C40. C60, NC, PC and T1–T9 as defined in Figure 2.
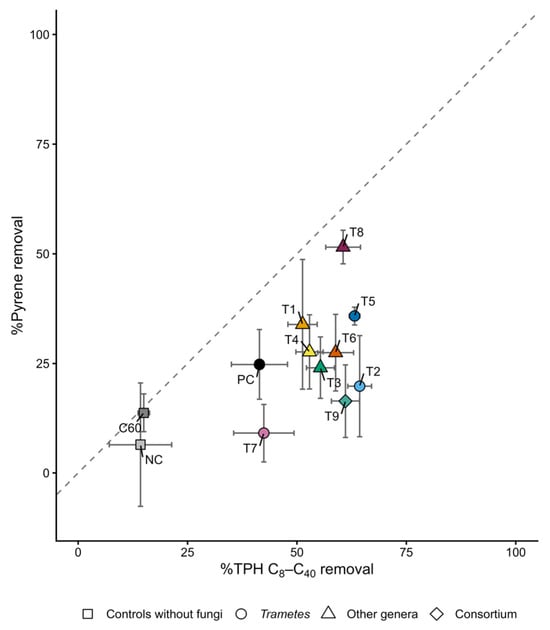
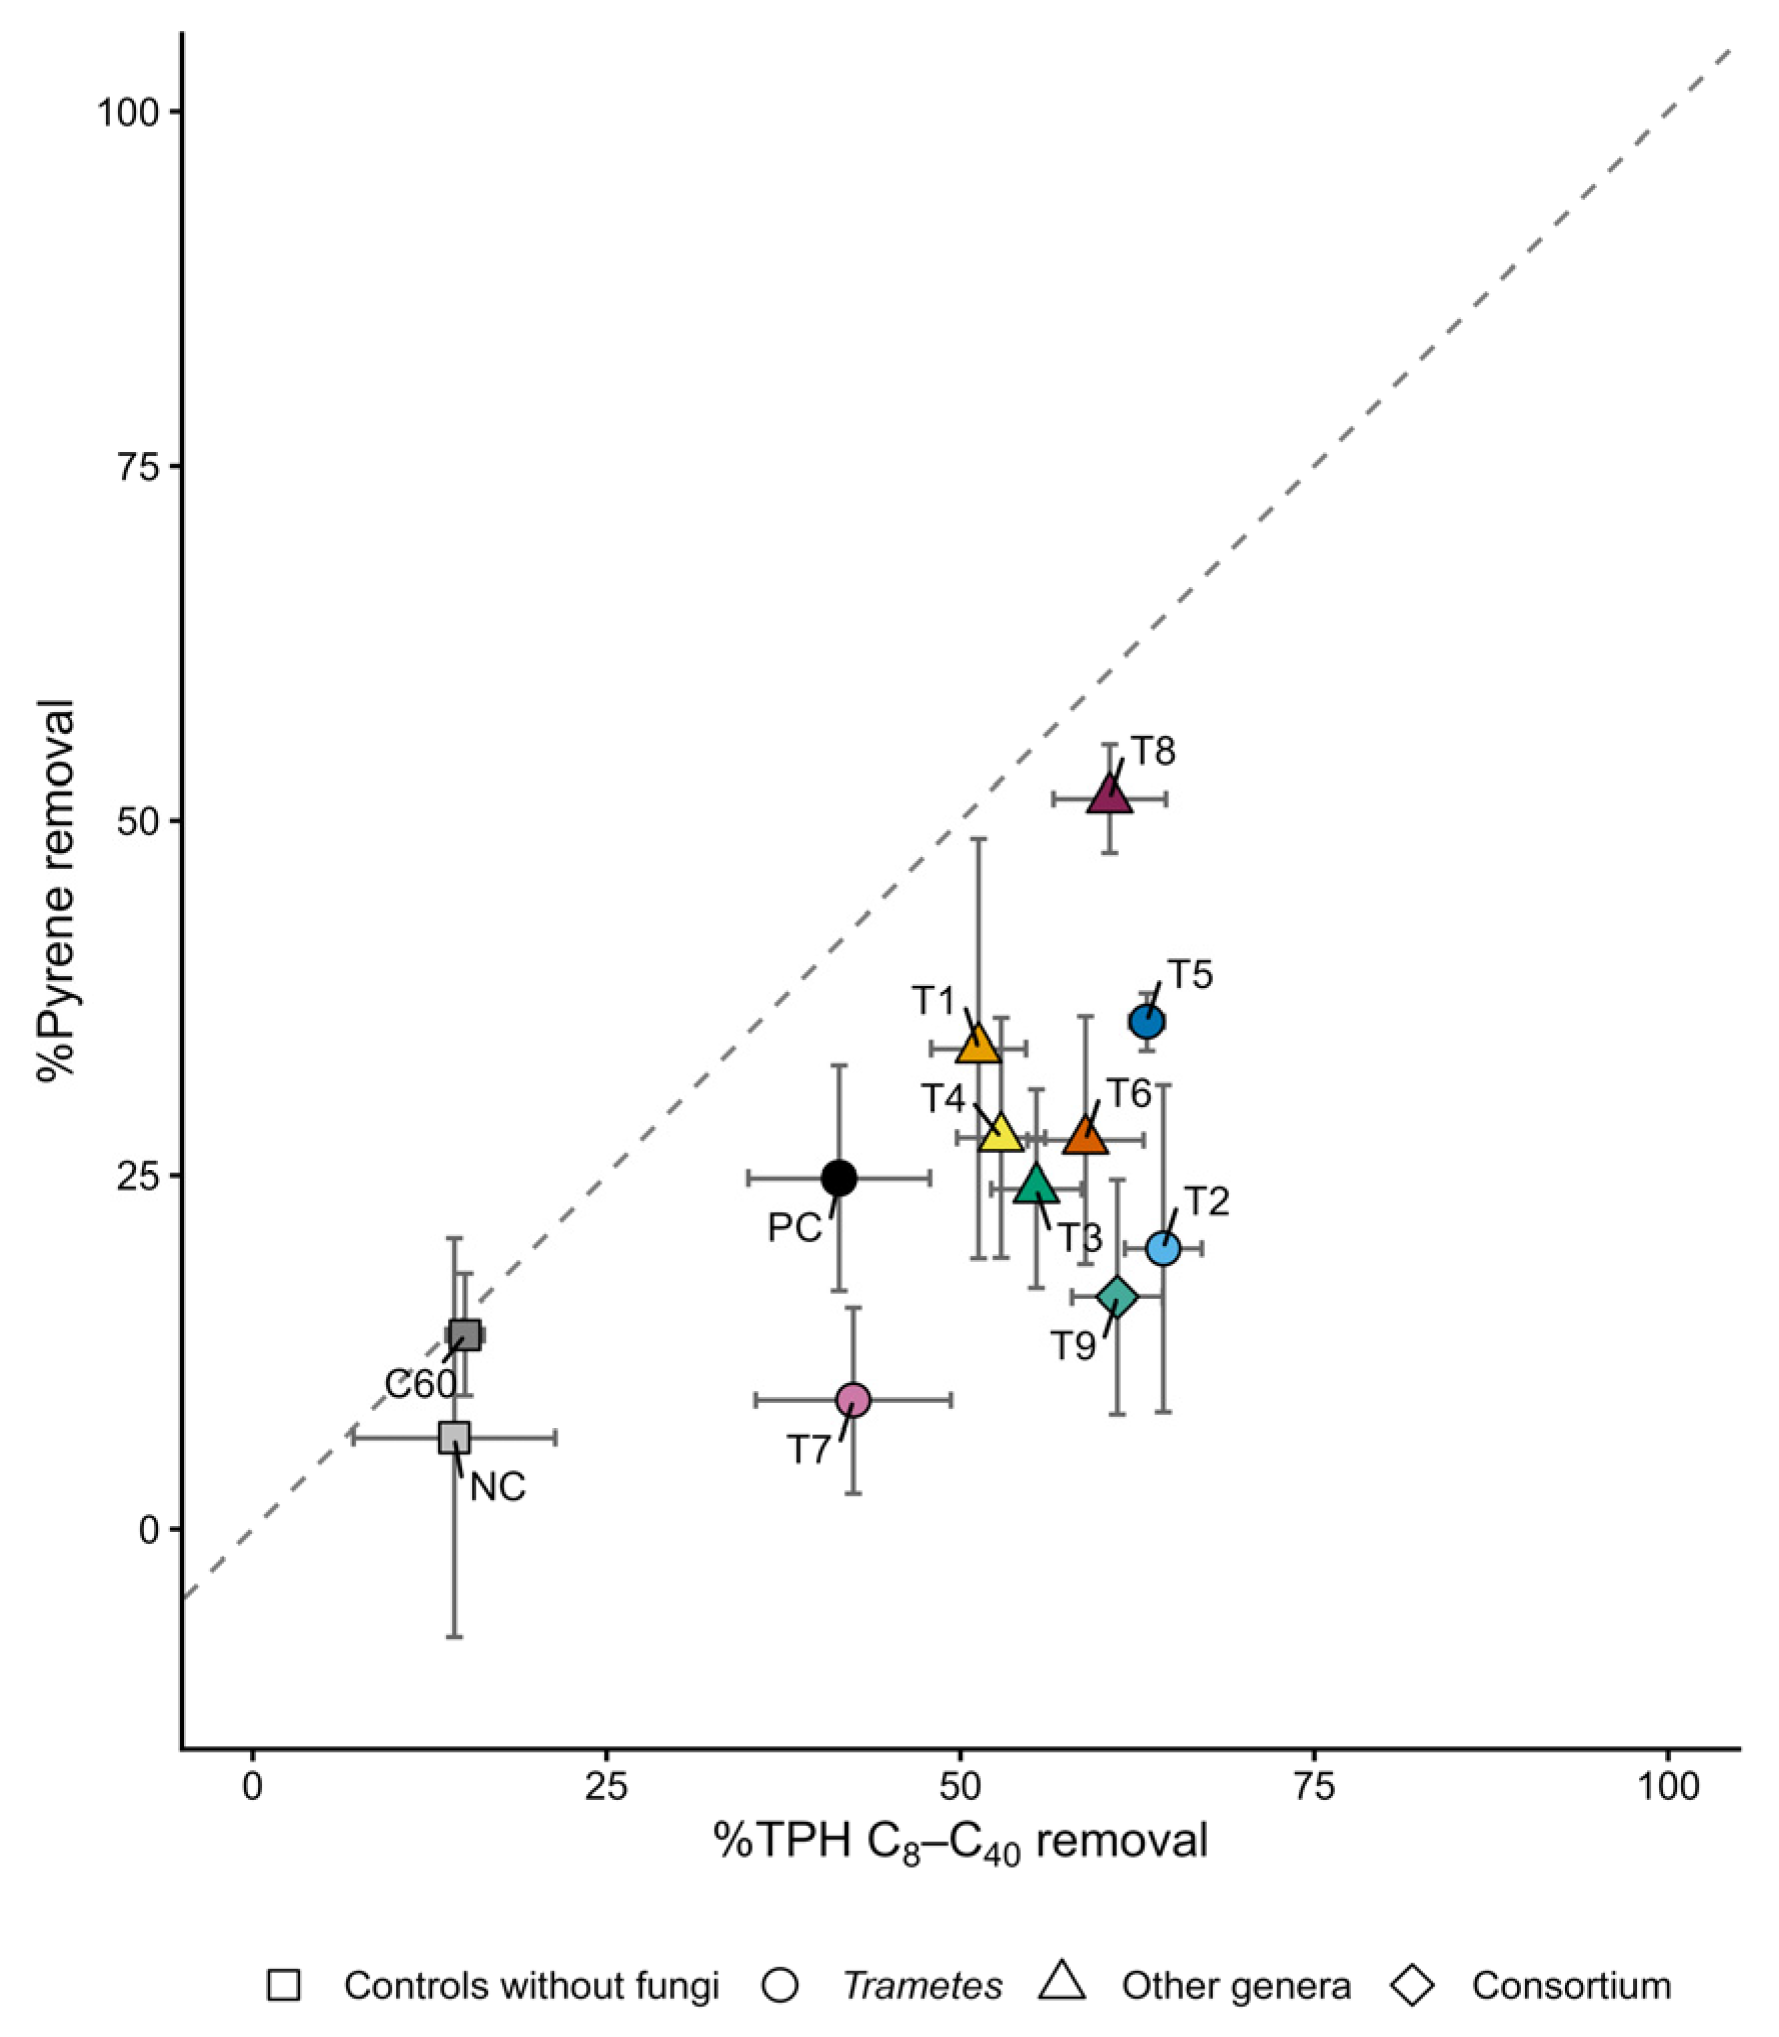
Figure 4 compares TPH C8–C40 and pyrene (the only PAH detected above the limit of quantification). Most treatments fell below the 1:1 line, indicating that the C8–C40 fraction was removed more efficiently than pyrene. Pyrene removal was low and highly variable (9–52%) and differed significantly among treatments (one-way ANOVA, p = 0.017); post-hoc comparisons (Tukey HSD) showed that only T8 (L. crinitus) achieved pyrene removal (52 ± 4%) significantly above the control NC (p = 0.03), whereas all other treatments were statistically indistinguishable from NC.
Figure 4.
Relationship between %TPH C8–C40 removal and %pyrene removal after 60 days of treatment. Each point represents the mean of replicates (n = 3–6, depending on treatment); error bars indicate ± standard error of the mean (SE) on both axes. The dashed line indicates the 1:1 relationship. Most treatment points are below the diagonal, indicating lower pyrene removal relative to the TPH C8–C40 removal. C60, NC, PC and T1–T9 as defined in Figure 2.
Representative GC-FID chromatographic profiles (Supplementary Figure S1) provide qualitative context for the quantitative removal data. The superimposed chromatograms showed that C60 had the highest overall FID signal across the entire C8–C40 range, exhibiting a large, broad unresolved complex mixture (UCM) envelope extending from approximately C10 to beyond C40, characteristic of heavily weathered petroleum contamination. The NC displayed an intermediate signal intensity, whereas the fungal treatments (PC, T1–T9) showed an overall reduction in signal intensity across the hydrocarbon range compared to C60 and NC, consistent with the TPH removal measured in these treatments. In all samples, the UCM peaked close to the C24 boundary and tailed off across the heavy window, while the light window contributed only a small leading edge.
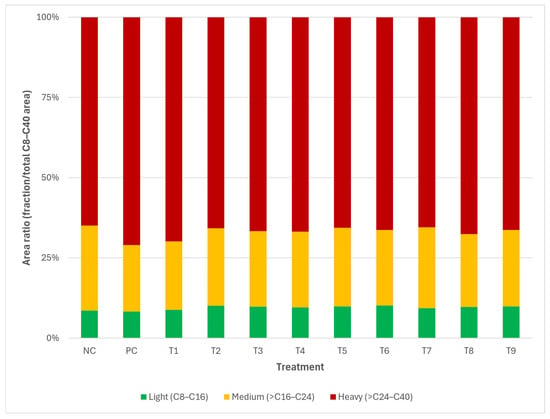
The heavy fraction dominated the profile in every treatment (~65–71% of the total C8–C40 area), followed by the medium (~21–27%) and the light fraction (~8–10%) (Figure 5). The distribution was similar in NC and in the fungal treatments, although the proportion of the medium fraction was slightly lower in most of them (~21–25%, vs. 27% in NC; one-way ANOVA F(10,52) = 10.8, p < 0.001; Tukey HSD vs. NC, p < 0.05 for PC, T1, T3, T4, T6, T8 and T9), most markedly in PC and T1 (~21%).
Soil pH increased from 7.0 (C0) to about 9 in all substrate-amended treatments, including NC, with no significant differences among fungal treatments (Figure S3). Electrical conductivity and nitrogen content showed no meaningful variation among fungal treatments.
Relative to NC, the fungal treatments reduced the light, medium and heavy windows by 16%, 35% and 22% on average, respectively. Across fungal treatments, the reduction was significant for the light and medium windows (linear mixed-effects model on replicate-level areas: p = 0.028 and p = 0.002) but not for the heavy window (p = 0.065; Figure S2). Per treatment (Dunnett’s test vs. NC; Table S5), the light and medium windows were significantly reduced in all fungal treatments except T7 (p ≤ 0.027), and the heavy window in T2, T3, T5, T6, T8 and T9 (p ≤ 0.034), but not in PC, T1, T4 (p = 0.051) or T7.
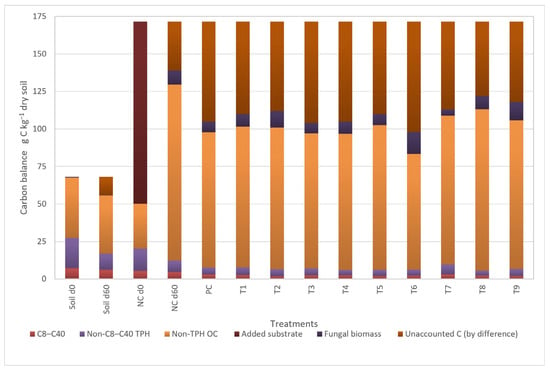
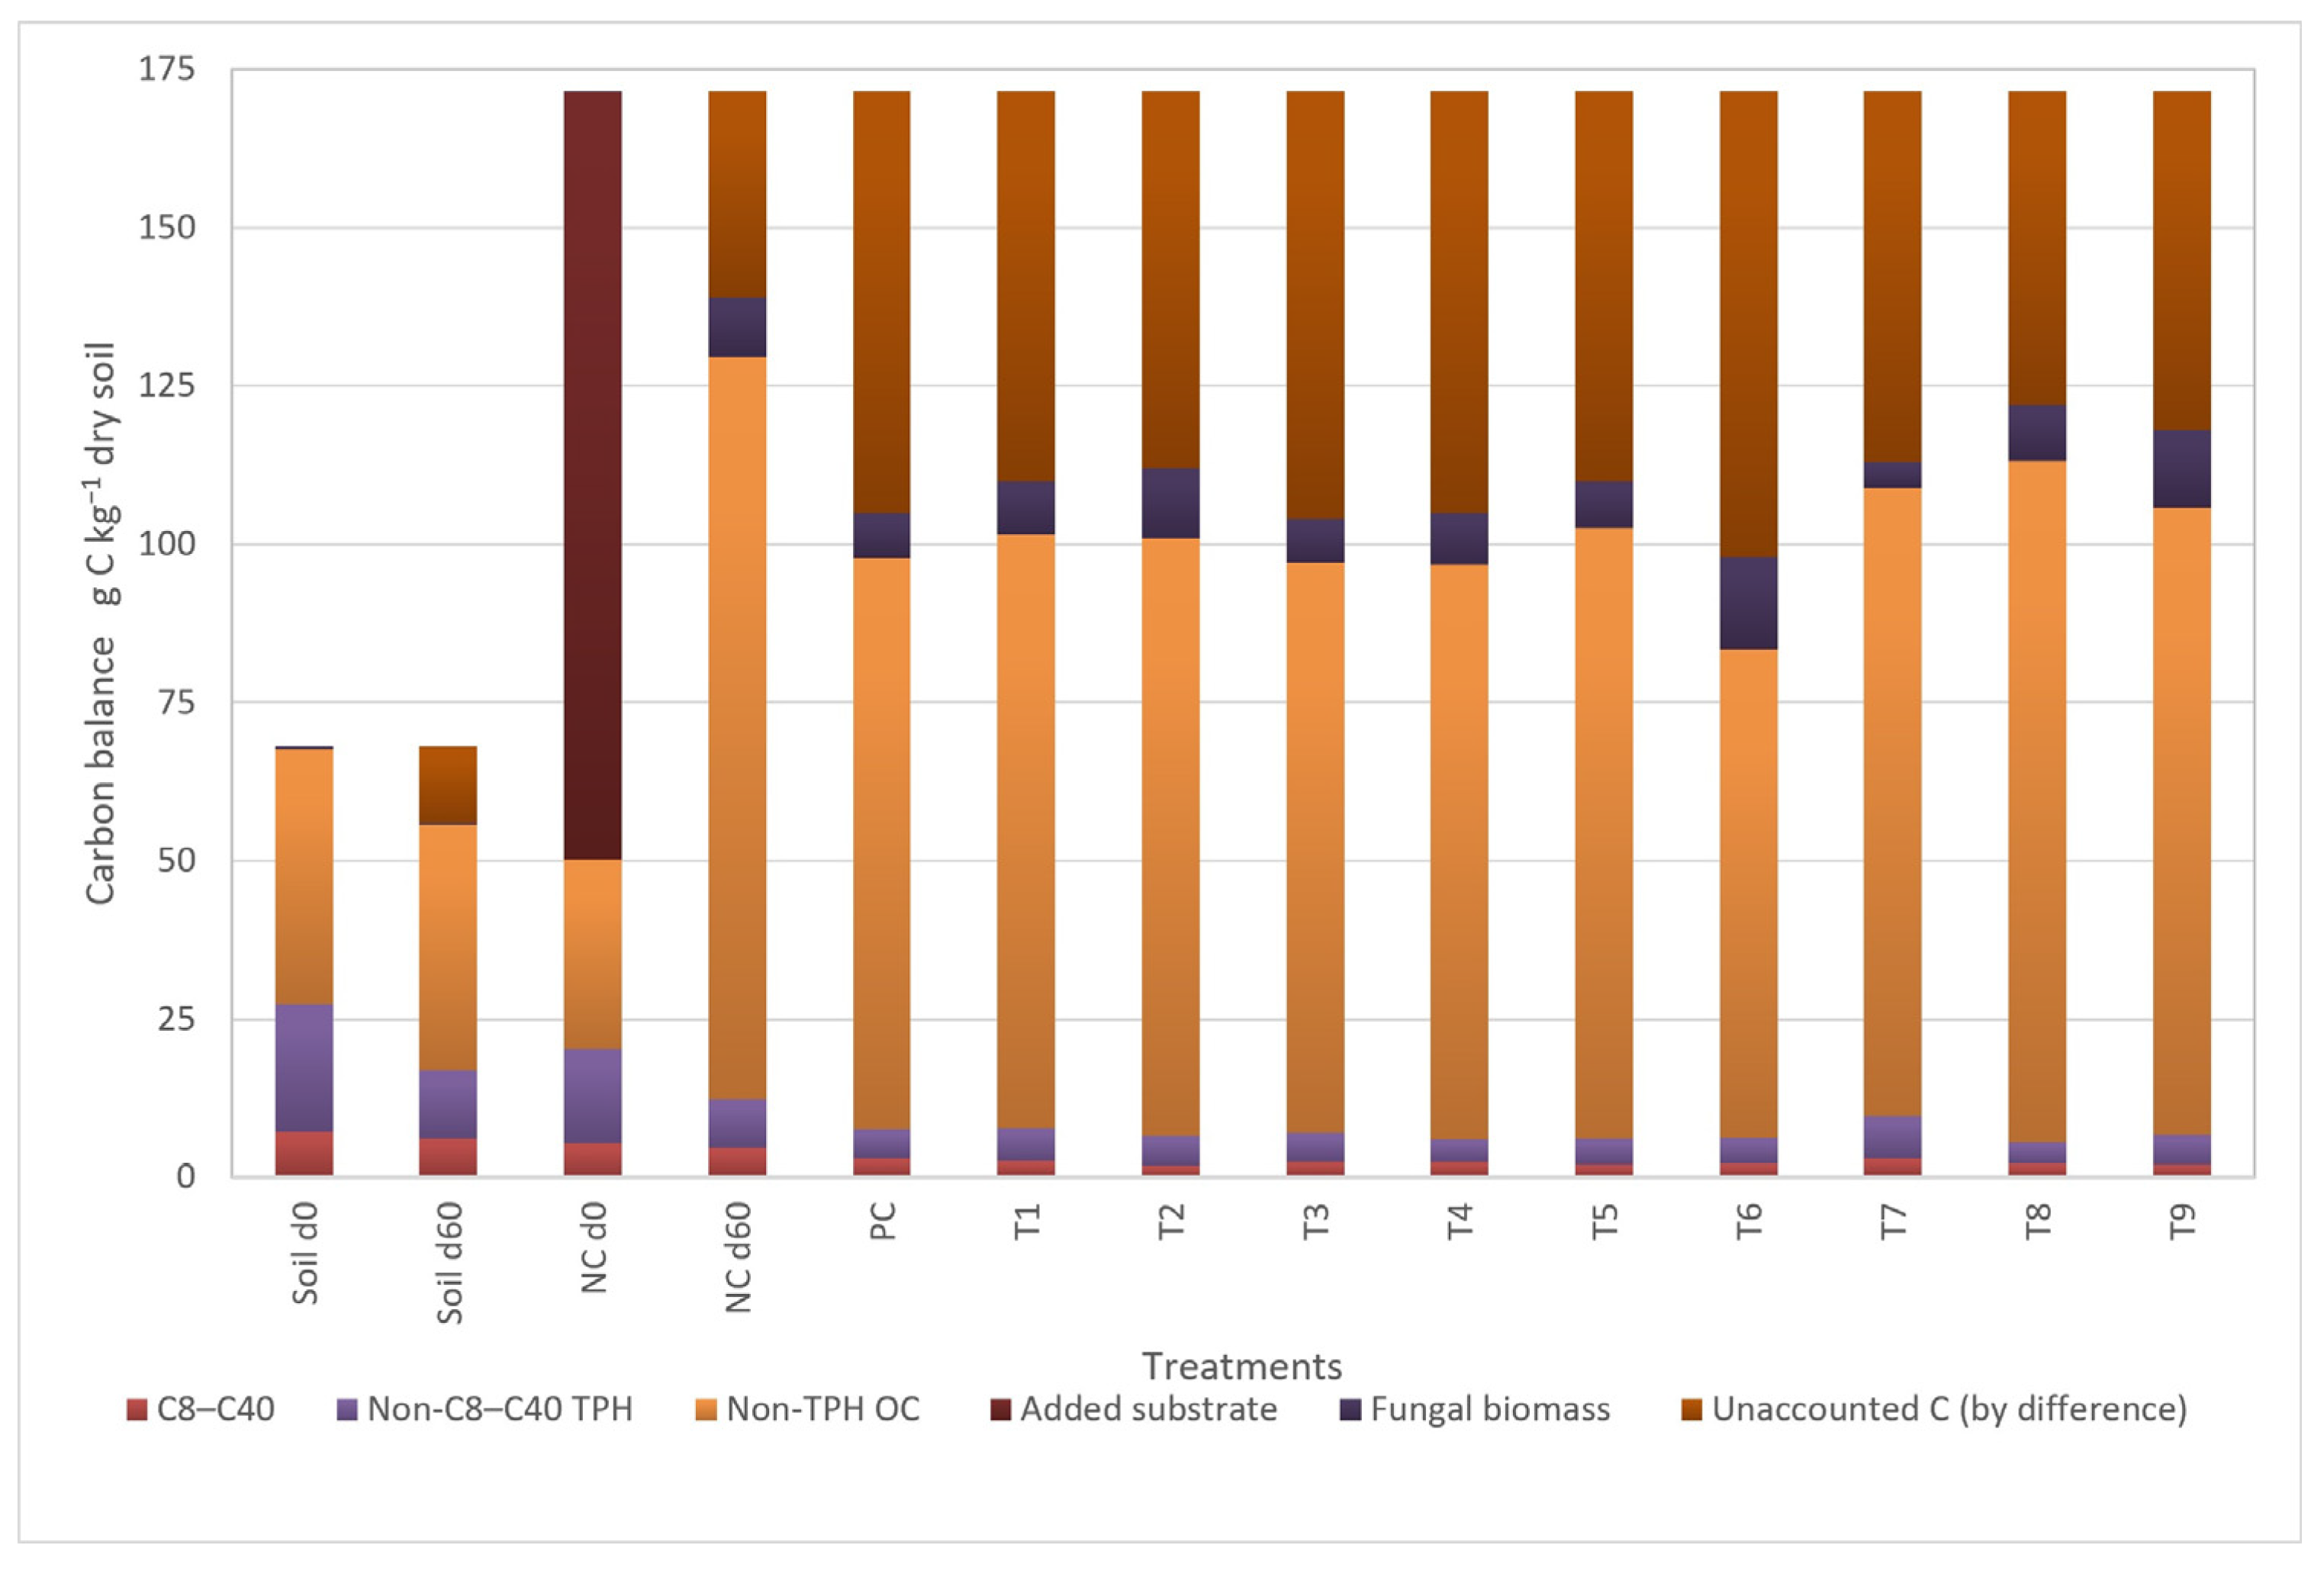
To assess carbon flux in the bioremediation process, Figure 6 shows the estimated carbon mass balance across controls and treatments (T1–T9). Overall, at the end of the 60-day treatment, carbon was distributed predominantly in the residual non-TPH organic carbon pool and unaccounted carbon (obtained by difference), which is expected to consist mainly of mineralized C (CO2) but also includes volatilization, physical losses and analytical errors. In all fungal treatments, residual TPH carbon (C8–C40 TPH + non C8–C40 TPH) was low. Expressed as proportions of the total carbon recovered at day 60, the pools differed little among the fungal treatments: residual TPH carbon accounted for only a minor share (about 3–6% of total C) and total fungal biomass (estimated from ergosterol) for a comparably small pool (about 2–9%), whereas most of the carbon was split between the non-TPH organic carbon (about 45–60%) and the fraction that disappeared from the measured pools (about 28–43%), the latter being unaccounted carbon.
Figure 6.
Carbon mass balance showing the distribution of carbon pools (g C kg−1 soil dry matter) at the beginning (d0) and end (d60) of the incubation period. Values for Soil d0 and Soil d60 are expressed per kg of dry soil; values for NC, PC and fungal treatments (T1–T9) are expressed per kg of dry matter (soil + residual substrate). For NC at d0, native soil organic matter (SOM) and added substrate are distinguishable and shown as separate layers; at d60 in all treatments they are merged into a single non-TPH organic C pool. Unaccounted C was obtained by difference between initial and final carbon and includes mineralized C (CO2) as well as other losses and analytical errors. Fungal biomass C was estimated from ergosterol and represents total fungal biomass, including indigenous fungi. NC, PC and T1–T9 as defined in Figure 2.
4. Discussion
The results confirm that native WRF bioaugmentation substantially enhanced petroleum hydrocarbon removal, clearly outperforming both natural attenuation and substrate-mediated biostimulation. The 15% removal in C60 (Figure 2) reflects natural attenuation under the condition tested, where residual volatilization and indigenous microbial activity may contribute. This limited removal is consistent with the highly weathered nature of the contamination. This value should not be interpreted as a constant depletion rate: natural attenuation dynamics are non-linear, and after 30–40 years the more volatile and bioavailable fractions are expected to represent a diminishing proportion of the residual contamination [8,42]. The remaining contamination is therefore composed predominantly of recalcitrant heavy hydrocarbons for which further spontaneous loss is minimal [39]. The removal in NC (14% of TPH C8–C40, Figure 2, Figure 3 and Figure 4), statistically indistinguishable from that of C60, indicates that the easily biodegradable organic substrate alone did not enhance hydrocarbon removal by the indigenous microbiota beyond natural attenuation. Accordingly, the significant difference in hydrocarbon removal between NC and the fungal treatments (42–64%, Figure 2, Figure 3 and Figure 4) indicates that the enhanced removal is associated with fungal inoculation rather than with substrate-driven biostimulation alone. The ergosterol data support this: NC reached a final ergosterol concentration comparable to that of the inoculated treatments (0.104 g kg−1 vs. 0.045–0.163 g kg−1; Table S3), indicating that substantial fungal biomass developed without inoculation. However, NC removed no more TPH than C60. Enhanced removal was therefore not explained by total fungal biomass but was associated with inoculation with the selected strains. Because ergosterol is an aggregate proxy that does not distinguish inoculated from indigenous fungi, colonization by the inoculated strains could not be confirmed in this study.
Among the different fungal species used alone or in pairs, T. menziesii QCAM7783 (T2) showed the highest mean TPH C8–C40 removal (64 ± 3%), followed closely by T. menziesii QCAM7790 (T5, 63 ± 1%), and by the dual-strain consortium (T9, 61 ± 3%) (Figure 2, Figure 3 and Figure 4). L. crinitus QCAM7796 (T8) achieved the highest gravimetric (73%) and pyrene removal among all strains, suggesting a preferential action on the heavier and aromatic fractions. To the best of our knowledge, this is the first report of L. crinitus being applied to the degradation of petroleum hydrocarbons in contaminated soil. Although other species of Lentinus, such as L. subnudus and L. squarrosulus, have been previously evaluated for TPH removal [43,44] L. crinitus has only been documented in the context of dye decolorization [45] and tolerance to the herbicide 2,4 D [46]. The mechanisms underlying its degradation capacity were not directly assessed in this study. However, its ability to produce laccases and other oxidative enzymes [45] could partially explain its performance.
The dual-strain consortium T9 (G. cf. parvulum + T. menziesii) achieved removal rates statistically comparable to those of its individual constituents T6 and T2, as well as to most other fungal treatments (Figure 2). This result indicates that, under the conditions tested, combining two fungal species did not yield a significant improvement in TPH removal over the use of a single strain. Because the relative abundance of each species at day 60 was not determined, these results do not show whether both species coexisted or one displaced the other, as interspecific competition has been reported to reduce performance in fungal co-cultures [47,48]. Strain-specific quantification, such as qPCR, is needed to resolve consortium dynamics. Previous characterization of these strains reported high laccase activity in G. cf. parvulum and a broader ligninolytic enzyme repertoire in Trametes species [26], which could support a degree of metabolic complementarity; however, such complementarity did not translate into higher removal rates within the 60-day time frame of this study.
The dual quantification approach revealed that the TPH C8–C40 GC-FID detectable fraction accounted for only 26% of the total TPH contamination (8.5 ± 0.4 g kg−1 dry soil), while the remaining 74% (23.8 ± 1.8 g kg−1 dry soil) corresponded to material not resolved by GC-FID, which is expected to include heavier and polar petroleum constituents characteristic of weathered contamination, as well as co-extracted soil organic matter [12]. Both methods were well correlated across the full set of samples (Figure 3; Pearson r = 0.94, p < 0.001). This overall correlation is partly driven by the clear separation between the low removals in the controls (C60, NC), and the fungal treatments; considering only the fungal treatments, the positive correlation was moderate (r = 0.78). In all cases, the TPH removal measured by the gravimetric method consistently exceeded the C8–C40 removal measured by the GC-FID method (all points above the diagonal in Figure 3). Both the GC-FID method and the TPH gravimetric method include a silica gel cleanup step to reduce polar interferences from biogenic organic compounds; however, this cleanup does not completely eliminate all non-hydrocarbon interferences [49], meaning that a portion of the gravimetric fraction could include soil organic matter not fully removed during cleanup. Therefore, the difference between the two methods should be interpreted with caution, as it likely reflects not only heavy hydrocarbon fractions but may also include a contribution from residual interfering organic substances extracted from the soil by the acetone-hexane extraction step. The 38% decrease in TPH gravimetric in C60, an unamended soil weathered for decades, also suggests that this fraction includes material more labile than heavy hydrocarbons; conclusions are therefore based primarily on TPH C8–C40. The difference between the gravimetric and GC-FID methods was smaller in the fungal treatments (10 ± 1%) than in the non-fungus controls (23–25%) (Figure 3, vertical distance between the experimental point and the diagonal). This suggests that the fungi also reduced part of the extractable fraction outside C8–C40. The broader removal observed in the fungal treatments is in line with the non-specific radical-mediated oxidation mechanism of ligninolytic enzymes [20,50].
At the fraction level, the light (C8–C16), medium (>C16–C24) and heavy (>C24–C40) fractions were reduced relative to NC across the fungal treatments, significantly for the light and medium fractions (mixed-effects model) and, for the heavy fraction, in six of the ten fungal treatments (Dunnett’s test); T7 showed no significant reduction in any window. Because these reductions are expressed relative to NC, abiotic losses common to all microcosms should be largely accounted for, and the additional removal is associated with inoculation. The heavy fraction, as the major component of the profile, accounted for the largest absolute loss of area, and the relative distribution of the fractions changed only slightly. This pattern was observed in most fungal treatments. Several native strains reached reductions like those of PC; given the wide, overlapping confidence intervals, neither an advantage nor equivalence can be concluded.
Among the 16 US EPA priority PAHs analyzed, only pyrene was detected in the studied soils. This is consistent with the expected PAH profile of a petrogenic source subjected to ~30–40 years of natural attenuation under tropical conditions. Low molecular weight PAHs (2–3 rings) are preferentially lost through volatilization, dissolution, and biodegradation, processes that are accelerated by elevated temperatures, high rainfall, and intense microbial activity [51,52]. Conversely, high molecular weight PAHs (5–6 rings) are typically scarce in petrogenic sources such as Ecuadorian Oriente crude, which is classified as naphthenic-aromatic (KUOP ≈ 10.5) with a PAH profile dominated by 2–4 ring compounds [53]. Pyrene thus represents a recalcitrant residual marker of the original contamination. Pyrene removal across fungal treatments was lower than TPH removal (9–52% vs. 42–64%) (Figure 4 vs. Figure 3). This pattern is in line with the well-documented greater recalcitrance of four-ring PAHs compared to aliphatic hydrocarbons. This low degradability is attributable to their thermodynamic stability and strong sorption to soil organic matter, conditions that are further intensified by prolonged aging [8,54]. The variation in pyrene removal among treatments may reflect differences in the specific enzymatic profiles of each fungal strain. Degradation of PAHs is generally considered to be more dependent on oxidative enzyme activities than is aliphatic hydrocarbon degradation [50].
The carbon balance (Figure 6) suggests that the added substrate was the main source of unaccounted, presumably mineralized C. Unaccounted C in the fungal treatments was 1.5–2.3 times higher than in the negative control. The limitation of this balance is that native SOM and residual substrate could not be distinguished at d60; thus, unaccounted C includes contributions from both pools. Direct CO2 measurement (respirometry) and isotopic labeling (δ13C) of the substrate could resolve these contributions in future studies.
Despite considerable variation in final ergosterol concentrations among treatments (Table S3, converted to fungal biomass carbon in Figure 6), TPH C8–C40 removal remained within a comparable range across fungal treatments (CV = 12%), suggesting that removal was not primarily driven by total fungal biomass. Final ergosterol concentrations represent an aggregate proxy of total fungal biomass, including both indigenous fungi and the inoculated strains; differences among treatments cannot be attributed specifically to the inoculated strains. Differences in removal among treatments may instead reflect differences in metabolic or enzymatic activity rather than in biomass, given the central role of extracellular ligninolytic enzymes in fungal hydrocarbon degradation [55], and evidence that degradation efficiency depends on enzyme production rather than on fungal abundance alone [56]. As laccase, manganese peroxidase and lignin peroxidase activities were not measured in the microcosms, this possibility remains speculative and needs to be tested by direct enzyme assays in soil, together with strain-specific quantification of fungal biomass, such as qPCR.
The increase in soil pH observed in all substrate-amended treatments (Section 3; Figure S3) is consistent with that reported by Cipriani-Avila et al. (2025) [26] using the same substrate, where pH increases were attributed to the release of calcium and magnesium cations during microbial degradation of the added organic substrate. As pH did not differ significantly among fungal treatments, it was not considered a differentiating factor in remediation performance.
However, several limitations should be acknowledged. The microcosm conditions used here (controlled temperature, homogenized soil, standardized substrate addition) do not necessarily replicate the spatial heterogeneity and the more variable, and often suboptimal, growth conditions encountered in the field. Furthermore, the 60-day experimental timeframe may not capture longer-term dynamics such as sequential degradation of recalcitrant fractions or shifts in fungal-bacterial interactions. Future work should therefore evaluate these strains under field or pilot-scale conditions, incorporate time-course sampling to better resolve degradation kinetics, and explore the potential contribution of indigenous microbial communities stimulated by fungal activity to overall hydrocarbon removal. An additional limitation is the absence of an abiotic (sterile) control, which precludes a direct quantification of the non-biological contribution to the observed removal. Consequently, the removal efficiencies reported here should be interpreted as net values. Several lines of evidence nonetheless indicate that abiotic losses were limited and cannot explain the enhancement in the inoculated treatments. The 15 ± 1% loss of TPH C8–C40 in C60, which also includes native microbial activity, sets an upper bound for abiotic losses over 60 days, consistent with abiotic losses of about 3% in 120 days in an aged soil polluted with heavy hydrocarbons [57], and below 15% in 48 days for a sodium-azide-killed soil containing weathered diesel, a lighter product [58]. NC, which shared all substrate-related abiotic effects (sorption to added organic matter, matrix changes, pH increase), did not differ from C60, whereas the fungal treatments exceeded NC by 28–50 percentage points; even the least volatile window (>C24–C40) decreased in six of the ten fungal treatments. After 30–40 years of ageing, further sequestration within 60 days is also expected to be small [59,60], although increased sorption to the fungus-transformed substrate cannot be excluded. Other limitations are that colonization by the inoculated strains and the composition of the consortium were not confirmed with strain-specific methods, that the effect of fungal transformation of the carrier could not be separated from that of the living fungus, that CO2, moisture and headspace gases were not monitored, and that extraction by shaking does not fully exclude changes in extractability. Future studies should nevertheless incorporate a sterile control, preferably by gamma irradiation, to partition the abiotic and biotic components of removal explicitly.
5. Conclusions
This study demonstrates that native WRF from the Ecuadorian Amazon can reduce petroleum hydrocarbon contamination in aged, heavily polluted soils, with TPH removal efficiencies of 42–64% over two months. All fungal treatments removed significantly more TPH C8–C40 than the unamended and substrate-amended controls. Fungal treatments reduced the light and medium C8–C40 windows and, in most treatments, the heavy window. The dual-strain consortium did not outperform its individual strains under the conditions evaluated. These results support the potential of bioaugmentation with native Ecuadorian fungal strains as a viable strategy for mycoremediation and provide a basis for future field-scale validation.
Supplementary Materials
The following supporting information can be downloaded at: https://www.mdpi.com/article/10.3390/jof12110855/s1, Figure S1: Overlaid GC-FID chromatograms of the residual C8–C40 fraction per treatment (raw, non-normalized responses). Figure S2. Reduction of the light, medium and heavy fractions (see Figure S1) in the fungal treatments relative to the non-inoculated control with organic substrate (NC). Figure S3: Soil pH before (C0) and after 60 days of treatment. Table S1: Number of replicates (microcosms) per treatment. Table S2: Analytical quality control (LOQ, method blanks, surrogate and spiked soil recoveries). Table S3: Ergosterol concentrations and soil organic carbon and TPH (GC-FID and gravimetric) values used to calculate the carbon mass balance for each treatment. Table S4: Pairwise differences in TPH C8–C40 removal. Table S5. Reduction of the light, medium and heavy windows relative to NC, with Dunnett’s test.
Author Contributions
I.C.-A.: conceptualization and methodology, validation, formal analysis, investigation, writing—original draft, visualization, and writing—review and editing. C.D.: conceptualization, project administration, funding acquisition and draft review. A.Z.-R.: methodology, validation, visualization, supervision, and draft review. K.G.-V.: methodology, resources, project administration, and draft review. P.A.G.: conceptualization, writing—original draft, visualization, supervision, project administration, and draft review. All authors have read and agreed to the published version of the manuscript.
Funding
This research was funded by Académie de Recherche et d’Enseignement Supérieur (ARES), through the project “Paving the way towards biotechnology and bioeconomy in Ecuador”, in collaboration between Université catholique de Louvain and Pontificia Universidad Católica del Ecuador. Cony Decock also gratefully acknowledges the financial support received from the Belgian State—Belgian Federal Science Policy through the BCCM program.
Institutional Review Board Statement
Not applicable.
Informed Consent Statement
Not applicable.
Data Availability Statement
All data supporting the findings of this study are available within the article and its Supplementary Materials. Further inquiries can be directed to the corresponding author.
Acknowledgments
The authors wish to thank the Environmental Technologies Center of the Amazonía Viva Project, EP Petroecuador, for providing the soil samples and for their continued support and guidance during this research. This study was conducted in accordance with the framework contract for access to genetic resources and traditional knowledge granted by the Ecuadorian Ministry of Environment, MAAE-DBI-CM-2019-0125-A.
Conflicts of Interest
The authors declare no conflicts of interest.
Abbreviations
The following abbreviations are used in this manuscript:
| ANOVA | Analysis of variance |
| ASTM | American Society for Testing and Materials |
| BCCM | Belgian Co-ordinated Collections of Microorganisms |
| DIN | Deutsches Institut fûr Normung |
| DRO | Diesel range organics |
| GC-FID | Gas chromatography with flame ionization detection |
| GC-MS | Gas chromatography with mass spectrometry |
| HOCs | Hydrophobic organic contaminants |
| HPLC | High-performance liquid chromatography |
| MUCL | Mycothèque de l’Université catholique de Louvain |
| PAHs | Polycyclic aromatic hydrocarbons |
| SIM | Selected ion monitoring |
| SOM | Soil organic matter |
| TPH | Total petroleum hydrocarbons |
| UCM | Unresolved complex mixture |
| WRF | White-rot fungi |
References
- Adeniran, M.A.; Oladunjoye, M.A.; Doro, K.O. Soil and Groundwater Contamination by Crude Oil Spillage: A Review and Implications for Remediation Projects in Nigeria. Front. Environ. Sci. 2023, 11, 1137496. [Google Scholar] [CrossRef] [Scilit]
- Mendelssohn, I.A.; Andersen, G.L.; Baltz, D.M.; Caffey, R.H.; Carman, K.R.; Fleeger, J.W.; Joye, S.B.; Lin, Q.; Maltby, E.; Overton, E.B.; et al. Oil Impacts on Coastal Wetlands: Implications for the Mississippi River Delta Ecosystem after the Deepwater Horizon Oil Spill. BioScience 2012, 62, 562–574. [Google Scholar] [CrossRef] [Scilit]
- Jha, S.; Dahiya, P. Impact Analysis of Oil Pollution on Environment, Marine, and Soil Communities. In Advances in Oil-Water Separation; Elsevier: Amsterdam, The Netherlands, 2022; pp. 99–113. [Google Scholar]
- Durango-Cordero, J.; Saqalli, M.; Laplanche, C.; Locquet, M.; Elger, A. Spatial Analysis of Accidental Oil Spills Using Heterogeneous Data: A Case Study from the North-Eastern Ecuadorian Amazon. Sustainability 2018, 10, 4719. [Google Scholar] [CrossRef] [Scilit]
- García-Villacís, K.I.; Hidalgo-Lasso, D.; López Montalvo, J.; Yanez-Torres, P.; Marín Tapia, D.; Urvina Ulloa, J.; Vargas-Jentzsch, P. Bioavailability as a Tool for Planning Bioremediation of Petroleum-Polluted Soil. ACI Av. Cienc. Ing. 2023, 15, 16. [Google Scholar] [CrossRef] [Scilit]
- Rivera-Parra, J.L.; Vizcarra, C.; Mora, K.; Mayorga, H.; Dueñas, J.C. Spatial Distribution of Oil Spills in the North Eastern Ecuadorian Amazon: A Comprehensive Review of Possible Threats. Biol. Conserv. 2020, 252, 108820. [Google Scholar] [CrossRef] [Scilit]
- INIAP—Estación Experimental Central Amazónica. Caracterización de Los Suelos de La Amazonía Ecuatoriana; INIAP: Orellana, Ecuador, 2018. [Google Scholar]
- Reid, B.J.; Jones, K.C.; Semple, K.T. Bioavailability of Persistent Organic Pollutants in Soils and Sediments—A Perspective on Mechanisms, Consequences and Assessment. Environ. Pollut. 2000, 108, 103–112. [Google Scholar] [CrossRef] [Scilit] [PubMed]
- Nam, K.; Kim, J.Y. Persistence and Bioavailability of Hydrophobic Organic Compounds in the Environment. Geosci. J. 2002, 6, 13–21. [Google Scholar] [CrossRef] [Scilit]
- Michael-Igolima, U.; Abbey, S.J.; Ifelebuegu, A.O. A Systematic Review on the Effectiveness of Remediation Methods for Oil Contaminated Soils. Environ. Adv. 2022, 9, 100319. [Google Scholar] [CrossRef] [Scilit]
- Majeed, B.K.; Shwan, D.M.S.; Rashid, K.A. A Review on Environmental Contamination of Petroleum Hydrocarbons, Its Effects and Remediation Approaches. Environ. Sci. Processes Impacts 2025, 27, 526–548. [Google Scholar] [CrossRef] [Scilit] [PubMed]
- Kuppusamy, S.; Naga Raju, M.; Megharaj, M.; Venkateswarlu, K. Total Petroleum Hydrocarbons: Environmental Fate, Toxicity, and Remediation; Springer: Cham, Switzerland, 2020. [Google Scholar]
- Buccina, S.; Chene, D.; Gramlich, J. Accounting for the Environmental Impacts of Texaco’s Operations in Ecuador: Chevron’s Contingent Environmental Liability Disclosures. Account. Forum 2013, 37, 110–123. [Google Scholar] [CrossRef] [Scilit]
- Ossai, I.C.; Ahmed, A.; Hassan, A.; Hamid, F.S. Remediation of Soil and Water Contaminated with Petroleum Hydrocarbon: A Review. Environ. Technol. Innov. 2020, 17, 100526. [Google Scholar] [CrossRef] [Scilit]
- Daccò, C.; Girometta, C.; Asemoloye, M.D.; Carpani, G.; Picco, A.M.; Tosi, S. Key Fungal Degradation Patterns, Enzymes and Their Applications for the Removal of Aliphatic Hydrocarbons in Polluted Soils: A Review. Int. Biodeterior. Biodegrad. 2020, 147, 104866. [Google Scholar] [CrossRef] [Scilit]
- Boddy, L.; Hiscox, J. Fungal Ecology: Principles and Mechanisms of Colonization and Competition by Saprotrophic Fungi. Microbiol. Spectr. 2016, 4, FUNK-0019-2016. [Google Scholar] [CrossRef] [Scilit] [PubMed]
- Rayner, A.D.M.; Boddy, L. Fungal Decomposition of Wood: Its Biology and Ecology; John Wiley & Sons: Chichester, UK, 1988. [Google Scholar]
- Nagy, L.G.; Tóth, R.; Kiss, E.; Slot, J.; Gácser, A.; Kovács, G.M. Six Key Traits of Fungi: Their Evolutionary Origins and Genetic Bases. Microbiol. Spectr. 2017, 5, FUNK-0036-2016. [Google Scholar] [CrossRef] [Scilit] [PubMed]
- Hatakka, A. Lignin-Modifying Enzymes from Selected White-Rot Fungi: Production and Role from in Lignin Degradation. FEMS Microbiol. Rev. 1994, 13, 125–135. [Google Scholar] [CrossRef]
- Torres-Farradá, G.; Thijs, S.; Rineau, F.; Guerra, G.; Vangronsveld, J. White Rot Fungi as Tools for the Bioremediation of Xenobiotics: A Review. JoF 2024, 10, 167. [Google Scholar] [CrossRef] [Scilit] [PubMed]
- Zhuo, R.; Fan, F. A Comprehensive Insight into the Application of White Rot Fungi and Their Lignocellulolytic Enzymes in the Removal of Organic Pollutants. Sci. Total Environ. 2021, 778, 146132. [Google Scholar] [CrossRef] [Scilit] [PubMed]
- Wick, L.Y.; Harms, H. The Mycosphere as a Hotspot for the Biotransformation of Contaminants in Soil. In Cellular Ecophysiology of Microbe; Krell, T., Ed.; Springer International Publishing: Cham, Switzerland, 2017; pp. 1–10. [Google Scholar]
- Efremenko, E.; Stepanov, N.; Senko, O.; Aslanli, A.; Maslova, O.; Lyagin, I. Using Fungi in Artificial Microbial Consortia to Solve Bioremediation Problems. Microorganisms 2024, 12, 470. [Google Scholar] [CrossRef] [Scilit] [PubMed]
- Ceci, A.; Pinzari, F.; Russo, F.; Persiani, A.M.; Gadd, G.M. Roles of Saprotrophic Fungi in Biodegradation or Transformation of Organic and Inorganic Pollutants in Co-Contaminated Sites. Appl. Microbiol. Biotechnol. 2019, 103, 53–68. [Google Scholar] [CrossRef] [Scilit] [PubMed]
- Haroune, L.; Saibi, S.; Bellenger, J.-P.; Cabana, H. Evaluation of the Efficiency of Trametes Hirsuta for the Removal of Multiple Pharmaceutical Compounds under Low Concentrations Relevant to the Environment. Bioresour. Technol. 2014, 171, 199–202. [Google Scholar] [CrossRef] [Scilit] [PubMed]
- Cipriani-Avila, I.; Decock, C.; Zambrano-Romero, A.; Zaldumbide, K.; Garcés-Ruiz, M.; Caiza-Olmedo, J.; Gordillo, A.; Luna, V.; Gerin, P.A. Mycoremediation of Petroleum-Contaminated Soil Using Native Ganoderma and Trametes Strains from the Ecuadorian Amazon. JoF 2025, 11, 651. [Google Scholar] [CrossRef] [Scilit] [PubMed]
- ASTM C136/C136M-19; Standard Test Method for Sieve Analysis of Fine and Coarse Aggregates. ASTM International: West Conshohocken, PA, USA, 2019.
- EPA 9045D; Soil and Waste pH. U.S. Environmental Protection Agency: Washington, DC, USA, 2004.
- APHA/AWWA/WEF. Method 2510: Conductivity. In Standard Methods for the Examination of Water and Wastewater, 23rd ed.; American Public Health Association: Washington, DC, USA, 2017. [Google Scholar]
- ASTM D2216-98; Standard Test Methods for Laboratory Determination of Water (Moisture). ASTM International: West Conshohocken, PA, USA, 1998.
- ASTM F1647-11; Standard Test Methods for Organic Matter Content of Athletic Field Rootzones. ASTM International: West Conshohocken, PA, USA, 2018.
- EN 13342/DIN ISO 11261; Soil Quality—Determination of Total Nitrogen—Modified Kjeldahl Method. Deutsches Institut für Normung: Berlin, Germany, 2002.
- U.S. Environmental Protection Agency. N-Hexane Extractable Material (HEM; Oil and Grease) and Silica Gel Treated N-Hexane Extractable Material (SGT-HEM; Non-Polar Material) by Extraction and Gravimetry; U.S. Environmental Protection Agency, Office of Water: Washington, DC, USA, 2010. [Google Scholar]
- U.S. Environmental Protection Agency. Nonhalogenated Organics by Gas Chromatography; U.S. Environmental Protection Agency, Office of Solid Waste: Washington, DC, USA, 2003. [Google Scholar]
- U.S. Environmental Protection Agency. Method 8270E (SW-846): Semivolatile Organic Compounds by Gas Chromatography/Mass Spectrometry (GC/MS); U.S. Environmental Protection Agency: Washington, DC, USA, 2014. [Google Scholar]
- U.S. Environmental Protection Agency. US EPA SW-846 Method 8000; United States Environmental Protection Agency (EPA): Washington, DC, USA, 2018. [Google Scholar]
- Canadian Council of Ministers of the Environment. Canada-Wide Standard for Petroleum Hydrocarbons (PHC) in Soil: Scientific Rationale; Canadian Council of Ministers of the Environment: Winnipeg, MB, USA, 2008. [Google Scholar]
- Borràs, E.; Caminal, G.; Sarrà, M.; Novotný, Č. Effect of Soil Bacteria on the Ability of Polycyclic Aromatic Hydrocarbons (PAHs) Removal by Trametes versicolor and Irpex lacteus from Contaminated Soil. Soil Biol. Biochem. 2010, 42, 2087–2093. [Google Scholar] [CrossRef] [Scilit]
- Speight, J.G. The Chemistry and Technology of Petroleum; CRC Press: Boca Raton, FL, USA, 2014. [Google Scholar]
- Djajakirana, G.; Joergensen, R.G.; Meyer, B. Ergosterol and Microbial Biomass Relationship in Soil. Biol. Fertil. Soils 1996, 22, 299–304. [Google Scholar] [CrossRef]
- Pribyl, D.W. A Critical Review of the Conventional SOC to SOM Conversion Factor. Geoderma 2010, 156, 75–83. [Google Scholar] [CrossRef] [Scilit]
- Koshlaf, E.; Ball, A. Soil Bioremediation Approaches for Petroleum Hydrocarbon Polluted Environments. AIMS Microbiol. 2017, 3, 25–49. [Google Scholar] [CrossRef] [Scilit] [PubMed]
- Adenipekun, C.O.; Fasidi, I.O. Bioremediation of Oil-Polluted Soil by Lentinus subnudus, a Nigerian White-Rot Fungus. Afr. J. Biotechnol. 2005, 4, 796–798. [Google Scholar]
- Adenipekun, C.O.; Isikhuemhe, O.S. Bioremediation of Engine Oil Polluted Soil by the Tropical White Rot Fungus, Lentinus squarrosulus Mont. (Singer). Pak. J. Biol. Sci. 2008, 11, 1634–1637. [Google Scholar] [CrossRef] [Scilit] [PubMed]
- Tavares, M.F.; Avelino, K.V.; Araújo, N.L.; Marim, R.A.; Linde, G.A.; Colauto, N.B.; Do Valle, J.S. Decolorization of Azo and Anthraquinone Dyes by Crude Laccase Produced by Lentinus crinitus in Solid State Cultivation. Braz. J. Microbiol. 2020, 51, 99–106. [Google Scholar] [CrossRef] [Scilit] [PubMed]
- Serbent, M.P.; Guimarães, D.K.S.; Drechsler-Santos, E.R.; Helm, C.V.; Giongo, A.; Tavares, L.B.B. Growth, Enzymatic Production and Morphology of the White-Rot Fungi Lentinus crinitus (L.) Fr. upon 2,4-D Herbicide Exposition. Int. J. Environ. Sci. Technol. 2020, 17, 2995–3012. [Google Scholar] [CrossRef] [Scilit]
- Boddy, L. Interspecific Combative Interactions between Wood-Decaying Basidiomycetes. FEMS Microbiol. Ecol. 2000, 31, 185–194. [Google Scholar] [CrossRef] [PubMed]
- Hamad, A.A.; Moubasher, H.A.; Moustafa, Y.M.; Mohamed, N.H.; Abd-el Rhim, E.H. Petroleum Hydrocarbon Bioremediation Using Native Fungal Isolates and Consortia. Sci. World J. 2021, 2021, 1–13. [Google Scholar] [CrossRef] [Scilit] [PubMed]
- Zemo, D.A.; O’Reilly, K.T.; Mohler, R.E.; Tiwary, A.K.; Magaw, R.I.; Synowiec, K.A. Nature and Estimated Human Toxicity of Polar Metabolite Mixtures in Groundwater Quantified as TPHd/DRO at Biodegrading Fuel Release Sites. Groundw. Monit. Remediat. 2013, 33, 44–56. [Google Scholar] [CrossRef] [Scilit]
- Harms, H.; Schlosser, D.; Wick, L.Y. Untapped Potential: Exploiting Fungi in Bioremediation of Hazardous Chemicals. Nat. Rev. Microbiol. 2011, 9, 177–192. [Google Scholar] [CrossRef] [Scilit] [PubMed]
- Johnsen, A.R.; Wick, L.Y.; Harms, H. Principles of Microbial PAH-Degradation in Soil. Environ. Pollut. 2005, 133, 71–84. [Google Scholar] [CrossRef] [Scilit] [PubMed]
- Wilcke, W.; Amelung, W.; Krauss, M.; Martius, C.; Bandeira, A.; Garcia, M. Polycyclic Aromatic Hydrocarbon (PAH) Patterns in Climatically Different Ecological Zones of Brazil. Org. Geochem. 2003, 34, 1405–1417. [Google Scholar] [CrossRef] [Scilit]
- Yunker, M.B.; Macdonald, R.W.; Vingarzan, R.; Mitchell, R.H.; Goyette, D.; Sylvestre, S. PAHs in the Fraser River Basin: A Critical Appraisal of PAH Ratios as Indicators of PAH Source and Composition. Org. Geochem. 2002, 33, 489–515. [Google Scholar] [CrossRef] [Scilit]
- Cerniglia, C.E. Biodegradation of Polycyclic Aromatic Hydrocarbons. Biodegradation 1992, 3, 351–368. [Google Scholar] [CrossRef] [Scilit]
- Pointing, S. Feasibility of Bioremediation by White-Rot Fungi. Appl. Microbiol. Biotechnol. 2001, 57, 20–33. [Google Scholar] [CrossRef] [Scilit] [PubMed]
- Novotný, Č.; Svobodová, K.; Erbanová, P.; Cajthaml, T.; Kasinath, A.; Lang, E.; Šašek, V. Ligninolytic Fungi in Bioremediation: Extracellular Enzyme Production and Degradation Rate. Soil Biol. Biochem. 2004, 36, 1545–1551. [Google Scholar] [CrossRef] [Scilit]
- Medaura, M.C.; Guivernau, M.; Moreno-Ventas, X.; Prenafeta-Boldú, F.X.; Viñas, M. Bioaugmentation of Native Fungi, an Efficient Strategy for the Bioremediation of an Aged Industrially Polluted Soil with Heavy Hydrocarbons. Front. Microbiol. 2021, 12, 626436. [Google Scholar] [CrossRef] [Scilit] [PubMed]
- Eriksson, M.; Ka, J.-O.; Mohn, W.W. Effects of Low Temperature and Freeze-Thaw Cycles on Hydrocarbon Biodegradation in Arctic Tundra Soil. Appl. Environ. Microbiol. 2001, 67, 5107–5112. [Google Scholar] [CrossRef] [Scilit] [PubMed]
- Semple, K.T.; Morriss, A.W.J.; Paton, G.I. Bioavailability of Hydrophobic Organic Contaminants in Soils: Fundamental Concepts and Techniques for Analysis. Eur. J. Soil Sci. 2003, 54, 809–818. [Google Scholar] [CrossRef] [Scilit]
- Alexander, M. Aging, Bioavailability, and Overestimation of Risk from Environmental Pollutants. Environ. Sci. Technol. 2000, 34, 4259–4265. [Google Scholar] [CrossRef] [Scilit]

Disclaimer/Publisher’s Note: The statements, opinions and data contained in all publications are solely those of the individual author(s) and contributor(s) and not of MDPI and/or the editor(s). MDPI and/or the editor(s) disclaim responsibility for any injury to people or property resulting from any ideas, methods, instructions or products referred to in the content. |
© 2026 by the authors. Licensee MDPI, Basel, Switzerland. This article is an open access article distributed under the terms and conditions of the Creative Commons Attribution (CC BY) license.