


Abstract
Thelephora ganbajun is a highly valued edible ectomycorrhizal fungus, but the relationships between its natural distribution and growth and soil environmental conditions remain poorly understood. In this study, mycosphere soils and adjacent control soils were collected from seven geographic sites in Yunnan Province, China. Soil physicochemical properties, enzyme activities, untargeted metabolomics, and bacterial and fungal amplicon sequencing were integrated to characterize geographic variation in the belowground environment and its associations with fruiting-body metabolic phenotypes. Nutrient levels and enzyme activities differed between mycosphere and control soils, and the magnitude of these differences varied among sites. A total of 5006 metabolites were annotated, including 77 differential metabolites shared across all seven sites, although their directions of change were strongly site-dependent. Bacterial and fungal communities in mycosphere soils exhibited significant geographic differentiation. The first two axes of distance-based redundancy analysis cumulatively explained 50.04% and 56.73% of the variation in bacterial and fungal communities, respectively. Soil pH, alkali-hydrolyzable nitrogen, and available phosphorus emerged as key environmental factors, with the latter two significantly associated with both bacterial and fungal community structure. Procrustes analysis further revealed concordant geographic differentiation of the two microbial communities. The volatile, non-volatile, and free amino acid metabolic phenotypes of fruiting bodies were associated with different components of the belowground environment. These findings reveal geographic variation in the belowground environment of T. ganbajun during a single fruiting season and its associations with fruiting-body metabolic phenotypes, providing candidate environmental indicators for future habitat assessment.
1. Introduction
Thelephora ganbajun M. Zang (Thelephoraceae) is a rare wild edible mushroom distributed mainly in Yunnan Province, China, and has considerable edible, economic, and ecological value. Unlike saprotrophic edible fungi, T. ganbajun is an ectomycorrhizal fungus that, under natural conditions, depends on symbiotic associations with the roots of host plants. Its hyphal growth, nutrient acquisition, and fruiting-body formation are influenced by both host plants and soil conditions [1]. This dependence also partly explains why stable artificial cultivation remains difficult for T. ganbajun, matsutake, truffles, and many other ectomycorrhizal fungi. Therefore, characterizing the soil ecological conditions of the natural habitats of T. ganbajun may help identify soil conditions favorable for its growth and provide a basis for wild-resource conservation and habitat management.
Ectomycorrhizal symbiosis is primarily characterized by nutritional mutualism between host plants and fungi. Host plants supply photosynthetically fixed carbon to fungi, whereas fungi use extraradical hyphae to acquire nutrients such as nitrogen and phosphorus from the soil and transfer a portion of these nutrients to their host plants [2,3]. The Hartig net serves as an important interface for nutrient and metabolite exchange between the two partners, while extraradical hyphae extend this exchange into the surrounding soil. Recent studies have shown that ectomycorrhizal systems also involve diverse associated microorganisms. Mycorrhiza helper bacteria can promote mycorrhiza formation, hyphal growth, and nutrient transformation, while ectomycorrhizal hyphae can influence surrounding microorganisms by providing colonization sites and releasing selective exudates [3,4]. For example, Deveau et al. found that the mycorrhiza helper bacterium Pseudomonas fluorescens BBc6R8 promoted hyphal growth and branching in the ectomycorrhizal fungus Laccaria bicolor and influenced fungal gene expression [5]. Therefore, the soil surrounding ectomycorrhizal fungi not only provides space and nutrients for hyphal growth but also serves as a site for material exchange and interactions among host plants, fungi, and other microorganisms.
Studies of edible ectomycorrhizal fungi, such as matsutake and truffles, provide important insights into these belowground interactions. Previous research has shown that matsutake-associated soil patches harbor not only matsutake mycelia but also diverse fungi and actinomycetes. Compared with adjacent soils outside these patches, soils associated with matsutake showed significantly higher activities of several enzymes involved in organic matter decomposition. Meanwhile, soil microbial composition and certain soil properties also differed among geographic sites [6]. In an artificial symbiotic system involving the Indian truffle and Chinese white pine, mycorrhiza formation likewise altered the surrounding soil properties and bacterial and fungal community structures [7]. Specifically, bacterial diversity was lower in mycorrhiza-associated soils than in control soils, whereas several bacterial genera, including Reyranella, Rhizomicrobium, Nordella, and Pseudomonas, and fungal genera, including Cuphophyllus, Leucangium, and Histoplasma, showed higher relative abundances in mycorrhiza-associated samples. Recent metagenomic studies have further revealed differences in soil moisture and nutrient levels, including nitrogen and phosphorus, between matsutake-colonized and non-colonized soils. These environmental differences were closely associated with changes in microbial community composition and nitrogen metabolism-related functions. Matsutake and surrounding microorganisms also exhibited metabolic synchrony in processes such as nitrate reduction and glutamate and tryptophan biosynthesis [4]. These studies also identified bacterial taxa, including Conexibacter and Paraburkholderia, that may be associated with matsutake. Furthermore, an interdisciplinary study by Yoo et al. identified a relatively stable core microbiome across matsutake-associated soil patches in different geographic regions, while also revealing niche-specific taxa in soil, mycorrhizal roots, and fruiting bodies. For example, Caballeronia and Paraburkholderia were more commonly associated with matsutake-colonized soils, whereas Ewingella and Pseudomonas were more prevalent in fruiting bodies [8]. Collectively, these studies indicate that the growth of edible ectomycorrhizal fungi is closely associated with soil properties, microbial communities, and microbial metabolic functions, and that these belowground ecological characteristics are influenced by geographic environmental conditions.
In contrast, the belowground ecology of T. ganbajun remains poorly understood. Previous studies have mainly focused on the genetic diversity of its geographic populations [9], the distribution of microbial communities and functional genes across different tissue compartments of its fruiting bodies [10], and changes in proteins and metabolites during the development of mycelia, primordia, and fruiting bodies [11]. These studies have advanced our understanding of population structure, the microbial communities associated with fruiting bodies, and developmental processes in T. ganbajun. However, it remains unclear whether mycosphere soils and adjacent control soils from different geographic sites exhibit consistent differences in physicochemical properties, enzyme activities, and metabolite profiles. Direct evidence is also lacking as to whether mycosphere metabolites and microbial communities across different sites exhibit both shared characteristics and site-specific patterns. Furthermore, the relationships among soil environmental conditions, enzyme activities, metabolites, and microbial communities have not yet been comprehensively investigated.
Against this background, this study investigated T. ganbajun and its associated soils at seven geographic sites in Yunnan Province, China. First, differences in physicochemical properties, enzyme activities, and metabolite composition between mycosphere soils (RSs) and adjacent control soils (CSs) were compared, and the variation in these differences among sites was examined. Bacterial and fungal community composition in RSs from different sites and their relationships with soil environmental factors were then analyzed. By integrating soil environmental, metabolomic, and microbial community data, associations among different ecological dimensions and between these dimensions and fruiting-body metabolic phenotypes were further explored. This study aimed to characterize the geographic differentiation of soil characteristics associated with T. ganbajun and their relationships with fruiting-body metabolic phenotypes, providing a basis for subsequent habitat assessment and validation of candidate indicators.
2. Materials and Methods
2.1. Soil Sampling
From July to September 2025, fruiting bodies of T. ganbajun and associated soil samples were collected from seven geographic sites in Yunnan Province, China: Nanhua County (NH), Yimen County (YM), Yiliang County (YL), Changning County (CN), Fengqing County (FQ), Shiping County (SP), and Shuanglong Subdistrict, Panlong District, Kunming (SL). Fruiting bodies were identified based on morphological characteristics [12]. At each site, three individual fruiting bodies at similar developmental stages were sampled separately as biological sampling units. For each fruiting body, one RS sample and its corresponding adjacent CS sample were collected, yielding 21 matched RS–CS pairs across the seven sites. GPS coordinates and elevations were recorded for the sampling points, as provided in Table S1.
In this study, RS was defined as a composite soil sample collected from the base of a T. ganbajun fruiting body and its immediate surroundings. To collect RS, leaf litter, stones, and other surface debris around the fruiting body were first removed. Soil was then excavated to a depth of 5–10 cm within an approximately 5-cm-diameter area centered on the base of the fruiting body, and the fruiting body together with the surrounding fine roots and soil was carefully removed intact. After gently shaking off loose soil and larger stones, a sterile spatula was used to collect soil tightly adhering to fine roots and mycelial aggregates, together with the soil directly beneath the base of the stipe. These two soil fractions were combined, passed through a sterile 2-mm mesh metal sieve, and thoroughly mixed to obtain one RS sample per fruiting body. Following a soil sampling method used for ectomycorrhizal fungi [13], CS was collected at the same depth, approximately 40 cm from the corresponding fruiting body, in an area without T. ganbajun fruiting bodies or obvious mycelial aggregates. Soil subsamples were collected in three directions, combined, passed through a sterile 2-mm mesh metal sieve, and thoroughly mixed to obtain one CS sample paired with the corresponding RS sample. As the presence or absence of T. ganbajun mycelium was not verified by species-specific molecular detection in this study, RS and CS were treated as operational sampling categories defined by sampling location and observable field characteristics, rather than as confirmed colonized and uncolonized soils.
After homogenization, each soil sample was divided according to the requirements of subsequent analyses. Subsamples used for the determination of soil physicochemical properties, mineral elements, and particle-size composition were air-dried. Subsamples used for enzyme activity assays, untargeted metabolomics, and amplicon sequencing were transferred into sterile cryovials, rapidly frozen in liquid nitrogen, and stored at −80 °C until further analysis.
2.2. Soil Chemical Properties
Soil physicochemical properties were determined according to the methods specified in relevant Chinese industry standards. The following parameters were measured according to agricultural industry standards: soil pH by the potentiometric method (NY/T 1377-2007) [14], soil organic matter (SOM) by potassium dichromate oxidation with external heating (NY/T 1121.6-2006) [15], total nitrogen (TN) using an automatic nitrogen analyzer (NY/T 1121.24-2012) [16], total phosphorus (TP) by the molybdenum–antimony colorimetric method (NY/T 88-1988) [17], total potassium (TK) by flame photometry (NY/T 87-1988) [18], available phosphorus (AP) by spectrophotometry (NY/T 1121.7-2014) [19], and available potassium (AK) by flame photometry (NY/T 889-2004) [20]. Soil organic carbon (SOC) was calculated from SOM using a conversion factor of 1.724 (SOC = SOM/1.724). Alkali-hydrolyzable nitrogen (AN) was determined using the alkali diffusion method according to the forestry industry standard LY/T 1228-2015 [21]. Detailed procedures are provided in Method S1.
2.3. Soil Enzyme Activities
Soil enzyme activities were determined using commercial assay kits (Suzhou Grace Biotechnology Co., Ltd., Suzhou, China) according to the manufacturers’ instructions. The enzymes assayed were phenol oxidase (PO; G0146W), soil urease (S-UE; G0301W), soil catalase (S-CAT; G0303W), soil acid phosphatase (S-ACP; G0304W), and soil chitinase (S-Chitinase; G0335W). Detailed procedures are provided in Method S1.
2.4. Soil Particle-Size Distribution and Mineral Element Determination
Soil particle-size distribution was determined by laser diffraction. A 10-g portion of air-dried soil passed through a 2-mm sieve was dispersed in deionized water and gradually introduced until the obscuration reached 10–20%. Particle-size distribution was measured using a Mastersizer 2000 laser diffraction particle-size analyzer equipped with a Hydro 2000MU wet dispersion unit (Malvern Instruments Ltd., Malvern, UK). Before measurement, the soil particles were thoroughly dispersed by circulating and stirring the suspension and applying ultrasonication for 3–5 min. Measurements were performed once the suspension had stabilized and the obscuration remained within 10–20%. The instrument calculated the volume percentage of particles in different size fractions based on Mie scattering theory. According to the United States Department of Agriculture (USDA) particle-size classification, soil particles were classified as clay (<0.002 mm), silt (0.002–0.05 mm), and sand (0.05–2 mm).
The concentrations of Ca, Mg, S, Fe, Mn, Zn, Cu, Se, and Cr in soil were determined by inductively coupled plasma atomic emission spectrometry (ICP-AES) according to the Chinese water industry standard SL 394.1-2007 [22]. Detailed procedures are provided in Method S1.
2.5. Untargeted Soil Metabolomics
A 250-mg aliquot of each soil sample was extracted with 500 μL of 70% methanol–water extraction solution containing internal standards, pre-cooled to −20 °C. The mixture was vortexed for 3 min, sonicated in an ice-water bath for 10 min, vortexed again for 1 min, and then incubated at −20 °C for 30 min. After centrifugation at 12,000 rpm for 10 min at 4 °C, the supernatant was filtered through a 0.22-μm polytetrafluoroethylene (PTFE) membrane filter and subjected to liquid chromatography–mass spectrometry (LC–MS) analysis. Metabolites were detected using a Vanquish ultra-high-performance liquid chromatography (UHPLC) system coupled to a Q Exactive HF-X high-resolution mass spectrometer (Thermo Fisher Scientific, Waltham, MA, USA). Chromatographic separation was performed on an Waters Corporation, Milford, MA, USA (1.8 μm, 2.1 mm × 100 mm). Mobile phase A consisted of ultrapure water containing 0.1% formic acid, and mobile phase B consisted of acetonitrile containing 0.1% formic acid. The flow rate was 0.40 mL/min, the column temperature was maintained at 40 °C, and the injection volume was 4 μL. The gradient elution program was as follows: 0–5 min, 5–65% B; 5–6 min, 65–99% B; 6–7.5 min, 99% B; and 7.5–7.6 min, 99–5% B, followed by re-equilibration until 10 min. Mass spectra were acquired in both positive- and negative-ion modes over an m/z range of 84–1250.
Raw mass spectrometry data were converted to the mzML format using ProteoWizard (version 3.0), followed by peak extraction, alignment, and retention time correction using XCMS. Ion features with a missing value rate exceeding 50% within a group were removed, and peak areas were corrected using support vector regression. Metabolites were annotated against an in-house database, public databases, predictive databases, and metDNA. Metabolite annotations were classified by evidence level as Level 2 (putative structural annotation) or Level 3 (putative compound-class annotation). Metabolites with a composite identification score ≥0.5 and a coefficient of variation (CV) <0.5 in quality control (QC) samples were retained. Relative metabolite abundances were represented by corrected peak areas.
2.6. Bacterial and Fungal Amplicon Sequencing
Total deoxyribonucleic acid (DNA) was extracted from RS samples using the HiPure Soil DNA Kit (Magen Biotechnology Guangzhou, China) according to the manufacturer’s instructions. DNA concentration and purity were determined using a NanoDrop 2000 spectrophotometer (Thermo Fisher Scientific, Waltham, MA, USA), and DNA integrity was assessed by agarose gel electrophoresis. The V3–V4 region of the bacterial 16S ribosomal RNA (rRNA) gene was amplified using primers 341F (5′-CCTACGGGNGGCWGCAG-3′) and 806R (5′-GGACTACHVGGGTATCTAAT-3′). The fungal internal transcribed spacer 2 (ITS2) region of ribosomal DNA was amplified using primers ITS3_KYO2 (5′-GATGAAGAACGYAGYRAA-3′) and ITS4 (5′-TCCTCCGCTTATTGATATGC-3′).
The PCR amplification program consisted of an initial denaturation at 95 °C for 5 min, followed by 30 cycles of denaturation at 95 °C for 1 min, annealing at 60 °C for 1 min, and extension at 72 °C for 1 min, with a final extension at 72 °C for 7 min. Negative controls were included during PCR amplification to monitor potential contamination. The amplicons were examined by 2% agarose gel electrophoresis, purified using AMPure XP beads (Beckman Coulter, Brea, CA, USA), and quantified using a Qubit 3.0 fluorometer (Thermo Fisher Scientific, Waltham, MA, USA). Sequencing libraries were prepared using the DNA Prep Kit (Illumina, San Diego, CA, USA), and qualified libraries were sequenced on the NovaSeq 6000 platform (Illumina, San Diego, CA, USA) using paired-end 250-bp sequencing (PE250).
Raw paired-end reads were quality-filtered using fastp v0.18.0. Reads containing adapter sequences, with a proportion of ambiguous bases ≥10%, or with a proportion of low-quality bases ≥50% were removed. The retained paired-end reads were merged using FLASH v1.2.11. High-quality bacterial sequences were clustered into operational taxonomic units (OTUs) at a sequence similarity threshold of ≥97% using the UPARSE algorithm implemented in USEARCH v11.0.667. Chimeric sequences were removed using UCHIME, and the most abundant sequence within each OTU was selected as the representative sequence. Singleton sequences were removed after clustering.
High-quality fungal sequences were processed using DADA2 v1.12.1 for dereplication, error-model construction, and sequence denoising to generate amplicon sequence variants (ASVs). Chimeric sequences were subsequently removed, and an ASV abundance table was generated. Representative bacterial OTU sequences were aligned against the SILVA v138.2 database, whereas fungal ASV sequences were compared against the UNITE v10.0 database. Taxonomic assignment was performed using the Ribosomal Database Project (RDP) Classifier v2.14 with a confidence threshold of 0.8.
2.7. Integrated Analysis of Fruiting-Body Metabolic Phenotypes and the Belowground Environment
Fruiting bodies of T. ganbajun were collected in one-to-one correspondence with the 21 RS samples and were simultaneously used for volatile metabolomics, non-volatile metabolomics, and free amino acid analysis. Volatile metabolites were analyzed by headspace solid-phase microextraction coupled with gas chromatography–tandem mass spectrometry (HS-SPME-GC-MS/MS), non-volatile metabolites by ultra-performance liquid chromatography–tandem mass spectrometry (UPLC-MS/MS), and free amino acids using an amino acid analyzer. Principal component analysis (PCA) was performed separately on the volatile metabolite, non-volatile metabolite, and free amino acid datasets of the fruiting bodies, and the first principal component (PC1) score of each sample was extracted to represent the major gradient of variation in the corresponding metabolic phenotype. Similarly, separate PCA analyses were conducted for the physicochemical properties, enzyme activities, and metabolite profiles of RSs, and the corresponding PC1 scores were extracted. For fungal communities, principal coordinate analysis (PCoA) based on Bray–Curtis dissimilarities was performed, and the first principal coordinate (PCoA1) score was extracted. Spearman correlation analysis was then conducted using the paired fruiting-body and RS samples to evaluate the relationships between the overall characteristics of the belowground environment and fruiting-body metabolic phenotypes.
2.8. Statistical Analysis
Differences in soil physicochemical properties, enzyme activities, mineral element contents, and particle-size composition among RSs from the seven geographic sites were analyzed by one-way analysis of variance (ANOVA) using SPSS 26 (IBM Corp., Armonk, NY, USA), followed by Fisher’s least significant difference (LSD) test for multiple comparisons, with statistical significance set at p < 0.05. Results are presented as means ± standard deviations. For site-specific RS–CS comparisons, OPLS-DA models were evaluated using three-fold leave-one-pair-out cross-validation, in which each RS–CS pair was held out together in turn. To account for the paired design, all eight possible within-pair label configurations (23) were exhaustively enumerated by exchanging RS and CS labels within each pair. Exact p values were calculated as the proportion of configurations yielding Q2 values greater than or equal to the observed Q2. For the separate seven-site RS-only analysis, a one-versus-rest OPLS1 ensemble was evaluated using 10 repeats of stratified three-fold cross-validation and 999 random permutations of site labels among the 21 RS samples. p values were calculated using the plus-one correction. Differential metabolites were initially screened using a variable importance in projection (VIP) score > 1 and an unadjusted ANOVA p < 0.05. For multiple-testing sensitivity analysis, BH adjustment was applied to all 6792 valid ANOVA p values from the complete set of LC–MS features.
For paired RS–CS soil samples, a linear mixed-effect model accounting for the paired design was used to assess the effects of site, soil type, and their interaction, with a paired-block model used for sensitivity analysis. Interaction p values were obtained from the paired-block model. PCA was performed on the log2(RS/CS) changes in metabolite abundance calculated from the 21 pairs of soil samples. Euclidean distances were calculated from standardized paired-difference profiles, followed by permutational multivariate analysis of variance (PERMANOVA; 999 permutations) and permutational analysis of multivariate dispersions (PERMDISP).
Bacterial and fungal alpha-diversity indices were calculated from the OTU or ASV abundance tables for each sample, and differences among sites were assessed using the Kruskal–Wallis test. Bray–Curtis dissimilarities were calculated from relative abundance data and visualized using PCoA. Differences in community composition were tested using PERMANOVA with 999 permutations. In addition, PERMDISP based on Bray–Curtis dissimilarities was performed with 9999 permutations to assess the homogeneity of multivariate dispersions among bacterial and fungal communities across the seven sites. Differential microbial taxa were identified using linear discriminant analysis effect size (LEfSe), with thresholds of p < 0.05 and a linear discriminant analysis (LDA) score ≥4.0. Relationships between environmental factors and microbial communities were assessed using distance-based redundancy analysis (db-RDA) and Mantel tests, while concordance between bacterial and fungal communities was evaluated using Procrustes analysis. Relationships among variables were assessed using Spearman correlation analysis with pairwise deletion, and BH-adjusted Q < 0.05 was considered statistically significant. All multivariate ordination, permutation tests, and correlation analyses were performed in R version 4.2.0.
3. Results
3.1. Soil Properties, Enzyme Activities, and Particle-Size Composition
The physicochemical properties of RSs differed markedly among geographic sites (Table 1). Soil pH ranged from 5.01 to 6.81; all RSs were acidic, although SLRS was closest to neutral. CNRS had the highest TN, SOM, SOC, AN, TP, and AK contents among the seven sites. YMRS had the highest TK content, at 13.665 g kg−1, whereas SPRS had the highest AP content, at 7.225 mg kg−1. In contrast, SLRS had the lowest TN, SOM, and SOC contents, YLRS had the lowest TP and TK contents, and FQRS had the lowest AK content.
Table 1.
Physicochemical properties of mycosphere soils.
CSs also differed significantly among geographic sites (Table 2), with pH values ranging from 4.92 to 5.82. YMCS had the highest TN, SOM, SOC, AN, AP, and AK contents, whereas CNCS had the highest TK content and SLCS had the highest TP content. SPCS had the lowest TN, SOM, SOC, AN, TP, and TK contents.
Table 2.
Physicochemical properties of control soils.
Descriptively, RS–CS differences varied among sites. At FQ and SP, all eight nutrient variables were higher in RS than in CSs. AP and AK contents in FQRS were approximately 3.62- and 3.98-fold those in FQCS, respectively; in SPRS, the corresponding values were 8.26- and 3.48-fold those in SPCS. In contrast, TN, SOM, SOC, AN, TP, AP, and AK contents were lower in both YMRS and SLRS than in their corresponding CSs, whereas TK was slightly higher in YMRS but lower in SLRS. NH, CN, and YL showed mixed RS–CS differences across individual nutrient variables.
Enzyme activities in RSs differed among geographic sites (Table 3). CNRS exhibited the highest urease and catalase activities, whereas SPRS showed the highest acid phosphatase and chitinase activities. PO activity was relatively high in SPRS, YLRS, and FQRS, but lowest in SLRS. Comparison of mean values in Table 3 and Table 4 showed that acid phosphatase and PO activities were consistently lower in RS than in the corresponding CSs across all seven sites. Urease, catalase, and chitinase activities were lower in RS than in CS at five of the seven sites. Further paired analyses showed that RS–CS differences in soil physicochemical properties and enzyme activities varied among sites (Figure S3A), with significant Site × Soil type interactions for all 14 variables (p < 0.001; Figure S3B).
Table 3.
Enzyme activities in mycosphere soils.
Table 4.
Enzyme activities in control soils.
Particle-size composition and mineral element contents also differed among the seven RSs (Table 5). SPRS had the highest sand proportion (58.26%) and the lowest clay and silt proportions, and also had the highest Ca and Mg contents. In contrast, YMRS had the lowest sand proportion (11.55%) and the highest clay proportion (33.15%). CNRS and FQRS were dominated by silt and had relatively high Fe and S contents.
Table 5.
Particle-size composition and mineral elements of mycosphere soils.
3.2. Soil Metabolomic Analysis
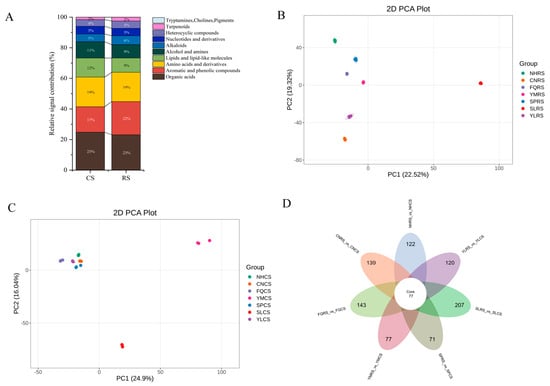
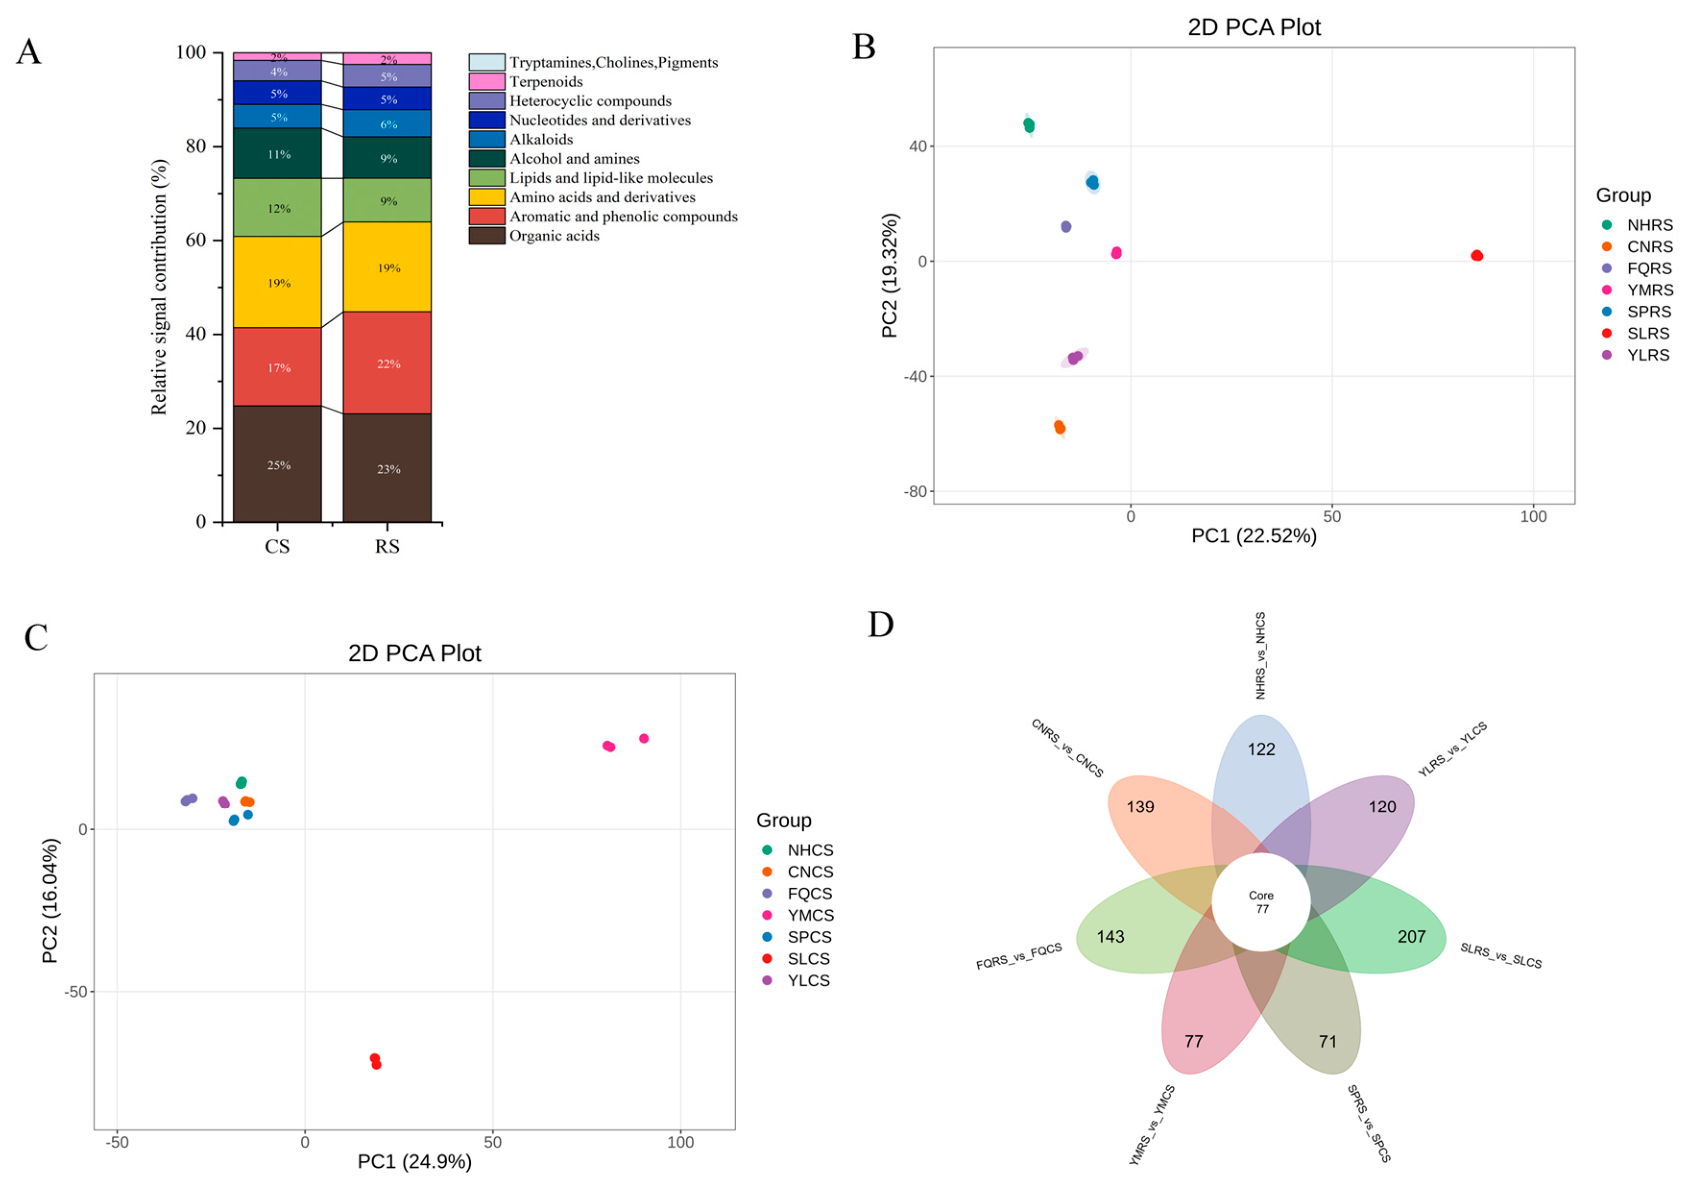
A total of 5006 metabolites were annotated in T. ganbajun-associated soil samples from the seven geographic sites. The major metabolite classes were generally similar between RSs and CSs, with organic acids, amino acids and their derivatives, and aromatic and phenolic compounds representing the predominant categories in both soil types (Figure 1A). The relative proportions of aromatic and phenolic compounds, alkaloids, and terpenoids were higher in RS than in CS, whereas organic acids, lipids and lipid-like molecules, alcohols, and amines accounted for higher proportions in CS. In addition, tryptamines, choline-related compounds, and pigments each accounted for less than 1% of the metabolites in both RS and CS, resulting in segments too small to be clearly distinguished in the stacked bar chart.
Figure 1.
Metabolomic analysis of T. ganbajun mycosphere soils and adjacent control soils across different geographic sites. (A) Metabolite classes and relative abundances in RSs and CSs; (B) PCA of RS samples from different sites; (C) PCA of CS samples from different sites; (D) Venn diagram of differential metabolites.
PCA revealed geographic differentiation in both RS and CS metabolite profiles (Figure 1B,C). RS samples clustered by site, with SLRS clearly separated from the other sites. Among CS samples, YMCS and SLCS were separated from the relatively tight cluster formed by NHCS, CNCS, FQCS, SPCS, and YLCS.
To assess site-dependent RS–CS shifts, PCA was performed on the paired metabolite-difference profiles from 21 RS–CS pairs (Figure S3C). PC1 and PC2 explained 21.22% and 16.83% of the variation, respectively. The profiles separated according to site, whereas the three replicates within each site generally clustered together. PERMANOVA confirmed significant among-site differences in the paired RS–CS metabolite-difference profiles (pseudo-F = 7.83, R2 = 0.770, p = 0.001), with no significant difference in multivariate dispersion (PERMDISP, p = 0.519).
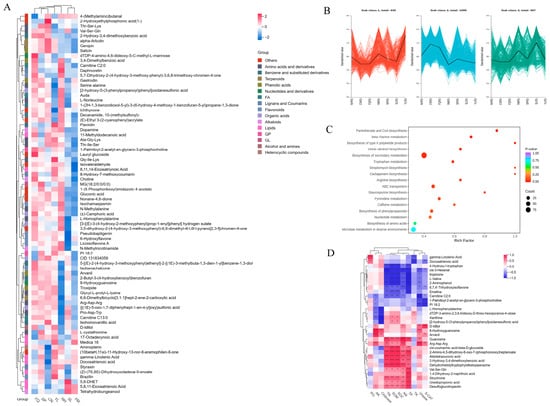
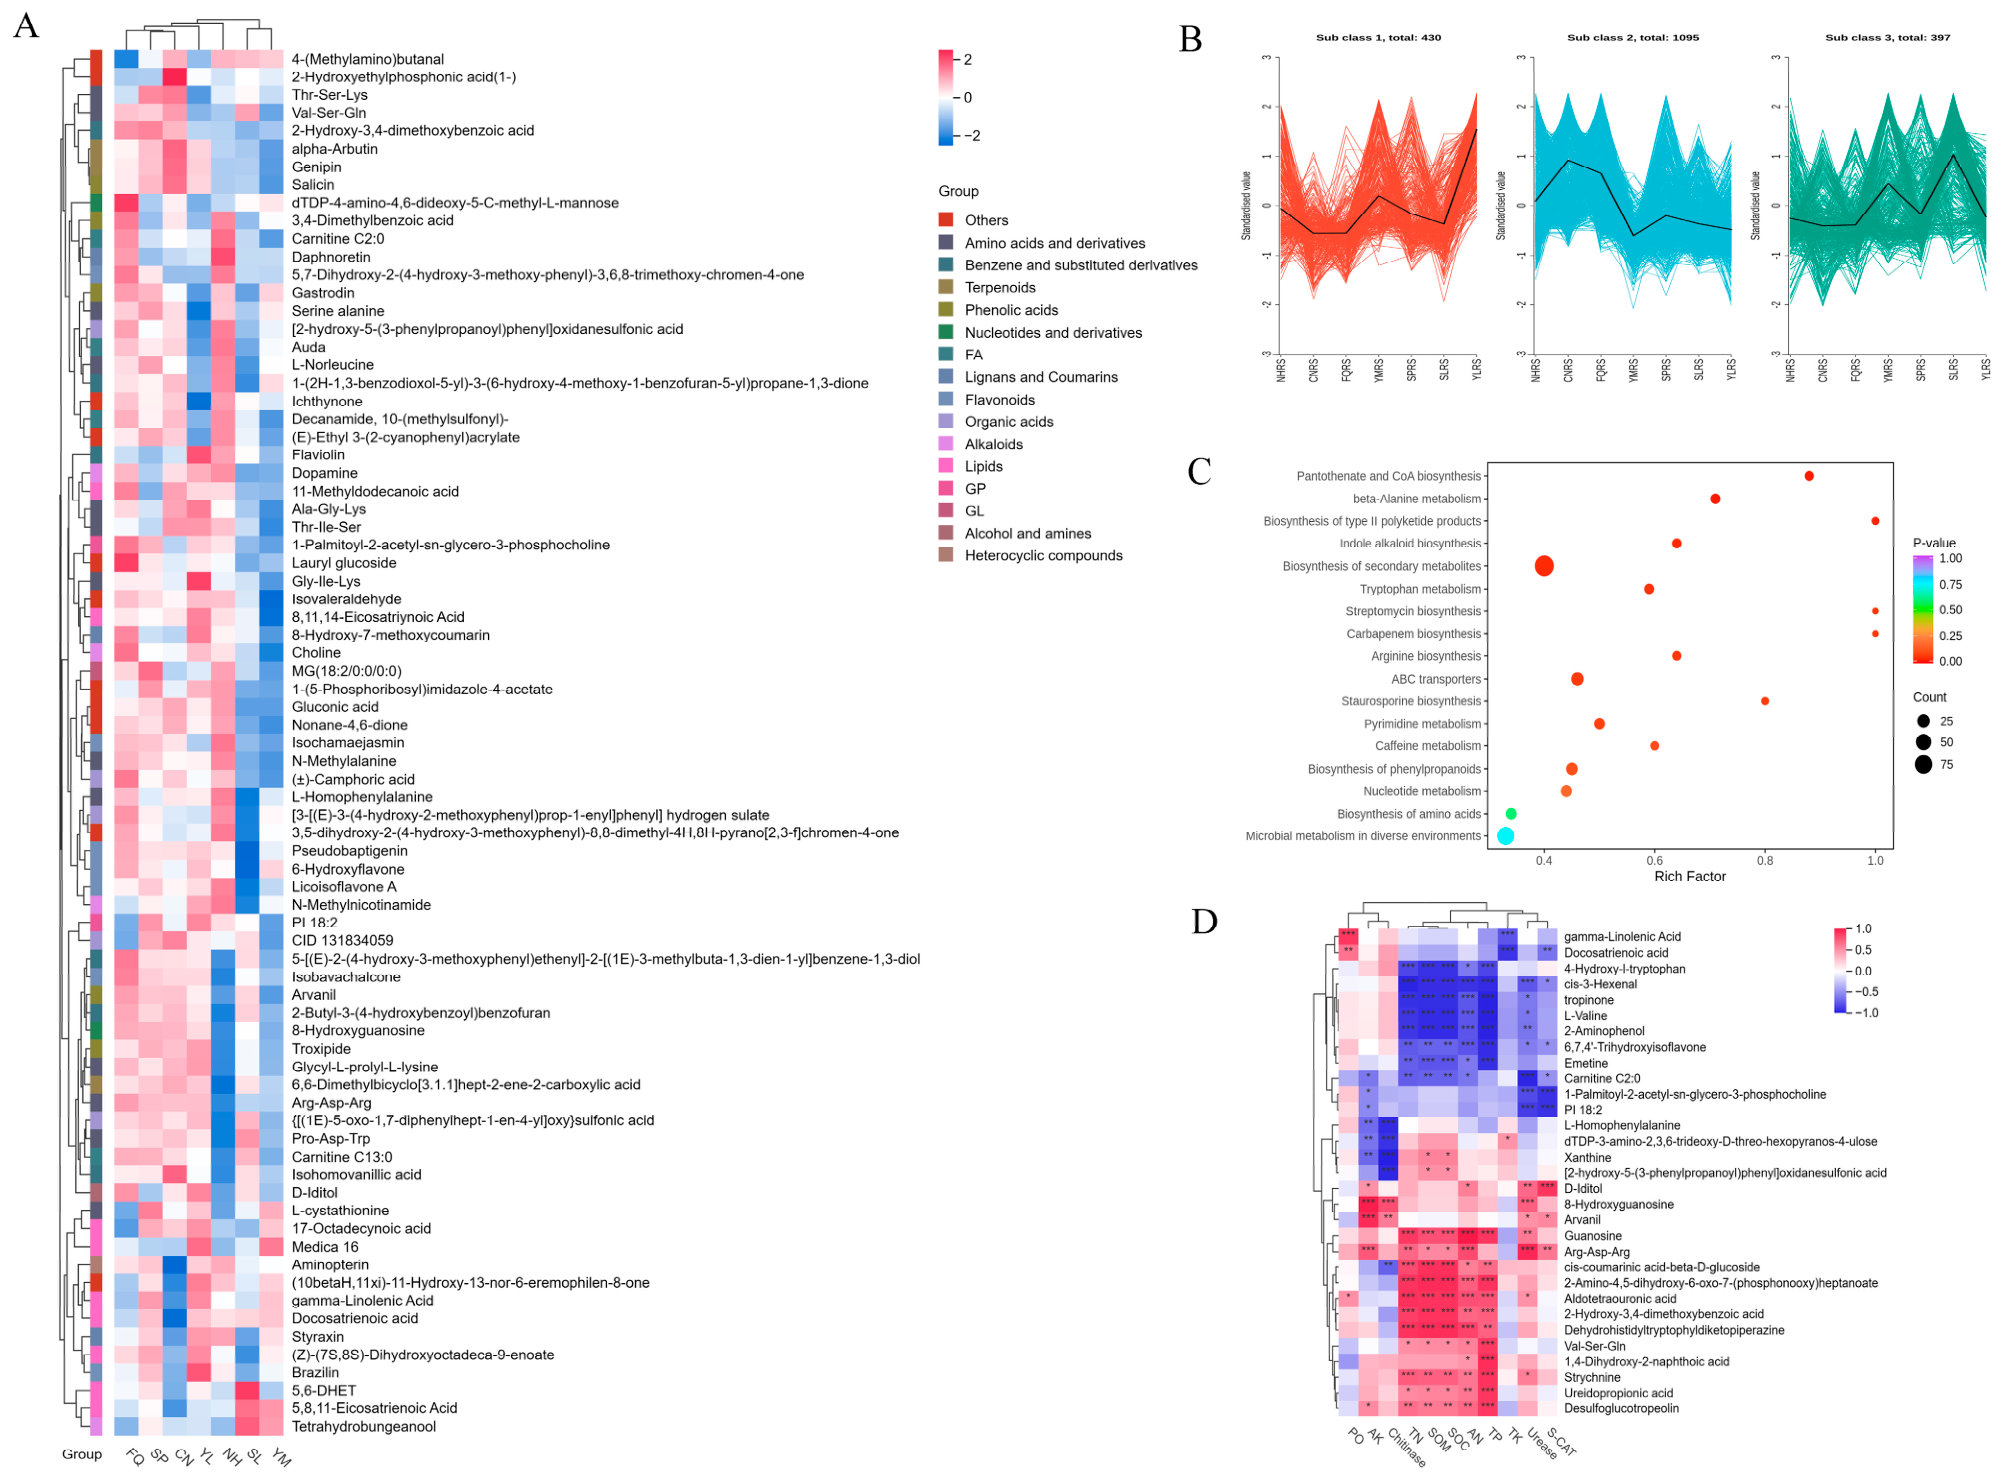
OPLS-DA was performed separately for paired comparisons between RS and CS samples at each of the seven sites. Pair-aware three-fold leave-one-pair-out cross-validation yielded CV Q2 values ranging from 0.9757 to 0.9964, with a classification accuracy of 100% at all seven sites. Exhaustive within-pair permutation testing yielded an exact p value of 0.25 at all sites, with consistent results across the two alternative feature profiles (Figure S1 and Table S3A,B). The Venn diagram showed that 77 differential metabolites were shared across all seven sites (Figure 1D). SL had the largest number of site-specific differential metabolites (207), whereas SP had the fewest (71). To characterize the site-dependent responses of the 77 shared metabolites, log2(RS/CS) values were calculated from the mean relative abundances of the three biological replicates at each site and visualized in a heatmap (Figure 2A). Many metabolites showed positive log2(RS/CS) values in FQ, SP, and CN, with some showing concordant enrichment across these sites, whereas most shared metabolites showed negative values in YM. SL, NH, and YL showed mixed positive and negative responses. Thus, the 77 metabolites were shared across the seven site-specific comparisons, but the direction and magnitude of their changes varied among sites.
Figure 2.
Characteristics of differential metabolites in T. ganbajun mycosphere soils from different geographic sites. (A) Heatmap showing the response patterns of shared differential metabolites in mycosphere soils relative to adjacent control soils; (B) K-means clustering of differential metabolites; (C) KEGG pathway enrichment analysis of differential metabolites; (D) correlation analysis between candidate metabolites and soil environmental factors. Asterisks indicate the significance levels of correlations based on BH-adjusted Q values (* Q < 0.05, ** Q < 0.01, *** Q < 0.001).
To further characterize metabolic differences among RS samples from different geographic sites, OPLS-DA was performed using the seven sites as comparison groups (Figure S2). The corresponding RS-only classification validation showed CV Q2 values of 0.9631–0.9653, an accuracy of 100%, and permutation p values of 0.001 across the three feature profiles (Table S3C). A total of 1922 differential metabolites were identified using a VIP score >1 and p < 0.05 as screening criteria, followed by K-means clustering analysis (Figure 2B). After BH adjustment across all 6792 valid ANOVA tests from the complete set of 6822 LC–MS features, 1915 of the 1922 initially screened metabolites (99.64%) remained statistically significant (Q < 0.05), indicating that the initial selection was largely robust to full-family multiple-testing correction. The differential metabolites were classified into three clusters. Cluster 1 contained 430 metabolites, which showed the highest standardized levels in YL and mainly comprised aromatic and phenolic compounds, amino acids and their derivatives, and organic acids. Cluster 2 contained 1095 metabolites, which showed the highest standardized levels in CN and the lowest abundance in YM; these metabolites mainly comprised amino acids and their derivatives, aromatic and phenolic compounds, and organic acids. The 397 metabolites in Cluster 3 showed the highest standardized levels in SL and mainly comprised amino acids and their derivatives, aromatic and phenolic compounds, and lipids. Overall, the different clusters exhibited distinct patterns of variation, further indicating pronounced geographic differentiation in the metabolic composition of RSs.
To identify the major biological processes associated with metabolic differences among RSs, the differential metabolites obtained from the multigroup comparison were subjected to Kyoto Encyclopedia of Genes and Genomes (KEGG) pathway enrichment analysis (Figure 2C). Significantly enriched pathways included beta-alanine metabolism, tryptophan metabolism, arginine biosynthesis, phenylpropanoid biosynthesis, indole alkaloid biosynthesis and pyrimidine metabolism. These results were consistent with the predominance of amino acids and their derivatives and aromatic and phenolic compounds in the K-means clusters, indicating that metabolic differences among RSs from different sites were mainly associated with nitrogen-containing metabolism, aromatic metabolism, and secondary metabolic processes.
To further examine the relationships between soil environmental factors and key metabolites, the differential metabolites shared across the seven RS–CS comparisons were integrated with metabolites involved in key KEGG pathways among the differential metabolites identified across RSs, yielding 202 candidate metabolites. Spearman correlation analysis was then performed between these metabolites and the physicochemical properties and enzyme activities of RSs. Using |ρ| ≥ 0.8 and Q < 0.05 as the screening criteria, 31 metabolites showed strong and significant correlations with at least one soil variable (Figure 2D). Correlation clustering revealed similar patterns for TN, SOM, SOC, AN and TP. Metabolites including 4-Hydroxy-L-tryptophan, cis-3-Hexenal, tropinone, L-Valine, 2-Aminophenol, 6,7,4′-Trihydroxyisoflavone, and Emetine were generally negatively correlated with these nutrient variables, whereas Guanosine, Arg-Asp-Arg, cis-coumarinic acid-β-D-glucoside, 2-Hydroxy-3,4-dimethoxybenzoic acid, and Dehydrohistidyltryptophyldiketopiperazine were predominantly positively correlated. In contrast, the correlation patterns of PO, chitinase, urease, and S-CAT with metabolites were more dispersed, with several lipids, nucleosides, and other metabolites showing significant correlations with these enzyme activities.
3.3. Bacterial and Fungal Community Characteristics in T. ganbajun Mycosphere Soils
3.3.1. Diversity and Composition of Bacterial and Fungal Communities
16S rRNA gene amplicon sequencing of 21 RS samples from the seven geographic sites yielded 2,457,038 raw reads. After merging, quality filtering, and chimera removal, 2,326,577 high-quality sequences were retained (93,864–125,661 per sample; mean retention rate, 94.69%), yielding 28,369 OTUs at a 97% sequence similarity threshold. Fungal ITS2 amplicon sequencing yielded 2,147,270 raw reads, of which 1,946,902 high-quality sequences were retained after merging, quality filtering, denoising, and chimera removal (63,110–109,523 per sample; mean retention rate, 90.67%). DADA2 denoising yielded 6805 ASVs. Good’s coverage ranged from 97.44% to 98.53% for bacteria and was 1.000 for fungi.
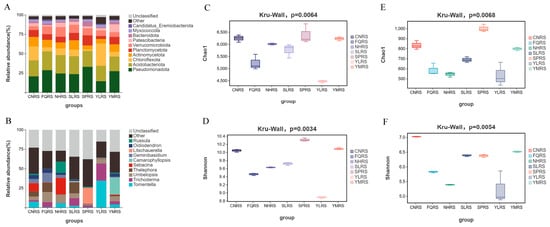
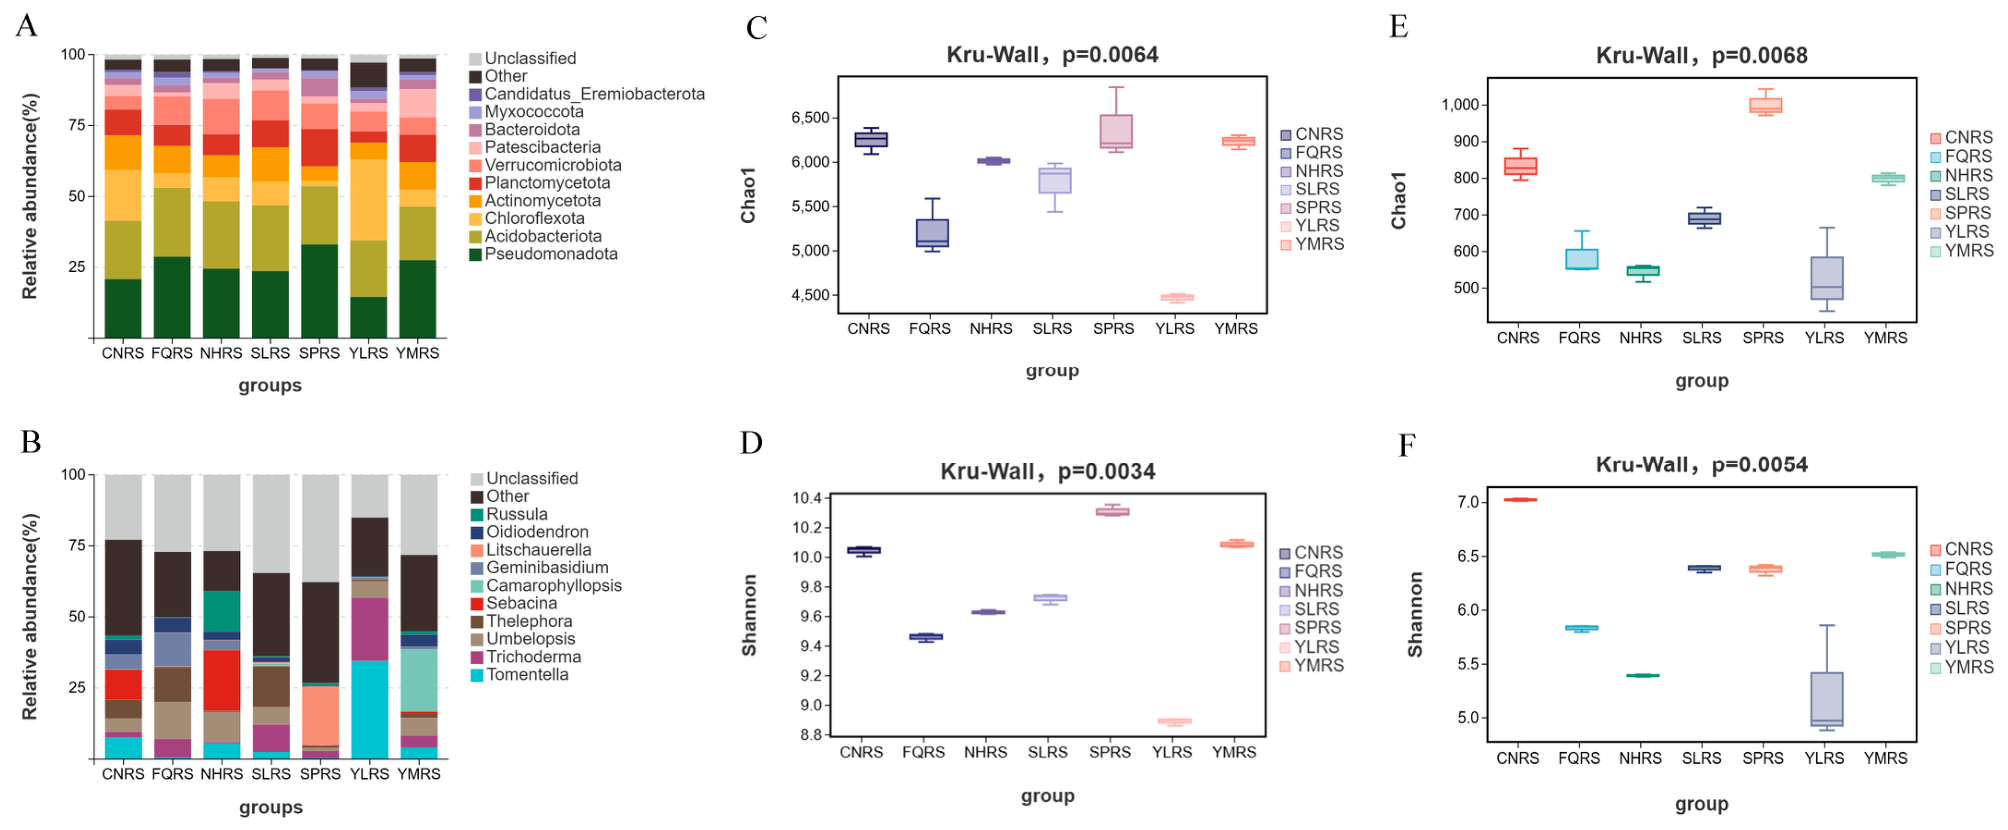
Bacterial and fungal community compositions in RSs varied among geographic sites (Figure 3A,B). At the phylum level, bacterial communities were dominated by Pseudomonadota, Acidobacteriota, Chloroflexota, Actinomycetota, and Planctomycetota. These major phyla were shared across sites, but their relative abundances differed: Pseudomonadota was more abundant in SPRS, whereas YLRS showed a higher proportion of Chloroflexota and a lower proportion of Pseudomonadota. At the genus level, the major annotated fungal genera included Tomentella, Trichoderma, Umbelopsis, Thelephora, Sebacina, Camarophyllopsis, Geminibasidium, Litschauerella, Oidiodendron, and Russula. Their relative abundances varied among sites: Tomentella and Trichoderma were relatively abundant in YLRS, Camarophyllopsis in YMRS, and Litschauerella in SPRS; Russula and Sebacina were relatively abundant in NHRS, whereas Thelephora was relatively abundant in FQRS and SLRS.
Figure 3.
Bacterial and fungal community composition and alpha diversity in T. ganbajun mycosphere soils from different geographic sites. (A) Relative abundance of bacterial communities at the phylum level; (B) relative abundance of fungal communities at the genus level; (C) Chao1 richness index of bacterial communities; (D) Shannon diversity index of bacterial communities; (E) Chao1 richness index of fungal communities; (F) Shannon diversity index of fungal communities.
Both bacterial and fungal alpha-diversity indices differed significantly among the seven sites (Figure 3C–F). For bacteria, Chao1 values were relatively high in CNRS, SPRS, and YMRS, and lower in FQRS and YLRS, with YLRS showing the lowest richness. The Shannon index was highest in SPRS, followed by YMRS and CNRS, and lowest in YLRS. For fungi, Chao1 richness was highest in SPRS, relatively high in CNRS and YMRS, and lower in YLRS, NHRS, and FQRS. The fungal Shannon index was highest in CNRS, followed by YMRS, SLRS, and SPRS, whereas YLRS had the lowest value. Overall, YLRS showed relatively low bacterial and fungal richness and diversity, whereas SPRS generally exhibited relatively high microbial richness and diversity. The differences in all four alpha-diversity indices among the seven sampling sites remained significant across all 1000 rarefaction iterations (p < 0.05; Supplementary Table S2).
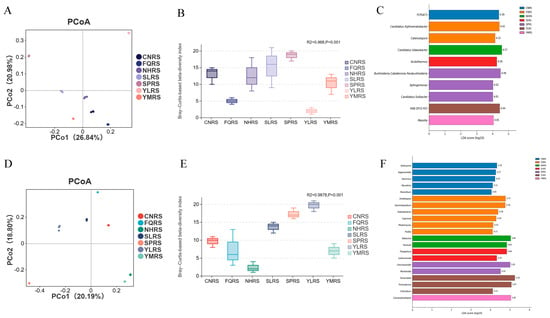
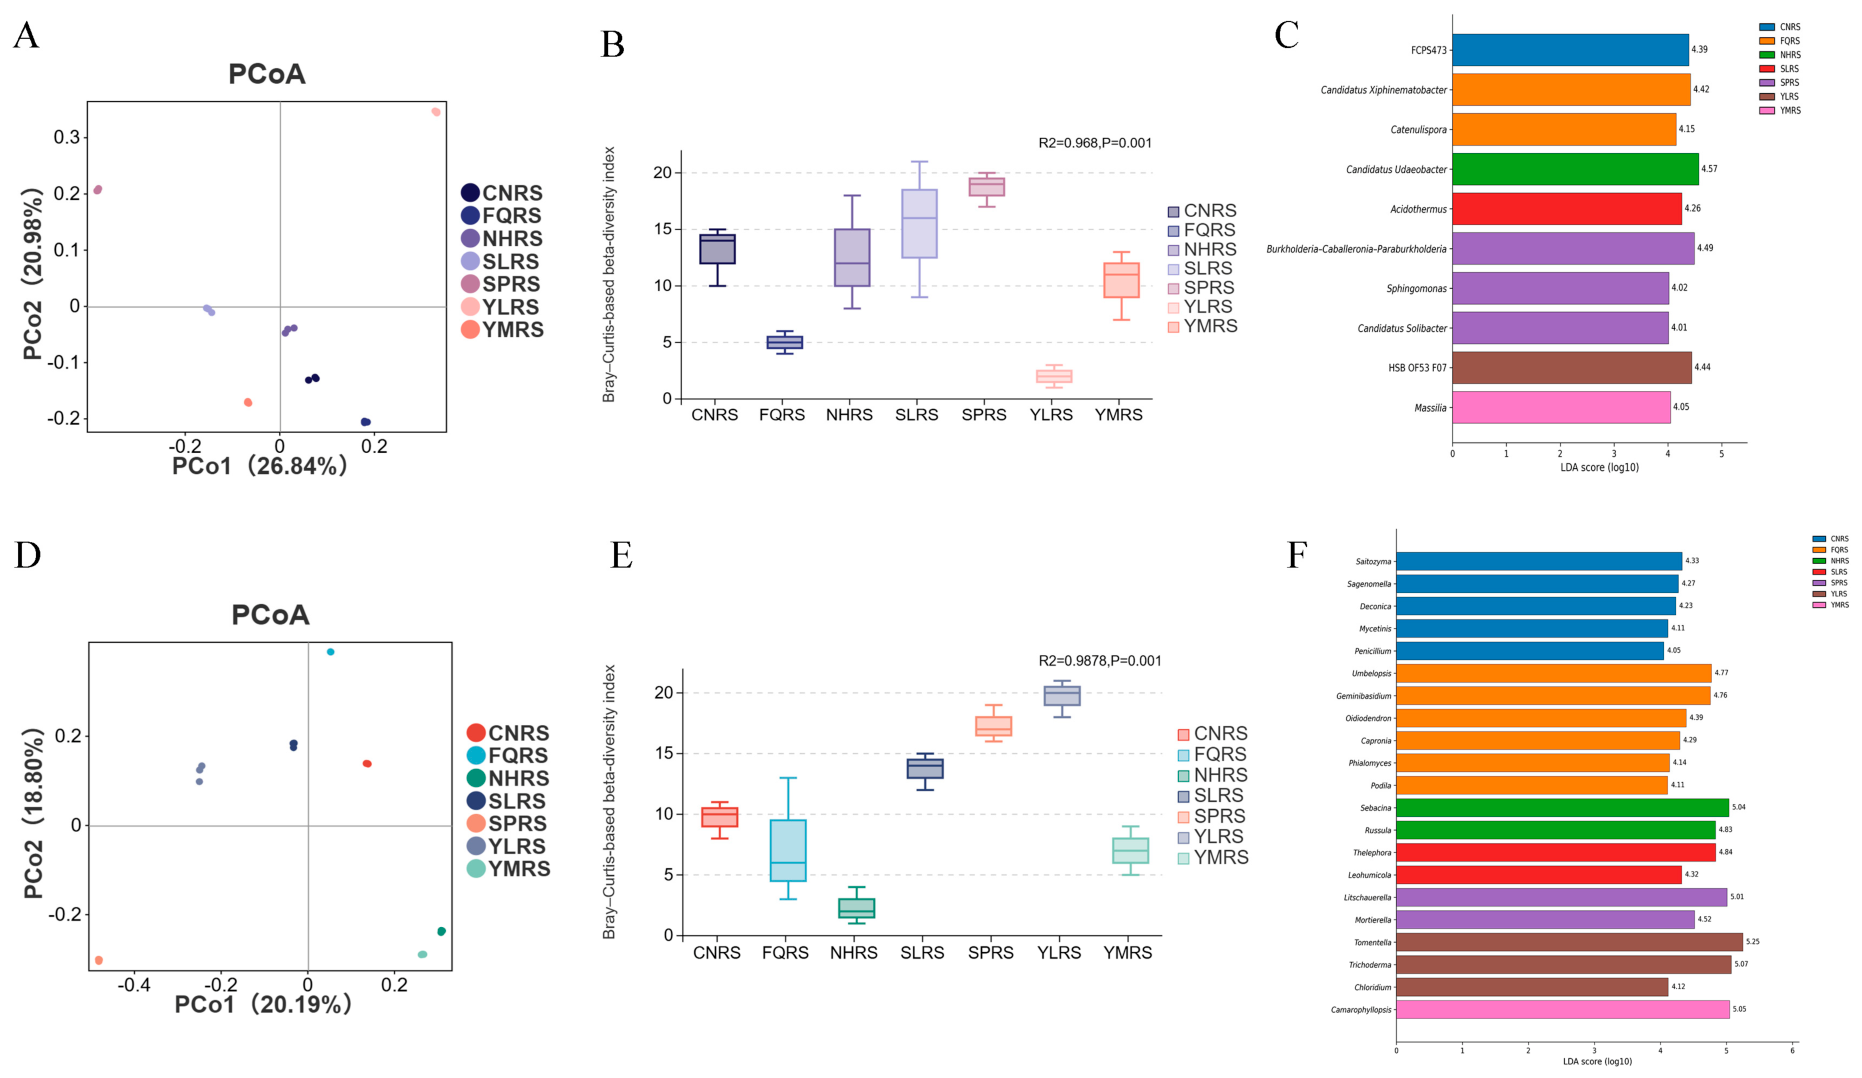
Bray–Curtis-based PCoA showed geographic differentiation in both bacterial and fungal community structures. For bacteria, PCoA1 and PCoA2 explained 26.84% and 20.98% of the variation, respectively (Figure 4A), with samples separated by site and replicates from the same site generally clustering together. PERMANOVA confirmed significant among-site differences in bacterial community structure (Figure 4B; R2 = 0.968, p = 0.001). For fungi, PCoA1 and PCoA2 explained 20.19% and 18.80% of the variation, respectively (Figure 4D), with samples forming distinct site-associated clusters. PERMANOVA also showed significant among-site differences in fungal community structure (Figure 4E; R2 = 0.988, p = 0.001). PERMDISP detected no significant differences in multivariate dispersion among sites for either bacteria (F6,14 = 1.810, p = 0.153) or fungi (F6,14 = 1.767, p = 0.063).
Figure 4.
Bacterial and fungal community diversity and differential taxa in T. ganbajun mycosphere soils from different geographic sites. (A) PCoA of bacterial communities based on Bray–Curtis dissimilarities; (B) PERMANOVA of bacterial community structure based on Bray–Curtis dissimilarities; (C) LEfSe analysis of differential bacterial taxa; (D) PCoA of fungal communities based on Bray–Curtis dissimilarities; (E) PERMANOVA of fungal community structure based on Bray–Curtis dissimilarities; (F) LEfSe analysis of differential fungal taxa.
3.3.2. Differential Microbial Taxa in Mycosphere Soils from Different Geographic Sites
Genus-level LEfSe analysis identified 10 characteristic bacterial taxa among the seven sites using an LDA score threshold of ≥4.0 (Figure 4C). FCPS473 characterized CNRS, whereas Candidatus Xiphinematobacter and Catenulispora characterized FQRS. Candidatus Udaeobacter was characteristic of NHRS, and Acidothermus of SLRS. SPRS was characterized by Burkholderia–Caballeronia–Paraburkholderia, Sphingomonas, and Candidatus Solibacter. HSB OF53-F07 characterized YLRS, whereas Massilia was characteristic of YMRS.
Fungal LEfSe analysis identified 21 characteristic genera (p < 0.05, LDA score ≥ 4.0; Figure 4F). CNRS was characterized by Saitozyma, Sagenomella, Deconica, Mycetinis, and Penicillium, whereas FQRS was characterized by Umbelopsis, Geminibasidium, Oidiodendron, Capronia, Phialomyces, and Podila. Sebacina and Russula were characteristic of NHRS, while Thelephora and Leohumicola characterized SLRS. Litschauerella and Mortierella had relatively high LDA scores in SPRS. YLRS was characterized by Tomentella, Trichoderma, and Chloridium, with Tomentella showing the highest LDA score (5.25). Camarophyllopsis was characteristic of YMRS. More characteristic genera were identified for fungi than for bacteria (21 vs. 10).
3.3.3. Relationships Between Microbial Communities and Soil Environmental Factors
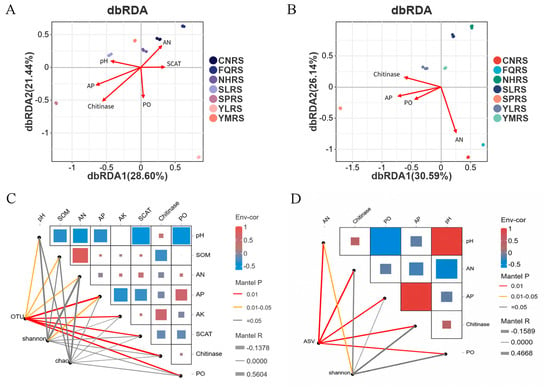
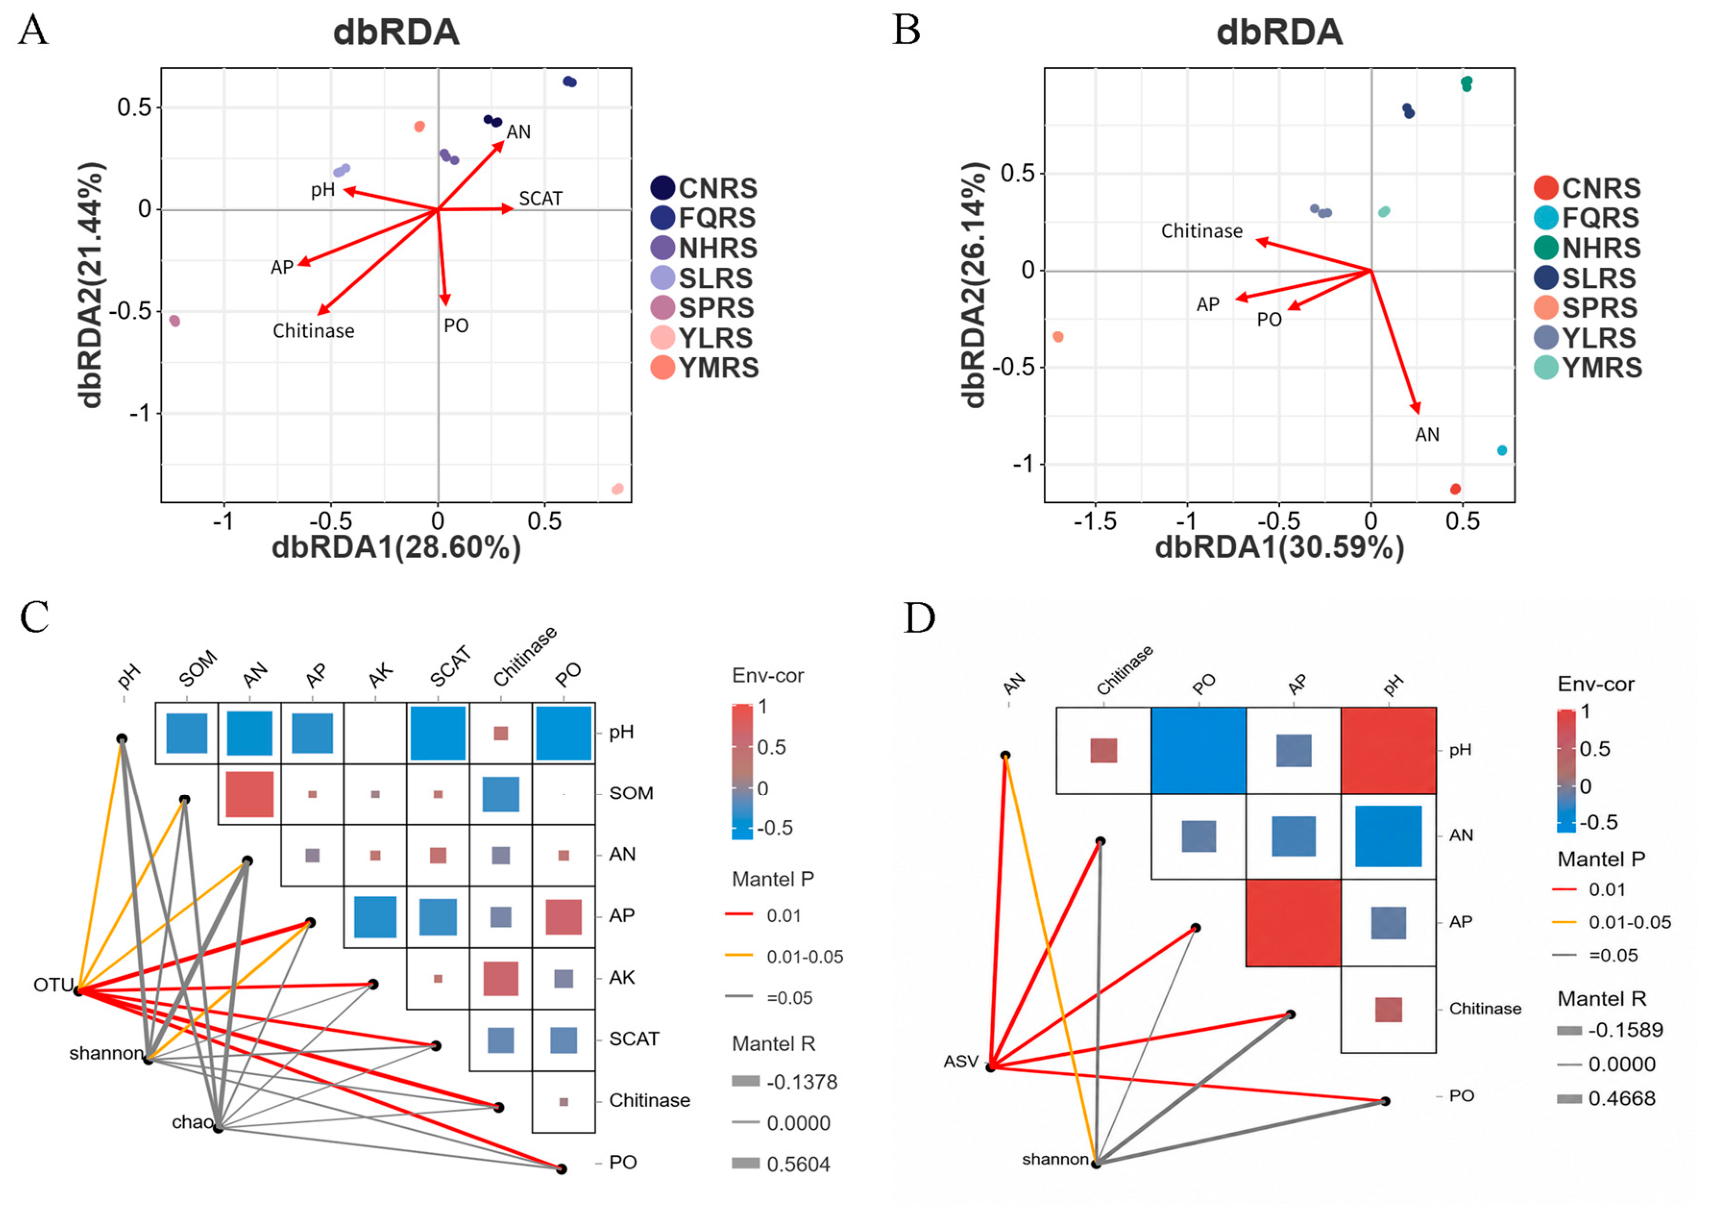
After excluding highly collinear variables (VIF ≥ 10), db-RDA1 and db-RDA2 explained 28.60% and 21.44% of bacterial community variation, respectively, accounting for 50.04% cumulatively (Figure 5A). Permutation tests showed that pH, AN, and AP were significantly associated with bacterial community structure (p = 0.001), whereas S-CAT, chitinase, and PO were not significant.
Figure 5.
Relationships between environmental factors and bacterial and fungal community structure in T. ganbajun mycosphere soils from different geographic sites. (A) db-RDA of bacterial community structure and environmental factors; (B) db-RDA of fungal community structure and environmental factors; (C) Mantel test analysis of relationships between environmental factors and bacterial community characteristics; (D) Mantel test analysis of relationships between environmental factors and fungal community characteristics.
For fungal communities, db-RDA1 and db-RDA2 explained 30.59% and 26.14% of the variation, respectively, with a cumulative explained variation of 56.73% (Figure 5B). After VIF screening, AN, AP, chitinase, and PO were retained in the final model. AN and AP were significantly associated with fungal community structure (p = 0.001), whereas chitinase and PO were not significant. The AN vector extended mainly toward the positive direction of db-RDA1 and the negative direction of db-RDA2, whereas the AP vector extended primarily along the negative direction of db-RDA1.
To further characterize the relationships between soil environmental factors and microbial communities, Spearman correlation analysis was used to assess correlations among environmental variables, and Mantel tests were used to evaluate the relationships of environmental factors with microbial community composition and alpha diversity. For bacterial communities (Figure 5C), OTU-level community composition was significantly correlated with all eight environmental factors analyzed, whereas the Shannon index was significantly correlated only with AP, and no significant Mantel correlations were detected between the Chao1 index and any environmental factor. For fungal communities (Figure 5D), ASV-level community composition was significantly correlated with AN, chitinase, PO, AP, and pH, whereas the Shannon index was significantly correlated only with AN. The Spearman correlation matrix also revealed pronounced covariation among soil environmental factors, indicating that these environmental gradients were not independent of one another.
3.4. Associations Among Soil Environmental Factors, Metabolites, and Microbial Communities
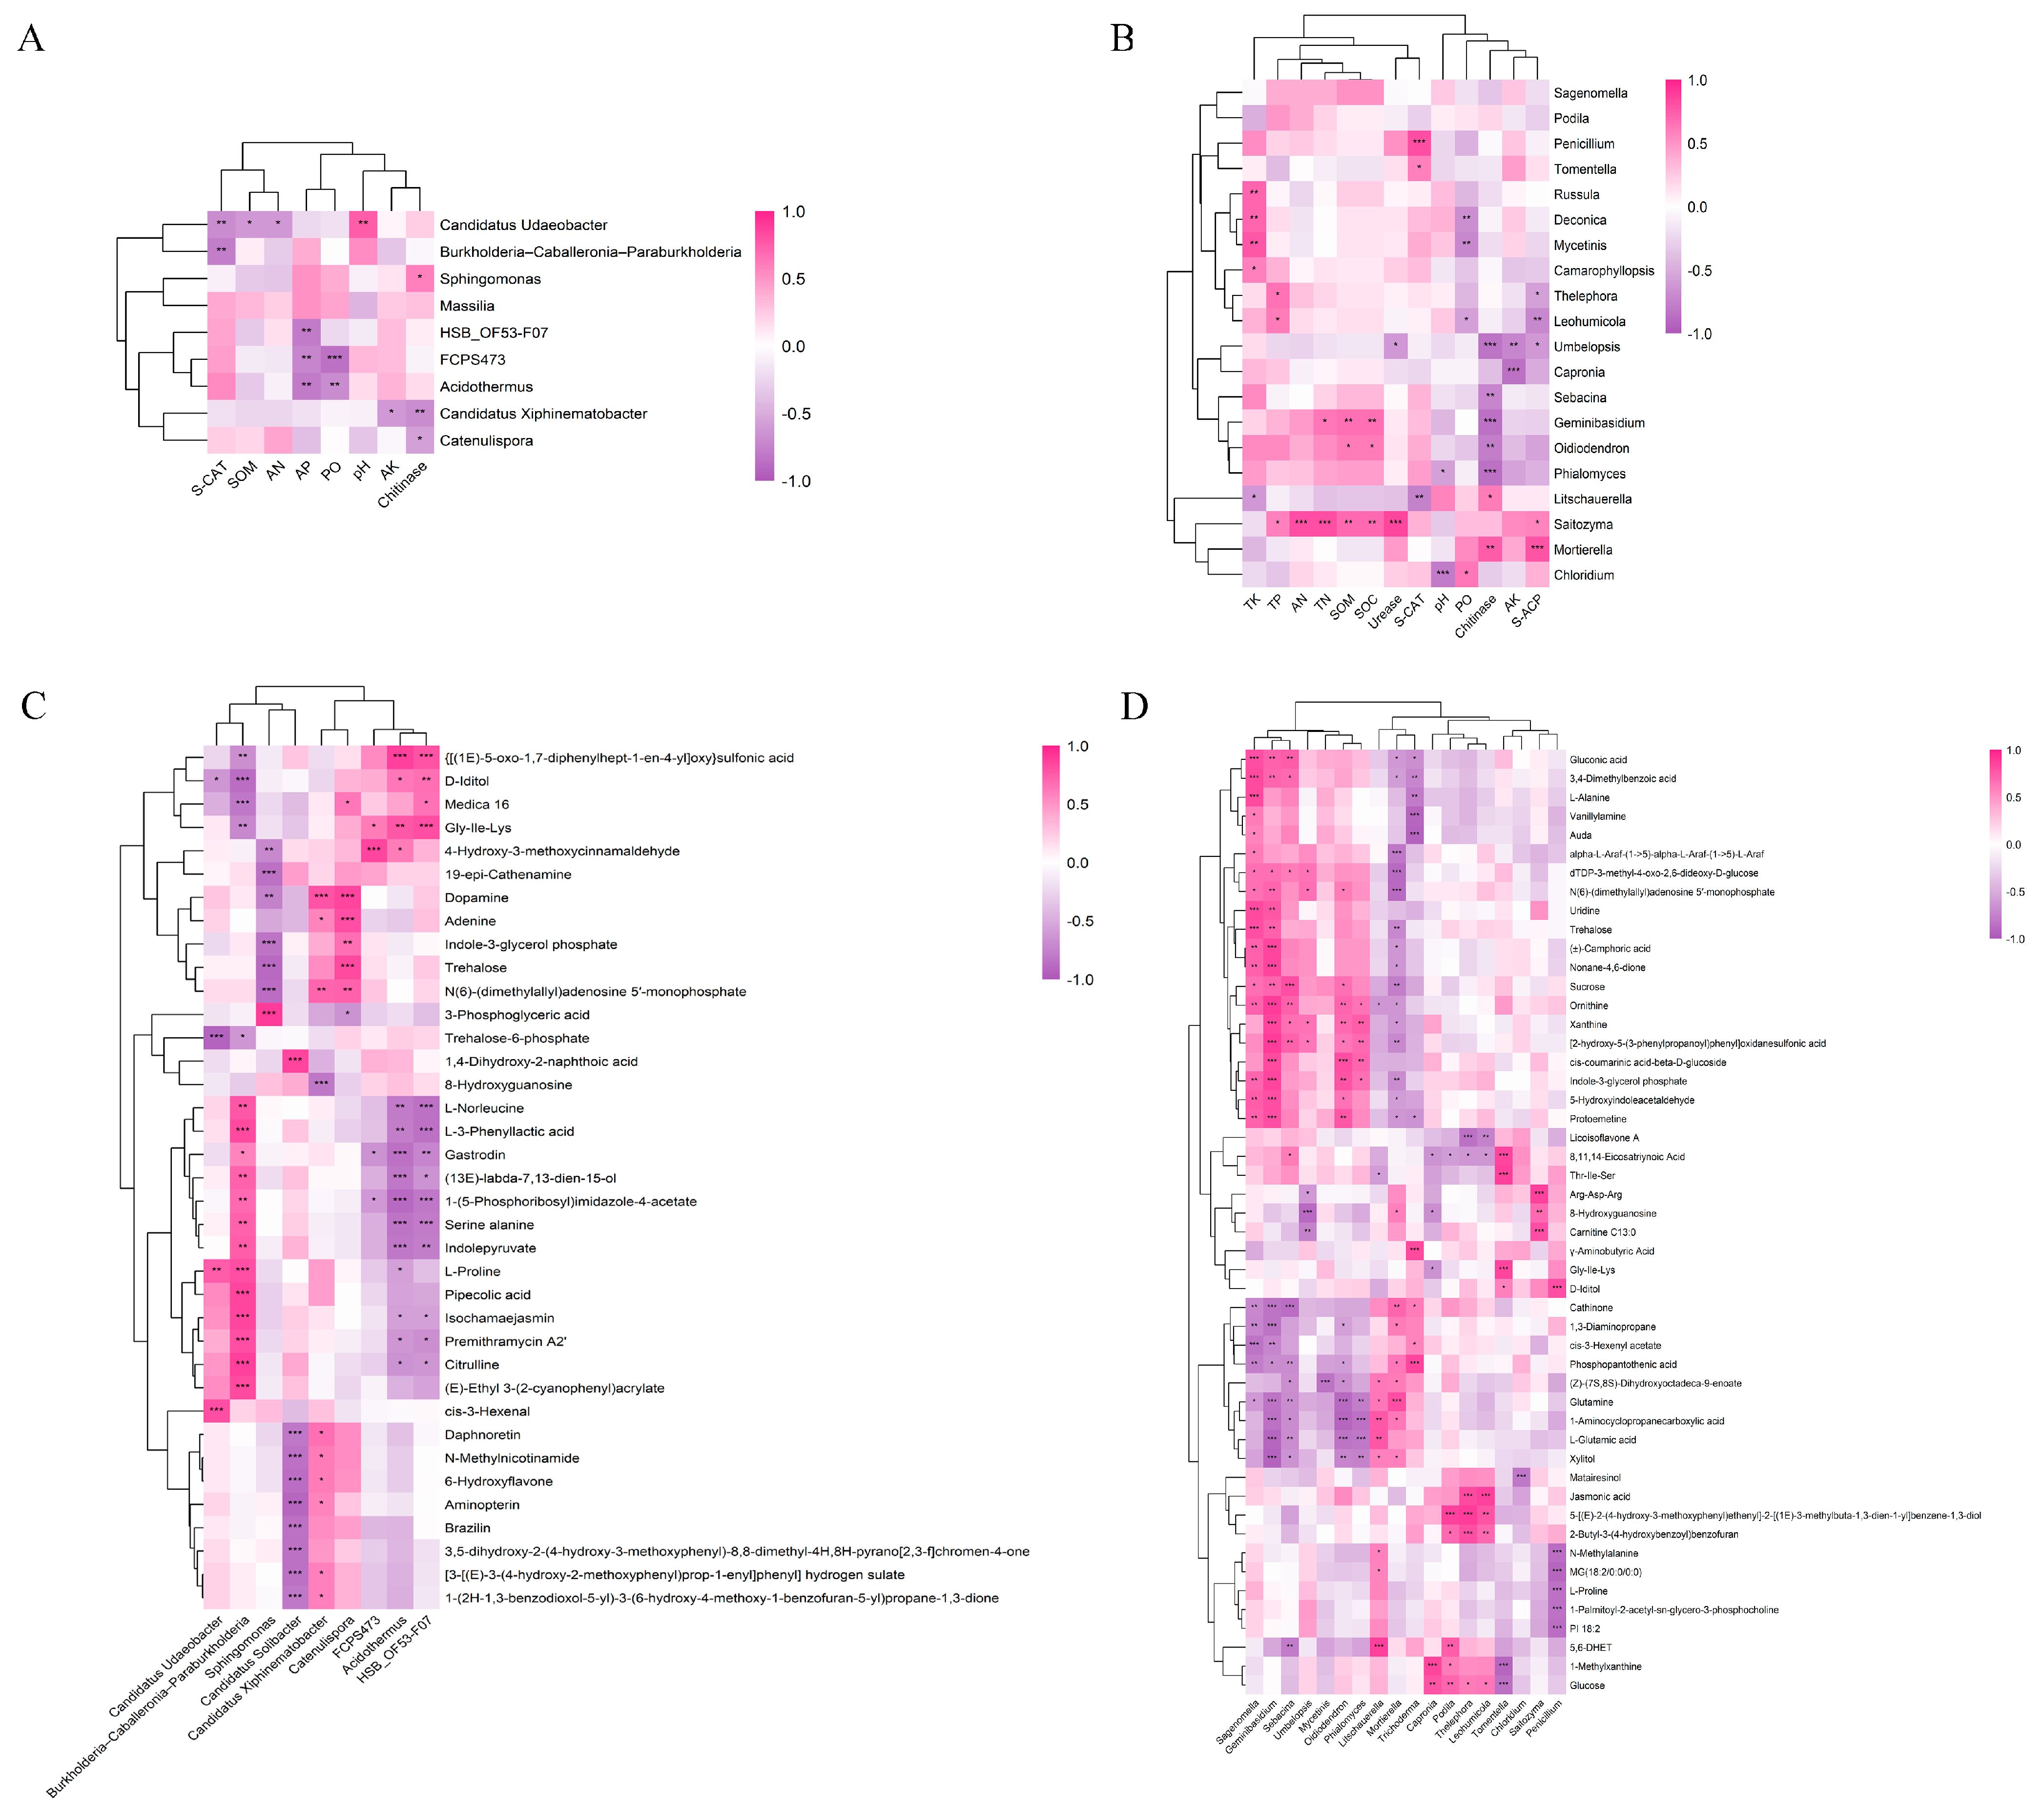
Spearman correlation analysis revealed distinct associations between characteristic bacterial genera and soil environmental variables (|ρ| ≥ 0.5, BH-adjusted Q < 0.05; Figure 6A). Candidatus Udaeobacter was negatively correlated with S-CAT, SOM, and AN but positively correlated with pH. Burkholderia–Caballeronia–Paraburkholderia was negatively correlated with S-CAT, whereas Sphingomonas was positively correlated with chitinase. FCPS473 and Acidothermus were negatively correlated with AP and PO.
Figure 6.
Associations among microbial taxa, environmental factors, and metabolites in T. ganbajun mycosphere soils from different geographic sites. (A) Correlation heatmap between key bacterial taxa and soil environmental factors; (B) correlation heatmap between key fungal taxa and soil environmental factors; (C) correlation heatmap between key metabolites and key bacterial taxa; (D) correlation heatmap between key metabolites and key fungal taxa. Asterisks indicate the significance levels of correlations based on BH-adjusted Q values (* Q < 0.05, ** Q < 0.01, *** Q < 0.001).
Characteristic fungal genera also showed distinct associations with soil environmental variables (|ρ| ≥ 0.5, BH-adjusted Q < 0.05; Figure 6B). Saitozyma was positively correlated with TN, TP, AN, SOM, SOC, and urease. Thelephora was positively correlated with TP but negatively correlated with S-ACP, whereas Umbelopsis was negatively correlated with urease, chitinase, AK, and S-ACP.
Strong associations were also observed between characteristic bacterial genera and candidate metabolites (|ρ| ≥ 0.8, BH-adjusted Q < 0.05; Figure 6C). Burkholderia–Caballeronia–Paraburkholderia was positively correlated with L-3-Phenyllactic acid, L-Proline, Pipecolic acid, and Citrulline. Other notable associations involved D-Iditol, Gly-Ile-Lys, Adenine, Trehalose, and Indole-3-glycerol phosphate, with correlation directions varying among genera.
Characteristic fungal genera also showed strong associations with candidate metabolites (|ρ| ≥ 0.8, BH-adjusted Q < 0.05; Figure 6D). Sagenomella was positively correlated with gluconic acid, L-alanine, and trehalose, whereas Geminibasidium was positively correlated with ornithine, xanthine, and indole-3-glycerol phosphate. Additional associations involved phosphopantothenic acid, glutamine, 1-aminocyclopropanecarboxylic acid, and L-glutamic acid, as well as other characteristic genera, including Thelephora, Tomentella, Mortierella, Sebacina, and Oidiodendron.
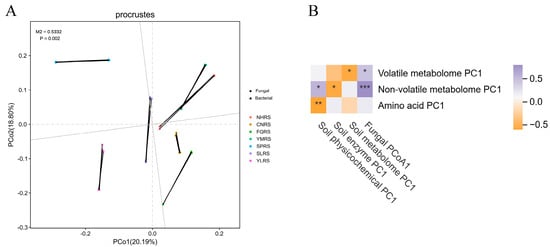
Procrustes analysis was used to assess the concordance between bacterial and fungal community structures across different geographic sites (Figure 7A). The results showed a significant correlation between the ordination structures of the two microbial communities (M2 = 0.5332, p = 0.002). The patterns of variation among sites were largely consistent between the two ordinations, indicating that bacterial and fungal communities exhibited concordant geographic differentiation. The relationships between soil characteristics and the metabolic phenotypes of T. ganbajun fruiting bodies were further examined (Figure 7B). The results showed that different fruiting-body metabolic phenotypes were not uniformly associated with the belowground environment. The volatile metabolome was significantly associated with both the soil metabolome and fungal communities, suggesting that variation in fruiting-body aroma compounds among geographic sites may be related not only to soil nutrient status but also to the chemical and biological environments surrounding the mycelia.
Figure 7.
Associations between belowground ecological characteristics and fruiting-body metabolic phenotypes of T. ganbajun across different geographic sites. (A) Procrustes analysis of bacterial and fungal community structures based on Bray–Curtis dissimilarities; (B) correlation analysis between belowground environmental characteristics and fruiting-body metabolic phenotypes based on paired mycosphere soil and fruiting-body samples. Asterisks indicate the significance levels of correlations based on BH-adjusted Q values (* Q < 0.05, ** Q < 0.01, *** Q < 0.001).
4. Discussion
4.1. Differences in Soil Metabolite Composition and Their Environmental Associations
In this study, metabolite composition differed between RS and CS, but the specific patterns of variation differed among geographic sites. Similar differences in the belowground chemical environment have been reported in studies of plant rhizospheres. For example, organic acids were relatively abundant in peony rhizosphere soils, whereas the proportion of lipid-related metabolites was lower [23]. A study of maize rhizospheres found that various aromatic carboxylic acids were concentrated on root surfaces and in the surrounding soil, indicating that plant-derived aromatic metabolites can enter and persist in rhizosphere microsites [24]. Rhizosphere bacteria associated with wild oat (Avena barbata) exhibit selective preferences for utilizing aromatic organic acids, and these differences in substrate utilization are closely associated with rhizosphere bacterial community assembly [25]. These studies provide a useful reference for interpreting the differences in soil metabolite composition observed in the present study. However, the specific sources and transformation processes of individual compounds in soils associated with T. ganbajun remain to be clarified.
In addition, the higher proportion of terpenes in RS may be associated with microbial interactions. Using a sorghum rhizobox experiment, Chou et al. found that different monoterpenes and sesquiterpenes exerted distinct effects on rhizosphere bacterial and fungal communities, with these effects depending on terpene identity, application concentration, and exposure duration. The same terpene could promote the growth of certain fungi while inhibiting other microorganisms [26].
Metabolic differences among RSs from different geographic sites mainly involved amino acid metabolism, nitrogen-containing compound metabolism, and aromatic and secondary metabolic processes. Similar changes in amino acid and secondary metabolism have also been observed in other ectomycorrhizal systems, where these processes have been suggested to be associated with material exchange during symbiosis, host defense, and environmental adaptation [27]. Meanwhile, the distinct correlation patterns between soil variables and candidate metabolites observed in this study are consistent with previous rhizosphere studies. Significant associations between soil physicochemical properties and metabolite composition have been reported in peony rhizosphere soils [23], while a multi-site study of Scutellaria baicalensis found that different soil factors were associated with overall metabolite composition and that individual metabolites could exhibit distinct or even opposing responses to environmental conditions [28]. These findings suggest that soil metabolite composition is associated with environmental variation and exhibits pronounced geographic differences. However, the specific processes underlying these relationships cannot be established from correlation analyses alone.
4.2. Geographic Differentiation of Microbial Communities and Their Relationships with Soil Environment
This study revealed pronounced geographic differentiation in bacterial and fungal communities in mycosphere soils from different sites, with some ectomycorrhizal fungal taxa exhibiting distinct discriminatory patterns among sites. A study of ectomycorrhizal roots in the Ailao Mountains of Yunnan found that Russulales and Thelephorales were major fungal groups and indicated that ectomycorrhizal fungal community composition was jointly influenced by host plants and local environmental conditions [29]. Studies across different forest types have also shown that major lineages, including Sebacina, Tomentella–Thelephora, and Russula–Lactarius, exhibit distinct responses to soil pH, moisture, and carbon and nitrogen conditions [30]. These findings provide an ecological context for understanding the distribution of characteristic fungal taxa across the geographic sites examined in this study.
In addition, Mortierella was identified as one of the characteristic taxa at the Shiping site. Previous research isolated Mortierella strains with strong phosphorus-solubilizing capacity from poplar rhizosphere soils, indicating that some members of this genus may participate in the transformation of poorly soluble phosphorus [31]. The characteristic bacterial taxa at Shiping also included Burkholderia–Caballeronia–Paraburkholderia and Sphingomonas. The genus complex Burkholderia–Caballeronia–Paraburkholderia has also been identified as an important bacterial group in matsutake (Tricholoma matsutake) habitat soils, where its distribution was associated with microbial networks and various metabolic processes. That study further indicated that forest type, soil physicochemical properties, and soil texture were associated with microbial community differences in matsutake habitats [32]. These findings provide clues for understanding the potential ecological roles of these taxa and their associations with soil environmental conditions, although their specific functions require further validation.
Analysis of environmental associations further showed that soil pH, AN, and AP were significantly associated with microbial community differentiation among mycosphere soils from different sites. Both AN and AP were significantly associated with bacterial and fungal community structure. A cross-regional nutrient-addition study showed that changes in nitrogen and phosphorus availability can significantly alter soil bacterial and fungal community composition [33], while soil pH is generally recognized as an important environmental factor influencing bacterial distributions [34]. Global-scale research has likewise identified soil pH and nutrient conditions as important environmental gradients shaping soil microbial community composition [35].
In this study, soil environmental conditions were more strongly associated with overall microbial community composition than with some alpha-diversity indices. This finding is consistent with forest soil research showing that different environmental factors vary in their explanatory power for community composition and alpha diversity [36]. Therefore, microbial community variation among geographic sites should not be characterized solely by differences in richness or diversity; the identities of specific taxa and their relationships with environmental gradients also need to be considered. Importantly, the taxa identified by LEfSe represent discriminant differences among mycosphere soils from different sites. Whether these taxa are specific to the T. ganbajun mycosphere or relatively enriched in mycosphere soils remains to be determined through further analysis incorporating microbial data from adjacent control soils.
4.3. Associations Between the Belowground Environment and Fruiting-Body Metabolic Phenotypes
This study revealed that different metabolic phenotypes of fruiting bodies exhibited distinct patterns of association with the belowground environment. The volatile metabolome was significantly associated with both the soil metabolome and fungal communities, suggesting that variation in fruiting-body aroma compounds among geographic sites may be related to both the belowground chemical and biological environments. Previous studies have reported associations between the microbial composition of mushroom fruiting bodies and the surrounding soil environment. In truffles, associated microorganisms may also participate in the formation of certain volatile compounds [37,38]. In contrast, the non-volatile metabolome was significantly associated with soil physicochemical properties, enzyme activities, and fungal communities, suggesting that these metabolites may be related to concurrent variation in belowground nutrient conditions, soil biochemical processes, and the microbial environment. Similar findings have been reported in cultivated Ganoderma lucidum, where fruiting-body metabolite composition was closely associated with soil pH, organic matter, available phosphorus, and multiple soil enzyme activities [39]. Free amino acids, in comparison, were primarily associated with soil physicochemical properties, suggesting that their variation among geographic sites may be more closely related to belowground nutrient conditions. However, the specific mechanisms underlying these associations require further investigation.
4.4. Ecological Implications and Future Research Directions
The results indicate that geographic differences among T. ganbajun habitats involve multiple dimensions of soil nutrient conditions, metabolite profiles, and microbial community composition rather than a single dominant nutrient or microbial group. In ectomycorrhizal systems, stable-isotope tracing has shown that host-derived carbon can be transferred to surrounding bacteria through fungal hyphae, with this transfer varying according to soil nitrogen availability [40]. Ectomycorrhizal fungi can also alter soil metabolite profiles and bacterial community composition [41], while their organic acid release may vary with mineral nutrient conditions and affect surrounding bacteria [42]. These processes provide a possible ecological context for the multidimensional patterns observed in T. ganbajun-associated soils.
Soil pH, AN, and AP repeatedly emerged as relevant environmental variables in this study and are candidate factors for future habitat assessments of T. ganbajun. Previous studies have linked soil pH and phosphorus availability to phosphatase activity and ectomycorrhizal fungal community responses [43], and shown that phosphorus limitation and nitrogen-to-phosphorus status can influence fungal investment in organic phosphorus acquisition [44]. Long-term nitrogen and phosphorus fertilization has also been reported to affect ectomycorrhizal fungal fruiting-body formation [45]. The suitable ranges of these variables and their relationships with consistent fruiting of T. ganbajun require further validation.
The key soil metabolites and characteristic microbial taxa identified here are candidates for further habitat studies. Bacterial strains from mycorrhizal microenvironments can either stimulate or inhibit fungal hyphal growth, with these effects varying according to substrate conditions [46]. Future studies could combine long-term habitat monitoring, targeted metabolite analysis, and functional validation of selected microbial taxa to evaluate their potential value in habitat assessment and conservation-oriented management of T. ganbajun.
Several limitations should be acknowledged. This study captured spatial differences among natural geographic sites during a single fruiting season. Associations among soil properties, metabolites, microbial communities, and fruiting-body metabolic phenotypes mainly reflected covariation across sites and may partly have been influenced by shared geographic background. Previous studies have shown that some ectomycorrhizal fungal genotypes can have broad spatial distributions within forest stands, while associated fungal communities may exhibit scale-dependent spatial autocorrelation [47,48]. In this study, the genetic independence of the three fruiting bodies sampled at each site was not verified, and the varying distances among sampling points may have influenced the assessment of within-site soil heterogeneity and microbial community differences. Furthermore, host-plant identities were not systematically determined, and species-specific molecular assays were not used to verify the presence of T. ganbajun mycelium in RS or its absence or reduced abundance in CS; therefore, RS–CS differences should not be interpreted as confirmed effects of fungal colonization. Soil microbial communities also exhibit temporal dynamics, and seasonal variation may influence fungal community assembly [49]. Future research could incorporate finer-scale spatial sampling and continuous monitoring across years and fruiting seasons at representative sites. Comparing the belowground ecological characteristics of areas with sustained fruiting and those with declining fruiting would help clarify how these factors relate to fruiting-body formation in T. ganbajun.
5. Conclusions
This study showed that differences in nutrient levels, enzyme activities, and metabolite profiles between RS and CS across seven sites in Yunnan Province were strongly site-dependent. The metabolite composition and bacterial and fungal communities of RS also exhibited significant geographic differentiation. Soil pH, AN, and AP repeatedly emerged in multiple analyses of environmental associations, with both AN and AP associated with bacterial and fungal community structure. The volatile, non-volatile, and free-amino-acid metabolic phenotypes of fruiting bodies were associated with different components of the belowground environment, indicating multilayered associations between belowground environmental characteristics and fruiting-body metabolic phenotypes. These findings provide a basis for understanding geographic variation in T. ganbajun habitats. Soil pH, AN, AP, and the associated metabolites and microbial taxa may serve as candidate indicators for future habitat assessment, although their indicator value and potential ecological roles require further validation.
Supplementary Materials
The following supporting information can be downloaded at: https://www.mdpi.com/article/10.3390/jof12110831/s1, Method S1: Detailed Soil Analysis Procedures; Figure S1: OPLS-DA score plots for pairwise comparisons between RS and CS soils at the seven geographic sites; Figure S2: OPLS-DA score plot of metabolomic profiles in Thelephora ganbajun mycosphere soils from seven geographic sites; Figure S3: Site-dependent differences between paired mycosphere and adjacent control soils. (A) Mean log2(RS/CS) values of soil properties and enzyme activities. (B) Site × soil type interaction tests. (C) PCA of paired soil metabolomic shifts across seven geographic sites; Table S1: Geographic coordinates and elevations of the sampling sites; Table S2: Sensitivity of alpha-diversity comparisons to sequencing-depth normalization by repeated rarefaction; Table S3: Validation and sensitivity analyses of RS–CS pair-aware and RS-only multigroup OPLS-DA models.
Author Contributions
L.S.: Writing—original draft, Formal analysis. S.Y. (Shimei Yang): Software, Visualization. F.W.: Investigation. S.Y. (Shunqing Yang): Data curation. R.Y.: Supervision. Q.Z.: Investigation. M.G.: Project administration, Writing—review & editing. All authors have read and agreed to the published version of the manuscript.
Funding
This work was supported by the International Joint Laboratory for Green Production Technology of Special Fruits and Vegetables in Yunnan Province (202403AP140018) and the Gui Mingying Expert Workstation.
Data Availability Statement
Raw sequence reads of the bacterial 16S rRNA gene and fungal ITS2 amplicons generated in this study have been deposited in the NCBI Sequence Read Archive under BioProject accession number PRJNA1551744.
Conflicts of Interest
The authors declare no conflicts of interest.
References
- Yamada, A. Cultivation studies of edible ectomycorrhizal mushrooms: Successful establishment of ectomycorrhizal associations in vitro and efficient production of fruiting bodies. Mycoscience 2022, 63, 235–246. [Google Scholar] [CrossRef] [Scilit] [PubMed]
- Kumar, J.; Atri, N.S. Studies on ectomycorrhiza: An appraisal. Bot. Rev. 2018, 84, 108–155. [Google Scholar] [CrossRef] [Scilit]
- Martin, F.; Kohler, A.; Murat, C.; Veneault-Fourrey, C.; Hibbett, D.S. Unearthing the roots of ectomycorrhizal symbioses. Nat. Rev. Microbiol. 2016, 14, 760–773. [Google Scholar] [CrossRef] [Scilit] [PubMed]
- Bae, I.H.; Kim, H.; Kim, S.-M.; Lee, Y.-H. Multi-meta-omics reveal unique symbiotic synchronization between ectomycorrhizal fungus and soil microbiome in Tricholoma matsutake habitat. Microbiome 2025, 14, 23. [Google Scholar] [CrossRef] [Scilit] [PubMed]
- Deveau, A.; Palin, B.; Delaruelle, C.; Peter, M.; Kohler, A.; Pierrat, J.C.; Sarniguet, A.; Garbaye, J.; Martin, F.; Frey-Klett, P. The mycorrhiza helper Pseudomonas fluorescens BBc6R8 has a specific priming effect on the growth, morphology and gene expression of the ectomycorrhizal fungus Laccaria bicolor S238N. New Phytol. 2007, 175, 743–755. [Google Scholar] [CrossRef] [Scilit] [PubMed]
- Vaario, L.-M.; Fritze, H.; Spetz, P.; Heinonsalo, J.; Hanajík, P.; Pennanen, T. Tricholoma matsutake dominates diverse microbial communities in different forest soils. Appl. Environ. Microbiol. 2011, 77, 8523–8531. [Google Scholar] [CrossRef] [Scilit] [PubMed]
- Li, Q.; Zhao, J.; Xiong, C.; Li, X.; Chen, Z.; Li, P.; Huang, W. Tuber indicum shapes the microbial communities of ectomycorhizosphere soil and ectomycorrhizae of an indigenous tree (Pinus armandii). PLoS ONE 2017, 12, e0175720. [Google Scholar] [CrossRef] [Scilit] [PubMed]
- Yoo, S.; Seo, C.W.; Lim, Y.W. Functionally distinct core microbes of Tricholoma matsutake revealed by cross-study analysis. Microbiome 2026, 14, 58. [Google Scholar] [CrossRef] [Scilit] [PubMed]
- Sha, T.; Xu, J.; Palanichamy, M.G.; Zhang, H.-B.; Li, T.; Zhao, Z.-W.; Zhang, Y.-P. Genetic diversity of the endemic gourmet mushroom Thelephora ganbajun from south-western China. Microbiology 2008, 154, 3460–3468. [Google Scholar] [CrossRef] [Scilit] [PubMed]
- Liu, D.; He, X.; Chater, C.C.C.; Perez-Moreno, J.; Yu, F. Microbiome community structure and functional gene partitioning in different micro-niches within a sporocarp-forming fungus. Front. Microbiol. 2021, 12, 629352. [Google Scholar] [CrossRef] [Scilit] [PubMed]
- Zhang, Z.; Gai, H.; Sha, T. Using integrated multi-omics to explore the differences in the three developmental stages of Thelephora ganbajun Zang. Appl. Sci. 2024, 14, 2856. [Google Scholar] [CrossRef] [Scilit]
- Zang, M. Some new and noteworthy higher fungi from eastern Himalayas. Plant Divers. 1987, 9, 1–3. [Google Scholar]
- Warmink, J.A.; Van Elsas, J.D. Selection of bacterial populations in the mycosphere of Laccaria proxima: Is type III secretion involved? ISME J. 2008, 2, 887–900. [Google Scholar] [CrossRef] [Scilit] [PubMed]
- NY/T 1377-2007; Determination of pH in Soil. China Agriculture Press: Beijing, China, 2007.
- NY/T 1121.6-2006; Soil Testing—Part 6: Method for Determination of Soil Organic Matter. Standards Press of China: Beijing, China, 2006.
- NY/T 1121.24-2012; Soil Testing—Part 24: Determination of Total Nitrogen in Soil—Automatic Kjeldahl Apparatus Method. China Agriculture Press: Beijing, China, 2012.
- NY/T 88-1988; Method for Determination of Soil Total Phosphorus. China Agriculture Press: Beijing, China, 1988.
- NY/T 87-1988; Method for Determination of Total Potassium in Soils. Standards Press of China: Beijing, China, 1988.
- NY/T 1121.7-2014; Soil Testing—Part 7: Method for Determination of Available Phosphorus in Soil. China Agriculture Press: Beijing, China, 2014.
- NY/T 889-2004; Determination of Exchangeable Potassium and Non-Exchangeable Potassium Content in Soil. China Agriculture Press: Beijing, China, 2004.
- LY/T 1228-2015; Nitrogen Determination Methods of Forest Soils. Standards Press of China: Beijing, China, 2015.
- SL 394.1-2007; Determination of 34 Elements (Pb, Cd, V, P, etc.)—Inductively Coupled Plasma Atomic Emission Spectroscopy (ICP-AES). China Water & Power Press: Beijing, China, 2007.
- Sun, X.; Zhang, X.; Zhang, G.; Miao, Y.; Zeng, T.; Zhang, M.; Zhang, H.; Zhang, L.; Huang, L. Environmental response to root secondary metabolite accumulation in Paeonia lactiflora: Insights from rhizosphere metabolism and root-associated microbial communities. Microbiol. Spectr. 2022, 10, e02800-22. [Google Scholar] [CrossRef] [Scilit] [PubMed]
- Lohse, M.; Haag, R.; Lippold, E.; Vetterlein, D.; Reemtsma, T.; Lechtenfeld, O.J. Direct imaging of plant metabolites in the rhizosphere using laser desorption ionization ultra-high resolution mass spectrometry. Front. Plant Sci. 2021, 12, 753812. [Google Scholar] [CrossRef] [Scilit] [PubMed]
- Zhalnina, K.; Louie, K.B.; Hao, Z.; Mansoori, N.; Da Rocha, U.N.; Shi, S.; Cho, H.; Karaoz, U.; Loqué, D.; Bowen, B.P.; et al. Dynamic root exudate chemistry and microbial substrate preferences drive patterns in rhizosphere microbial community assembly. Nat. Microbiol. 2018, 3, 470–480. [Google Scholar] [CrossRef] [Scilit] [PubMed]
- Chou, M.-Y.; Andersen, T.B.; Mechan Llontop, M.E.; Beculheimer, N.; Sow, A.; Moreno, N.; Shade, A.; Hamberger, B.; Bonito, G. Terpenes modulate bacterial and fungal growth and sorghum rhizobiome communities. Microbiol. Spectr. 2023, 11, e01332-23. [Google Scholar] [CrossRef] [Scilit] [PubMed]
- Sebastiana, M.; Gargallo-Garriga, A.; Sardans, J.; Pérez-Trujillo, M.; Monteiro, F.; Figueiredo, A.; Maia, M.; Nascimento, R.; Silva, M.S.; Ferreira, A.N.; et al. Metabolomics and transcriptomics to decipher molecular mechanisms underlying ectomycorrhizal root colonization of an oak tree. Sci. Rep. 2021, 11, 8576. [Google Scholar] [CrossRef] [Scilit] [PubMed]
- Liao, Y.; Chen, X.; Du, X.; Jia, J.; Xu, Y.; Qiang, Y.; Bai, B.; Cui, L.; Li, Y. Climatic, soil, and rhizosphere fungal drivers of flavonoid composition in Scutellaria baicalensis. Appl. Soil Ecol. 2026, 225, 107251. [Google Scholar] [CrossRef] [Scilit]
- Zeng, Q.; Man, X.; Lebreton, A.; Dai, Y.; Martin, F.M. The bacterial and fungal microbiomes of ectomycorrhizal roots from stone oaks and Yunnan pines in the subtropical forests of the Ailao Mountains of Yunnan. Front. Microbiol. 2022, 13, 916337. [Google Scholar] [CrossRef] [Scilit] [PubMed]
- Geml, J.; Leal, C.M.; Nagy, R.; Sulyok, J. Abiotic environmental factors drive the diversity, compositional dynamics and habitat preference of ectomycorrhizal fungi in Pannonian forest types. Front. Microbiol. 2022, 13, 1007935. [Google Scholar] [CrossRef] [Scilit] [PubMed]
- Sang, Y.; Jin, L.; Zhu, R.; Yu, X.-Y.; Hu, S.; Wang, B.-T.; Ruan, H.-H.; Jin, F.-J.; Lee, H.-G. Phosphorus-solubilizing capacity of Mortierella species isolated from rhizosphere soil of a poplar plantation. Microorganisms 2022, 10, 2361. [Google Scholar] [CrossRef] [Scilit] [PubMed]
- Ji, R.-Q.; Xu, Y.; Si, Y.-J.; Phukhamsakda, C.; Li, Y.; Meng, L.-P.; Liu, S.-Y.; Xie, M.-L. Fungal–bacterial networks in the habitat of SongRong (Tricholoma matsutake) and driving factors of their distribution rules. J. Fungi 2022, 8, 575. [Google Scholar] [CrossRef] [Scilit] [PubMed]
- Leff, J.W.; Jones, S.E.; Prober, S.M.; Barberán, A.; Borer, E.T.; Firn, J.L.; Harpole, W.S.; Hobbie, S.E.; Hofmockel, K.S.; Knops, J.M.H.; et al. Consistent responses of soil microbial communities to elevated nutrient inputs in grasslands across the globe. Proc. Natl. Acad. Sci. USA 2015, 112, 10967–10972. [Google Scholar] [CrossRef] [Scilit] [PubMed]
- Rousk, J.; Bååth, E.; Brookes, P.C.; Lauber, C.; Lozupone, C.; Caporaso, J.G.; Knight, R.; Fierer, N. Soil bacterial and fungal communities across a pH gradient in an arable soil. ISME J. 2010, 4, 1340–1351. [Google Scholar] [CrossRef] [Scilit] [PubMed]
- Bahram, M.; Hildebrand, F.; Forslund, S.K.; Anderson, J.L.; Soudzilovskaia, N.A.; Bodegom, P.M.; Bengtsson-Palme, J.; Anslan, S.; Coelho, L.P.; Harend, H.; et al. Structure and function of the global topsoil microbiome. Nature 2018, 560, 233–237. [Google Scholar] [CrossRef] [Scilit] [PubMed]
- Cui, J.; Yuan, X.; Zhang, Q.; Zhou, J.; Lin, K.; Xu, J.; Zeng, Y.; Wu, Y.; Cheng, L.; Zeng, Q.; et al. Nutrient availability is a dominant predictor of soil bacterial and fungal community composition after nitrogen addition in subtropical acidic forests. PLoS ONE 2021, 16, e0246263. [Google Scholar] [CrossRef] [Scilit] [PubMed]
- Pent, M.; Põldmaa, K.; Bahram, M. Bacterial communities in boreal forest mushrooms are shaped both by soil parameters and host identity. Front. Microbiol. 2017, 8, 836. [Google Scholar] [CrossRef] [Scilit] [PubMed]
- Vahdatzadeh, M.; Deveau, A.; Splivallo, R. The role of the microbiome of truffles in aroma formation: A meta-analysis approach. Appl. Environ. Microbiol. 2015, 81, 6946–6952. [Google Scholar] [CrossRef] [Scilit] [PubMed]
- Ji, W.; Zhang, N.; Su, W.; Wang, X.; Liu, X.; Wang, Y.; Chen, K.; Ren, L. The impact of continuous cultivation of Ganoderma lucidum on soil nutrients, enzyme activity, and fruiting body metabolites. Sci. Rep. 2024, 14, 10097. [Google Scholar] [CrossRef] [Scilit] [PubMed]
- Gorka, S.; Dietrich, M.; Mayerhofer, W.; Gabriel, R.; Wiesenbauer, J.; Martin, V.; Zheng, Q.; Imai, B.; Prommer, J.; Weidinger, M.; et al. Rapid transfer of plant photosynthates to soil bacteria via ectomycorrhizal hyphae and its interaction with nitrogen availability. Front. Microbiol. 2019, 10, 168. [Google Scholar] [CrossRef] [Scilit] [PubMed]
- Berrios, L.; Bogar, G.D.; Bogar, L.M.; Venturini, A.M.; Willing, C.E.; Del Rio, A.; Ansell, T.B.; Zemaitis, K.; Velickovic, M.; Velickovic, D.; et al. Ectomycorrhizal fungi alter soil food webs and the functional potential of bacterial communities. mSystems 2024, 9, e00369-24. [Google Scholar] [CrossRef] [Scilit] [PubMed]
- Olsson, P.A.; Wallander, H. Interactions between ectomycorrhizal fungi and the bacterial community in soils amended with various primary minerals. FEMS Microbiol. Ecol. 1998, 27, 195–205. [Google Scholar] [CrossRef]
- Carrino-Kyker, S.R.; Kluber, L.A.; Petersen, S.M.; Coyle, K.P.; Hewins, C.R.; DeForest, J.L.; Smemo, K.A.; Burke, D.J. Mycorrhizal fungal communities respond to experimental elevation of soil pH and P availability in temperate hardwood forests. FEMS Microbiol. Ecol. 2016, 92, fiw024. [Google Scholar] [CrossRef] [Scilit] [PubMed]
- Meeds, J.A.; Kranabetter, J.M.; Zigg, I.; Dunn, D.; Miros, F.; Shipley, P.; Jones, M.D. Phosphorus deficiencies invoke optimal allocation of exoenzymes by ectomycorrhizas. ISME J. 2021, 15, 1478–1489. [Google Scholar] [CrossRef] [Scilit] [PubMed]
- Bashian-Victoroff, C.; Yanai, R.D.; Horton, T.R.; Lamit, L.J. Nitrogen and phosphorus additions affect fruiting of ectomycorrhizal fungi in a temperate hardwood forest. Fungal Ecol. 2025, 73, 101388. [Google Scholar] [CrossRef] [Scilit]
- Oh, S.-Y.; Lim, Y.W. Root-associated bacteria influencing mycelial growth of Tricholoma matsutake (pine mushroom). J. Microbiol. 2018, 56, 399–407. [Google Scholar] [CrossRef] [Scilit] [PubMed]
- Dahlberg, A.; Stenlid, J. Population structure and dynamics in Suillus bovinus as indicated by spatial distribution of fungal clones. New Phytol. 1990, 115, 487–493. [Google Scholar] [CrossRef] [Scilit] [PubMed]
- Lilleskov, E.A.; Bruns, T.D.; Horton, T.R.; Taylor, D.; Grogan, P. Detection of forest stand-level spatial structure in ectomycorrhizal fungal communities. FEMS Microbiol. Ecol. 2004, 49, 319–332. [Google Scholar] [CrossRef] [Scilit] [PubMed]
- Buscardo, E.; Geml, J.; Nagy, L. Seasonal dependence of deterministic versus stochastic processes influencing soil fungal community composition in a lowland Amazonian rain forest. Commun. Earth Environ. 2024, 5, 334. [Google Scholar] [CrossRef] [Scilit]

Disclaimer/Publisher’s Note: The statements, opinions and data contained in all publications are solely those of the individual author(s) and contributor(s) and not of MDPI and/or the editor(s). MDPI and/or the editor(s) disclaim responsibility for any injury to people or property resulting from any ideas, methods, instructions or products referred to in the content. |
© 2026 by the authors. Licensee MDPI, Basel, Switzerland. This article is an open access article distributed under the terms and conditions of the Creative Commons Attribution (CC BY) license.