


Abstract
Wearable pulse metrics are typically reported as a single daily, waking, or nightly average. This presentation of the data may mask differences between sleep and wakefulness, temporal variations within a given state, and differences in the amount of signal retained. To determine whether single-value averages provide a representative summary of free-living pulse physiology, we analyzed 28 days of smartwatch and smart-ring data from 35 participants. Sleep and waking periods were identified using the smart-ring sleep data. Pulse rate was obtained from the smartwatch-generated values, and pulse rate variability (PRV) was calculated from the raw photoplethysmography as the root mean square of successive pulse-interval differences (RMSSD) and standard deviation of pulse-to-pulse intervals (SDNN). Analyses compared paired sleep–wake periods and examined temporal variability within both waking and sleep periods. Mean pulse rate was 72.4 beats/min during sleep and 89.1 beats/min during the subsequent waking period (difference: −16.7 beats/min; 95% confidence interval [CI], −23.0 to −10.2). The mean absolute deviation of the five-minute waking pulse-rate measurements from the waking-period mean was 10.89 beats/min (95% CI, 9.75–12.02); on average, 44.6% of waking measurements differed from the mean by more than 10 beats/min. During sleep, the mean absolute deviation from the period mean was 4.30 beats/min (95% CI, 3.17–5.56). From earlier to later sleep, RMSSD increased by 40.8% (95% CI, 18.7–67.5%; q = 0.0001) and SDNN increased by 82.6% (95% CI, 51.4–117.4%; q = 0.0001). Only 8.6% of the waking recordings met the PRV quality criteria, whereas 64.0% of the sleep recordings did. In summary, single-value averages may not capture differences between sleep and wakefulness or temporal structure within states; unequal signal retention may also affect the representativeness of state averages. Therefore, reports of wearable pulse biomarkers should specify sleep–wake state, within-state timing, aggregation method, and signal retention criteria.
1. Introduction
Pulse rate and beat-to-beat variability from wearables are usually summarized as one number for a 24-h period, a waking period, or a sleep period. Although these summaries are a convenient way to monitor and compare measurements over time, they do not account for the temporal and behavioral context. Waking and sleep differ in multiple respects, including behavior, posture, movement, respiration, sleep physiology, and circadian rhythms [1,2,3,4,5]. Therefore, a 24-h summary may include measurements taken in vastly different physiological states [6,7,8,9].
Separating waking from sleep reduces some of the ambiguity; however, it does not eliminate all of it. For example, a single summary value for waking may not accurately reflect nonlinear or context-dependent changes that occur throughout the day [2,7,8]. Similarly, sleep is organized temporally [10,11]; stages, homeostatic pressure, and circadian timing all change over the course of the night. Consequently, single-value waking and sleep summaries can obscure these physiologically distinct within-state changes. Additionally, these summaries are defined in many ways: daily and waking values have been derived from brief standardized resting recordings [12], activity-matched free-living periods [7], or proprietary resting heart rate algorithms [13], and nightly values have been derived from whole-night averages, early-sleep segments, end-of-night estimates [14], or estimates weighted toward a specific sleep stage [15,16]. Because of this within-state temporal structure, nominally equivalent summaries can represent different parts of the day or night and may not be directly comparable [17].
Another complication is that signal quality varies within and between waking and sleep. Free-living photoplethysmography (PPG) is affected by motion, waveform quality, detector performance [18,19,20], missing data, sleep–wake boundaries, and the sampling schedule. These factors determine which measurements are retained after preprocessing. Signal-quality filtering may preferentially retain quiet, high-quality portions of a state, so a state average may reflect a selected subset of the entire waking or sleep period. Such selective retention is particularly relevant for pulse rate variability (PRV), which relies on accurate pulse timing and is often less completely captured during active waking than during sleep.
The aim of this study was therefore to determine what single-value 24-h, waking, and nightly summaries of wearable pulse measurements can and cannot represent under free-living conditions. Using a publicly available 28-day multimodal wearable dataset, we investigated differences in pulse measurements between actual sleep and the subsequent waking period, temporal variation in pulse rate and PRV within waking and sleep, deviations of individual measurements from waking- and sleep-period averages, and differences in PRV signal retention between waking and sleep. Sensitivity and corroborating analyses evaluated the robustness of the primary findings.
2. Methods
2.1. Study Design and Wearable Measurements
This was an observational secondary analysis using a publicly available 28-day multimodal dataset collected from September 2022 to June 2023 [21]. Participants in the parent cohort were first-generation immigrants residing in Finland for no more than five years, aged 18–65 years, fluent in English, and with UCLA Loneliness Scale scores of 28 or higher. Forty-two participants enrolled; three withdrew, and 39 completed the study. The 39 completers had a mean age of 31.5 years (SD = 6.1); 26 were female and 13 were male. Of the completers, 38 provided primary sleep periods from the smart ring, and 35 of these participants also had smartwatch recordings. Because of differences in alignment and measurement quality, the analytic sample size for each outcome varied. Since individual age and sex were not linked to recording identifiers, available participant-level characteristics (recording availability, sleep span, and movement) were compared across analytic subsets in Supplementary Material S6. The parent study was approved by the Ethics Committee for Human Sciences at the University of Turku (26/2022), and participants provided written informed consent. Participants wore a Samsung Galaxy Watch Active2 (hereafter, smartwatch) and an Oura Ring generation 2 (hereafter, smart ring) during daily life. The smartwatch was programmed to collect approximately 12-min sessions every two hours and provided raw PPG, accelerometer, and gyroscope signals along with device-generated heart-rate estimates. The smart ring provided primary sleep timing, sleep-stage labels in five-minute epochs, heart rate, and the root mean square of successive pulse-interval differences (RMSSD). All timestamps for a participant were shifted by an unknown offset between −60 and +60 min for de-identification. Because the same shift was applied to all streams and days, elapsed time and cross-device alignment within a participant were preserved.
2.2. Five-Minute Outcomes and PRV Quality Criteria
The central five-minute segment of each eligible smartwatch recording (hereafter, a window) was analyzed to ensure all scheduled recordings followed the same temporal sampling rule. The timestamp spacing indicated an effective raw-PPG sampling rate of approximately 25 Hz; this rate was used for processing. Raw PPG was detrended, bandpass filtered, and then processed using two unassisted pulse detectors; additional technical information is provided in Supplementary Materials S1 and S2. Known-answer simulations at approximately 25 Hz produced root-mean-square pulse-interval errors of approximately 4–14 ms after sub-sample peak refinement, depending on the amount of noise present; at the higher noise level, simulated RMSSD was overestimated by approximately 35–38% (Supplementary Material S2). The primary pulse-rate endpoint was the median of the smartwatch-generated heart-rate values available within each window. Released values were analyzed as reported, without assuming a reporting frequency or resampling. Eligibility for pulse-rate analysis did not depend on meeting the additional raw-PPG criteria used for PRV. A window was eligible for pulse-rate analysis when at least 50% of the reported values were positive and finite, their median was 35–220 beats/min, the analyzed window spanned at least 299 s, and the 99th percentile of absolute timestamp-alignment residuals was no greater than 15 s. Raw PPG was used for PRV only after interval-level quality screening and a screen for harmonic detection failures. Smartwatch PRV was quantified as RMSSD, calculated only from adjacent accepted intervals without bridging rejected gaps, and as the sample standard deviation of accepted pulse-to-pulse intervals (SDNN). Both measures were expressed in milliseconds and natural-log transformed for analysis. Because they were derived from peripheral pulse intervals rather than electrocardiographic (ECG) R–R intervals, they are described as PRV rather than heart rate variability (HRV) [22,23]. The primary PRV screen required detector agreement ≥ 0.65, a rejected-interval fraction ≤ 20%, and neither a harmonic-ambiguity flag nor a broad harmonic or half-rate flag. Full quality thresholds and supporting diagnostics are provided in Supplementary Materials S2, S7 and S8.
2.3. Definition of Sleep and Waking Periods
Sleep onset and final awakening were determined based on the smart ring’s five-minute hypnograms. Sleep onset was defined as the beginning of the first epoch of light, deep, or rapid eye movement (REM) sleep. Final awakening was identified as the end of the last such epoch. Any intervening epochs of wakefulness were considered wake after sleep onset (WASO) and did not affect the elapsed time of the sleep period. Primary sleep periods had to be between 3 and 14 h long and were identified exclusively from the smart ring’s sleep records and hypnograms. One period was chosen per participant-day, which was defined from local noon to the following noon so that a typical overnight period fell within one analytic day. Periods were assigned to days by the time of final awakening and were not truncated at noon. A smartwatch window was classified as actual sleep only if all five minutes of the window were covered by epochs of sleep. Windows that included an awake epoch, lacked stage data, or spanned sleep onset or final awakening were not classified as sleep. The corresponding waking period began at final awakening and ended at the onset of the next primary sleep period, excluding windows in bed before that onset or during non-primary sleep; windows during WASO were not included in either the sleep or waking analysis (Supplementary Materials S3 and S4).
A sleep or waking period could be used for a particular outcome only if it included at least two separate usable windows whose midpoints were at least one hour apart. Therefore, an individual recording could not be used to represent an entire waking or sleep period. Models of temporal change used observations up to 20 h after awakening and up to 10 h after sleep onset. These limits represent the modeled time axis, not the duration of waking or sleep periods. Sleep periods of up to 14 h were eligible, but their sparse observations beyond 10 h after onset were excluded from the temporal models. Temporal change was summarized as the fitted early-to-late change between the 5th and 95th percentiles of observed time since awakening or sleep onset, calculated separately for each outcome and state. Figures were limited to the same interval to avoid interpreting poorly supported tails.
2.4. Primary Statistical Analysis
The direct sleep–wake comparison and the within-state temporal profiles were analyzed as two separate estimands (Supplementary Material S5). For the direct comparison, each qualifying primary sleep period was paired only with the qualifying waking period that immediately followed it. Waking windows more than 20 h after awakening were excluded from paired contrasts. Windows were first averaged within the sleep and waking periods of each paired cycle; a sleep-minus-wake difference was calculated for that cycle; and cycle differences were then averaged within each participant. Participant-level differences were finally averaged across participants, so each participant received equal weight regardless of the number of qualifying cycles (participant-balanced). A waking period from one study day was never paired with an unrelated sleep period from another day. As a robustness analysis, we also compared each participant’s mean across all qualifying sleep periods with that participant’s mean across all qualifying waking periods, without pairing. Confidence intervals (CIs) for the primary paired pulse-rate contrast were calculated with 5000 whole-participant bootstrap draws, the corresponding P value was obtained from a two-sided participant-level t-test, and inference treated participants as independent units. The paired PRV contrasts were interpreted descriptively because the retained samples were small and sensitive to screening criteria.
Temporal profiles were estimated separately within waking and sleep and included all participants with qualifying data in the state being modeled, regardless of their data in the other state. Each model included a four-degree-of-freedom cubic B-spline for hours since awakening or sleep onset (knots at 0, 10, and 20 h or 0, 5, and 10 h, respectively), participant-specific intercepts for pulse rate and waking PRV or period-specific intercepts for sleep PRV, and within-participant deviations in acceleration and gyroscope magnitude to account for concurrent movement, which can affect both pulse physiology and PPG signal quality. Hierarchical weights gave equal total influence to participants, equal influence to qualifying periods within each participant, and equal influence to windows within a period. Global temporal tests used restricted-null participant wild-cluster bootstrap inference with 9999 draws, and contrast intervals used 2000 whole-participant bootstrap draws, except for descriptive waking PRV profiles, which used conditional cluster-robust intervals. The global time test jointly evaluated all spline terms and tested whether the modeled curve was nonconstant in any form, including curved or nonmonotonic patterns, rather than testing for a linear trend. Benjamini–Hochberg false-discovery-rate (FDR) control was applied separately to the two pulse-rate temporal tests (waking and sleep) and the two sleep PRV tests (RMSSD and SDNN) [24]. Waking PRV temporal profiles were descriptive because of limited support (Supplementary Material S5).
To assess how well period averages represented individual observations, we quantified deviations of five-minute observations from their own waking- or sleep-period averages, using participant- and period-balanced mean absolute deviations and proportions beyond descriptive thresholds (5 and 10 beats/min for pulse rate and a more than 1.2-fold deviation from the period geometric mean for PRV), with 5000-draw participant-bootstrap confidence intervals.
2.5. Sensitivity Analyses
Sensitivity analyses included (1) applying a more stringent PRV quality screen; (2) adjusting sleep PRV for sleep stage and for contemporaneous pulse rate; (3) using an alternative sleep-boundary definition; (4) comparing within-sleep RMSSD between the smartwatch and the smart ring; and (5) comparing early versus late sleep summaries. Waking PRV retention was also recalculated within 0–20 h after awakening (Supplementary Material S4). Dynamic acceleration was compared between PRV-accepted and PRV-rejected recordings within each state (Supplementary Material S7).
The more stringent PRV screen (hereafter, stringent screen) added motion and waveform-template checks, additional interval screening, a pulse-rate consistency check, and a minimum number of adjacent interval pairs. It also excluded isolated accepted intervals when calculating SDNN. To separate the effects of sample selection from those of interval processing, the primary interval processing was also applied to the stringent-screen windows. In both the primary-screen and stringent-screen samples, sensitivity analyses adjusted sleep RMSSD and SDNN for smart-ring-estimated sleep stages and, separately, for contemporaneous pulse rate.
The alternative sleep definition replaced actual sleep with the source-defined sleep interval (the start-to-end interval of each smart-ring sleep record), which may include awake time (sleep onset latency, wake after sleep onset, and wake after final awakening; Supplementary Material S12). Since this definition altered both sleep boundaries and eligible windows, the two definitions were also compared within windows eligible under both. For the cross-device comparison, matched smartwatch and smart-ring observations from the same participants and sleep periods were compared, including repeated-measures limits of agreement; neither consumer device was considered a reference. The more densely sampled smart-ring heart-rate and RMSSD series also provided an independent within-sleep profile. To evaluate aggregation, early (0 to <3 h) and late (5 to <8 h) sleep summaries were compared with each other and with whole-period averages, and the dense smart-ring stream was compared with the same stream sampled only at smartwatch observation times. Night-to-night repeatability of early, late, and whole-night smartwatch RMSSD summaries was summarized with single-night intraclass correlation coefficients (ICCs). Additional methods are described in Supplementary Materials S8–S12.
Data processing, signal extraction, and statistical analyses were conducted using Python 3.12.9 (Python Software Foundation, Beaverton, OR, USA).
3. Results
3.1. Paired Sleep–Wake Differences
A total of 31 participants provided 284 paired sleep–wake cycles. The participant-balanced average pulse rate was 72.4 beats/min during actual sleep and 89.1 beats/min during the subsequent waking period (sleep minus wake, −16.7 beats/min; 95% bootstrap CI, −23.0 to −10.2; P < 0.001). Comparing each participant’s average across all qualifying sleep periods with that across all qualifying waking periods gave a slightly smaller difference (−16.1 beats/min; 95% CI, −22.4 to −9.6).
The sleep-minus-wake RMSSD and SDNN differences were −10.7% and −19.9%, respectively (11 participants, 30 cycles; Supplementary Material S11). These comparisons are descriptive because of limited waking PRV retention, and the estimates were sensitive to quality screening.
3.2. Temporal Structure Within Waking and Sleep
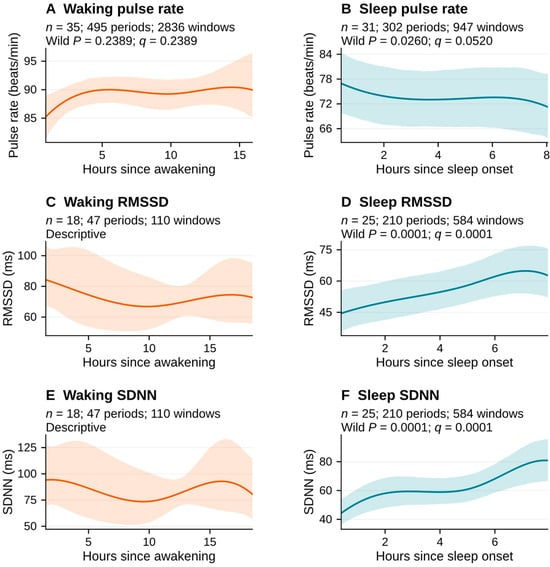
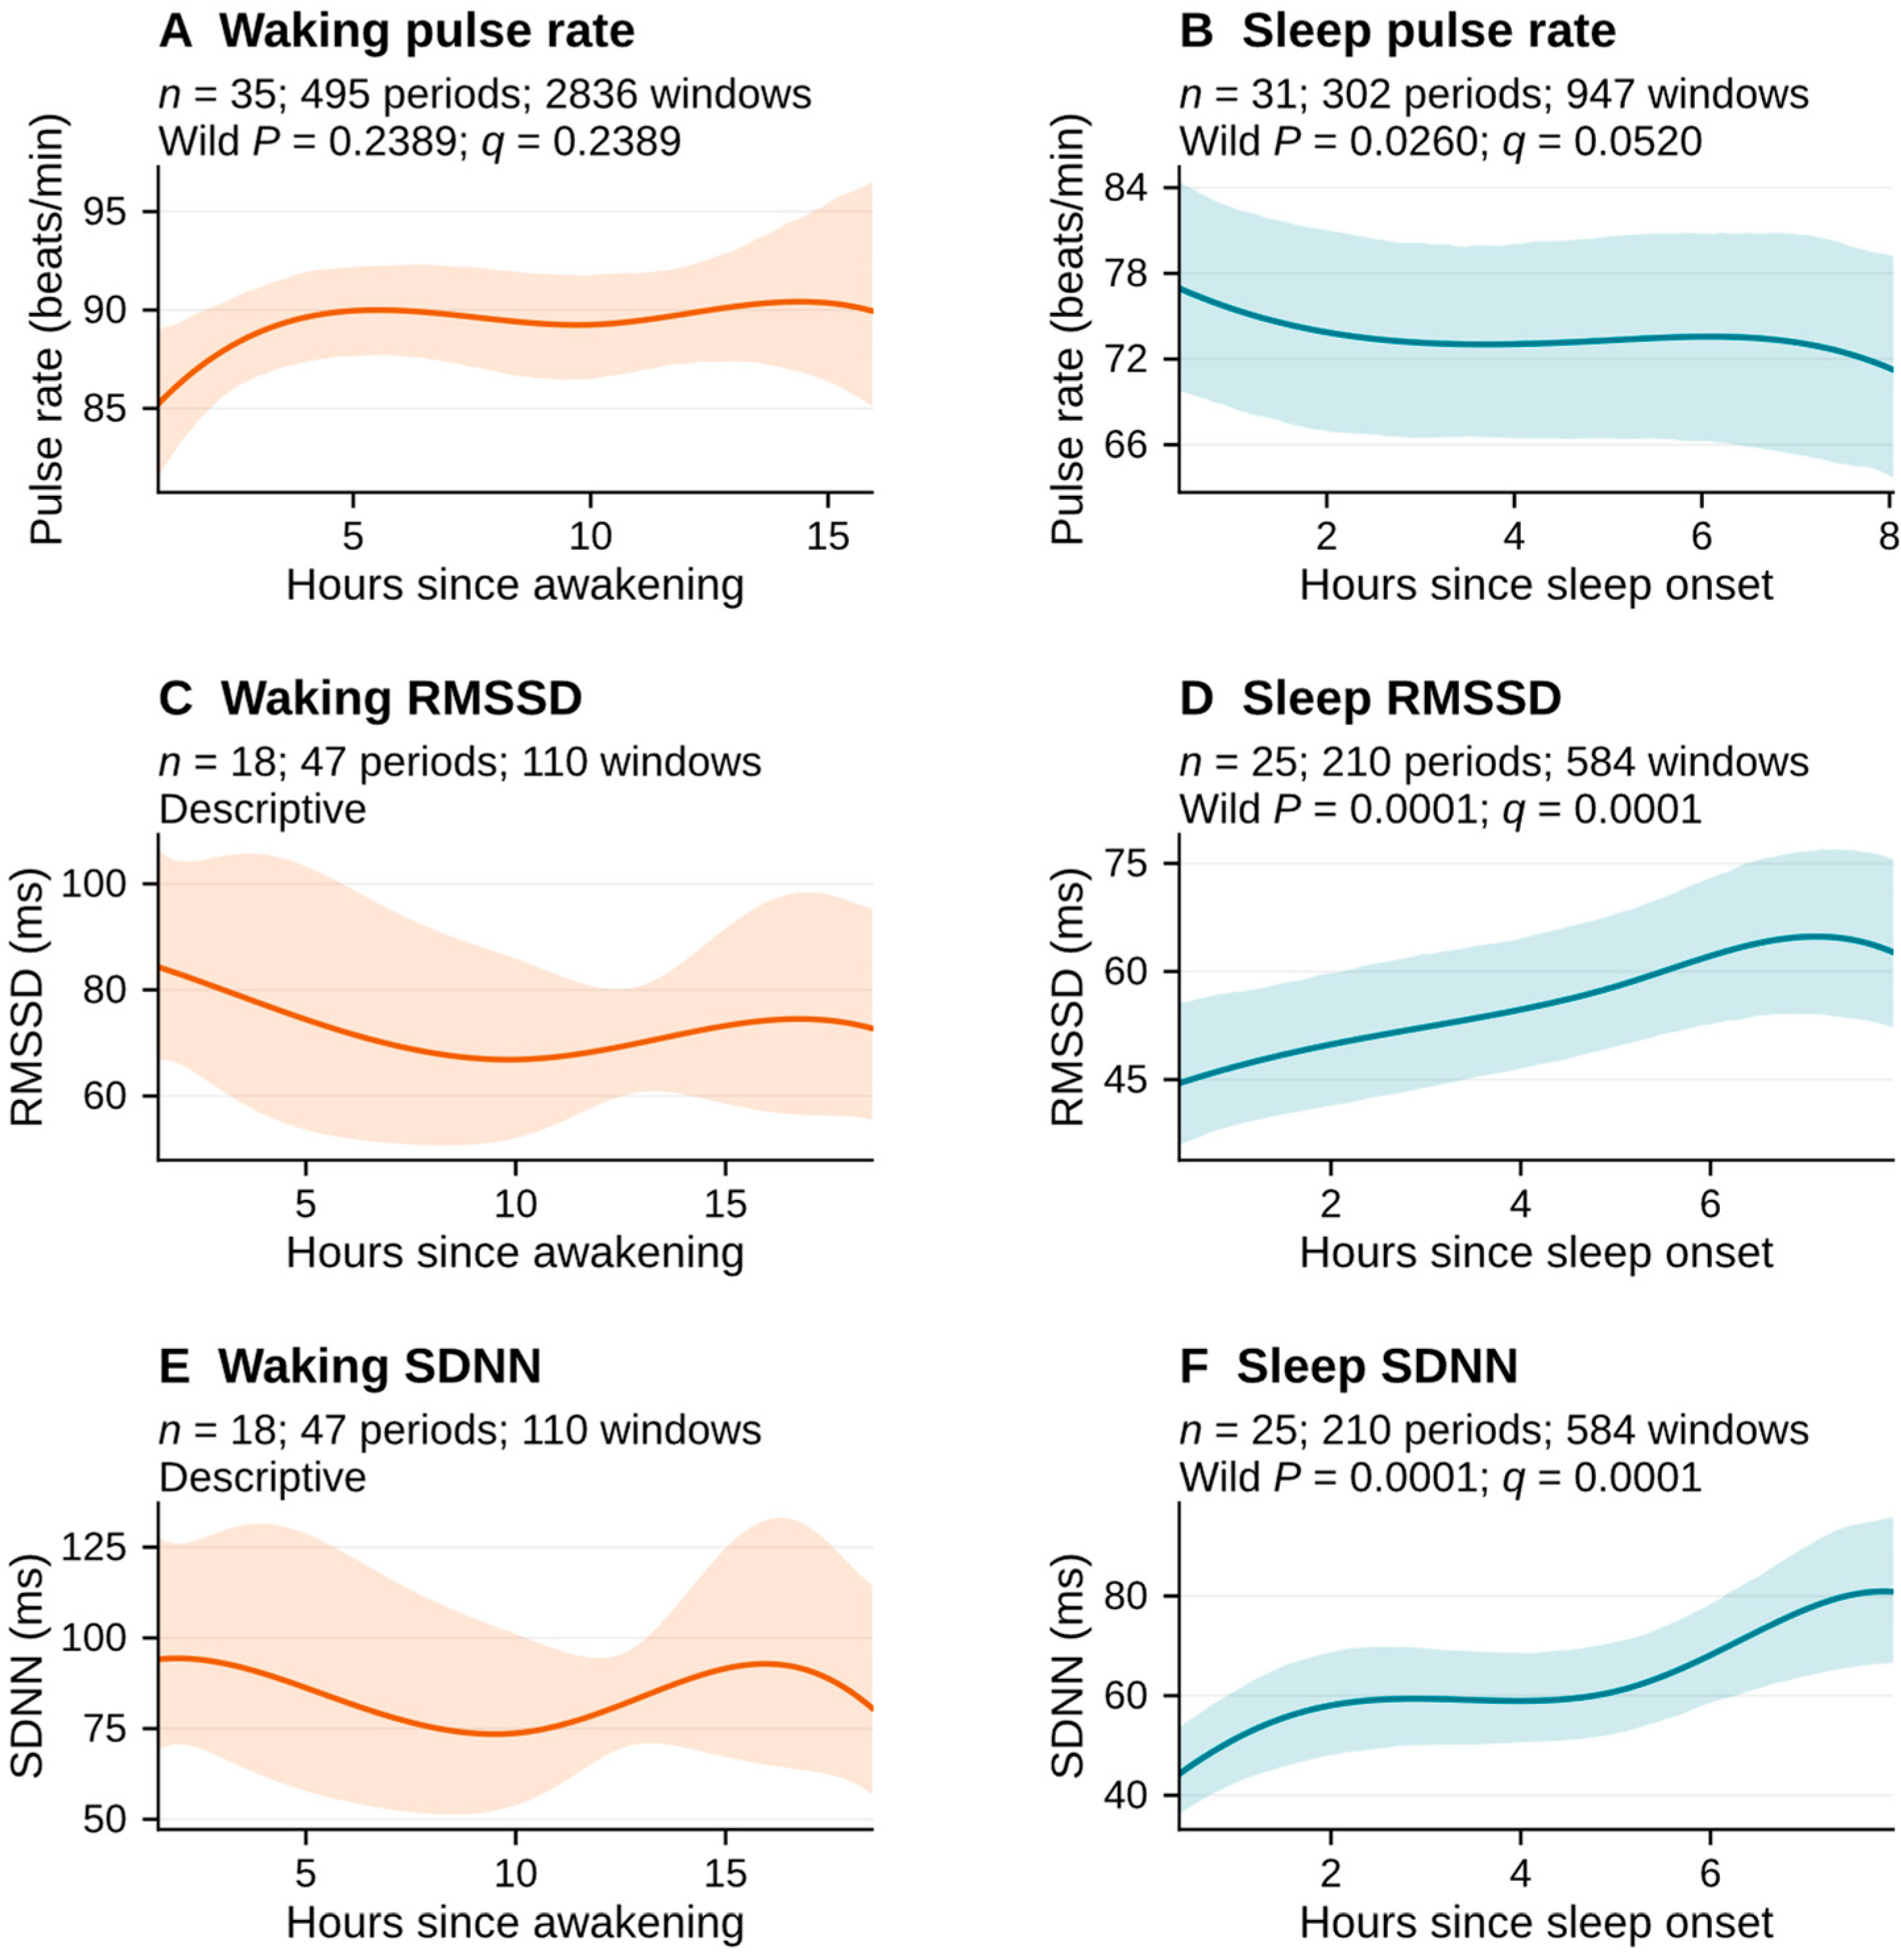
The waking pulse-rate profile (35 participants, 2836 five-minute windows from 495 periods) did not show a statistically significant association with time since awakening (global test, wild-bootstrap P = 0.2389; q = 0.2389; Figure 1). Between the 5th and 95th percentiles of observed time since awakening, the fitted change was +4.7 beats/min (95% bootstrap CI, −0.2 to 10.9). During actual sleep (31 participants, 947 windows from 302 periods), the fitted pulse rate decreased by 5.7 beats/min between the 5th and 95th percentiles of observed time since sleep onset (95% bootstrap CI, −9.8 to −1.5; wild-bootstrap P = 0.0260); however, the global time test did not meet the FDR-adjusted significance threshold (q = 0.0520).
Figure 1.
Participant-balanced smartwatch pulse-rate and PRV profiles during waking (left column) and actual sleep (right column). Each panel is restricted to the outcome- and state-specific interval between the 5th and 95th percentiles of observed time since awakening or sleep onset. Lines are weighted spline estimates adjusted for within-participant acceleration and gyroscope deviations. Pulse-rate and waking PRV models have participant intercepts; sleep PRV models have period intercepts. Bands show pointwise participant-bootstrap 95% confidence intervals, except the descriptive waking PRV panels, which use conditional cluster-robust intervals. Sleep and waking PRV curves use the primary PRV screen. Wild-bootstrap P values are from the global time tests, and q values are adjusted within the pulse-rate and sleep PRV families. In panels D and F, P = 0.0001 is the minimum Monte Carlo P value attainable with 9999 draws. Contributor counts by elapsed hour appear in Supplementary Material S8, Table S7. Abbreviations: n, number of participants; PRV, pulse rate variability; RMSSD, root mean square of successive pulse-interval differences; SDNN, standard deviation of pulse-to-pulse intervals.
The waking RMSSD and SDNN profiles, which are descriptive because of limited data (18 participants, 110 windows from 47 periods), showed fitted early-to-late changes of −13.7% (conditional cluster-robust 95% CI, −44.2% to 33.3%) and −14.3% (−51.2% to 50.4%), respectively. During actual sleep (25 participants, 584 windows from 210 periods), fitted RMSSD increased by 40.8% from earlier to later sleep (95% bootstrap CI, 18.7–67.5%; global wild-bootstrap PMC = 0.0001; q = 0.0001). SDNN also increased by 82.6% (95% bootstrap CI, 51.4–117.4%; PMC = 0.0001; q = 0.0001). Table 1 summarizes the paired state comparisons and temporal profiles.
Table 1.
Primary paired sleep–wake comparisons and temporal profiles.
Individual observations often differed from their period averages. The participant-balanced mean absolute deviation of waking pulse rate from its own period mean was 10.89 beats/min (95% CI, 9.75–12.02); on average (participant- and period-balanced), 68.5% and 44.6% of waking windows differed by more than 5 and 10 beats/min, respectively, from that mean. During sleep, the corresponding mean absolute deviation was 4.30 beats/min (95% CI, 3.17–5.56), with an average of 21.6% and 11.6% of windows exceeding those thresholds. Among sleep PRV windows (25 participants, 584 windows from 210 periods), an average of 30.5% of RMSSD and 54.4% of SDNN values differed from their period’s geometric mean by more than 1.2-fold.
3.3. PRV Signal Retention During Waking and Sleep
The signal-quality screening process resulted in different proportions of waking and sleep recordings being retained. Prior to applying the period-qualification requirement (at least two usable windows with midpoints at least one hour apart within a period), 329 of 3831 waking recordings (8.6%) and 668 of 1043 actual-sleep recordings (64.0%) passed the primary PRV screen (Supplementary Material S4, Figure S1). These denominators include only recorded sessions that could be assigned to a state, not all scheduled sessions. Therefore, retained waking measurements represent a small and potentially selective subset of all waking observations. Within participants, rejected waking recordings had higher median dynamic acceleration than accepted recordings (mean difference, 0.0289 g; 95% CI, 0.0194–0.0409; 32 participants). However, no such difference was found for sleep recordings (−0.0008 g; 95% CI, −0.0024 to 0.0009; 24 participants; Supplementary Material S7). In addition, the median percentage of detected pulse intervals rejected by the interval-validity checks was higher during waking than during sleep, both among windows qualifying for PRV analysis (5.78% vs. 0.45%) and among all accepted recordings before period qualification (3.96% [interquartile range, 0.68–10.31%] vs. 0.48% [0–2.18%]). Within participants, windows with larger fractions of rejected intervals also exhibited higher RMSSD and SDNN (mean Spearman ρ, 0.50 and 0.68 during sleep and 0.57 and 0.65 during waking), although these associations were weaker under the stringent screen (Supplementary Material S7).
3.4. Sensitivity Analyses
3.4.1. More Stringent PRV Screen
The stringent screen eliminated 3611 (94.3%) of 3831 waking recordings and 420 (40.3%) of 1043 actual-sleep recordings. In the stringent-screen sleep sample (25 participants, 530 windows from 195 periods), RMSSD increased by 40.8% (95% bootstrap CI, 16.2–72.8%; wild-bootstrap P = 0.0029) and SDNN by 62.0% (95% bootstrap CI, 41.7–89.7%; P = 0.0002), compared to 40.8% and 82.6% under the primary screen. When the primary interval processing was applied to the same 530 windows, the RMSSD and SDNN increases were 43.1% and 75.3%, respectively, demonstrating that both sample composition and interval handling contributed to the difference in SDNN between screens. Paired sleep-minus-wake RMSSD and SDNN differences were +33.4% and +12.7% (5 participants, 9 cycles), compared to −10.7% and −19.9% under the primary screen (11 participants, 30 cycles); however, since the selected samples were different, these contrasts do not establish a physiological sleep–wake PRV difference.
3.4.2. Adjustment for Sleep Stages and Pulse Rate
In the primary-screen sample, adjusting for smart-ring-estimated sleep stage left the early-to-late RMSSD increase essentially unchanged (41.2%; 95% bootstrap CI, 20.7–65.6%; wild-bootstrap PMC = 0.0001; unadjusted, 40.8%) but reduced the SDNN increase to 52.2% (95% bootstrap CI, 28.6–82.9%; P = 0.0024; unadjusted, 82.6%).
In the same sample, adjusting for contemporaneous device-reported pulse rate reduced the RMSSD increase to 17.4% (95% bootstrap CI, 3.0–33.8%; P = 0.0254) and the SDNN increase to 71.5% (95% bootstrap CI, 38.0–108.4%; P = 0.0042; Supplementary Material S8). Under the stringent screen, the pulse-rate-adjusted RMSSD increase was 15.5% (95% bootstrap CI, −0.6% to 35.8%; P = 0.1575).
3.4.3. Alternative Sleep Definition
With the source-defined sleep interval in the primary-screen sample (25 participants, 675 windows from 226 periods), RMSSD and SDNN increased by 27.6% (P = 0.0091) and 73.1% (P = 0.0051), compared to 40.8% and 82.6% for actual sleep (both PMC = 0.0001). Since the two definitions differed in both sleep boundaries and eligible periods, they were also compared within windows eligible under both; in these windows, the increases were similar for actual and source-defined sleep (primary screen: RMSSD, 35.1% and 37.3%; SDNN, 71.7% and 75.5%; Supplementary Material S12).
3.4.4. Cross-Device Comparison
The dense smart-ring stream also showed an increase in the within-sleep RMSSD profile (Supplementary Material S9, Figure S4). In temporally matched smartwatch and smart-ring sleep windows (25 participants, 559 windows from 204 periods), the participant-balanced smartwatch-to-smart-ring RMSSD ratio was 1.200 (95% CI, 1.127–1.278), with repeated-measures 95% limits of agreement of 0.747 to 1.928; the ratio increased with smartwatch pulse rate. The fitted early-to-late RMSSD increase was 39.4% for the smartwatch and 55.3% for the smart ring; the device-by-time test indicated different temporal profiles (wild-bootstrap P = 0.0144). Thus, the two devices showed increases in the same direction but differed in absolute RMSSD and the shape of the temporal profile (Supplementary Material S9).
3.4.5. Early Versus Late Sleep Summaries
Early (0 to <3 h) and late (5 to <8 h) actual-sleep summaries differed within the same periods. Smartwatch RMSSD was 31.6% higher in late than in early sleep (95% CI, 20.7–44.6%; 22 participants, 101 periods), and SDNN was 23.9% higher (95% CI, 12.5–36.2%). Relative to the whole-period mean, early and late smartwatch RMSSD were 13.0% lower and 14.5% higher, respectively. Spearman correlations between participant-level summaries from early and late sleep ranged from approximately 0.72 to 0.97 across outcomes. Single-night ICCs for night-to-night repeatability of smartwatch RMSSD were 0.805 (95% CI, 0.612–0.882), 0.719 (0.510–0.821), and 0.799 (0.637–0.883) for early, late, and whole-night summaries, respectively. The comparison illustrates how a nightly summary depends on which sleep intervals are sampled (Supplementary Material S10).
4. Discussion
These findings demonstrate temporal structure at multiple levels that is masked by single-value summaries. Pulse rate was significantly lower during actual sleep than during the subsequent waking period, and waking pulse-rate observations varied widely around each individual’s average for that period; however, no common temporal pattern in waking pulse rate was identified. Within sleep, RMSSD and SDNN increased from earlier to later in the period. PRV signal retention was much lower during waking than during sleep, so state-level summaries depend in part on which measurements pass signal-quality screening.
The paired pulse-rate difference of 16.7 beats/min is consistent with the anticipated lower pulse rate during sleep. The difference was evident within the same sleep–wake cycle, so a single 24-h summary that combines the two states would obscure it. These values should not be viewed as normative estimates, since the absolute sleep and waking means were obtained from short, scheduled recordings rather than continuous monitoring.
Separating waking from sleep only partially addresses the aggregation issue. Although the waking pulse-rate curve did not show a significant common temporal pattern, five-minute observations differed substantially from their own waking-period means; thus, the absence of a common pattern does not imply that individual waking periods were uniform. One possible explanation is that waking pulse rate is affected by activity, posture, meals, and other behaviors whose timing varies between individuals and days; these influences may cancel out in a population-average curve but remain large within individual periods. Time since awakening is also not equivalent to circadian phase; therefore, the waking profiles describe these observational conditions rather than an intrinsic circadian rhythm. A single waking average describes central tendency but omits substantial variation among sampled measurements, to which measurement error may also contribute.
The within-sleep PRV findings provide a clear example of why a single nightly value can be ambiguous. Since RMSSD and SDNN increased from earlier to later sleep, a whole-night average combines lower early and higher late values; therefore, its magnitude depends on which part of the night is observed and how long the period lasts. The increase was present under both PRV screens and in the smart-ring stream, although absolute levels and temporal profiles differed between devices. Several mechanisms could contribute to this pattern. Sleep stage identifies the current sleep state, whereas time since sleep onset reflects the changing distribution of stages and the broader circadian and homeostatic context of the night. Prior polysomnographic studies have shown that high-frequency HRV power, a marker of vagal modulation, varies with circadian phase within non–rapid eye movement (NREM) sleep stages [3], and that HRV changes across successive N2 and REM epochs of the same night [25]. HRV therefore depends on when in the night it is measured, not only on sleep stage. Consistent with this, the increases in both PRV measures persisted after adjustment for smart-ring-estimated sleep stage, suggesting that changes in stage composition alone did not explain them, although stage adjustment attenuated the SDNN increase. Adjustment for concurrent pulse rate reduced the RMSSD increase, suggesting that part of the overnight rise in RMSSD was shared with changes in pulse rate. This could reflect physiology, because RMSSD tends to be higher when pulse rate is lower [26], or measurement error that varies with pulse rate; these data cannot separate the two. The residual associations should not be interpreted as causal effects of elapsed sleep time; circadian phase, homeostatic processes, respiration, posture, and other unmeasured factors remain possible contributors.
Far fewer waking than sleep recordings met the PRV criteria, probably because wrist PPG pulse timing is degraded by movement and changing sensor contact during daily activities [18,19,27]. Consistent with this, rejected waking recordings had greater dynamic acceleration than accepted recordings, whereas no such difference was observed during sleep. The retained waking windows therefore likely overrepresent quiet, stationary moments with lower pulse rates (Supplementary Material S7), so a free-living waking PRV average may describe resting wakefulness rather than the waking day as a whole. Residual pulse-timing error may also be greater during waking and can inflate successive-difference measures such as RMSSD [27,28]; without simultaneous ECG, its contribution cannot be quantified. More broadly, a 24-h, waking, or nightly value reflects the sampling and retention rules that produced it as well as the underlying physiology. Two studies can use the same nominal measure yet obtain different summaries if one samples early sleep, another samples the entire night, or quality filtering preferentially removes active waking measurements.
5. Strengths and Limitations
The strengths of this study include the use of repeated measures over 28 days in free-living conditions, the separation of the device-generated pulse-rate endpoint from raw PPG PRV, and the use of an independent smart-ring stream for sleep timing and cardiac comparisons. Since sleep was defined by the smart ring, the smartwatch PPG signal was used to estimate PRV but not to define the sleep–wake state. Hierarchical weighting prevented heavily sampled participants or nights from dominating the estimates. Direct sleep–wake comparisons were paired within the same cycle of sleep and subsequent waking, and temporal profiles used all participants with data in the state being modeled. Sensitivity analyses evaluated quality screening, sleep-stage and pulse-rate adjustment, sleep-boundary definitions, cross-device consistency, and early versus late sleep summaries.
There are also several limitations to this study. First, the sample was small and relatively young, consisting of first-generation immigrants living in Finland who met a loneliness-screening criterion; therefore, the generalizability of the findings is limited. Second, PRV analyses were based on only 25 participants for sleep profiles and 11 participants for paired comparisons. Third, raw smartwatch PPG was recorded only once every two hours and at approximately 25 Hz; therefore, both the temporal resolution of the profiles and the precision of pulse-to-pulse timing are limited [20,28,29]. Consequently, fitted curves represent gradual population-level changes rather than rapid transitions. Fourth, neither device was validated against simultaneous ECG and polysomnography in this specific cohort. Fifth, estimates for later sleep depend on periods long enough to reach those times. Lastly, no circadian-phase marker, respiration or posture measurement, activity control, or experimental manipulation was available to separate circadian, homeostatic, sleep-stage, and behavioral mechanisms.
6. Conclusions
The interpretation of wearable pulse rate and PRV depends on both the underlying physiology and the method by which a summary value is constructed. A summary value depends on whether the measurements come from sleep, wakefulness, or both, and on which portions of these periods are sampled. The value also depends on how the measurements are combined and which measurements meet the signal-quality criteria. Because studies and devices may use different methods for constructing summary values, nominally identical metrics may not describe the same physiological condition. For example, because RMSSD and SDNN increased from earlier to later sleep, a sleep PRV value depends on which portion of the sleep period is sampled. Similarly, a free-living waking PRV average may primarily represent quiet, low-movement periods rather than the entire waking period. Nevertheless, single-value summaries remain useful as long as their construction is reported explicitly. We recommend that sleep and waking values be reported separately and, when the data allow, in more detail, such as separate values for early and late sleep or for waking periods with different levels of physical activity. Reports should also state the signal-quality criteria used and the percentage of recordings that met them. Future studies using continuous recordings combined with simultaneous ECG and markers of circadian phase are needed to separate the physiological, behavioral, and measurement components of this temporal structure and to determine which summary definitions are most appropriate for various research and clinical applications.
Supplementary Materials
The following supporting information can be downloaded at: https://www.mdpi.com/article/10.3390/jcdd13110589/s1, Supplementary Material S1: Raw smartwatch recordings, sample timing, and selection of the central five-minute window; Supplementary Material S2: PPG processing, quality-screening criteria, and simulated timing error; Supplementary Material S3: Identifying primary sleep periods and sleep boundaries; Supplementary Material S4: Window state classification, period eligibility, observation flow, and signal retention; Supplementary Material S5: Statistical estimands, inference, and multiplicity; Supplementary Material S6: Participant characteristics and analytic selection; Supplementary Material S7: Rejected pulse intervals, PRV screening, and movement; Supplementary Material S8: Temporal-model estimates, sensitivity analyses of sleep PRV, and hourly support; Supplementary Material S9: Smartwatch vs. smart-ring comparisons during sleep; Supplementary Material S10: Early versus late sleep summaries, sparse versus dense sampling, and night-to-night repeatability; Supplementary Material S11: Paired sleep–wake PRV contrasts under the two screens; Supplementary Material S12: Sensitivity to the sleep-boundary definition.
Author Contributions
Conceptualization, S.H.; Methodology, S.H.; Software, S.H.; Validation, R.C. and S.H.; Formal Analysis, S.H.; Resources, A.R. and S.H.; Writing—Original Draft Preparation, R.C. and S.H.; Writing—Review and Editing, R.C., A.R. and S.H.; Visualization, S.H.; Supervision, S.H.; Project Administration, S.H.; Funding Acquisition, S.H. All authors have read and agreed to the published version of the manuscript.
Funding
S.H. was supported by National Institutes of Health grants (K99AG083234, R00AG083234, and R01AG083799).
Institutional Review Board Statement
This study was a secondary analysis of publicly available, de-identified data and did not require additional Institutional Review Board approval.
Informed Consent Statement
Participants in the parent study provided written informed consent. No additional consent was required for this secondary analysis.
Data Availability Statement
The source dataset is publicly available through Dryad (https://doi.org/10.5061/dryad.qz612jmrn).
Acknowledgments
The authors thank the investigators and participants who created and shared the public multimodal dataset. During the preparation of this manuscript, the authors used MGB AI Zone (Mass General Brigham) to improve language, clarity, and readability. The authors reviewed, edited, and approved the final text.
Conflicts of Interest
The authors declare no conflicts of interest.
References
- Carrington, M.; Walsh, M.; Stambas, T.; Kleiman, J.; Trinder, J. The Influence of Sleep Onset on the Diurnal Variation in Cardiac Activity and Cardiac Control. J. Sleep Res. 2003, 12, 213–221. [Google Scholar] [CrossRef] [Scilit] [PubMed]
- Boudreau, P.; Yeh, W.-H.; Dumont, G.A.; Boivin, D.B. A Circadian Rhythm in Heart Rate Variability Contributes to the Increased Cardiac Sympathovagal Response to Awakening in the Morning. Chronobiol. Int. 2012, 29, 757–768. [Google Scholar] [CrossRef] [Scilit] [PubMed]
- Boudreau, P.; Yeh, W.-H.; Dumont, G.A.; Boivin, D.B. Circadian Variation of Heart Rate Variability Across Sleep Stages. Sleep 2013, 36, 1919–1928. [Google Scholar] [CrossRef] [Scilit] [PubMed]
- Somers, V.K.; Dyken, M.E.; Mark, A.L.; Abboud, F.M. Sympathetic-Nerve Activity during Sleep in Normal Subjects. N. Engl. J. Med. 1993, 328, 303–307. [Google Scholar] [CrossRef] [Scilit] [PubMed]
- Burgess, H.J.; Trinder, J.; Kim, Y.; Luke, D. Sleep and Circadian Influences on Cardiac Autonomic Nervous System Activity. Am. J. Physiol.-Heart Circ. Physiol. 1997, 273, H1761–H1768. [Google Scholar] [CrossRef] [Scilit] [PubMed]
- Natarajan, A.; Pantelopoulos, A.; Emir-Farinas, H.; Natarajan, P. Heart Rate Variability with Photoplethysmography in 8 Million Individuals: A Cross-Sectional Study. Lancet Digit. Health 2020, 2, e650–e657. [Google Scholar] [CrossRef] [Scilit] [PubMed]
- Gaur, P.; Temple, D.S.; Hegarty-Craver, M.; Boyce, M.D.; Holt, J.R.; Wenger, M.F.; Preble, E.A.; Eckhoff, R.P.; McCombs, M.S.; Davis-Wilson, H.C.; et al. Continuous Monitoring of Heart Rate Variability in Free-Living Conditions Using Wearable Sensors: Exploratory Observational Study. JMIR Form. Res. 2024, 8, e53977. [Google Scholar] [CrossRef] [Scilit] [PubMed]
- Natarajan, A.; Gleichauf, K.; Khalid, M.; Heneghan, C.; Schneider, L.D. Circadian Rhythm of Heart Rate and Activity: A Cross-Sectional Study. Chronobiol. Int. 2025, 42, 108–121. [Google Scholar] [CrossRef] [Scilit] [PubMed]
- Wu, F.; Langer, P.; Shim, J.; Fleisch, E.; Barata, F. Comparative Efficacy of Commercial Wearables for Circadian Rhythm Home Monitoring From Activity, Heart Rate, and Core Body Temperature. IEEE J. Biomed. Health Inform. 2025, 29, 900–908. [Google Scholar] [CrossRef] [Scilit] [PubMed]
- Trinder, J.; Kleiman, J.; Carrington, M.; Smith, S.; Breen, S.; Tan, N.; Kim, Y. Autonomic Activity during Human Sleep as a Function of Time and Sleep Stage. J. Sleep Res. 2001, 10, 253–264. [Google Scholar] [CrossRef] [Scilit] [PubMed]
- Bonnet, M.H.; Arand, D.L. Heart Rate Variability: Sleep Stage, Time of Night, and Arousal Influences. Electroencephalogr. Clin. Neurophysiol. 1997, 102, 390–396. [Google Scholar] [CrossRef] [Scilit] [PubMed]
- Nunan, D.; Donovan, G.; Jakovljevic, D.G.; Hodges, L.D.; Sandercock, G.R.H.; Brodie, D.A. Validity and Reliability of Short-Term Heart-Rate Variability from the Polar S810. Med. Sci. Sports Exerc. 2009, 41, 243–250. [Google Scholar] [CrossRef] [Scilit] [PubMed]
- Quer, G.; Gouda, P.; Galarnyk, M.; Topol, E.J.; Steinhubl, S.R. Inter- and Intraindividual Variability in Daily Resting Heart Rate and Its Associations with Age, Sex, Sleep, BMI, and Time of Year: Retrospective, Longitudinal Cohort Study of 92,457 Adults. PLoS ONE 2020, 15, e0227709. [Google Scholar] [CrossRef] [Scilit] [PubMed]
- Nuuttila, O.-P.; Seipäjärvi, S.; Kyröläinen, H.; Nummela, A. Reliability and Sensitivity of Nocturnal Heart Rate and Heart-Rate Variability in Monitoring Individual Responses to Training Load. Int. J. Sports Physiol. Perform. 2022, 17, 1296–1303. [Google Scholar] [CrossRef] [Scilit] [PubMed]
- Dial, M.B.; Hollander, M.E.; Vatne, E.A.; Emerson, A.M.; Edwards, N.A.; Hagen, J.A. Validation of Nocturnal Resting Heart Rate and Heart Rate Variability in Consumer Wearables. Physiol. Rep. 2025, 13, e70527. [Google Scholar] [CrossRef] [Scilit] [PubMed]
- Grosicki, G.J.; Presby, D.M. Accurate Comparison of Wearables Requires Contextual Equivalence. Physiol. Rep. 2025, 13, e70710. [Google Scholar] [CrossRef] [Scilit] [PubMed]
- De Zambotti, M.; Goldstein, C.; Cook, J.; Menghini, L.; Altini, M.; Cheng, P.; Robillard, R. State of the Science and Recommendations for Using Wearable Technology in Sleep and Circadian Research. Sleep 2024, 47, zsad325. [Google Scholar] [CrossRef] [Scilit] [PubMed]
- Bent, B.; Goldstein, B.A.; Kibbe, W.A.; Dunn, J.P. Investigating Sources of Inaccuracy in Wearable Optical Heart Rate Sensors. npj Digit. Med. 2020, 3, 18. [Google Scholar] [CrossRef] [Scilit] [PubMed]
- Charlton, P.H.; Kyriacou, P.A.; Mant, J.; Marozas, V.; Chowienczyk, P.; Alastruey, J. Wearable Photoplethysmography for Cardiovascular Monitoring. Proc. IEEE 2022, 110, 355–381. [Google Scholar] [CrossRef] [Scilit] [PubMed]
- Mejía-Mejía, E.; May, J.M.; Kyriacou, P.A. Effects of Using Different Algorithms and Fiducial Points for the Detection of Interbeat Intervals, and Different Sampling Rates on the Assessment of Pulse Rate Variability from Photoplethysmography. Comput. Methods Programs Biomed. 2022, 218, 106724. [Google Scholar] [CrossRef] [Scilit] [PubMed]
- Wang, Y.; Auxier, J.; Mark, A.; Farzanehkari, P.; Axelin, A.; Azimi, I.; Rahmani, A.M.; Liljeberg, P. Loneliness and Well-Being in Finnish Immigrants: A Multimodal Dataset from Wearables and Passive Data Collection. Data Brief 2026, 64, 112331. [Google Scholar] [CrossRef] [Scilit] [PubMed]
- Schäfer, A.; Vagedes, J. How Accurate Is Pulse Rate Variability as an Estimate of Heart Rate Variability? A Review on Studies Comparing Photoplethysmographic Technology with an Electrocardiogram. Int. J. Cardiol. 2013, 166, 15–29. [Google Scholar] [CrossRef] [Scilit] [PubMed]
- Kantrowitz, A.B.; Ben-David, K.; Morris, M.; Wittels, H.L.; Wishon, M.J.; McDonald, S.M.; Renaghan, E.J.; Feigenbaum, L.A.; Wittels, S.H. Pulse Rate Variability Is Not the Same as Heart Rate Variability: Findings from a Large, Diverse Clinical Population Study. Front. Physiol. 2025, 16, 1630032. [Google Scholar] [CrossRef] [Scilit] [PubMed]
- Benjamini, Y.; Hochberg, Y. Controlling the False Discovery Rate: A Practical and Powerful Approach to Multiple Testing. J. R. Stat. Soc. Ser. B (Methodol.) 1995, 57, 289–300. [Google Scholar] [CrossRef] [Scilit]
- Eddie, D.; Bentley, K.H.; Bernard, R.; Mischoulon, D.; Winkelman, J.W. Aggregating Heart Rate Variability Indices across Sleep Stage Epochs Ignores Significant Variance through the Night. Sleep Med. 2022, 90, 262–266. [Google Scholar] [CrossRef] [Scilit] [PubMed]
- De Geus, E.J.C.; Gianaros, P.J.; Brindle, R.C.; Jennings, J.R.; Berntson, G.G. Should Heart Rate Variability Be “Corrected” for Heart Rate? Biological, Quantitative, and Interpretive Considerations. Psychophysiology 2019, 56, e13287. [Google Scholar] [CrossRef] [Scilit] [PubMed]
- Sarhaddi, F.; Kazemi, K.; Azimi, I.; Cao, R.; Niela-Vilén, H.; Axelin, A.; Liljeberg, P.; Rahmani, A.M. A Comprehensive Accuracy Assessment of Samsung Smartwatch Heart Rate and Heart Rate Variability. PLoS ONE 2022, 17, e0268361. [Google Scholar] [CrossRef] [Scilit] [PubMed]
- Bent, B.; Dunn, J.P. Optimizing Sampling Rate of Wrist-Worn Optical Sensors for Physiologic Monitoring. J. Clin. Transl. Sci. 2021, 5, e34. [Google Scholar] [CrossRef] [Scilit] [PubMed]
- Baek, H.J.; Shin, J.; Jin, G.; Cho, J. Reliability of the Parabola Approximation Method in Heart Rate Variability Analysis Using Low-Sampling-Rate Photoplethysmography. J. Med. Syst. 2017, 41, 189. [Google Scholar] [CrossRef] [Scilit] [PubMed]

Disclaimer/Publisher’s Note: The statements, opinions and data contained in all publications are solely those of the individual author(s) and contributor(s) and not of MDPI and/or the editor(s). MDPI and/or the editor(s) disclaim responsibility for any injury to people or property resulting from any ideas, methods, instructions or products referred to in the content. |
© 2026 by the authors. Licensee MDPI, Basel, Switzerland. This article is an open access article distributed under the terms and conditions of the Creative Commons Attribution (CC BY) license.