


Simple Summary
Simmental cattle grow rapidly and are highly tolerant to stress; however, the misuse of antibiotics, which is common in cattle production, readily induces bacterial resistance and the dissemination of resistance genes, creating an urgent need for safe antibiotic alternatives. Astragalus, a natural medicinal herb, can inhibit pathogens and promote growth, yet studies on its use for the proactive control of disease in beef cattle are scarce. This study was an exploratory longitudinal before-and-after self-controlled trial without a concurrent blank control and with a limited sample size, in which Simmental calves were continuously supplemented with Astragalus powder at 30 g/kg of feed for 14 d. Combining pathogen isolation and identification with 16S rRNA amplicon sequencing, we found that the detection rates of respiratory Streptococcus and Klebsiella pneumoniae, as well as those of enteric Clostridium perfringens and Escherichia coli, were all lower after supplementation than before. Genus-level microbiota analysis showed that the relative abundances of Streptococcus and Fournierella decreased significantly, whereas that of Butyrivibacter increased significantly. In summary, these preliminary results suggest that Astragalus can reduce the level of pathogen carriage and modulate the gut microbiota in calves, showing potential as an antibiotic alternative for beef cattle production and providing an experimental reference for further in-depth research on green and healthy beef cattle farming. In summary, these preliminary results show that, within the 14-day observation window, the detection rates of the examined bacterial pathogens were lower and the relative abundances of several bacterial genera were different from those recorded before supplementation in the same animals. Because this was an uncontrolled before-and-after study without a concurrent control group, these differences cannot be attributed to Astragalus, and the present work provides only descriptive baseline information for designing adequately controlled trials on Astragalus in beef cattle production.
Abstract
Simmental cattle are favored by producers for their rapid growth, strong stress tolerance, and other excellent characteristics. However, the widespread misuse of antibiotics at key stages of cattle production has become a serious hidden risk, as it readily induces bacterial resistance and increases the risk of resistance gene transmission. Therefore, effective antibiotic alternatives urgently need to be developed to safeguard the sustainable and healthy development of the cattle industry. Astragalus, a natural traditional Chinese medicine, has been shown to effectively inhibit pathogen proliferation and promote animal growth, and is widely used in animal production; however, research on its use for the proactive control of disease in beef cattle remains limited. In this preliminary, exploratory longitudinal before-and-after self-controlled study (without a concurrent untreated control group and with a small sample size), Simmental calves were continuously supplemented with Astragalus powder (30 g/kg of feed) for 14 d and served as their own controls. By isolating enteric and respiratory pathogens and combining these results with 16S rRNA gene amplicon sequencing, we found that the detection rates of respiratory Streptococcus, Klebsiella pneumoniae, enteric Clostridium perfringens, and Escherichia coli were all lower after supplementation than before. In addition, paired Wilcoxon signed-rank tests at the genus level showed that the relative abundances of Streptococcus and Fournierella decreased significantly after supplementation, whereas that of Butyrivibacter increased significantly (p < 0.05). These preliminary results provide a basis for further research on Astragalus as a potential antibiotic alternative in beef cattle production and provide a scientific basis for the green and healthy development of the beef cattle industry. As no concurrent untreated control group was established and no functional, metabolomic or immunological analyses were conducted, the above observations merely describe temporal changes within this single cohort of calves. The present study can serve as descriptive baseline information to inform the design of future controlled trials.
1. Introduction
Astragalus is a traditional plant used both as medicine and as food, and has been shown to effectively modulate immune function, alleviate chronic inflammation, promote the proliferation of beneficial intestinal bacteria, and strengthen the intestinal barrier structure [1]. Previous studies have reported that, as a functional feed additive, Astragalus can improve the growth performance of livestock and poultry, enhance disease resistance, and increase the economic returns of farming [2]. Specifically, Astragalus polysaccharides can upregulate the activities of amylase, lipase, and protease, optimize the structure of the gut microbiota, maintain intestinal health, and improve digestive and absorptive efficiency, thereby promoting animal growth and improving feed utilization [3]; Astragalus isoflavones can increase the apparent ileal digestibility of amino acids and serum amino acid levels and, when administered before long-distance transport, effectively alleviate stress-induced physiological disturbances and reduce the production losses caused by transport stress [4]. In summary, as a natural Chinese herbal medicine, Astragalus can improve intestinal health, enhance growth performance, and alleviate transport stress in livestock and poultry, and is therefore a potential feed additive for improving production efficiency.
As a natural feed additive, Astragalus mainly contains Astragalus polysaccharides (APS), astragaloside IV (AS-IV), and isoflavones. Among these, APS acts on the gut microbiota, builds the intestinal barrier, and regulates innate immunity. APS can also serve as a prebiotic that is fermented and utilized by beneficial bacteria in the colon, thereby increasing the abundance of Bifidobacterium, Lactobacillus, and butyrate-producing bacteria, while inhibiting Proteobacteria and opportunistic pathogens and promoting the production of short-chain fatty acids [5]. AS-IV exerts anti-inflammatory, anti-apoptotic, organ-protective, and anti-fibrotic effects [6]. Astragalus isoflavones (e.g., formononetin and calycosin) can activate the antioxidant Nrf2 signaling pathway, regulate endocrine function, improve insulin resistance, downregulate stress-related inflammatory cytokines, and alleviate weaning stress and transport stress [7].
Simmental cattle are one of the most widely distributed dual-purpose (dairy and beef) breeds in the world. Owing to their rapid growth, high-quality meat, and high production efficiency, Simmental cattle occupy a dominant position in China’s beef cattle industry and are of considerable industrial value. For Simmental calves, 2 months of age is a critical developmental stage, at which the digestive and immune systems are not yet mature, resulting in relatively weak digestive function and limited disease resistance [8]. At present, antibiotic-based disease control strategies are widely applied at several key stages of Simmental calf production, including the late gestation of dams, the rearing of newborn calves, and the stress period of calves. Long-term, high-dose use of antibiotics readily induces resistance in pathogens, which not only markedly reduces the efficacy of routine veterinary treatment, creating a vicious cycle in which drug use continues to increase while efficacy continues to decline, but also promotes the horizontal transmission of resistance genes among bacterial populations, posing potential risks to both animal health and public health [9]. Such practices are inconsistent with the policy orientation toward sustainable livestock production and severely constrain the high-quality and sustainable development of the beef cattle industry. As a natural alternative to antibiotics, Astragalus is of considerable practical significance and application value in Simmental calf production. Its use can help reduce antibiotic use in calf production, improve calf health, and promote the development of green and sustainable beef cattle production systems. Therefore, the present study adopted a longitudinal before-and-after design without a concurrent control group, aiming to provide preliminary evidence for the association between short-term Astragalus supplementation and the carriage of specific bacterial pathogens and the composition of the gut microbiota in Simmental calves.
2. Materials and Methods
2.1. Experimental Materials
We used a fecal genomic DNA extraction kit (Tiangen Biotech, Beijing, China) (for direct PCR detection of rectal and nasal swab samples) (Bioer Technology, Hangzhou, China), 2× Taq MasterMix (Vazyme, Nanjing, China), agarose, 2× PrimeSTAR® Max DNA Polymerase (Takara Bio, Shiga, Japan), and DL500/DL1000/DL2000 DNA markers (Takara Bio, Shiga, Japan). Culture media for pathogens: 5% sheep blood agar (Biowest, Nuaillé, France), MacConkey agar (Oxoid, Basingstoke, UK), eosin methylene blue (EMB) agar (BD, Franklin Lakes, NJ, USA), Salmonella–Shigella (SS) agar (Merck, Darmstadt, Germany), TSC agar (Land Bridge, Beijing, China), Baird–Parker agar (Land Bridge, Beijing, China), MEM-K2 agar (Land Bridge, Beijing, China), and cooked meat medium (Land Bridge, Beijing, China); all reagents and culture media were used according to the manufacturers’ instructions.
2.2. Preparation of Astragalus Powder and Supplementation Regimen
In this study, dried roots of commercially available Astragalus membranaceus (Fisch.) Bge. var. mongholicus (Bge.) Hsiao were used. The roots were pulverized and passed through a 200-mesh sieve to prepare Astragalus powder (hereinafter referred to as Astragalus powder) [10], which was accurately weighed and sealed in bags of 30 g each. The Astragalus powder was mixed uniformly into the feed in a wet-mixed manner and added at 30 g/kg of feed for 14 consecutive days of supplementation.
2.3. Animals and Experimental Design
The calves used in this study were selected from the same barn of a large-scale cattle farm in Ningxia Hui Autonomous Region, China. Seven healthy 2-month-old Simmental calves (initial body weight 60–105 kg) were randomly selected. Owing to objective constraints, the calves were of mixed sex and were not screened by sex; none of the calves had a recent history of medication, During the experimental period, each calf was offered an adequate amount of pelleted starter and 6 kg of whole milk at 08:00 and 14:00 daily. Residual pelleted starter was cleared and fresh feed was provided on the following day. The pelleted starter consisted of corn 42.0, soybean meal 24.0, wheat bran 15.0, alfalfa meal 10.0, whey powder 7.0, vitamin-mineral premix 1.5, and salt 0.5 (all values expressed as percentage on a dry matter basis).
Nasal and rectal swab samples were collected, and the calves were weighed, on day 0 (D0) and day 14 (D14); the samples were used for etiological detection of nasal and rectal swabs and for 16S rRNA gene amplicon sequencing of rectal swabs, respectively. Each calf served as its own control, and no concurrent blank (untreated) control group was set; the study was therefore a preliminary longitudinal before-and-after (self-controlled) study, which can only compare the changes occurring over time in the same animals before and after Astragalus supplementation.
2.4. Sample Collection
Body weight measurement: All calves were weighed before the morning feeding before supplementation (D0) and after 14 d of continuous supplementation (D14), and individual body weights (kg) were recorded.
Nasal swab collection: Sterile gloves were worn, and a sterile disposable swab was inserted 5–8 cm into both nasal cavities of each calf to collect nasal secretions. The swab head was immediately transferred into a pre-prepared 2 mL Eppendorf tube containing 1 mL of sterile saline. One aliquot was stored at 4 °C for pathogen isolation, and the other was immediately snap-frozen in liquid nitrogen for later use.
Rectal swab collection: Sterile gloves were worn, and the perianal area was cleaned with 75% ethanol cotton balls and air-dried naturally. A sterile disposable swab was slowly inserted into the rectum to a depth of 3–4 cm to collect a rectal swab sample. The swab was rotated 5 turns to collect rectal contents, after which the swab head was broken off and placed in a sterile 2 mL Eppendorf tube. One aliquot was stored at 4 °C for pathogen isolation, and the other was immediately snap-frozen in liquid nitrogen and transported on dry ice for 16S rRNA gene amplicon sequencing.
2.5. Isolation and Identification of Pathogens
2.5.1. Target Pathogens and Primers
Nasal and rectal swab samples were used for the detection of respiratory- and intestinal-associated pathogens, respectively. The respiratory samples were tested for Streptococcus spp., Klebsiella pneumoniae, Staphylococcus aureus, and Mycoplasma bovis; the intestinal samples were tested for Clostridium perfringens, Escherichia coli, and Salmonella spp.
All primers and amplification conditions were verified for specificity using positive controls and no-template controls (NTC); each amplification batch simultaneously included positive and negative isolates, and no bands of the expected size appeared in the negative control lanes, indicating that no obvious reagent or aerosol contamination was present in that batch (Table 1).
Table 1.
Summary of all primers. F, forward primer; R, reverse primer.
2.5.2. Isolation and Identification of Clostridium perfringens
Rectal swab samples were transferred into 9 mL of sterile saline and vortexed for 1 min to obtain a 1:10 dilution. Then, 1 mL of the diluted suspension was inoculated into cooked meat medium and enriched anaerobically at 37 °C for 18 h; the enrichment culture was streaked onto TSC (sulfite–cycloserine) agar and incubated anaerobically at 37 °C for 24 h; typical colonies (black, surrounded by an opaque halo) were picked and purified 3 times on TSC agar to obtain a pure culture of Clostridium perfringens.
Subsequently, dominant single colonies grown on TSC agar were spread evenly on sterile glass slides and subjected to Gram staining. Microscopic examination revealed Gram-positive short rods. Single colonies were then picked, and the cpa virulence gene of Clostridium perfringens was amplified by PCR; the primers used for cpa were cpa-F: GCTAATGTTACTGCCGTTGA and cpa-R: CCTCTGATACATCGTGTAAG; the target gene was cpa (alpha-toxin gene), and the expected amplicon size was 324 bp; the reaction conditions were initial denaturation at 96 °C for 10 min, followed by 30 cycles of denaturation at 96 °C for 30 s, annealing at 55 °C for 30 s, and extension at 72 °C for 30 s, with a final extension at 72 °C for 10 min. A positive band of approximately 324 bp was observed after agarose gel electrophoresis, and the isolate was accordingly identified as Clostridium perfringens.
2.5.3. Isolation and Identification of Escherichia coli
Rectal swab samples were transferred into 9 mL of sterile saline and vortexed for 1 min to obtain a 1:10 dilution. After dilution, the samples were inoculated onto LB agar by the streak-plate method and incubated aerobically at 37 °C for 18 h; single colonies were picked and streaked onto EMB agar and cultured at 37 °C for 24 h for selective isolation, after which colonies with a typical metallic sheen were picked and purified 3 times on EMB agar to obtain a pure culture of E. coli.
Subsequently, dominant single colonies grown on EMB agar were spread evenly on sterile glass slides and subjected to Gram staining. Microscopic examination revealed Gram-negative short rods. Single colonies were then picked, and the uidA gene of E. coli was amplified by PCR. The primers used for uidA were uidA-F: ATGGAATTTCGCCGATTTTGC and uidA-R: ATTGTTTGCCTCCCTGCTGC; the target gene was uidA (β-glucuronidase), and the expected amplicon size was 187 bp; the reaction conditions were initial denaturation at 96 °C for 10 min, followed by 30 cycles of denaturation at 96 °C for 30 s, annealing at 52 °C for 30 s, and extension at 72 °C for 30 s, with a final extension at 72 °C for 10 min. A positive band of approximately 187 bp was observed after agarose gel electrophoresis, and the isolate was accordingly identified as E. coli.
2.5.4. Isolation and Identification of Salmonella spp.
Rectal swab samples were transferred into 9 mL of sterile saline and vortexed for 1 min to obtain a 1:10 dilution. The diluted suspension was inoculated onto SS agar by the streak-plate method and incubated aerobically at 37 °C for 18 h; the culture broth was then streaked directly onto SS agar and cultured at 37 °C for 18–24 h, and no typical colorless and transparent colonies with a black center were observed, so the sample was judged to be negative.
Subsequently, dominant single colonies grown on SS agar were spread evenly on sterile glass slides and subjected to Gram staining. Microscopic examination revealed Gram-negative rods. Single colonies were then picked, and the invA virulence gene was amplified by PCR. The primers used for invA were invA-F: GTCCTCCGCCCTGTCTACT and invA-R: TCCTAACGACGACCCTTC; the target gene was invA (Salmonella invasion protein A), and the expected amplicon size was 284 bp; the reaction conditions were initial denaturation at 96 °C for 10 min, followed by 30 cycles of denaturation at 96 °C for 30 s, annealing at 55 °C for 30 s, and extension at 72 °C for 30 s, with a final extension at 72 °C for 10 min. A positive band of approximately 284 bp was observed after agarose gel electrophoresis, and the isolate was accordingly identified as Salmonella.
2.5.5. Isolation and Identification of Streptococcus spp.
Nasal swab samples were transferred into 9 mL of sterile saline and vortexed for 1 min to obtain a 1:10 dilution. The diluted suspension was inoculated onto 5% sheep blood agar plates by the streak-plate method and incubated aerobically at 37 °C for 18 h; typical colonies exhibiting β-hemolysis were picked and purified 3 times on 5% sheep blood agar to obtain a pure culture of Streptococcus.
Thereafter, typical colonies grown on blood agar were spread evenly on sterile glass slides and subjected to Gram staining. Microscopic examination revealed Gram-positive cocci arranged in chains. Single colonies were then picked, and the 16S rRNA gene of Streptococcus was amplified by PCR. The primers used were 27F (AGAGTTTGATCCTGGCTCAG)/1492R (CGGTTACCTTGTTACGACTTC); the target gene was the bacterial 16S rRNA gene, and the expected amplicon size was approximately 1465 bp; the reaction conditions were initial denaturation at 96 °C for 10 min, followed by 30 cycles of denaturation at 96 °C for 30 s, annealing at 55 °C for 30 s, and extension at 72 °C for 90 s, with a final extension at 72 °C for 10 min. A positive band of approximately 1500 bp was observed after agarose gel electrophoresis; the band was excised, recovered and submitted for Sanger sequencing, and the isolate was identified as Streptococcus based on the sequencing results.
2.5.6. Isolation and Identification of Klebsiella pneumoniae
Nasal swab samples were transferred into 9 mL of sterile saline and vortexed for 1 min to obtain a 1:10 dilution. The diluted suspension was inoculated onto MacConkey agar by the streak-plate method and cultured at 37 °C for 18 h; typical pink, mucoid colonies were picked and purified 3 times on MacConkey agar to obtain a pure culture of Klebsiella pneumoniae.
Subsequently, dominant colonies grown on MacConkey agar were spread evenly on sterile glass slides and subjected to Gram staining. Microscopic examination revealed Gram-negative, short and thick rods. Single colonies were then picked, and the khe gene of Klebsiella pneumoniae was amplified by PCR. The primers used for khe were khe-F: GCGGTCTGTCAAGTCGGATGTG and khe-R: CATCGTTTACGGCGTGGACTACC; the target gene was khe (Klebsiella haemolysin gene), and the expected amplicon size was 215 bp; the reaction conditions were initial denaturation at 96 °C for 10 min, followed by 30 cycles of denaturation at 96 °C for 30 s, annealing at 58 °C for 30 s, and extension at 72 °C for 30 s, with a final extension at 72 °C for 10 min. A positive band of approximately 215 bp was observed after agarose gel electrophoresis, and the isolate was accordingly identified as Klebsiella pneumoniae.
2.5.7. Isolation and Identification of Staphylococcus aureus
Nasal swab samples were transferred into 9 mL of sterile saline and vortexed for 1 min to obtain a 1:10 dilution. The diluted suspension was inoculated onto Baird–Parker agar base by the streak-plate method and incubated aerobically at 37 °C for 18 h. Dominant single colonies were picked and successively passaged and purified 3 times on Baird–Parker agar base to obtain a pure culture of respiratory Staphylococcus aureus.
Thereafter, typical black colonies grown on Baird–Parker agar were spread evenly on sterile glass slides and subjected to Gram staining. Microscopic examination revealed Gram-positive cocci. Single colonies were then picked, and the nuc gene of S. aureus was amplified by PCR. The primers used for nuc were nuc-F: GCGATTGATGGTGATACGGTT and nuc-R: AGCCAAGCCTTGACGAACTAAAGC; the target gene was nuc (thermonuclease gene), and the expected amplicon size was 279 bp; the reaction conditions were initial denaturation at 96 °C for 10 min, followed by 30 cycles of denaturation at 96 °C for 30 s, annealing at 55 °C for 30 s, and extension at 72 °C for 30 s, with a final extension at 72 °C for 10 min. A positive band of approximately 279 bp was observed after agarose gel electrophoresis, and the isolate was accordingly identified as Staphylococcus aureus.
2.5.8. Isolation and Identification of Mycoplasma spp.
Nasal swab samples were transferred into 9 mL of sterile saline and vortexed for 1 min to obtain a 1:10 dilution. The diluted suspension was spread onto MEM-K2 agar by the streak-plate method and cultured at 37 °C under 5% CO2 for 7–14 d; typical “fried-egg” colonies were picked and passaged and purified 3 times on fresh medium to obtain a pure culture (Mycoplasma spp.) isolate; Mycoplasma lack a cell wall and stain weakly and atypically with Gram staining, and routine microscopy is therefore of limited reference value, so colony morphology and PCR results were used as the main basis for identification. Single colonies were then picked, and the 16S rRNA gene of Mycoplasma sp. was amplified by PCR. The primers used were Mm-F: CGAAAGCGGCTTACTGGCTTGTT and Mm-R: TTGAGATTAGCTCCCCTTCACAG; the target gene was the Mycoplasma mycoides cluster 16S rRNA gene, and the expected amplicon size was 548 bp; the reaction conditions were initial denaturation at 96 °C for 10 min, followed by 30 cycles of denaturation at 96 °C for 30 s, annealing at 53 °C for 30 s, and extension at 72 °C for 30 s, with a final extension at 72 °C for 10 min. A positive band of approximately 548 bp was observed after agarose gel electrophoresis, and the isolate was accordingly assigned to the Mycoplasma mycoides cluster.
2.6. Statistical Analysis
Pathogen carriage rates were expressed as the proportion of positive calves among the calves examined (n = 7) at each time point and were compared descriptively only (each calf was sampled at both time points and served as its own control, so these carriage data are paired observations from the same 7 animals), without statistical testing. Analysis of the 16S rRNA gene sequencing data was performed based on the ASV table output by the NovoMagic platform: genus-level relative abundance bar plots were calculated from the group means, taking the top 10 genera by abundance, and are presented at both the individual-sample and group levels; the ASV Venn diagram was based on ASV-level analysis; alpha diversity (Shannon and Simpson indices) was calculated using the default pipeline of the platform, and between-group comparisons were performed using the paired Wilcoxon signed-rank test with Benjamini–Hochberg (BH) false discovery rate (FDR) correction applied across these two indices, two-sided; beta diversity was calculated based on the weighted UniFrac distance (weighted UniFrac), and PCoA, NMDS ordination, and UPGMA clustering (top 10 taxa by total abundance at the genus level) were all performed on this distance matrix; beta diversity indices were compared between the two time points using the two-sample t-test and the Wilcoxon rank-sum test implemented in the platform for between-group differences in beta diversity indices; because these modules treat the pre- and post-supplementation samples as two independent groups, their output is used only as a descriptive summary of within-group dispersion and is not used as the inferential basis for any statement about community structure; Genus-level differential abundance analysis was performed on the ASV table summarized at the genus level, and the paired Wilcoxon signed-rank test was used to compare the two time points before and after supplementation, with a BH-adjusted q < 0.05 considered significant and an uncorrected p < 0.05 described as nominally significant; the taxa contributing to between-group differences were identified by SIMPER analysis (Bray–Curtis distance) to obtain the contribution rate of each genus to the average between-group dissimilarity. All tests were two-tailed, and the statistical analyses were completed in the NovoMagic platform.
Taken together, three statistical elements must be distinguished. (i) The paired Wilcoxon signed-rank test is the primary inferential test for every comparison between the two time points, because the 7 calves were sampled twice and each animal served as its own control; its two-sided p value is reported as a number rather than as a threshold. (ii) The NovoMagic t-test is not a separate analysis of independent data: it is the default be-tween-group module of the sequencing platform, in which the pre- and post-supplementation samples are treated as two independent groups, and the p value printed in Between-group differences in the genus-level relative abundances of rectal swab samples from calves is the output of this module; it is reported only to document the platform-generated figure and does not form the basis of any inference. (iii) FDR correction is the Benjamini–Hochberg procedure applied to the p values of the primary test within a predefined family of comparisons, which converts each uncorrected p value into an adjusted q value; the alpha-diversity indices (m = 2) and the genera subjected to differential abundance screening were corrected as two separate families. Accordingly, each observation indicator is linked to one method: body weight (Table 2) and pathogen carriage rates are descriptive; alpha diversity (Shannon and Simpson indices) uses the paired Wilcoxon signed-rank test with BH correction; beta-diversity indices use the platform two-sample t-test and Wilcoxon rank-sum module as a descriptive summary of within-group dispersion; and genus-level differential abundance uses the paired Wilcoxon signed-rank test as the primary test, with the platform t-test reported alongside it. For every inferential comparison, both the uncorrected p value and the BH-adjusted q value are given in Section 4.
Table 2.
Initial and final body weights of calves.
3. 16S rRNA Gene Amplicon Sequencing
Rectal swab samples collected before supplementation and after 14 d of supplementation were transported to a commercial sequencing company on dry ice for 16S rRNA gene amplicon sequencing and bioinformatic analysis.
All samples were sequenced and analyzed on the NovoMagic platform.
3.1. Experimental Procedure
3.1.1. Amplicon Generation
16S rRNA/18SrRNA/ITS genes of distinct regions (16SV4/16SV3/16SV3- V4/16SV4-V5,18SV4/18SV9, ITS1/ITS2, ArcV4) were amplified used specific primer (e.g., 16SV4:515F- 806R) with the barcode. All PCR reactions were carried out with 15 µL of Phusion High-Fidelity PCR Master Mix, 0.2 µM of forward and reverse primers, and about 10 ng of template DNA. Thermal cycling consisted of initial denaturation at 98 °C for 1 min, followed by 30 cycles of denaturation at 98 °C for 10 s, annealing at 50 °C for 30 s, and elongation at 72 °C for 30 s and 72 °C for 5 min.
3.1.2. PCR Product Quantification and Qualification
The PCR products were purified using magnetic bead purification. Samples were mixed in equidensity ratios based on the concentration of PCR products. After thorough mixing, the PCR products were detected and target bands were recovered.
3.1.3. Library Preparation and Sequencing
Sequencing libraries were generated and indexes were added. The library was checked with Qubit and real-time PCR for quantification and bioanalyzer for size distribution detection. Quantified libraries were pooled and sequenced on NovaSeq 6000 platforms (Illumina, San Diego, CA, USA), according to effective library concentration and data amount required.
3.2. Bioinformatics Analysis Pipeline
3.2.1. Paired-End Reads’ Assembly and Quality Control
Data Split
Paired- end reads were assigned to samples based on their unique barcode and truncated by cutting off the barcode and primer sequence.
Sequence Assembly
Paired-end reads were merged using FLASH (V1.2. 11, http://ccb.jhu.edu/software/FLASH/, accessed on 25 December 2025), a very fast and accurate analysis tool, which was designed to merge paired end reads when at least some of the reads overlap with the read generated from the opposite end of the same DNA fragment, and the splicing sequences were called raw tags.
Data Filtration
Quality filtering on the raw tags was performed using the fastp (V0.23.1) software to obtain high-quality Clean Tags.
Chimera Removal
The tags were compared with the reference databases (Silva database (16S), https://www.arb-silva.de/, accessed on 25 December 2025; Unite Database (ITS), https://unite.ut.ee/, accessed on 25 December 2025) to detect chimera sequences, and the effective tags were obtained by removing the chimera sequences with the vsearch package (V2.16.0, https://github.com/torognes/vsearch, accessed on 25 December 2025).
3.2.2. ASV Denoising and Species Annotation
ASV Denoising
For the Effective Tags obtained previously, denoising was performed with the DADA2 module in the QIIME2 software (025.4.dada2) to obtain initial ASVs (Amplicon Sequence Variants).
Species Annotation
Species annotation was performed using QIIME2 software. For 16S, the annotation database is Silva Database, while for ITS, it is Unite Database. For unregular regions, Micro_NT is used by default (a sub-library obtained by extracting archaea, fungi, viruses, and bacteria from the NT).
Note:
The fasta file (SILVA_138.1_SSURef_NR99_tax_silva.fasta) from the Silva official website only provide species name rather than taxonomic information, and their taxonomic information file is incomplete. Therefore, we need use species names to get their taxonomic information from the NCBI. At first, the taxonomic information file from Silva is used for annotation; for those sequences that cannot be annotated, a dmp file provided by NCBI would be used to supplement the taxonomic information. In order to study the phylogenetic relationships of each ASV and the differences in the dominant species among different samples (groups), multiple sequence alignment was performed using QIIME2 software, and the resulting alignment was used to construct a phylogenetic tree for the UniFrac-based beta diversity analyses.
Data Normalization
The absolute abundance of ASVs was normalized using a standard of sequence number corresponding to the sample with the least sequences. Subsequent analysis of alpha diversity and beta diversity was performed based on the output normalized data.
Relative Abundance
The top 10 taxa of each sample at each taxonomic rank (phylum and genus) were selected to plot the distribution histogram of relative abundance in Perl through SVG function.
Venn and Flower Diagrams
Venn diagrams visually display the common and unique information between different samples or groups. Venn diagrams were produced in R with the VennDiagram function and in perl with the SVG function.
3.2.3. Alpha Diversity
In order to analyze the diversity, richness and evenness of the communities in the sample, alpha diversity was calculated for the Shannon and Simpson indices in QIIME 2.
Two indices were used to identify community diversity: the Shannon index (https://scikit.bio/docs/latest/generated/skbio.diversity.alpha.html, accessed on 25 December 2025) and the Simpson index (https://scikit.bio/docs/latest/generated/skbio.diversity.alpha.simpson.html, accessed on 25 December 2025).
3.2.4. Beta Diversity
Beta Diversity
In order to evaluate the complexity of the community composition and compare the differences between samples (groups), beta diversity was calculated based on weighted and unweighted unifrac distances in QIIME2, and Bray–Curtis distances were additionally calculated for SIMPER analysis.
Spearman Correlation Heatmap
A Spearman correlation heatmap based on genus-level relative abundance was generated in R to display the correlation between samples.
Unweighted Pair-Group Method with Arithmetic Mean (UPGMA)
A cluster tree was constructed using UPGMA, which is based on the weighted unifrac distance matrix. This is widely used in ecology for evolutionary classification. The UPGMA dendrogram was drawn through the upgma.tre function within QIIME.
Cluster Analysis
Within-group dispersion was compared between the two groups using a two-sample t-test and the Wilcoxon rank-sum test, and the results were displayed as box plots.
Principal Coordinate Analysis (PCoA) was performed to get principal coordinates and visualize from complex and multidimensional data. A distance matrix of weighted or unweighted unifrac among samples was obtained before transformation to a new set of orthogonal axes, wherein the maximum-variation factor is demonstrated by the first principal coordinate, the second one by the second principal coordinate, and so on. PCoA analysis was performed by the ade4 package and ggplot2 package in R software (Version 4.0.3).
Non-metric multidimensional scaling (NMDS) was also implemented for data dimension reduction. Similar to the PCoA, NMDS also uses the distance matrix but it emphasizes the numerical rank instead. The distance between sample points on the diagram can only reflect the rank information rather than the numerical differences. NMDS analysis was implemented through R software with the ade4 package and ggplot2 package.
3.2.5. Community Difference Analysis
Between-group differences in community structure were assessed by SIMPER analysis, and genus-level relative abundances were compared between the two groups by two-sample tests.
Simper can reveal the contribution of each species to the differentiation between groups. The top 10 species were selected and presented on the graph. It was performed in R with the Vegan package and ggplot2 package.
4. Results
4.1. Changes in Body Weight of Calves Before and After Astragalus Supplementation
Seven calves were randomly selected and numbered. The calves were weighed and recorded before the morning feeding at the start of the trial (D0) and after 14 d (D14), the results are shown in Table 2.
4.2. Detection of Enteric Pathogens in Calves Before and After Astragalus Supplementation
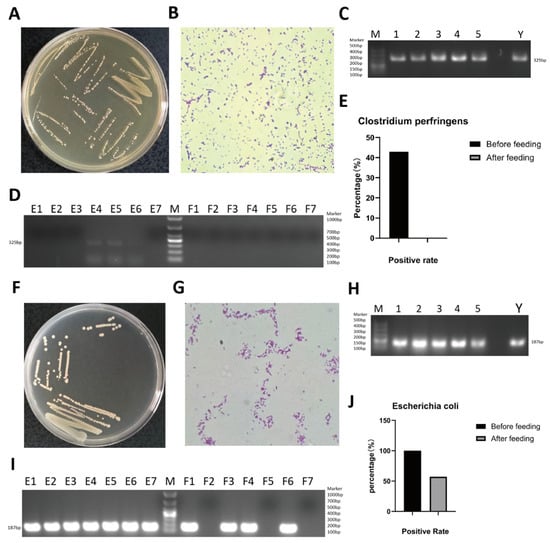
To investigate the carriage of enteric bacteria before and after supplementation, seven 2-month-old calves were selected and continuously supplemented with Astragalus powder for 14 d. Rectal swab samples were collected before and after supplementation and tested for the target bacteria, including Clostridium perfringens, Escherichia coli, and Salmonella [11]. After culture in cooked meat medium and selective isolation on TSC agar, colonies 2–5 mm in diameter with a smooth surface were observed on TSC agar plates (Figure 1A). Gram staining revealed Gram-positive short rods (Figure 1B). Single colonies were randomly picked from Figure 1A, and the cpa virulence gene of Clostridium perfringens was amplified by PCR; a positive band of approximately 324 bp was observed by agarose gel electrophoresis (Figure 1C). Based on these identification results, the presence of Clostridium perfringens in the rectal swab samples of calves was confirmed. The cpa virulence gene was further detected by PCR using DNA extracted directly from the rectal swab samples. The results showed that calves E4, E5, and E6 carried Clostridium perfringens before Astragalus supplementation, whereas none of the seven calves were positive after supplementation; the carriage rate of Clostridium perfringens decreased from 42.9% (3/7) before supplementation to 0 (0/7) after supplementation (Figure 1D,E). Screening of rectal swab samples on EMB agar revealed the presence of Escherichia coli, which formed round colonies with a typical metallic sheen (Figure 1F). Gram staining revealed Gram-negative short rods (Figure 1G). PCR amplification of the uidA gene of Escherichia coli yielded an electrophoretic band of approximately 187 bp (Figure 1H). Based on these identification results, the presence of uidA-positive E. coli in the rectal swab samples was confirmed. The uidA gene was further detected by PCR using DNA extracted directly from the rectal swab samples. The results showed that all seven calves (E1–E7) carried Escherichia coli before supplementation and that F1, F3, F4, and F6 were positive after supplementation; the carriage rate of uidA-positive E. coli decreased from 100% (7/7) to 57.1% (4/7) (Figure 1I,J). After screening on SS agar, Salmonella was not detected in rectal swab samples either before or after supplementation. In summary, the isolation and identification results for the rectal swab samples showed that the carriage rates of the enteric pathogens examined were lower after supplementation than before. It should be noted that this comparison is a self-comparison of the same animals before and after supplementation and cannot exclude the influence of factors such as increasing age, spontaneous recovery, and the rearing environment.
Figure 1.
Isolation and identification of pathogens in rectal swab samples collected from calves before and after Astragalus supplementation. (A) Colony morphology of Clostridium perfringens isolated from calf rectal swab samples on TSC agar. (B) Gram staining identification of Clostridium perfringens isolated from calf rectal swab samples. (C) PCR identification of the cpa virulence gene of Clostridium perfringens isolated from calf rectal swab samples. Lane M, DL500 DNA marker; lanes 1–5, 5 colonies randomly picked from Figure 1A; lane Y, positive control. (D) PCR detection of the cpa virulence gene of Clostridium perfringens in rectal swab samples collected from calves before and after Astragalus supplementation. Lane M, DL1000 DNA marker; lanes E1–E7, rectal swab samples collected before Astragalus supplementation; lanes F1–F7, rectal swab samples collected after Astragalus supplementation. (E) Carriage rate of Clostridium perfringens in rectal swab samples collected from calves before and after Astragalus supplementation. (F) Colony morphology of Escherichia coli isolated from calf rectal swab samples on EMB agar. (G) Gram staining identification of Escherichia coli isolated from calf rectal swab samples. (H) PCR identification of the uidA gene of Escherichia coli isolated from calf rectal swab samples. Lane M, DL500 DNA marker; lanes 1–5, 5 colonies randomly picked; lane Y, positive control. (I) PCR detection of the uidA gene of Escherichia coli in rectal swab samples collected from calves before and after Astragalus supplementation. Lane M, DL1000 DNA marker; lanes E1–E7, rectal swab samples E1–E7 collected before Astragalus supplementation; lanes F1–F7, rectal swab samples E114–E714 collected after Astragalus supplementation. (J) Carriage rate of uidA-positive Escherichia coli in rectal swab samples collected from calves before and after Astragalus supplementation.
4.3. Detection of Respiratory Pathogens in Calves Before and After Astragalus Supplementation
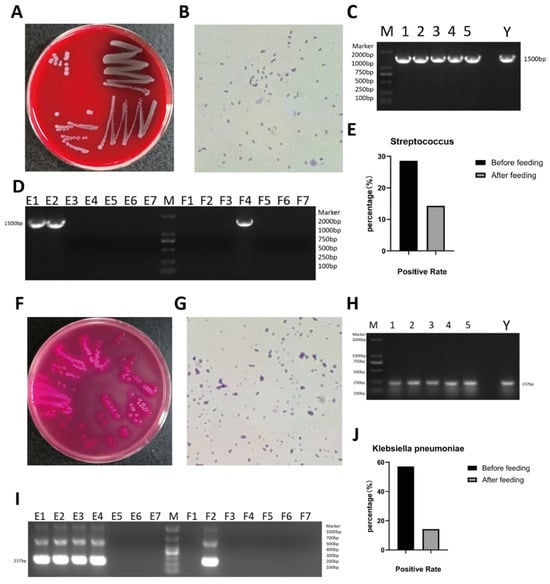
Nasal swab samples were collected before and after supplementation and tested for respiratory pathogens, including Streptococcus, Klebsiella pneumoniae, Staphylococcus aureus, and Mycoplasma bovis. After culture on 5% sheep blood agar and screening on blood agar plates, pinpoint, round colonies 0.5–3 mm in diameter were observed (Figure 2A). Gram staining revealed Gram-positive cocci arranged in chains (Figure 2B). Single colonies were randomly picked from Figure 2A, and the 16S rRNA gene of Streptococcus was amplified by PCR; a positive band of approximately 1500 bp was observed by agarose gel electrophoresis (Figure 2C). Based on these identification results, the presence of Streptococcus in the nasal swab samples of calves was confirmed. The 16S rRNA gene was further detected by PCR using DNA extracted directly from the nasal swab samples. The results showed that calves E1 and E2 carried Streptococcus before supplementation and that only F4 was positive after supplementation; the carriage rate decreased from 28.6% (2/7) to 14.3% (1/7) (Figure 2D,E). Screening on MacConkey agar yielded round colonies approximately 3–4 mm in diameter (Figure 2F). Gram staining revealed Gram-negative rods (Figure 2G). Single colonies were randomly picked from Figure 2F, and the khe gene of Klebsiella pneumoniae was amplified by PCR; a positive band of approximately 215 bp was observed by agarose gel electrophoresis (Figure 2H). Based on these identification results, the presence of Klebsiella pneumoniae in the nasal swab samples of calves was confirmed. The khe gene was further detected by PCR using DNA extracted directly from the nasal swab samples. The results showed that calves E1, E2, E3, and E4 carried Klebsiella pneumoniae before supplementation and that only F1 was positive after supplementation; the carriage rate decreased from 57.1% (4/7) to 14.3% (1/7) (Figure 2I,J). After screening on MEM-K2 agar, Mycoplasma was not detected in nasal swab samples either before or after supplementation; likewise, after screening on Baird–Parker agar, Staphylococcus aureus was not detected in nasal swab samples either before or after supplementation. In summary, the isolation and identification results for the nasal swab samples showed that the carriage rates of the respiratory pathogens examined were lower after supplementation than before.
Figure 2.
Isolation and identification of pathogens in nasal swab samples collected from calves before and after Astragalus supplementation. (A) Colony morphology of Streptococcus isolated from calf nasal swab samples on sheep blood agar. (B) Gram staining identification of Streptococcus isolated from calf nasal swab samples. (C) PCR identification of the 16S rRNA gene of Streptococcus isolated from calf nasal swab samples. Lane M, DL2000 DNA marker; lanes 1–5, 5 colonies randomly picked from Figure 2A; lane Y, positive control. (D) PCR detection of the 16S rRNA gene of Streptococcus in nasal swab samples collected from calves before and after supplementation. Lane M, DL2000 DNA marker; lanes E1–E7, nasal swab samples collected before supplementation; lanes F1–F7, nasal swab samples collected after 14 d of supplementation. (E) Carriage rate of Streptococcus in nasal swab samples of calves before and after supplementation (based on the number of positive calves among the 7 calves). (F) Colony morphology of Klebsiella pneumoniae isolated from calf nasal swab samples on MacConkey agar. (G) Gram staining identification of Klebsiella pneumoniae isolated from calf nasal swab samples. (H) PCR identification of the khe gene of Klebsiella pneumoniae isolated from calf nasal swab samples. Lane M, DL2000 DNA marker; lanes 1–5, 5 colonies randomly picked from Figure 2F; lane Y, positive control. (I) PCR detection of the khe gene of Klebsiella pneumoniae in nasal swab samples collected from calves before and after supplementation. Lane M, DL1000 DNA marker; lanes E1–E7, nasal swab samples collected before supplementation; lanes F1–F7, nasal swab samples collected after 14 d of supplementation. (J) Carriage rate of Klebsiella pneumoniae in nasal swab samples of calves before and after supplementation (based on the number of positive calves among the 7 calves).
4.4. Changes in Gut Microbial Community Composition and Diversity in Calves Before and After Astragalus Supplementation
To explore the composition and richness of the gut microbial community of calves before and after supplementation, rectal swab samples collected before supplementation and after 14 d of supplementation were analyzed by 16S rRNA gene amplicon sequencing.
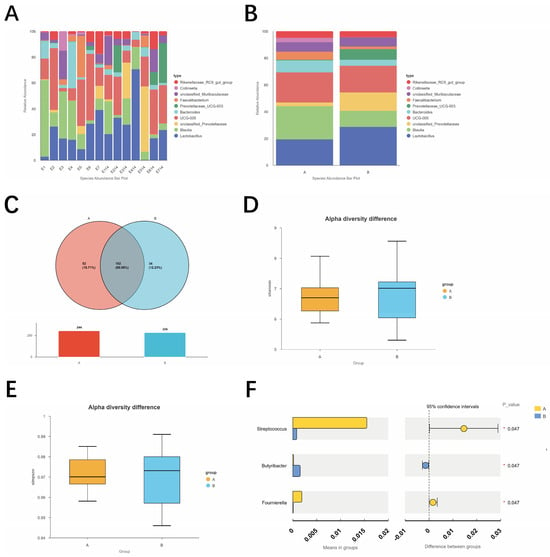
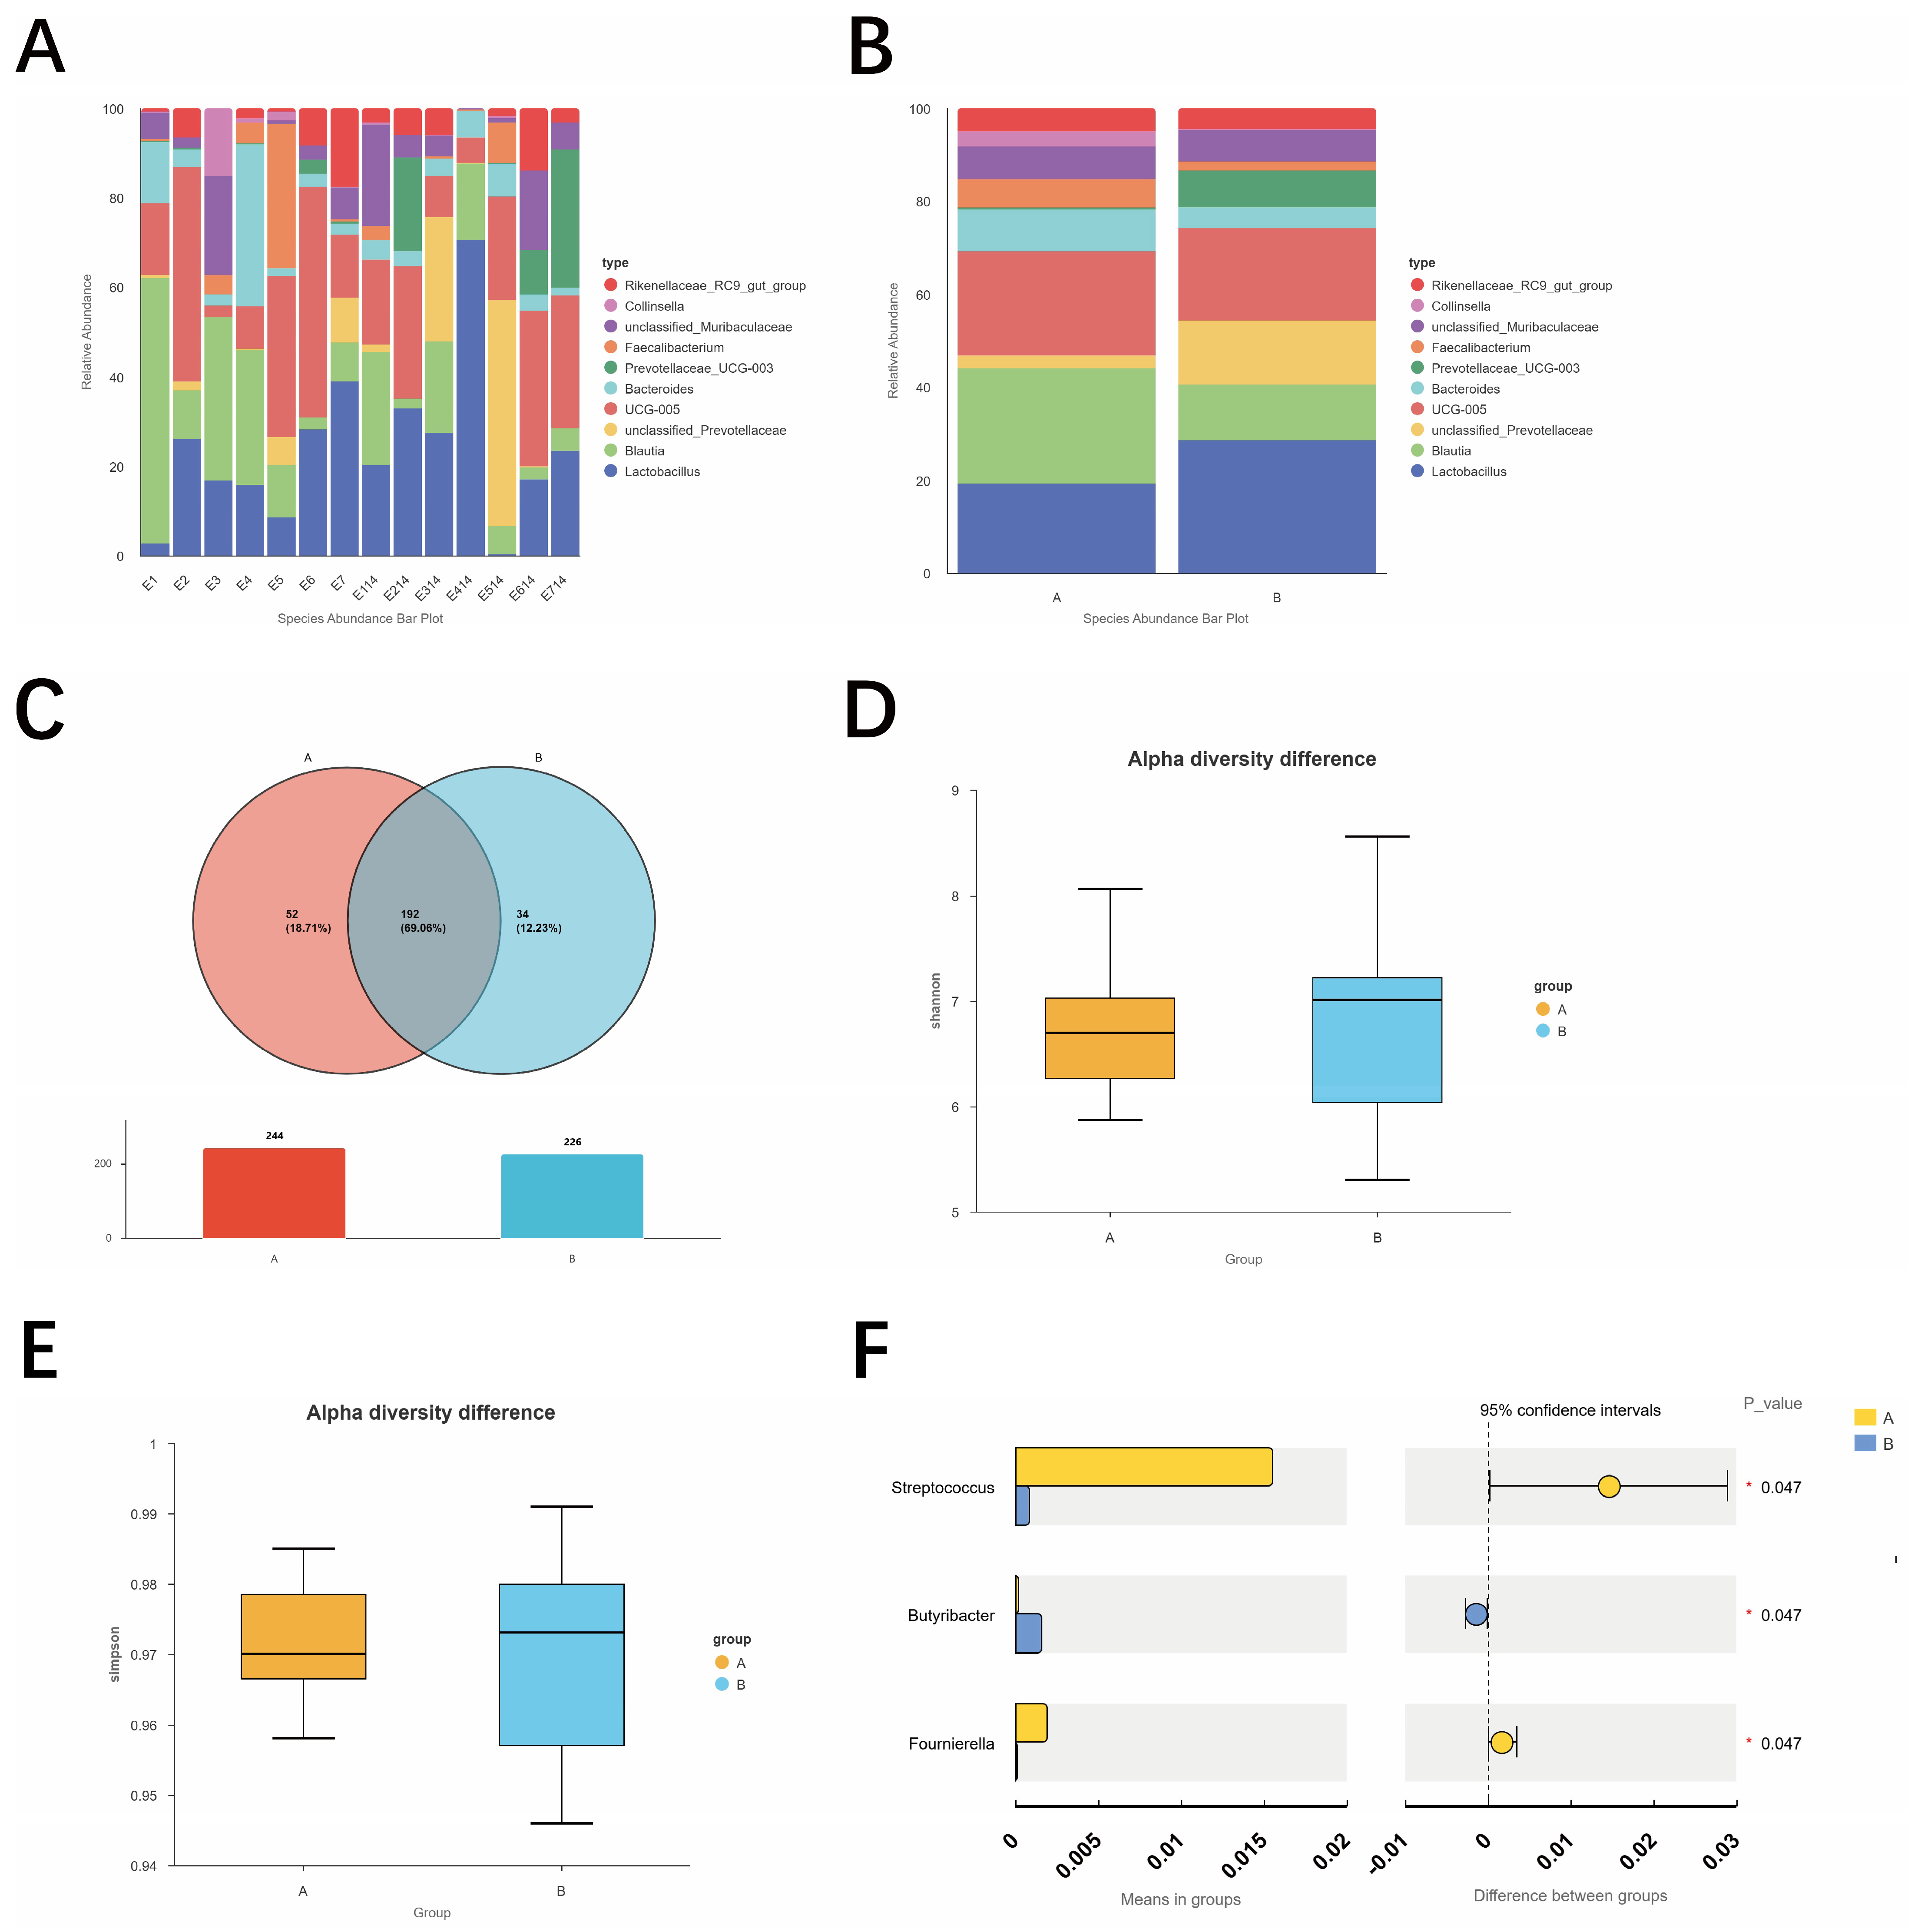
The results showed that the microbial communities in the rectal swab samples of cattle before and after supplementation were mainly composed of Lactobacillus and Blautia; in addition, unclassified_Prevotellaceae, UCG-005, Bacteroides, Prevotellaceae_UCG-003, Faecalibacterium, unclassified_Muribaculaceae, Collinsella, Rikenellaceae_RC9_gut_group, and other taxa were detected, indicating that the calf gut harbors a complex microbial community structure (Figure 3A).
Figure 3.
Analysis of the microbial community composition and diversity of rectal swab samples from calves before and after Astragalus supplementation. (A) Genus-level species abundance bar chart of individual rectal swab samples before and after supplementation. E1–E7, rectal swab samples collected before supplementation; E114–E714, rectal swab samples collected after 14 d of supplementation. (B) Group-level species abundance bar chart of rectal swab samples before and after supplementation. Group A, rectal swab samples collected before supplementation; Group B, rectal swab samples collected after 14 d of supplementation. (C) ASV Venn diagram of rectal swab samples before and after supplementation. Group A, before supplementation; Group B, after 14 d of supplementation. (D) Between-group comparison of the Shannon index of rectal swab samples before and after supplementation. Group A, before supplementation; Group B, after 14 d of supplementation. (E) Between-group comparison of the Simpson index of rectal swab samples before and after supplementation. Group A, before supplementation; Group B, after 14 d of supplementation. (F) Between-group differences in genus-level relative abundances of calf rectal swab samples before and after Astragalus supplementation. Only genera with significant between-group differences (p < 0.05) are shown; the bars on the left indicate the mean relative abundance of each group, and those on the right indicate the between-group difference and its 95% confidence interval, denoting p < 0.05. Group A represents rectal swab samples collected before Astragalus supplementation, and Group B represents rectal swab samples collected 14 d after Astragalus supplementation. An asterisk (*) indicates a significant difference between groups (p < 0.05).
Further analysis of the genus-level stacked bar plots revealed pronounced individual differences in the gut microbiota of calves before supplementation (Figure 3A); at the group mean level, the relative abundances of Lactobacillus and unclassified Prevotellaceae tended to increase after supplementation, whereas those of Blautia and Collinsella tended to decrease (Figure 3B). The ASV Venn diagram showed that a total of 244 ASVs were detected before supplementation and 226 ASVs after supplementation; 192 ASVs were shared by the two groups, accounting for 69.06% of the total ASVs, while 52 ASVs (18.71%) were unique to the pre-supplementation group and 34 ASVs (12.23%) were unique to the post-supplementation group (Figure 3C).
Alpha diversity analysis showed that the medians of the Shannon (Figure 3D) and Simpson indices (Figure 3E) of the gut microbiota of calves decreased slightly after supplementation compared with before supplementation, but the distribution ranges of the box plots of the two groups overlapped and no significance markers were observed (p > 0.05).
To further determine whether the above genus-level differences were statistically significant, an exploratory genus-level differential abundance test was performed on the two groups before and after supplementation, and three genera with nominally different relative abundances were detected (Figure 3F). The p value displayed in Figure 3F is the output of the NovoMagic between-group t-test module, in which the two time points are treated as two independent groups; for the paired design used here, the paired Wilcoxon signed-rank test gave p = 0.046860 for Streptococcus, p = 0.047202 for Fournierella and p = 0.046809 for Butyrivibacter, and the corresponding BH-adjusted q values (m = 3 genera tested) were q = 0.65526, 0.65526 and 0.65526. Among these, the relative abundance of Streptococcus decreased from approximately 1.65% before supplementation to approximately 0.18% after supplementation, and that of Fournierella decreased from approximately 0.25% to approximately 0.06%; both decreases were nominally significant after supplementation. In contrast, Butyrivibacter increased from approximately 0.02% to approximately 0.25% and was the only genus whose increase was nominally significant after supplementation. It should be noted that no statistical difference was detected between the two time points for Lactobacillus and Blautia, the two genera with the highest relative abundances (p > 0.05), suggesting that the increase in Lactobacillus and the decrease in Blautia observed in Figure 3B were not yet sufficient to constitute a stable between-group difference within the 14 d supplementation period; therefore, these changes are described only as trends in this study.
In summary, over time, the genus-level relative abundance and ASV composition of the calf gut microbiota exhibited certain changing trends before and after astragalus supplementation (the relative abundance of Lactobacillus and other genera increased, whereas Blautia and Collinsella showed declining trends). Nevertheless, the composition of core species remained highly overlapping, and the overall α-diversity did not change significantly.
4.5. Changes in Gut Microbial Community Structure in Calves Before and After Astragalus Supplementation
To further explore the changes in the structure of the gut microbial community of calves before and after Astragalus supplementation, beta diversity index analysis, PCoA, NMDS, UPGMA clustering, and within-group dispersion comparison were performed on the microbial communities of rectal swab samples collected before and after supplementation.
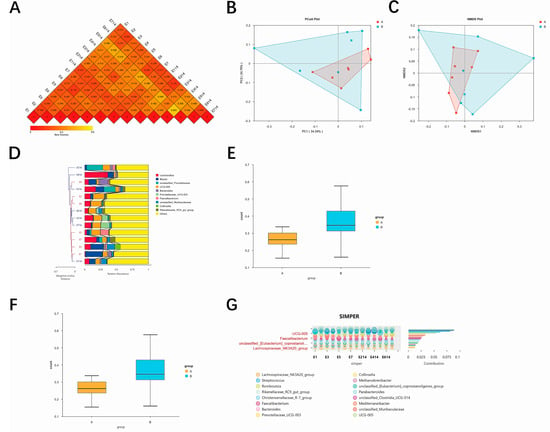
Beta diversity index analysis showed that the correlation coefficients between samples were mostly concentrated in the range of 0.4–0.7, and the heatmap blocks were predominantly orange-red (Figure 4A), indicating that the microbial composition among samples showed a moderate positive correlation overall, with no obvious outliers deviating from the main body.
Figure 4.
Analysis of the microbial community structure of rectal swab samples from calves before and after Astragalus supplementation. (A) Spearman correlation heatmap of individual rectal swab samples before and after supplementation. E1–E7, rectal swab samples collected before supplementation; E114–E714, rectal swab samples collected after 14 d of supplementation. (B) PCoA analysis of rectal swab samples before and after supplementation (based on the weighted UniFrac distance). Group A, before supplementation; Group B, after 14 d of supplementation. (C) NMDS analysis of rectal swab samples before and after supplementation. Group A, before supplementation; Group B, after 14 d of supplementation; Stress = 0.03. (D) UPGMA clustering analysis of rectal swab samples before and after supplementation. E1–E7, rectal swab samples collected before supplementation; E114–E714, rectal swab samples collected after 14 d of supplementation. (E) Between-group difference test of the beta diversity index (two-sample t-test) of rectal swab samples before and after supplementation. Group A, before supplementation; Group B, after 14 d of supplementation. (F) Between-group difference test of the beta diversity index (Wilcoxon rank-sum test) of rectal swab samples before and after supplementation. Group A, before supplementation; Group B, after 14 d of supplementation. (G) SIMPER analysis based on the Bray–Curtis distance, showing the contribution of each genus to the between-group community differences before and after supplementation. The bubble plot on the left indicates the relative abundance of the contributing taxa in each sample, with the bubble diameter proportional to the relative abundance; the bar plot on the right indicates the contribution rate of each genus to the average between-group dissimilarity, and the 4 genera with the highest contribution rates are marked in red. E1–E7, rectal swab samples collected before supplementation; E114–E714, rectal swab samples collected after 14 d of supplementation.
In the PCoA ordination analysis, the first two axes, PC1 and PC2, explained 34.34% and 24.26% of the community variation, respectively, with a cumulative explanation rate of 58.60% (Figure 4B). The pre-supplementation samples (Group A) were relatively tightly clustered in the ordination space and were mainly located in the positive direction of PC1; the post-supplementation samples (Group B) were more dispersed and shifted toward the negative direction along the PC1 axis. The two groups showed a certain degree of separation in the ordination space, but within-group overlap was evident.
NMDS analysis showed a distribution pattern similar to that of PCoA (Figure 4C, Stress = 0.03). The pre-supplementation samples were clustered in a relatively limited area, whereas the post-supplementation samples were more widely distributed and shifted toward another area. The two groups partially overlapped in the ordination space while exhibiting an observable distributional difference.
In the UPGMA clustering analysis, the pre- and post-supplementation samples were to some extent grouped into different branches, with some pre-supplementation samples clustering together and the post-supplementation samples also forming a relatively independent clustering relationship (Figure 4D). The stacked bar plot of phylum-level species abundance on the right shows that the species composition of samples within the same cluster branch was relatively similar. Owing to individual differences, some pre- and post-supplementation samples were intermingled and were not completely separated by group.
Comparison of within-group dispersion (Figure 4E,F) showed that, under the distance metric corresponding to the t-test, the box position of Group B was shifted upward relative to that of Group A, indicating a trend toward increased dispersion of samples within the group; under the distance metric corresponding to the Wilcoxon test, the distribution ranges of the two groups overlapped considerably and the difference in medians was small.
To identify the main taxa contributing to the differences in community structure between the two groups, SIMPER analysis was further performed (Figure 4G). The results showed that the four genera contributing most to the between-group difference before and after supplementation were, in order, UCG-005, Faecalibacterium, unclassified_Eubacterium_coprostanoligenes_group, and Lachnospiraceae_NK3A20_group, followed by Streptococcus, Collinsella, Christensenellaceae_R-7_group, and others, among which the contribution rate of UCG-005 was markedly higher than those of the remaining taxa. It should be pointed out that the SIMPER contribution rate depends on both the relative abundance of a taxon and the consistency of its change between groups; therefore, the taxa with the highest contribution rates are not equivalent to those with the highest abundances: in this study, Lactobacillus and Blautia, the most abundant genera, did not appear at the top of the contribution ranking, indicating that although their group means fluctuated to some extent, the inter-individual variation within groups was relatively large and their contribution to the overall community differentiation was limited. Collectively, Figure 4A–G reveal that continuous astragalus supplementation drove divergent trends in microbial communities of calf rectal swabs regarding ordination distribution, sample clustering and intra-group dispersion. However, in the absence of a concurrent control group, this phenomenon cannot be directly ascribed to astragalus supplementation, and the effects of time and other factors need to be accounted for in future research.
5. Discussion
In this study, seven 2-month-old calves were continuously supplemented with Astragalus for 14 d, and the microbial changes in rectal and nasal swab samples before and after supplementation were examined at two levels: pathogen isolation and culture, and 16S rRNA gene amplicon sequencing. Overall, the detection rates of the enteric pathogens examined (Clostridium perfringens and uidA-positive Escherichia coli) and of the respiratory pathogens examined (Streptococcus and Klebsiella pneumoniae) were all lower after supplementation than before; The gut microbiota exhibited distinct trends of change in genus-level relative abundance, shared/unique ASV relationships, and the ordination space of beta diversity. In contrast, the median values of the Shannon and Simpson indices decreased only slightly; the boxes overlapped between groups, and no statistical significance was observed.
At the level of pathogen detection, the detection rates of the three tested bacteria showed a decreasing trend after supplementation, whereas Salmonella, Mycoplasma bovis, and Staphylococcus aureus were not detected either before or after supplementation. This trend is consistent in direction with the immunomodulatory and gut microecological regulatory effects of APS, the main active component of Astragalus, previously reported in livestock and poultry: APS can reduce the colonization probability of opportunistic pathogens by promoting intestinal mucosal sIgA secretion, enhancing the activity of macrophages and lymphocytes, and maintaining the integrity of the intestinal mucosal barrier. Notably, the detected pathogenic bacteria displayed a parallel decline in both the intestinal and respiratory tracts in the present study. This finding bears similarities to previous studies reporting that astragalus supplementation may exert concomitant effects on the respiratory microbiota through mucosal–immune crosstalk of the “gut–lung axis” [12]; however, because immunological indicators such as cytokines and sIgA were not measured, this link remains only an indirect observation in the present study and cannot yet serve as direct evidence. This directional agreement, however, is no more than a comparison with published findings and does not indicate that these mechanisms operated in the present study: sIgA, cytokines, intestinal barrier proteins and the activity of macrophages or lymphocytes were not measured here. The parallel decrease in the examined pathogens at the intestinal and respiratory sites is therefore recorded as an observation that remains to be explained by future work.
At the level of gut microbiota composition, the relative abundances of Lactobacillus and unclassified Prevotellaceae tended to increase after supplementation, whereas those of Blautia and Collinsella tended to decrease. Lactobacillus is a common lactic acid-producing genus in the calf gut, and members of this genus have been reported to inhibit the colonization of pathogens such as Clostridium perfringens and Escherichia coli through lactic acid and bacteriocin production and through nutrient competition. In the present study, however, neither lactic acid nor bacteriocin production was measured and no antagonism assay was performed, so the directional agreement between the higher relative abundance of Lactobacillus and the lower pathogen detection rates is a hypothesis-generating observation rather than evidence of inhibition. Blautia and Collinsella are generally regarded as genera associated with short-chain fatty acid production or intestinal inflammation [13]; the decrease in their relative abundances after supplementation may reflect a redistribution of microbial niches after short-term supplementation rather than a unidirectional “beneficial/harmful” change. Because metagenomic functional prediction or metabolomic profiling was not performed in this study, it is not yet possible to determine whether this change was accompanied by alterations in metabolites such as short-chain fatty acids and bile acids. At the ASV level, shared ASVs accounted for 69.06% before and after supplementation, with 52 ASVs unique to the pre-supplementation samples and 34 unique to the post-supplementation samples, suggesting that the core microbial framework retained a high degree of overlap after short-term supplementation and that the changes occurred mainly through the replacement of low-abundance taxa.
At the level of community structure, the Spearman correlation heatmap showed that the correlation coefficients between samples were concentrated at 0.4–0.7, with no obvious outliers, suggesting that the baseline microbiota of the seven calves had a certain degree of similarity among individuals; in PCoA and NMDS, the first two axes cumulatively explained 58.60% of the community variation, the pre-supplementation samples were relatively tightly clustered, and the post-supplementation samples shifted toward the negative direction of the PC1 axis with an expanded distribution range, so that the two groups partially overlapped in the ordination space but showed an observable trend of separation; UPGMA clustering likewise showed that the two groups of samples were to some extent clustered into similar branches, although intermingling occurred because of individual differences. The box plots of the beta diversity indices based on the t-test and the Wilcoxon test (Figure 4E,F) displayed two patterns, namely “an upward shift of the box and increased dispersion in the post-supplementation group” and “similar medians with considerable overlap between the two groups”, respectively, suggesting that the sensitivity to differences in community structure before and after supplementation differed among distance metrics, which is consistent with the observation of “partial but incomplete separation” in the PCoA/NMDS analysis. Alpha diversity did not change significantly, whereas beta diversity showed an observable shift; however, in the absence of a concurrent control group, the extent to which this shift is attributable to supplementation rather than to increasing age still requires further verification.
Genus-level differential abundance testing further showed that the relative abundance of intestinal Streptococcus decreased by approximately one order of magnitude after supplementation (from approximately 1.65% to 0.18%, p = 0.046860; BH-adjusted q = 0.65526). This result is directionally consistent with the observed decrease in the detection rate of respiratory Streptococcus in nasal swabs from 28.6% to 14.3% in the present study. It must be emphasized, however, that 16S rRNA gene amplicon sequencing can identify taxa only to the genus level, so it remains undetermined whether the Streptococcus detected in the intestine and in the respiratory tract belong to the same species; moreover, because no concurrent control group was set in this study, the above association remains a parallel change in the same animals over the same period and is insufficient to serve as causal evidence. In the same period, the relative abundance of Butyrivibacter increased and that of Fournierella decreased, suggesting that short-term supplementation may also cause shifts among different genera within the butyrate-producing bacteria; combined with the decreasing trend in the relative abundance of Blautia (also a major butyrate producer), the present study cannot conclude that butyrate-producing bacteria were enhanced overall.
This study has the following limitations. First, the sample size was seven animals, and a longitudinal self-controlled design before and after supplementation was used without a concurrent negative control group, so the contributions of increasing age, a rising proportion of solid feed intake, and natural changes in the rearing environment to the microbiota and to pathogen detection rates cannot be excluded. Second, pathogen detection relied on selective medium isolation and virulence gene PCR identification, which have limited sensitivity and a limited culturable range, so some viable but non-culturable (VBNC) bacteria may have been missed. Third, 16S rRNA gene amplicon sequencing identified taxa only to the genus level, so probiotic and pathogenic strains could not be distinguished at the species or strain level, and functional prediction was not performed. Fourth, the supplementation period was 14 d, and the persistence and rebound effects of the microbiota changes, as well as their associations with phenotypic indicators such as growth performance and diarrhea scores, were not addressed in this study. Fifth, the content of active components in the Astragalus powder and the actual intake of the calves were not measured, and no dose gradient was set, so the dose–effect relationship could not be evaluated. Future studies should enlarge the sample size, add a concurrent control group and dose gradients, extend the observation period, and integrate metagenomic, metabolomic, and mucosal immune indicators to further verify the regulatory effects of Astragalus supplementation on the intestinal–respiratory microecology of calves and the underlying mechanisms.
6. Conclusions
In this study, seven 2-month-old calves were continuously supplemented with Astragalus for 14 d. The results showed that, after supplementation, the carriage rates of Clostridium perfringens and uidA-positive Escherichia coli in rectal swabs decreased from 42.9% (3/7) and 100% (7/7) before supplementation to 0 (0/7) and 57.1% (4/7), respectively; the carriage rates of Streptococcus and Klebsiella pneumoniae in nasal swabs decreased from 28.6% (2/7) and 57.1% (4/7) to 14.3% (1/7), respectively; and Salmonella, Mycoplasma, and Staphylococcus aureus were not detected either before or after supplementation. The results of 16S rRNA gene amplicon sequencing showed that, after supplementation, the gut microbiota of calves tended to show increased relative abundances of Lactobacillus and unclassified Prevotellaceae and decreased relative abundances of Blautia and Collinsella at the genus level; genus-level testing showed that the relative abundance of Streptococcus decreased significantly after supplementation (p < 0.05), which is consistent in direction with the decrease in the carriage rate of Streptococcus in nasal swabs; the total number of ASVs decreased from 244 to 226, and shared ASVs accounted for 69.06% (192/278), indicating that the core species assemblage retained a high degree of overlap; the between-group differences in the Shannon and Simpson indices did not reach significance, whereas PCoA, NMDS, and UPGMA clustering showed observable between-group shifts in the ordination space. Taken together, under the conditions of this trial, short-term Astragalus supplementation was accompanied by decreased carriage rates of the enteric and respiratory pathogens examined in calves and by an observable shift of the gut microbiota toward Lactobacillus enrichment, whereas alpha diversity did not change significantly; because no concurrent control was set, these changes cannot be attributed to Astragalus supplementation, but they may serve as a reference for subsequent controlled studies. These findings may provide a reference for the subsequent evaluation of Astragalus as a feed additive for regulating the gut microecology of calves, although its efficacy still needs to be verified in trials with larger samples, a concurrent control group, and combined immunological and metabolic indicators.
Author Contributions
L.X. and Y.Z. contributed equally to this work. N.L. and J.H. and X.L. conceived and supervised the project and designed the experiments. L.X. and Y.Z. performed most of the experiments, and Y.P. and P.S. performed the isolation and identification of pathogens. K.P. and Y.N. were responsible for the Astragalus supplementation of the calves. W.M. and H.M. assisted with the 16S rRNA data analysis. The manuscript was written by L.X. and N.L., and all authors provided comments and approved it. All authors have read and agreed to the published version of the manuscript.
Funding
This research was funded by the Key Research and Development Program of Ningxia Hui Autonomous Region (grant numbers 2024BBF01014 and 2025BBF02007), the Scientific Research Program of the Education Department of Shaanxi Province (grant number 23JK0412), the Key Technology Demonstration Project for Animal Husbandry of Shaanxi Province (grant number 2024NYGG005-6), and the National Beef Cattle and Yak Industrial Technology System (grant number CARS-37).
Institutional Review Board Statement
All animal experimental procedures were approved by the Laboratory Animal Welfare and Ethics Committee of Northwest A&F University on 25 August 2025 (approval No. IACUC2025-0825) and were carried out in strict accordance with the Guidelines for the Care and Use of Laboratory Animals.
Informed Consent Statement
Not applicable.
Data Availability Statement
The data presented in this study are openly available in the China National Center for Bioinformation (CNCB) under BioProject accession number PRJCA073693 at https://www.cncb.ac.cn, accessed on 15 November 2026.
Conflicts of Interest
The authors of this article declare no conflicts of interest.
References
- Chang, X.; Zhang, X.; Guo, H.; Yao, X.; Zhang, J.; Zhuang, K.; Li, L. The role of Astragalus membranaceus and its derivatives in digestive system diseases: Reconstruction of immune tolerance. Front. Immunol. 2026, 17, 1855390. [Google Scholar] [CrossRef] [Scilit]
- Wei, H.; Ding, L.; Wang, X.; Yan, Q.; Jiang, C.; Hu, C.; Wang, G.; Zhou, Y.; Henkin, Z.; Degen, A.A. Astragalus root extract improved average daily gain, immunity, antioxidant status and ruminal microbiota of early weaned yak calves. J. Sci. Food Agric. 2021, 101, 82–90. [Google Scholar] [CrossRef] [Scilit]
- Ardra, M.; Riyas, P.K.R.; Rahul, K.; Pradhan, C. House cricket (Acheta domesticus) meal as an alternative protein source in pangasius (Pangasianodon hypophthalmus) diets: Effects on growth performance and health status. Anim. Feed. Sci. Technol. 2026, 337, 116715. [Google Scholar] [CrossRef] [Scilit]
- Ma, C.; Zhang, J.; Yang, Q.; Zhang, Q. Research progress on biological functions of astragalus stems and leaves and their application in cattle production: A review. Anim. Biotechnol. 2026, 37, 2631838. [Google Scholar] [CrossRef] [Scilit]
- Liang, H.; Tao, S.; Wang, Y.; Zhao, J.; Yan, C.; Wu, Y.; Liu, N.; Qin, Y. Astragalus polysaccharide: Implication for intestinal barrier, anti-inflammation, and animal production. Front. Nutr. 2024, 11, 1364739. [Google Scholar] [CrossRef] [Scilit]
- Wang, F.; Zhao, Y.; Chen, S.; Chen, L.; Sun, L.; Cao, M.; Li, C.; Zhou, X. Astragaloside IV Alleviates Ammonia-Induced Apoptosis and Oxidative Stress in Bovine Mammary Epithelial Cells. Int. J. Mol. Sci. 2019, 20, 600. [Google Scholar] [CrossRef] [Scilit]
- Che, Y.; Li, L.; Kong, M.; Geng, Y.; Wang, D.; Li, B.; Deng, L.; Chen, G.; Wang, J. Dietary supplementation of Astragalus flavonoids regulates intestinal immunology and the gut microbiota to improve growth performance and intestinal health in weaned piglets. Front. Immunol. 2024, 15, 1459342. [Google Scholar] [CrossRef] [Scilit]
- Yao, K.; Gao, Y.; Yang, L.; Yang, M.; Wu, X.; Zhang, X.; Lv, Z.; Shao, W.; Wei, Y.; Ren, W. Effects of feeding different proportions of steam-flaked corn-based starter on growth performance, immunity and serum metabolism of pre-weaned Simmental calves. Front. Vet. Sci. 2025, 11, 1502738. [Google Scholar] [CrossRef] [Scilit]
- Hallal Ferreira Raro, O.; Poirel, L.; Tocco, M.; Nordmann, P. Impact of veterinary antibiotics on plasmid-encoded antibiotic resistance transfer. J. Antimicrob. Chemother. 2023, 78, 2209–2216. [Google Scholar] [CrossRef] [Scilit]
- Shao, P.; Sha, Y.; Liu, X.; He, Y.; Wang, F.; Hu, J.; Wang, J.; Li, S.; Chen, X.; Yang, W.; et al. Supplementation with Astragalus Root Powder Promotes Rumen Microbiota Density and Metabolome Interactions in Lambs. Animals 2024, 14, 788. [Google Scholar] [CrossRef] [Scilit]
- Yang, Z.; Yan, S.; Zhang, L.; Zhao, C.; Wang, J.; Chen, J.; Liu, Y.; Xu, X.; Wang, Y. Global Genomic Analysis Reveals Spatial Patterns and Temporal Trends of Priority-Antimicrobial Resistance in Salmonellaenterica Isolates from Aquatic Animals. Vet. Sci. 2026, 13, 868. [Google Scholar] [CrossRef] [Scilit]
- de Oliveira, G.L.V.; Oliveira, C.N.S.; Pinzan, C.F.; de Salis, L.V.V.; Cardoso, C.R.B. Microbiota Modulation of the Gut-Lung Axis in COVID-19. Front. Immunol. 2021, 12, 635471. [Google Scholar] [CrossRef] [Scilit]
- Liu, X.; Mao, B.; Gu, J.; Wu, J.; Cui, S.; Wang, G.; Zhao, J.; Zhang, H.; Chen, W. Blautia—A new functional genus with potential probiotic properties? Gut Microbes 2021, 13, 1875796. [Google Scholar] [CrossRef] [Scilit]

Disclaimer/Publisher’s Note: The statements, opinions and data contained in all publications are solely those of the individual author(s) and contributor(s) and not of MDPI and/or the editor(s). MDPI and/or the editor(s) disclaim responsibility for any injury to people or property resulting from any ideas, methods, instructions or products referred to in the content. |
© 2026 by the authors. Licensee MDPI, Basel, Switzerland. This article is an open access article distributed under the terms and conditions of the Creative Commons Attribution (CC BY) license.