


Simple Summary
The gut microbiota of fish changes continuously as the host grows, but it remains unclear whether this process mainly involves replacement of individual microorganisms or broader changes in the persistence of community members. In this study, Decapterus maruadsi were maintained as the same cohort within the same culture system with an unchanged feed formulation and were sampled successively at three body-size stages. Although the dominant bacterial groups were broadly conserved throughout growth, the gut microbial community changed markedly at finer taxonomic levels. Smaller fish contained more stage-specific and transient microorganisms and showed greater variation among pooled samples, whereas larger fish contained fewer stage-specific microorganisms and were increasingly dominated by persistent community members. Persistent ASVs contributed 58.43 ± 15.08%, 79.54 ± 6.38%, and 90.14 ± 2.14% of total bacterial abundance in the early-, middle-, and late-growth groups, respectively. These findings show that gut microbiota development in D. maruadsi involves not only taxonomic turnover but also increasing dominance of repeatedly occurring microorganisms during growth, providing an ecological perspective on microbiome succession in cultured marine fish.
Abstract
Gut microbiome development during fish growth involves not only taxonomic turnover but also changes in the persistence and ecological dominance of microbial members. Here, we characterized the gut microbiota of D. maruadsi across three successive growth-associated body-size groups: the early-growth group (BLEGC; 4.98–6.81 g), middle-growth group (BLMG; 16.67–19.63 g), and late-growth group (BLLGC; 27.30–28.66 g). The three groups were successively sampled from the same cohort continuously reared in the same culture system. Fish received the same diet formulation throughout cultivation, with feeding quantity adjusted according to growth stage. At each stage, 15 fish were sampled, and rinsed intestinal tissues from five individuals were pooled to generate one composite sample, yielding three pooled intestinal samples per growth stage. Gut bacterial communities differed significantly among growth stages (ANOSIM: R = 0.2593, p = 0.005), while Pseudomonadota remained the dominant phylum across all groups. Complementary PERMANOVA supported an overall stage-associated difference, although PERMDISP also indicated heterogeneous multivariate dispersion among stages. Growth-associated restructuring became more evident at finer taxonomic levels and was accompanied by a pronounced contraction of stage-specific microbial membership. The number of unique ASVs declined from 361 in BLEGC to 286 in BLMG and 69 in BLLGC, whereas 84 ASVs were shared across all three stages. Forty ASVs met the global persistent criterion of detection in at least eight of the nine pooled samples, and their abundance contribution increased from 58.43 ± 15.08% in BLEGC to 79.54 ± 6.38% in BLMG and 90.14 ± 2.14% in BLLGC. When mean abundance was calculated only among samples in which each ASV was detected, prevalence remained positively associated with conditional mean abundance. Collectively, these results indicate that growth-associated gut microbiome succession in D. maruadsi involves not only taxonomic turnover but also progressive redistribution of community abundance toward highly prevalent and persistent bacterial members.
1. Introduction
The fish gastrointestinal tract harbors complex microbial communities that form an important component of the host-associated ecosystem. Intestinal microorganisms have been associated with nutrient acquisition and digestion, immune development, colonization resistance, and maintenance of intestinal homeostasis, while their composition is simultaneously shaped by host physiology, diet, surrounding water, and other environmental factors [1,2]. Unlike terrestrial vertebrates, fish are continuously exposed to microorganisms from the aquatic environment, resulting in continuous microbial exchange among water, food, and the gastrointestinal tract. Nevertheless, fish intestinal communities are not simply passive reflections of environmental microbial pools; the intestinal habitat can selectively retain particular bacterial populations and support recurrent or core microbial members [1,2,3]. Consequently, understanding how the gut microbiota is established and reorganized during host growth is increasingly important for interpreting host–microbe relationships in fishes and for developing microbiome-informed approaches to aquatic animal health and culture management.
Host development represents an important source of variation in fish-associated microbial communities. During growth, changes in intestinal morphology, digestive capacity, immune status, food intake, and the physicochemical conditions of the gastrointestinal tract can alter the ecological niches available to microorganisms [1,2]. Several studies have consequently demonstrated pronounced ontogenetic succession of fish gut microbiota. In Danio rerio, intestinal bacterial composition changes substantially with host development, and distinct developmental-stage-associated community configurations can emerge even during intervals without major changes in diet or external environment [4]. Ictalurus punctatus similarly exhibit marked temporal shifts in gut microbiota during early development, followed by comparatively smaller changes during later stages [5]. Stage-specific microbial signatures have also been reported throughout embryonic and juvenile development of Salmo salar [6]. These findings demonstrate that developmental stage can structure fish intestinal microbiota beyond simple responses to diet or surrounding water. Importantly, however, developmental trajectories are not uniform among species, highlighting the need to characterize microbiome succession within individual host systems rather than assuming a universal pattern of microbial maturation [4,5,6].
Most studies of fish microbiome ontogeny have focused primarily on changes in alpha diversity, beta diversity, and the relative abundance of individual bacterial taxa [4,5,6]. These approaches are essential for identifying compositional turnover but provide limited information on how the ecological status of community members changes during development. In particular, a bacterial taxon that is abundant in a single sample may represent a temporary bloom rather than a consistently maintained component of the host microbiota, whereas taxa repeatedly detected across hosts or developmental stages may constitute a more persistent microbial fraction. The concepts of prevalence, persistence, and core microbiota therefore provide an additional ecological framework for examining microbiome development. Studies in Danio rerio have demonstrated the existence of recurrent core gut bacterial populations despite substantial differences in host provenance and rearing history [3], while persistent core populations have also been identified in European seabass across individuals, intestinal regions, diets, and time [7]. More recently, developmental analysis of Trachinotus blochii showed that transient microorganisms contributed strongly during early life, whereas recurrent/core microorganisms became increasingly prominent as development proceeded [8]. Together, these findings suggest that microbiome development may involve not only taxonomic replacement but also shifts from transient microbial membership toward increasing dominance of repeatedly occurring taxa. However, this dimension of microbial succession remains much less characterized than conventional diversity and taxonomic composition, particularly in marine fishes [3,7,8].
Decapterus maruadsi is an economically important carangid fish widely distributed in the western Pacific marginal seas and is an important fishery resource in the East China Sea and northern South China Sea [9,10]. Previous research on D. maruadsi has focused primarily on population genetics, phylogeography, spatial distribution, habitat preference, fishery resources, and nutritional characteristics [9,10]. For example, population genetic analyses have revealed broad-scale population structure and historical demographic patterns of D. maruadsi, while fishery studies have demonstrated clear associations between its distribution and marine environmental conditions [9,10]. In contrast, little is known about how the intestinal microbiota of D. maruadsi changes during host growth, and particularly whether growth-associated taxonomic turnover is accompanied by changes in microbial persistence and community organization.
In the present study, we characterized the gut microbial communities of cultured D. maruadsi across three successive body-size classes: BLEGC (4.98–6.81 g), BLMG (16.67–19.63 g), and BLLGC (27.30–28.66 g). The three groups were obtained by successively sampling the same cohort of fish continuously reared in the same culture system as they reached progressively larger body-size ranges. Fish received feed with the same formulation throughout cultivation, while feeding quantity was adjusted according to growth stage. This longitudinal cohort design reduced variation associated with differences in fish origin, culture system, and feed formulation, although host age, cultivation duration, calendar time, and cumulative environmental exposure remained confounded with sampling stage. Using 16S rRNA gene amplicon sequencing, we investigated changes in microbial diversity and community composition, quantified shared and stage-specific microbial membership, examined growth-stage-associated taxa, and classified ASVs according to their prevalence across the complete dataset as transient, intermittent, or persistent. We also evaluated the relationship between microbial prevalence and relative abundance. We hypothesized that growth-associated microbiome succession in D. maruadsi would involve not only taxonomic turnover but also progressive reorganization of community membership, with stage-specific and transient microorganisms decreasing in quantitative importance while persistent and prevalent taxa increasingly dominated the intestinal community.
2. Materials and Methods
2.1. Fish Rearing, Experimental Design, and Sample Collection
Cultured D. maruadsi used in this study originated from the same cohort and were continuously maintained in the same culture system throughout the cultivation period. All fish received the same formulated diet, and the feed formulation remained unchanged throughout cultivation. Fish were fed twice daily, and feeding quantity was adjusted according to fish growth and feeding requirements. Fish were fasted for 12 h before each sampling event. To investigate growth-associated changes in the intestinal microbiota, the same cohort was sampled successively after different cultivation periods as the fish reached three predefined body-size ranges. Fish weighing 4.98–6.81 g were assigned to the BLEGC group, those weighing 16.67–19.63 g to the BLMG group, and those weighing 27.30–28.66 g to the BLLGC group. Thus, the three groups represented successive growth stages of the same continuously reared cohort rather than independently reared fish populations.
The same cohort was sampled at approximately 3, 4, and 5 months of age on 11 November 2025, 17 December 2025, and 25 January 2026, respectively, corresponding to intervals of 36 and 39 days between successive sampling events. Body size and host age therefore covaried with cultivation duration, calendar time, feeding quantity, and cumulative environmental exposure. Detailed contemporaneous measurements of water temperature, salinity, dissolved oxygen, tank dimensions, stocking density, and feed proximate composition were unavailable for the three sampling events. Water and feed microbiota were not sampled concurrently. Individual body lengths and individual-level body-weight measurements beyond the recorded stage-specific ranges were unavailable.
At each growth stage, 15 apparently healthy fish falling within the predefined body-weight range were selected from the culture system. No obvious external lesions, abnormal behavior, or visible signs of disease were observed at the time of sampling. The 15 fish were randomly divided into three subsets, with five fish in each subset. The rinsed intestinal tracts from the five fish within each subset were combined to generate one pooled intestinal sample. Consequently, three pooled intestinal samples were obtained at each growth stage, resulting in nine samples in total. The pooled intestinal sample, rather than the individual fish, was treated as the sampling unit in subsequent microbiome analyses. However, all samples originated from a single non-replicated rearing system; the three pooled samples per stage therefore represent replicate microbiome measurements within the same culture system rather than independent rearing replicates. The samples were designated BLEGC1–BLEGC3, BLMG1–BLMG3, and BLLGC1–BLLGC3.
Fish were processed aseptically immediately after collection. Fish were euthanized by immersion in tricaine methanesulfonate (MS-222; 200 mg L−1) before tissue collection. The external body surface was rinsed with sterile water and disinfected with 75% ethanol. The abdominal cavity was opened using sterile scissors and forceps, and the entire intestinal tract was aseptically removed. Intestinal contents were discarded, and the intestinal tract was gently rinsed with sterile water before pooling. Instruments were sterilized or replaced between individual fish to minimize cross-contamination. For each pooled sample, the rinsed intestinal tissues from five fish were combined in a sterile container. The pooled intestinal samples were immediately placed in liquid nitrogen, transported under cold-chain conditions, and stored at −80 °C until DNA extraction.
2.2. Total Genomic DNA Extraction and Quality Assessment
Microbial genomic DNA was extracted from the pooled whole-intestine samples using the DNeasy PowerSoil Pro Kit (QIAGEN GmbH, Hilden, Germany) according to the manufacturer’s instructions. Before DNA extraction, intestinal samples were aseptically homogenized to obtain representative microbial DNA from the pooled samples. The concentration of extracted DNA was measured using a Qubit 3.0 Fluorometer (Life Technologies, Thermo Fisher Scientific, Waltham, MA, USA) with the Equalbit 1× dsDNA HS Assay Kit (Vazyme, Nanjing, China). DNA integrity and purity were further evaluated using 1.0% agarose gel electrophoresis and a NanoDrop ND-2000 spectrophotometer (Thermo Scientific, Waltham, MA, USA). DNA samples meeting the quality requirements were subsequently used for 16S rRNA gene amplification.
An extraction blank and a PCR no-template negative control were included during laboratory processing but were not sequenced. Consequently, sequence-based contaminant identification or removal was not possible. No mock community or 16S rRNA gene qPCR measurement of bacterial load was included in the study design.
2.3. Amplification of the 16S rRNA Gene
The V3–V4 hypervariable region of the bacterial 16S rRNA gene was amplified using the 338F/806R primer pair. The expected insert size was approximately 468 bp, and the amplicons were suitable for paired-end sequencing using the Illumina MiSeq PE300 platform (San Diego, CA, USA).
PCR amplification was performed in a total reaction volume of 20 μL containing 10 ng of template DNA, 0.8 μL of each primer (10 μM), 4 μL of 5× FastPfu buffer, 0.4 μL of FastPfu polymerase, 0.2 μL of bovine serum albumin, and 250 μM dNTPs. The PCR program consisted of an initial denaturation at 95 °C for 3 min, followed by 29 cycles of denaturation at 95 °C for 30 s, annealing at 55 °C for 30 s, and extension at 72 °C for 45 s, with a final extension at 72 °C for 10 min. PCR products were examined by agarose gel electrophoresis, purified, quantified, and pooled in equimolar proportions before sequencing.
2.4. Illumina Sequencing and Bioinformatic Processing
Purified amplicons were pooled in equimolar proportions and sequenced using an Illumina MiSeq PE300 platform according to the standard protocols of Majorbio Bio-Pharm Technology Co., Ltd. (Shanghai, China). Raw sequence data were processed using QIIME 2 (version 2020.2.0). Briefly, raw reads were demultiplexed and primer sequences were removed, followed by quality filtering, denoising, paired-end merging, and chimera removal using the DADA2 plugin. Sequence processing used q2-dada2 version 2020.2.0, q2-feature-classifier version 2020.2.0, and Cutadapt version 2.8. Representative ASV sequences were aligned using MAFFT, and a phylogenetic tree was constructed using FastTree2. The exact MAFFT/FastTree2 version numbers and DADA2 trimming, truncation, and expected-error settings were not documented in the archived analysis records. Taxonomic assignment was performed using the classify-sklearn naïve Bayes classifier against the SILVA Release 138 database, including bacterial and archaeal lineages. Following taxonomic assignment, ASVs assigned to chloroplasts, mitochondria, eukaryotes, or other non-target lineages were removed from the feature table. No archaeal ASVs were detected in the final filtered dataset; therefore, all retained prokaryotic ASVs were assigned to Bacteria. The resulting filtered ASV abundance table was used for all subsequent analyses. Across the nine intestinal samples, 802,607 optimized sequences were obtained and 718,125 sequences remained after denoising. The feature table was standardized to 35,884 sequences per sample before diversity and shared-taxon analyses. Per-sample sequencing statistics are provided in Supplementary Table S1.
2.5. Diversity, Community Structure, and Statistical Analyses
Alpha diversity was evaluated using the Chao1 richness index, Shannon diversity index, and Good’s coverage index based on the filtered ASV abundance table. Rarefaction curves were generated for each sample to evaluate sequencing completeness and determine whether sequencing depth adequately represented the intestinal microbial communities. Stage-level alpha-diversity values are reported as mean ± SD, and differences among the three growth stages were evaluated using Kruskal–Wallis tests.
Beta diversity was assessed using Bray–Curtis dissimilarity calculated from ASV relative abundance profiles. Principal coordinate analysis (PCoA) was performed to visualize differences in intestinal microbial community structure among BLEGC, BLMG, and BLLGC. Differences in overall community composition among the three growth stages were tested using analysis of similarities (ANOSIM) with 999 permutations based on Bray–Curtis dissimilarity. PERMANOVA was used as a complementary test of stage-associated community differences, and PERMDISP was used to assess homogeneity of multivariate dispersion. Exact permutation procedures were used where feasible, and pairwise PERMANOVA comparisons were interpreted in light of the limited number of unique permutations available for three-versus-three comparisons.
Differences in taxonomic relative abundance among BLEGC, BLMG, and BLLGC were evaluated using the Kruskal–Wallis test. Taxonomic composition at the phylum, class, order, family, and genus levels was summarized based on relative abundance. Shared and stage-specific taxa among growth stages were visualized using Venn diagrams at different taxonomic levels. Statistical significance was defined as p < 0.05.
2.6. Classification of Transient, Intermittent, and Persistent Taxa
To characterize microbial occurrence patterns across the sampled growth sequence, the prevalence of each ASV was calculated across all nine pooled intestinal samples as the proportion of samples in which the ASV was detected. Based on its prevalence across the complete dataset, each ASV was classified as transient (prevalence < 0.2), intermittent (0.2 ≤ prevalence ≤ 0.8), or persistent (prevalence > 0.8). Thus, persistent ASVs were detected in at least eight of the nine pooled intestinal samples.
For stage-level numerical representation, each ASV identity was counted only once within a stage regardless of the number of pooled samples in which it occurred. Thus, the denominator was the total number of unique ASVs detected in that stage rather than the total number of ASV occurrence records across the three pooled samples. The cumulative relative abundance contributed by ASVs belonging to each category was calculated separately for BLEGC, BLMG, and BLLGC and summarized across the three pooled analytical samples as mean ± SD.
To evaluate sensitivity to the prevalence definition, two complementary analyses were conducted. First, alternative thresholds (<0.25, 0.25–0.75, and >0.75) were applied to the complete nine-sample dataset. Second, a leave-one-stage-out analysis defined persistent ASVs using only the six BLEGC and BLMG samples (prevalence > 0.8) and then quantified the abundance contribution of this independently defined set in the held-out BLLGC samples. In addition, within-stage occurrence was summarized separately to distinguish taxa detected in all three pools of an individual stage from globally persistent taxa.
For the prevalence–abundance analysis, mean relative abundance was calculated only among samples in which each ASV was detected, thereby reducing the direct arithmetic dependence introduced when zero values are included in the abundance mean. ASV-level observations were treated as descriptive community features rather than statistically independent experimental units.
3. Results
3.1. Sequencing Depth and Alpha-Diversity Patterns
Across the nine intestinal samples, 802,607 optimized sequences were obtained and 718,125 sequences remained after denoising, the feature table was standardized to 35,884 sequences per sample. Rarefaction curves based on the Chao richness index, Shannon diversity index, and coverage index gradually approached asymptotes with increasing sequencing depth, indicating that the sequencing effort was sufficient to capture the major bacterial diversity present in the intestinal samples (Figure S1). Coverage values approached 1.0 in all nine samples, further supporting the completeness of sequencing and the suitability of the dataset for subsequent community analyses. Chao1 richness was 239.07 ± 135.80, 214.00 ± 53.93, and 95.00 ± 9.85 in BLEGC, BLMG, and BLLGC, respectively (Kruskal–Wallis p = 0.0665). Shannon diversity was 3.442 ± 0.744, 2.949 ± 0.347, and 2.600 ± 0.301, respectively (p = 0.1133). Thus, although richness and diversity tended to decline across the sampled growth sequence, these trends were not statistically supported at the present level of replication.
3.2. Gut Bacterial Community Structure Differed Across Growth Stages
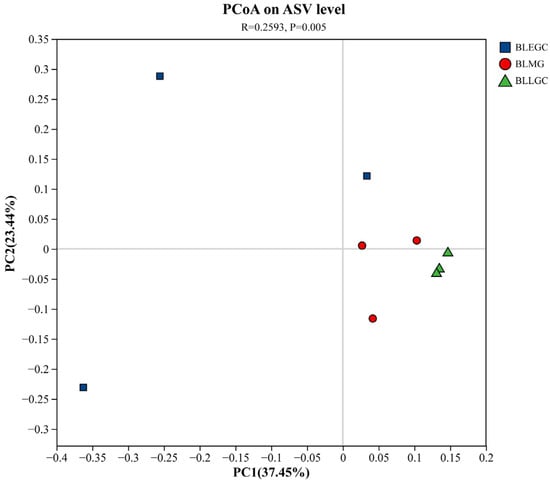
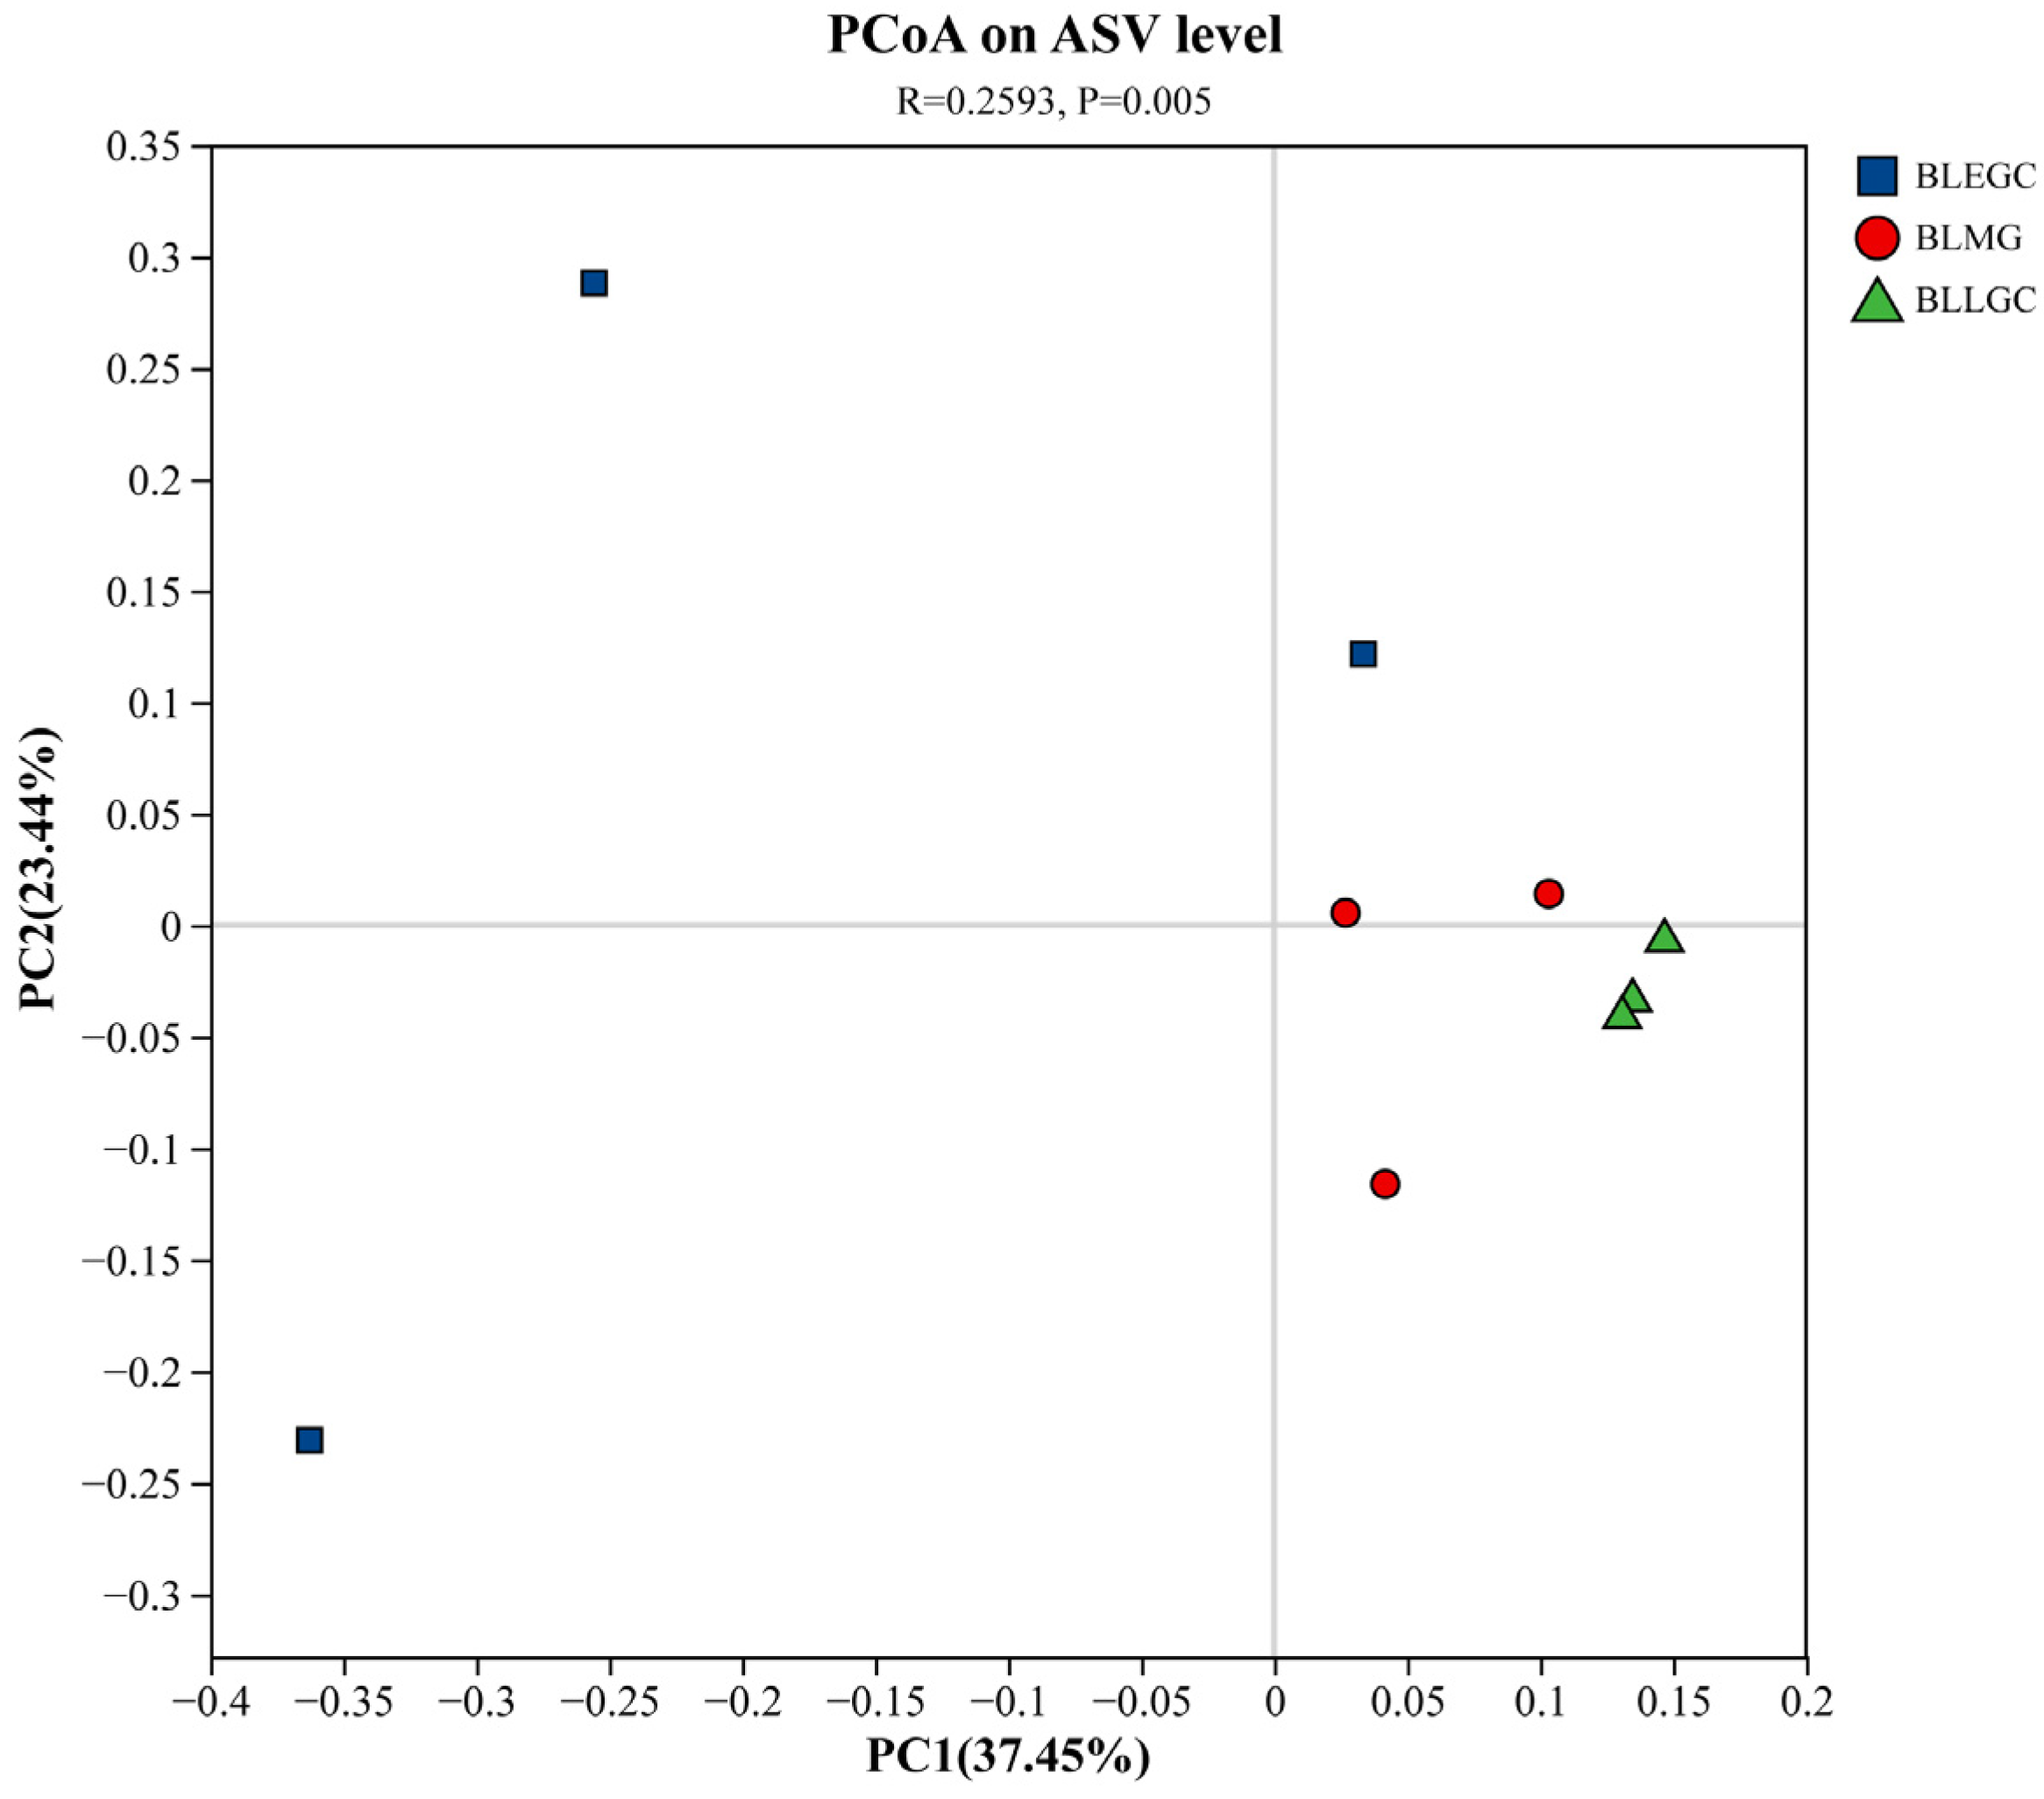
Principal coordinate analysis based on Bray–Curtis dissimilarity revealed differentiation of gut bacterial communities among BLEGC, BLMG, and BLLGC. PC1 explained 37.45% of total community variation and PC2 explained 23.44%, with the first two axes together accounting for 60.89% of the overall variation. ANOSIM indicated a significant difference in overall community composition among the three growth stages (R = 0.2593, p = 0.005). BLEGC samples were more widely dispersed in the ordination space, whereas BLMG samples were positioned more closely together and BLLGC samples formed the most compact cluster. Complementary PERMANOVA detected an overall stage-associated difference (pseudo-F = 1.832, R2 = 0.379, exact permutation p = 0.00357), while PERMDISP also detected significant heterogeneity of multivariate dispersion (F = 56.48, exact permutation p = 0.025). Pairwise PERMANOVA comparisons were not statistically significant (all exact p = 0.10). Accordingly, the overall multivariate pattern was interpreted cautiously as reflecting both differences in community location and within-stage dispersion (Figure 1).
Figure 1.
Principal coordinate analysis (PCoA) of Bray–Curtis dissimilarity among pooled gut bacterial communities of D. maruadsi across the three growth-associated sampling stages.
3.3. Growth-Associated Restructuring of Gut Bacterial Communities Across Major Taxonomic Levels
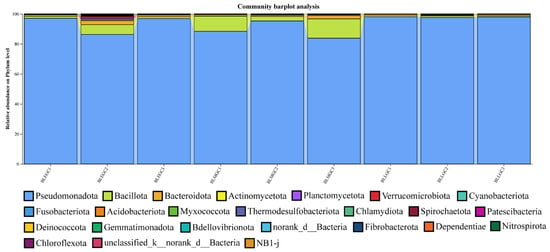
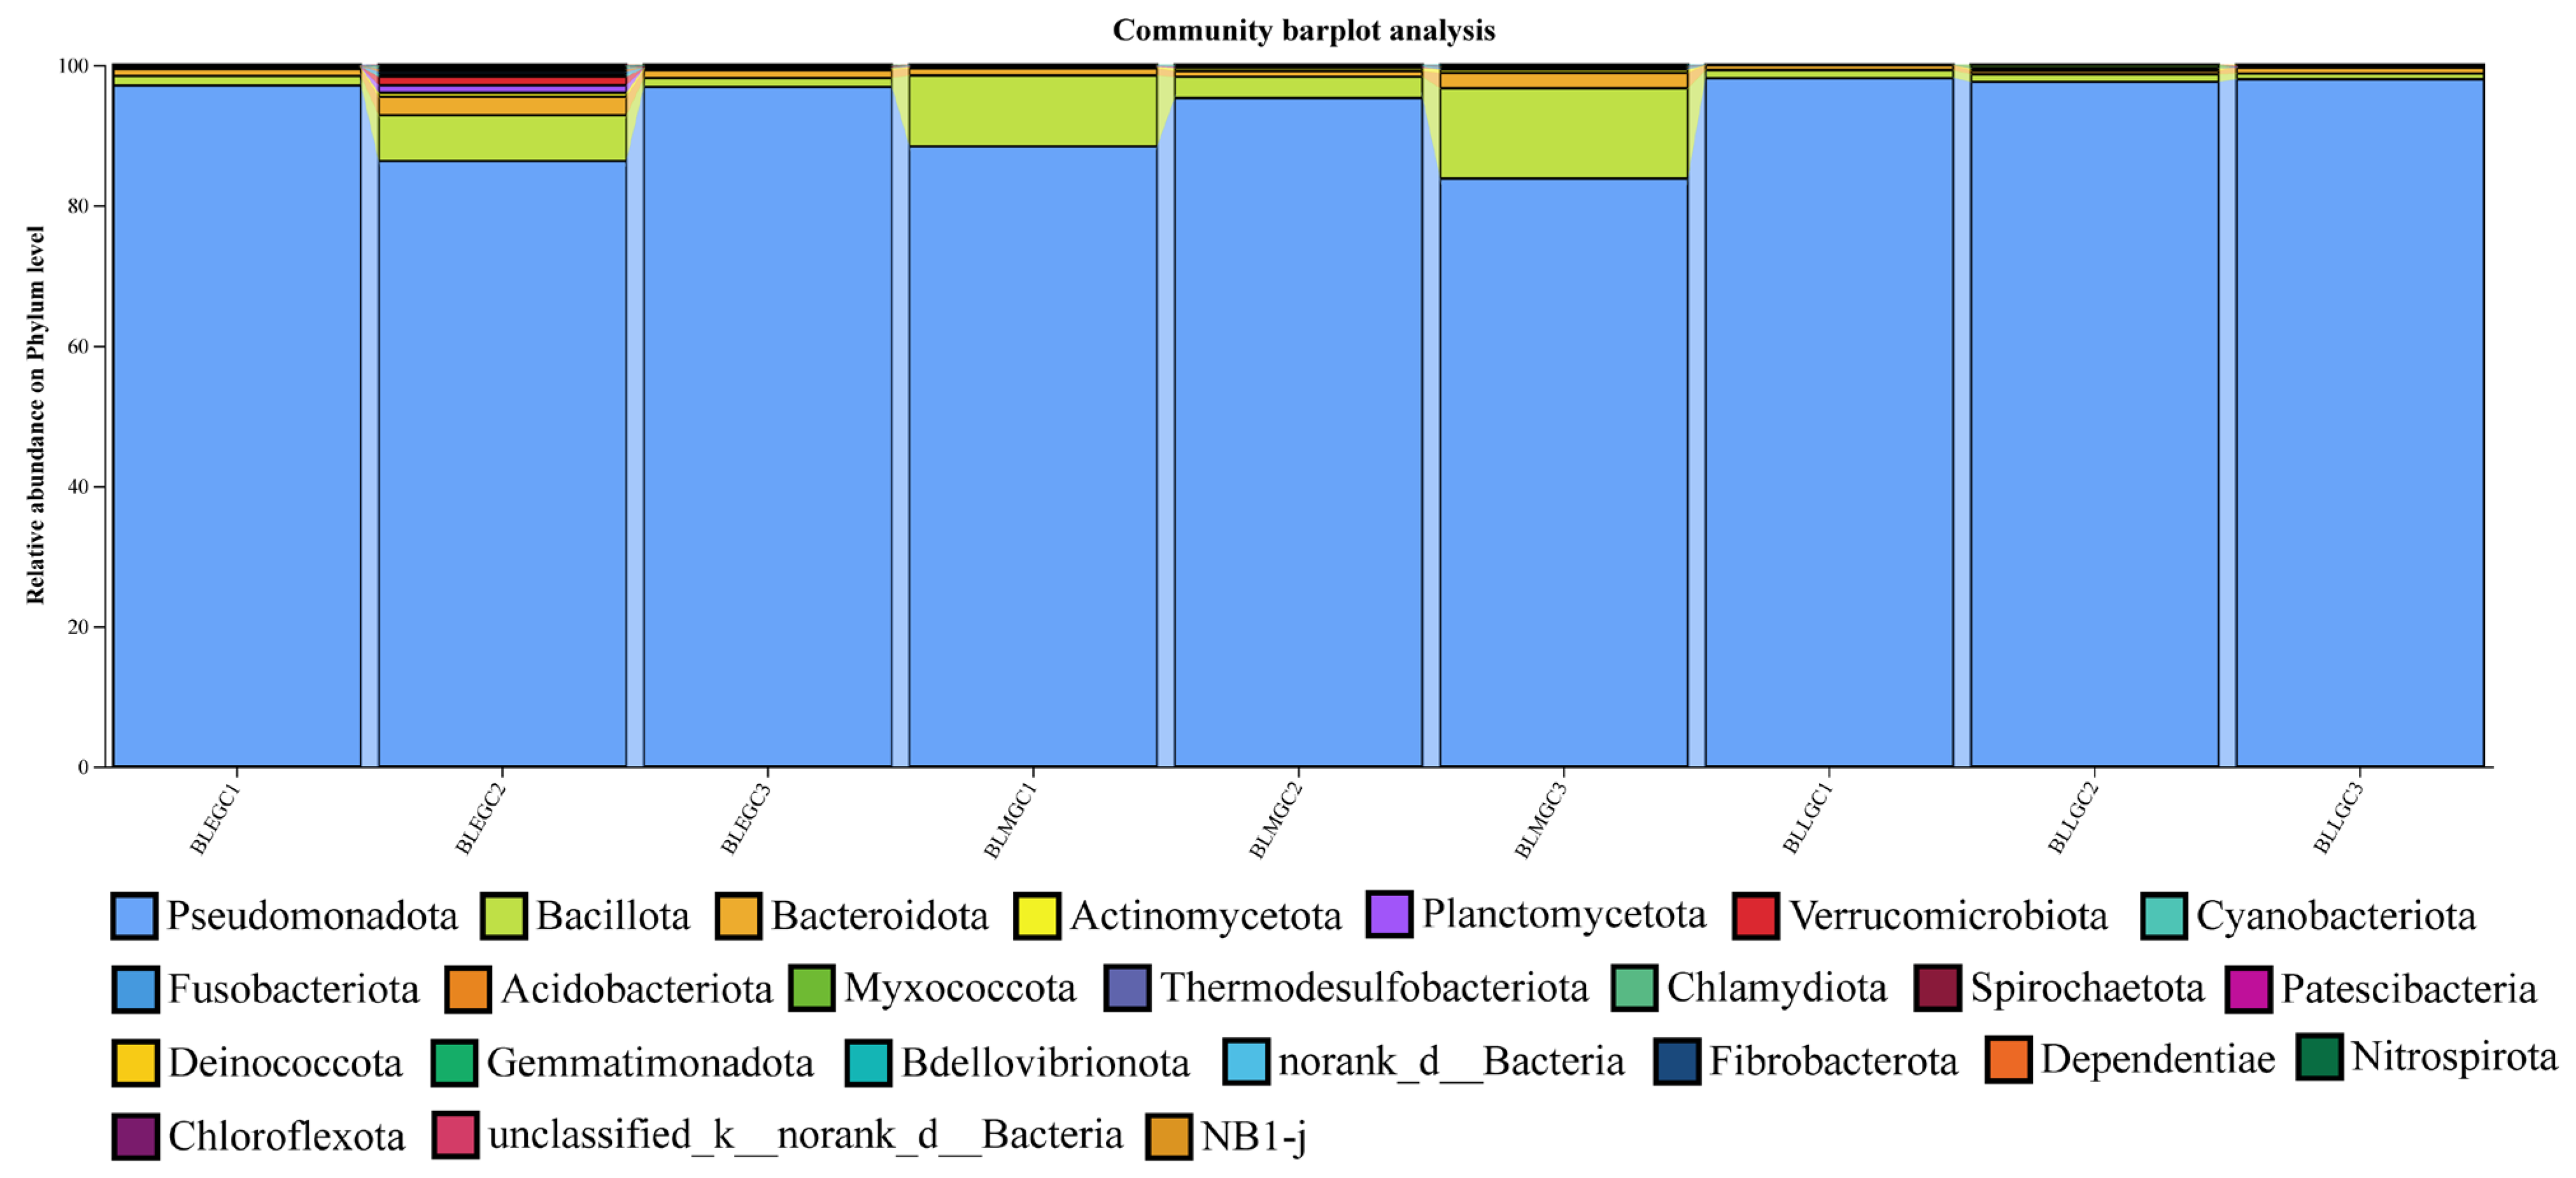
Despite the significant differences in overall community structure, the broad taxonomic framework of the gut microbiota remained relatively conserved across growth stages. At the phylum level, Pseudomonadota overwhelmingly dominated all nine samples. Bacillota represented the major secondary phylum in several samples, whereas Bacteroidota, Actinomycetota, Planctomycetota, Verrucomicrobiota, Cyanobacteriota, Fusobacteriota, Acidobacteriota, Myxococcota, and several other phyla generally contributed much smaller proportions (Figure 2). Although the dominance of Pseudomonadota was maintained throughout the three size classes, the relative contribution of secondary phyla varied among stages. BLEGC showed the greatest phylum-level heterogeneity, with noticeable differences in the proportions of Bacillota and other low-abundance phyla among the three replicates. BLMG retained the dominance of Pseudomonadota but showed relatively stronger contributions from Bacillota in several samples. In contrast, BLLGC displayed the most uniform phylum-level structure, with Pseudomonadota accounting for the majority of the bacterial community in all three replicates and most other phyla contributing only minor fractions.
Figure 2.
Gut bacterial community composition of D. maruadsi across three growth stages; relative abundances of dominant bacterial taxa are shown at the phylum level.
At the class level, AlphaProteobacteria and GammaProteobacteria represented the dominant groups across all samples, while Bacilli, Bacteroidia, Clostridia, Actinobacteria, Verrucomicrobiia, Planctomycetes, Cyanobacteriia, Fusobacteriia, and other classes occurred at lower abundances. BLEGC exhibited substantial variation in the balance between AlphaProteobacteria and GammaProteobacteria. Several BLEGC replicates contained relatively large GammaProteobacteria fractions, whereas AlphaProteobacteria became increasingly prominent in BLMG and BLLGC. The three BLLGC samples also showed greater similarity in the relative contributions of these two dominant classes (Figure S2).
The growth-associated changes became more pronounced at the order level (Figure S3). Hyphomicrobiales, Pseudomonadales, Burkholderiales, Enterobacterales, Rhodobacterales, Lactobacillales, Sphingomonadales, Caulobacterales, Flavobacteriales, Legionellales, and several additional orders constituted the main intestinal bacterial groups. BLEGC was characterized by a heterogeneous combination of several dominant orders. Hyphomicrobiales was abundant across the group, but Pseudomonadales, Burkholderiales, and Enterobacterales also contributed substantially to individual replicates. In particular, Enterobacterales showed a strong increase in one BLEGC sample, whereas the relative abundance of Burkholderiales was greater in another. This order-level heterogeneity corresponded closely with the broad dispersion of BLEGC samples in the PCoA. In BLMG, Hyphomicrobiales became more consistently dominant. Pseudomonadales and Burkholderiales remained important components, whereas Enterobacterales was less prominent than in the most strongly enriched BLEGC sample. Rhodobacterales, Lactobacillales, and several other lower-abundance orders also contributed noticeably to individual BLMG communities. BLLGC showed the most consistent order-level structure. Hyphomicrobiales remained strongly dominant, followed primarily by Pseudomonadales and Burkholderiales. Several orders that contributed substantially to individual BLEGC or BLMG samples were greatly reduced in the largest fish.
A comparable pattern was observed at the family level. Beijerinckiaceae, Pseudomonadaceae, Moraxellaceae, Comamonadaceae, Burkholderiaceae, Vibrionaceae, Paracoccaceae, Rhizobiaceae, Enterobacteriaceae, Streptococcaceae, Sphingomonadaceae, Rhodocyclaceae, Aeromonadaceae, Caulobacteraceae, Lactobacillaceae, and several additional families represented the major components of the gut microbiota. BLEGC again showed strong inter-replicate variation. Beijerinckiaceae was an important component in all three samples but differed markedly in relative abundance, while Moraxellaceae and Vibrionaceae exhibited pronounced enrichment in individual replicates. In BLMG, Beijerinckiaceae became more consistently abundant, while Pseudomonadaceae, Moraxellaceae, Comamonadaceae, Burkholderiaceae, Streptococcaceae, and other families contributed variable fractions. By contrast, BLLGC displayed a more reproducible family-level profile dominated mainly by Beijerinckiaceae, Pseudomonadaceae, Moraxellaceae, Comamonadaceae, and Burkholderiaceae (Figure S4). Taken together, the phylum-to-family analyses showed that the major higher-level taxonomic framework remained broadly conserved across growth stages, whereas more pronounced compositional changes occurred within Pseudomonadota and other dominant lineages at finer taxonomic resolutions. The BLLGC pooled samples also displayed comparatively similar family- and order-level profiles.
3.4. Genus-Level Profiles Revealed Pronounced Taxonomic Turnover and Increasing Compositional Consistency
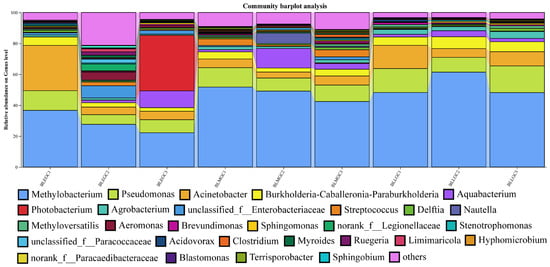
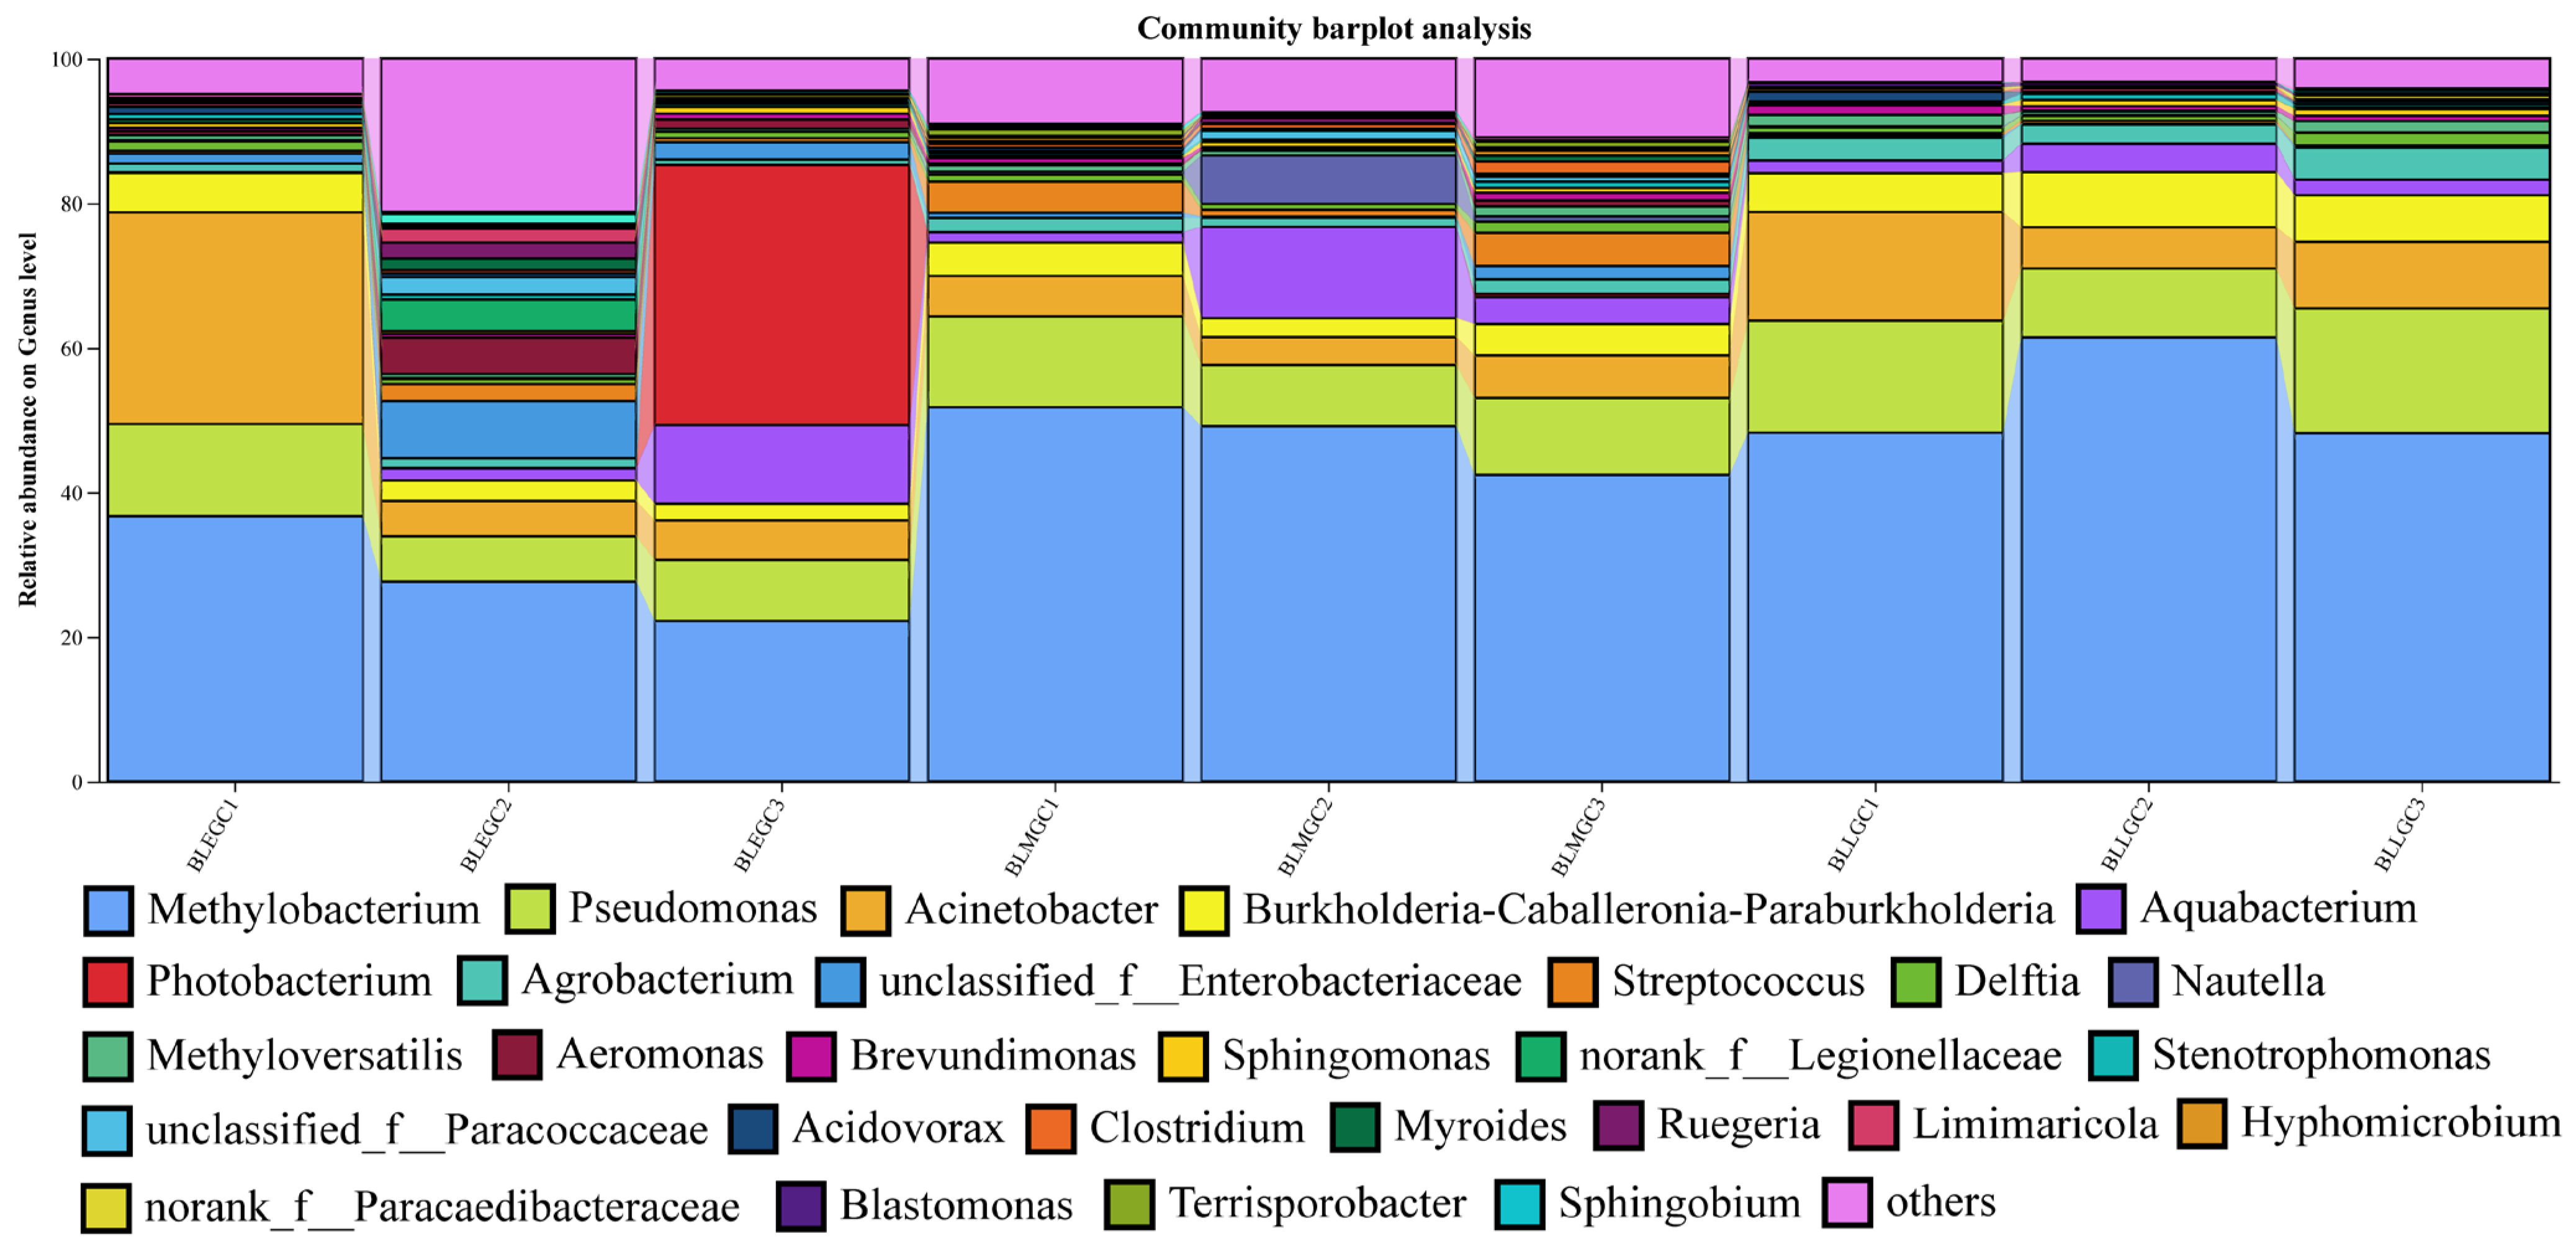
The strongest growth-associated changes were observed at the genus and ASV levels. Methylobacterium was one of the most consistently abundant genera across the dataset, together with Pseudomonas, Acinetobacter, Burkholderia-Caballeronia-Paraburkholderia, Aquabacterium, Photobacterium, Agrobacterium, Streptococcus, Delftia, Nautella, Methyloversatilis, Aeromonas, Brevundimonas, Sphingomonas, Stenotrophomonas, Acidovorax, Clostridium, Myroides, Ruegeria, Limimaricola, Hyphomicrobium, Blastomonas, Terrisporobacter, and Sphingobium (Figure 3). BLEGC displayed the greatest genus-level heterogeneity. Although Methylobacterium was abundant in all three samples, its relative contribution differed markedly among replicates. Pseudomonas and Acinetobacter were also major components, but their relative abundances varied strongly. In particular, Acinetobacter constituted a large fraction of one BLEGC sample, whereas Photobacterium became highly enriched in another. These sample-specific increases contributed substantially to the differences among BLEGC replicates. Several additional genera, including Aquabacterium, Aeromonas, Streptococcus, Delftia, and others, also showed uneven distributions among BLEGC samples. As a result, the early-stage communities did not share a single dominant genus-level profile but instead exhibited several alternative configurations characterized by different combinations of abundant taxa. BLMG showed a clearly reorganized community. Methylobacterium increased in relative prominence and became the dominant genus in all three samples. Pseudomonas also remained abundant, while Acinetobacter, Burkholderia-Caballeronia-Paraburkholderia, Aquabacterium, and several lower-abundance genera contributed additional fractions. Compared with BLEGC, extreme sample-specific enrichment of individual genera was less apparent. The intermediate group also contained several taxa that were relatively more conspicuous than in either BLEGC or BLLGC. This pattern was particularly evident for several Bacillota-associated genera and indicated that BLMG possessed a distinct genus-level configuration rather than simply representing a compositional midpoint between the two endpoint groups. BLLGC exhibited the greatest consistency among biological replicates. Methylobacterium was strongly dominant across all three samples, while Pseudomonas represented another recurrent major genus. Acinetobacter, Burkholderia-Caballeronia-Paraburkholderia, Agrobacterium, and several other genera occurred at lower but comparatively stable proportions. In contrast, Photobacterium, Aeromonas, and several genera that were abundant in individual BLEGC samples were greatly reduced.
Figure 3.
Gut bacterial community composition of D. maruadsi across three growth stages; relative abundances of dominant bacterial taxa are shown at the genus level.
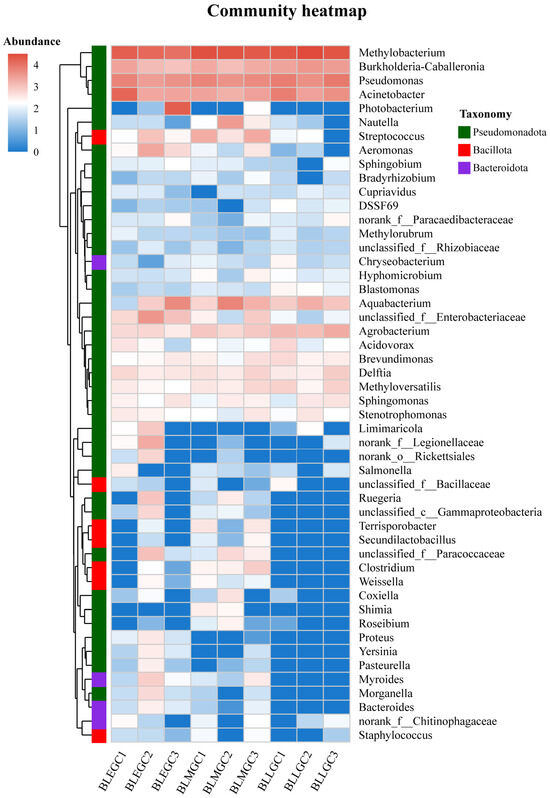
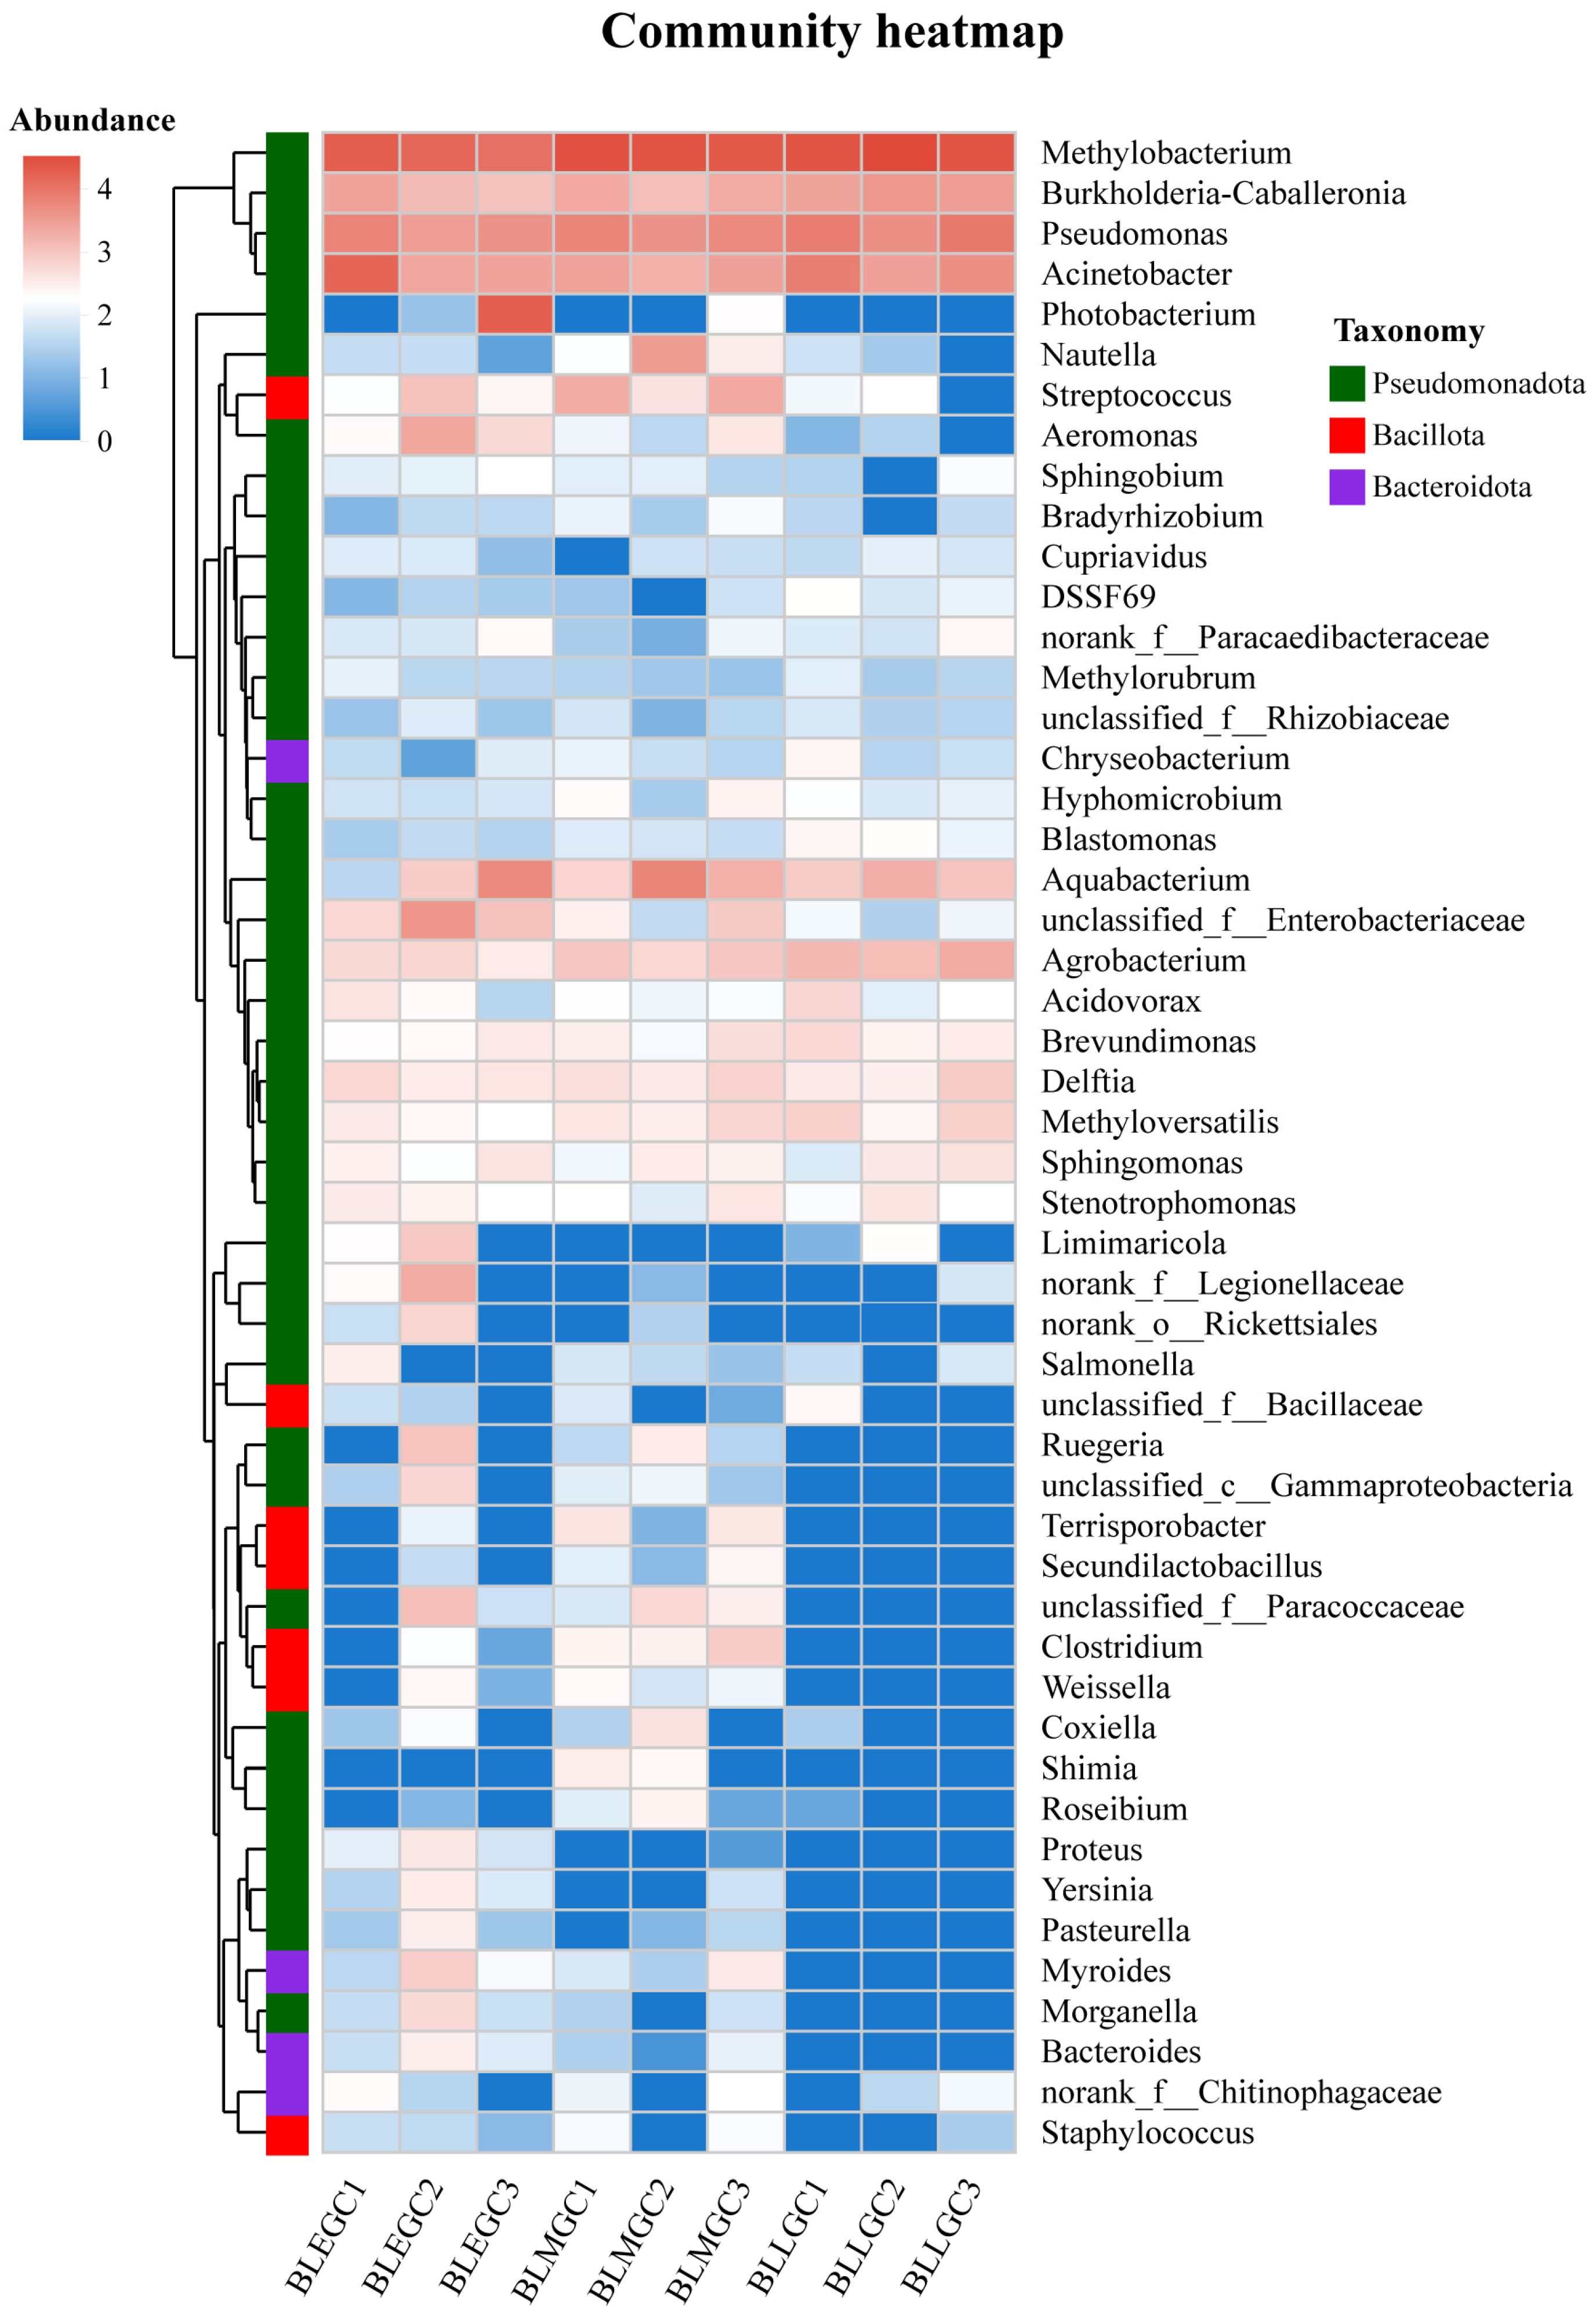
The heatmap of the 50 most abundant bacterial genera further resolved these genus-level differences (Figure 4). Methylobacterium, Burkholderia-Caballeronia-Paraburkholderia, Pseudomonas, and Acinetobacter were among the most abundant genera and occurred across multiple samples. In contrast, several genera displayed strong stage- or sample-specific abundance patterns. Photobacterium, Nautella, Streptococcus, Aeromonas, Sphingobium, Bradyrhizobium, Cupriavidus, Methylorubrum, Chryseobacterium, Aquabacterium, Agrobacterium, Acidovorax, Delftia, Methyloversatilis, Sphingomonas, and Stenotrophomonas varied markedly among samples. A number of lower-abundance genera were mainly detected in BLEGC or BLMG and became rare or undetectable in BLLGC. These included Salmonella, Terrisporobacter, Secundilactobacillus, Clostridium, Weissella, Coxiella, Proteus, Yersinia, Pasteurella, Myroides, Morganella, Bacteroides, and Staphylococcus.
Figure 4.
Heatmap of the 50 most abundant bacterial genera in the gut microbiota of D. maruadsi across the three growth-associated sampling stages.
The genus-level profiles therefore showed pronounced growth-stage-associated restructuring. BLEGC contained stronger sample-specific enrichment of multiple bacterial taxa, whereas the BLLGC pooled samples were characterized by more consistent dominance of a smaller set of recurrent bacterial members. This pattern was concordant with the PCoA and with the reduction in stage-specific taxa described below.
3.5. Stage-Specific Bacterial Membership Declined Sharply During Fish Growth
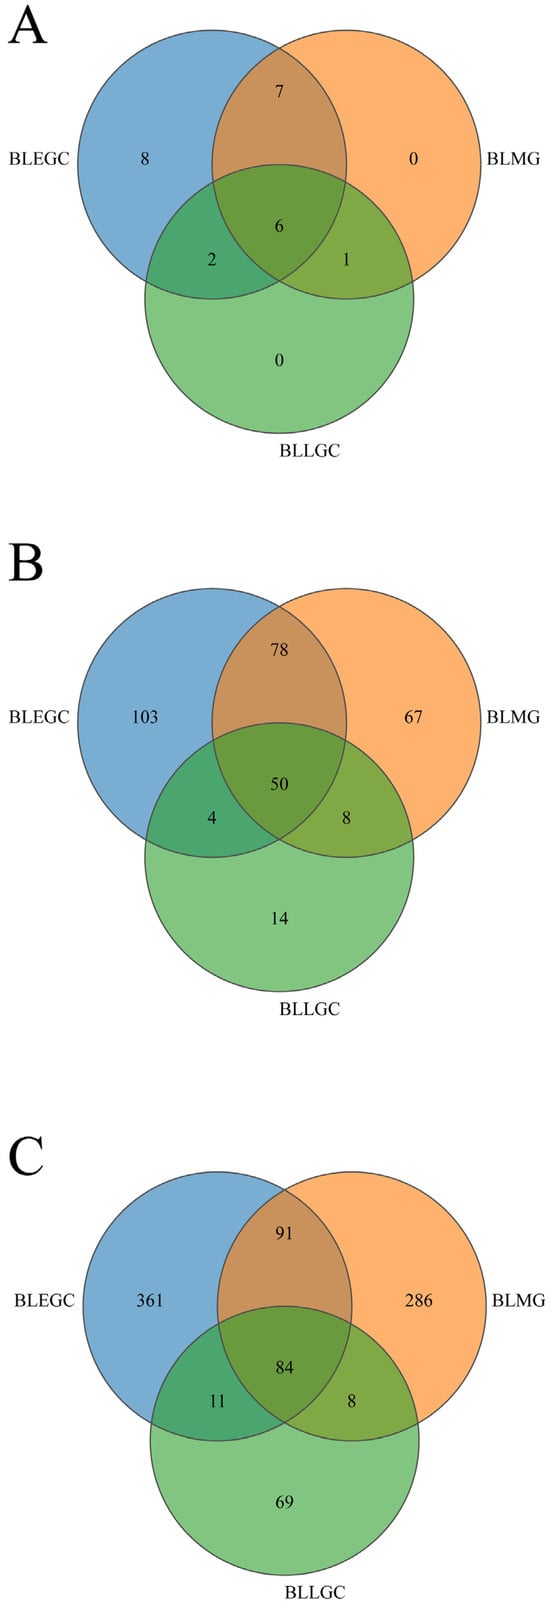
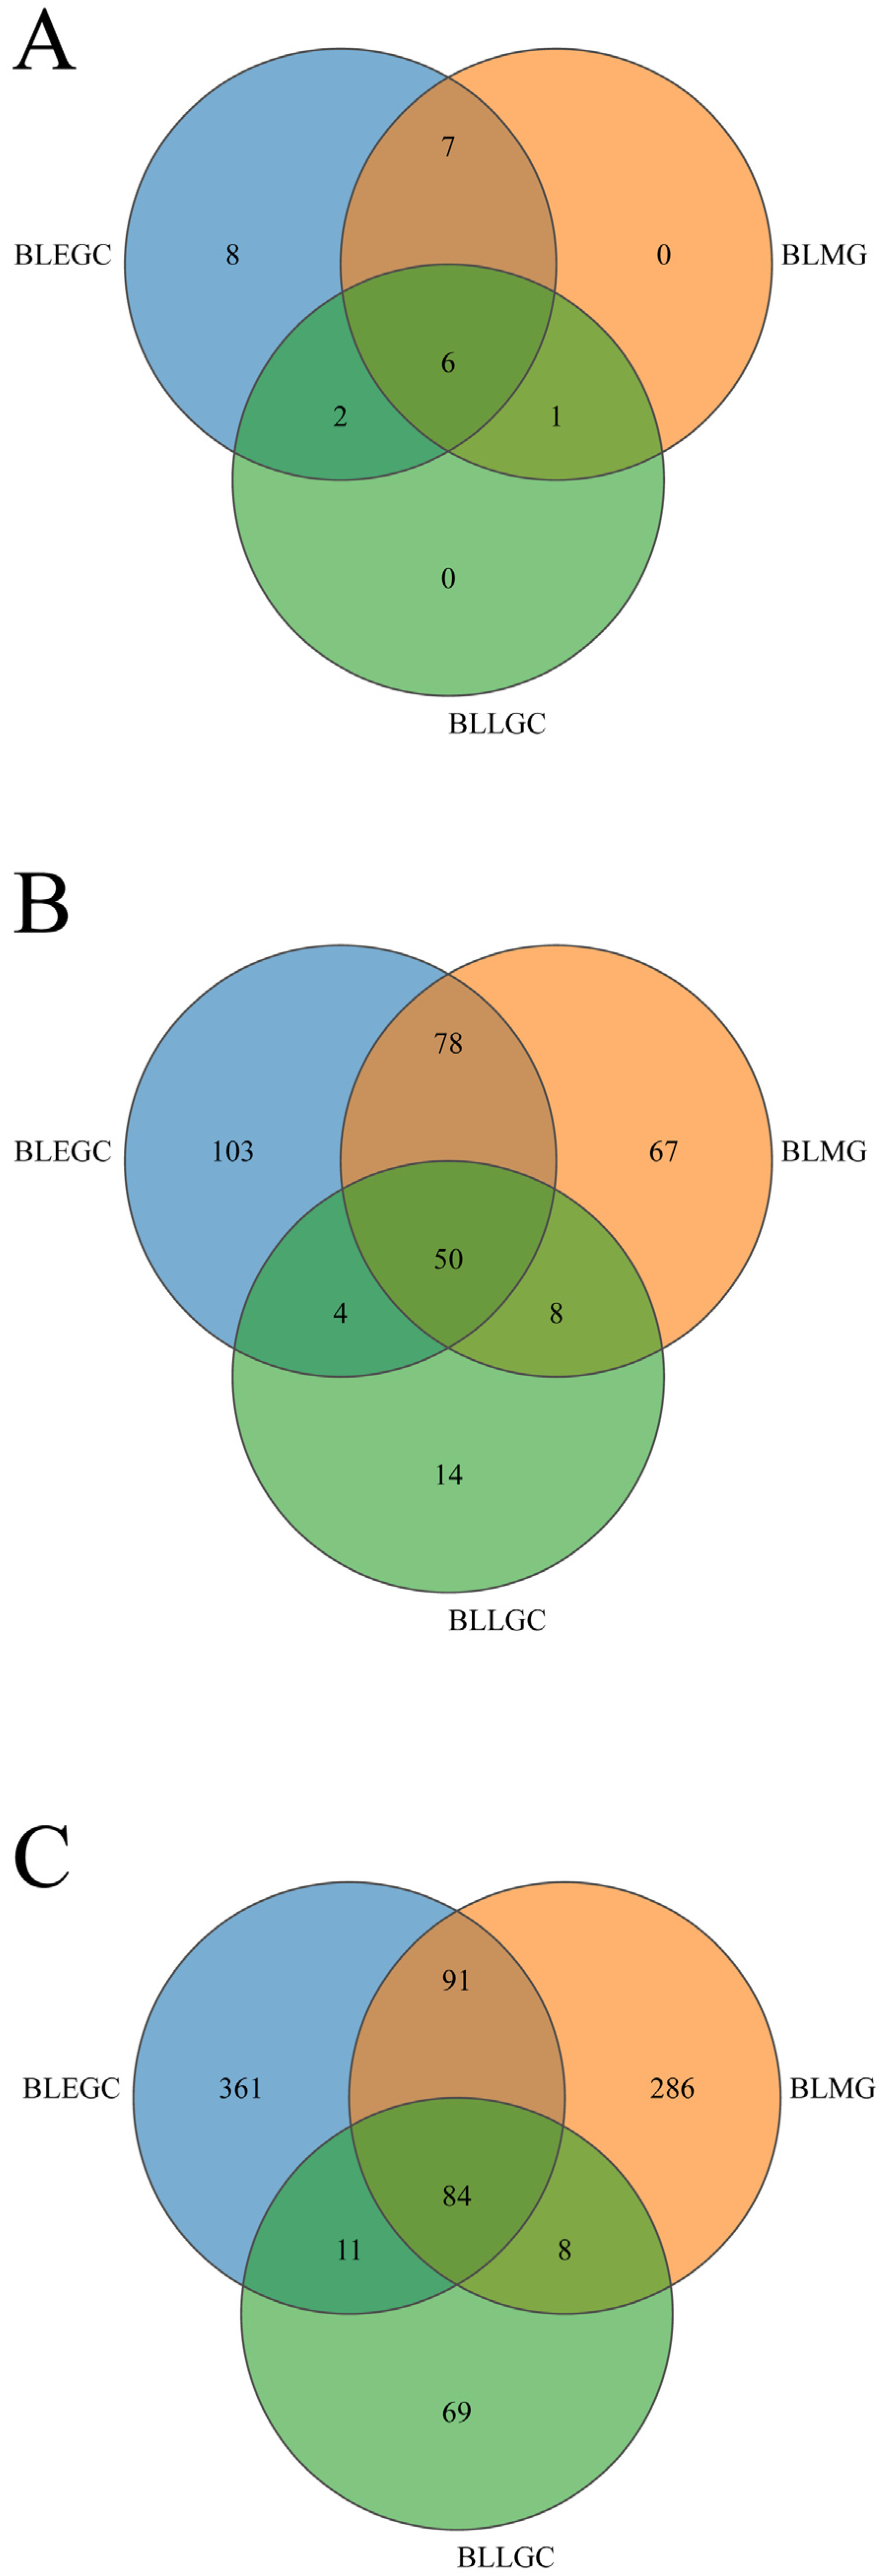
Venn analysis revealed marked differences in the number of shared and stage-specific bacterial taxa among the three growth stages (Figure 5). At the phylum level, six bacterial phyla were shared among all three groups. BLEGC contained eight unique phyla, whereas the number of phyla restricted to BLMG or BLLGC was much smaller. Seven phyla were shared exclusively between BLEGC and BLMG, two were shared only between BLEGC and BLLGC, and one was shared only between BLMG and BLLGC. The decline in stage-specific membership became much more pronounced at the genus level. BLEGC contained 103 unique genera, BLMG contained 67, and BLLGC contained only 14. In contrast, 50 genera were shared among all three groups. BLEGC and BLMG shared an additional 78 genera, whereas only 4 genera were shared exclusively between BLEGC and BLLGC and 8 genera between BLMG and BLLGC. The same pattern was even more evident at ASV resolution. BLEGC contained 361 unique ASVs, BLMG contained 286, and BLLGC contained only 69. A total of 84 ASVs were shared across all three growth stages. In addition, BLEGC and BLMG shared 91 ASVs, whereas only 11 ASVs were shared exclusively between BLEGC and BLLGC and 8 ASVs between BLMG and BLLGC.
Figure 5.
Shared and stage-specific ASVs among the three growth-associated sampling stages of D. maruadsi. (A) Phylum level, (B) genus level, (C) ASV level.
The number of stage-specific ASVs was approximately 80.9% lower in BLLGC than in BLEGC, while the number of unique genera was approximately 86.4% lower. BLEGC and BLMG shared substantially more taxa with one another than either group shared exclusively with BLLGC. A total of 84 ASVs and 50 genera were detected across all three growth stages, representing a cross-stage shared microbial fraction. These results demonstrate a marked reduction in stage-specific taxonomic membership across the sampled growth sequence.
3.6. A Fixed Persistent ASV Fraction Became Increasingly Dominant in Community Abundance
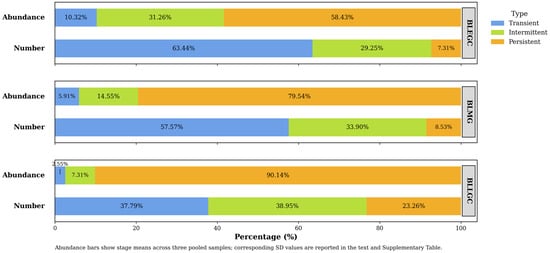
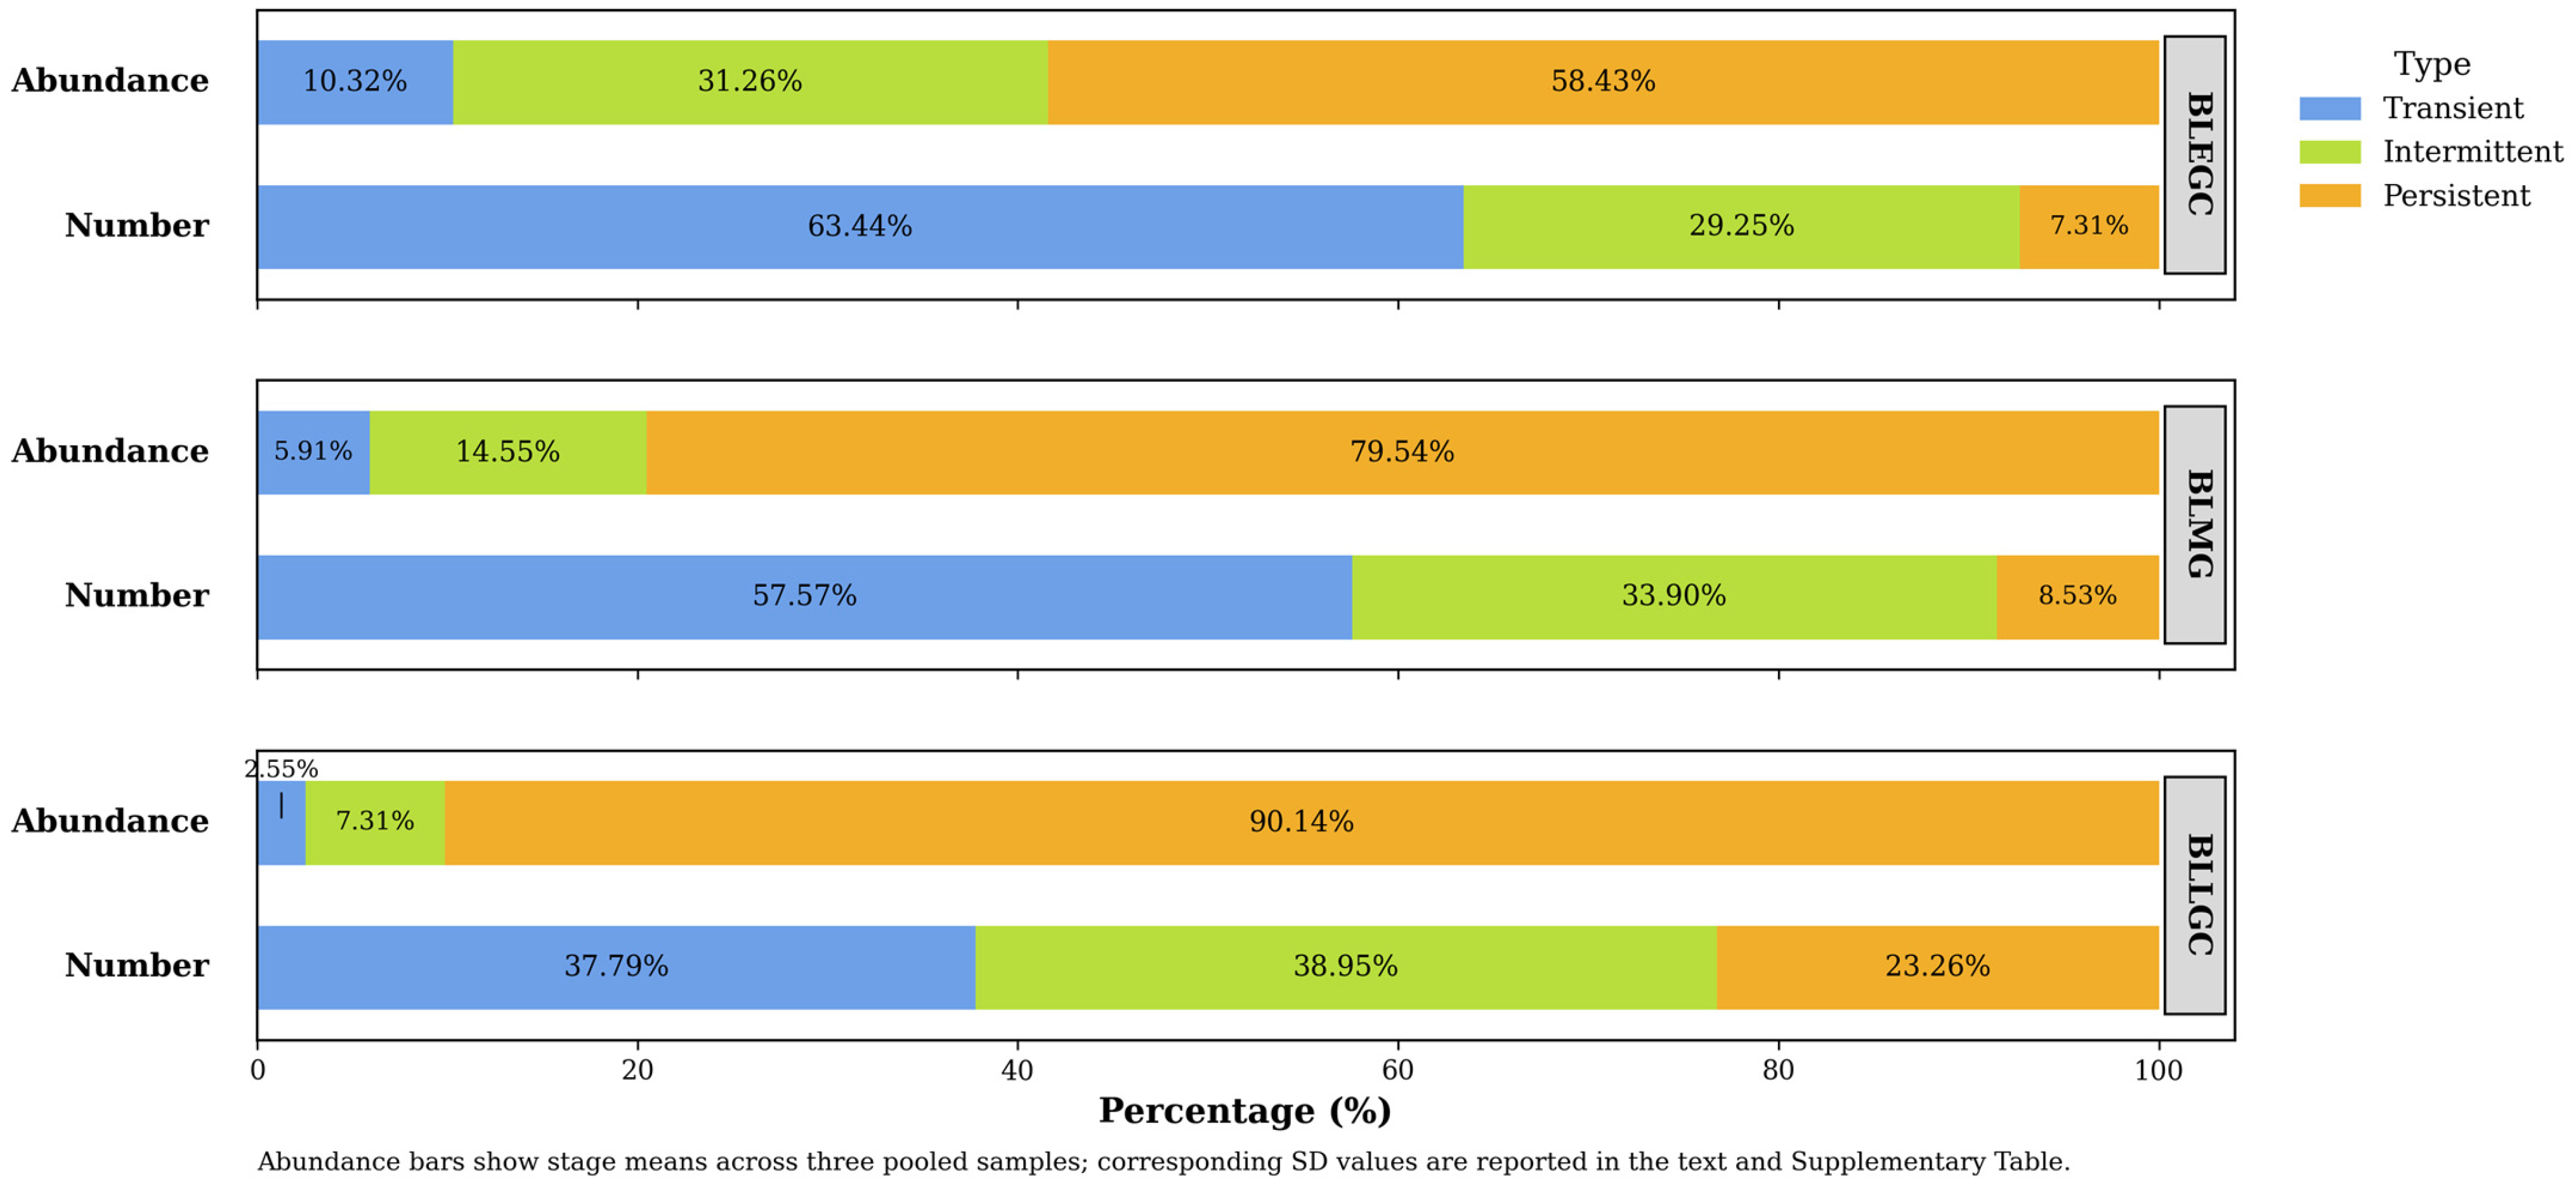
Across the complete nine-sample dataset, 682 ASVs were classified as transient, 188 as intermittent, and 40 as persistent. Because persistence was defined globally as detection in at least eight of nine pooled samples, the persistent fraction consisted of the same 40 ASVs across the sampled growth sequence. The total numbers of unique ASVs detected in BLEGC, BLMG, and BLLGC were 547, 469, and 172, respectively. The numbers of transient/intermittent/persistent unique ASVs were 347/160/40 in BLEGC, 270/159/40 in BLMG, and 65/67/40 in BLLGC. Persistent ASVs therefore represented 7.31%, 8.53%, and 23.26% of stage-level unique ASVs, respectively. This proportional increase did not reflect an increase in the absolute number of persistent ASVs; rather, it primarily reflected the pronounced contraction of total stage-level richness (Figure 6).
Figure 6.
Numerical representation and abundance contribution of transient, intermittent, and persistent ASVs across the three growth-associated stages of D. maruadsi. “Number” represents the proportion of unique ASV identities assigned to each prevalence category within each stage, whereas “Abundance” represents the mean relative-abundance contribution of each category across the three pooled analytical samples. Corresponding SD values for abundance contributions are reported in the Results and Supplementary Materials.
At the pooled-sample level, persistent-ASV abundance contributions were 58.43 ± 15.08%, 79.54 ± 6.38%, and 90.14 ± 2.14% in BLEGC, BLMG, and BLLGC, respectively. Transient-ASV abundance contributions declined from 10.32 ± 5.51% to 5.91 ± 1.57% and 2.55 ± 0.47%, while intermittent ASVs contributed 31.26 ± 12.18%, 14.55 ± 5.97%, and 7.31 ± 2.46%. Exact permutation Kruskal–Wallis tests supported overall stage-associated differences in persistent and transient abundance contributions (both p = 0.0107); the intermittent fraction showed an exact permutation p = 0.0286.
The abundance-based pattern was robust to alternative analytical definitions. Using alternative prevalence thresholds, persistent ASVs contributed 60.46 ± 14.47%, 81.30 ± 5.95%, and 92.30 ± 0.98% of community abundance in BLEGC, BLMG, and BLLGC, respectively. In the leave-one-stage-out analysis, 53 ASVs defined as persistent using only BLEGC and BLMG samples contributed 63.38 ± 12.25% and 84.77 ± 3.87% in the two defining stages and 91.71 ± 1.05% in the held-out BLLGC samples. These results indicate that the increasing abundance dominance of high-prevalence taxa was not solely a mechanical consequence of including the late-stage samples in the persistence definition. Detailed sensitivity-analysis results are provided in Table S3.
3.7. Prevalence Remained Positively Associated with Conditional Mean Abundance
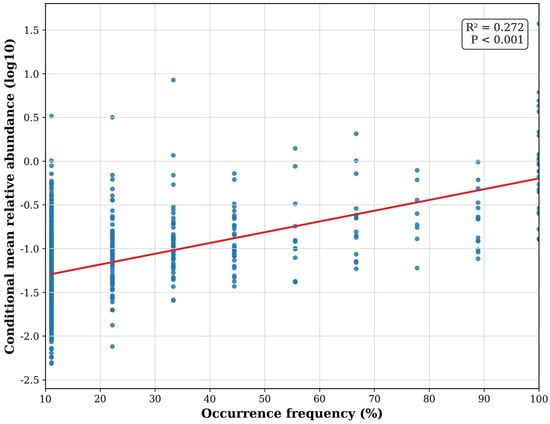
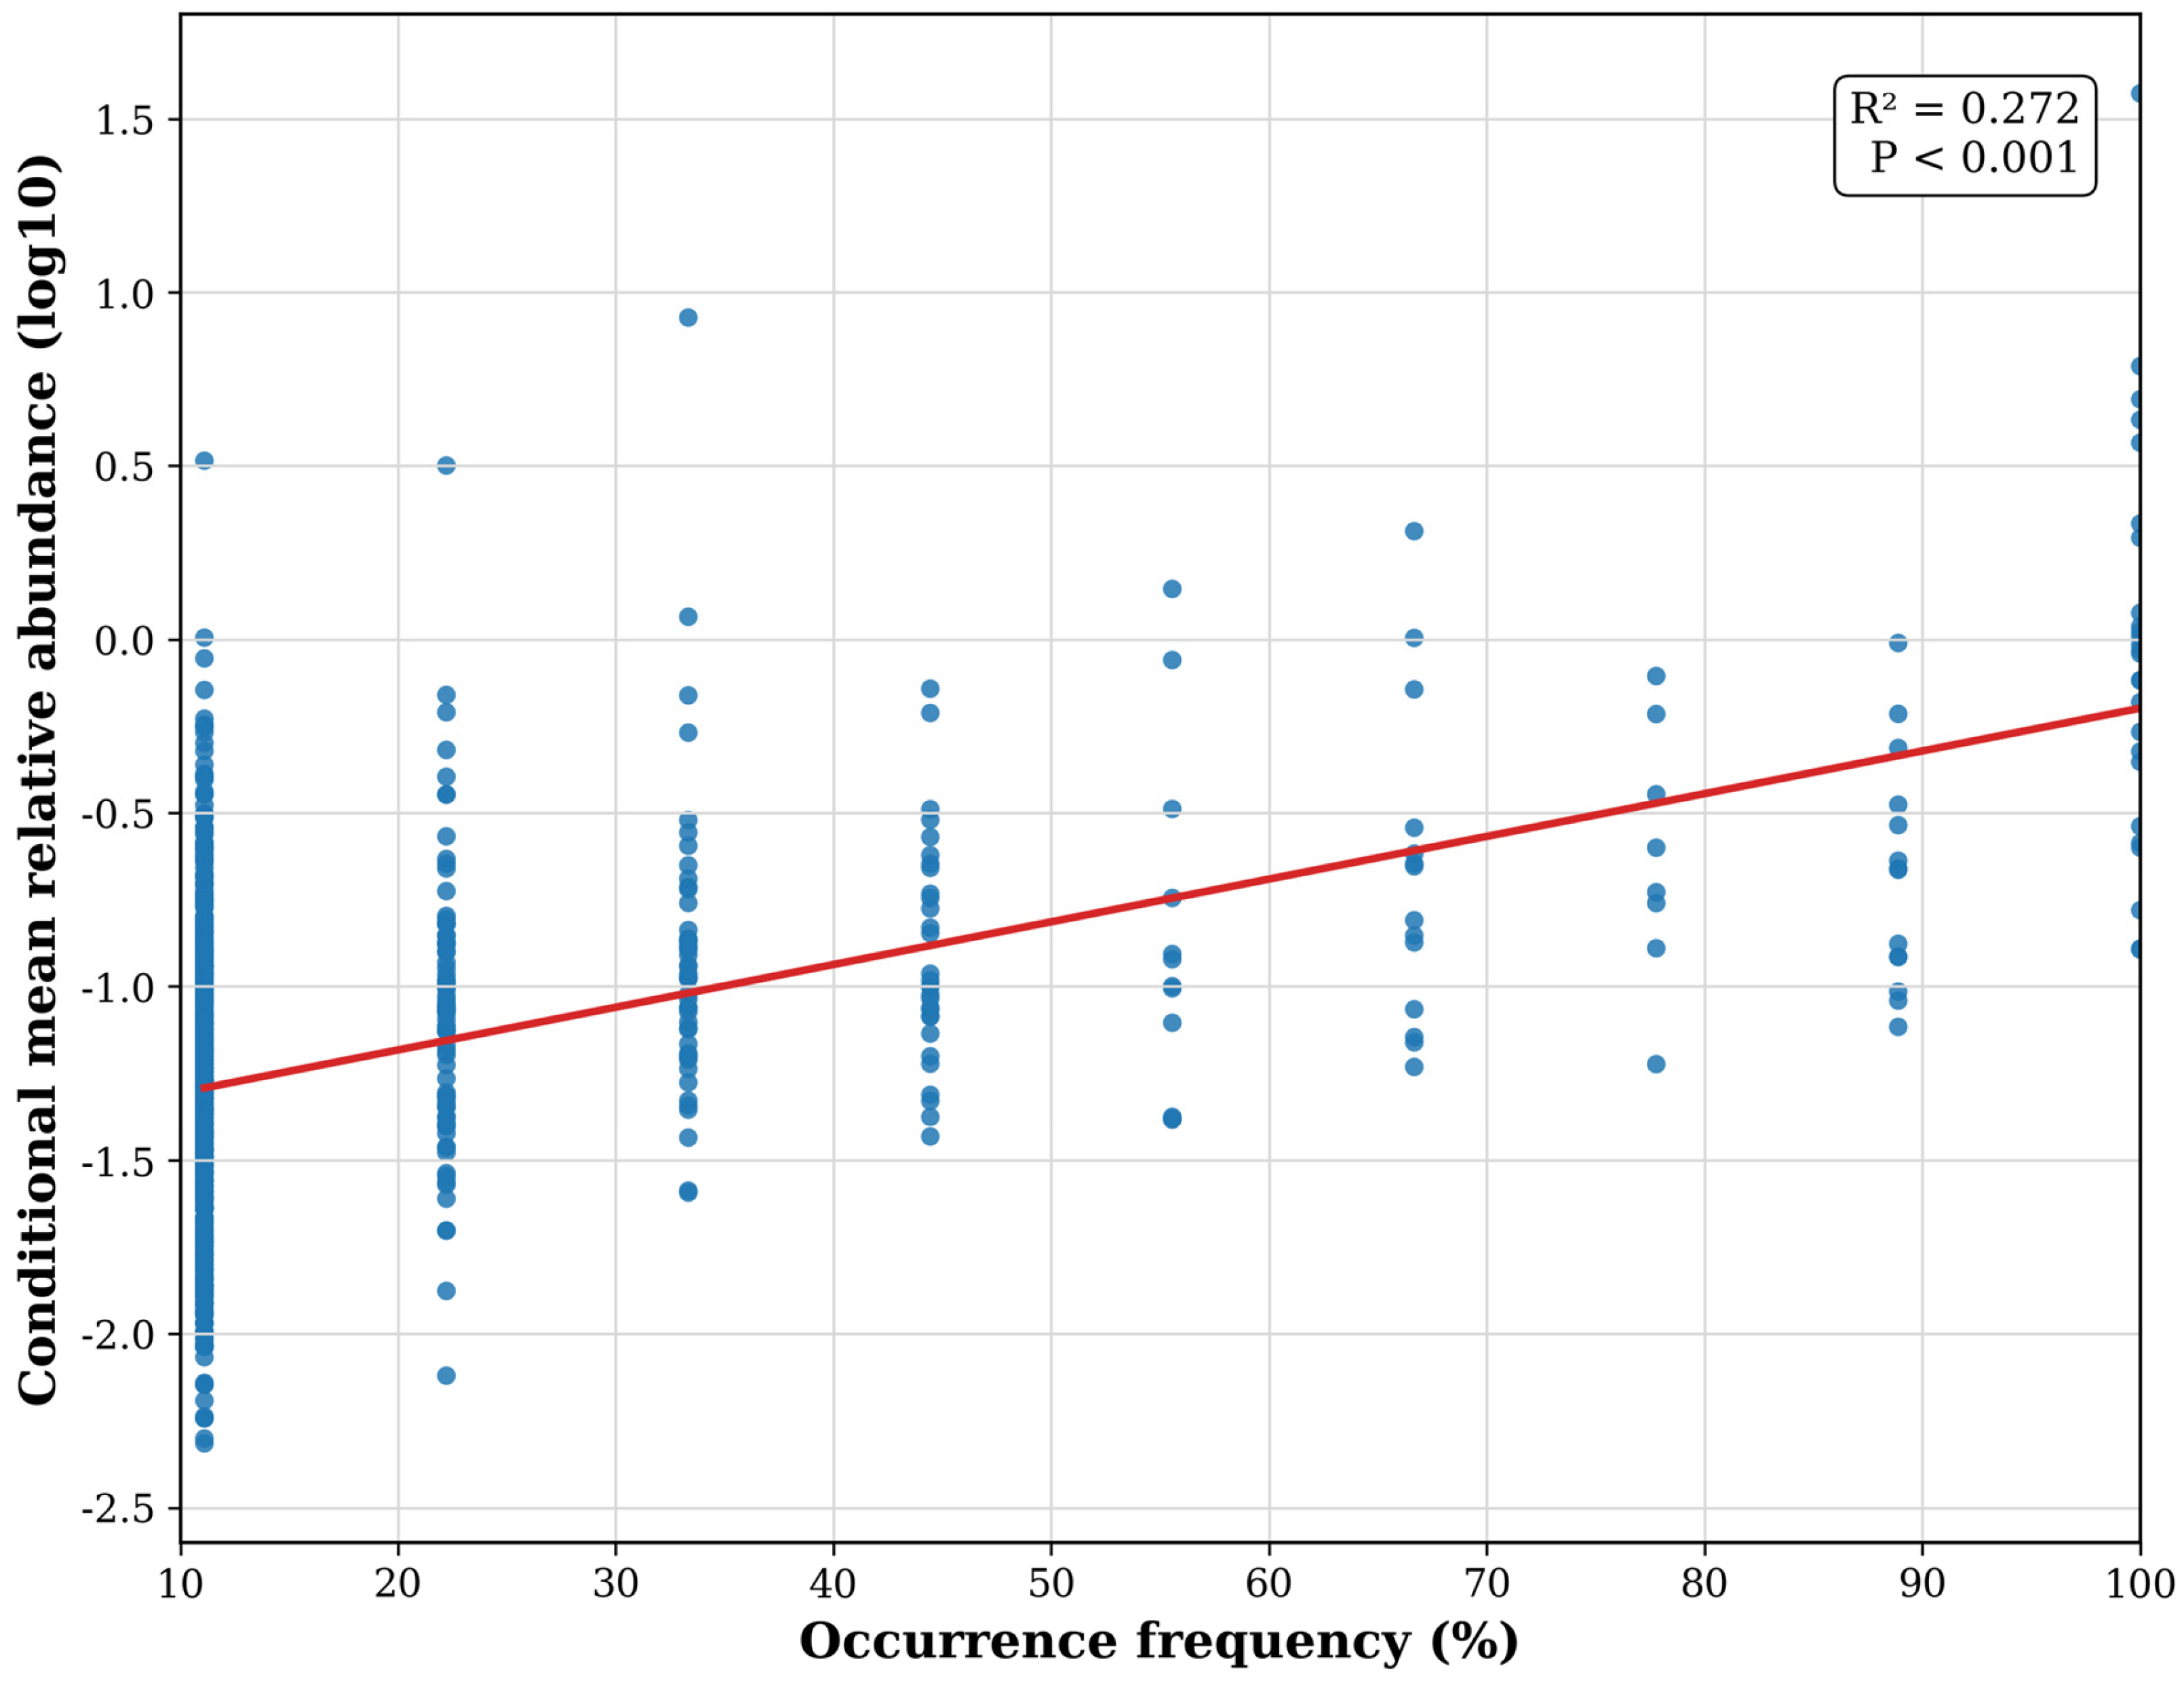
Using conditional mean abundance calculated only among samples in which each ASV was detected, prevalence remained positively associated with log10-transformed conditional mean relative abundance (n = 910 ASVs, R2 = 0.272; Spearman ρ = 0.436; Figure 7). Because ASV-level observations originated from the same nine compositional samples and were not statistically independent experimental units, this relationship was interpreted as an exploratory community-level pattern rather than as independent inferential evidence for ecological persistence.
Figure 7.
Relationship between ASV prevalence and conditional mean relative abundance across the gut bacterial communities of D. maruadsi. Conditional mean abundance was calculated only among samples in which each ASV was detected.
3.8. Exploratory Genus-Level Abundance Patterns Across Growth Stages
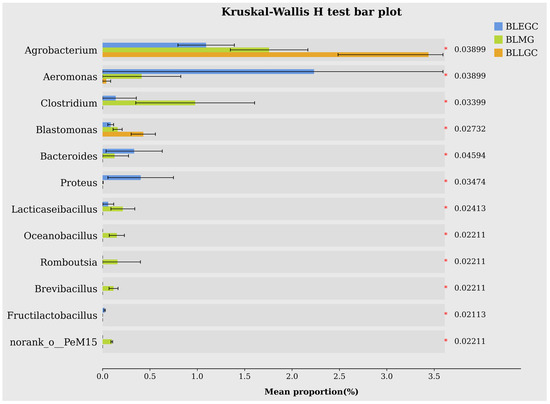
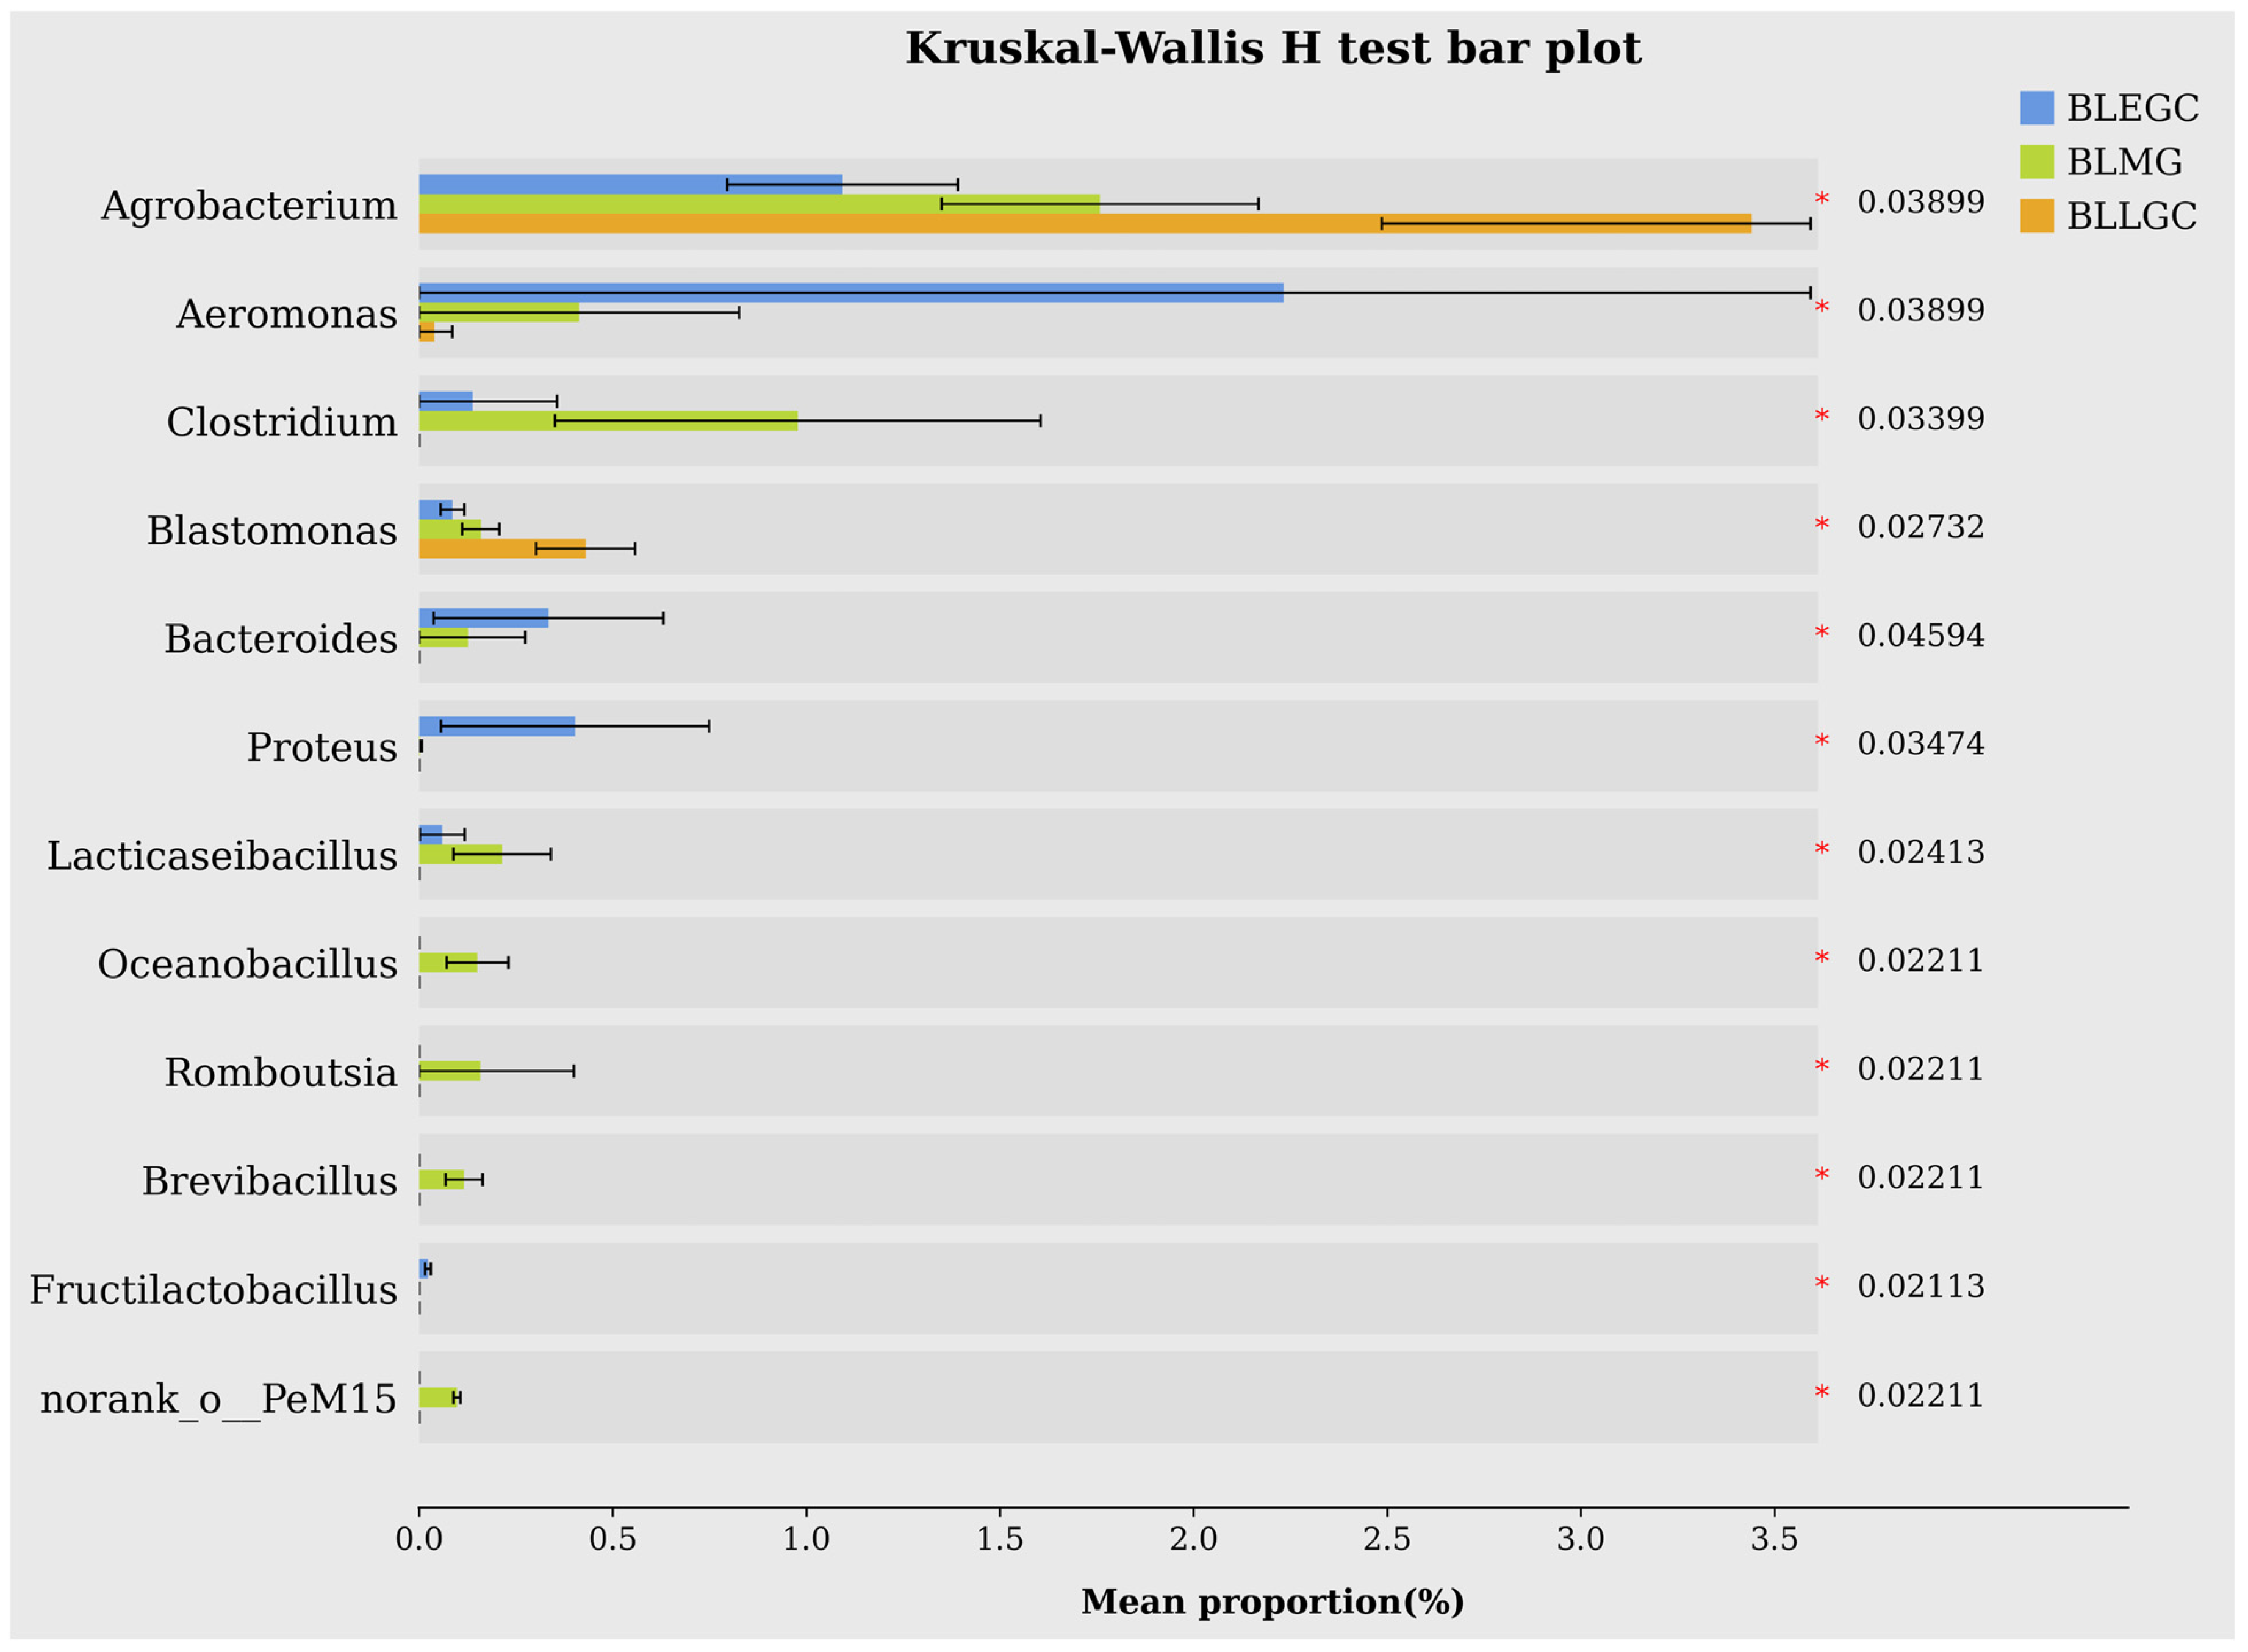
A total of 67 genus-level taxa were evaluated using Kruskal–Wallis tests (Figure 8). Twelve taxa showed nominal p < 0.05: Fructilactobacillus, norank_o__PeM15, Oceanobacillus, Brevibacillus, Romboutsia, Lacticaseibacillus, Blastomonas, Clostridium, Proteus, Aeromonas, Agrobacterium, and Bacteroides. However, none remained significant after Benjamini–Hochberg false-discovery-rate correction (minimum adjusted q = 0.2375). These taxa are therefore presented only as exploratory growth-stage-associated candidates. Several candidates showed their highest mean abundance in BLMG, whereas Aeromonas, Proteus, and Bacteroides were descriptively higher in BLEGC and Agrobacterium tended to increase toward BLLGC. These patterns should not be interpreted as statistically confirmed differential abundance after correction for multiple testing. Complete genus-level test results are provided in Table S2.
Figure 8.
Exploratory genus-level abundance patterns among the three growth-associated sampling stages. Bars represent mean relative abundance ± SD across three pooled analytical samples per stage. Displayed p values are nominal Kruskal–Wallis values; none of the 67 tested genera remained significant after Benjamini–Hochberg FDR correction. * p < 0.05.
4. Discussion
4.1. Growth-Associated Restructuring of the Gut Microbiota
The present study revealed clear growth-associated restructuring of the gut bacterial community of D. maruadsi. Because the three body-size classes were successively sampled from the same cohort continuously reared in the same culture system, variation associated with fish origin and rearing system was minimized. Similar ontogenetic changes have been reported in several teleost fishes. Danio rerio exhibit distinct developmental-stage-associated intestinal bacterial communities, including pronounced compositional shifts during development [4]. Ictalurus punctatus likewise undergoes marked temporal restructuring of the intestinal microbiota during early development, followed by comparatively smaller changes at later sampling stages [5]. In Salmo salar, stage-specific microbial signatures and continuous succession have been observed from embryonic development through juvenile growth [6].
Host development nevertheless involves multiple covarying factors. Changes in body size are accompanied by changes in intestinal morphology, digestive capacity, immune status, feeding intensity, cultivation duration, and cumulative exposure to environmental microorganisms [11,12]. Fish gut communities are also influenced by diet, environmental conditions, salinity, trophic ecology, and host-associated processes [13,14]. In the present experiment, feed formulation remained unchanged among BLEGC, BLMG, and BLLGC, reducing one major source of dietary variation. However, feeding quantity, cultivation duration, host developmental status, calendar time, and unmeasured temporal environmental conditions covaried with sampling stage. Accordingly, the observed microbial differences are interpreted as growth-associated succession rather than as isolated effects of body weight.
The PCoA and ANOSIM demonstrated differences in overall bacterial community composition among the sampled stages; complementary PERMANOVA supported an overall stage-associated effect, although significant PERMDISP indicated that differences in within-stage dispersion also contributed to the multivariate pattern. The present study did not explicitly quantify stochastic and deterministic community assembly processes, and the current data therefore do not provide direct evidence for changes in deterministic assembly, host selection, or other specific ecological assembly mechanisms during growth.
4.2. A Conserved High-Level Taxonomic Framework Masked Extensive Restructuring at Finer Resolutions
One notable feature of the present dataset was the contrast between the relatively conserved phylum-level community and the pronounced restructuring observed at finer taxonomic levels. Pseudomonadota remained overwhelmingly dominant across BLEGC, BLMG, and BLLGC, whereas substantially greater changes were apparent among AlphaProteobacteria and GammaProteobacteria and among the constituent orders, families, genera, and ASVs. Such a pattern is consistent with previous fish microbiome studies showing that developmental transitions may occur mainly through turnover within broadly conserved bacterial phyla [4,6,15,16,17].
For example, the intestinal microbiota of developing Salmo salar underwent major stage-dependent changes despite the repeated dominance of Proteobacteria at several developmental stages; importantly, the dominant genera affiliated with this phylum differed substantially among stages [6]. Similarly, Danio rerio retain a recognizable set of major intestinal bacterial lineages throughout development while showing strong age-associated changes in individual bacterial populations [4]. This hierarchical pattern is important because phylum-level similarity should not be interpreted as microbiome stability. The intestinal environment may continue to support bacteria belonging to the same broad phylogenetic groups while selecting for very different bacterial populations within those groups. Comparative analyses across fishes have also demonstrated that gut microbiota composition reflects a combination of host ecology and environmental conditions and that meaningful ecological differences can be obscured when communities are examined only at coarse taxonomic resolution [13,14,18].
In D. maruadsi, the strongest differences occurred at the genus and ASV levels. BLEGC contained pronounced sample-specific increases in taxa such as Acinetobacter and Photobacterium, whereas later-stage samples were characterized by more consistent dominance of Methylobacterium and several other recurrent lineages. The top 50 genus heatmap likewise showed redistribution of bacterial genera among growth stages rather than replacement of entire higher-level taxonomic groups. Therefore, the developmental signal was characterized primarily by reorganization within a broadly conserved taxonomic framework. Because the negative controls were not sequenced, recurrent taxa such as Methylobacterium cannot be unequivocally distinguished from potential reagent-derived signals and are therefore interpreted as high-prevalence taxa within the analyzed dataset rather than definitively demonstrated resident gut bacteria.
4.3. The Early-Stage Microbiota Contained a Larger Heterogeneous and Stage-Specific Bacterial Fraction
BLEGC exhibited several features distinguishing it from the later growth stages. Its biological pools were more widely distributed in ordination space, its genus-level profiles showed conspicuous sample-specific enrichment, and it contained substantially more stage-specific genera and ASVs than BLMG or BLLGC. Together, these results indicate that the smallest fish harbored a comparatively heterogeneous bacterial assemblage. Dynamic early-stage gut communities have been observed in other fishes [19,20]. Ictalurus punctatus showed substantial microbiota turnover during early ontogeny, followed by less pronounced shifts at later developmental stages [5]. In Trachinotus blochii, early-life microbiota also showed pronounced ontogenetic dynamics, with transient microorganisms contributing strongly to early communities and recurrent/core taxa becoming increasingly prominent during subsequent development [8].
The stage-specific ASV results in D. maruadsi are particularly notable. Unique ASVs decreased from 361 in BLEGC to 286 in BLMG and only 69 in BLLGC, while unique genera declined from 103 to 67 and 14, respectively. Thus, longer culture duration did not lead to progressive accumulation of increasingly large numbers of detectable bacterial taxa. Instead, the stage-specific fraction became substantially smaller in the largest fish. One possible explanation is that early-stage intestinal environments permit temporary establishment of a wider range of bacterial immigrants, whereas changes associated with host development progressively restrict which organisms can persist [20,21,22]. Studies of developing Atlantic cod indicate that host-associated selection can structure larval microbial communities and that changes in intestinal development may alter the selective environment encountered by microorganisms [11]. Danio rerio studies similarly suggest that the relative contribution of non-neutral processes, including host selection, microbial interactions, and active dispersal, can increase during development [12].
Nevertheless, the current experiment does not directly demonstrate stronger host-associated filtering in BLLGC. The number of stage-specific ASVs is influenced by overall richness, sequencing depth, and the threshold used to define taxon presence. Accordingly, the reduction in unique ASVs alone does not demonstrate stronger host selection. Its ecological relevance instead derives from its concordance with the decline in low-prevalence membership and the increasing abundance contribution of persistent taxa.
4.4. Increasing Abundance Dominance of a Fixed Persistent Fraction Supports Community Consolidation
A major feature of the present study was the progressive increase in the abundance contribution of ASVs classified as persistent across the complete nine-sample dataset. Persistent ASVs contributed 58.43 ± 15.08% of bacterial abundance in BLEGC, increased to 79.54 ± 6.38% in BLMG, and reached 90.14 ± 2.14% in BLLGC. In contrast, transient-ASV abundance contributions declined from 10.32 ± 5.51% to 5.91 ± 1.57% and 2.55 ± 0.47%. These patterns indicate that microbiome succession involved much more than replacement of individual bacterial genera. Instead, the occupancy structure of the entire community changed. Persistent taxa represented a relatively small numerical fraction but accounted for a large proportion of community abundance, and this imbalance became progressively stronger across the sampled growth sequence.
Ontogenetic changes in the balance between transient and recurrent microorganisms have also been reported in Trachinotus blochii. Sumithra described a highly dynamic early-life microbiota and identified persistent/core bacterial components whose ecological importance changed with developmental stage. More broadly, persistent microbial populations have been documented in fish intestinal systems despite variation in diets and host individuals [23,24]. In European seabass, generalist core populations have been reported across fish, dietary conditions, intestinal regions, and sampling periods [7], and conserved core intestinal bacteria have also been described in Danio rerio [3]. In the present dataset, the globally persistent fraction consisted of the same 40 ASVs throughout the analysis. Their taxonomic identities are provided in Table S4. These 40 ASVs represented 7.31%, 8.53%, and 23.26% of stage-level unique ASVs, respectively; thus, the increase in their numerical proportion primarily reflected contraction of total richness rather than accumulation of additional persistent taxa. Sensitivity analyses using alternative prevalence thresholds and a leave-one-stage-out definition retained the same increasing abundance pattern, supporting the conclusion that later-stage community abundance became increasingly concentrated in a recurrent high-prevalence fraction.
The contamination-control limitation is particularly relevant when interpreting this persistent fraction. Because extraction and PCR blanks were not sequenced, formal sequence-based decontamination was not possible. Excluding Methylobacterium-assigned ASVs in a descriptive sensitivity analysis reduced the remaining persistent fraction to 29.78 ± 9.75%, 31.92 ± 4.05%, and 37.98 ± 5.79% across BLEGC, BLMG, and BLLGC, respectively, and this numerical trend was not statistically supported (exact permutation p = 0.232). This analysis does not establish the absence or presence of reagent contamination; rather, it illustrates that biological interpretation of specific recurrent lineages should remain cautious.
4.5. The Prevalence–Abundance Relationship Indicates a Quantitatively Important Recurrent Fraction but Is Descriptive
Prevalence and abundance represent related but distinct ecological characteristics. High abundance within a single sample does not necessarily indicate a recurrent host-associated bacterium, because occasional blooms may produce high local abundance while the organism remains absent from most samples. Conversely, high prevalence does not necessarily indicate quantitative dominance if a taxon persists consistently at very low abundance. Core microbiome concepts therefore generally emphasize repeated occurrence across hosts or conditions rather than abundance alone [3,7]. Using conditional mean abundance calculated only among samples in which each ASV was detected, prevalence remained positively associated with abundance (R2 = 0.272; Spearman ρ = 0.436). Because ASV observations originated from the same nine compositional samples and are not independent experimental units, this relationship is interpreted as an exploratory descriptive pattern rather than independent inferential evidence. Low-abundance taxa are also intrinsically more likely to fall below sequencing detection thresholds, which can contribute to positive occupancy–abundance relationships.
The persistence categories used in this study were defined across the complete nine-sample dataset rather than independently within each growth stage. Accordingly, an ASV detected in all three pooled samples of one stage may still be classified as globally intermittent if it is absent from samples collected at the other stages. Global persistence and within-stage occurrence therefore represent different ecological properties and should not be interpreted interchangeably. The 84 ASVs shared across all three stages represent a cross-stage shared fraction, whereas the stricter globally persistent criterion identified 40 ASVs detected in at least eight of the nine pooled samples.
4.6. BLMG Showed an Exploratory Transitional Configuration
BLMG displayed several features consistent with a transitional microbial configuration rather than simply an intermediate mixture between BLEGC and BLLGC. The abundance contribution of persistent taxa increased sharply from 58.43 ± 15.08% in BLEGC to 79.54 ± 6.38% in BLMG. Several genera, including Clostridium, Lacticaseibacillus, Oceanobacillus, Romboutsia, and Brevibacillus, exhibited their highest mean relative abundances in BLMG. However, none of the 67 genus-level tests remained significant after Benjamini–Hochberg FDR correction, so these genus-level patterns are treated as exploratory rather than statistically confirmed stage indicators.
Non-linear and stage-specific bacterial responses have been documented during fish ontogeny [25]. Salmo salar exhibited distinct bacterial signatures at successive developmental stages rather than a simple monotonic transition between early and late communities [6]. Likewise, Danio rerio microbiota assemble into stage-specific configurations during development, with microbial shifts occurring both in association with environmental/dietary changes and during periods of relatively constant external conditions [4].
The largest increase in the abundance contribution of persistent ASVs occurred between BLEGC and BLMG, whereas the largest increase in their proportional representation occurred between BLMG and BLLGC. This pattern is compatible with BLMG representing an exploratory transitional configuration within the sampled growth sequence. However, the present grouping was based on body-size classes rather than histologically or physiologically defined stages of intestinal maturation; therefore, correspondence with a specific physiological maturation stage remains unresolved. The genera showing nominal growth-stage-associated abundance patterns should be regarded as taxonomic candidates rather than direct evidence of microbial activity or host effects. In addition, 16S rRNA gene sequencing does not determine whether these microorganisms were metabolically active or directly influenced host physiology [2].
4.7. Lower Dispersion of BLLGC Pools Is Consistent with Consolidation but Does Not Demonstrate Stability
The BLLGC samples clustered closely in the PCoA and showed comparatively similar genus-level compositions. Combined with the reduced number of stage-specific taxa and the strong dominance of persistent members, this pattern suggests that the later-stage communities were more compositionally consistent among pooled replicates. Ictalurus punctatus provides one comparable example. Their intestinal microbiota underwent large changes during early development, whereas shifts between later time points were less pronounced, which the authors interpreted cautiously as possible movement toward a more stable configuration [5]. Trachinotus blochii likewise displayed strong microbial dynamics during early ontogeny and changes in the contribution of core and transient bacterial populations across development [8]. Nevertheless, reduced variability with host development is not universal. Stephens et al. reported that interindividual differences among Danio rerio intestinal microbiomes actually increased with age despite clear developmental succession [4]. This contrast demonstrates that ontogenetic microbiome trajectories vary among host species, culture systems, developmental windows, and sampling strategies. Because each analytical sample consisted of intestinal tissues pooled from five fish, the ordination analysis describes variability among pooled samples rather than inter-individual microbiome variability. The significant PERMDISP result further indicates that the observed late-stage compactness is part of a broader difference in multivariate dispersion among stages and should not be interpreted as evidence of temporal stability. The present dataset therefore does not resolve whether microbiome variability among individual fish changed during growth.
4.8. An Integrated View of Growth-Associated Gut Microbiome Consolidation in D. maruadsi
Collectively, the results support a coherent growth-associated trajectory of intestinal bacterial community development in D. maruadsi. The BLEGC microbiota represented the most heterogeneous state examined and contained the greatest number of stage-specific genera and ASVs. BLMG showed an intermediate configuration in which persistent-ASV abundance increased sharply while substantial stage-specific membership remained. Similar stage-specific transitional communities have been documented during the ontogeny of Danio rerio and Salmo salar [4,6]. BLLGC contained only 69 stage-specific ASVs, while the same 40 globally persistent ASVs represented 23.26% of stage-level unique ASVs and contributed 90.14 ± 2.14% of total bacterial abundance. Later-stage pools also displayed comparatively similar taxonomic profiles. This pattern shares several features with developmental microbiome trajectories reported for Ictalurus punctatus and Trachinotus blochii, in which early communities are relatively dynamic and later development involves increased representation of recurrent microbial populations [5,8]. However, differences from Danio rerio demonstrate that the direction of microbiome variability is not universal [4]. These findings are specific to D. maruadsi under the culture conditions and growth interval examined here and do not imply a universal microbiome trajectory across teleost fishes [26]. Within the present system, growth-associated gut microbiome succession was characterized by contraction of stage-specific microbial membership, declining quantitative contribution of transient taxa, and increasing abundance dominance of highly prevalent bacterial members. Thus, the principal growth-associated signal was not simply replacement of particular bacterial genera, but a redistribution of community abundance toward microorganisms repeatedly detected across the complete sampled growth sequence.
These conclusions remain specific to the sampled culture system and time window. Growth stage covaried with host age, calendar time, cultivation duration, feeding quantity, and unmeasured environmental variation, and the rearing system lacked independent replication. Water and feed microbiota were not sampled concurrently, preventing separation of long-term host-associated occurrence from repeated environmental or dietary input. In addition, the negative controls were not sequenced, limiting sequence-based contaminant assessment. These constraints restrict causal interpretation and should be considered when generalizing the results to other culture systems or fish populations.
5. Conclusions
This study demonstrates pronounced growth-associated succession of the gut bacterial community in D. maruadsi across three successive body-size classes sampled from the same continuously reared cohort. Although the broad taxonomic framework remained largely conserved, with Pseudomonadota dominating throughout the sampled growth sequence, substantial restructuring occurred at finer taxonomic resolutions. The smallest fish contained a larger stage-specific microbial fraction, whereas the largest fish exhibited markedly fewer stage-specific ASVs and substantially greater abundance dominance of persistent taxa. Unique ASVs declined from 361 in BLEGC to 69 in BLLGC, while the same 40 globally persistent ASVs represented 7.31%, 8.53%, and 23.26% of stage-level unique ASVs and contributed 58.43 ± 15.08%, 79.54 ± 6.38%, and 90.14 ± 2.14% of community abundance, respectively. The prevalence–abundance analysis further indicated a positive but moderate descriptive association between ASV prevalence and conditional mean abundance (R2 = 0.272; Spearman ρ = 0.436). Together, these findings indicate that growth-associated gut microbiome succession in D. maruadsi involved not only taxonomic turnover but also progressive redistribution of community abundance toward highly prevalent and persistent bacterial members. Because body size covaried with host age, cultivation duration, calendar time, feeding quantity, and unmeasured environmental variation within a single non-replicated culture system, the observed pattern represents growth-associated temporal restructuring rather than an isolated effect of body weight.
Supplementary Materials
The following supporting information can be downloaded at: https://www.mdpi.com/article/10.3390/vetsci13111156/s1, Figure S1: Rarefaction curves of gut bacterial communities across three growth stages of D. maruadsi; Figure S2: Relative abundance of gut bacterial taxa at the class level; Figure S3: Relative abundance of gut bacterial taxa at the order level; Figure S4: Relative abundance of gut bacterial taxa at the family level; Table S1: Per-sample sequencing statistics and alpha-diversity indices; Table S2: Complete genus-level Kruskal–Wallis and Benjamini–Hochberg FDR results; Table S3: Sensitivity analyses of prevalence-based persistence classification; Table S4: Taxonomic identities of globally persistent ASVs.
Author Contributions
Conceptualization, X.W., D.L. and W.H.; methodology, J.L.; software, J.H.; validation, F.Y. and D.L.; formal analysis, X.W. and Z.L.; investigation, J.L.; resources, D.L.; data curation, X.W.; writing—original draft preparation, X.W.; writing—review and editing, X.W. and D.L.; visualization, X.W.; supervision, W.H.; project administration, X.W.; funding acquisition, X.W. and W.H. All authors have read and agreed to the published version of the manuscript.
Funding
This research was funded by Startup Fund for Advanced Talents of Ningde Normal University (No.: 2024Y16), Special Fund for Major Research Projects of Ningde Normal University (No.: 2025ZX030).
Institutional Review Board Statement
All procedures involving D. maruadsi were reviewed and approved by the Science and Technology Ethics Review Committee of Ningde Normal University (Approval No. ND-010-2025; approved on 1 August 2025).
Informed Consent Statement
Not applicable.
Data Availability Statement
The raw sequence data are available in the Genome Sequence Archive (Genomics, Proteomics & Bioinformatics 2021) at the National Genomics Data Center (Nucleic Acids Res 2022), China National Center for Bioinformation/Beijing Institute of Genomics, Chinese Academy of Sciences (accession codes: CRA049855).
Conflicts of Interest
The authors declare no conflicts of interest.
References
- Llewellyn, M.S.; Boutin, S.; Hoseinifar, S.H.; Derome, N. Teleost microbiomes: The state of the art in their characterization, manipulation and importance in aquaculture and fisheries. Front. Microbiol. 2014, 5, 207. [Google Scholar] [CrossRef] [Scilit] [PubMed]
- Tarnecki, A.M.; Burgos, F.A.; Ray, C.L.; Arias, C.R. Fish intestinal microbiome: Diversity and symbiosis unravelled by metagenomics. J. Appl. Microbiol. 2017, 123, 2–17. [Google Scholar] [CrossRef] [Scilit] [PubMed]
- Roeselers, G.; Mittge, E.K.; Stephens, W.Z.; Parichy, D.M.; Cavanaugh, C.M.; Guillemin, K.; Rawls, J.F. Evidence for a core gut microbiota in the zebrafish. ISME J. 2011, 5, 1595–1608. [Google Scholar] [CrossRef] [Scilit] [PubMed]
- Stephens, W.Z.; Burns, A.R.; Stagaman, K.; Wong, S.; Rawls, J.F.; Guillemin, K.; Bohannan, B.J. The composition of the zebrafish intestinal microbial community varies across development. ISME J. 2016, 10, 644–654. [Google Scholar] [CrossRef] [Scilit] [PubMed]
- Bledsoe, J.W.; Peterson, B.C.; Swanson, K.S.; Small, B.C. Ontogenetic characterization of the intestinal microbiota of channel catfish through 16S rRNA gene sequencing reveals insights on temporal shifts and the influence of environmental microbes. PLoS ONE 2016, 11, e0166379. [Google Scholar] [CrossRef] [Scilit] [PubMed]
- Lokesh, J.; Kiron, V.; Sipkema, D.; Fernandes, J.M.; Moum, T. Succession of embryonic and the intestinal bacterial communities of Atlantic salmon (Salmo salar) reveals stage-specific microbial signatures. MicrobiologyOpen 2019, 8, e00672. [Google Scholar] [CrossRef] [Scilit] [PubMed]
- Kokou, F.; Sasson, G.; Friedman, J.; Eyal, S.; Ovadia, O.; Harpaz, S.; Cnaani, A.; Mizrahi, I. Core gut microbial communities are maintained by beneficial interactions and strain variability in fish. Nat. Microbiol. 2019, 4, 2456–2465. [Google Scholar] [CrossRef] [Scilit] [PubMed]
- Sumithra, T.; Sharma, S.K.; Suresh, G.; Gop, A.P.; Surya, S.; Gomathi, P.; Anil, M.; Sajina, K.; Reshma, K.; Ebeneezar, S. Mechanistic insights into the early life stage microbiota of silver pompano (Trachinotus blochii). Front. Microbiol. 2024, 15, 1356828. [Google Scholar] [CrossRef] [Scilit] [PubMed]
- Wang, Q.-H.; Wu, R.-X.; Li, Z.-L.; Niu, S.-F.; Zhai, Y.; Huang, M.; Li, B. Effects of Late Pleistocene climatic fluctuations on the phylogeographic and demographic history of Japanese scad (Decapterus maruadsi). Front. Mar. Sci. 2022, 9, 878506. [Google Scholar] [CrossRef] [Scilit]
- Hino, H.; Kurota, H.; Muko, S.; Ohshimo, S. Estimation of Preferred Habitats and Total Catch Amount of the Round Scad Decapterus maruadsi and Five Other Scad Species in the East China Sea and Sea of Japan. Jpn. Agric. Res. Q. JARQ 2023, 57, 153–163. [Google Scholar] [CrossRef] [Scilit]
- Bakke, I.; Coward, E.; Andersen, T.; Vadstein, O. Selection in the host structures the microbiota associated with developing cod larvae (Gadus morhua). Environ. Microbiol. 2015, 17, 3914–3924. [Google Scholar] [CrossRef] [Scilit] [PubMed]
- Burns, A.R.; Stephens, W.Z.; Stagaman, K.; Wong, S.; Rawls, J.F.; Guillemin, K.; Bohannan, B.J. Contribution of neutral processes to the assembly of gut microbial communities in the zebrafish over host development. ISME J. 2016, 10, 655–664. [Google Scholar] [CrossRef] [Scilit] [PubMed]
- Sullam, K.E.; Essinger, S.D.; Lozupone, C.A.; O’Connor, M.P.; Rosen, G.L.; Knight, R.; Kilham, S.S.; Russell, J.A. Environmental and ecological factors that shape the gut bacterial communities of fish: A meta-analysis. Mol. Ecol. 2012, 21, 3363–3378. [Google Scholar] [CrossRef] [Scilit] [PubMed]
- Wong, S.; Rawls, J.F. Intestinal microbiota composition in fishes is influenced by host ecology and environment. Mol. Ecol. 2012, 21, 3100–3102. [Google Scholar] [CrossRef] [Scilit] [PubMed]
- Ghanbari, M.; Kneifel, W.; Domig, K.J. A new view of the fish gut microbiome: Advances from next-generation sequencing. Aquaculture 2015, 448, 464–475. [Google Scholar] [CrossRef] [Scilit]
- Egerton, S.; Culloty, S.; Whooley, J.; Stanton, C.; Ross, R.P. The gut microbiota of marine fish. Front. Microbiol. 2018, 9, 873. [Google Scholar] [CrossRef] [Scilit] [PubMed]
- Ou, W.; Yu, G.; Zhang, Y.; Mai, K. Recent progress in the understanding of the gut microbiota of marine fishes. Mar. Life Sci. Technol. 2021, 3, 434–448. [Google Scholar] [CrossRef] [Scilit] [PubMed]
- Legrand, T.P.; Wynne, J.W.; Weyrich, L.S.; Oxley, A.P. A microbial sea of possibilities: Current knowledge and prospects for an improved understanding of the fish microbiome. Rev. Aquac. 2020, 12, 1101–1134. [Google Scholar] [CrossRef] [Scilit]
- Zhang, Z.; Li, D.; Refaey, M.M.; Xu, W.; Tang, R.; Li, L. Host age affects the development of southern catfish gut bacterial community divergent from that in the food and rearing water. Front. Microbiol. 2018, 9, 495. [Google Scholar] [CrossRef] [Scilit] [PubMed]
- Wang, A.R.; Ran, C.; Ringø, E.; Zhou, Z.G. Progress in fish gastrointestinal microbiota research. Rev. Aquac. 2018, 10, 626–640. [Google Scholar] [CrossRef] [Scilit]
- Nayak, S.K. Role of gastrointestinal microbiota in fish. Aquac. Res. 2010, 41, 1553–1573. [Google Scholar] [CrossRef] [Scilit]
- Butt, R.L.; Volkoff, H. Gut microbiota and energy homeostasis in fish. Front. Endocrinol. 2019, 10, 9. [Google Scholar] [CrossRef] [Scilit] [PubMed]
- Perlman, D.; Martínez-Álvaro, M.; Moraïs, S.; Altshuler, I.; Hagen, L.H.; Jami, E.; Roehe, R.; Pope, P.B.; Mizrahi, I. Concepts and consequences of a core gut microbiota for animal growth and development. Annu. Rev. Anim. Biosci. 2022, 10, 177–201. [Google Scholar] [CrossRef] [Scilit] [PubMed]
- Jones, J.; DiBattista, J.D.; Stat, M.; Bunce, M.; Boyce, M.C.; Fairclough, D.V.; Travers, M.J.; Huggett, M.J. The microbiome of the gastrointestinal tract of a range-shifting marine herbivorous fish. Front. Microbiol. 2018, 9, 2000. [Google Scholar] [CrossRef] [Scilit] [PubMed]
- Garibay-Valdez, E.; Olivas-Bernal, C.A.; Vargas-Albores, F.; Martínez-Porchas, M.; García-Godínez, D.M.; Medina-Félix, D.; Martínez-Córdova, L.R.; Cicala, F. Deciphering the gut microbiota of zebrafish, the most used fish as a biological model: A meta-analytic approach. Comp. Biochem. Physiol. Part A Mol. Integr. Physiol. 2024, 297, 111713. [Google Scholar] [CrossRef] [Scilit] [PubMed]
- Luan, Y.; Li, M.; Zhou, W.; Yao, Y.; Yang, Y.; Zhang, Z.; Ringø, E.; Olsen, R.E.; Clarke, J.L.; Xie, S. The fish microbiota: Research progress and potential applications. Engineering 2023, 29, 137–146. [Google Scholar] [CrossRef] [Scilit]
Disclaimer/Publisher’s Note: The statements, opinions and data contained in all publications are solely those of the individual author(s) and contributor(s) and not of MDPI and/or the editor(s). MDPI and/or the editor(s) disclaim responsibility for any injury to people or property resulting from any ideas, methods, instructions or products referred to in the content. |
© 2026 by the authors. Licensee MDPI, Basel, Switzerland. This article is an open access article distributed under the terms and conditions of the Creative Commons Attribution (CC BY) license.