


Abstract
Analysis of flow-induced pipe vibrations has been applied in a variety of applications, such as flowrate inference and leak detection. These applications are based on a functional relationship between the vibration features estimated in the pipe walls and the dynamics related to the flow of the substance. The dataset described in this document is comprised of signals acquired using an accelerometer attached to a pipe conveying cold water at specific flowrate values. Tests were carried out under numerals of the ISO 4064-1/2: 2016 standard and were performed in two measurement benches designed for flowmeter calibration, and a total of 80 flowrate values, from 25 L/h to 20,000 L/h, were considered. For each flowrate value, 3 to 6 samples were taken, so that the resulting dataset has a total of 382 signals that contain acceleration values in three axes and a timestamp in microseconds.
Dataset License: CC-BY 4.0.
1. Summary
The vibrations produced in the walls of a pipe when a fluid circulates through it have been studied with a variety of aims, from the general analysis of systems dynamics [1] to more specific applications such as leak detection [2]. One of the specific applications of pipe vibration analysis that has shown potential for future developments is the design of non-intrusive flowrate soft sensors, capable of inferring the value of the flowrate using vibrational signals [3], and it has been addressed using either accelerometers [4,5,6], Laser Doppler Vibrometers (LDV) [7] or acoustic sensors [8,9].
The dataset described in this paper is comprised of signals measured using a triaxial accelerometer attached to a pipe through which cold water circulates at fixed flowrates, with the aim of analyzing pipe vibrations. Signals were acquired in a total of 80 flowrate values from 6.25 L/h to 20,000 L/h, with 3 to 6 repetitions for each flowrate, obtaining a total of 382 signals. Each signal is labeled with the corresponding flowrate value and contains a timestamp in microseconds and the linear acceleration in each one of the three axes, which were measured using a triaxial accelerometer with a sample rate of 100 Hz.
The experiment was carried out in the facilities of ACUATUBOS S.A.S., a company in Envigado, Antioquia-Colombia, that has a flowmeter calibration laboratory accredited by the National Accreditation Organism of Colombia (ONAC), using two different measurement benches: the micro measurement bench that can be used to measure flowrates from 5 L/h to 16,000 L/h; and the macro-measurement bench, which allows measurement of flowrates between 90 L/h and 25,000 L/h.
The dataset was collected as part of a research project on the potential of vibration analysis for the development of non-intrusive flowrate measurement.
2. Data Description
The dataset is made up of 382 files (.txt format). Each file corresponds to a particular flowrate value and contains the information of the accelerometer readings in three axes and a time column. The structure of each file is the following:
- The first row specifies the flowrate value at which the signal was recorded.
- The subsequent rows have four columns of information in the following order:
- o
- Timestamp in microseconds.
- o
- Linear acceleration in the x-axis in m/s2.
- o
- Linear acceleration in the y-axis in m/s2.
- o
- Linear acceleration in the z-axis in m/s2.
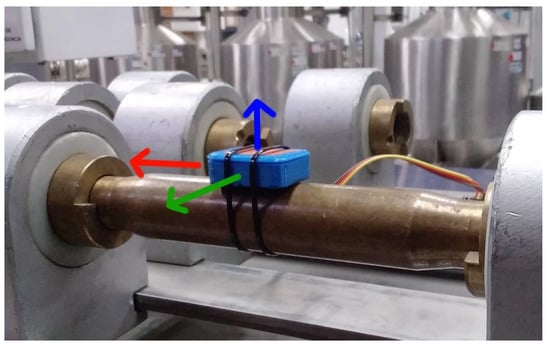
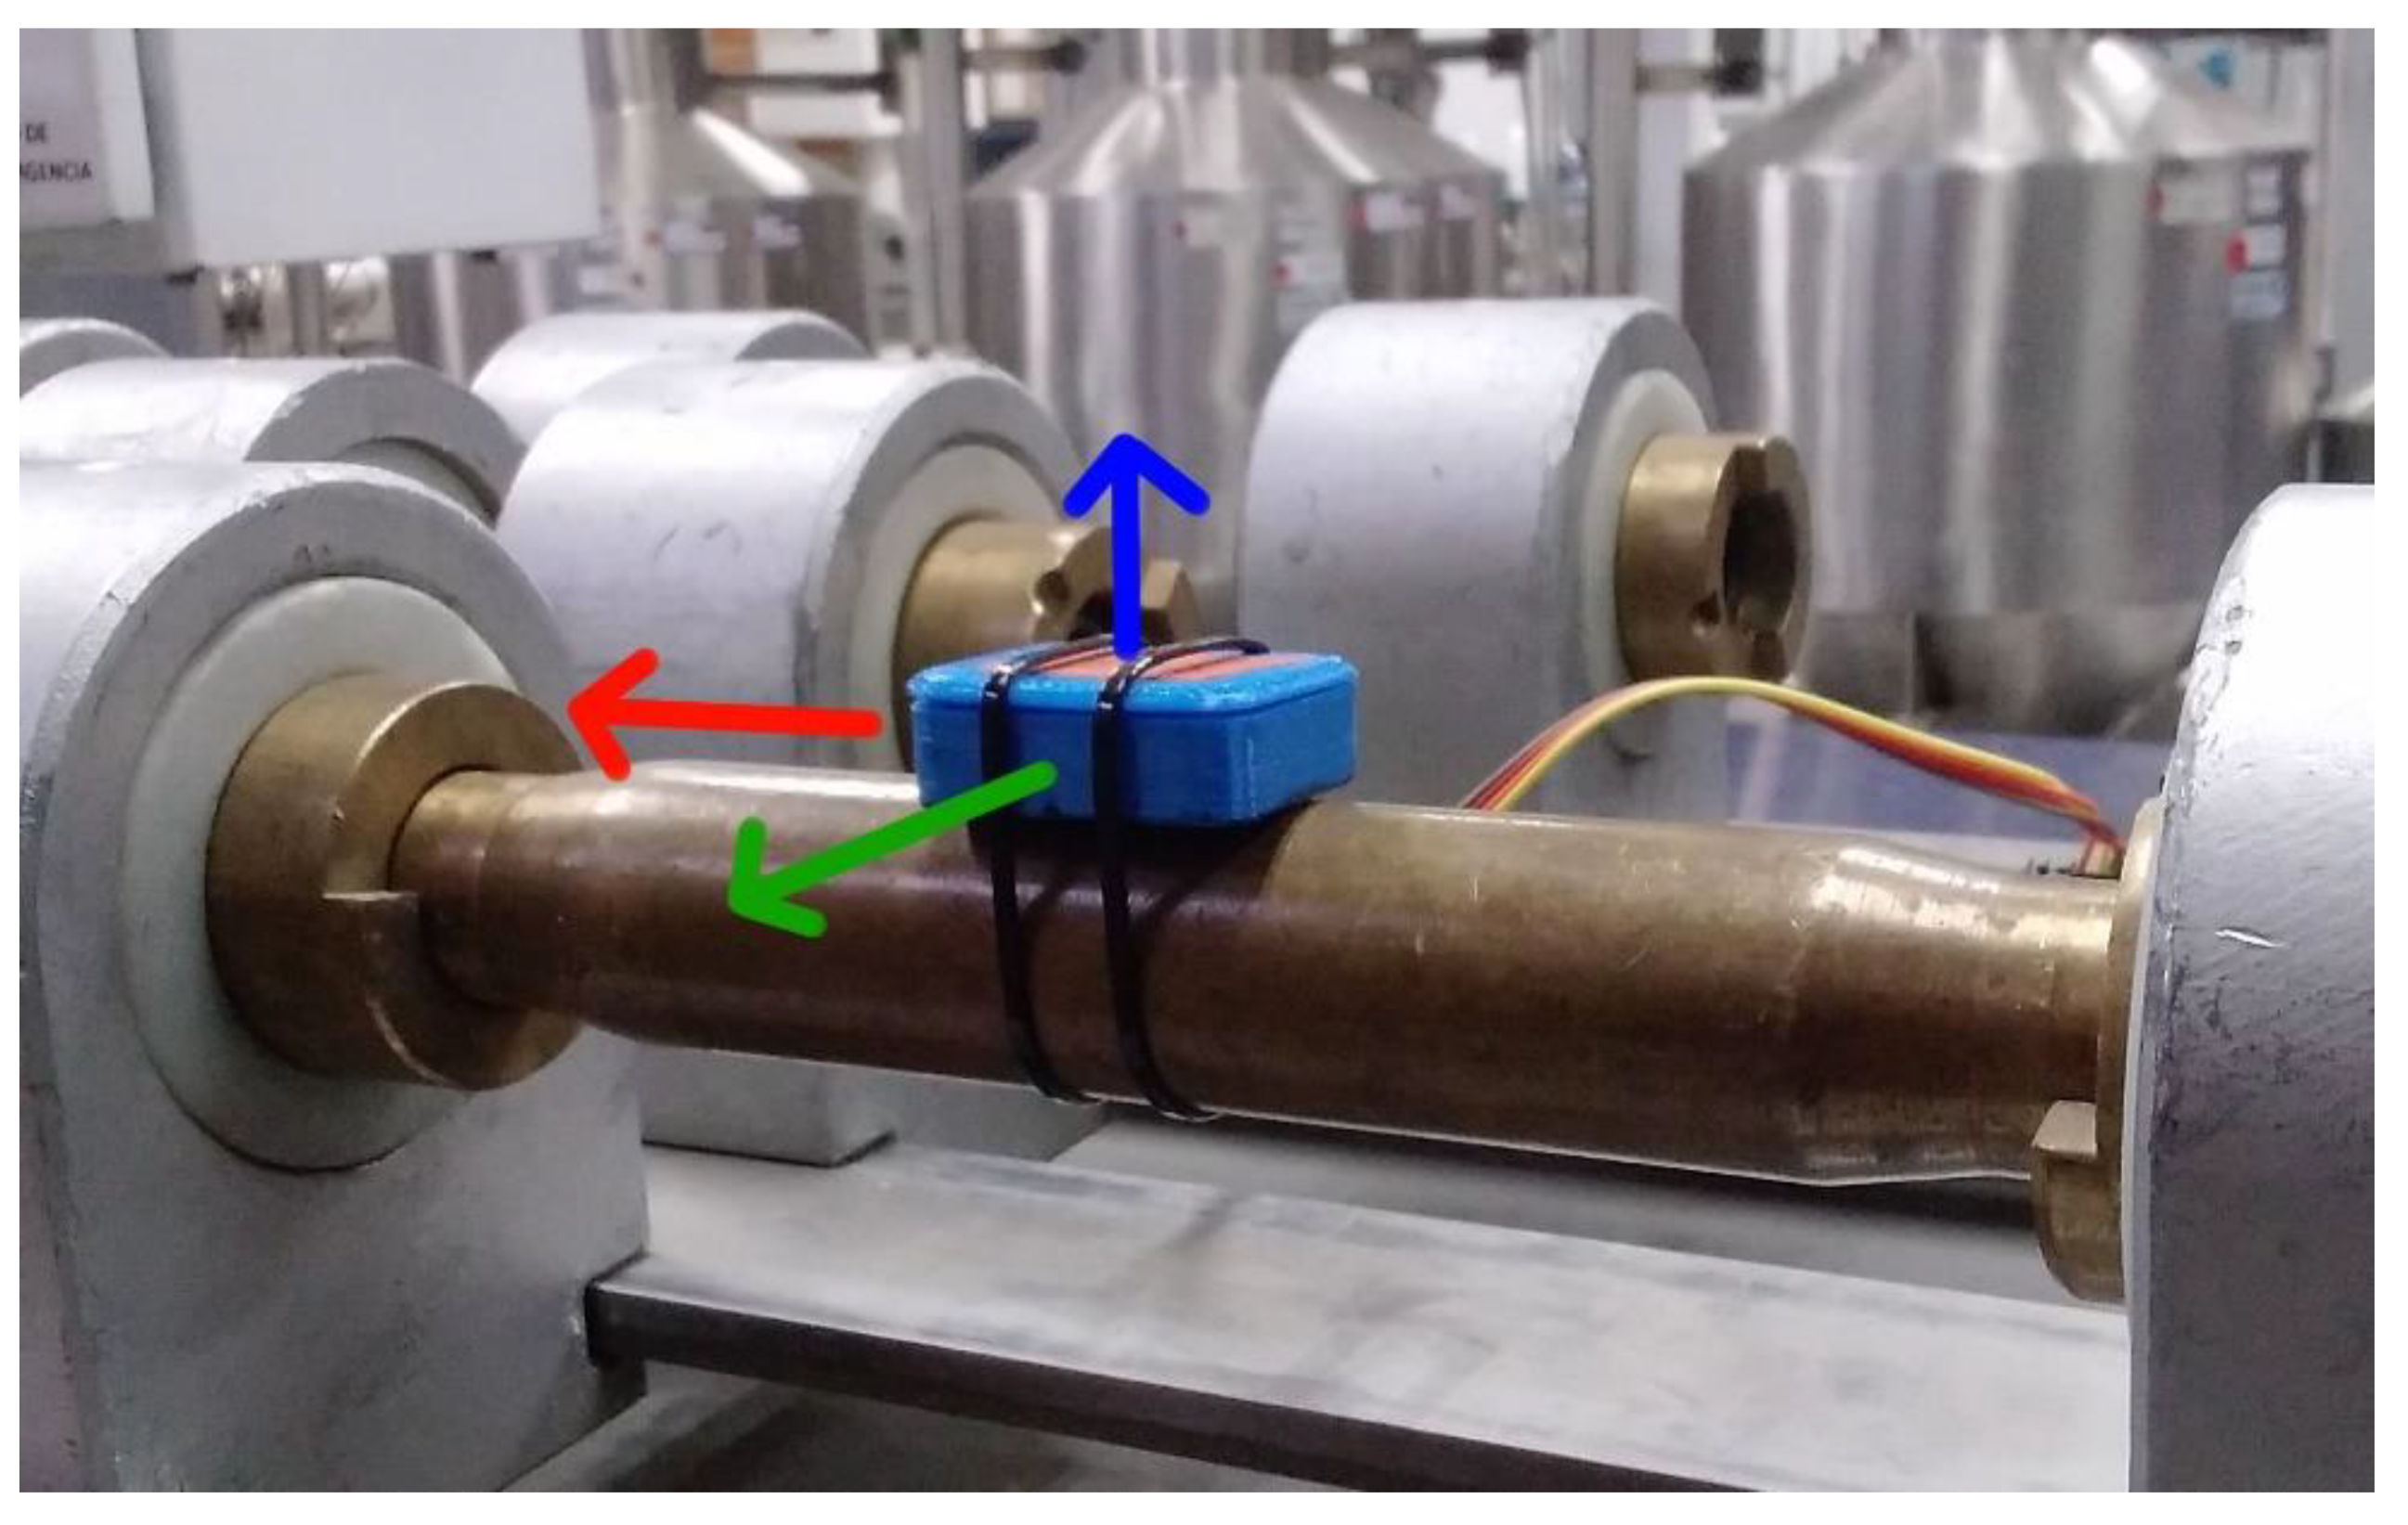
Figure 1 shows the directions of the accelerometer axis in relation to the pipe, where the x-axis (red) is longitudinal to the pipe and corresponds to the direction of the water flow, the y-axis (green) is transverse to the pipe and the z-axis (blue) is the vertical axis.
Figure 1.
Accelerometer axis: red indicates x-axis, green indicates y-axis and blue indicates z-axis.
The signals were acquired in two different test benches: the micro measurement bench, which can be used to measure flowrates from 5 L/h to 16,000 L/h; and the macro measurement bench, which allows measurement of flowrates between 90 L/h and 25,000 L/h. The flowrate values recorded in the micro measurement bench are reported in Table 1 and the flowrate values recorded in the macro measurement bench are reported in Table 2. Each table specifies the flowrate value, the number of repetitions, the duration of each repetition in seconds and the names of the files that contain the signals.
Table 1.
Flowrate values recorded at the micro measurement bench.
Table 2.
Flowrate values recorded at the macro measurement bench.
3. Methods
The data were obtained in the facilities of ACUATUBOS S.A.S. in Envigado, Antioquia-Colombia, a company that has a flowmeter calibration laboratory accredited by the National Accreditation Organism of Colombia (ONAC). Two different measurement benches were used, the micro measurement bench and the macro measurement bench, which are both designed to calibrate flowmeters and share a common pump system. The following subsections describe the pump system and the features of each bench.
3.1. Pump System
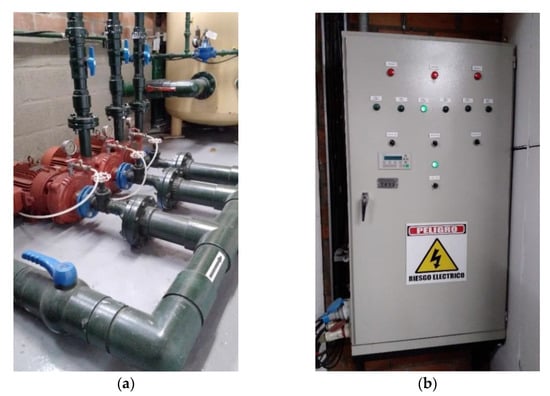
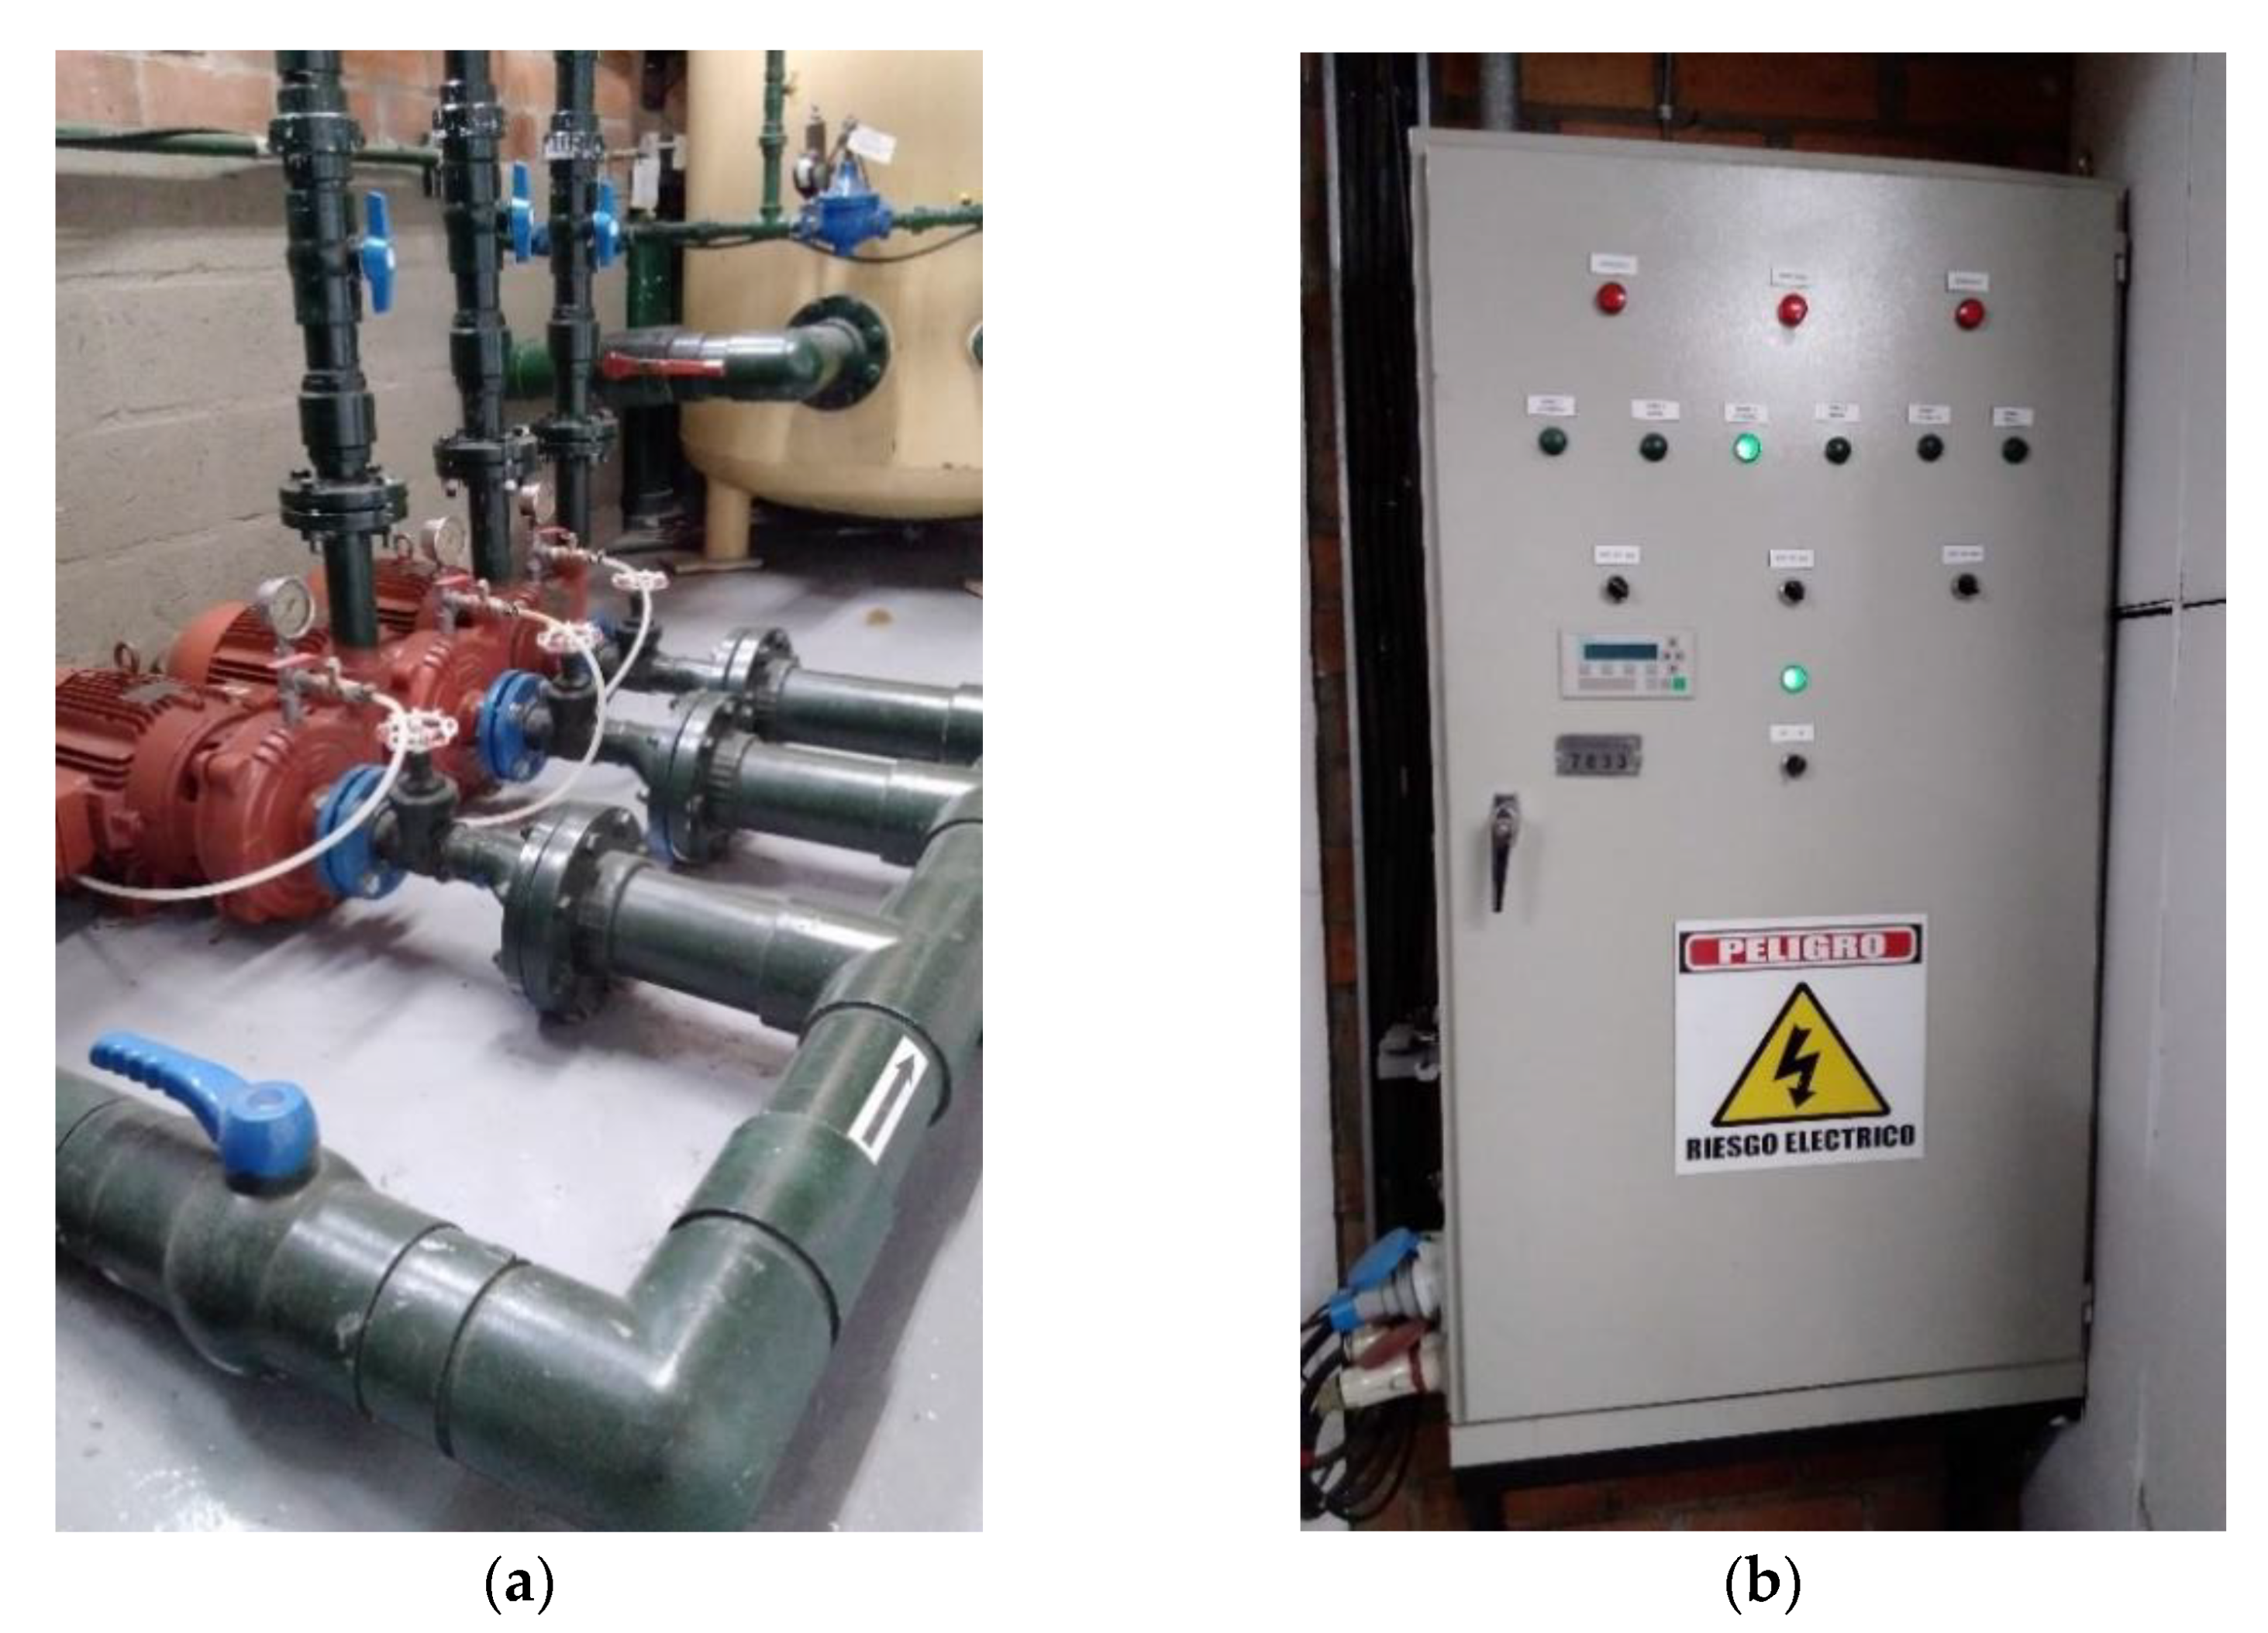
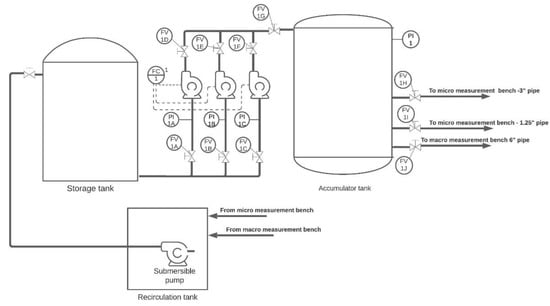
Both measurement benches share a common pump system, illustrated in Figure 2.
Figure 2.
Pump system: (a) Centrifugal pumps and accumulator tank; (b) Control panel.
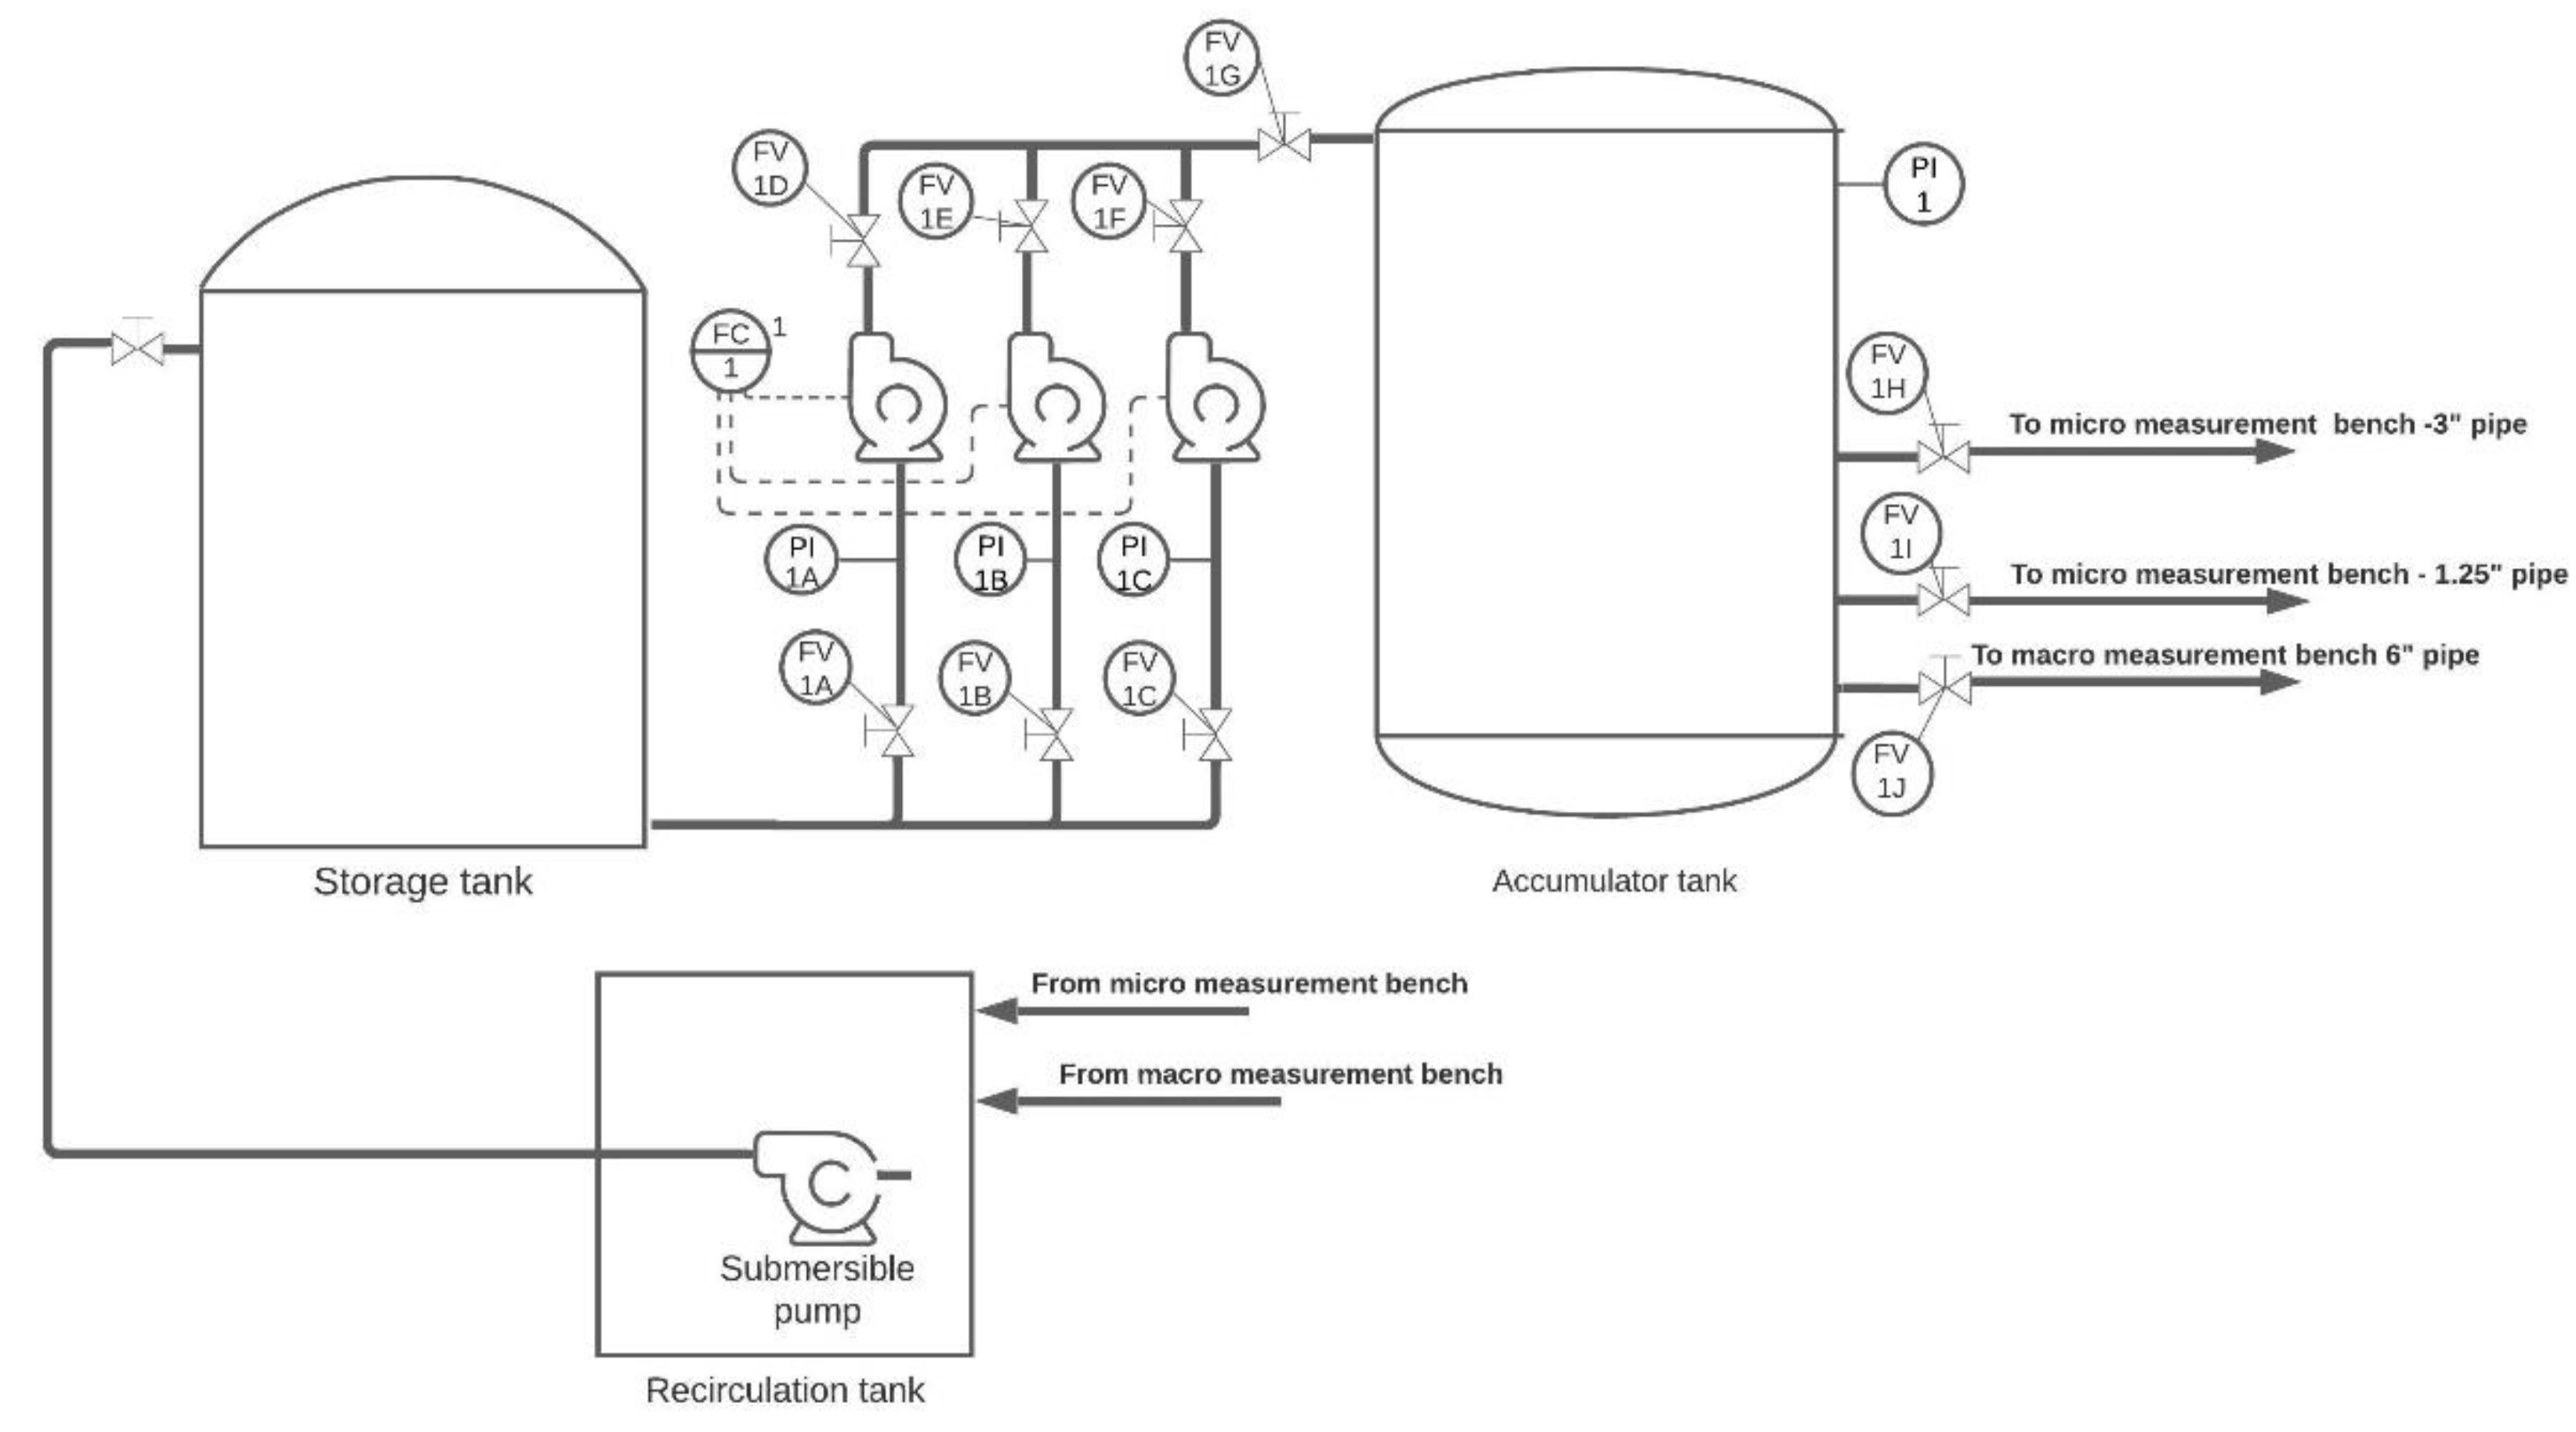
The pump system secures a constant pressure and comprises a storage tank, three 10HP centrifugal pumps connected in parallel and controlled with a speed drive, and an accumulator tank that maintains the water pressure at 90 psi. This tank has three outlets: one 6′′ pipe used to transport water to the macro measurement bench and two pipes for the micro measurement bench; one 1.25′′ pipe used to supply water in tests performed up to 700 L/h and one 3′′ pipe used in tests performed at higher flowrates. All the pipes of the pumping system are made of PVC. Figure 3 shows a diagram of the pumping system.
Figure 3.
Pump system diagram.
3.2. Micro Measurement Bench
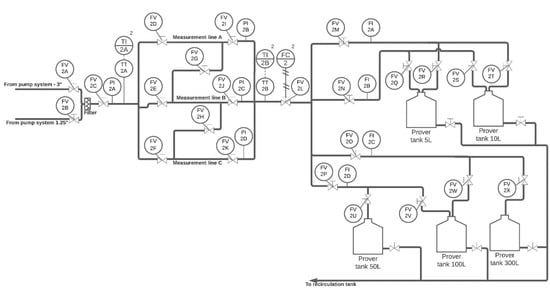
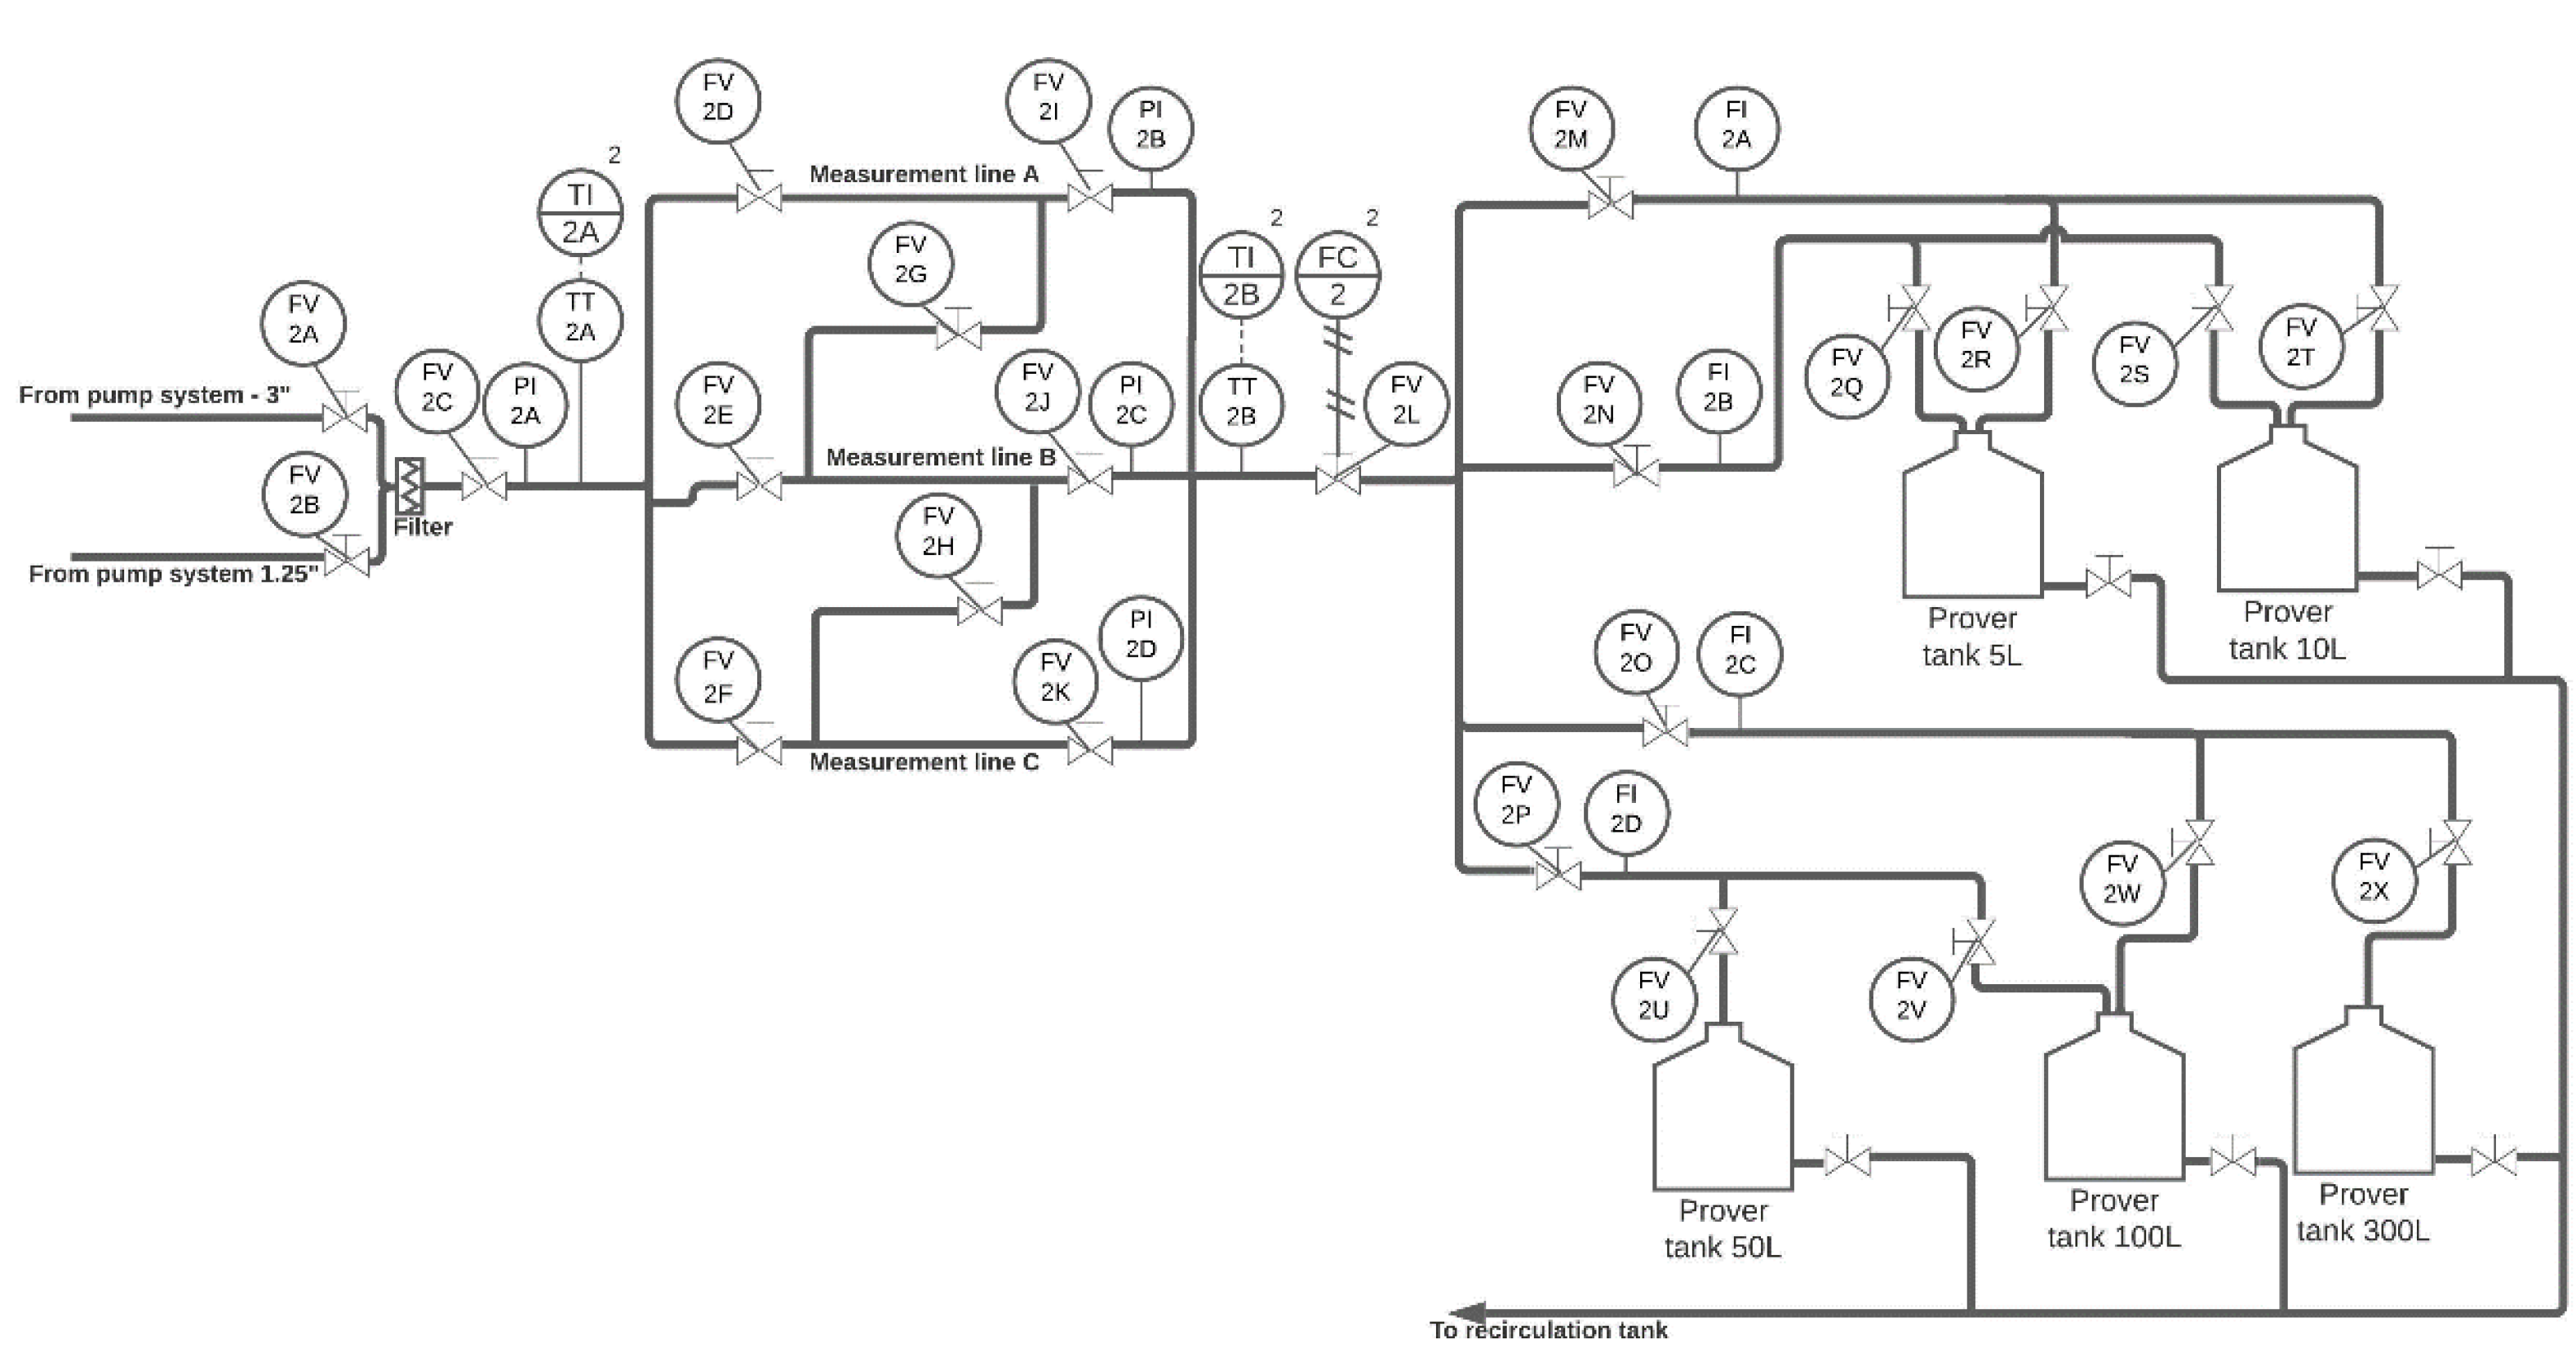
The micro measurement bench is designed to calibrate flowmeters and has the capacity for measuring flowrates from 5 L/h to 16,000 L/h. In the measurement bench, water is propelled by means of the pump system to circulate through a set of three pipe segments (measurement lines) where the flowmeters that need to be calibrated may be installed. Figure 4 shows a diagram of the micro measurement bench.
Figure 4.
Instrumentation diagram of the micro measurement bench.
The pipes in this bench are made of SAE 304 stainless steel, and between the pump system and the bench, there is a filter that prevents particles or sediment from entering the measurement lines. Each measurement line has 14 places where flowmeters can be installed for calibration. In Figure 4, valves FV 2D to FV 2K allow the configuration of the bench so that each measurement line can be used independently, or all the lines can be connected in a series to be used at the same time for a test.
Each measurement line has a pressure indicator that allows the verification of the pressure in the line during the test. In Figure 4, after the measurement lines, valve FV 2L is used to start the water flow from the control panel; likewise, valves FV 2M to FV 2P allow the user to determine the measurement instruments to be used in the test and are manually operated to determine the flowrate at which the test is going to be performed. Figure 4 shows the instruments available in the bench and Table 3 establishes their characteristics. This table also specifies the range of flowrates at which each specific instrument was used as a reference instrument to obtain the values described in Table 1.
Table 3.
Measurement instruments in the micro measurement bench.
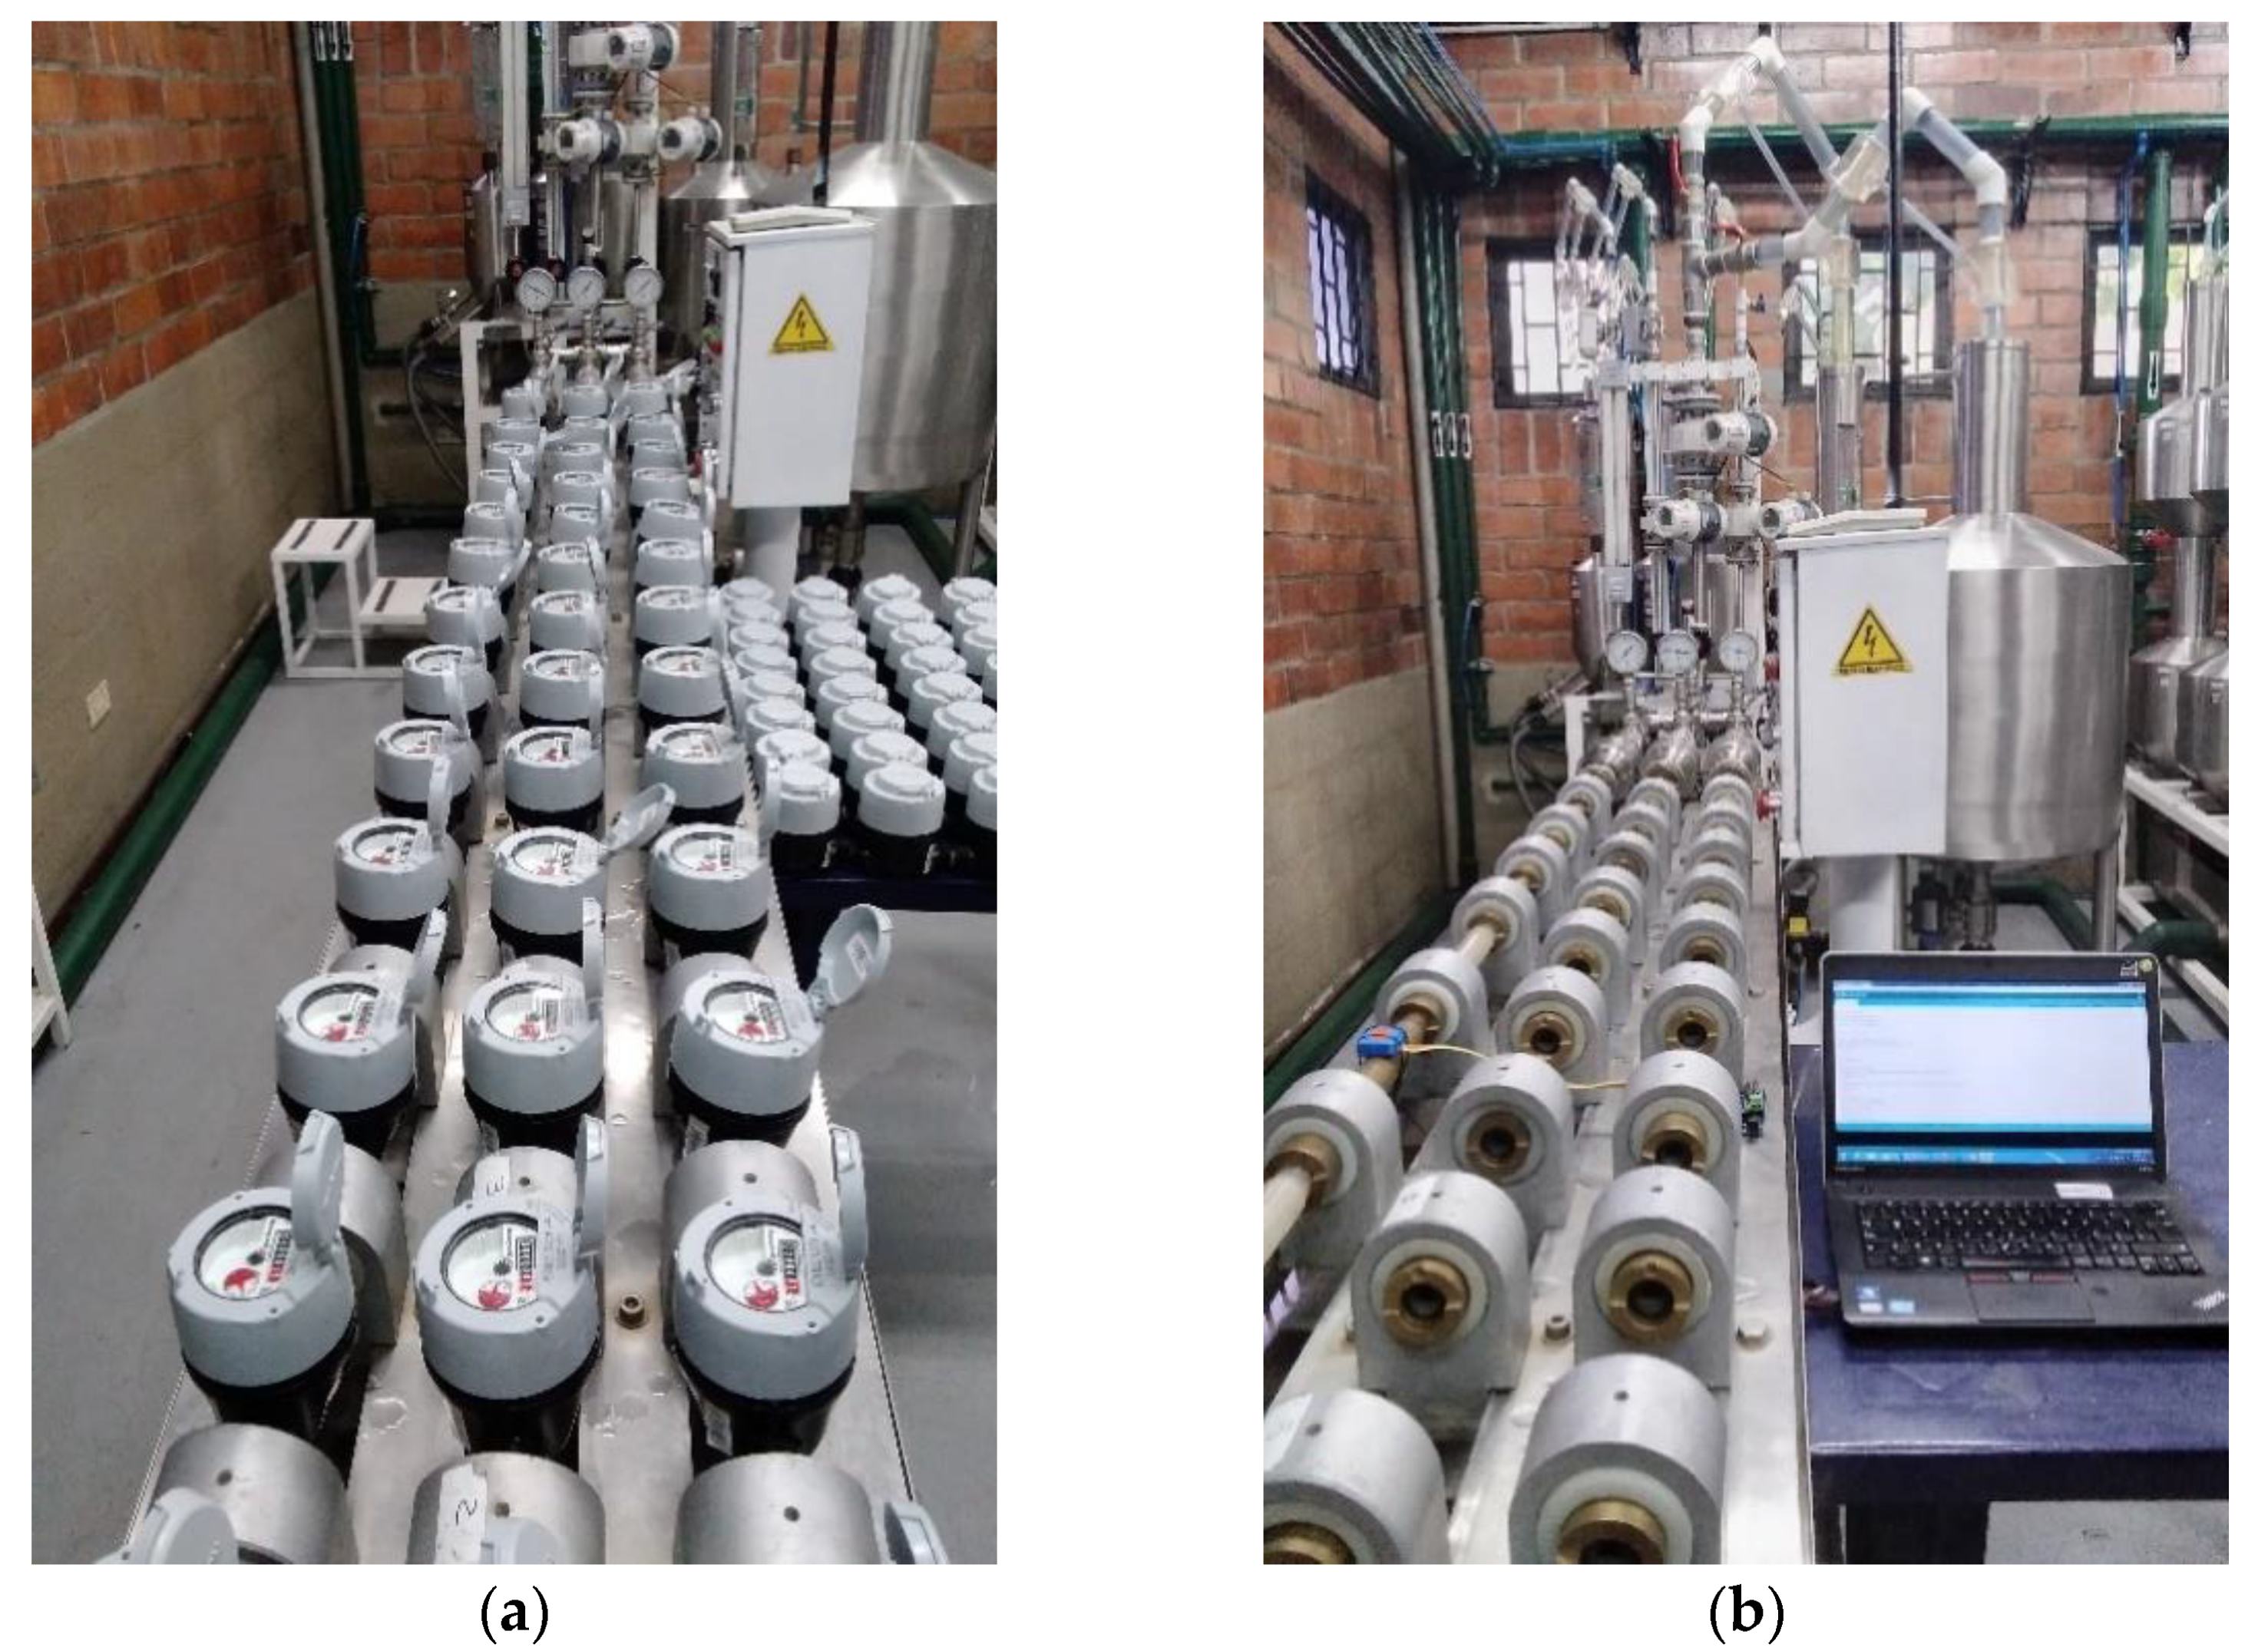
Figure 5a shows the measurement lines with flowmeters installed, and all the lines operating in series, as it is arranged in a typical calibration test. The places that are not used for flowmeters in a test are filled with union tubes that are manufactured in brass, a copper and zinc alloy, which is resistant to cavitation. Figure 5b shows the measurement lines with the configuration used to obtain the database described in this paper, using only one measurement line, where the flowmeters were replaced with union tubes and the accelerometer was installed in one of them.
Figure 5.
Micro measurement bench: (a) Measurement lines with flowmeters as configured in a calibration test; (b) Measurement lines as configured in the test performed for this dataset.
As shown in Figure 4, after the measurement lines, the water goes to the prover tanks. Valves FV 2Q to FV 2X are used to configure which prover tank is used in a specific test. From the prover tanks, the water goes to a recirculation tank from which the water can go back to the initial storage tank in the pump system, driven by an immersion pump.
The pipes in the measurement lines are 280 cm long and were calculated and designed to efficiently allow the passage of water, prevent cavitation, reverse flow and generation of water hammer. Also, the measurement lines are free of flow disturbances caused by elbows, T-branches, valves, pump vibrations or any factor that can generate incorrect measurements. The union tubes are calculated to have at least five diameters of distance between the gauges, thus preventing any distortion in the speed profile and the generation of swirls.
3.3. Macro Measurement Bench
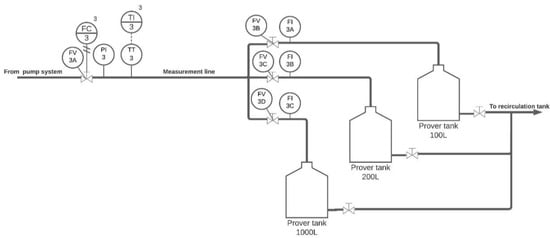
The macro measurement bench is designed to calibrate flowmeters and has the capacity to measure flowrates from 90 L/h to 25,000 L/h. In the macro measurement bench, water is propelled by a pump system that circulates water through one pipe segment (measurement line) that is 185 cm long and has two places where the flowmeters that need to be calibrated may be installed. Figure 6 shows a diagram of the micro measurement bench. The pipes in the measurement line are made of SAE 304 stainless steel and were designed to efficiently allow the passage of water, prevent cavitation, reverse flow and generation of water hammer. Also, the measurement line is free of flow disturbances caused by elbows, T-branches, valves or any factor that can generate incorrect measurements. The union tubes are made of carbon steel and are calculated to have at least five diameters of distance between the gauges, thus preventing any distortion in the velocity profile and generation of swirls.
Figure 6.
Instrumentation diagram of the macro measurement bench.
The measurement line has a pressure indicator that allows the verification of this variable during the test. In Figure 6, valve FV 3A is used to start the water flow from the control panel, and valves FV 3B to FV 3D allow the user to determine the measurement instrument to be used in the test and are manually operated to determine the flowrate at which the test is going to be performed. The instruments available in the bench are shown in Figure 6 and their characteristics are detailed in Table 4. This table also specifies the flowrate range at which each specific instrument was used as a reference instrument to obtain the values described in Table 2.
Table 4.
Measurement instruments in the macro measurement bench.
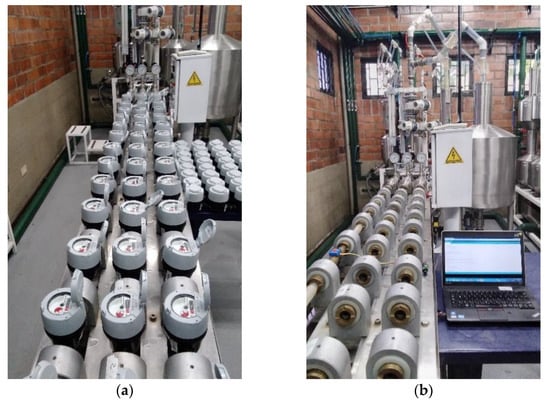
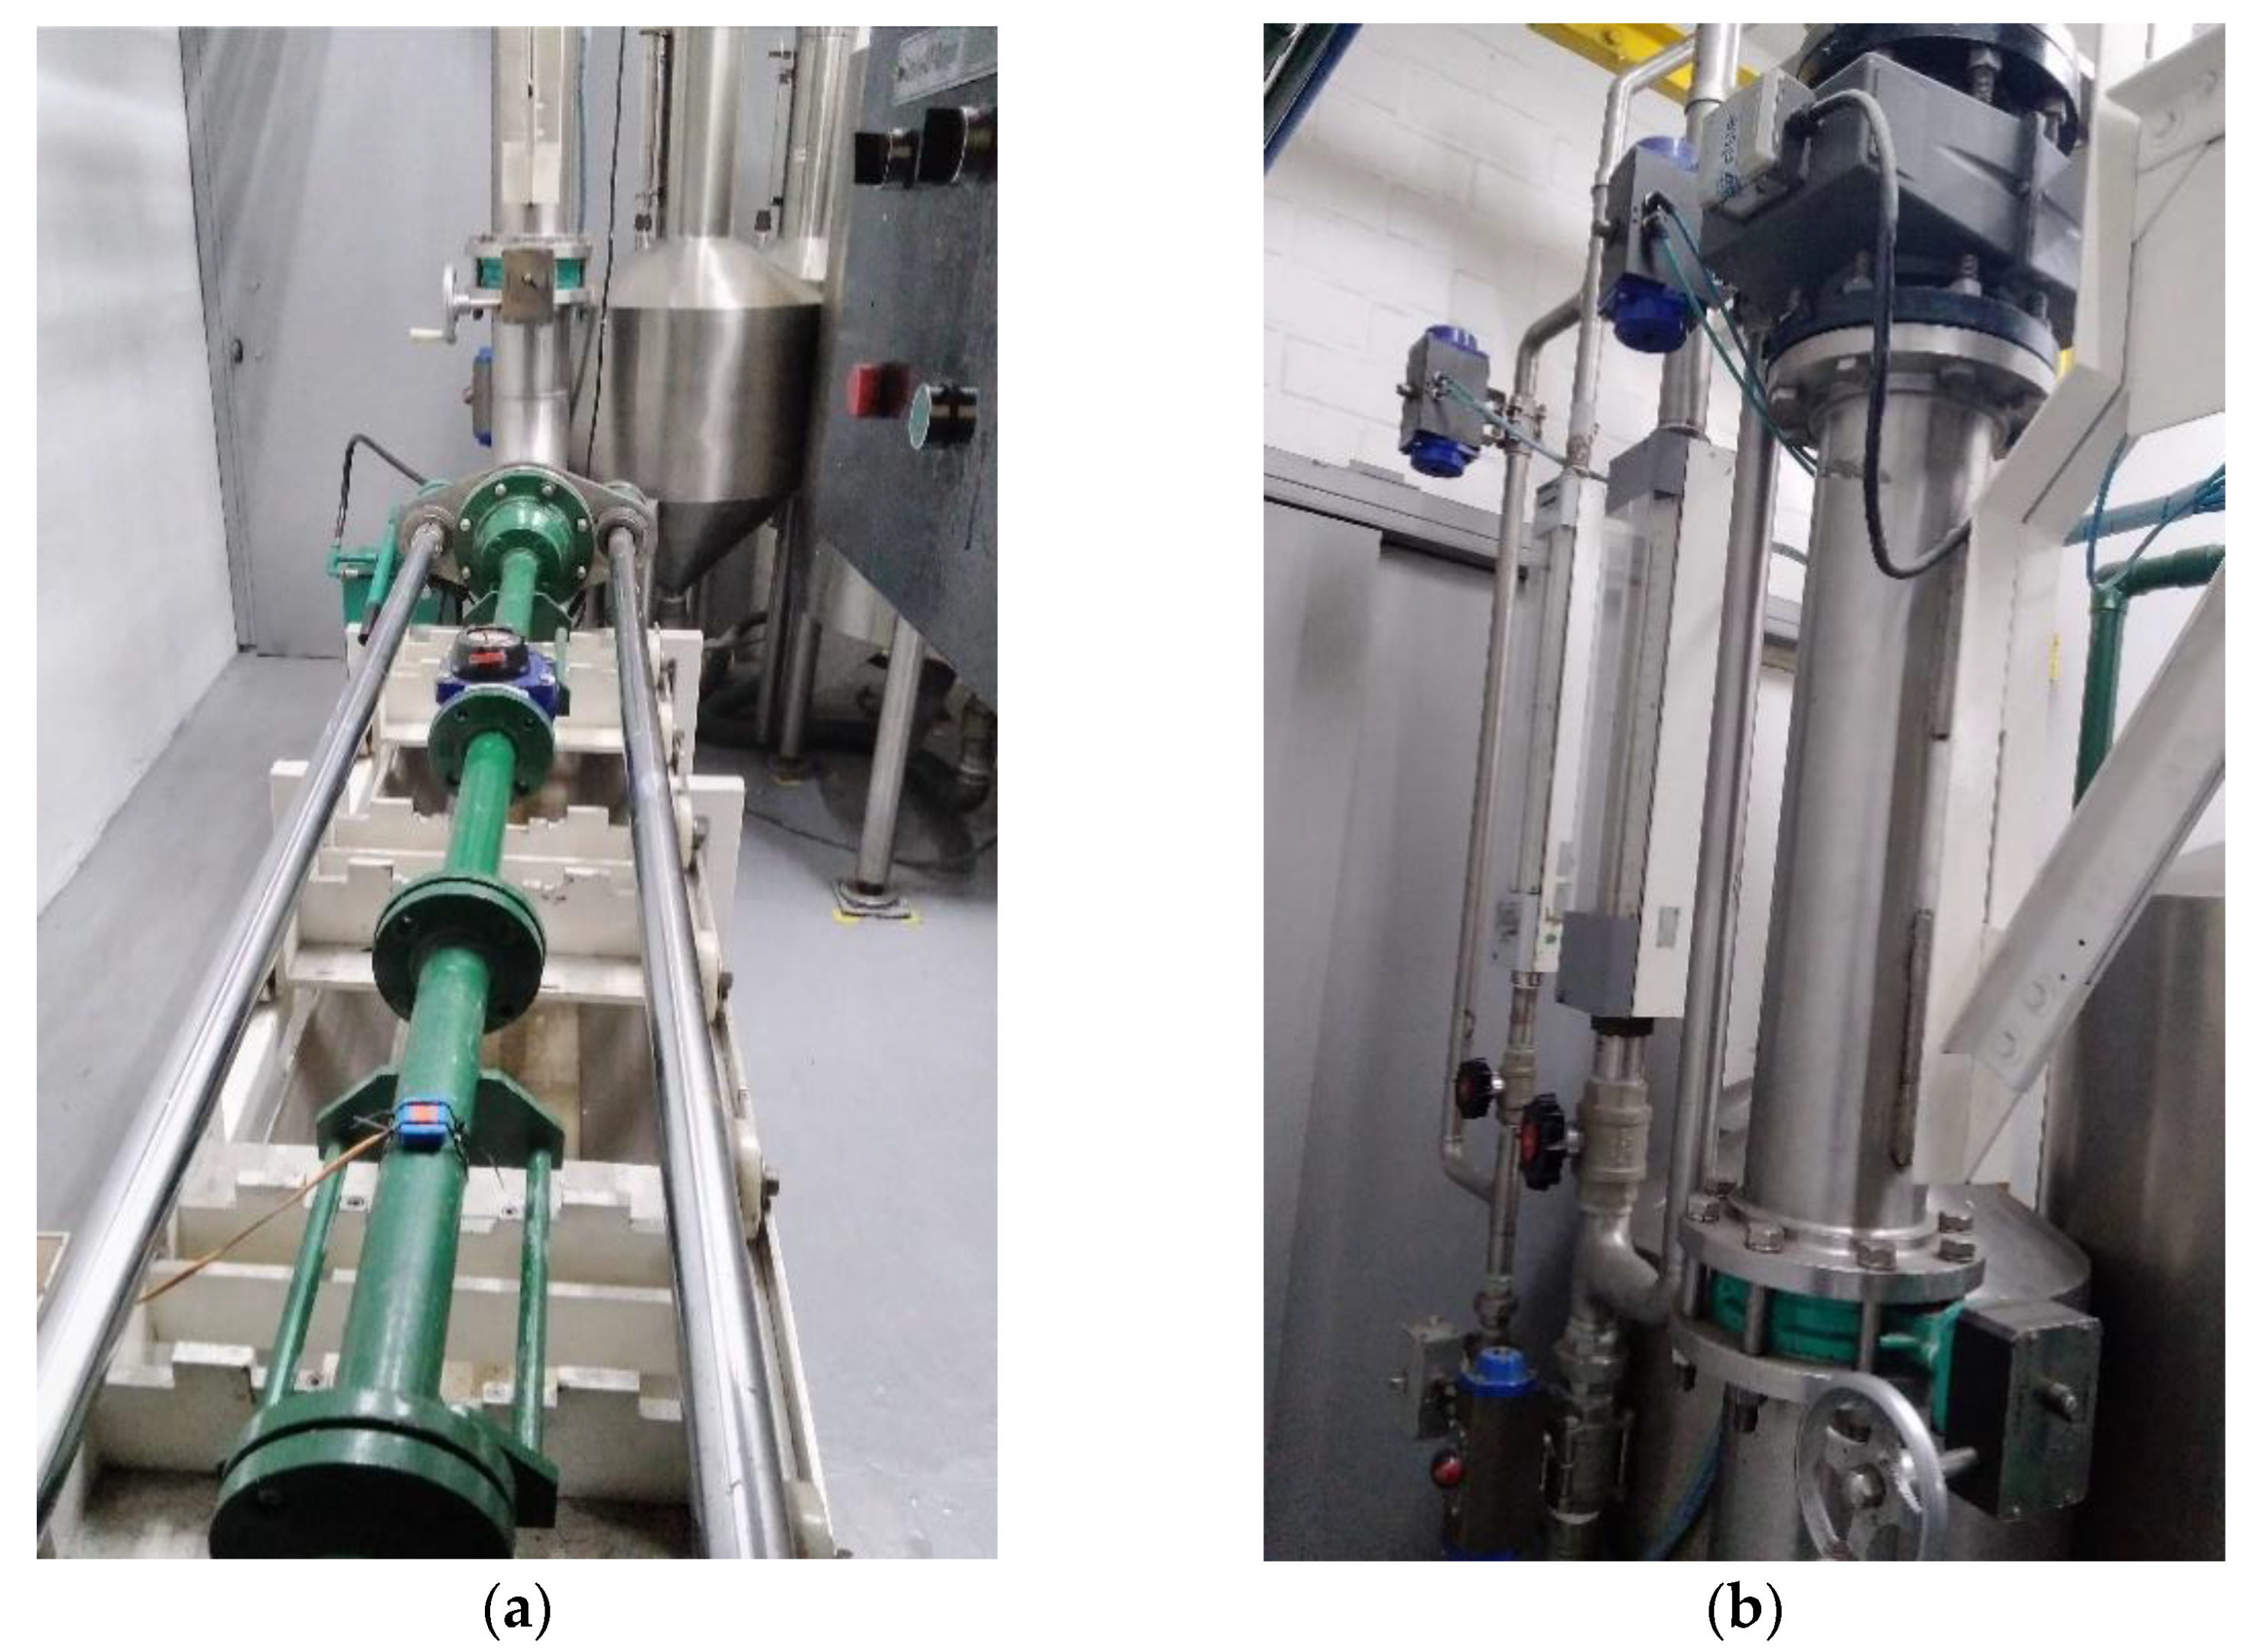
As shown in Figure 6, after the measurement line the water gets to the prover tanks, from which it may be directed to the recirculation tank depicted in Figure 3. Figure 7 shows the macro measurement bench.
Figure 7.
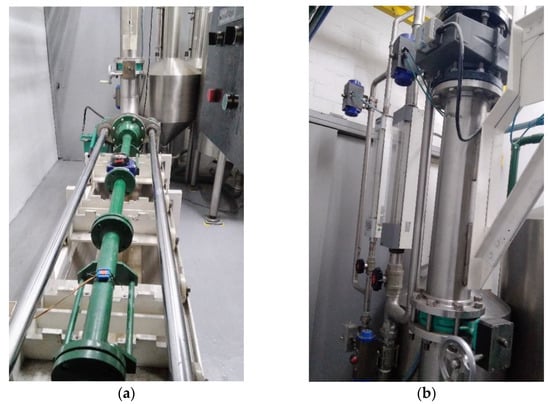
Macro measurement bench: (a) measurement line; (b) flowmeters.
3.4. Acceleration Measurement
The vibrational information was recorded using an Inertial Measurement Unit (IMU) reference BNO055, attached to the measurement line in accelerometer mode. This IMU includes a 32-bit cortex M0 + microcontroller running Bosch Sensortec sensor fusion software, which allows data to be configured and pre-processed internally. The IMU was configured to use an available fusion mode that separates two acceleration sources: the gravity force and the acceleration applied to the sensor due to movement (linear acceleration). The fusion algorithm provides two separate outputs for the gravity vector and the linear acceleration, and in this work, only linear acceleration was recorded. The measurements were acquired in the lower range of the accelerometer, that is, ±2g, the sensitivity tolerance typical is ±1% for this scale. Table 5 shows the characteristics of the linear acceleration data.
Table 5.
Linear acceleration data characteristics.
In this experiment, the triaxial accelerometer integrated into the IMU was used, which allows the evaluation of movement, discriminating between swing and transversal movement. The vibration can be evaluated with the vector sum or individually to know the direction relative to the installation. Accelerometers are susceptible to different types of error due to their MEMS (Micro Electro Mechanicals Systems) construction, however, many of these have been reduced with improvements in the manufacturing method and with internal sensory fusion algorithms. The BNO055 includes an internal temperature sensor, that has an operating range of −40 °C to 85 °C and a Temperature Coefficient of Sensitivity (TCS) of ±0.03%/K. Also, the accelerometer has a software-configurable low-pass filter to avoid higher frequencies that are not considered within the proposed experiment. Regarding noise, the noise density for the accelerometer as a function of the frequency for the ±2 g scale and at temperature ambient (25 °C) is typically 150 µg/Hz. Finally, the calibration procedure described by the manufacturer was carried out, which basically allows for adjusting the offset and verifying the alignment between the axes.
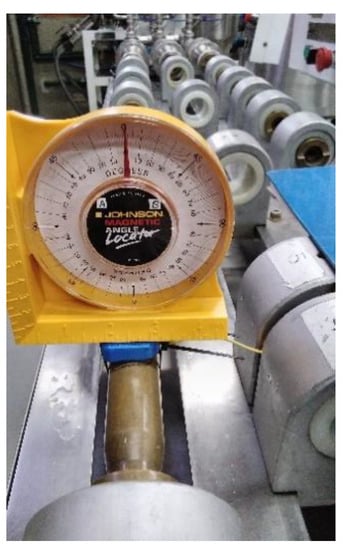
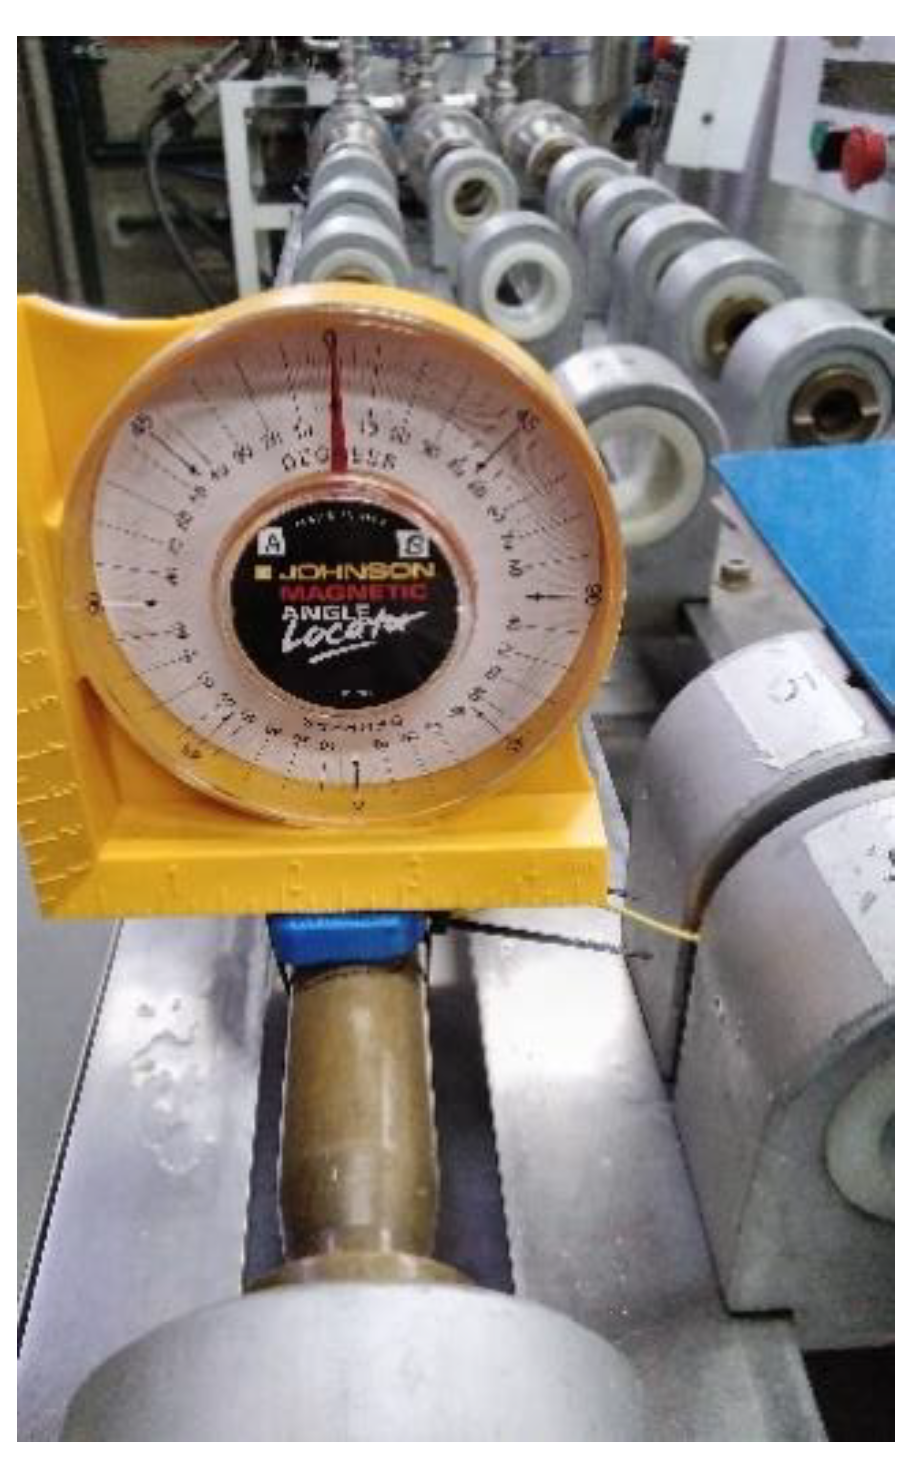
The IMU was attached to one of the test segments of the bench, as shown in Figure 1, and its correct position according to the axis was verified with an inclinometer, as shown in Figure 8, however, taking into account that gravity was isolated, the measure can always be observed as a relative measure independent of its location.
Figure 8.
Verification of the IMU positioning.
The acceleration readings from the IMU were acquired using an Arduino Leonardo at a sample rate of 100 Hz and were sent to a computer using serial communication to be recorded on .txt files.
3.5. Acquisition Protocol
The tests were carried out under the applicable numerals of the ISO 4064-1/2: 2016 standard. The flowmeters used to secure the flowrate value for each test and to label the dataset are described in Table 3 andTable 4. The flowrate values analyzed in each bench were selected according to the standard, considering minimum (Q1), transition (Q2) and nominal (Q3) flowrates. In order to carry out measurements in the entire measurement range, Q1, Q2 and Q3 were not selected using the same ratio but rather trying to fully take advantage of the measurement range available in the bench. Table 6 shows the possible values of Q1, Q2 and Q3 for the micro measurement bench according to the mentioned standard, highlighting the chosen values, while Table 7 shows the possible values of Q1, Q2 and Q3 for the macro measurement bench.
Table 6.
Q1, Q2 and Q3 values according to ISO 4064-1:2016 for the micro measurement bench.
Table 7.
Q1, Q2 and Q3 values according to ISO 4064-1:2016 for the macro measurement bench.
Each signal was recorded using the following procedure:
- The inclination of the accelerometer was revised.
- The bench was configured to the desired flowrate.
- Constant flowrate was verified before recording the signal.
4. User Notes
The approach used to measure the data in this work seeks to deliver a database that can be used in the development of low-cost flowrate soft sensors, allowing the users to develop their own computational routines. The approach has some inherent strengths and weaknesses, that should be considered by the users of the data, and are summarized in Table 8.
Table 8.
Strengths and weaknesses of the measurement approach.
Author Contributions
Conceptualization, F.V., C.S., M.V. and E.D.-T.; methodology, F.V., C.S., M.V., J.S.B.-V. and E.D.-T.; software, M.V. and J.S.B.-V.; validation, M.V. and E.D.-T.; formal analysis, M.V. and E.D.-T.; investigation, F.V., C.S., M.V. and E.D.-T.; resources, J.S.B.-V. and E.D.-T.; data curation, F.V., C.S., M.V. and E.D.-T.; writing—original draft preparation, M.V. and E.D.-T.; writing—review and editing, M.V., J.S.B.-V. and E.D.-T.; visualization, F.V., C.S., M.V. and E.D.-T.; supervision, M.V. and E.D.-T.; project administration, M.V. and E.D.-T.; funding acquisition, E.D.-T. All authors have read and agreed to the published version of the manuscript.
Funding
This research was funded by the Instituto Tecnológico Metropolitano ITM of Medellin-Colombia, grant number P21106.
Data Availability Statement
The data presented in this study are openly available in https://doi.org/10.17605/OSF.IO/4VKFW. Last accessed: 17 August 2021.
Acknowledgments
This vibration signal database was obtained within the framework of the final year engineering project “Indirect measurement method for estimating cold water flowrate through vibration analysis and artificial intelligence”, for a Quality Engineering degree from the Instituto Tecnologico Metropolitano ITM in Medellin, Colombia (for F.V. and C.S.). The authors would like to thank the Measurement Analysis and Decision Support Laboratory (AMYSOD Lab) and the Control and Robotics Laboratory of Parque i at Instituto Tecnológico Metropolitano ITM. Likewise, the authors acknowledge ACUATUBOS S.A.S., for the use of the facilities that led to the measurements presented in this dataset.
Conflicts of Interest
The authors declare no conflict of interest. The funders had no role in the design of the study; in the collection, analyses, or interpretation of data; in the writing of the manuscript, or in the decision to publish the results.
References
- Zhang, T.; Ouyang, H.; Zhao, C.; Ding, Y.J. Vibration analysis of a complex fluid-conveying piping system with general boundary conditions using the receptance method. Int. J. Press. Vessel. Pip. 2018, 166, 84–93. [Google Scholar] [CrossRef] [Scilit]
- Ismail, M.I.; Dziyauddin, R.A.; Salleh, N.A.; Muhammad-Sukki, F.; Bani, N.A.; Izhar, M.A.; Latiff, L.A. A Review of Vibration Detection Methods Using Accelerometer Sensors for Water Pipeline Leakage. IEEE Access 2019, 7, 51965–51981. [Google Scholar] [CrossRef] [Scilit]
- Vallejo, M.; Villa-Restrepo, F.; Sánchez-González, C.; Delgado-Trejos, E. Metrological Advantages of Applying Vibration Analysis to Pipelines: A Review. Sci. Tech. 2021, 26, 28–35. [Google Scholar] [CrossRef] [Scilit]
- Evans, R.P.; Blotter, J.D.; Stephens, A.G. Flow Rate Measurements Using Flow-Induced Pipe Vibration. J. Fluids Eng. 2004, 126, 280–285. [Google Scholar] [CrossRef] [Scilit]
- Venkata, S.K.; Navada, B.R. Estimation of Flow Rate Through Analysis of Pipe Vibration. Acta Mech. Autom. 2019, 12, 294–300. [Google Scholar] [CrossRef] [Scilit]
- Pirow, N.O.; Louw, T.M.; Booysen, M.J. Non-invasive estimation of domestic hot water usage with temperature and vibration sensors. Flow Meas. Instrum. 2018, 63, 1–7. [Google Scholar] [CrossRef] [Scilit]
- Dinardo, G.; Fabbiano, L.; Vacca, G.; Lay-Ekuakille, A. Vibrational signal processing for characterization of fluid flows in pipes. Measurement 2018, 113, 196–204. [Google Scholar] [CrossRef] [Scilit]
- Göksu, H. Flow Measurement by Wavelet Packet Analysis of Sound Emissions. Meas. Control 2018, 51, 104–112. [Google Scholar] [CrossRef] [Scilit]
- Jacobs, H.; Skibbe, Y.; Booysen, M.; Makwiza, C. Correlating Sound and Flow Rate at a Tap. Procedia Eng. 2015, 119, 864–873. [Google Scholar] [CrossRef] [Scilit]

Publisher’s Note: MDPI stays neutral with regard to jurisdictional claims in published maps and institutional affiliations. |
© 2021 by the authors. Licensee MDPI, Basel, Switzerland. This article is an open access article distributed under the terms and conditions of the Creative Commons Attribution (CC BY) license (https://creativecommons.org/licenses/by/4.0/).