


Abstract
Administrative disaster data may be technically usable even when available fields do not support every substantive interpretation associated with a workflow. We present an evidence-aware software–data compatibility framework using an archived OpenFEMA Disaster Declarations Summaries snapshot and the R package DisasterAlert 1.0.0. The archive comprises 5074 declaration-area records, 356 FEMA declaration numbers, and 54 observed jurisdictions. Analytical-unit choice changes geographic summaries: declaration-area rankings have only moderate agreement with declaration-number counts (Spearman ), and Gini concentration falls from 0.653 to 0.432. Declaration-type stratification explains this pooled result: rank agreement is 0.751 for major-disaster, 0.962 for emergency, and 0.989 for fire-management declarations; median rows per declaration number are 8, 47, and 1, respectively. Complete-month and 2024–2025 calendar checks show that the principal rankings are not boundary-month artifacts. Nine exported functions are mapped to documented input and evidence requirements through an audit of argument compatibility, source-field availability, upstream prerequisites, and construct support. Spatial outputs are restricted to jurisdiction-level administrative summaries, with clustered-bootstrap uncertainty reported for compositional entropy. This single, developer-affiliated data–software demonstration does not externally validate general applicability; independent evaluation across other packages and datasets is required.
1. Introduction
Disaster analytics increasingly combines administrative records, geospatial information, social-media streams, remotely sensed observations, volunteered geographic information, and multimodal or AI-assisted systems. Recent disaster-informatics research has expanded from social-media collection and crisis classification to multimodal recognition, geovisualization, knowledge-graph infrastructures, and automated situational reporting [1,2,3,4,5,6,7,8]. These richer systems can provide information that administrative records do not contain, but their analytical value depends on provenance, collection rules, geographic resolution, annotation, and validation [9,10,11,12,13]. Reproducibility therefore requires more than executable code: the analytical unit, source fields, transformations, software behavior, and scope of interpretation must also be explicit [14,15,16,17].
FEMA Disaster Declarations Summaries provide a useful case for examining these requirements. The source is institutionally curated and records declaration dates, states or territories, designated areas, incident classifications, program indicators, and administrative identifiers. A declaration-summary row, however, is not automatically a distinct physical disaster event. Multiple designated areas can share the same disasterNumber; administrative titles are not public comments; state identifiers are not event coordinates; and record counts are not direct measures of loss, severity, exposure, or response quality. These distinctions are particularly important when general-purpose analytical software can technically accept a field whose substantive meaning differs from the construct implied by the software workflow.
The R package DisasterAlert 1.0.0 provides a modular set of nine exported functions for disaster-related text preparation, sentiment-oriented analysis and summaries, synthetic text generation, interactive visualization, and sentiment mapping [18]. The package is designed to operate on user-supplied data whose fields match the intended workflow. For example, its documented sentiment function accepts a user-selected text column, with User_Comment as the default, while mapping workflows additionally use sentiment outputs and record-level coordinates. FEMA declaration summaries offer administrative title text but do not contain a public-comment corpus or package-ready record-level latitude and longitude. The OpenFEMA case therefore provides a useful alignment test: it shows how a flexible analytical package can expose different capabilities depending on the evidential content of the supplied dataset. A workflow that is not activated by this particular schema should not be interpreted as a defect or performance limitation of the package.
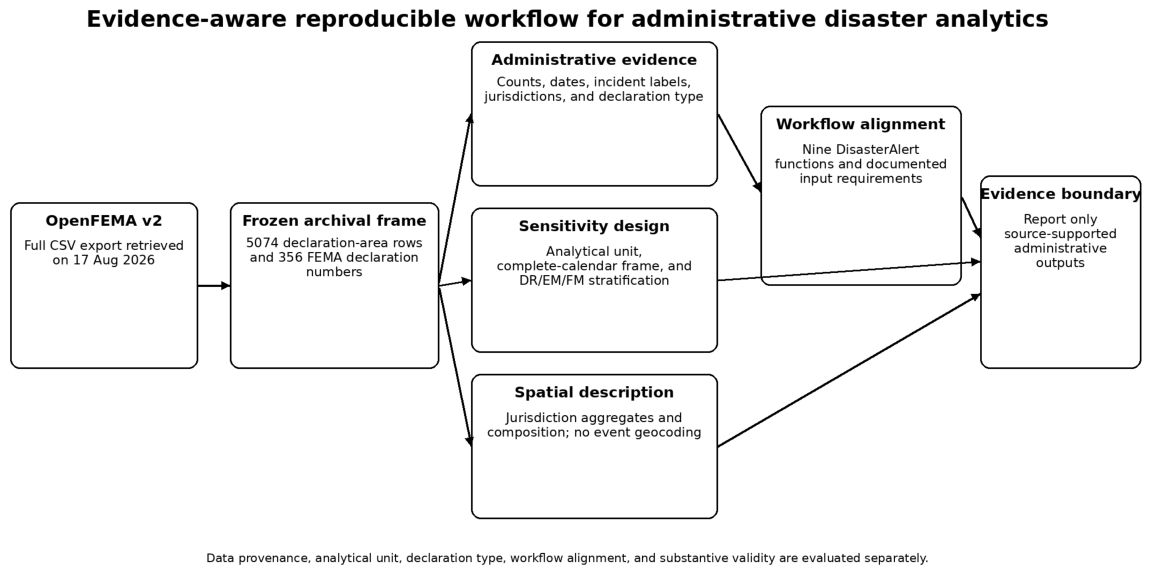
The central research question is therefore: How can administrative disaster records and analytical software be evaluated jointly so that reproducible execution is separated from substantive validity? The study addresses this question through an integrated design. First, it preserves a fixed row-level OpenFEMA object with retrieval metadata and a cryptographic checksum. Second, it distinguishes declaration-area rows from FEMA declaration numbers and quantifies the consequences of that analytical choice. Third, it decomposes the unit-of-analysis contrast by FEMA declarationType, preventing pooled jurisdiction rankings from being interpreted without regard to the very different administrative multiplicities of major-disaster (DR), emergency (EM), and fire-management (FM) declarations. Fourth, it evaluates the archival results against complete-month and complete-calendar frames. Fifth, it proposes a four-dimension software–data alignment audit that separates formal argument compatibility, source-field availability, upstream prerequisites, and substantive construct support; whether a function is used in the case study is recorded separately as an application decision. Spatial analysis is restricted to jurisdiction-level administrative aggregates and explicitly quantifies finite-sample uncertainty in compositional diversity. The framework is demonstrated on one data–software pair and is not presented as externally validated across other packages or datasets. The integrated study design is summarized in Figure 1. This design follows broader calls for quality-aware use of administrative data and transparent scientific software [19,20,21].
Figure 1.
Study design. The archived OpenFEMA object is evaluated at declaration-area and FEMA-declaration-number levels, with complete-calendar and declaration-type sensitivity analyses. The workflow-alignment component maps the documented input requirements of DisasterAlert functions to the evidence supplied by OpenFEMA. The final evidence boundary permits only outputs that are supported by the documented administrative source.
2. Research Scope and Analytical Positioning
2.1. Operational Questions
The analysis addresses four operational questions:
- Administrative description: What temporal, categorical, and jurisdiction-level patterns can be reconstructed from the frozen OpenFEMA object?
- Analytical-unit and declaration-type sensitivity: How do conclusions change when declaration-area rows are replaced by FEMA declaration-number counts, and how much of that contrast is associated with DR, EM, and FM declaration composition?
- Window and spatial robustness: Are the principal rankings stable in complete-month and complete-calendar frames, and which spatial summaries remain defensible without event coordinates?
- Software–data alignment: Which documented DisasterAlert workflows are directly supported by the OpenFEMA schema, and which require additional user-supplied evidence, derived outputs, or record-level spatial fields?
2.2. Positioning in Recent Disaster-Informatics Research
Recent crisis-informatics systems use data streams whose semantics differ substantially from administrative declarations. Social-media analyses can capture eyewitness reports, needs, emotions, and location cues, but are sensitive to collection filters, representativeness, privacy, and geolocation availability [2,9,10,11]. Multimodal systems combine text and images and increasingly address open-world or distribution-shift settings [3,7,8]. Geospatial systems integrate volunteered geographic information, satellite imagery, knowledge graphs, or other spatial sources [4,5,22]. Explainable-AI and OSINT-oriented work further emphasizes transparent decision support and modular provenance [6,12,13].
The present study does not attempt to reproduce those richer data streams. Instead, it treats the mismatch between an administrative source and a software package as a methodological object in its own right. This is useful because transparent source code does not guarantee that an available field measures the construct implied by a function name or downstream interpretation. The approach therefore complements, rather than replaces, crisis-monitoring and multimodal systems.
2.3. Package Version and Developer Relationship
The software object examined is DisasterAlert version 1.0.0, published on CRAN in 2025 [18]. All three manuscript authors are also authors/developers of the package. This relationship is disclosed because the package interfaces are themselves an object of analysis. The study does not claim comparative superiority, predictive performance, operational effectiveness, or independently validated substantive accuracy for the package. The package description and function names are treated as documentation of intended functionality, not as evidence that any underlying construct has been externally validated.
A central example is analyze_disaster_sentiment(). The function accepts a user-selected text column and uses User_Comment as its documented default. Therefore, the absence of a literal User_Comment column is not a computational prohibition: declarationTitle can satisfy the formal text argument. The evidential problem is different. A FEMA declaration title is an administrative label, not a documented corpus of affected-community comments. Passing it to a sentiment routine could demonstrate executability but would not establish public sentiment, urgency, impact, severity, or burden without independent construct validation. This distinction is consistent with trustworthy-AI and humanitarian-AI principles [12,13,15,23].
3. Data, Reproducibility, and Compatibility Audit
3.1. Authoritative Source and Archival Window
The authoritative source is FEMA’s OpenFEMA Disaster Declarations Summaries version-2 dataset [24,25]. The official full CSV export was retrieved on 17 August 2026 and contained 70,243 rows at retrieval. The fixed analytical archive was created by applying the inclusive declaration-date bounds
2023-08-31T00:00:00.000Z ≤ declarationDate ≤ 2026-03-22T23:59:59.999Z
- and sorting by declarationDate and id. No hazard keyword, free-text term, state filter, or incident-type filter was used. The resulting snapshot contains 5074 rows and all 28 fields present in the full export. Its SHA-256 fingerprint is
cff1a97026b67e6cf0da377144c468933ab3e1c06b246fbc25bd002dec219ebb.
The date-bounded object is used as an archival provenance frame rather than as a natural hazard season, probability sample, or calendar-year census. No causal or population-sampling meaning is attached to the exact start and end dates. To prevent the archival bounds from determining the substantive interpretation, two independent analysis frames are evaluated: complete months from 1 September 2023 through 28 February 2026 and the two complete calendar years 2024–2025. The first isolates boundary-month effects and the second provides a natural calendar-frame check. Findings emphasized in the text are required to remain qualitatively stable across these frames.
3.2. Two Analytical Units
The primary administrative unit is one declaration-summary row, typically corresponding to a designated administrative area under a declaration. Multiple rows can share a disasterNumber when multiple areas are designated. The snapshot contains 5074 declaration-area records but only 356 unique FEMA declaration numbers. Within this snapshot, each disasterNumber is internally consistent for state, declaration date, incident type, declaration type, and declaration title. A second deterministic dataset is therefore constructed by retaining one row per unique disasterNumber. This provides a direct sensitivity analysis for designated-area multiplicity rather than treating the 5074 rows as 5074 independent physical events.
3.3. Why the Archived Snapshot Is Necessary
OpenFEMA is a maintained administrative source. In the archived window, 3413 of 5074 rows (67.26%) have a lastRefresh timestamp after 22 March 2026, and the latest lastRefresh is 14 August 2026. This does not prove that every substantive field in those rows changed; it demonstrates that the records continued to be maintained after the study cutoff. Exact reproduction therefore requires the concrete input object, not only a query against the live endpoint. Archiving the data, environment, and executable reconstruction path follows recommendations for computational reproducibility [14,16,17,19].
3.4. Evidence-Aware Workflow Alignment Audit
Workflow alignment is recorded across four separable dimensions rather than compressed into a single package-level judgment. For each exported function we record: (i) whether the formal argument type can be satisfied; (ii) whether a source field suitable for the documented interface is available; (iii) whether required upstream outputs are available; and (iv) whether the supplied source supports the substantive construct normally attached to the workflow. These dimensions characterize the relation between the OpenFEMA schema and a documented DisasterAlert workflow; they are not measures of software quality, predictive performance, or implementation correctness. A separate study application status records whether the function is needed in the present FEMA analysis. Functions requiring public-comment text, derived sentiment outputs, or record-level coordinates remain available for datasets that provide those inputs, even when those workflows are outside the evidential scope of OpenFEMA declaration summaries.
The audit is based on the archived FEMA schema and the documented CRAN interfaces of DisasterAlert 1.0.0. An executable R script is included in the replication bundle for independent checking of package version, namespace exports, formal arguments, and selected smoke tests. Runtime success is neither required for the reported FEMA numerical results nor interpreted as evidence of construct validity. The audit framework is proposed as a reusable reporting protocol, but empirical transportability beyond this data–software pair remains to be established independently.
3.5. Computational Environment and Generative-AI Assistance
All reported numerical reconstructions and static figures were generated from the archived CSV with Python 3.13.5; the frozen package list, minimal environment specification, deterministic analysis scripts, derived tables, and checksums are included in the replication bundle distributed with the source package. ChatGPT version GPT-5.6 (web version) (OpenAI; https://chatgpt.com/; accessed on 17 August 2026) was used only for language editing and improvements to grammar, clarity, and presentation. It was not used to write analytical code, conduct analyses, produce numerical results or figures, or formulate scientific interpretations or conclusions. The authors reviewed and verified the complete manuscript and take responsibility for its content.
4. Measures and Spatial Representation
Let the archived row-level dataset be
where is declaration date, jurisdiction, incident classification, disaster number, and the unique FEMA row identifier.
For jurisdiction s, the declaration-area count is
and the number of distinct FEMA declaration numbers is
The snapshot share is . Incident-type richness is
Because richness tends to increase with opportunity for observation, composition is additionally summarized using normalized Shannon entropy. If is the proportion of jurisdiction s records in incident category k and is the number of incident classifications in the snapshot, then
with zero-contribution terms omitted when . This measure reflects evenness and categorical breadth jointly; it remains descriptive and is not a hazard-diversity estimator for the physical environment. Because multiple declaration-area rows can share one FEMA disasterNumber, uncertainty is assessed with a declaration-number-clustered bootstrap rather than by resampling rows independently. Within each jurisdiction, complete disasterNumber clusters are sampled with replacement and all rows belonging to each selected cluster are carried into the replicate. We use 2000 resamples with fixed seed 20260817 and report 95% percentile uncertainty intervals as descriptive resampling diagnostics, not population-sampling confidence intervals. The main entropy map applies a pragmatic dual display screen of at least 20 archived rows and at least five FEMA declaration numbers. Row-count threshold sensitivity is reported at , , and while retaining the five-declaration minimum; these screens affect visual eligibility, not the entropy point estimates themselves. The complete clustered-bootstrap and threshold outputs are included in the replication bundle.
For a nonnegative jurisdiction-level measure sorted as , the Gini coefficient is
We apply Equation (6) separately to and . Spearman rank correlation between the two jurisdiction-level measures is used as a descriptive sensitivity diagnostic. Gini coefficients are computed over the 54 jurisdictions observed in the archival frame; the comparison between analytical units therefore uses identical geographic support. For provenance, the interval is summarized descriptively, but it is not interpreted as the number or frequency of record revisions.
Spatial Representation and Interpretation Boundary
Spatial outputs are administrative, not event-geographic. Choropleths map quantities already aggregated to a documented jurisdiction. The count map uses only for color scaling, while labels and reported values remain raw counts. A second map displays to distinguish incident-label composition from record volume. No individual FEMA row is assigned an inferred coordinate, and no nearest-neighbor, spatial-autocorrelation, hotspot, kernel-density, or event-density inference is performed. Polygon geometry is used only to display administrative aggregates. Consequently, the maps answer where records are administratively associated in the archived data object; they do not estimate physical hazard footprints, severity, exposure, loss, or event intensity.
5. Results
5.1. Snapshot Characteristics and Temporal Structure
Table 1 summarizes the archived dataset. The difference between 5074 declaration-area rows and 356 unique FEMA declaration numbers is central to the sensitivity analysis below.
Table 1.
Overview of the archived OpenFEMA declaration-summary snapshot.
The median interval from declaration date to the archived lastRefresh timestamp is 443.6 days; the 90th and 95th percentiles are 770.6 and 920.6 days. These values show that the records continued to be maintained after declaration, but a single archived lastRefresh value does not reveal the number, timing, or field-level content of historical revisions.
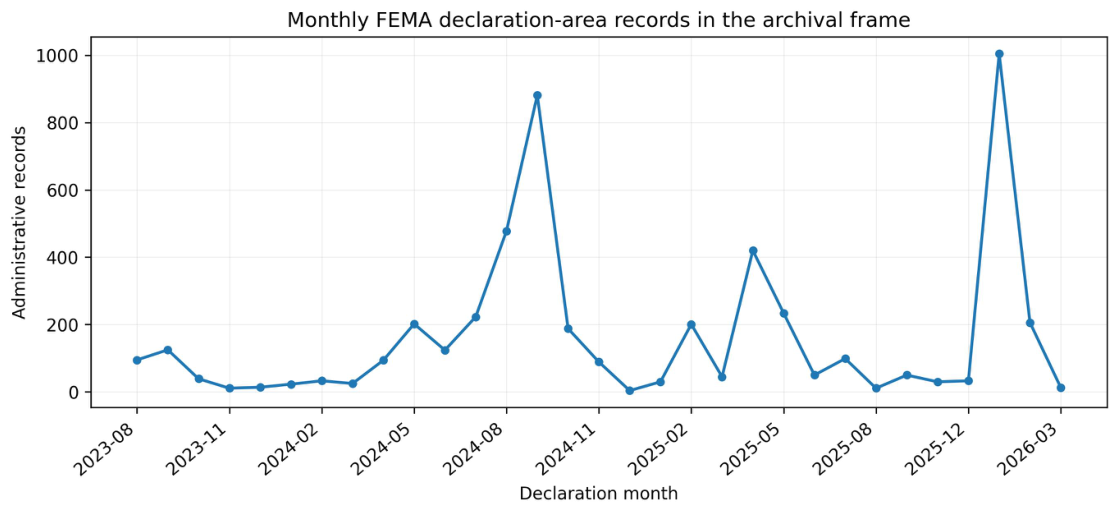
The monthly declaration-area series is strongly episodic (Figure 2). January 2026 contains 1004 rows, the largest monthly count in the archival frame. The first and last months are partial; substantive interpretation therefore relies on the complete-month and complete-calendar checks reported below rather than on boundary-month contrasts.
Figure 2.
Monthly FEMA declaration-area record counts in the archived snapshot. Counts are administrative rows, not unique physical disaster events.
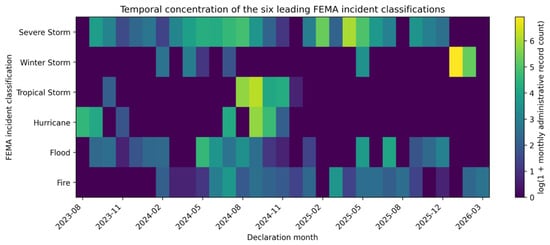
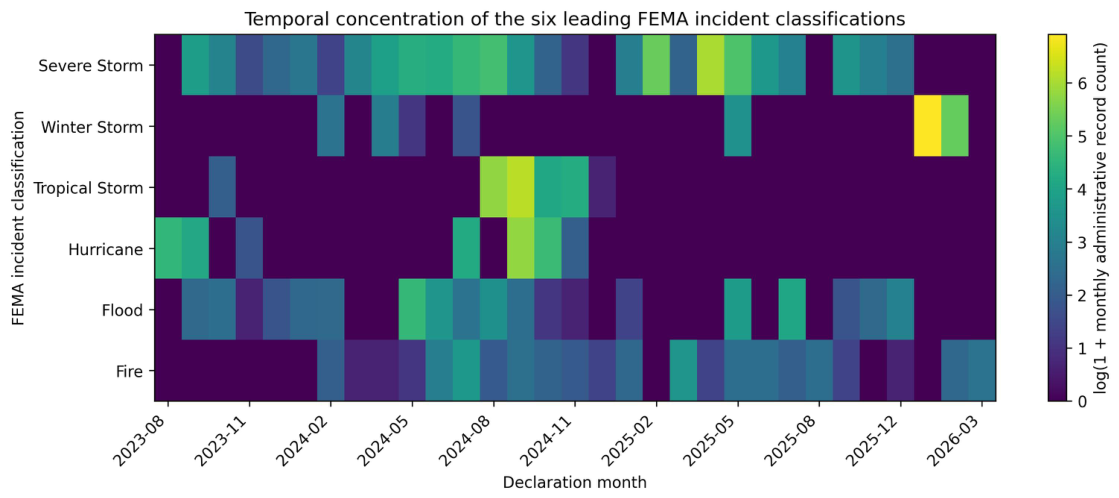
Figure 3 separates month from incident composition. Winter Storm rows form a pronounced January–February 2026 cluster; Tropical Storm and Hurricane rows are concentrated in late summer and autumn 2024; Severe Storm rows recur across several separated administrative episodes. The logarithmic display scale improves visibility without changing the underlying counts.
Figure 3.
Month-by-incident heatmap for the six most frequent FEMA incident classifications. Cell intensity represents for the administrative row count in each month–classification combination.
5.2. Incident Classifications and Jurisdiction Composition
Six incident classifications account for 4986 of 5074 rows (98.27%): Severe Storm (1498; 29.52%), Winter Storm (1269; 25.01%), Tropical Storm (947; 18.66%), Hurricane (675; 13.30%), Flood (379; 7.47%), and Fire (218; 4.30%). These are FEMA administrative labels and should not be interpreted as an independent physical-hazard frequency distribution.
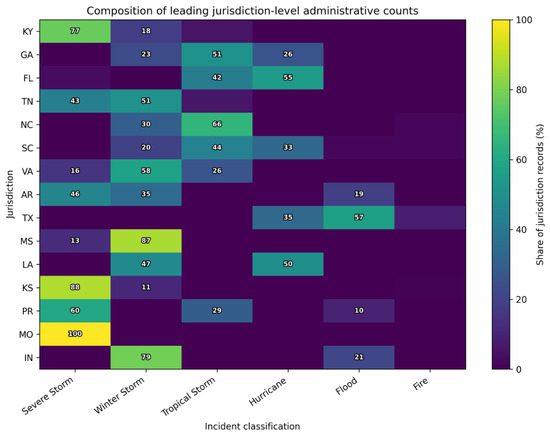
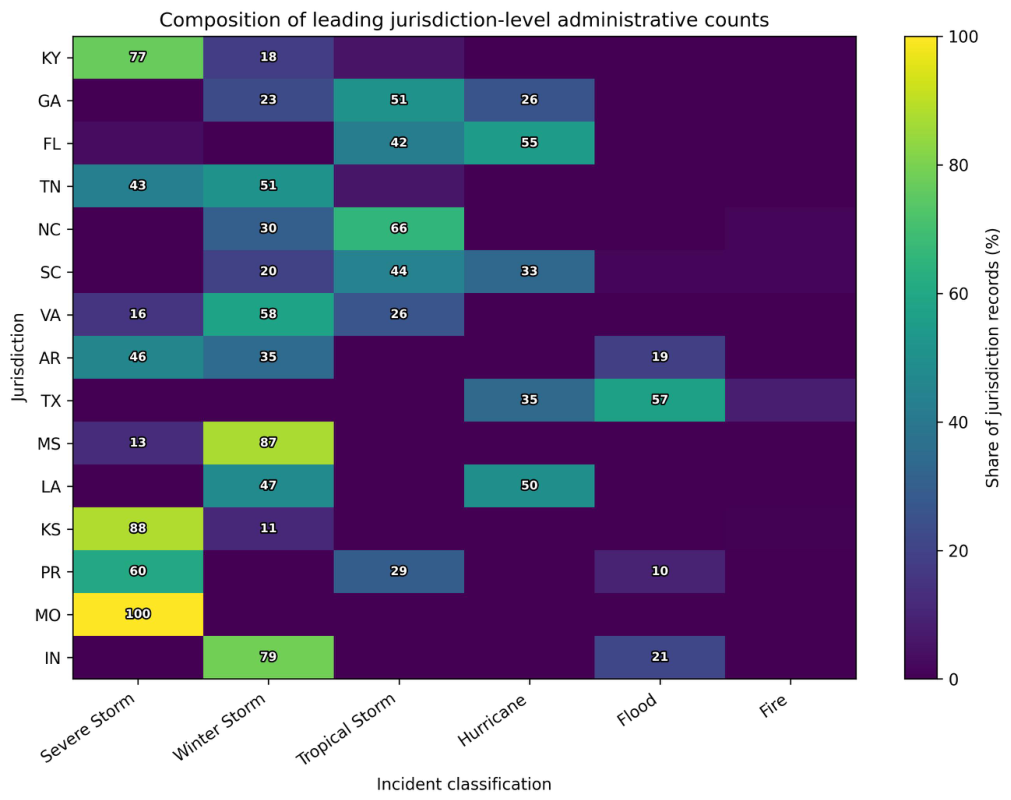
Figure 4 shows the composition of the 15 highest-count jurisdictions. Florida is dominated by Hurricane and Tropical Storm rows, Kentucky by Severe Storm rows, and Texas by Flood and Hurricane rows. Thus, similarly large administrative totals can arise from different categorical mixtures.
Figure 4.
Jurisdiction-by-incident composition for the 15 highest-count jurisdictions and six leading FEMA incident classifications. Cells are percentages of all archived records for the corresponding jurisdiction; labels are shown for cells representing at least 10%.
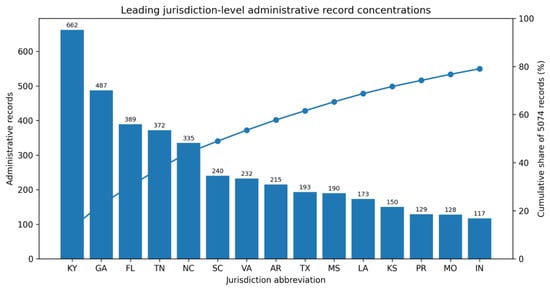
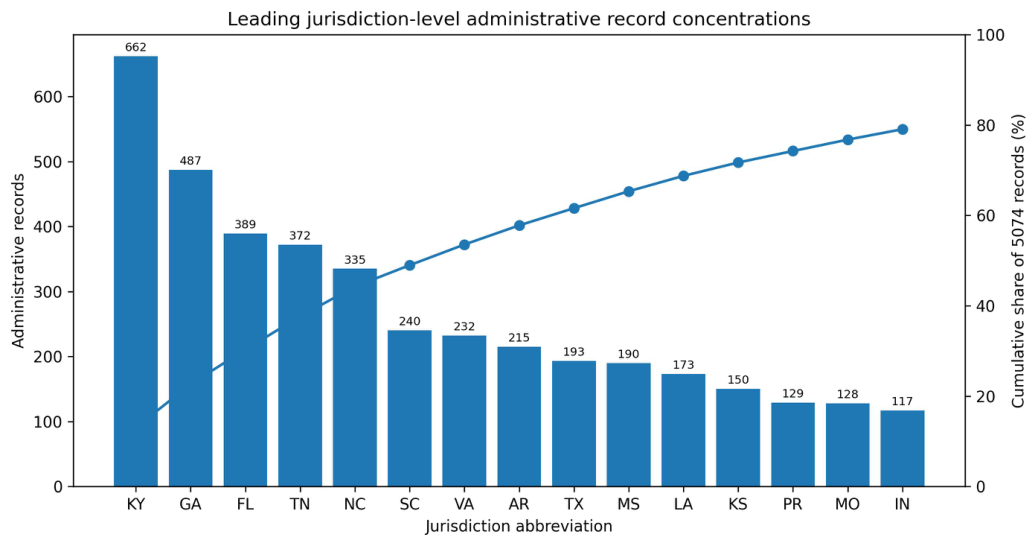
Figure 5 shows declaration-area concentration. Kentucky, Georgia, Florida, Tennessee, and North Carolina together contribute 2245 rows (44.25% of the snapshot), and the 15 highest-count jurisdictions contribute 79.07%.
Figure 5.
Leading jurisdiction-level declaration-area record counts and cumulative share of the complete 5074-row archive.
5.3. Sensitivity to Analytical Unit and Study Window
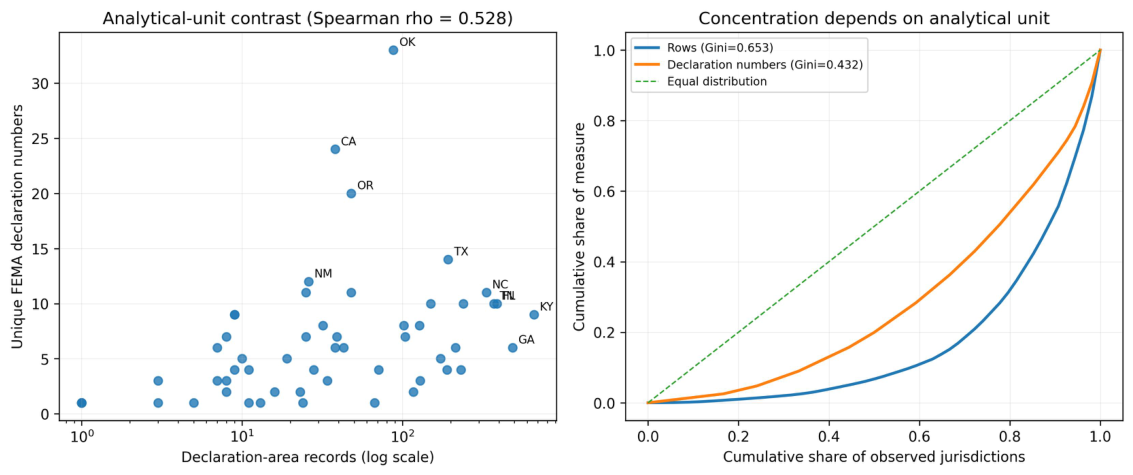
The jurisdiction ranking changes substantially when designated-area multiplicity is removed. Table 2 contrasts the leading jurisdictions under the two analytical units. Kentucky has the largest declaration-area count (662) but only nine unique FEMA declaration numbers. Oklahoma has only 88 declaration-area rows yet has the largest number of unique FEMA declaration numbers (33). California and Oregon similarly move upward when the unit is one unique FEMA declaration number rather than a designated-area row.
Table 2.
Unit-of-analysis sensitivity. The top five jurisdictions differ materially between declaration-area row counts and counts of unique disasterNumber values.
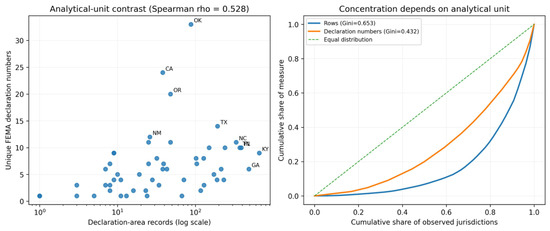
Across jurisdictions, declaration-area counts and declaration-number counts have only moderate rank agreement (). Figure 6 shows both the jurisdiction-level relationship and Lorenz curves. The result establishes that the high concentration of declaration-area rows is partly a property of designated-area multiplicity; it should not be re-labeled as concentration in the number of distinct physical events. Both Gini coefficients are conditional on the same 54 jurisdictions observed in the archival frame; no unobserved jurisdiction is silently assigned a substantive zero.
Figure 6.
Sensitivity to the analytical unit. (Left): declaration-area record counts versus unique FEMA declaration numbers by jurisdiction; selected jurisdictions with large counts or rank shifts are labeled. (Right): Lorenz curves for the two measures. Row-level concentration (Gini 0.653) is substantially stronger than declaration-number concentration (Gini 0.432).
The complete-month frame contains 4966 rows and 347 FEMA declaration numbers; jurisdictional row-count ranks correlate with the archival frame and declaration-number ranks correlate . The top-five row share changes only from 44.25% to 44.22%. The 2024–2025 complete-calendar frame also retains strong agreement ( for row counts and for declaration-number counts). These results show that the principal geographic ranking is not a boundary-month artifact.
5.4. Declaration-Type Decomposition of Analytical-Unit Sensitivity
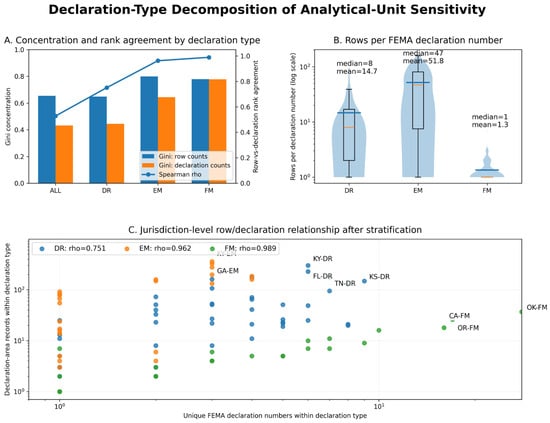
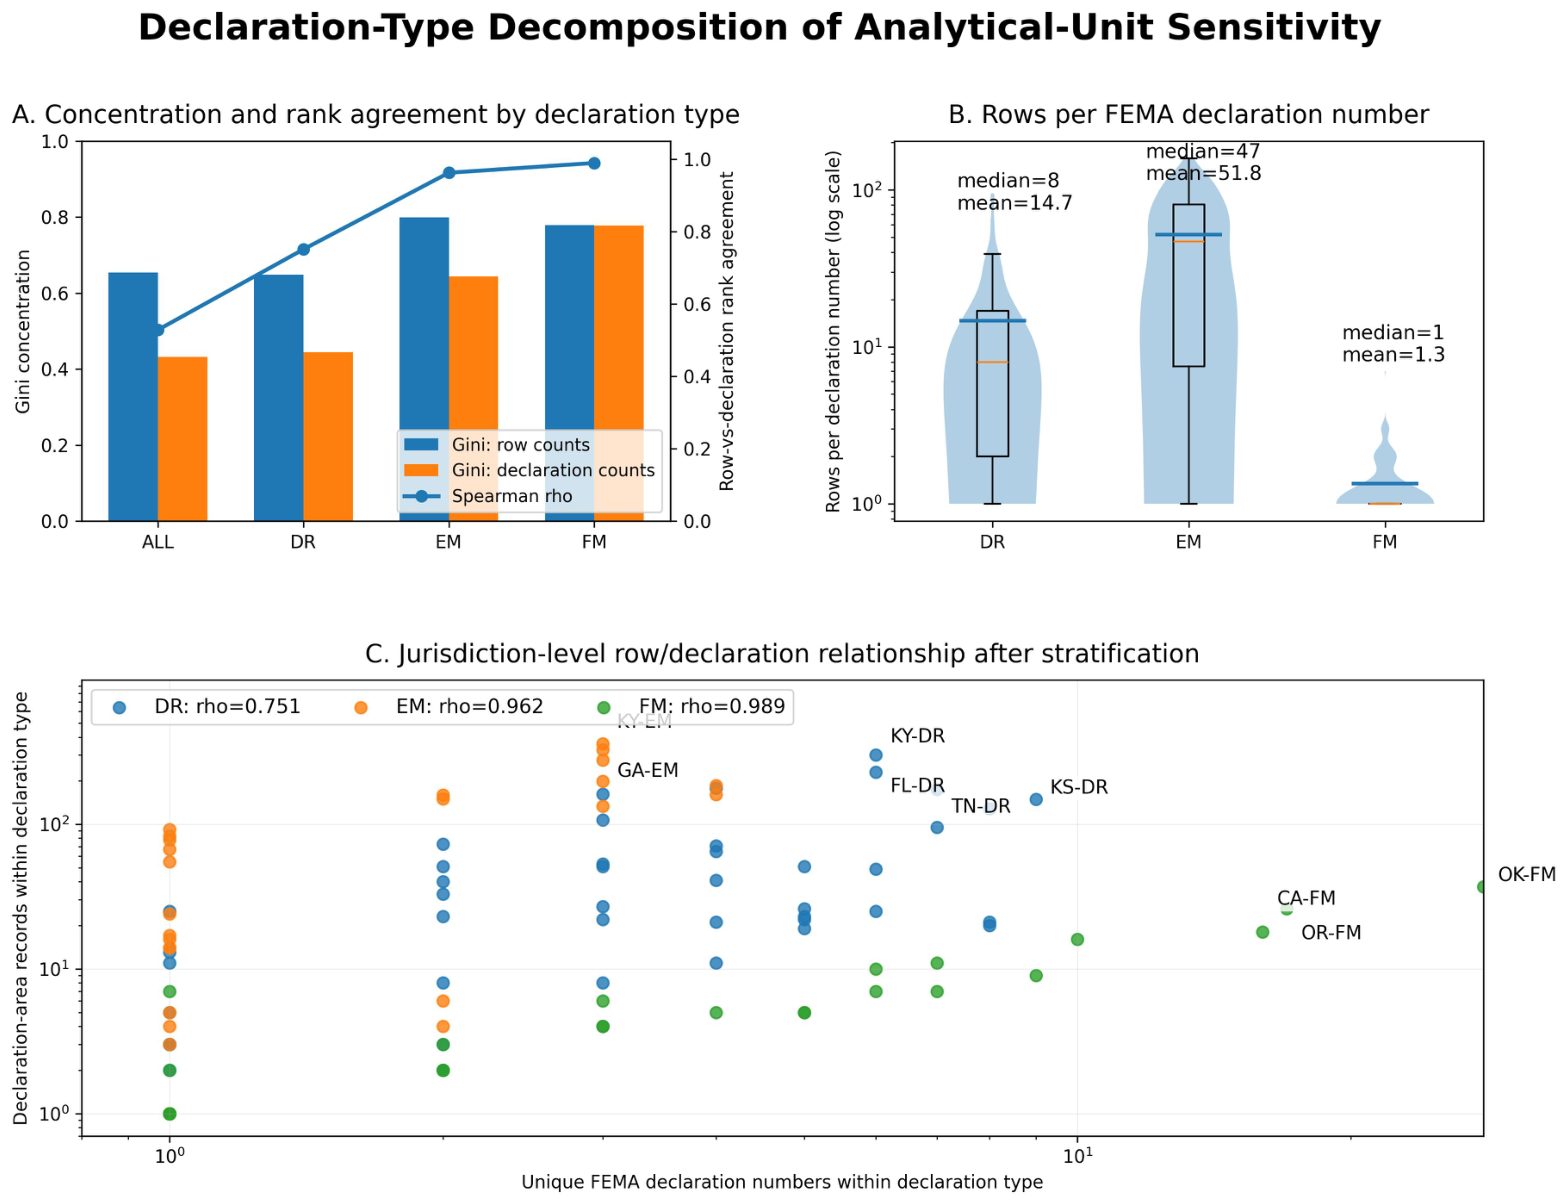
The pooled analytical-unit contrast combines declaration types with very different administrative multiplicities. Table 3 therefore stratifies the analysis by FEMA declarationType. In the archival frame, DR records comprise 2450 rows and 167 declaration numbers, EM records 2433 rows and 47 declaration numbers, and FM records 191 rows and 142 declaration numbers. The typical number of declaration-area rows attached to one FEMA declaration number differs sharply: the median is 8 for DR, 47 for EM, and 1 for FM.
Table 3.
Declaration-type decomposition of analytical-unit sensitivity. Gini coefficients and Spearman correlations are computed on the same 54-jurisdiction support, with zero counts retained for jurisdictions not represented within a declaration type.
The stratified results materially refine the pooled interpretation. Rank agreement is substantially higher within each declaration type than in the pooled data, particularly for EM and FM. The pooled therefore reflects not only designated-area multiplicity but also differences in the jurisdictional mixture of DR, EM, and FM declarations. EM declarations generate many designated-area rows per federal declaration number, whereas FM declarations are usually close to one row per declaration number. Figure 7 integrates these effects by showing type-specific concentration, multiplicity distributions, and jurisdiction-level row/declaration relationships.
Figure 7.
Declaration-type decomposition of analytical-unit sensitivity. Panel (A) compares Gini concentration and row-versus-declaration-number rank agreement for the pooled archive and DR, EM, and FM strata. Panel (B) shows the distribution of declaration-area rows per FEMA declaration number on a logarithmic scale. Panel (C) shows jurisdiction-level row and declaration-number counts after stratification. The figure demonstrates that the pooled analytical-unit contrast combines both designated-area multiplicity and declaration-type composition.
5.5. Administrative Geography and Compositional Diversity
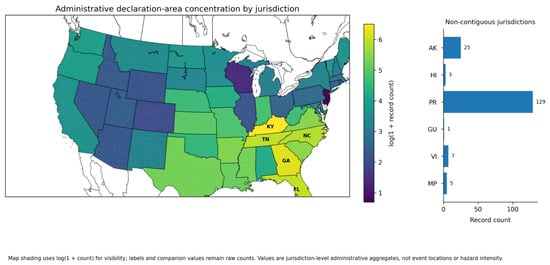
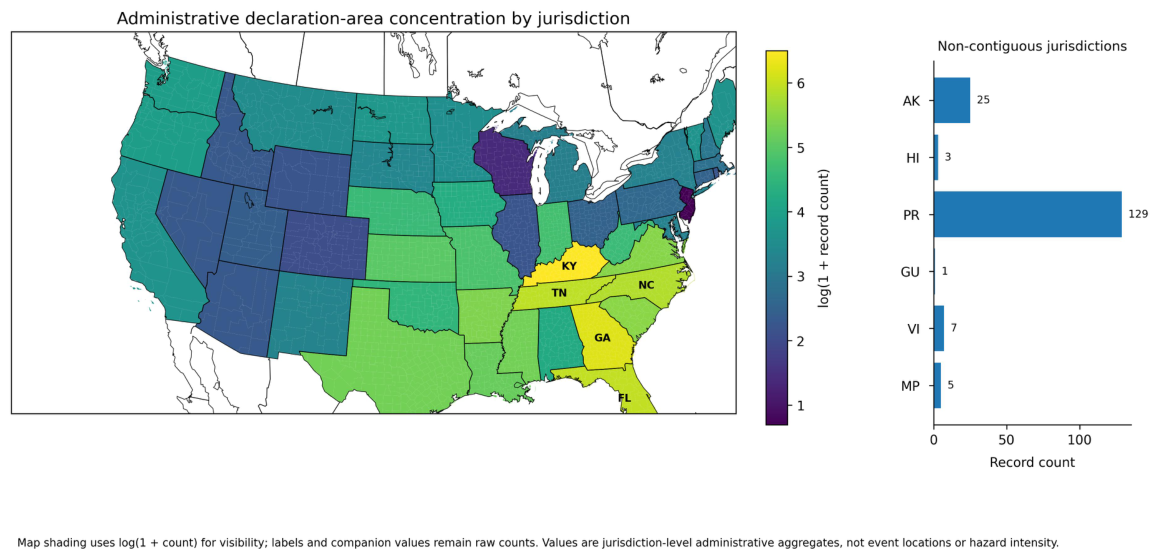
Figure 8 maps the jurisdiction-level declaration-area counts using a logarithmic color scale. The southeastern and south-central concentration visible in the map is a property of the archived administrative rows. It does not indicate that a larger physical area was affected or that underlying hazards were more severe.
Figure 8.
Administrative declaration-area concentration by jurisdiction. Conterminous-state shading represents for cartographic scaling; the companion panel reports raw counts for non-contiguous jurisdictions. The map is not an event-location, hazard-intensity, exposure, or loss map.
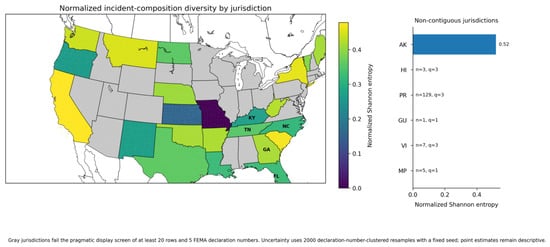
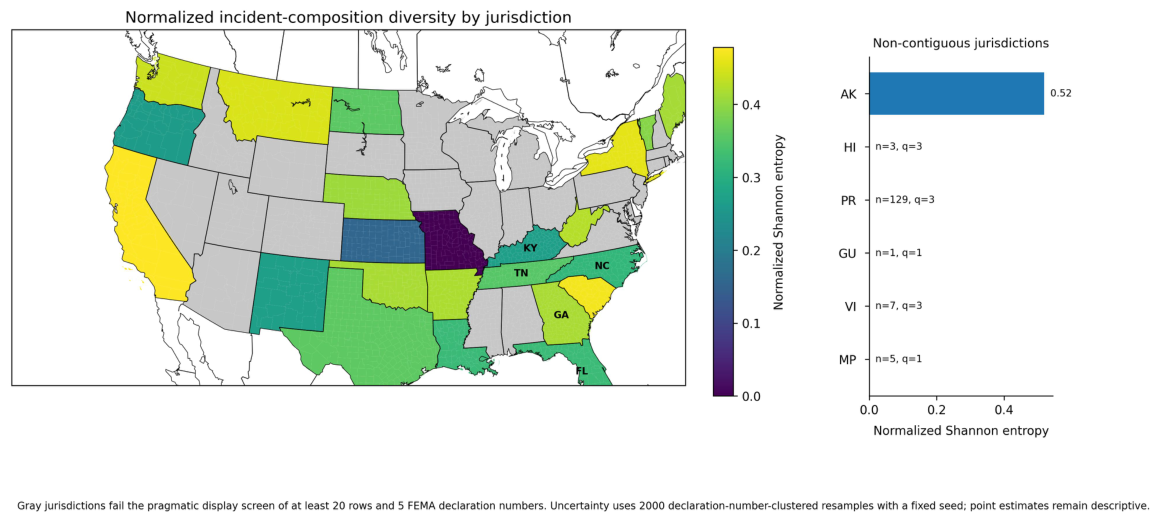
Raw incident-type richness varies from one to five categories, but richness alone is sensitive to the number of records observed. Figure 9 therefore maps normalized Shannon entropy only for jurisdictions with at least 20 archived rows and at least five FEMA declaration numbers. Jurisdictions failing either part of this pragmatic display screen are shown in gray. Under the 2000-resample declaration-number-clustered bootstrap, the median 95% interval width is 0.338 among the 24 jurisdictions meeting the main screen; corresponding median widths are 0.341 for the row threshold and 0.343 for , with the five-declaration minimum held fixed. These relatively wide intervals reinforce the descriptive role of the entropy map and show why individual row resampling would overstate precision. Among eligible jurisdictions, Alaska, California, South Carolina, New York, and Montana have relatively high compositional entropy, whereas several high-count jurisdictions are more strongly dominated by one or two incident classifications.
Figure 9.
Normalized Shannon entropy of incident-classification composition by jurisdiction. Gray jurisdictions fail the pragmatic display screen of at least 20 archived rows and five FEMA declaration numbers. Uncertainty is summarized with 2000 declaration-number-clustered resamples (fixed seed 20260817); row-threshold sensitivity at is included in the replication bundle. The measure summarizes FEMA administrative label composition and is not a physical-hazard diversity index.
5.6. Functional Scope and OpenFEMA Workflow Alignment
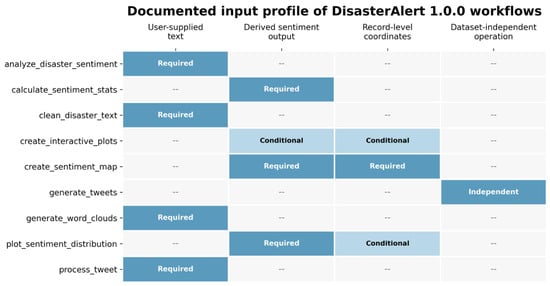
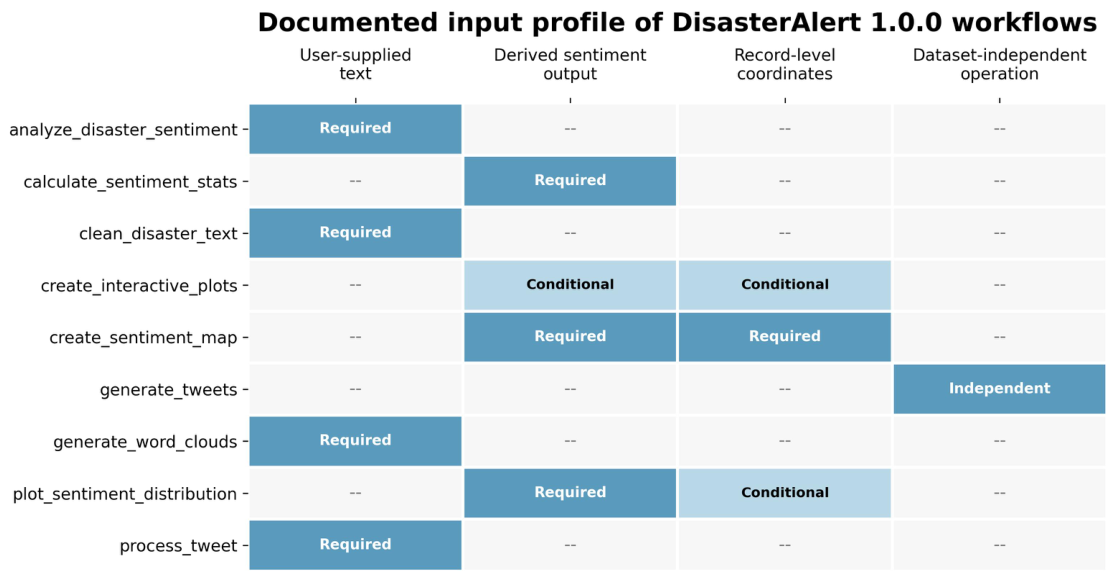
The package-level assessment is presented as a data-requirement alignment exercise rather than a scorecard. Table 4 summarizes the functional roles represented by all nine exported functions, the evidence expected by those workflows, and how the OpenFEMA declaration-summary schema relates to those requirements. Figure 10 complements the table by visualizing workflow prerequisites rather than labeling functions as successful or unsuccessful. The detailed four-dimension function-level audit remains in the replication archive for transparency. In this framing, a workflow that requires information absent from OpenFEMA is simply outside the scope of this particular source, not a weakness of DisasterAlert.
Table 4.
Functional scope of DisasterAlert 1.0.0 and alignment with the OpenFEMA declaration-summary schema used in this case study. The table describes dataset-to-workflow alignment rather than package quality or function performance.
Figure 10.
Documented input profile of the nine exported DisasterAlert 1.0.0 functions. Filled cells indicate workflow prerequisites rather than performance scores; “–” indicates that the corresponding input/evidence is not required for that workflow. The figure highlights the modular design of the package: text-oriented, sentiment-derived, spatial, and dataset-independent functions are activated by different combinations of user-supplied or derived inputs. OpenFEMA is only one possible source schema.
6. Discussion
6.1. Methodological Contribution and Empirical Implications
The study proposes an evidence-aware reporting framework that distinguishes the source evidence, analytical unit, executable software operations, and claims supported by those operations. Its four-dimension audit makes workflow requirements inspectable, while the FEMA analysis shows why analytical-unit choice belongs in the provenance record. Declaration-area counts weight federal declarations according to the number of designated areas; declaration-number counts weight each federal declaration once. The resulting jurisdiction rankings differ substantially, with Gini concentration declining from 0.653 to 0.432 and pooled rank agreement of only .
Declaration-type decomposition identifies two contributors to this contrast: designated-area multiplicity and the jurisdictional composition of DR, EM, and FM declarations. Median rows per declaration number range from 47 for EM to one for FM, while within-type rank agreement is much higher than the pooled value. The complete-month and 2024–2025 analyses further show that the principal jurisdiction rankings are not driven by partial boundary months. Together, these results demonstrate that reproducible administrative summaries require the unit, declaration composition, and temporal frame to be reported alongside the numerical output.
6.2. Spatial and Software Implications
The spatial analysis addresses two administrative questions: the concentration of declaration-area records and the balance of incident classifications within jurisdictions. The count choropleth and normalized entropy map answer these questions without treating state or territory polygons as event coordinates. Physical hazard surfaces, hotspots, exposure, or loss would require separately documented spatial evidence such as event coordinates, hazard footprints, satellite observations, or geolocated communication data [4,5,22].
The software audit similarly separates interface compatibility from evidential support. A character field can satisfy a text-function signature without representing public commentary, and a state identifier can support administrative aggregation without enabling event geocoding. OpenFEMA therefore supplies direct inputs for some DisasterAlert workflows, while sentiment-oriented and record-level spatial workflows require additional data and validation. This mapping describes the relationship between one source schema and documented software requirements; it is not a test of comparative package quality or predictive performance. The distinction is consistent with crisis-informatics research showing that collection mechanisms, modalities, location evidence, and annotation regimes determine what can be inferred [4,5,7,8,10,12].
6.3. Reproducibility, Limitations, and External Validation
The replication bundle contains the archived row-level CSV, retrieval manifest, SHA-256 checksums, derived sensitivity tables, compatibility audit, deterministic analysis and figure scripts, frozen dependencies, and an R interface-check script. The fixed archive, rather than a later live API response, is the computational reference, and the clustered entropy analysis can be reconstructed with the reported seed and disasterNumber resampling unit.
The archival interval is a bounded case-study window, not a probabilistic sample of disasters. The entropy thresholds are pragmatic display rules, and the clustered-bootstrap intervals are descriptive resampling diagnostics. The lastRefresh field records the latest maintenance timestamp but not the history or content of revisions. Most importantly, the proposed framework has been demonstrated on a single data–software pair by authors who also developed DisasterAlert. It should therefore be understood as an inspectable reporting approach rather than an externally validated general methodology. Independent applications by other researchers across additional packages, datasets, disaster types, locations, languages, and time periods are needed to evaluate transportability and operational validity.
7. Conclusions
This study shows that reproducibility in administrative disaster analytics depends on preserving the data object and reporting the analytical unit, declaration composition, temporal frame, and evidential requirements of each workflow. In the OpenFEMA archive, declaration-area and declaration-number summaries produce materially different jurisdiction rankings and concentration estimates. Stratification demonstrates that both designated-area multiplicity and DR/EM/FM composition contribute to the pooled contrast, while complete-month and complete-calendar checks support the stability of the main rankings.
The four-dimension alignment audit provides a traceable way to compare documented software requirements with the evidence available in a dataset. Applied to DisasterAlert 1.0.0, it identifies workflows directly supported by OpenFEMA and those requiring additional text, derived variables, or record-level spatial data. The archived inputs, scripts, checksums, and audit files make this demonstration reproducible. Because the framework has been evaluated only on this single, developer-affiliated data–software pair, independent testing on other combinations is required before broader general applicability is claimed.
Author Contributions
Conceptualization, H.H., L.M.M. and N.K.; Methodology, H.H., L.M.M. and N.K.; Writing—review and editing, H.H., L.M.M. and N.K. All authors have read and agreed to the published version of the manuscript.
Funding
We would like to acknowledge two projects: SystR Project, grant number 101212761, and PARATUS project, grant number 101073954.
Institutional Review Board Statement
Not applicable.
Informed Consent Statement
Not applicable.
Data Availability Statement
The authoritative source is FEMA’s public OpenFEMA Disaster Declarations Summaries version-2 dataset.
Acknowledgments
Use of Generative AI: ChatGPT (web version) (OpenAI; https://chatgpt.com/; accessed on 17 August 2026) was used only for language editing and improvements to grammar, clarity, and presentation. It was not used to write analytical code, conduct analyses, produce numerical results or figures, or formulate scientific interpretations or conclusions. The authors reviewed and verified the complete manuscript and take responsibility for its content.
Conflicts of Interest
Hossein Hassani, Leila Marvian Mashhad, and Nadejda Komendantova are the authors/developers of the DisasterAlert R package cited and examined in this study.
References
- Ogie, R.I.; Verstaevel, N. Disaster informatics: An overview. Prog. Disaster Sci. 2020, 7, 100111. [Google Scholar] [CrossRef] [Scilit]
- Phengsuwan, J.; Shah, T.; Thekkummal, N.B.; Wen, Z.; Sun, R.; James, P.; Ranjan, R. Use of Social Media Data in Disaster Management: A Survey. Future Internet 2021, 13, 46. [Google Scholar] [CrossRef] [Scilit]
- Zou, Z.; Gan, H.; Huang, Q.; Cai, T.; Cao, K. Disaster Image Classification by Fusing Multimodal Social Media Data. ISPRS Int. J. Geo-Inf. 2021, 10, 636. [Google Scholar] [CrossRef] [Scilit]
- Vavassori, A.; Carrion, D.; Zaragozi, B.; Migliaccio, F. VGI and Satellite Imagery Integration for Crisis Mapping of Flood Events. ISPRS Int. J. Geo-Inf. 2022, 11, 611. [Google Scholar] [CrossRef] [Scilit]
- Li, W.; Wang, S.; Chen, X.; Tian, Y.; Gu, Z.; Lopez-Carr, A.; Schroeder, A.; Currier, K.; Schildhauer, M.; Zhu, R. GeoGraphVis: A knowledge graph and geovisualization empowered cyberinfrastructure to support disaster response and humanitarian aid. ISPRS Int. J. Geo-Inf. 2023, 12, 112. [Google Scholar] [CrossRef] [Scilit]
- Schwarz, K.; Bollens, K.; Arias Aranda, D.; Hartmann, M. AI-Enhanced Disaster Management: A Modular OSINT System for Rapid Automated Reporting. Appl. Sci. 2024, 14, 11165. [Google Scholar] [CrossRef] [Scilit]
- Shetty, N.P.; Bijalwan, Y.; Chaudhari, P.; Shetty, J.; Muniyal, B. Disaster assessment from social media using multimodal deep learning. Multimed. Tools Appl. 2025, 84, 18829–18854. [Google Scholar] [CrossRef] [Scilit]
- Yu, C.; Hu, B.; Wang, Z. Open-world disaster information identification from multimodal social media. Complex Intell. Syst. 2025, 11, 7. [Google Scholar] [CrossRef] [Scilit]
- Löchner, M.; Fathi, R.; Schmid, D.; Dunkel, A.; Burghardt, D.; Fiedrich, F.; Koch, S. Case Study on Privacy-Aware Social Media Data Processing in Disaster Management. ISPRS Int. J. Geo-Inf. 2020, 9, 709. [Google Scholar] [CrossRef] [Scilit]
- Rachunok, B.A.; Fan, C.; Lee, R.; Nateghi, R.; Mostafavi, A. Is the data suitable? The comparison of keyword versus location filters in crisis informatics using Twitter data. Int. J. Inf. Manag. Data Insights 2022, 2, 100063. [Google Scholar] [CrossRef] [Scilit]
- Yigitcanlar, T.; Regona, M.; Kankanamge, N.; Mehmood, R.; D’Costa, J.; Lindsay, S.; Nelson, S.; Brhane, A. Detecting Natural Hazard-Related Disaster Impacts with Social Media Analytics: The Case of Australian States and Territories. Sustainability 2022, 14, 810. [Google Scholar] [CrossRef] [Scilit]
- Ghaffarian, S.; Taghikhah, F.R.; Maier, H.R. Explainable artificial intelligence in disaster risk management: Achievements and prospective futures. Int. J. Disaster Risk Reduct. 2023, 98, 104123. [Google Scholar] [CrossRef] [Scilit]
- Albahri, A.S.; Khaleel, Y.L.; Habeeb, M.A.; Ismael, R.D.; Hameed, Q.A.; Deveci, M.; Homod, R.Z.; Albahri, O.S.; Alamoodi, A.H.; Alzubaidi, L. A systematic review of trustworthy artificial intelligence applications in natural disasters. Comput. Electr. Eng. 2024, 118, 109409. [Google Scholar] [CrossRef] [Scilit]
- Papin, J.A.; Mac Gabhann, F.; Sauro, H.M.; Nickerson, D.; Rampadarath, A. Improving reproducibility in computational biology research. PLoS Comput. Biol. 2020, 16, e1007881. [Google Scholar] [CrossRef] [Scilit] [PubMed]
- Haibe-Kains, B.; Adam, G.A.; Hosny, A.; Khodakarami, F.; Massive Analysis Quality Control (MAQC) Society Board of Directors; Waldron, L.; Wang, B.; McIntosh, C.; Goldenberg, A.; Kundaje, A.; et al. Transparency and reproducibility in artificial intelligence. Nature 2020, 586, E14–E16. [Google Scholar] [CrossRef] [Scilit] [PubMed]
- Romano, J.D.; Moore, J.H. Ten simple rules for writing a paper about scientific software. PLoS Comput. Biol. 2020, 16, e1008390. [Google Scholar] [CrossRef] [Scilit] [PubMed]
- Seibold, H.; Czerny, S.; Decke, S.; Dieterle, R.; Eder, T.; Fohr, S.; Hahn, N.; Hartmann, R.; Heindl, C.; Kopper, P.; et al. A computational reproducibility study of PLOS ONE articles featuring longitudinal data analyses. PLoS ONE 2021, 16, e0251194. [Google Scholar] [CrossRef] [Scilit] [PubMed]
- Hassani, H.; Komendantova, N.; Marvian Mashhad, L. DisasterAlert: Disaster Alert and Sentiment Analysis, R package version 1.0.0, CRAN; R-Tools Technology Inc.: Richmond Hill, ON, Canada, 2025. [Google Scholar] [CrossRef] [Scilit]
- Umbach, G. Open Science and the impact of Open Access, Open Data, and FAIR publishing principles on data-driven academic research: Towards ever more transparent, accessible, and reproducible academic output? Stat. J. IAOS 2024, 40, 59–70. [Google Scholar] [CrossRef] [Scilit]
- Berzofsky, M.E.; Liao, D.; Barnett-Ryan, C.; Smith, E.L. A total data quality paradigm for official statistics based on administrative data. Stat. J. IAOS 2025, 41, 205–215. [Google Scholar] [CrossRef] [Scilit]
- Ortame, F.; Isidori, F. Statistical frameworks for reliable machine learning predictions and inference. Stat. J. IAOS 2026, 42, 203–210. [Google Scholar] [CrossRef] [Scilit]
- He, C.; Hu, D. Social Media Analytics for Disaster Response: Classification and Geospatial Visualization Framework. Appl. Sci. 2025, 15, 4330. [Google Scholar] [CrossRef] [Scilit]
- Coppi, G.; Moreno Jimenez, R.; Kyriazi, S. Explicability of humanitarian AI: A matter of principles. J. Int. Humanit. Action 2021, 6, 19. [Google Scholar] [CrossRef] [Scilit]
- Federal Emergency Management Agency. OpenFEMA; Public data API and documentation; Federal Emergency Management Agency: Washington, DC, USA, 2026.
- Federal Emergency Management Agency. Disaster Declarations Summaries; OpenFEMA dataset, version 2; Federal Emergency Management Agency: Washington, DC, USA, 2026.

Disclaimer/Publisher’s Note: The statements, opinions and data contained in all publications are solely those of the individual author(s) and contributor(s) and not of MDPI and/or the editor(s). MDPI and/or the editor(s) disclaim responsibility for any injury to people or property resulting from any ideas, methods, instructions or products referred to in the content. |
© 2026 by the authors. Licensee MDPI, Basel, Switzerland. This article is an open access article distributed under the terms and conditions of the Creative Commons Attribution (CC BY) license.