


Abstract
Background: Borderline dengue immunoglobulin M (IgM) enzyme-linked immunosorbent assay (ELISA) results create diagnostic and epidemiological uncertainty. Collapsing the manufacturer’s three qualitative categories into a binary outcome changes the effective decision rule and may materially alter the apparent positivity proportion. This Data article describes an anonymized laboratory dataset from Trinidad and Tobago and evaluates both category-handling uncertainty and test-misclassification uncertainty. Methods: The dataset comprises 161 consecutive serum specimens submitted for routine dengue IgM testing between 1 September 2025 and 28 February 2026 and processed in four analytical batches. The results were analyzed under three prespecified scenarios: borderline classified as negative, borderline excluded, and borderline classified as positive. Exact Clopper–Pearson 95% confidence intervals (CIs) were calculated. Rogan–Gladen adjustment was applied only to the borderline-excluded scenario because the ELISA test validation estimates of sensitivity and specificity were calculated after excluding borderline results. Results: Twenty specimens (12.4%) were positive, 29 (18.0%) borderline, and 112 (69.6%) negative. The apparent IgM positivity was 12.4% (20/161; 95% CI 7.8–18.5%) when borderline results were classified as negative, 15.2% (20/132; 95% CI 9.5–22.4%) when they were excluded, and 30.4% (49/161; 95% CI 23.4–38.2%) when they were classified as positive. For determinate results, the conditional Rogan–Gladen estimates were 13.2% using a sensitivity of 100.0% and specificity of 97.7%, and 15.1% using a sensitivity of 82.2% and specificity of 96.8%. Conclusions: Misclassification adjustment is informative but remains conditional on the transportability of external assay-performance estimates. The dataset supports transparent category-level reanalysis, while the absence of continuous index values, confirmatory testing, and detailed clinical metadata limits numerical cut-off recalibration and patient-level inference.
1. Introduction
Dengue is a major mosquito-borne viral disease in tropical and subtropical regions and continues to impose a substantial clinical and public-health burden. Laboratory surveillance is essential because its clinical manifestations overlap with those of other febrile illnesses and because the usefulness of a diagnostic method depends on the stage of infection. Molecular detection and non-structural protein 1 antigen testing are most informative early in illness, whereas serological assays become increasingly useful after antibody development [1,2,3,4,5].
Commercial dengue IgM ELISAs are practical for routine diagnostic laboratories and surveillance programs, but their interpretation is not intrinsically binary. The EUROIMMUN Anti-Dengue Virus ELISA (IgM) reports negative, borderline, and positive index categories. Borderline results may occur near the analytical decision limits and may also reflect evolving seroconversion, waning IgM, secondary flavivirus exposure, cross-reactive antibodies, or specimen-specific analytical variation [5,6,7,8,9]. The manufacturer therefore treats the borderline interval as an indeterminate zone rather than a secure positive or negative classification [9].
Converting a three-category result into a binary outcome is a form of categorical collapse. Methodological research in other fields shows that category-collapsing rules can change statistical estimates, model behavior, and prevalence because the resulting binary variable depends on the rule used to reassign the intermediate category [10,11,12]. In the present setting, counting borderline specimens as positive approximates a lower positivity threshold at the lower boundary of the borderline interval, whereas counting them as negative retains the higher positive threshold. Excluding borderline specimens preserves their indeterminate status but changes the denominator. Research on seropositivity cut-offs similarly emphasizes that threshold choice, validation samples, assay characteristics, and intended use affect the resulting seroprevalence estimate and its comparability across studies [10].
A second source of uncertainty is diagnostic-test misclassification. The observed proportion of positive tests is an apparent prevalence and may differ from the underlying prevalence when the sensitivity and specificity are imperfect. The Rogan–Gladen estimator provides a simple correction when valid sensitivity and specificity estimates are available [13]. Recent reviews show that failure to account for test performance can bias seroprevalence estimates, while also cautioning that adjustment may be misleading when validation estimates are not transferrable to the population under study [14].
The EUROIMMUN IgM instructions for use report multiple validation profiles. Importantly, borderline results were excluded from the sensitivity and specificity calculations [9]. Consequently, those performance estimates can be applied most coherently to an analysis restricted to determinate results, but they cannot be assumed to remain valid when all borderline results are reassigned as positive or negative. The magnitude by which sensitivity or specificity would change under either collapsed rule is unknown.
The present Data article describes an anonymized dengue IgM ELISA dataset generated from routine diagnostic specimens in Trinidad and Tobago. Its objectives are to: (i) document the available variables and their valid reuse; (ii) quantify how three explicit borderline-handling rules alter apparent IgM positivity; and (iii) illustrate conditional Rogan–Gladen adjustment using manufacturer performance profiles that excluded borderline samples. The article deliberately distinguishes scenario analysis from diagnostic truth and distinguishes batch provenance from analytical reproducibility.
2. Materials and Methods
2.1. Study Design and Period
A retrospective, laboratory-based data descriptor and secondary analysis was conducted using an anonymized extract of routine dengue IgM testing performed in Trinidad and Tobago. The specimens were submitted between 1 September 2025 and 28 February 2026. The study objective was to describe the dataset and evaluate how prespecified rules for handling borderline results influence apparent IgM positivity and conditional misclassification-adjusted estimates.
2.2. Study Setting, Population, and Available Metadata
The analytical extract comprised 161 consecutive serum specimens submitted to a clinical diagnostic laboratory for routine dengue serology. Clinical suspicion of dengue was determined by the referring clinician before laboratory submission. Samples were processed in four analytical batches containing 31, 29, 53, and 48 specimens, respectively. Batch identifiers are retained as provenance variables; the batches contained different patient specimens and therefore do not constitute repeated measurements of the same samples.
Eligible records had adequate serum volumes, complete laboratory documentation for the variables included in the extract, and a valid manufacturer-derived qualitative interpretation. Duplicate submissions and records with incomplete qualitative classification were excluded before anonymization. The analytical file does not contain age, sex, detailed symptoms, comorbidities, exact days from symptom onset, referring facility, vaccination history, previous flavivirus exposure, or geocoded information. These variables were therefore unavailable for stratified analyses.
2.3. Detection and Interpretation of Anti-Dengue Virus IgM
Dengue virus-specific IgM antibodies were detected using the EUROIMMUN Anti-Dengue Virus ELISA (IgM) (EUROIMMUN Medizinische Labordiagnostika AG, Lubeck, Germany) according to the manufacturer’s instructions [9]. Diluted serum was incubated in antigen-coated microplate wells. After washing, an enzyme-labelled anti-human IgM conjugate and tetramethylbenzidine substrate were applied. The reaction was stopped and absorbance was measured at 450 nm. The results are expressed as an index or ratio and were interpreted using the manufacturer-defined categories:
- Negative: index < 0.80;
- Borderline (equivocal): index >= 0.80 to <1.10;
- Positive: index >= 1.10.
The public analytical extract used for this Data article contains the final qualitative category rather than the continuous specimen-level index/OD-ratio. It can therefore support category-level reanalysis but cannot support the recalibration of numerical cut-offs, assessment of distance from the decision limits, or modelling of within-category analytical variation.
2.4. Data Records and Reuse
The deposited resource is intended for the transparent reproduction of specimen counts and alternative codings of the borderline category. Table 1 summarizes the principal variables and appropriate secondary uses. Continuous values and detailed clinical or temporal metadata should not be inferred from the available fields.
Table 1.
Dataset variables and the principal scope of valid secondary use.
2.5. Apparent Positivity Scenarios
Three prespecified analyses were used to quantify uncertainty introduced by categorical collapse:
Borderline classified as negative. The numerator comprised the 20 positive specimens and the denominator comprised all 161 specimens. This is the lowest apparent positivity estimate among the three rules, but it does not prove that borderline specimens are uninfected.
Borderline excluded. The numerator comprised the 20 positive specimens and the denominator comprised the 132 determinate positive or negative specimens. This preserves the indeterminate status of the borderline category but changes the target population to specimens with determinate results.
Borderline classified as positive. The numerator comprised the 20 positive plus 29 borderline specimens, and the denominator comprised all 161 specimens. This is the highest apparent positivity estimate and may include nonspecific or cross-reactive results.
None of the three rules was treated as a reference-standard classification because RT-PCR, NS1 antigen results, paired acute and convalescent sera, and clinical adjudication were unavailable.
2.6. Rogan–Gladen Misclassification Adjustment
The Rogan–Gladen estimator was calculated as:
where PA is apparent prevalence, Se is sensitivity, and Sp is specificity [13]. Adjustment was restricted to the borderline-excluded analysis because the EUROIMMUN validation studies explicitly excluded borderline specimens from their accuracy calculations [9]. Two manufacturer profiles were examined: Study I (Se 100.0%, Sp 97.7%) and Study II (Se 82.2%, Sp 96.8%).
PRG = (PA + Sp − 1)/(Se + Sp − 1)
The exact Clopper–Pearson confidence limits for the apparent positivity proportion were transformed through the same equation while treating sensitivity and specificity as fixed. These conditional intervals do not incorporate uncertainty in assay-performance estimates, differences between the manufacturer validation populations and the present suspected-case population, or referral and spectrum effects. Therefore, the adjusted results are sensitivity analyses rather than definitive estimates of population prevalence.
2.7. Statistical Analysis
Frequencies and percentages were calculated for qualitative categories. Exact two-sided 95% confidence intervals were calculated using the Clopper–Pearson binomial method [15]. Calculations were performed in R (R 4.6.1 Foundation for Statistical Computing, Vienna, Austria). No Cochran Q statistic, I-squared statistic, or inferential test of batch reproducibility was used in the final analysis. Because different specimens were included in each batch, a similarity or difference between batches could reflect case mix and cannot establish analytical repeatability or reproducibility. A formal reproducibility study would require replicate testing of the same specimens across runs, operators, instruments, reagent lots, or days [16]. A two-sided inferential significance threshold was therefore not applicable to the descriptive batch variable.
2.8. Ethical Considerations
The study used previously collected, anonymized serum specimens and laboratory records generated during routine diagnostic testing. No additional specimens were collected for this analysis, and no identifying information was available to the investigator. The study was conducted in accordance with the Declaration of Helsinki and was approved by the Campus Ethics Committee of The University of the West Indies, St. Augustine (CREC-SA.3404/07/2025; approval date 4 July 2025). The requirement for individual informed consent was waived for the retrospective analysis of anonymized records.
3. Results
3.1. Qualitative Distribution
Among 161 serum specimens, 20 (12.4%) were classified as positive, 29 (18.0%) as borderline, and 112 (69.6%) as negative. Thus, nearly one-fifth of the analytical records were located in the manufacturer-defined indeterminate interval and directly determined the separation among the three apparent positivity scenarios.
3.2. Scenario-Dependent Apparent IgM Positivity
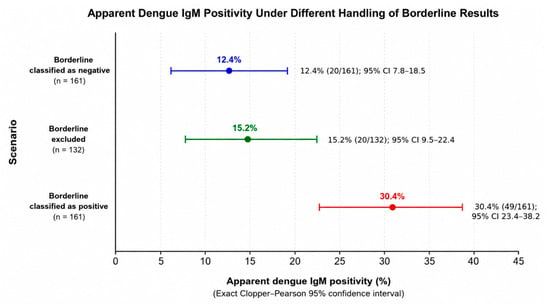
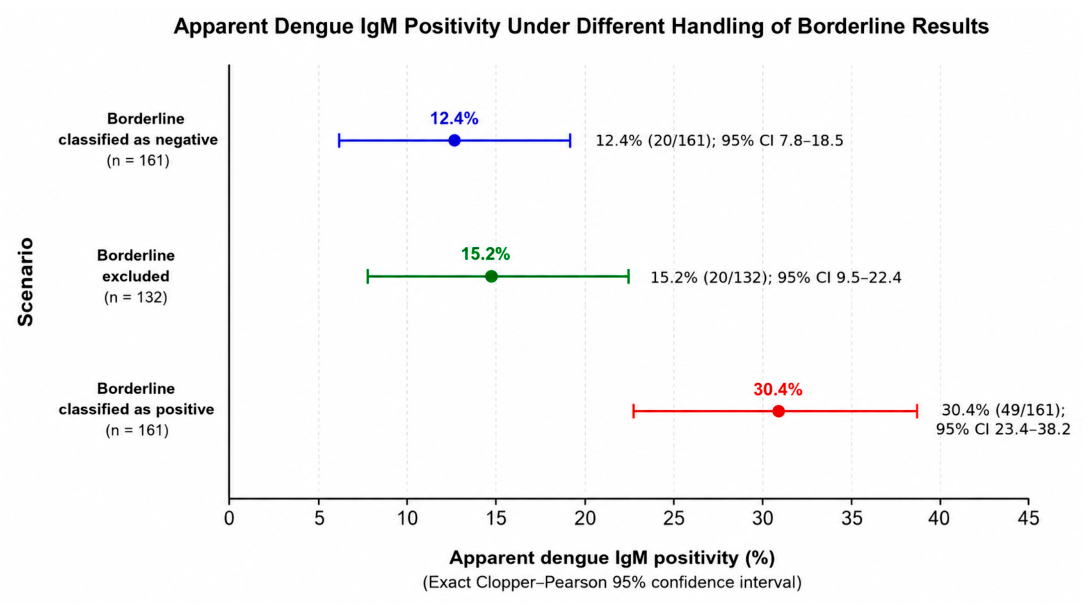
When borderline results were classified as negative, the apparent IgM positivity was 12.4% (20/161; exact 95% CI 7.8–18.5%). Excluding borderline specimens yielded 15.2% (20/132; exact 95% CI 9.5–22.4%). Classifying borderline specimens as positive yielded 30.4% (49/161; exact 95% CI 23.4–38.2%). The absolute difference between the lowest and highest scenarios was 18.0 percentage points (Figure 1 and Table 2).
Figure 1.
Apparent dengue IgM positivity under three prespecified rules for handling borderline ELISA results. Points show the observed percentages; horizontal bars show exact Clopper–Pearson 95% confidence intervals. These are classification scenarios and do not represent molecularly confirmed infection prevalence.
Table 2.
Apparent dengue IgM positivity under alternative classifications of borderline results.
3.3. Conditional Misclassification-Adjusted Estimates
Rogan–Gladen adjustment was applied to the borderline-excluded apparent proportion of 15.2%. Using the manufacturer Study I profile (sensitivity 100.0%; specificity 97.7%), the adjusted estimate was 13.2%. Using the Study II profile (sensitivity 82.2%; specificity 96.8%), the adjusted estimate was 15.1% (Table 3). The difference between the adjusted estimates illustrates that the correction depends on the selected validation profile.
Table 3.
Conditional Rogan–Gladen adjustment among specimens with determinate results. Sensitivity and specificity were treated as fixed; the intervals do not include uncertainty in assay-performance estimates or differences between validation and study populations.
3.4. Batch Variable
The four batch identifiers and batch sizes are retained in the dataset as provenance information. No inferential batch comparison is presented because each batch contained different patient specimens. Accordingly, the dataset does not permit the estimation of analytical repeatability or reproducibility from the batch variable alone.
4. Discussion
This Data article demonstrates two distinct sources of uncertainty in a qualitative serological dataset: uncertainty created by the handling of borderline results and uncertainty created by imperfect test performance. The same 161 records produced apparent IgM positivity estimates ranging from 12.4% to 30.4% solely because the 29 borderline specimens were handled differently. The 18.0-percentage-point spread is therefore a property of the classification rule, not evidence of a corresponding change in the underlying infection burden.
The category-handling scenarios have different interpretations. Assigning borderline results as positive effectively moves the binary decision boundary towards the lower limit of the borderline interval (index 0.80), increasing the number classified as positive. Assigning them as negative preserves the manufacturer’s positive threshold at index 1.10 but converts an explicitly uncertain category into a non-positive outcome. Exclusion does not declare the borderline specimens positive or negative but changes the estimand to positivity among determinate specimens. Similar methodological work has shown that diagnostic and category-collapsing rules can substantially alter prevalence estimates and other statistical results [10,11,12].
The manufacturer’s validation information is central to interpretation. EUROIMMUN reported different sensitivity and specificity values across validation studies, and borderline results were excluded from the calculations [9]. The authors consider that the collapse rule to exclude indeterminate or equivocal results is the most consistent with the manufacturer’s intended usage and guidelines, and the method by which the manufacturer estimated the sensitivity and specificity of the test, and therefore, it is diagnostically correct.
The Rogan–Gladen analysis accounts for diagnostic misclassification in the raw apparent proportion. Applied to determinate specimens, the adjusted point estimates were 13.2% and 15.1%, depending on which manufacturer validation profile was used. These results demonstrate both the usefulness and the limitation of correction: adjustment can account algebraically for imperfect sensitivity and specificity, but the answer depends on the selected external estimates. The manufacturer studies differed in reference method and population, and neither necessarily represents clinically suspected cases in Trinidad and Tobago. The transformed intervals also treated sensitivity and specificity as fixed. Accordingly, these values should not be interpreted as definitive true prevalence estimates [13,14].
The current public analytical extract is reusable at the qualitative-category level. It permits confirmation of the total counts, reconstruction of each scenario, calculation of exact confidence intervals, and methodological teaching on equivocal results. However, the absence of continuous specimen-level index/OD-ratio values prevents users from applying alternative numerical thresholds, estimating how far observations lie from the cut-offs, or fitting models that preserve the continuous assay signal. Future releases of similar laboratory datasets should prospectively retain de-identified continuous measurements, quality-control values, specimen dates, days from symptom onset, basic demographic variables, and confirmatory test results, subject to ethics and privacy requirements.
The batch identifier also requires careful language. Reproducibility refers to obtaining sufficiently consistent results when the same specimens are measured under relevant changed conditions. Here, the batches contained different specimens. Batch-to-batch similarities or differences could therefore arise from the patient mix, timing of collection, referral patterns, or unmeasured clinical characteristics rather than assay performance. The batch variable is therefore treated solely as provenance; Cochran Q, I-squared, and claims of analytical reproducibility are not applicable.
Additional limitations affect epidemiological interpretation. The specimens were consecutive submissions from clinically suspected patients in one diagnostic setting and do not constitute a probability sample of the population. The dataset lacks molecular confirmation, NS1 antigen results, paired serology, symptom-onset timing, previous flavivirus exposure, and detailed clinical information. Dengue IgM may be absent early in infection, attenuated in some secondary infections, persistent after recent infection, or affected by flavivirus cross-reactivity [5,6,7,8,9,17,18,19]. Consequently, the estimates describe the tested specimen set and should not be interpreted as dengue incidence or population prevalence in Trinidad and Tobago.
5. Conclusions
The dataset is valuable for transparent category-level reanalysis, but its lack of continuous assay values, confirmatory testing, and detailed metadata limits threshold recalibration, patient-level diagnosis, and population inference. Explicit reporting of the borderline rule, the estimand, and the assumptions used for misclassification adjustment is essential for the reproducible use of this and similar serological datasets.
Author Contributions
Conceptualization, methodology, formal analysis, data curation, writing—original draft preparation, and writing—review and editing, A.J.-V. Investigation and writing—editing and review were also performed by R.A.F. and S.S. Software was used by S.S. All authors have read and agreed to the published version of the manuscript.
Funding
This research received no external funding.
Institutional Review Board Statement
The study was conducted in accordance with the Declaration of Helsinki and approved by the Campus Research Ethics Committee of The University of the West Indies, St. Augustine (CREC-SA.3404/07/2025; 4 July 2025).
Informed Consent Statement
Patient informed consent was waived because the study was a retrospective laboratory-based investigation using previously collected, anonymized serum specimens and records obtained during routine diagnostic testing. No additional specimens were collected for research, and no identifiable personal information was available to the investigator.
Data Availability Statement
The anonymized dataset is publicly available in Figshare under a CC BY license: https://doi.org/10.6084/m9.figshare.32870273. Secondary users should note that the current analytical extract supports qualitative category-level analyses and does not include continuous specimen-level ELISA index/OD-ratio values or the clinical metadata listed in Section 2.2.
Acknowledgments
The author thanks the West Indian Immunology Society for its support.
Conflicts of Interest
The author declares no conflicts of interest.
References
- World Health Organization. Dengue and Severe Dengue; WHO: Geneva, Switzerland, 2025. [Google Scholar]
- Bhatt, S.; Gething, P.W.; Brady, O.J.; Messina, J.P.; Farlow, A.W.; Moyes, C.L.; Drake, J.M.; Brownstein, J.S.; Hoen, A.G.; Sankoh, O.; et al. The global distribution and burden of dengue. Nature 2013, 496, 504–507. [Google Scholar] [CrossRef] [Scilit] [PubMed]
- Guzman, M.G.; Harris, E. Dengue. Lancet 2015, 385, 453–465. [Google Scholar] [CrossRef] [Scilit]
- Wilder-Smith, A.; Ooi, E.E.; Horstick, O.; Wills, B. Dengue. Lancet 2019, 393, 350–363. [Google Scholar] [CrossRef] [Scilit] [PubMed]
- Muller, D.A.; Depelsenaire, A.C.I.; Young, P.R. Clinical and laboratory diagnosis of dengue virus infection. J. Infect. Dis. 2017, 215, S89–S95. [Google Scholar] [CrossRef] [Scilit] [PubMed]
- Hunsperger, E.A.; Yoksan, S.; Buchy, P.; Nguyen, V.C.; Sekaran, S.D.; Enria, D.A.; Pelegrino, J.L.; Vazquez, S.; Artsob, H.; Drebot, M.; et al. Evaluation of commercially available anti-dengue virus immunoglobulin M tests. Emerg. Infect. Dis. 2009, 15, 436–440. [Google Scholar] [CrossRef] [Scilit] [PubMed]
- Sharp, T.M.; Fischer, M.; Munoz-Jordan, J.L.; Paz-Bailey, G.; Staples, J.E.; Gregory, C.J.; Waterman, S.H. Dengue and Zika virus diagnostic testing for patients with a clinically compatible illness and risk for infection with both viruses. MMWR Recomm. Rep. 2019, 68, 1–10. [Google Scholar] [CrossRef] [Scilit] [PubMed]
- Kasbergen, L.M.; Nieuwenhuijse, D.F.; de Bruin, E.; Sikkema, R.S.; Koopmans, M.P.G. The increasing complexity of arbovirus serology: An in-depth systematic review on cross-reactivity. PLoS Neglected Trop. Dis. 2023, 17, e0011651. [Google Scholar] [CrossRef] [Scilit] [PubMed]
- EUROIMMUN Medizinische Labordiagnostika AG. Anti-Dengue Virus ELISA (IgM): Instructions for Use; EI 266b-9601 M.; EUROIMMUN: Lubeck, Germany, 2023. [Google Scholar]
- Chan, Y.; Fornace, K.; Wu, L.; Arnold, B.F.; Priest, J.W.; Martin, D.L.; Chang, M.A.; Cook, J.; Stresman, G.; Drakeley, C. Determining seropositivity-A review of approaches to define population seroprevalence when using multiplex bead assays to assess burden of tropical diseases. PLoS Neglected Trop. Dis. 2021, 15, e0009457. [Google Scholar] [CrossRef] [Scilit] [PubMed]
- Loya, J.M.; Wagner, A.; Pittman, B.; Davis, M.T. Differences in diagnostic rules used to determine borderline personality disorder impact prevalence and associations with clinically relevant variables: Findings from the National Epidemiologic Survey on Alcohol and Related Conditions-III. Personal. Disord. 2024, 15, 60–73. [Google Scholar] [CrossRef] [Scilit] [PubMed]
- Liu, J.; Bao, Y.; DiStefano, C.; Jiang, W. Collapsing sparse responses in Likert-type scale data: Advantages and disadvantages for model fit in CFA. Educ. Psychol. Meas. 2026, 86, 649–673. [Google Scholar] [CrossRef] [Scilit] [PubMed]
- Rogan, W.J.; Gladen, B. Estimating prevalence from the results of a screening test. Am. J. Epidemiol. 1978, 107, 71–76. [Google Scholar] [CrossRef] [Scilit] [PubMed]
- Haile, S.R.; Kronthaler, D. Potential for bias in prevalence estimates when not accounting for test sensitivity and specificity: A systematic review of COVID-19 seroprevalence studies. Int. J. Public Health 2025, 70, 1608343. [Google Scholar] [CrossRef] [Scilit] [PubMed]
- Clopper, C.J.; Pearson, E.S. The use of confidence or fiducial limits illustrated in the case of the binomial. Biometrika 1934, 26, 404–413. [Google Scholar] [CrossRef]
- Clinical and Laboratory Standards Institute. User Protocol for Evaluation of Qualitative Test Performance, 2nd ed.; CLSI Document EP12-A2; CLSI: Wayne, PA, USA, 2008. [Google Scholar]
- World Health Organization. Dengue: Guidelines for Diagnosis, Treatment, Prevention and Control; WHO: Geneva, Switzerland, 2009. [Google Scholar]
- Pan American Health Organization. Recommendations for Laboratory Detection and Diagnosis of Arbovirus Infections in the Region of the Americas; PAHO: Washington, DC, USA, 2022. [Google Scholar]
- Peeling, R.W.; Artsob, H.; Pelegrino, J.L.; Buchy, P.; Cardosa, M.J.; Devi, S.; Enria, D.A.; Farrar, J.; Gubler, D.J.; Guzman, M.G.; et al. Evaluation of diagnostic tests: Dengue. Nat. Rev. Microbiol. 2010, 8, S30–S38. [Google Scholar] [CrossRef] [Scilit] [PubMed]

Disclaimer/Publisher’s Note: The statements, opinions and data contained in all publications are solely those of the individual author(s) and contributor(s) and not of MDPI and/or the editor(s). MDPI and/or the editor(s) disclaim responsibility for any injury to people or property resulting from any ideas, methods, instructions or products referred to in the content. |
© 2026 by the authors. Licensee MDPI, Basel, Switzerland. This article is an open access article distributed under the terms and conditions of the Creative Commons Attribution (CC BY) license.