Data Descriptor

Tracking K-12 and Higher Education Job Postings Through Web-Scraped Longitudinal Data

by
Mark A. Perkins
1,* and
Bolaji Aderibigbe Akorede
2
1
College of Education, University of Colorado at Colorado Springs, Colorado Springs, CO 80918, USA
2
College of Education, University of Wyoming, Laramie, WY 82071, USA
*
Author to whom correspondence should be addressed.
Data 2026, 11(3), 52; https://doi.org/10.3390/data11030052
Submission received: 30 September 2025 / Revised: 1 March 2026 / Accepted: 4 March 2026 / Published: 6 March 2026

Abstract

Teacher shortages and workforce trends in education are critical policy and research concerns. This study presents a robust data collection pipeline that systematically web-scrapes job postings for K-12 and higher education job postings across multiple sources. While the methodology could theoretically be adapted to other job categories, the pipeline is specifically implemented for educational job postings due to platform-specific structures and scraping constraints. Using R, we extract, clean, and archive job postings weekly, compiling them into a longitudinal master dataset that tracks trends in teacher openings over time. Our approach enables monthly trend analysis, providing insights into hiring patterns, subject-area demands, and geographic disparities. By making this dataset available, we contribute both a reproducible methodological pipeline for scraping, cleaning, and standardizing K-12 and higher education job postings, and a validated longitudinal dataset for research and workforce policy applications. This data descriptor details the methodology, data structure, and potential applications for researchers and policymakers monitoring education sector employment trends.

1. Summary

Teacher shortages, particularly in rural and high-need districts, remain a persistent concern in the U.S. education system [1]. These shortages arise from multiple factors, including high rates of burnout, insufficient institutional support, and declining interest in the profession [2,3]. Shortages are especially pronounced in specialized teaching areas (such as STEM, special education, and early childhood education), which have long been recognized as hard-to-staff [2,4].
Despite widespread recognition of these challenges, real-time data systems capable of capturing teacher labor market demand remain limited. Existing sources, including state administrative records, licensure data, and teacher exit surveys, typically provide aggregate statistics at annual or biannual intervals [5,6,7]. Such datasets obscure local variations, prevent timely policy responses, and limit the ability to identify shortages at the school or district level. Moreover, factors contributing to teacher attrition (e.g., workplace stress, professional isolation, and constrained advancement opportunities) are difficult to link to these coarse datasets [8,9].
To address this gap, we developed a longitudinal, high-frequency dataset of teacher and faculty job postings across Wyoming. Data were collected weekly from all 48 public school districts and from nine higher education institutions, capturing trends in labor demand across time, geography, and instructional roles. This approach allows for near-real-time identification of “hard-to-fill” job postings, seasonal hiring patterns, and differences between rural and urban districts. While web-scraped job postings are increasingly used in other industries to monitor labor markets, Education job postings are concentrated on specialized platforms (Frontline, TED K-12, SchoolSpring) whose HTML structures differ from general job boards, making direct adaptation of this pipeline to other sectors nontrivial [10,11].
Our data set provides a scalable, replicable approach for monitoring teacher labor markets with fine-grained temporal and geographic resolution. Weekly archival of job postings, including job title, department, posting date, and institution or district, enables analyses of repeated postings, which may signal structural shortages rather than temporary gaps. By systematically tracking labor demand, this dataset supports research on teacher supply and retention, informs workforce planning, and facilitates policy interventions tailored to district-specific needs [12,13].
Finally, we provide interactive Shiny [14] dashboards that allow users to explore trends across districts and institutions, filter by job category, and visualize longitudinal and current postings. This feature transforms static labor market information into an accessible, user-friendly resource, enabling stakeholders such as researchers, administrators, and policymakers to make data-informed decisions about teacher workforce planning. Beyond presenting a validated dataset, this work details a replicable methodology for collecting, cleaning, and archiving educational job postings, which can guide similar studies in other contexts.

2. Data Description

The data related to Wyoming job postings in higher education and K-12 districts, as well as the R scripts for data processing and dashboard creation, are deposited in a public repository (available here: https://github.com/MPerk78/Wyoming-Education-Jobs-Dashboard) (accessed on 24 September 2025) [15]. The link to the dashboard can be found here (https://marksresearch.shinyapps.io/Wy_Ed_Jobs/) (accessed on 24 September 2025). The dashboard contains two main tabs. One for K12 careers called “K-12 Careers” and one for higher education jobs called “Higher Ed Careers”. Each main tab has sub-tabs, respectively: jobs table, district locations, longitudinal trends, and current trends.
The GitHub repository Wyoming Education Jobs v1.0.0 (https://github.com/MPerk78/Wyoming-Education-Jobs-Dashboard) (accessed on 24 September 2025) organizes all scripts, processed datasets, and dashboard components to facilitate reproducibility and exploration. It contains Wy_Ed_Jobs.rmd, an RMarkdown file that consolidates, cleans, and processes both K-12 and higher education job postings; a Shiny application folder with app.R (or server.R/ui.R), www/tree.jpg, and data folders for current and longitudinal summary datasets; Archived_HE_Data/and Archived_K12_Data/folders storing CSV snapshots of past data points; and otherjobs.xlsx, which includes manually collected K-12 postings. This structure enables readers to reproduce the analyses, run the dashboards locally, and examine historical trends in Wyoming education job postings. A full codebook, included in the GitHub repository, documents each variable with name, type (numeric, nominal, text, datetime, identifier), derivation (scraped or processed), expected values or format, and guidance on missingness. This ensures full transparency and reproducibility of all analyses.”
The tab “Jobs Table”, developed using the datatable and DT packages [16] corresponds to the cleaned dataset of all higher education job postings collected during the study period (see Table 1 for an example). Specifically, the first column, “Institution”, reports the name of the higher education institution posting the job. The second column, “Position”, contains the official title of the posted position. The third column, ‘Location’, reflects the site-defined field, which may represent district, campus, or unit-level organizational labels depending on the platform. Some variation arises from source-specific naming conventions; these are preserved in the cleaned dataset and fully documented in the GitHub codebook. The fourth column, “Posting Date”, indicates the date that the job was posted and is only available if the institution included it. The fifth column, “URL”, reports the date the position was first listed. The tab corresponding to the K12 job postings provide similar information, only classify school districts with “District” instead of institutions.
The second tab of the dashboard, “Institution Locations”, provides a map where the user can locate each of the higher education or K12 institutions. This was developed using leaflet [17]. Each dot on the map allows for a tooltip to examine the name of the Institution as well as a link to its official job postings.
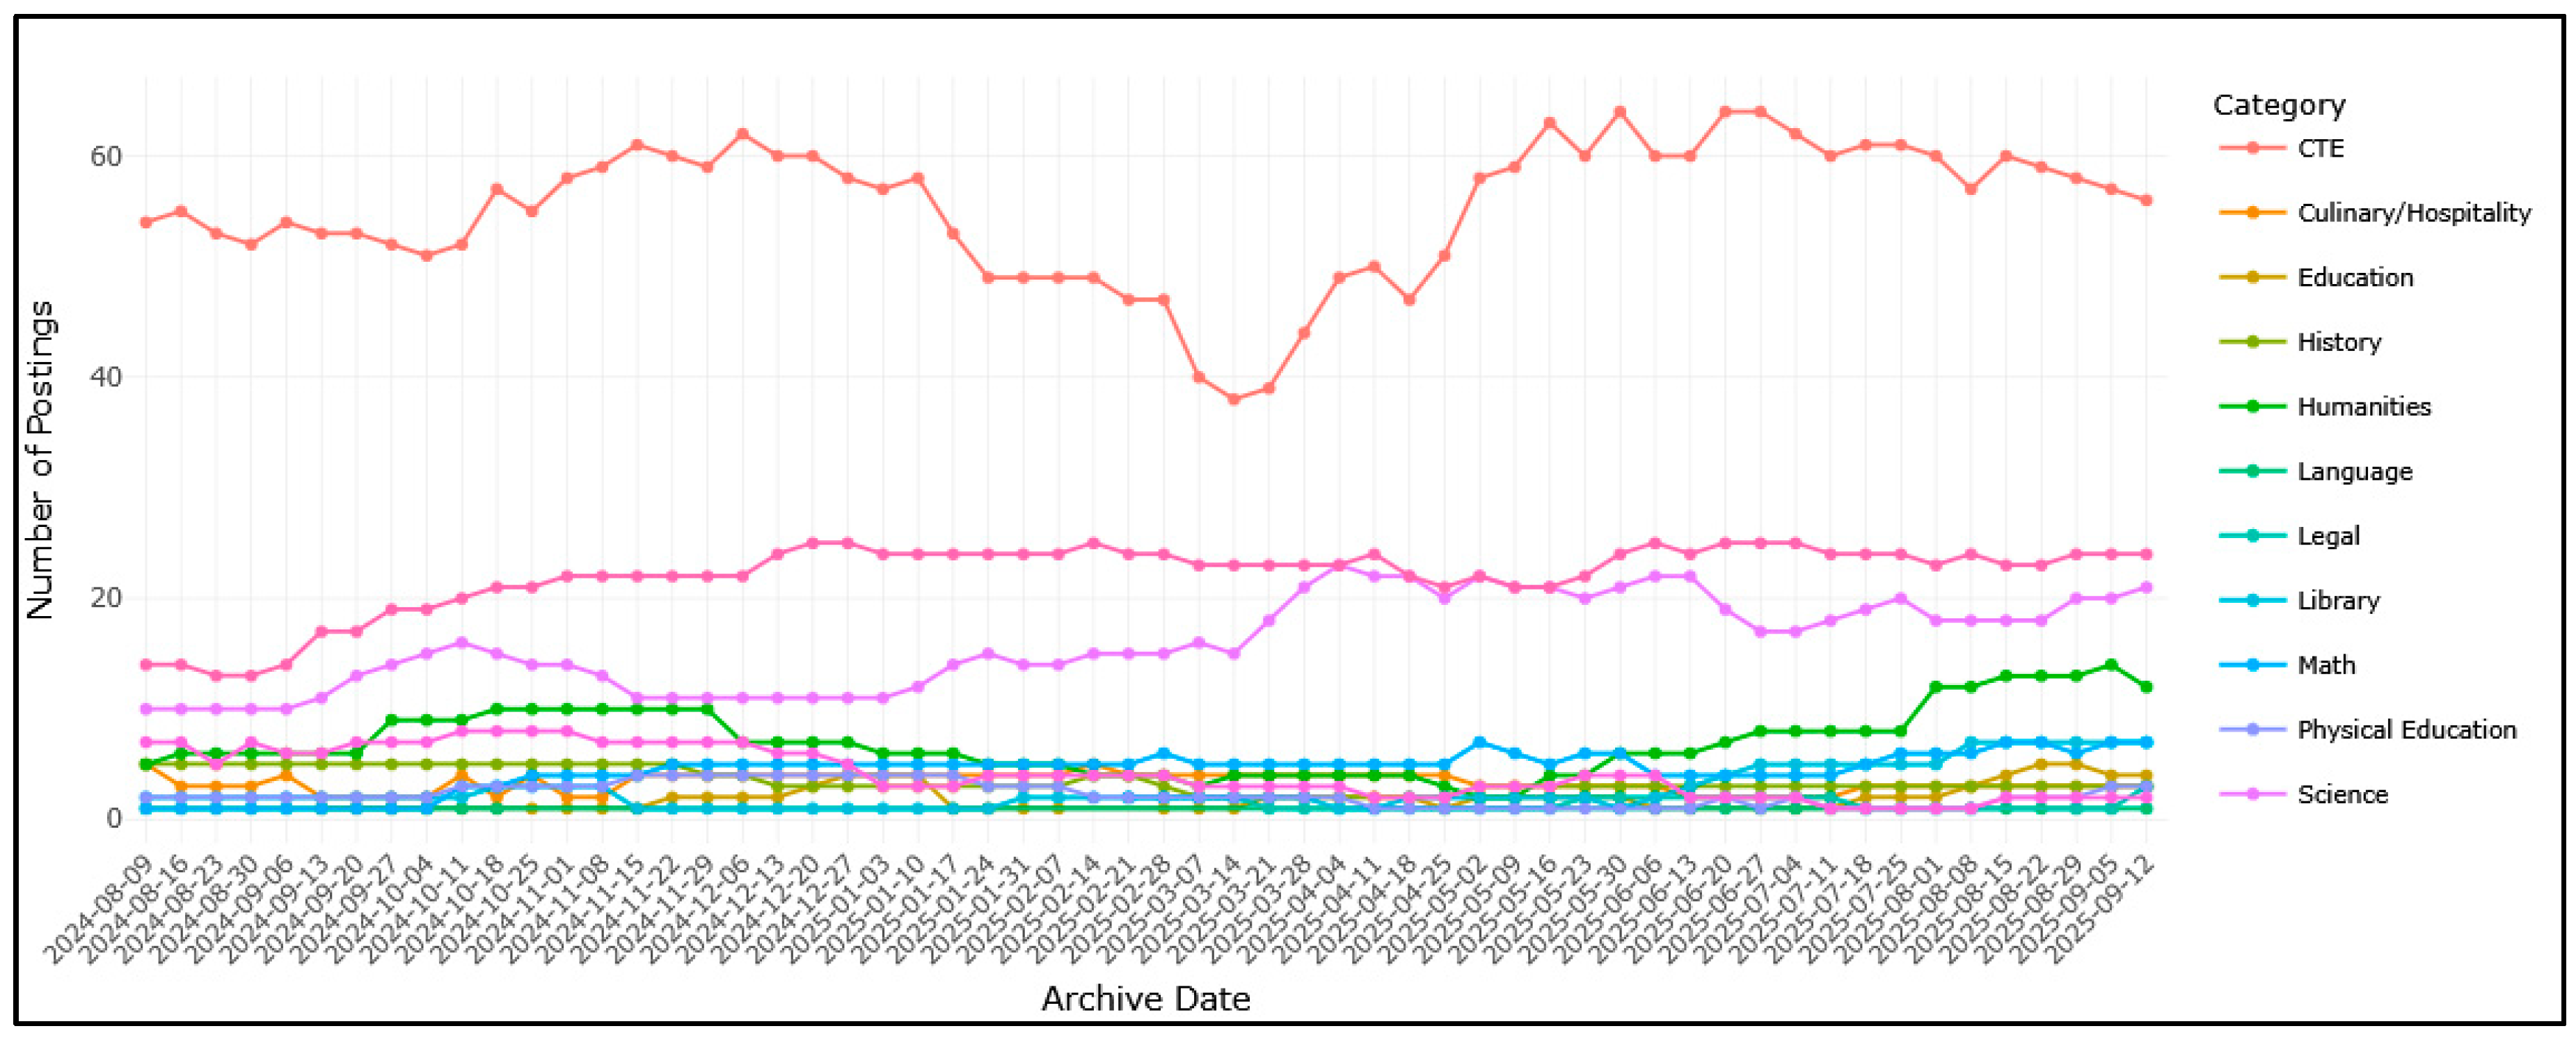
The third tab provides a longitudinal graph of distinct job faculty job counts by category and includes an input control to filter by school district (Figure 1). This tab uses ggplot to generate the graph and plotly to generate tooltips and exportable files, and shinyWidgets allows for filtering by district or institution [14,18,19].
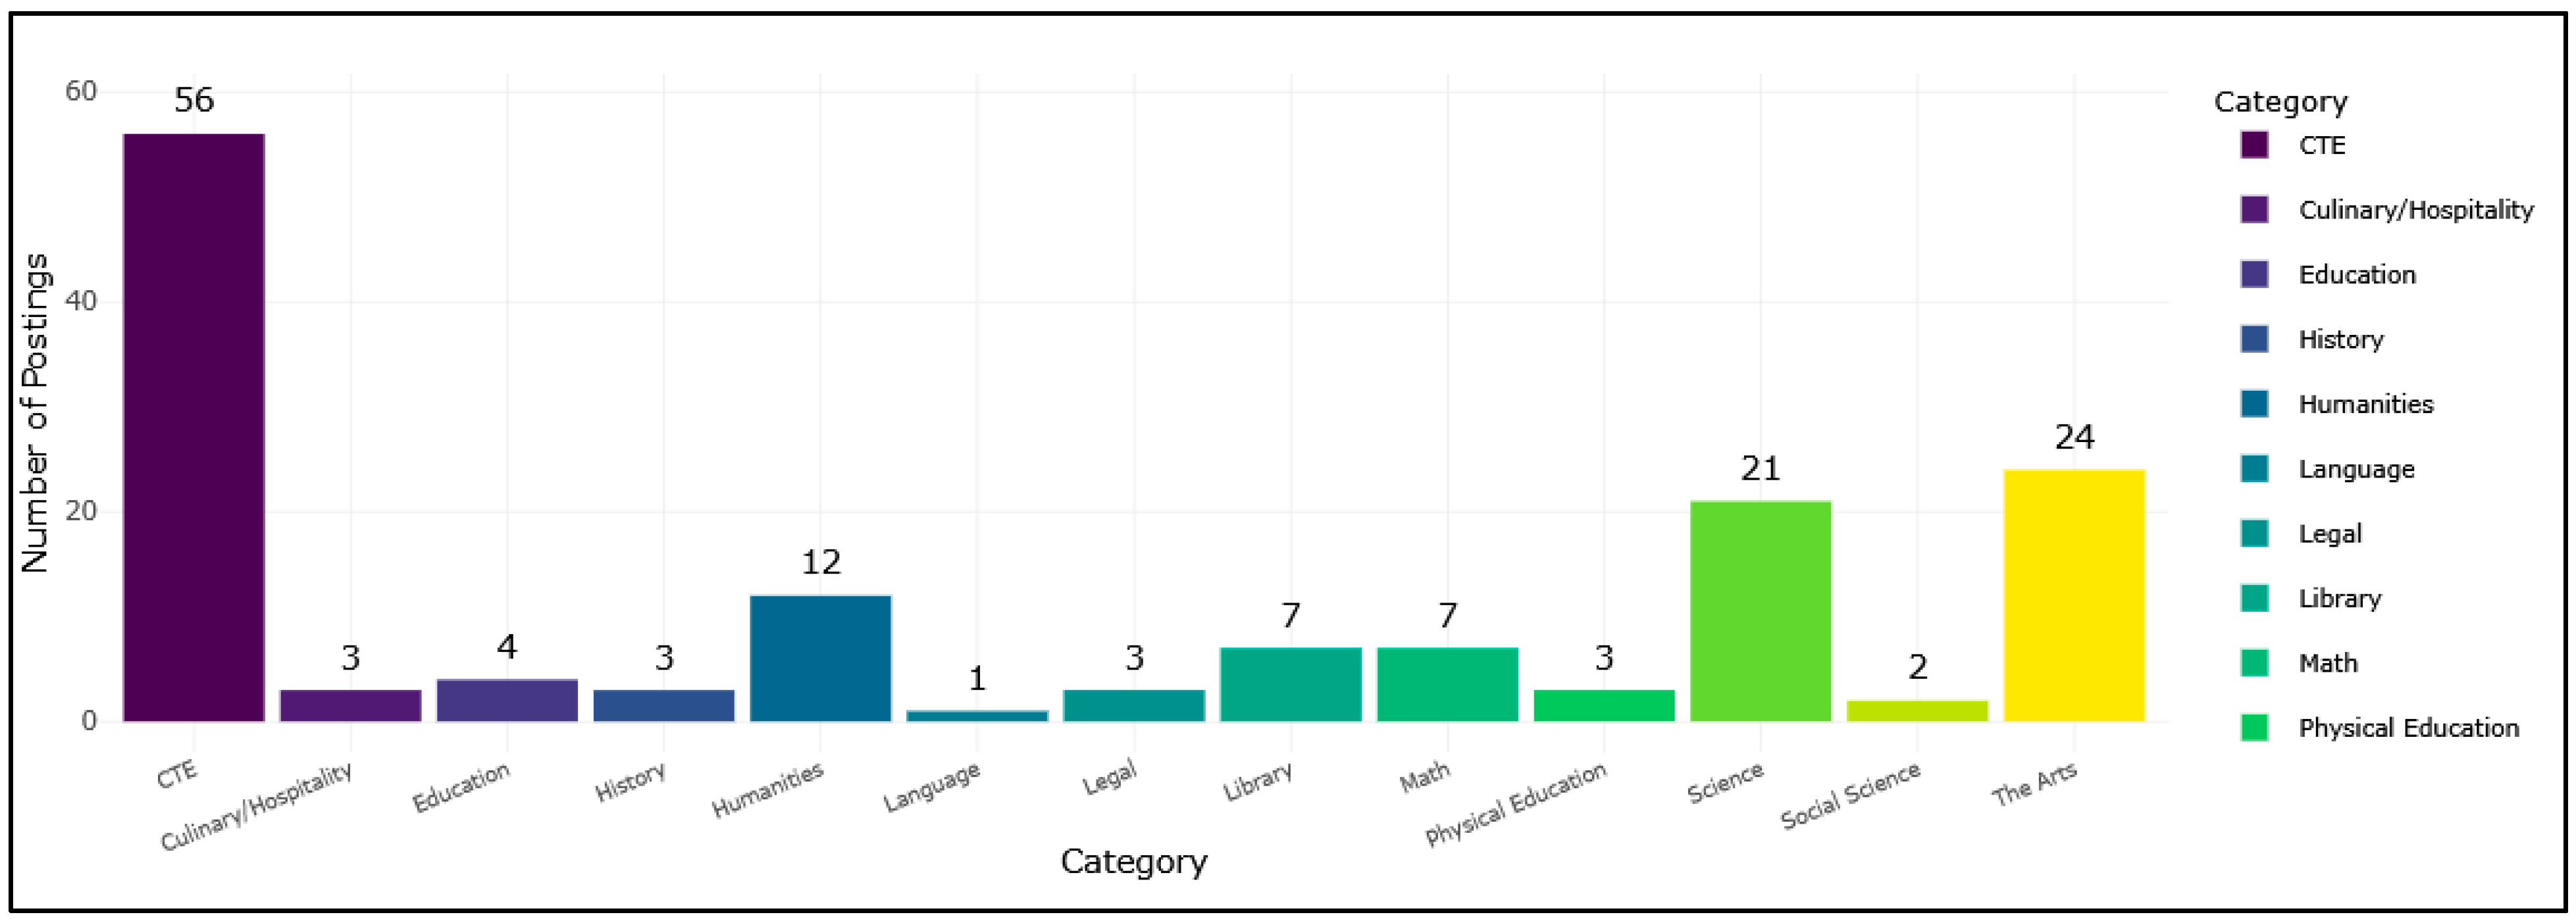
The final tab provides a bar graph of current faculty job postings with an input control to filter by the state (Figure 2). This also uses ggplot, plotly and ShinyWidgets [14,18,19].
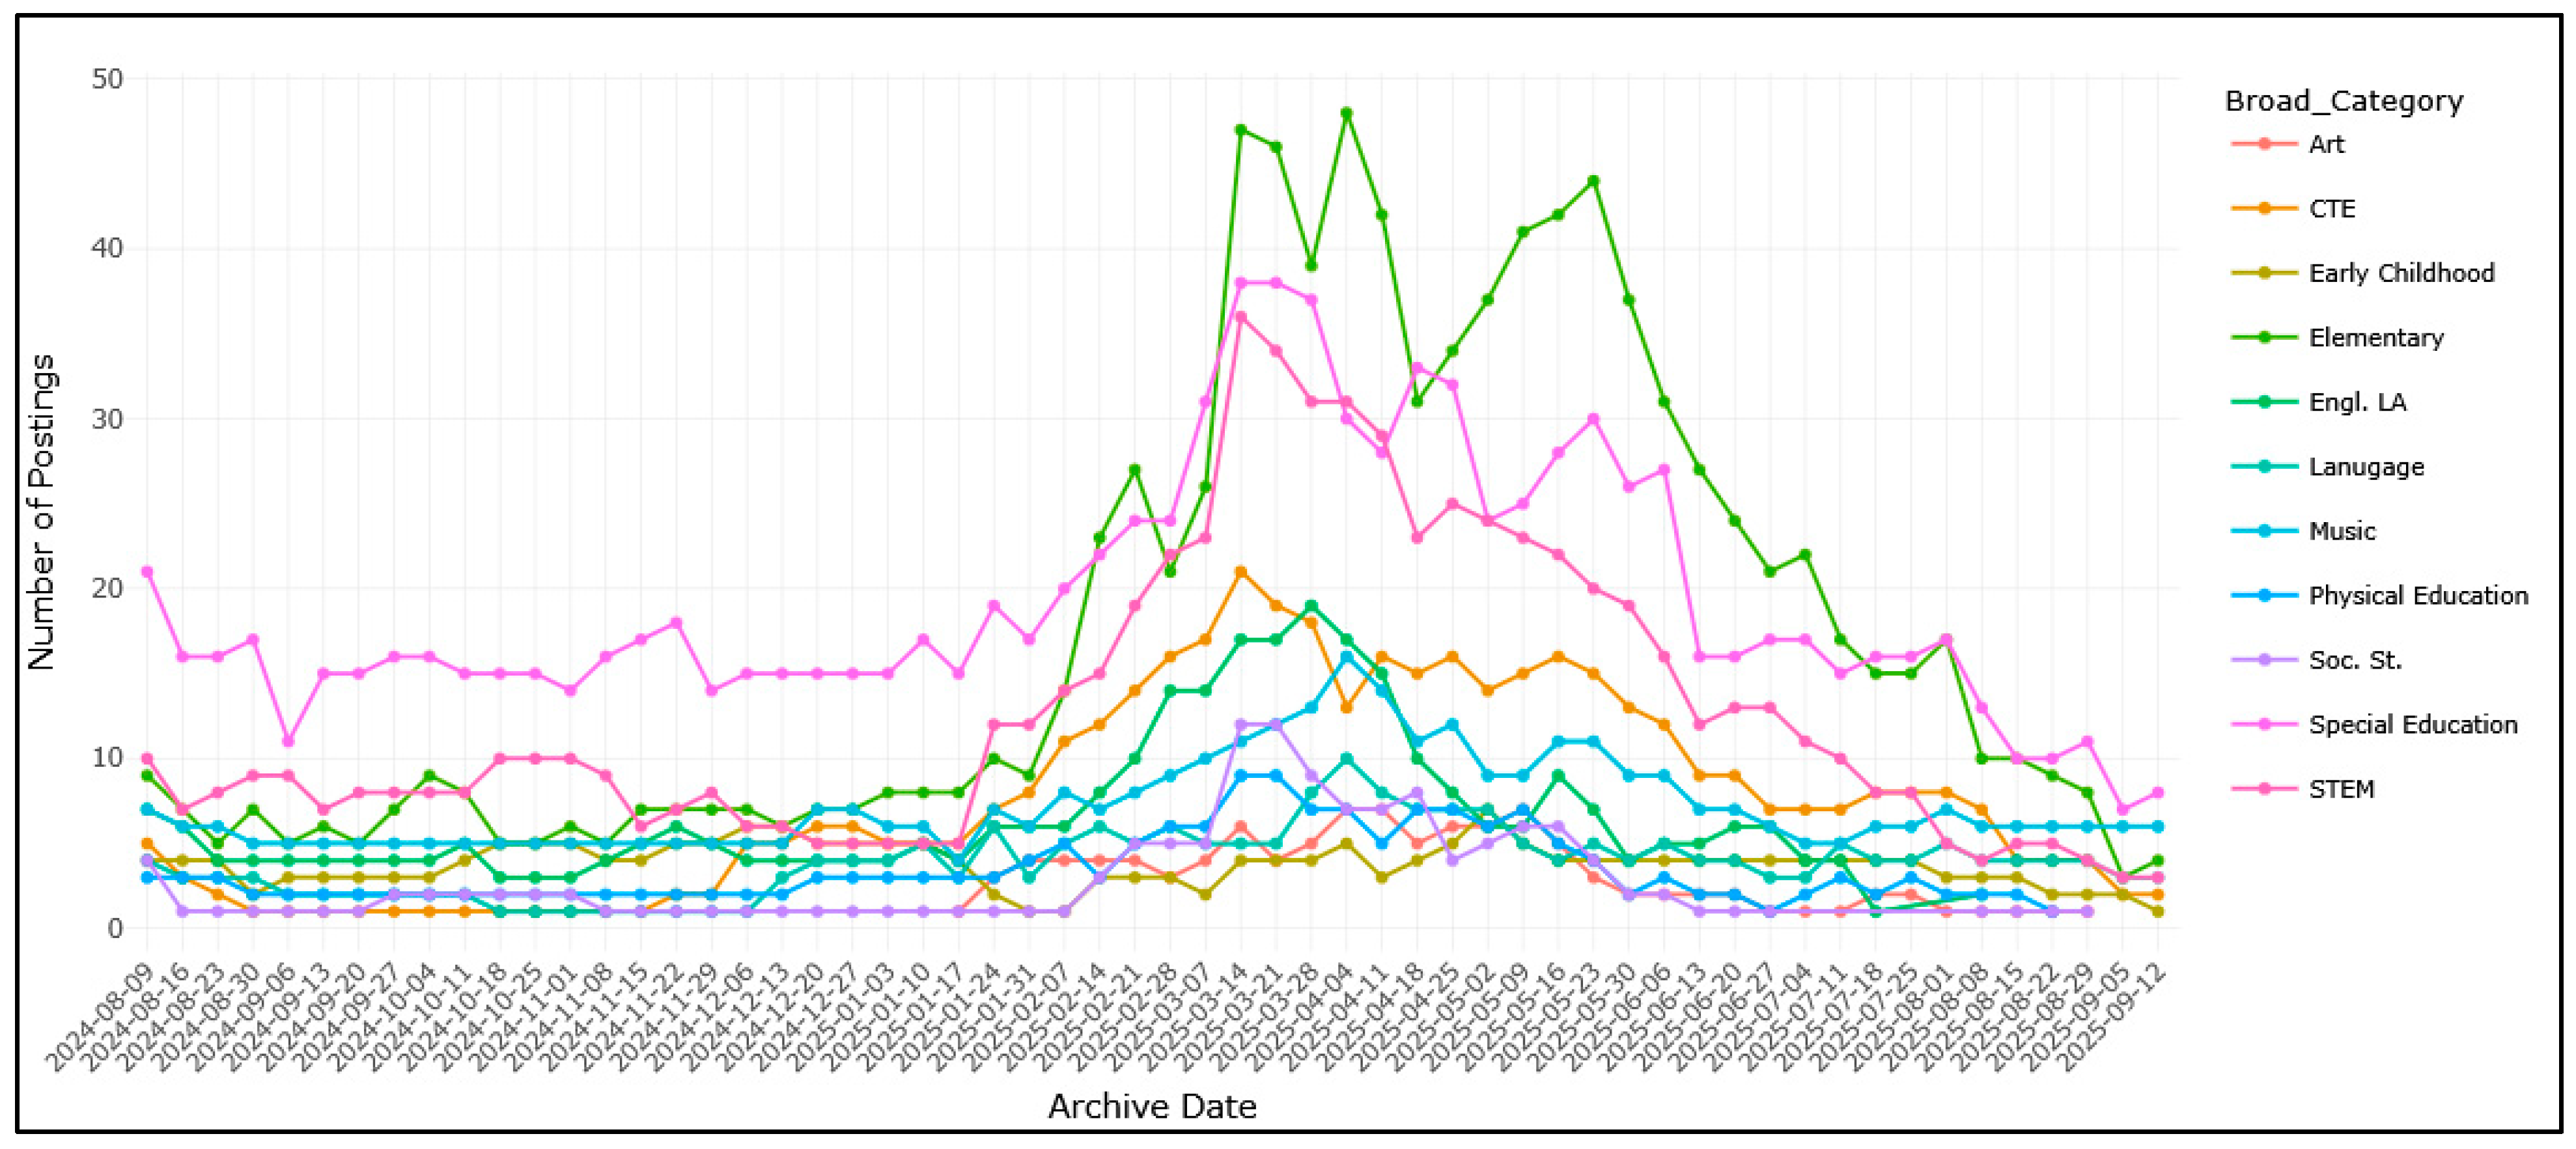
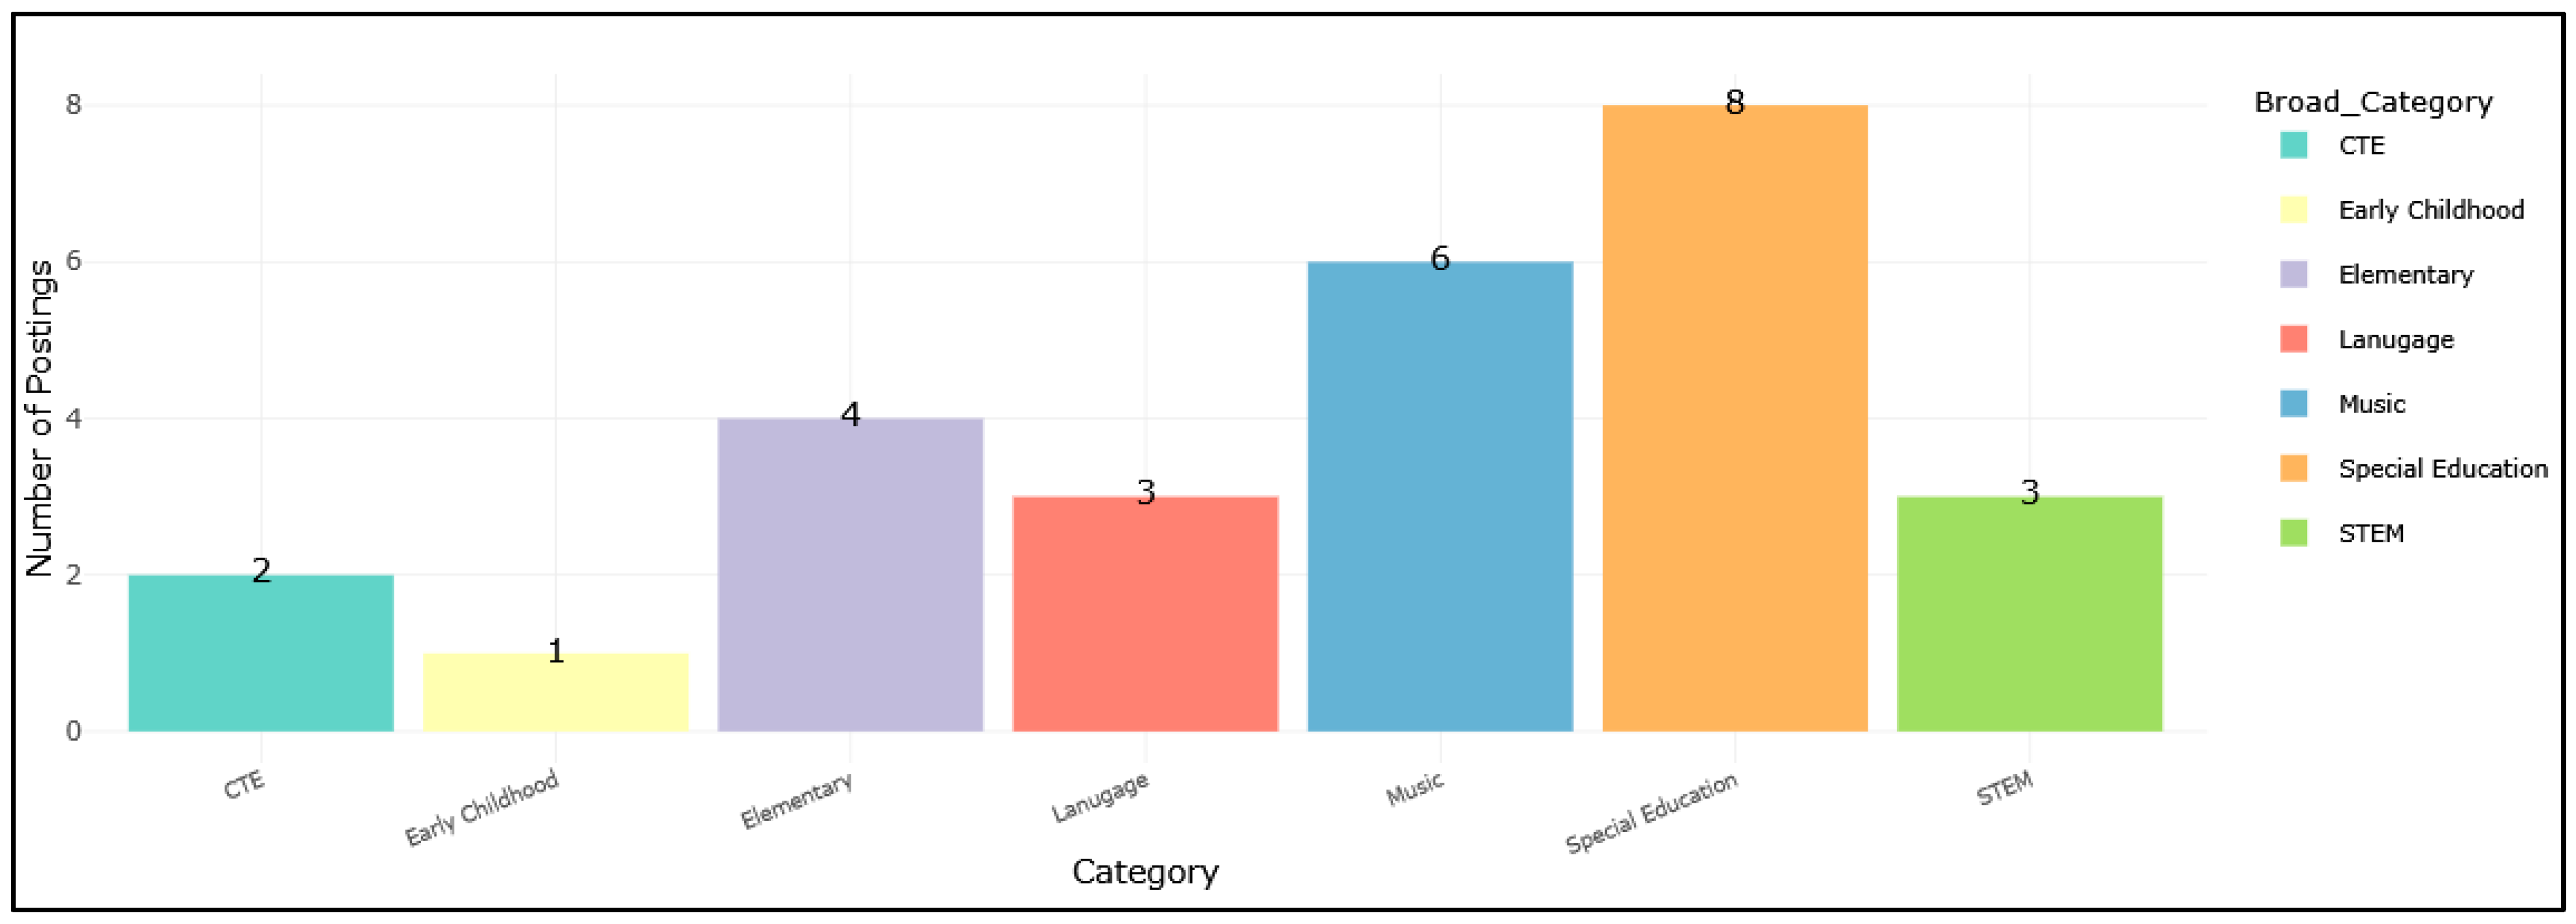
The columns and tabs for the K12 dashboard follow the same structure as for higher education, with the “District” column representing school districts (as opposed to “Institution” in the higher education dashboard) as shown in Figure 3 and Figure 4.

3. Materials and Methods

3.1. Data Acquisition and Scraping (With Manual Scrape Explanation)

Job postings were collected directly from the career webpages of nine Wyoming higher education institutions and 48 statewide K-12 districts. Most job postings were retrieved using automated web scraping in R, leveraging the RSelenium and rvest packages to ensure that dynamic page content and multi-page listings were fully captured [20,21]. In cases where automated scraping was not feasible (such as smaller rural district websites with non-standard HTML or password-protected portals), data were collected manually. Manual collection involved identifying each job posting’s URL and metadata, which were then integrated into the same standardized CSV structure used for automated scraping.
Scraping relied on platform-specific CSV input files for both K–12 and higher education. Each CSV contained columns for the institution or district name and the corresponding job site URL. The scraper iteratively processed each URL, allowing bugs or changes in website structure to be addressed without affecting other datasets.
  • K-12 Scraping: K-12 scraping was divided by platform (Frontline Education, TedK12, Springer School, and small rural district-specific portals) [22,23,24]. A subset of districts required manual scraping because their websites had unique designs or dynamic content that could not be consistently automated.
  • Higher Education Scraping: Higher education scraping followed a similar modular approach, with separate routines for each institution and platform including Government Jobs, School Jobs, People Admin, and unique job postings for individual institutions [25,26,27,28,29,30].
All datasets were structured with columns for the institution or district and the posting URL. Each posting was archived with its retrieval date to ensure reproducibility. The modular design of both K-12 and higher education scraping scripts allows each module to be rerun independently, enabling updates to individual sites without rerunning the full pipeline.
These sources were selected to capture most publicly available educational job postings and allow automated scraping where possible, with manual collection applied to unique or non-standard sites. The modular R scripts and Shiny app demonstrate the automation and cleaning routines applied across all platforms. While the modular design could theoretically be adapted to other job categories, unique platform structures and dynamic content in educational portals necessitate platform-specific scraping routines.

3.2. Data Cleaning and Standardization

Raw datasets were processed in R using dplyr and tidyr [31,32]. Data cleaning included:
  • Removal of duplicate postings.
  • Standardization of institution and district names.
  • Normalization of date fields to YYYY-MM-DD format.
  • Verification of posting URLs.
  • Categorization of job postings using keyword-based classification.
  • Cleaned datasets were exported as CSV files for subsequent analysis and dashboard deployment.
  • Normalization of date fields to YYYY-MM-DD when absolute dates are available; relative dates (e.g., “3 days ago” or “more than 30 days ago”) are converted into categorical ranges and tagged with the scrape date, enabling longitudinal and cross-sectional analyses even when exact posting dates are unavailable (see repository link in Section 5).

3.3. Analysis and Visualization

Descriptive statistics and exploratory analyses were conducted in R using ggplot2 and lubridate [18,33]. Analyses included:
  • Counts of job postings by institution/district and job type.
  • Monthly and yearly posting trends.
  • Summary statistics including mean, median, and range of job postings per institution or district.

3.4. Dashboard Development

Interactive dashboards were developed using the Shiny R package [14]. Both the higher education dashboard (WY_HE_Career) and the K-12 dashboard (WYK12) allow users to filter job postings by institution or district, job type, and posting date, as well as download filtered datasets for further analysis.
To enable geospatial visualization, each dashboard incorporates a CSV file containing the coordinates (latitude and longitude) of all districts and higher education institutions (salarymap2.csv). These coordinates allow the dashboards to display job postings on interactive maps using the leaflet package, with markers showing district or institution names, salary ranges, and additional metadata. The dashboards also include reactive plots summarizing longitudinal and current job posting trends, powered by ggplot2 and plotly, allowing dynamic filtering by district or institution.
The modular Shiny code is structured so that updates to the underlying job posting data or coordinate files automatically refresh the visualizations, maintaining up-to-date and reproducible dashboards.

3.5. Reproducibility

All scripts used for data collection, cleaning, analysis, and dashboard creation are structured for reproducibility. New data can be incorporated by rerunning the scraping and processing routines, ensuring that dashboards and datasets remain current without rerunning the full pipeline.

3.6. Limitations

The accuracy of these datasets depends on how frequently and accurately institutions and school districts update their own job postings. As such, the data represent an accumulation of publicly posted job postings and may not perfectly reflect actual job postings. Additionally, some job postings may contain errors introduced at the time of entry by the employer. Consequently, this dataset should be interpreted as a reflection of publicly available job postings rather than a definitive record of staffing needs and used primarily as an estimation of labor demand.

4. Ethical Considerations/Permissions

4.1. Data Sources

Data were collected exclusively from publicly accessible websites and institutional portals, covering both K-12 and higher education job postings. K-12 sources included Frontline Education, SchoolSpring, and district-specific portals powered by TedK12, as well as direct scraping from small rural district websites [22,23,24]. Higher education job postings were collected from a variety of platforms: Laramie County Community College via GovernmentJobs.com, Casper College and Central College via SchoolJobs.com, Western Wyoming College, Gillette College, and Eastern Wyoming College via PeopleAdmin.com, Sheridan College through its own portal, Northwest College via SimpleHire, and the University of Wyoming via the Oracle Cloud-based employment system (EEiK) institutions [25,26,27,28,29,30].

4.2. Ethical Compliance

All data collection adhered to the terms of service for each website. Only publicly accessible job postings were used; no login-protected or private information was accessed. Personal identifiers were possible as job postings were not about individual humans. The scraping pipeline was designed to minimize server load and avoid disruption to source sites. Researchers using this dataset should ensure compliance with any copyright, licensing, or privacy regulations associated with the source websites.

5. Data Availability

The code and all associated files (RMarkdown, Shiny app, Excel files, and archived CSVs) are available at https://github.com/MPerk78/Wyoming-Education-Jobs-Dashboard (accessed on 24 September 2025). Table 2 provides notes on each dataset. The higher education and K12 webscraping and data munging files are consolidated into one RMarkdown file and the dashboard is consolidated into one Shiny application. For the longitudinal tab of each dashboard, the user will need to set up a separate folder of archived data and have at least two time points.
The GitHub repository is organized as follows:
  • Wy_Ed_Jobs.rmd—RMarkdown file for scraping, cleaning, and consolidating both K-12 and higher education job postings.
  • Wy_Ed_Jobs—Shiny application folder containing app.R (or server.R/ui.R), www/tree.jpg, and data folders for current and summary longitudinal datasets.
  • Archived_HE_Data/ and Archived_K12_Data/—CSV archives of past data snapshots to support reproducibility.
  • Job scraping links—Links to job scraping sites as mentioned
  • otherjobs.xlsx—manually collected K-12 job postings.

Author Contributions

Conceptualization, M.A.P.; methodology, M.A.P.; software, M.A.P.; validation, M.A.P. and B.A.A.; formal analysis, M.A.P. and B.A.A.; investigation M.A.P. and B.A.A.; resources, M.A.P. and B.A.A.; data curation, M.A.P.; writing—original draft preparation, M.A.P. and B.A.A.; writing—review and editing M.A.P. and B.A.A.; visualization, M.A.P.; supervision, M.A.P. and B.A.A.; project administration, M.A.P. and B.A.A. All authors have read and agreed to the published version of the manuscript.

Funding

This research received no external funding.

Data Availability Statement

The data can be found on the GitHub repository: https://github.com/MPerk78/Wyoming-Education-Jobs-Dashboard (accessed on 24 September 2025). These data were generated through public sources using open-source software.

Conflicts of Interest

The authors declare no conflicts of interest.

References

  1. Nguyen, T.D. Linking school organizational characteristics and teacher retention: Evidence from repeated cross-sectional national data. Teach. Teach. Educ. 2021, 97, 103220. [Google Scholar] [CrossRef] [Scilit]
  2. Richards, J. Teacher Stress and Coping Strategies: A National Snapshot. Educ. Forum West Lafayette Ind. 2012, 76, 299–316. [Google Scholar] [CrossRef] [Scilit]
  3. Ryan, S.V.; Pendergast, L.L.; Schwing, S.; von der Embse, N.P.; Saeki, E.; Segool, N. Leaving the teaching profession: The role of teacher stress and educational accountability policies on turnover intent. Teach. Teach. Educ. 2017, 66, 1–11. [Google Scholar] [CrossRef] [Scilit]
  4. Madigan, D.J.; Kim, L.E. Towards an understanding of teacher attrition: A meta-analysis of burnout, job satisfaction, and teachers’ intentions to quit. Teach. Teach. Educ. 2021, 105, 103425. [Google Scholar] [CrossRef] [Scilit]
  5. Bleiberg, J.; Kraft, M.A. What Happened to the k-12 Education Labor Market During Covid? The Acute Need for Better Data Systems (Working Paper) [Internet]; Anneberg Institute at Brown University: Providence, RI, USA, 2022. [Google Scholar] [CrossRef]
  6. Gersten, R.; Keating, T.; Yovanoff, P.; Harniss, M.K. Working in Special Education: Factors that Enhance Special Educators’ Intent to Stay. Except. Child. 2001, 67, 549–567. [Google Scholar] [CrossRef] [Scilit]
  7. Lovaglio, P.G.; Mezzanzanica, M.; Colombo, E. Comparing time series characteristics of official and web job vacancy data. Qual. Quant. 2020, 54, 85–98. [Google Scholar] [CrossRef] [Scilit]
  8. Guarino, C.M.; Santibañez, L.; Daley, G.A. Teacher Recruitment and Retention: A Review of the Recent Empirical Literature. Rev. Educ. Res. 2006, 76, 173–208. [Google Scholar] [CrossRef] [Scilit]
  9. Sass, D.A.; Seal, A.K.; Martin, N.K. Predicting teacher retention using stress and support variables. J. Educ. Adm. 2011, 49, 200–215. [Google Scholar] [CrossRef] [Scilit]
  10. Beręsewicz, M.; Cherniaiev, H.; Mantaj, A.; Pater, R. Text analysis of job offers for mismatch of educational characteristics to labour market demands. Qual. Quant. 2024, 58, 1799–1825. [Google Scholar] [CrossRef] [Scilit]
  11. Galloway, M.L. Teacher Push Out: Lower Wages, Longer Hours, and State Freeriding on Teachers. Ph.D. Thesis, California State University, Sacramento, CA, USA, 2021. Available online: https://scholars.csus.edu/esploro/outputs/doctoral/Teacher-push-out-lower-wages-longer/99257898315301671 (accessed on 15 August 2025).
  12. Hise, M. Attrition, Mobility, and Retention Patterns of Public-School Teachers. Ph.D. Thesis, Pepperdine University, Malibu, CA, USA, 2022. Available online: https://digitalcommons.pepperdine.edu/etd/1231/ (accessed on 17 July 2025).
  13. Kangas-Dick, K.; O’Shaughnessy, E. Interventions that promote resilience among teachers: A systematic review of the literature. Int. J. Sch. Educ. Psychol. 2020, 8, 131–146. [Google Scholar] [CrossRef] [Scilit]
  14. Sievert, C. Interactive Web-Based Data Visualization with R, Plotly, and Shiny; Chapman and Hall/CRC: Boca Raton, FL, USA, 2020. [Google Scholar]
  15. Wyoming Education Careers [Internet]. Available online: https://marksresearch.shinyapps.io/Wy_Ed_Jobs/ (accessed on 25 September 2025).
  16. Xie, Y.; Cheg, J.; Tan, X. DT: A Wrapper of the JavaScript Library “DataTables” [Internet]. 2022. Available online: https://CRAN.R-project.org/package=DT (accessed on 4 July 2025).
  17. Cheng, J.; Karambelkar, B.; Xie, Y. Leaflet: Create Interactive Web Maps with the JavaScript “Leaflet” Library [Internet]. 2021. Available online: https://CRAN.R-project.org/package=leaflet (accessed on 14 May 2025).
  18. Kassambara, A. ggpubr: “ggplot2” Based Publication Ready Plots [Internet]. 2023. Available online: https://CRAN.R-project.org/package=ggpubr (accessed on 13 June 2025).
  19. Perrier, V.; Meyer, F.; Granjon, D. shinyWidgets: Custom Inputs Widgets for Shiny, Version 0.9.0; dreamRs: Frankston, Australia, 2023. [Google Scholar]
  20. Harrison, J. RSelenium: R Bindings for ‘Selenium WebDriver’ [Internet]. 2022. Available online: https://cran.r-project.org/web/packages/RSelenium/index.html (accessed on 30 May 2025).
  21. Wickham, H. Rvest: Easily Harvest (Scrape) Web Pages [Internet]. 2024. Available online: https://CRAN.R-project.org/package=rvest (accessed on 4 September 2025).
  22. Finding Teaching Jobs and Other Education Jobs [Internet]. Available online: https://www.schoolspring.com/#environment.basedomain# (accessed on 25 September 2025).
  23. Homepage [Internet]. Frontline Education. Available online: https://www.frontlineeducation.com/ (accessed on 25 September 2025).
  24. Sign In—TalentEd [Internet]. Available online: https://elmoreco.tedk12.com/sso/Account/Login?ReturnUrl=%2Fsso%2F%3Fpid%3D9%26productUrl%3DaHR0cHM6Ly9lbG1vcmVjby50ZWRrMTIuY29tL1JlY29yZHM%3D (accessed on 25 September 2025).
  25. GovernmentJobs|City, State, Federal & Public Sector Jobs [Internet]. Available online: https://www.governmentjobs.com/ (accessed on 25 September 2025).
  26. School Jobs|Faculty and Administrative Jobs [Internet]. Available online: https://www.schooljobs.com/ (accessed on 25 September 2025).
  27. PeopleAdmin. PeopleAdmin—Fulfilling the Mission of Higher Education [Internet]. Available online: https://peopleadmin.com/ (accessed on 25 September 2025).
  28. Sheridan College Applicant Portal|Search Jobs [Internet]. Available online: https://jobs.sheridan.edu/postings/search (accessed on 25 September 2025).
  29. Northwest College Applicant Portal|Search Jobs [Internet]. Available online: https://northwestcollege.simplehire.com/postings/search?page= (accessed on 25 September 2025).
  30. UW Candidate Experience Careers [Internet]. UW Candidate Experience. Available online: https://eeik.fa.us2.oraclecloud.com/hcmUI/CandidateExperience/en/sites/CX_1/jobs (accessed on 25 September 2025).
  31. Wickham, H.; Averick, M.; Bryan, J.; Chang, W.; McGowan, L.D.; François, R.; Grolemund, G.; Hayes, A.; Henry, L.; Hester, J.; et al. Welcome to the tidyverse. J. Open Source Softw. 2019, 4, 1686. [Google Scholar] [CrossRef] [Scilit]
  32. Wickham, H.; Francois, R.; Henry, L.; Müller, K. dplyr: A Grammar of Data Manipulation [Internet]. 2021. Available online: https://CRAN.R-project.org/package=dplyr (accessed on 10 August 2025).
  33. Grolemund, G.; Wickham, H. Dates and times made easy with lubridate. J. Stat. Softw. 2011, 40, 1–25. [Google Scholar] [CrossRef] [Scilit]
Figure 1. Interactive longitudinal dashboard of Wyoming higher education job faculty postings. Users can filter by institution.
Data 11 00052 g001
Figure 2. Interactive dashboard of current higher education faculty job postings. Users can filter for institution.
Data 11 00052 g002
Figure 3. Interactive longitudinal dashboard of Wyoming K-12 job teacher postings. Users can filter by school district.
Data 11 00052 g003
Figure 4. Interactive dashboard of current K12 teaching job postings. Users can filter for district.
Data 11 00052 g004
Table 1. Example format of the jobs table tabs.
InstitutionPositionLocationPosting DateURL
Casper CollegeDirector of Financial AidCasper, WY, USA12 September 2025https://www.schooljobs.com/careers/caspercollege (accessed on 24 September 2025)
Central Wyoming CollegeAdjunctRiverton, WY, USA10 September 2025https://www.schooljobs.com/careers/cwc (accessed on 24 September 2025)
Laramie County Community CollegeMathematics InstructorCheyenne, WY, USA31 August 2025https://www.governmentjobs.com/careers/lcccwy?page= (accessed on 24 September 2025)
Table 2. Overview of data processing and dashboard components.
Tab/DatasetData TypeNote
Wyoming K-12 & Higher Ed.Job Scraper and Longitudinal Consolidatorotherjobs.xlsx contains manually collected K-12 postings. Archived data for each time point is stored in separate CSVs for both K-12 and higher education. The single RMarkdown file consolidates, cleans, and processes all datasets.
Wyoming K-12 & Higher Ed.Shiny ApplicationApplications draw from the processed files generated by the consolidated RMarkdown script. Includes dashboards for both K-12 and higher education, with current and longitudinal views.
Disclaimer/Publisher’s Note: The statements, opinions and data contained in all publications are solely those of the individual author(s) and contributor(s) and not of MDPI and/or the editor(s). MDPI and/or the editor(s) disclaim responsibility for any injury to people or property resulting from any ideas, methods, instructions or products referred to in the content.