


Abstract
Research on wine perception shows that extrinsic information can alter reported sensory perceptions. This study adopts a repeated measures design to quantify how label information affects perceived quality relative to blind tasting. Forty-five adult tasters evaluated eight PDO Málaga wines in two tasting contexts: blind and label-informed conditions. Participants rated the perceived quality of aroma, colour, and flavour using 5-point scales, capturing evaluative judgments rather than intensity. Mean global sensory scores and attribute-level evaluations were analysed to assess context-related effects. The results reveal a robust and consistent effect of informational context: label disclosure systematically increased perceived quality ratings compared with blind tasting. Difference-based analysis (informed − blind) indicates that this effect varies across wines and attributes, acting primarily as an amplification mechanism rather than fundamentally altering relative evaluations. At the same time, colour wines were clearly differentiated under blind conditions, confirming the presence of intrinsic sensory variation independent of contextual cues. Sensory attributes showed strong correlations (r > 0.95), indicating an integrated perceptual response, but also suggesting limited discriminant capacity among attributes and a tendency toward global evaluative judgments. No statistically significant differences were observed between consumers and sommeliers, although subgroup comparisons should be interpreted with caution given the limited size of the expert sample. Overall, the findings are consistent with expectation-driven perception, in which labelling cues correlate (r > 0.95), indicating an integrated perceptual response; however, this also suggests limited discriminant capacity between attributes and a tendency toward global evaluative judgments. No statistically robust differences were observed between consumers and sommeliers, although subgroup comparisons should be interpreted with caution due to the limited size of the expert sample. The study suggests the relevance of aligning sensory profiles with extrinsic communication strategies in wine marketing and PDO contexts, while acknowledging limitations in sample composition, measurement scales, and the use of self-reported sensory ratings.
1. Introduction
The perception of wine involves a multisensory process in which visual, olfactory, and gustatory stimuli interact with cognitive expectations and contextual information, thereby shaping quality judgments and preferences [1,2,3,4,5,6]. In this context, blind tasting has traditionally been used to isolate the intrinsic sensory properties of wine by minimising the influence of extrinsic cues such as brand, origin, labelling, or price [7]. However, empirical evidence demonstrates that these cues systematically modify perception, leading to higher ratings when information is provided to tasters [8,9]. Expectation effects are particularly relevant in the case of wine, where symbolic and informational attributes play a central role in consumer evaluation [10,11,12].
Despite this evidence, significant empirical gaps remain. First, many studies rely on between-subjects designs or focus on individual extrinsic cues, which limits the ability to isolate perceptual changes within the same individual. Second, there is still insufficient empirical evidence on how informational context simultaneously affects multiple sensory attributes (e.g., aroma, colour, and flavour) under controlled conditions involving repeated measures [13,14]. Third, the interaction between expectation effects and the extent to which intrinsic sensory differentiation is maintained during blind tasting conditions has received limited attention [15,16,17]. Recent studies further confirm the role of extrinsic cues such as labelling in shaping perceived quality under controlled tasting conditions [18].
In this context, Protected Designations of Origin (PDOs) constitute a particularly suitable empirical setting for research, as they combine intrinsic product differentiation with powerful extrinsic signalling mechanisms linked to origin, tradition, and quality certification [19,20]. The Málaga PDO is especially relevant due to its structural diversity, encompassing both traditional sweet and fortified wines (PDO Málaga) and a wide range of still wines (PDO Sierras de Málaga), produced under heterogeneous environmental and technological conditions. This diversity makes it an ideal case for analysing the interaction between intrinsic sensory variation and informational framing [21,22].
Against this background, the present study examines how the disclosure of label information influences the declared sensory evaluations of wines, while holding both the panel of tasters and the wine samples constant. A total of 45 adult participants, including 8 professional sommeliers, evaluated eight wines using structured sensory scales under two conditions: blind tasting and informed tasting (with label revealed). This design allows for the direct estimation of within-subject changes attributable to informational context.
The overarching aim of this study is to assess the extent to which informational cues modify sensory evaluations and to determine whether these effects vary across attributes and individuals. To address this objective, the following hypotheses are proposed:
H1.
Compared to blind tasting, label information increases reported sensory ratings.
H2.
The magnitude of informational effects differs across sensory attributes.
H3.
Wines remain significantly differentiated under blind tasting conditions, reflecting intrinsic sensory variation independent of context.
H4.
Tasters exhibit heterogeneous sensitivity to extrinsic cues, giving rise to identifiable segments.
By focusing on a controlled repeated measures design within a PDO context, this study contributes to the literature by disentangling intrinsic sensory differences from expectation-driven effects. It may provide useful insights for both sensory science and wine marketing strategies [9,17].
2. Framework
Over the past three decades, wine sensory analysis has moved from a primarily quality-control practice to a multidisciplinary field that integrates perception science, consumer psychology, and advanced statistics [9,23,24]. This shift reflects a growing need to understand how consumers experience wine not only through measurable product attributes, but also through the cognitive and emotional contexts in which tasting occurs. Cross-national comparative work shows that perceived quality and sensory descriptors are shaped by culture and prior experience, underscoring the need to situate evaluations within their informational and social contexts [25].
Recent studies on “natural” wines in Spain exemplify this multidimensional approach: they examine differences between natural and conventional wines from sensory, chemical, and environmental perspectives and link them to producers’ values and processing choices [26,27]. Parallel applications to other fermented beverages, such as targeted sensory work on Canary Islands cider, demonstrate how context-sensitive sensory methods can characterise typicity and territorially grounded profiles, reinforcing their strategic value for origin-based differentiation [28].
At a theoretical level, wine perception emerges from the integration of visual, olfactory, and gustatory inputs with expectations and prior knowledge, including brand beliefs and category schemas [29,30]. Classic demonstrations show that colour manipulation or naming can redirect sensory descriptions [31]. At the same time, neuroscience and behavioural studies indicate that extrinsic cues—such as price and labelling—can modulate both reported pleasantness and neural correlates of reward [9,32,33]. Importantly, these effects are not merely “noise” around a stable sensory core; they are constitutive of real-world experience because consumers rarely drink wine in information-free contexts.
Methodologically, blind tasting is the reference approach for minimising bias from brand, origin, type, or price and for isolating intrinsic sensory differences [34,35,36,37]. Informed (“open” or “directed”) tastings, by contrast, approximate marketplace conditions in which designations of origin and label design are known; as a result, expectation-driven shifts can appear in hedonic and attribute ratings [8,29]. Evidence from behavioural economics and wine research reinforces this point: price signals change reported liking even among experienced tasters, and higher prices do not necessarily translate into higher hedonic scores under blind conditions [38,39]. Together, these studies motivate the combined use of blind and informed protocols to separate intrinsic product differentiation from extrinsic, information-induced shifts [40,41,42].
For producers operating under Protected Designations of Origin, the implications are strategic. Sensory profiles, claims of typicity, and communicative cues (e.g., appellation, varietal style, and price tier) jointly shape perceived quality and willingness to pay [22,43,44]. A framework that explicitly models both intrinsic variation (best evidenced by blind tasting) and expectation-consistent shifts (elicited by extrinsic cues), therefore offers a more complete account of how consumers evaluate wines from PDO systems such as Málaga and Sierras de Málaga.
Within this framework, our study leverages a repeated measures design to estimate, for the same tasters and the same wines, (i) the magnitude of label- and price-induced shifts relative to blind tasting; (ii) whether those shifts concentrate in particular attributes (aroma, colour, flavour) or reflect an integrated movement in overall evaluation; and (iii) whether consumers can be segmented by their sensitivity to extrinsic information. This approach aligns with best practices in contemporary sensory science—linking controlled protocols to real-world informational contexts—and provides actionable evidence for product development, label design, and origin-based market positioning [7,24,30].
2.1. Neurophysiological and Multisensory Foundations of Wine Perception
Flavour perception in wine arises from the integration of chemical and physical stimuli processed across multiple sensory systems rather than from isolated channels [1,2,45]. In contemporary perception science, “flavour” is explicitly multisensory—an emergent construct that combines olfaction (orthonasal and retronasal), vision, gustation, and trigeminal/somatosensory input within a common evaluative space [46,47].
Olfaction anchors this construct. Odours reach the olfactory epithelium both orthonasally (before sipping) and retronasally (during swallowing), engaging neural systems tied to memory and affect, which explains the evocative character of wine aromas and their strong influence on hedonic judgments [33,48,49]. Visual cues, in turn, set expectations before any olfactory or gustatory sampling. Wine colour—and its clarity, hue, and intensity—can redirect subsequent descriptions and ratings through top-down prediction: classic demonstrations show that colouring a white wine red elicits “red-wine” descriptors from experienced tasters [31,42,50,51].
Gustatory and trigeminal inputs contribute basic tastes (sweet, sour, bitter, umami, salty) and to oral-somatosensory qualities such as temperature, viscosity, carbonation, and astringency. The latter—driven by polyphenol–protein interactions—is particularly salient for red wines and shapes perceived structure and balance [49,52]. Critically, these channels interact: cross-modal influences mean that what tasters report for any single attribute (e.g., “flavour”) often reflects coordinated changes across the whole percept, not independent modules [2,49,50].
Weighting across attributes is not fixed. Evidence suggests that flavour/overall evaluation typically carries the greatest weight in global judgments, while the relative importance of aroma increases with expertise and product familiarity [2,11,53]. These dynamics, combined with predictive processes that align perception with prior expectations, help explain why strong inter-attribute correlations are commonly observed in controlled tastings and why informational cues can shift multiple ratings in concert.
This multisensory, expectation-sensitive view informs our empirical strategy. If attributes cohere into an integrated percept, we should observe high collinearity among aroma, colour, and flavour ratings; if informational context operates via expectation mechanisms, label cues should shift reported ratings relative to blind conditions, primarily acting as an amplification mechanism for attributes while preserving intrinsic differences among wines.
2.2. Consumer Decision Drivers
Sensory evaluation is central to understanding wine choice because perceived quality, stated preference, purchase intention, and willingness to pay all co-vary with what consumers taste—and with what they believe they are tasting [8,41]. Multivariate and choice-modelling approaches show that extrinsic cues, such as price knowledge, geographic origin, and label design, systematically shift perceived quality and stated WTP, often by as much as intrinsic sensory differences [54,55,56]. In this literature, blind protocols are used to identify intrinsic drivers, while informed protocols quantify how expectation and category beliefs reweigh the same sensory signals [9,10].
Experimental designs that combine chemical analysis with controlled tastings have clarified how physicochemical composition relates to perceived structure and liking, and how this mapping shifts with context [9,10]. The practical payoff is twofold: first, product development can target sensory spaces associated with acceptance; second, communication can align brand, origin narratives, and label elements with those sensory spaces [9,57]. In origin-based strategies, typicity claims and PDO information act as credible quality signals that interact with sensory expectations to shape valuation [56,58].
A growing focus on variability has shown that heterogeneity lies both across products and across tasters. Attributes differ in consensus: aroma often shows greater dispersion than colour or flavour because of its descriptive complexity and vocabulary uncertainty, whereas flavour/overall evaluations typically dominate global judgments [44]. Quantifying this heterogeneity—through consensus indices and consumer segmentation—helps interpret mean differences and reveals segments that are more or less sensitive to extrinsic information [41,59]. Against this background, our study uses blind and informed contexts to separate intrinsic product differentiation from expectation-consistent shifts, and clusters tasters by their sensitivity to label cues.
3. Methodology
We implemented a controlled, within-subjects sensory experiment to quantify how informational context shifts wine evaluations while holding tasters and products constant. The stimulus set comprised eight wines, five whites and three reds, from distinct wineries in Málaga. Seven wines were Protected Designation of Origin (PDO or D.O.P.) Sierras de Málaga and one to PDO Málaga (Table 1). Selection prioritised heterogeneity in grape variety, geographic origin, and vinification style to represent the regional portfolio. Table 1 lists, for each wine, appellation, producer, style, variety(ies), vintage, alcohol by volume, and retail price, which was included as contextual information but not manipulated as an experimental condition.
Table 1.
Sample list.
Tastings were conducted in a controlled environment consistent with sensory analysis guidance [35,37]. The room provided uniform, neutral lighting; light, non-distracting surfaces; adequate ventilation; and strict control of extraneous odours (no food, cleaning products, or perfumes). All assessments used the Albariza tasting glass (Vicrila/Hostelvia), designed to optimise visual and aromatic evaluation. Participants were provided with mineral water and plain breadsticks (piquitos) and spittoons to facilitate palate cleansing between samples, and s were instructed not to converse during evaluation.
The study used a within-subjects repeated measures design, in which each participant evaluated all wines under both tasting conditions. This design allows direct estimation of within-individual changes in perceived quality across informational contexts. Each participant assessed every wine under two sensory tasting contexts involving direct evaluation: (i) blind (no information) and (ii) label-informed condition (commercial label visible and type/typicity disclosed). Wine order and tasting conditions were randomised and counterbalanced across participants to control for order, carryover, and learning effects. The session was organised in short flights with brief rests to limit fatigue; pours were standardised and service temperatures were appropriate to style.
For each sample, tasters recorded ratings on three attributes—aroma, colour, and flavour—using 5-point scales anchored at 1 = very low and 5 = very high. The design yields 720 individual sensory observations (45 tasters × 8 wines × 2 sensory contexts). As detailed in the Analysis section, subsequent data exploration included principal component analysis to examine latent sensory structure and clustering techniques to segment wines and tasters by response patterns [60,61,62].
3.1. Sample and Participant Profile
The panel comprised 45 adult tasters recruited via non-probability convenience sampling: 37 consumers and 8 professional sommeliers randomly selected from the Málaga Sommeliers’ Association. The sommelier subgroup (n = 8) was included to explore potential expertise effects but was not treated as a separate experimental group. Error bars indicate standard deviations (SD). All inferential analyses were conducted on the pooled sample unless otherwise specified. Given the limited number of professionals, comparisons between consumers and sommeliers were considered exploratory and are interpreted with caution. See Supplementary Materials.
The aim was to assemble a heterogeneous panel across age, gender, and wine experience. The sample was predominantly male (64.4%) and included a substantial share of participants aged 55+ (37.8%). Regarding education, 39.5% held a university degree, 23.3% reported a master’s or PhD, suggesting adequate familiarity with evaluative tasks. Wine consumption was frequent: 35.6% reported drinking wine one to three times per week, 22.2% daily.
Consumers and sommeliers formed two experience strata used in exploratory subgroup analyses. Participation was voluntary, informed consent was obtained, and no identifying health data were collected. The convenience design supports internal validity for within-person comparisons, while external generalizability is limited to similar consumer profiles.
3.2. Statistical Analysis
Analyses followed the procedures described in the study protocol, without additional modelling beyond those specified.
- Descriptive statistics and associations
We computed means and standard deviations for each attribute (aroma, colour, flavour) across wines and sensory tasting contexts (blind and label-informed condition) to provide an overview of rating patterns. Linear associations among attributes were examined with Pearson correlation coefficients [63].
- 2.
- Differences across wines
To detect significant differences in sensory ratings among wines, a one-way ANOVA was applied for each attribute. When omnibus tests were significant, Tukey’s HSD post hoc comparisons were used to identify pairwise differences among wines [64].
- 3.
- Segmentation of wines and tasters
To explore latent structure and segment profiles, clustering analyses were performed. First, k-means clustering [60] was applied to standardised sensory data to form homogeneous groups based on attribute similarities. As a complement, hierarchical clustering using Ward’s method with Euclidean distance was used to visualise grouping structure and validate the k-means solution [61,62].
- 4.
- Context effects
To assess whether informational context influenced sensory evaluations, comparisons were conducted exclusively between the blind and label-informed condition tasting conditions, as these were the only contexts that involved direct sensory assessment.
Given the within-subject design, repeated measures ANOVA was applied for each attribute (aroma, colour, flavour) to evaluate the effect of tasting condition. When significant effects were detected, post hoc comparisons were conducted using Tukey’s HSD test with multiple-comparison adjustment.
Additionally, paired-samples t-tests were used as complementary analyses to directly compare evaluations under blind and label-informed conditions.
Assumptions of normality were evaluated through Shapiro–Wilk tests and visual inspection of Q–Q plots. Given the robustness of parametric tests to moderate deviations from normality, parametric analyses were retained. Where appropriate, results were cross-checked using non-parametric alternatives, yielding consistent conclusions.
- 5.
- Software
All analyses were conducted in Python (Version 3.11.0; Python Software Foundation, Wilmington, DE, USA)using pandas for data handling, scipy and statsmodels for inferential tests, scikit-learn for PCA and clustering, and matplotlib/seaborn for visualisation.
4. Results
This section reports findings from a controlled sensory experiment evaluating eight wines under two informational contexts. The dataset comprises 720 individual sensory observations (45 tasters × 8 wines × 2 sensory contexts), with three attributes per observation—aroma, colour, and flavour—rated on 5-point scales (1 = very low; 5 = very high). We first summarise descriptive patterns (score distributions by wine and context), then assess consistency across evaluator profiles (consumers vs. sommeliers), and finally use complementary multivariate tests to validate and interpret the observed patterns. Unless otherwise noted, Figures display mean values, while variability is reported using standard deviations (SD) to reflect dispersion across participants. Standard errors (SE) are retained in figures only for visualisation purposes. Before conducting the inferential analyses, the data’s distributional properties were examined. Normality was assessed using the Shapiro–Wilk test for each sensory attribute (aroma, colour, and flavour). While some departures from normality were observed, these were not severe enough to warrant concern; given that parametric tests are generally robust to moderate violations of this assumption, a parametric approach was retained throughout. Complementary non-parametric checks yielded consistent results, lending further support to the conclusions drawn.
4.1. Comparison of Wine-by-Wine Sensory Scores Between the Full Sample and the Sommelier Subgroup
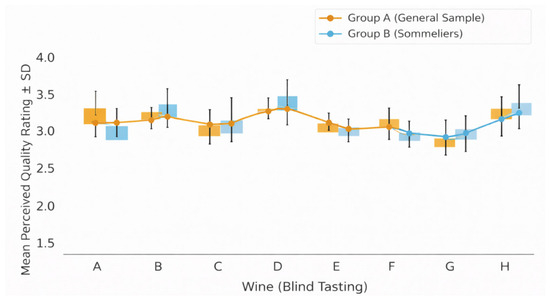
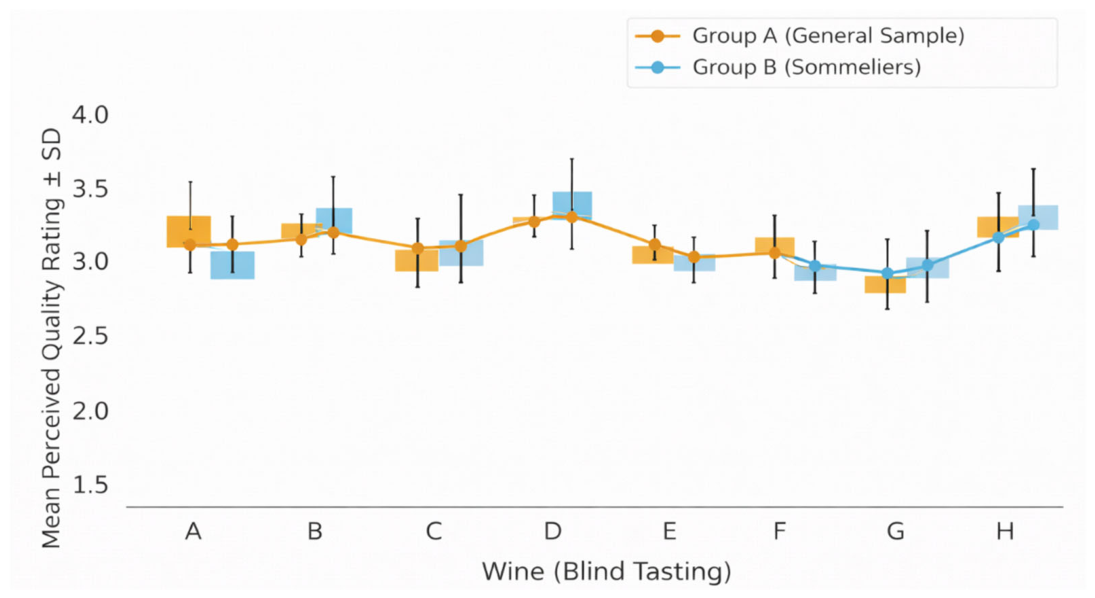
Objective and metric. To determine whether panel composition introduced systematic bias, we compared mean sensory scores for each wine (A–H) between the full consumer sample (Group A) and the sommelier subgroup (Group B). The primary metric was a composite score (the average of aroma, colour, and flavour) computed for each wine and group; attribute-level trends were also examined.
Blind condition (Figure 1). Across all eight wines, the two groups exhibited essentially parallel profiles. Mean differences were small relative to the observed variability (SD), indicating similar evaluation patterns between groups. The wines most highly rated by the full sample (e.g., D and H) likewise ranked highest among sommeliers, while wines with more moderate scores (e.g., E and G) occupied similar positions in both groups. This parallelism indicates a shared ordering of perceived quality when no extrinsic information is available.
Figure 1.
Mean sensory score per wine. Differences between consumers (n = 37) and sommeliers (n = 8) are descriptive and should be interpreted with caution given, the limited size of the professional group.
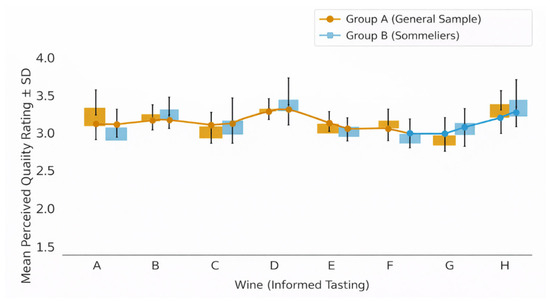
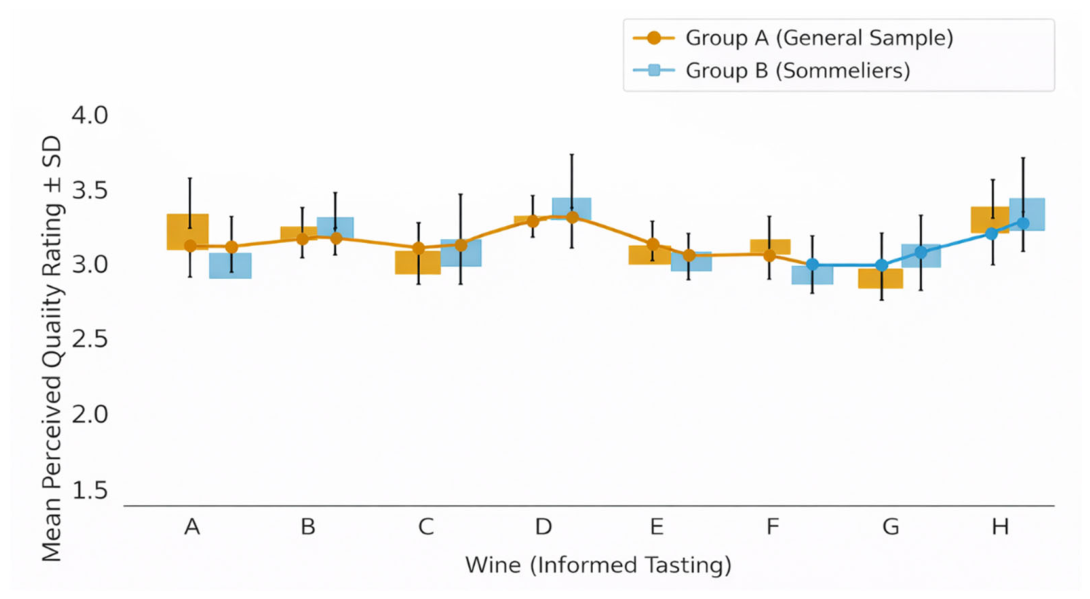
In the informed condition (Figure 2), the comparison again showed strong convergence. Although minor deviations were observed for individual wines, the group means remained within similar ranges. Exposure to the label and bottle presentation did not yield systematic divergence between consumers and sommeliers, suggesting that both groups incorporate the visual/cognitive information in similar ways when adjusting their sensory judgments.
Figure 2.
Mean sensory score per wine. Differences between consumers (n = 37) and sommeliers (n = 8) are descriptive and should be interpreted with caution, given the limited size of the professional group.
To avoid wine-by-wine fragmentation, we conducted a multivariate analysis of variance (MANOVA) with the eight wine scores (A–H) as dependent variables and group (full sample vs. sommeliers) as the between-subjects factor. In the blind tasting, Wilks’ Lambda was not significant (λ = 0.598; F(8, 20) = 1.68; p = 0.165), indicating no multivariate difference in the profile of scores across groups. The informed tasting produced the same conclusion (λ = 0.585; F(8, 17) = 1.51; p = 0.226).
Taken together, these results provide no evidence that the sommelier subgroup deviates systematically from the broader panel in either blind or informed contexts. Subsequent analyses, therefore, pool both groups to maximise precision without introducing bias related to specialisation. Given the limited size of the sommelier subgroup (n = 8), these comparisons should be interpreted with caution and are considered exploratory rather than definitive inferential results.
4.2. Overall Comparison Across Sensory Attributes
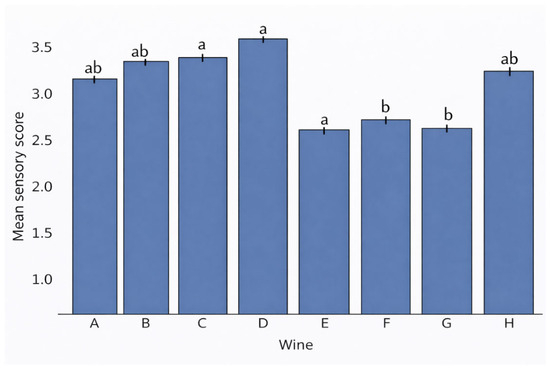
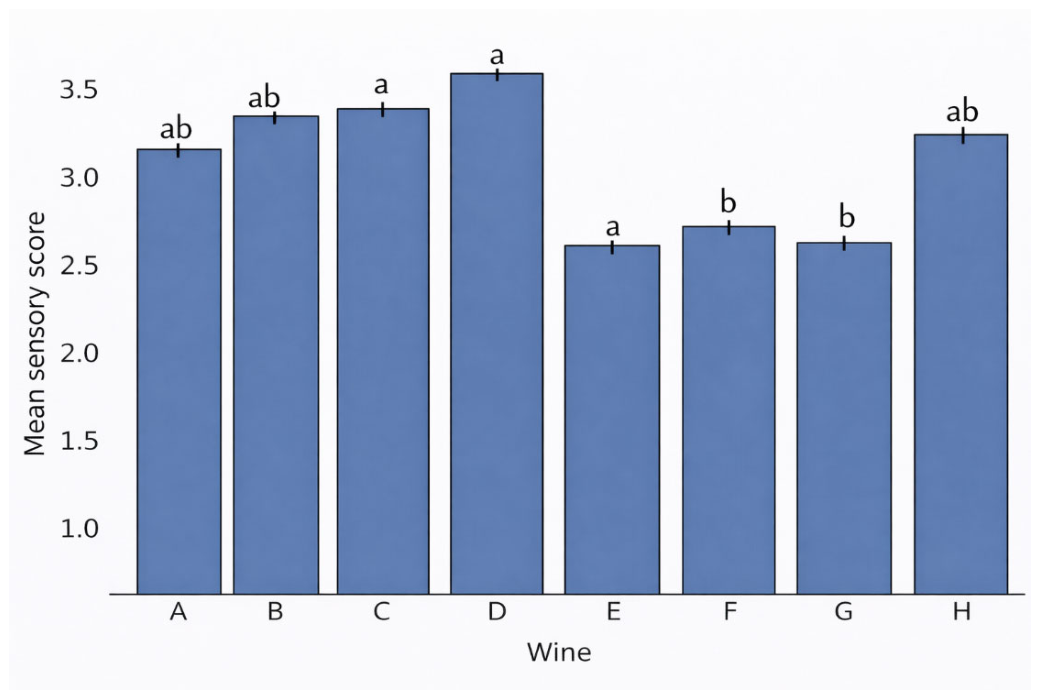
Descriptive results (Figure 3) indicate clear differentiation among wines when scores are averaged across attributes (global mean = average of aroma, colour, and flavour). Among whites, Wine B (3.49) and Wine A (3.27) lead the ranking with fresh, expressive profiles. At the lower end, Wine E shows the lowest overall mean (2.52), consistent with a more limited perceived expression and its minimal-intervention profile noted in the sample description. Among reds, Wines H and F present moderately high global means (3.16 and 3.05, respectively), while the third red sits slightly below the panel average. Overall, these patterns point to a general preference for the whites in this sample.
Figure 3.
Mean perceived quality ratings by wine. Error bars represent standard deviations (SD). Letters indicate homogeneous groups based on Tukey’s HSD post hoc test (p < 0.05). Assignments are consistent with observed mean differences.
Importantly, even under blind conditions, visual information remains present and can shape expectations for subsequent olfactory and gustatory judgments—an effect well documented in the sensory literature [31,42,65]. This helps explain why wines with more favourable visual profiles can show elevated global means, as aroma and flavour ratings often move in concert with colour-based expectations.
4.3. Within-Wine Variability in Sensory Evaluation
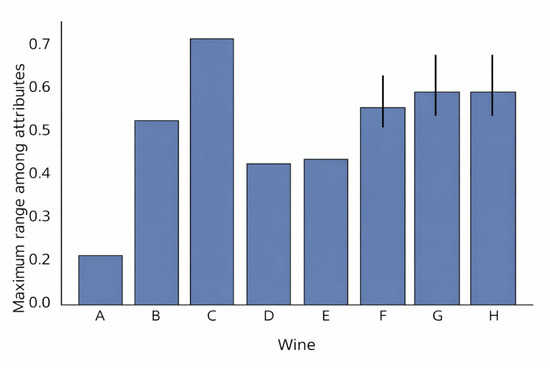
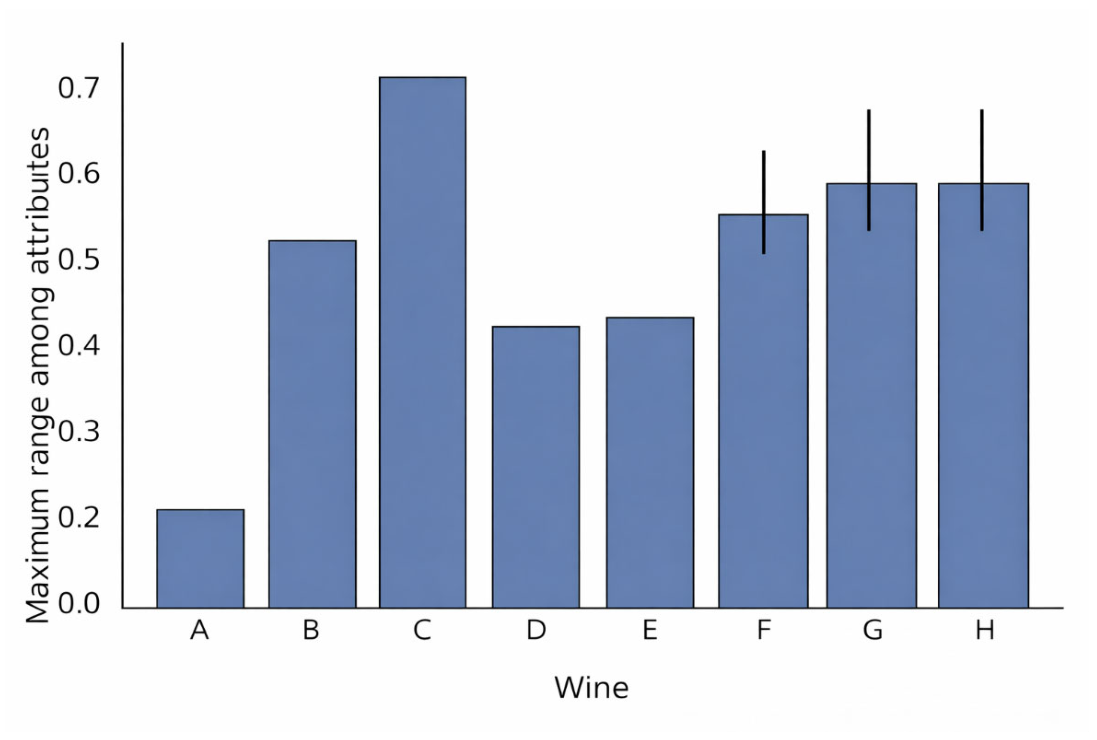
To assess perceptual coherence, we examined within-wine variability as the difference between the highest and lowest mean among the three attributes (Figure 4). Lower dispersion indicates a more harmonious profile; higher dispersion suggests sensory imbalance.
Figure 4.
Within-wine variability across aroma, colour, and flavour, calculated as the difference between the highest and lowest mean attribute scores; black error bars for Wines F, G, and H represent standard deviations, and lower values indicate more coherent sensory profiles.
Wines A and D exhibit the smallest internal differences (<0.2 points), indicating coherent, balanced perceptions across aroma, colour, and flavour. In contrast, Wine C shows the largest dispersion (0.72), driven by a strong contrast between a well-rated colour and a notably lower flavour score. A similar, though less pronounced, pattern appears for Wines E and H. These imbalances may reflect perceived acidity, aromatic complexity, or expectation effects carried over from visual cues, consistent with cross-modal interactions reported in the literature [49,50].
4.4. Sensory Profile and Perceptual Coherence
Combining the global meaning with within-wine variability yields a useful typology:
- Balanced and well-rated: D, B, A;
- Moderately balanced with mid-range ratings: G, F, H;
- Unbalanced with lower ratings: C, E.
From a managerial perspective, coherence across aroma, colour, and flavour is associated with higher satisfaction and repeat purchase. At the same time, marked imbalances can depress overall acceptance even when one attribute (e.g., colour) is strong [43,44].
4.5. Context Effects on Sensory Evaluation: Blind vs. Label-Informed Tasting
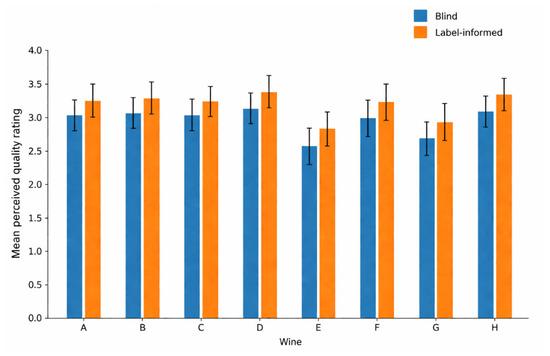
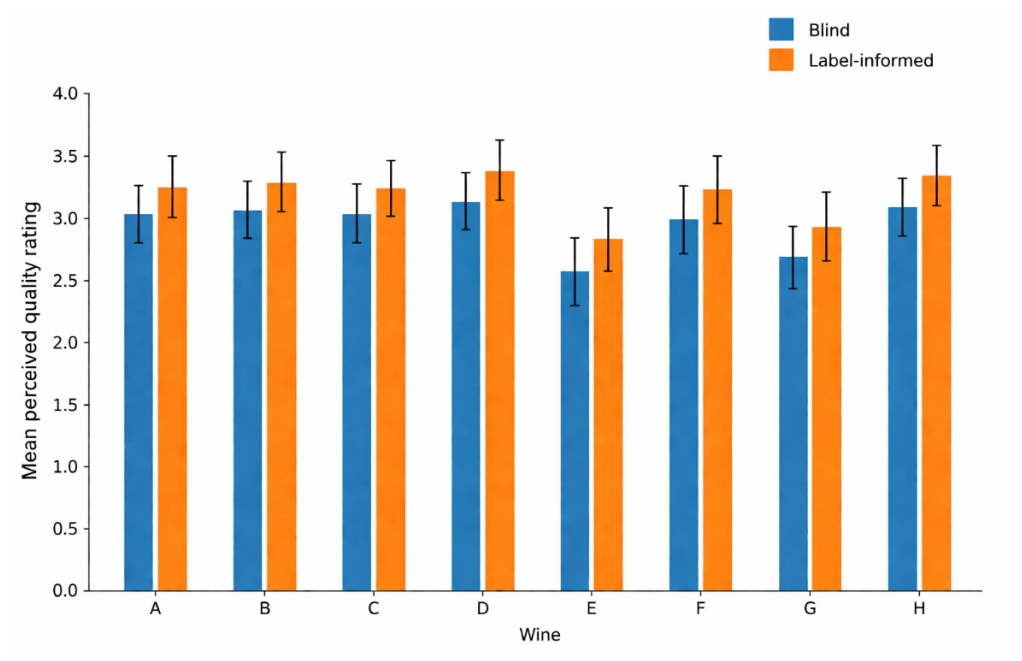
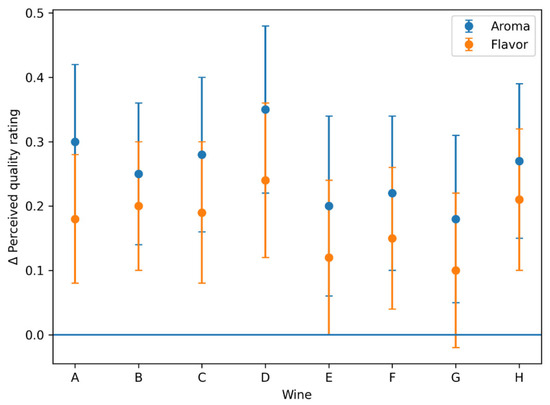
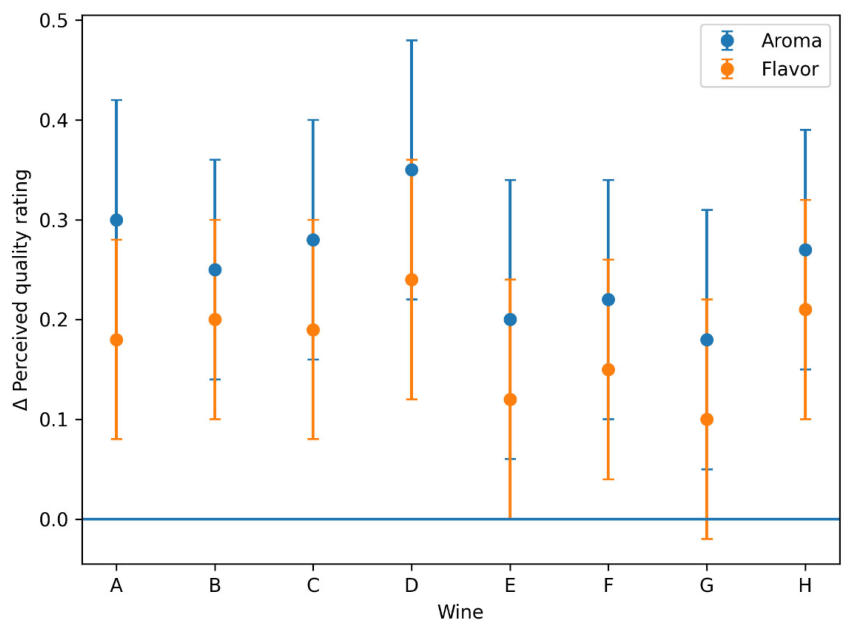
The analysis of context effects focuses on the two experimental conditions: blind tasting and label-informed tasting. Figure 5 compares mean global sensory scores (average of aroma, colour, and flavour) for each wine under these two contexts, while Figure 6 presents attribute-level differences across tasting conditions.
Figure 5.
Comparison of perceived quality ratings between tasting contexts (blind vs. label-informed). Bars represent mean global sensory scores for each wine (A–H) (n = 45). Error bars indicate standard deviations (SD).
Figure 6.
Effect of label information on perceived quality ratings by attribute (Δ informed − blind). Points represent mean differences for aroma and flavour across wines (A–H). Error bars indicate standard deviations (SD). The horizontal line at zero indicates that the informational context has no effect.
Comparing blind and informed conditions across Wines A–H shows systematic, albeit modest, increases in informed scores. These increases are most clearly evident for aroma, indicating that the disclosing of label information consistently enhances perceived sensory quality. This pattern is consistent with expectation effects, whereby label-related and visual cues amplify reported intensity or liking relative to blind tasting, without fundamentally altering intrinsic perception [9,29]. Pairwise comparisons between conditions confirmed that these differences were statistically significant (p < 0.05), with ratings under label-informed conditions exceeding those obtained under blind tasting. In this sense, the results provide empirical support for Hypothesis H1, which posits a positive effect of label information on sensory evaluations.
Importantly, the introduction of label information does not substantially modify the relative ranking of wines observed under blind conditions. Wines that achieve higher ratings in blind tasting tend to remain among the most highly evaluated once label information is disclosed. This finding suggests that extrinsic cues primarily amplify perceived quality rather than drive sensory reclassification, reinforcing intrinsic differences rather than overriding them.
At the product level, context effects are not homogeneous. Differences between blind and label-informed conditions are especially pronounced for specific wines (notably Wines A and F), which exhibit clearer increases in informed scores. In contrast, other wines (such as Wines D and G) remain comparatively stable across contexts, indicating a stronger anchoring of sensory perception in intrinsic product characteristics.
When disaggregated by sensory attribute (Figure 6), context-related variation is smaller for flavour than for aroma. Aroma shows the greatest sensitivity to informational framing, while colour displays intermediate shifts. This pattern aligns with the view that cognitively driven cues tend to exert a stronger influence on more “projective” or expectation-sensitive attributes—such as aroma and visual appearance—than on structural components of flavour related to mouthfeel and gustatory persistence [9,29].
Overall, the comparison between blind and label-informed tasting confirms that informational cues linked to labelling systematically elevate reported sensory evaluations—particularly for aroma—while preserving the underlying sensory structure of the wines. These findings underscore the relevance of aligning extrinsic communication strategies with intrinsic sensory profiles, especially in PDO contexts where labels play a central role in shaping consumer expectations.
4.6. Complementary Statistical Analyses
To reinforce these interpretations, we applied a set of complementary procedures to characterize the panel’s internal coherence, the consistency of sensory evaluations, and natural groupings among wines. Clustering analyses (k-means complemented by Ward’s hierarchical method) identified segments in both wines and tasters that align with the descriptive patterns above, providing a structural cross-check on the mean-based results. In addition, exploratory comparisons across sociodemographic variables (age, gender, and experience) did not yield statistically significant differences in assigned scores, suggesting that the observed patterns are robust across participant profiles within this sample.
Taken together, the descriptive patterns, context comparisons, and multivariate checks converge on three conclusions: (i) wines differ meaningfully in their global sensory means under controlled conditions; (ii) within-wine coherence is an informative quality signal, with low dispersion associated with higher acceptance; and (iii) informational context tends to raise reported ratings—especially for aroma—without eliminating intrinsic differences among wines. These results are congruent with established evidence on expectation-consistent shifts in perception and the strategic importance of aligning extrinsic cues with intrinsic sensory profiles.
4.6.1. Correlations Among Sensory Attributes
Pearson correlations (Table 2) revealed very strong linear associations among the evaluated dimensions: aroma–flavour (r = 0.99), aroma–colour (r = 0.98), and colour–flavour (r = 0.96 all p < 0.001). The near-unity coefficients indicate that tasters appraised the wines in an integrated manner—high scores on one attribute tended to co-occur with high scores on the others. This coherence is consistent with the multisensory, expectation-sensitive nature of flavour perception, in which visual, olfactory, and gustatory cues are processed jointly rather than independently [2,50]. However, the magnitude of these correlations also suggests a limited discriminant capacity between attributes, potentially reflecting a halo effect in which participants project an overall evaluative judgement onto each scale. This is consistent with previous research indicating that non-expert tasters may rely on global impressions rather than analytically separating sensory dimensions.
Table 2.
Pearson correlations among wine sensory attributes. Correlation matrix showing pairwise Pearson coefficients between aroma, colour, and flavour ratings across all wines and tasting contexts.
4.6.2. Differences Across Sensory Dimensions (ANOVA)
A one-way ANOVA comparing mean ratings for aroma, colour, and flavour identified a significant effect (F = 10.88; p = 0.003), indicating that at least one attribute’s central tendency differs from the others. Descriptively, colour tended to receive the highest scores, while flavour showed slightly lower means, with aroma in between. This pattern aligns with evidence that visual cues set anticipatory frames for subsequent olfactory and gustatory judgments, often elevating colour-related evaluations relative to more structurally complex mouthfeel and flavour assessments [2,65].
4.6.3. Wine Classification via Clustering
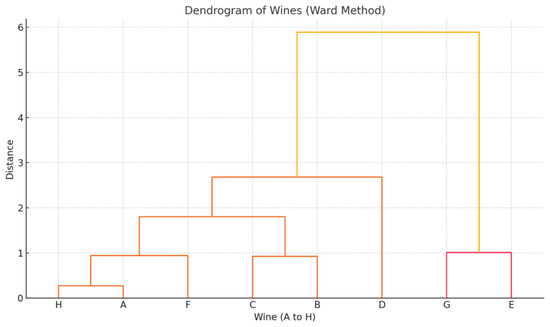
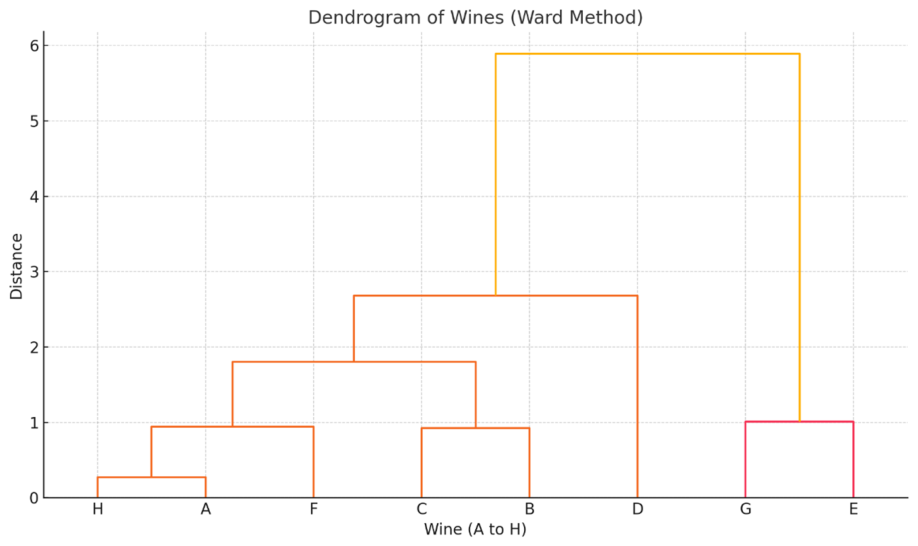
Hierarchical clustering using Ward’s method on standardised aroma, colour, and flavour scores reveals a clear hierarchical structure rather than two perfectly symmetrical clusters. As shown in Figure 7, Wines E and G form a highly cohesive pair, merging at a low distance indicating strong similarity across sensory attributes. In contrast, Wine D joins the remaining wines only at a higher distance, suggesting a more differentiated sensory profile.
Figure 7.
Dendrogram of wines based on hierarchical clustering using Ward’s method. Each terminal label represents one wine, from A to H. Branches that merge at lower distance values indicate wines with more similar sensory profiles, such as H and A or C and B. Branches that merge at higher distance values indicate greater dissimilarity between clusters. The coloured branches distinguish the main clusters identified by the hierarchical procedure, while the vertical axis represents the clustering distance.
The remaining wines (A, H, F, B, and C) cluster progressively, with sub-groupings that reflect intermediate levels of similarity. Overall, this structure is consistent with the k-means solution in identifying meaningful sensory differentiation among wines, while highlighting both compact groupings and more isolated profiles.
From a positioning perspective, the E–G cluster corresponds to wines sharing closely aligned sensory profiles, whereas Wine D appears as a distinct product with a differentiated balance of attributes. The larger cluster comprising A, H, F, B, and C reflects more heterogeneous but broadly comparable profiles, suggesting varying degrees of alignment with average consumer expectations within the panel.
4.6.4. Convergence Between k-Means and Hierarchical Clustering Results
The segmentation achieved through k-means clustering is enhanced by hierarchical clustering using Ward’s method, providing a coherent and robust interpretation of the sensory structure of the wines. While k-means offers a straightforward, partition-based approach to identifying operational sensory typologies, hierarchical clustering provides an exploratory perspective by revealing relative proximity and differentiation patterns among the wines. The k-means analysis identifies two broad sensory groupings that capture meaningful differences in overall profiles and acceptance patterns. This solution is advantageous from a practical perspective, as it simplifies the sensory landscape into interpretable clusters that are suitable for positioning and communication strategies. The hierarchical dendrogram (Figure 7) does not mirror the k-means partition in a strictly symmetrical way, but it supports its underlying logic by highlighting both compact similarities and differentiated profiles. Notably, Wines E and G form a tight pair at a low distance level, indicating substantial similarity across aroma, colour, and flavour dimensions. This close pairing aligns with their joint positioning in the k-means solution. In contrast, Wine D presents a relatively distinct profile, merging with the remaining wines only at higher distance levels. This structural separation reinforces its unique sensory positioning, as identified through k-means, and reflects a balanced set of attributes rather than random dispersion. The other wines (A, H, F, B, and C) cluster progressively, forming intermediate groupings without sharp internal boundaries. These wines correspond to the more heterogeneous cluster identified by k-means, where intrinsic differences exist but do not warrant further subdivision within the current study’s scope. Overall, combining k-means and hierarchical clustering yields a unified segmentation framework. K-means provides a clear and actionable partition of wines into broad sensory typologies, while hierarchical clustering validates this structure and adds depth by identifying compact subgroups and distinct profiles. This methodological complementarity enhances the robustness of the segmentation and supports its relevance for sensory interpretation and strategic positioning. To ensure an accurate interpretation of variability, results are reported using standard deviations (SD), as standard errors may underestimate the dispersion of sensory evaluations across participants.
5. Discussion
This study pursued a dual aim: (i) to characterise the sensory dimensions of a set of Málaga wines under blind conditions, and (ii) to examine how those evaluations are modulated by informational context. The results directly address the research and align well with prior evidence in sensory science and consumer behaviour.
First, regarding which attribute receives the highest score under blind tasting, colour was systematically rated above aroma and flavour. This pattern reinforces the anticipatory role of visual information documented in the literature: colour frames expectations for subsequent olfactory and gustatory judgments. It can elevate overall appraisal even before the first sip [29,42]. Although flavour is often considered the central driver of overall quality, experimental work shows that colour-induced expectations can reshape both perceived flavour and hedonic response [66,67].
Second, the very high correlations among aroma, colour, and flavour (r > 0.95) indicate that tasters evaluated the wines holistically rather than as independent channels. This supports a multisensory account of wine perception in which cross-modal interactions and top-down expectations produce coordinated movements across attributes [2]. It also aligns with work highlighting the roles of memory, affect, and prior beliefs in shaping reported flavour [32]. However, correlations of this magnitude also suggest a limited discriminant capacity between attributes, potentially reflecting a halo effect in which participants project a global evaluative judgement onto each scale. Therefore, results should be interpreted as reflecting a largely holistic perceptual response rather than fully independent sensory evaluations. From a methodological standpoint, our findings suggest that participants may have encountered some complexity when attempting to decouple specific sensory attributes. This challenge has led to a holistic evaluative judgement being projected across each scale. To mitigate this effect in future research, we believe there is significant value in incorporating preliminary familiarisation sessions or refining sensory descriptors; such measures would enhance discriminative capacity and reduce the natural interdependence between the observed attributes. Comparable coherence has been observed in international panels—e.g., among Italian, French, and Anglophone consumers—where integrated multisensory patterns emerge even when the symbolic and visual load of wines varies [67].
Third, one-way ANOVA confirmed statistically significant differences among wines, validating structured tasting as a technical instrument for discriminating intrinsic profiles. This is consistent with established sensory methodology, which links rigorous panel procedures to reliable product differentiation and predictive value for development decisions [1]. Importantly, these differences were preserved across tasting contexts, indicating that intrinsic quality signals remain stable even when informational cues are introduced.
Fourth, clustering analyses yielded a clear segmentation of wines into homogeneous groups based on their sensory profiles. From a managerial standpoint, this perceptual segmentation can support positioning strategies, label design, and market targeting by matching profiles to specific consumer niches and occasions [41,43].
Fifth, informational context, particularly exposure to label information, raised reported ratings, especially for colour and, to a lesser extent, for flavour. This pattern is consistent with expectation-based accounts, which show that symbolic cues such as origin and label design can modulate experienced quality and stated preferences [9,68]. The difference-based analysis (Δ informed − blind) further clarifies this effect, showing that the magnitude of the informational impact varies across wines and attributes. In our data, the uplift was most salient for mid-tier products, suggesting that context acts as an amplifier where intrinsic signals are neither weak nor overwhelmingly strong. International findings similarly indicate that label design can shift perceived emotions and hedonic judgments—especially when authenticity or sustainability cues are salient—while region-of-origin expectations modulate evaluations across markets [41,67,69]. While price information was not examined as an independent sensory condition in this study, prior research suggests that economic cues may further modulate expectations, an issue warranting controlled investigation in future research.
Finally, we did not detect significant differences in scores associated with age, gender, or educational attainment. This aligns with prior work noting that, under standardised protocols, sociodemographic variables may have limited influence on directed sensory evaluations, even though they shape habitual preference and consumption patterns [8]. Taken together, these results suggest that the patterns reported here are primarily attributable to the wines’ sensory properties and to informational framing, rather than to systematic differences in individual evaluator profiles. In this sense, the focus on perceptual evaluation aligns with consumer-oriented approaches in sensory science, where experienced quality is considered a key outcome variable.
Within this framework, the natural wine included in the sample received lower overall ratings. This may be linked to differences in consumer familiarity and expectations regarding this type of sensory profile. However, the absence of data on participants’ prior consumption habits limits the ability to interpret this effect fully and should be acknowledged as a limitation.
Overall, the evidence supports a coherent picture: (i) intrinsic differences among wines are clearly detectable under blind tasting; (ii) attributes move together within an integrated percept; and (iii) extrinsic cues produce expectation-consistent shifts without erasing intrinsic structure—effects that appear strongest for visually and symbolically sensitive dimensions and for products in the mid-range of perceived quality. These insights are directly actionable for PDO contexts: aligning label signalling with intrinsic profiles can enhance acceptance while maintaining authenticity, and perceptual segmentation can inform more precise positioning and communication. Limitations—such as convenience sampling, the use of 5-point scales, the focus on label-related cues rather than a broader range of extrinsic information, and the regional scope—point to future work linking context-induced shifts to revealed preference and purchase behaviour across more diverse panels and product sets.
6. Limitations
This study has several limitations that should inform interpretation and future research.
First, the panel size was modest (n = 45) and recruited by convenience in a single region; external validity is therefore limited to consumers with similar profiles and familiarity. The sommelier subgroup was small (n = 8), reducing power to detect expertise effects.
Second, all judgments used 5-point items. While practical, this coarse, ordinal scale may compress variability and lead to high correlations among sensory attributes, potentially limiting the ability to discriminate between dimensions. Future studies could employ more sensitive continuous scales or attribute-specific descriptors to enhance measurement precision.
Third, although environmental conditions were controlled, the study was conducted in a single session. Despite palate cleansing procedures, residual fatigue, adaptation, or carryover effects cannot be entirely ruled out. Repeated sessions and counterbalanced designs would strengthen internal validity.
Fourth, the product set comprised eight wines from PDOs in Málaga. Findings may not generalise to other styles, varieties, vintages, or regions.
Fifth, the informational manipulation focused on label-related cues. While price information was recorded as part of the contextual characteristics of the wines, it was not implemented as an experimental tasting condition. Future research should examine multiple extrinsic cues (including price, branding, and origin) in controlled designs to better understand their interaction effects.
Sixth, outcomes were self-reported sensory ratings. The study did not measure behavioural factors such as choice, willingness to pay, or physiological responses. Linking perceptual effects to actual consumer behaviour would enhance practical relevance.
Seventh, the study does not include physicochemical characterisation of the wines (e.g., volatile compounds, acidity, or residual sugar), which limits the ability to directly relate sensory profiles to compositional properties. Future research should integrate chemical and sensory data to better understand the mechanisms underlying perceived differences between wines.
Finally, clustering results are exploratory and may depend on methodological choices such as standardisation and cluster selection. Although consistent patterns were observed across methods, these segments should be validated in independent samples.
7. Conclusions
The findings support clear, actionable conclusions for both oenology and market positioning.
First, the general consumer panel and the sommelier subgroup exhibited highly similar evaluations. Mean scores were similar across wines, and MANOVA tests were non-significant (p > 0.05), indicating no systematic expertise effect. Given the limited size of the professional subgroup (n = 8), these results should be interpreted with caution; however, pooling both groups is justified for the present analysis, as observed differences between wines primarily reflect product characteristics rather than evaluator specialisation.
Second, in blind tastings, colour consistently received the highest ratings, reinforcing the anticipatory role of visual input in shaping the tasting experience even in the absence of extrinsic information.
Third, Pearson correlations among aroma, colour, and flavour were very high, indicating that tasters formed an integrated, coherent sensory judgement rather than assessing attributes in isolation. At the same time, correlations of this magnitude suggest a limited discriminant capacity between attributes, consistent with a halo effect in which participants project a global evaluative judgement across sensory dimensions.
Fourth, statistically significant differences among wines confirm the value of structured sensory analysis for discriminating organoleptic profiles and establishing quality criteria. Importantly, these differences were preserved across tasting contexts, indicating that intrinsic quality signals remain stable even when informational cues are introduced.
Fifth, clustering yielded two clearly defined wine typologies: one group characterised by higher scores and balanced, internally coherent profiles; another with lower acceptance and/or marked imbalances across attributes. This segmentation offers a practical basis for positioning, brand development, and targeted communication to specific market niches.
Sixth, informational context—specifically exposure to label information—significantly altered evaluations, raising scores across wines. The difference-based analysis (Δ informed − blind) shows that this effect varies in magnitude across wines and attributes, acting primarily as an amplification mechanism rather than fundamentally altering relative evaluations. These expectation effects underscore the need to consider extrinsic cues in shaping perception, and should be considered when designing tasting experiences and communication strategies, particularly for wines in the mid-range of perceived quality.
Finally, the results provide insights into consumer preferences within the Málaga PDO context. White wines—especially those from the Sierras de Málaga PDO—tended to receive higher sensory evaluations than red wines. Wines exhibiting greater coherence and balance across attributes (notably wines A, B, and D) achieved higher acceptance. In contrast, wines with more heterogeneous sensory profiles received lower ratings regardless of contextual information. Within this framework, the natural wine included in the sample received lower overall ratings due to dispersion across sensory attributes. This suggests a weaker alignment with the dominant expectations of the general consumer panel. Consistent with the literature, natural wines often challenge conventional sensory norms and may appeal more strongly to niche segments with specific preferences. Thus, their lower ratings in this context should not be interpreted as an absence of value, but rather as a divergence from mainstream sensory expectations under controlled conditions.
Overall, the findings indicate that:
- Colour is the most highly rated attribute under blind conditions, confirming the influence of visual input even in the absence of external information.
- Very high correlations among aroma, colour, and flavour indicate an integrated sensory evaluation, albeit with limited discriminant capacity between attributes.
- Wines differ significantly in their sensory means, validating structured tasting as a tool for organoleptic discrimination.
- Cluster analysis identifies two robust wine groups, balanced/high-acceptance versus more heterogeneous/imbalanced, useful for commercial positioning.
- Informational context significantly shifts perception, acting primarily as an amplification mechanism rather than altering relative rankings.
- No significant or robust differences emerged by evaluator expertise or sociodemographic profile, reinforcing the stability and representativeness of the panel.
Overall, combining controlled sensory analysis with informational manipulations and multivariate tools provides a robust framework to understand how wine perception is constructed and how it can be strategically leveraged in both enological development and market communication.
Supplementary Materials
The anonymized dataset used in the sensory experiment is available as supplementary research material through Zenodo at https://doi.org/10.5281/zenodo.18861710.
Author Contributions
Conceptualization, G.Z.-A. and J.F.-S.; methodology, G.Z.-A. and E.C.-R.; software, G.Z.-A.; validation, P.A.G. and E.C.-R.; investigation, G.Z.-A., J.F.-S. and E.C.-R.; resources, G.Z.-A.; data curation, G.Z.-A.; writing—original draft preparation, G.Z.-A., J.F.-S. and E.C.-R.; writing—review and editing, E.C.-R., P.A.G. and G.Z.-A.; visualisation, G.Z.-A.; supervision, E.C.-R. and G.Z.-A.; project administration, E.C.-R. All authors have read and agreed to the published version of the manuscript.
Funding
This research received no external funding.
Institutional Review Board Statement
The study was reviewed and approved by the Ethics Committee for Experimentation of the University of Málaga (CEUMA) (Ethical Report No. 221; CEUMA Registration No. 99-2026-H; approval date: 1 July 2026). The Committee determined that the study protocol, experimental procedures, research facilities, and planned participant incentives complied with the applicable ethical and research requirements.
Informed Consent Statement
Written informed consent was obtained from all subjects involved in the study to publish this paper.
Data Availability Statement
The anonymized dataset supporting the findings of this study, including the data from the sensory experiment and the statistical analyses reported in the manuscript, is openly available in Zenodo at https://doi.org/10.5281/zenodo.18861710.
Acknowledgments
The authors would like to acknowledge the support of the Universidad de Málaga, the Diputación Provincial de Málaga, and Sabor a Málaga for their institutional and logistical support. The authors also thank the wineries participating in the study for providing the wines used in the sensory evaluations.
Conflicts of Interest
The authors declare no conflicts of interest.
References
- Lawless, H.T.; Heymann, H. Sensory Evaluation of Food: Principles and Practices, 2nd ed.; Springer: New York, NY, USA, 2010. [Google Scholar]
- Spence, C. Multisensory flavour perception. Cell 2015, 161, 24–35. [Google Scholar] [CrossRef] [Scilit] [PubMed]
- Bandyopadhyay, A.; Hall, J.; Wong, H.Y.; Lockshin, L.; Zhang, Y.; Thaichon, P. “Regions” as brands: An empirical validation of consumer-based brand equity framework and demonstration of cross-over effect. Asia Pac. J. Mark. Logist. 2024, 36, 457–479. [Google Scholar] [CrossRef] [Scilit]
- Marangon, F.; Troiano, S.; Nassivera, F.; Carzedda, M. Wine cooperatives and quality clues: A choice experiment on European consumers. In Book of Abstracts 1st Conference of the EuAWE; Universidade de Trás-os-Montes e Alto Douro (UTAD): Vila Real, Portugal, 2022; p. 59. [Google Scholar]
- Parga-Dans, E.; Alonso-González, P.; Otero-Enríquez, R. The role of expert judgments in wine quality assessment: The mismatch between chemical, sensorial and extrinsic cues. Br. Food J. 2022, 124, 4286–4303. [Google Scholar] [CrossRef] [Scilit]
- Boukouvala, N.; Bofylatos, S. From wine tasting to materials sensorial perception: A framework for materials experience. In Proceedings of the DRS2022, Bilbao, Spain, 25 June–3 July 2022. [Google Scholar] [CrossRef] [Scilit]
- Stone, H.; Bleibaum, R.; Thomas, H.A. Sensory Evaluation Practices, 4th ed.; Elsevier: Amsterdam, The Netherlands, 2012. [Google Scholar]
- Mueller, S.; Lockshin, L.; Louviere, J. What you see may not be what you get: Asking consumers what matters may not reflect what they choose. Mark. Lett. 2010, 21, 335–350. [Google Scholar] [CrossRef] [Scilit]
- Piqueras-Fiszman, B.; Spence, C. Sensory expectations based on product-extrinsic food cues: An interdisciplinary review of the empirical evidence and theoretical accounts. Food Qual. Prefer. 2015, 40, 165–179. [Google Scholar] [CrossRef] [Scilit]
- Parr, W.V.; White, K.G.; Heatherbell, D.A. The nose knows: Influence of colour on perception of wine aroma. J. Wine Res. 2003, 14, 79–101. [Google Scholar] [CrossRef] [Scilit]
- Hughson, A.L.; Boakes, R.A. Perceptual and cognitive aspects of wine expertise. Aust. J. Psychol. 2001, 53, 103–108. [Google Scholar] [CrossRef] [Scilit]
- Arntzen, K.A.; Schirmer, H.; Wilsgaard, T.; Mathiesen, E.B. Moderate wine consumption is associated with better cognitive test results: A 7-year follow-up of 5033 subjects in the Tromsø Study. Acta Neurol. Scand. 2010, 122, 23–29. [Google Scholar] [CrossRef] [Scilit] [PubMed]
- Barbierato, E.; Menghini, S.; Bernetti, I. NEUROWINE: How Extrinsic Cues Influence Wine Quality Perception. Ph.D. Thesis, Università di Firenze, Florence, Italy, 2024. Available online: https://flore.unifi.it/bitstream/2158/1352691/3/PhD_FullText_Barbierato.pdf (accessed on 16 November 2025).
- García-Barón, S.E.; Carmona-Escutia, R.P.; Herrera-López, E.J.; Leyva-Trinidad, D.A.; Gschaedler-Mathis, A. Consumers’ drivers of perception and preference of fermented food products and beverages: A systematic review. Foods 2025, 14, 713. [Google Scholar] [CrossRef] [Scilit] [PubMed]
- Barbe, J.C.; Garbay, J.; Tempère, S. The sensory space of wines: From concept to evaluation and description. Foods 2021, 10, 1424. [Google Scholar] [CrossRef] [Scilit] [PubMed]
- Oyinseye, P.; Suárez, A.; Saldaña, E.; Fernández-Zurbano, P.; Valentin, D.; Sáenz-Navajas, M.P. Multidimensional representation of wine drinking experience. Food Qual. Prefer. 2022, 98, 104536. [Google Scholar] [CrossRef] [Scilit]
- Parr, W.V. Demystifying wine tasting: Cognitive psychology’s contribution. Food Res. Int. 2019, 124, 230–233. [Google Scholar] [CrossRef] [Scilit] [PubMed]
- Liu, C.; Sharma, C.; Xu, Q.; Gonzalez Viejo, C.; Fuentes, S.; Torrico, D.D. Influence of label design and country of origin information in wines on consumers’ visual, sensory, and emotional responses. Sensors 2022, 22, 2158. [Google Scholar] [CrossRef] [Scilit] [PubMed]
- Flinzberger, L.; Zinngrebe, Y.; Bugalho, M.N.; Plieninger, T. EU-wide mapping of ‘Protected Designations of Origin’ food products (PDOs) reveals correlations with social-ecological landscape values. Agron. Sustain. Dev. 2022, 42, 43. [Google Scholar] [CrossRef] [Scilit]
- Marco-Lajara, B.; Seva-Larrosa, P.; Martínez-Falcó, J.; García-Lillo, F. Wine clusters and Protected Designations of Origin (PDOs) in Spain: An exploratory analysis. J. Wine Res. 2022, 33, 146–167. [Google Scholar] [CrossRef] [Scilit]
- Zamarreño-Aramendia, G.; Cruz-Ruiz, E.; Ruiz-Romero de la Cruz, E. Sustainable economy and development of the rural territory: Proposal of wine tourism itineraries in La axarquía of malaga (Spain). Economies 2021, 9, 29. [Google Scholar] [CrossRef] [Scilit]
- Petruzzellis, L.; Bortolotti, A.; Romanazzi, S.; Qumsieh, G. The impact of multisensory cues on experience. assessing the brand role in wine choice. J. Wine Res. 2025, 36, 263–281. [Google Scholar] [CrossRef] [Scilit]
- Prescott, J. Multisensory processes in flavour perception and their influence on food choice. Curr. Opin. Food Sci. 2015, 3, 47–52. [Google Scholar] [CrossRef] [Scilit]
- Varela, P.; Ares, G. (Eds.) Novel Techniques in Sensory Characterization and Consumer Profiling; CRC Press: Boca Raton, FL, USA, 2014. [Google Scholar]
- Ballester, J.; Belascoin, M.; González-Hernández, M.; Parga-Dans, E.; Alonso-González, P.; Sáenz-Navajas, M.P. Sensory attributes and quality perception of red natural wines: A comparative study in Spain and France. OENO One 2024, 58, 7737. [Google Scholar] [CrossRef] [Scilit]
- Sáenz-Navajas, M.P.; Sánchez, C.; González-Hernández, M.; Bueno, M.; Peña, C.; Fernández-Zurbano, P.; Ballester, J.; Parga-Dans, E.; González, P.A. Natural versus conventional production of Spanish white wines: An exploratory study. J. Sci. Food Agric. 2023, 103, 3540–3549. [Google Scholar] [CrossRef] [Scilit] [PubMed]
- Sáenz-Navajas, M.P.; Terroba, E.; Parga-Dans, E.; Alonso-González, P.; Fernández-Zurbano, P.; Valentin, D. Attitudes towards natural wines among Spanish winemakers: Relationship with environmental awareness. Food Res. Int. 2024, 179, 114022. [Google Scholar] [CrossRef] [Scilit] [PubMed]
- Di Fede, R.S.; González-Hernández, M.; Parga-Dans, E.; Alonso-González, P.; Fernández-Zurbano, P.; Peña del Olmo, M.C.; Sáenz-Navajas, M.P. Sensory-directed approach to explore cider typicity: The case of ciders from the Canary Islands (Spain). Br. Food J. 2024, 126, 2363–2380. [Google Scholar] [CrossRef] [Scilit]
- Deliza, R.; MacFie, H.J.H. The generation of sensory expectation by external cues and its effect on sensory perception and hedonic ratings: A review. J. Sens. Stud. 1996, 11, 103–128. [Google Scholar] [CrossRef] [Scilit]
- Spence, C.; Piqueras-Fiszman, B. The Perfect Meal; Wiley-Blackwell: Oxford, UK, 2014. [Google Scholar]
- Darriet, F.; Pons, M.; Lamy, S.; Dubourdieu, D. Identification and Quantification of Geosmin, and Earthy Odorant Contamioninfg Wines. J. Agric. Food Chem. 2000, 48, 4835–4838. [Google Scholar] [CrossRef] [Scilit] [PubMed]
- Plassmann, H.; O’Doherty, J.; Shiv, B.; Rangel, A. Marketing actions can modulate neural representations of experienced pleasantness. Proc. Natl. Acad. Sci. USA 2008, 105, 1050–1054. [Google Scholar] [CrossRef] [Scilit] [PubMed]
- Shepherd, G.M. Neurogastronomy; Columbia University Press: New York, NY, USA, 2012. [Google Scholar]
- Stone, H.; Bleibaum, R.N.; Thomas, H.A. Sensory Evaluation Practices; Academic Press: London, UK, 2020. [Google Scholar]
- ISO 8589:2007; Sensory Analysis—Test Room Design. International Organization for Standardization: Vernier, Switzerland, 2007. Available online: https://www.iso.org/obp/ui/es/#iso:std:iso:8589:ed-2:v1:en (accessed on 23 October 2025).
- ISO 5495:2009; Sensory Analysis—Paired Comparison Test. International Organization for Standardization: Vernier, Switzerland, 2009. Available online: https://www.iso.org/obp/ui/es/#iso:std:iso:5495:ed-3:v1:en (accessed on 23 October 2025).
- ISO 11136:2014; Sensory Analysis—Hedonic Tests. International Organization for Standardization: Vernier, Switzerland, 2014. Available online: https://www.iso.org/obp/ui/es/#iso:std:iso:1136:ed-1:v1:en (accessed on 23 October 2025).
- Goldstein, R.; Almenberg, J.; Dreber, A.; Emerson, J.W.; Herschkowitsch, A.; Katz, J. Do more expensive wines taste better? Evidence from a Large Sample of Blind Tastings. J. Wine Econ. 2008, 3, 1–9. [Google Scholar] [CrossRef] [Scilit]
- Almenberg, E.; Dreber, A. When does the price affect the taste? Results from a Wine Experiment. J. Wine Econ. 2012, 6, 111–121. [Google Scholar] [CrossRef] [Scilit]
- Tuorila, H.; Monteleone, E. Sensory food science in changing society: Opportunities, needs, and challenges. Trends Food Sci. Technol. 2009, 20, 54–62. [Google Scholar] [CrossRef] [Scilit]
- Danner, L.; Ristic, R.; Johnson, T.E.; Meiselman, H.L.; Hoek, A.C.; Jeffery, D.W.; Bastian, S.E.P. Context and wine quality effects on consumers’ mood, emotions, liking and willingness to pay for Australian Shiraz wines. Food Res. Int. 2016, 89, 254–265. [Google Scholar] [CrossRef] [Scilit] [PubMed]
- Wang, J.; Spence, C. Drinking through rosé-coloured glasses: Influence of wine colour on the perception of aroma and flavour in wine experts and novices. Food Res. Int. 2019, 126, 108678. [Google Scholar] [CrossRef] [Scilit] [PubMed]
- Charters, S.; Pettigrew, S. The dimensions of wine quality. Food Qual. Prefer. 2007, 18, 997–1007. [Google Scholar] [CrossRef] [Scilit]
- Sáenz-Navajas, M.P.; Avizcuri, J.M.; Ballester, J.; Fernández-Zurbano, P.; Ferreira, V.; Peyron, D.; Valentin, D. Sensory-active compounds influencing wine experts’ and consumers’ perception of red wine intrinsic quality. LWT 2015, 60, 400–411. [Google Scholar] [CrossRef] [Scilit]
- Ashton, R.H. Dimensions of expertise in wine evaluation. J. Wine Econ. 2017, 12, 59–83. [Google Scholar] [CrossRef] [Scilit]
- Auvray, M.; Spence, C. The multisensory perception of flavour. Conscious. Cogn. 2008, 17, 1016–1031. [Google Scholar] [CrossRef] [Scilit] [PubMed]
- Verhagen, J.V.; Engelen, L. The neurocognitive bases of multimodal food perception: Sensory integration. Neurosci. Biobehav. Rev. 2006, 30, 613–650. [Google Scholar] [CrossRef] [Scilit] [PubMed]
- Gilbert, A.N.; Firestein, S. Dollars and scents: Commercial opportunities in olfaction and taste. Nat. Neurosci. 2002, 5, 1043–1045. [Google Scholar] [CrossRef] [Scilit] [PubMed]
- Small, D.M. Taste representation in the human insula. Brain Struct. Funct. 2010, 214, 551–561. [Google Scholar] [CrossRef] [Scilit] [PubMed]
- Delwiche, J. You eat with your eyes first. Physiol. Behav. 2012, 107, 502–504. [Google Scholar] [CrossRef] [Scilit] [PubMed]
- Morrot, G.; Brochet, F.; Dubourdieu, D. The colour of odours. Brain Lang. 2001, 79, 309–320. [Google Scholar] [CrossRef] [Scilit] [PubMed]
- Noble, A.C. Taste-aroma interactions. Trends Food Sci. Technol. 1996, 7, 439–444. [Google Scholar] [CrossRef] [Scilit]
- Sáenz-Navajas, M.P.; Avizcuri, J.M.; Echávarri, J.F.; Ferreira, V.; Fernández-Zurbano, P.; Valentin, D. Understanding quality judgements of red wines by experts: Effect of evaluation condition. Food Qual. Prefer. 2016, 48, 216–227. [Google Scholar] [CrossRef] [Scilit]
- Næs, T.; Tomic, O.; Giron, K.; Thyholt, K. A comparison of methods for analyzing multivariate sensory data in designed experiments—A case study of salt reduction in liver paste. Food Qual. Prefer. 2014, 32, 120–133. [Google Scholar] [CrossRef] [Scilit]
- Louviere, J.J.; Hensher, D.A.; Swait, J.D. Stated Choice Methods: Analysis and Applications; Cambridge University Press: Cambridge, UK, 2000. [Google Scholar]
- Combris, P.; Lecocq, S.; Visser, M. Estimation of a Hedonic Price Equation for Bordeaux Wine: Does Quality Matter. Econ. J. 1997, 107, 390–402. [Google Scholar] [CrossRef]
- Orth, U.R.; Malkewitz, K. Holistic package design and consumer brand impressions. J. Mark. 2008, 72, 64–81. [Google Scholar] [CrossRef] [Scilit]
- Lockshin, L.; Corsi, A.M. Consumer behaviour for wine 2.0: A review since 2003 and future directions. Wine Econ. Policy 2012, 1, 2–23. [Google Scholar] [CrossRef] [Scilit]
- Næs, T.; Brockhoff, P.B.; Tomic, O. Statistics for Sensory and Consumer Science; Wiley: Chichester, UK, 2010. [Google Scholar]
- MacQueen, J. Some methods for classification and Analysis of Multivariate Observations. In Proceedings of the Fifth Berkeley Symposium on Mathematical Statistics and Probability; University of California Press: Berkeley, CA, USA, 1967; pp. 281–297. [Google Scholar]
- García-Marino, M.; Trigueros, Á.; Escribano-Bailón, T. Biogenic amines in red wines. J. Food Compos. Anal. 2010, 23, 455–462. [Google Scholar] [CrossRef] [Scilit]
- Sáenz-Navajas, M.P.; Campo, E.; Sutan, A.; Ballester, J.; Valentin, D. Perception of wine quality according to extrinsic: The case of Burgundy wine consumers. Food Qual. Prefer. 2013, 27, 44–53. [Google Scholar] [CrossRef] [Scilit]
- Field, A. Discovering Statistics Using IBM SPSS Statistics, 4th ed.; SAGE: London, UK, 2013. [Google Scholar]
- Howell, D.C. Statistical Methods for Psychology, 8th ed.; Cengage Learning: Belmont, CA, USA, 2013. [Google Scholar]
- Delwiche, J. Strategies for flavour perception. In Handbook of Olfaction and Gustation, 2nd ed.; Wiley: Hoboken, NJ, USA, 2012; pp. 1047–1062. [Google Scholar]
- Zampini, M.; Sanabria, D.; Phillips, N.; Spence, C. The multisensory perception of flavor: Assessing the influence of colour cues on flavour discrimination responses. Food Qual. Prefer. 2007, 18, 975–984. [Google Scholar] [CrossRef] [Scilit]
- Ristic, R.; Danner, L.; Johnson, T.E.; Meiselman, H.L.; Hoek, A.C.; Jiranek, A.C.; Bastian, S.E.P. Wine-related aromas for different seasons and occasions: Hedonic and emotional responses of wine consumers from Australia, UK and USA. Food Qual. Prefer. 2019, 71, 250–260. [Google Scholar] [CrossRef] [Scilit]
- Siegrist, M.; Cousin, M.E. Expectations influence sensory experience in a wine tasting. Appetite 2009, 52, 762–765. [Google Scholar] [CrossRef] [Scilit] [PubMed]
- Capitello, R.; Begalli, D.; Agnoli, L. Determinants of consumer behavior in novice markets: The case of wine. J. Res. Mark. Entrep. 2015, 17, 110–126. [Google Scholar] [CrossRef] [Scilit]

Disclaimer/Publisher’s Note: The statements, opinions and data contained in all publications are solely those of the individual author(s) and contributor(s) and not of MDPI and/or the editor(s). MDPI and/or the editor(s) disclaim responsibility for any injury to people or property resulting from any ideas, methods, instructions or products referred to in the content. |
© 2026 by the authors. Licensee MDPI, Basel, Switzerland. This article is an open access article distributed under the terms and conditions of the Creative Commons Attribution (CC BY) license.