


Highlights
What are the main findings?
- FT-NIR enabled rapid multiparameter characterization of craft beer during fermentation and maturation.
- The NIRA transflectance accessory outperformed conventional quartz cuvette configurations in spectral quality and model performance.
What are the implications of the main findings?
- Second-derivative preprocessing improved the robustness of chemometric calibration and validation models.
- NIRA-based FT-NIR analysis provides a rapid tool for monitoring key physicochemical parameters in craft beer production.
Abstract
Near-infrared spectroscopy (NIR) is a non-destructive technique for rapid and accurate food analysis. FT-NIR analysis requires no solvents and is particularly suitable for routine quality control applications. This study evaluated the application of Fourier-transform near-infrared (FT-NIR) spectroscopy for estimating key physicochemical parameters in beer, including pH, final gravity, alcohol content, acidity, bitterness units (IBU), and α-acid content, in finished products and during late fermentation and maturation. A dataset of 350 samples was used for calibration and an independent hold-out subset of 50 samples was used for validation. Spectral data were collected with quartz cuvettes of 1.0, 0.5, and 0.1 cm path lengths, and a NIRA reflectance accessory (0.1 cm). Models were developed using Partial Least Squares (PLS) regression with 10 latent variables and processed via Spectrum Quant software. All configurations produced calibration R2 values above 0.84. Baseline corrections with first and second derivatives were tested. While most models exhibited satisfactory calibration performance, only NIRA maintained satisfactory performance in the independent hold-out validation subset, with regression slopes closest to unity and comparatively low standard errors. The model was applied as an exploratory case study to monitor physicochemical changes during a single fermentation and maturation process, showing no statistically significant differences from conventional analytical methods.
1. Introduction
Beer styles are traditionally characterized by physicochemical parameters such as original gravity, final gravity, alcohol content, color, and bitterness, which are essential for classification and quality control [1]. These attributes influence sensory perception and consumer acceptance, and their determination is a routine requirement in brewing laboratories [2].
Conventional analytical methods—distillation, titration, spectrophotometry, chromatography, and refractometry—are well established but often involve solvent use, generate chemical waste, and require extensive sample preparation. For instance, the determination of International Bitterness Units (IBUs) and α-acids typically relies on solvent extraction, while other parameters such as turbidity, pH, and total acidity demand multiple instruments and sequential analyses. These limitations underscore the need for rapid, cost-effective, and environmentally sustainable alternatives capable of delivering multi-parameter results in a single step [3].
Vibrational spectroscopy techniques, particularly mid-infrared (MIR) and near-infrared (NIR), have emerged as powerful tools for food quality assessment. Their main advantages include minimal or no sample preparation, non-destructive measurement, rapid acquisition, and the ability to simultaneously estimate multiple physicochemical parameters through chemometric modelling. In the brewing sector, these techniques are applicable both in laboratory settings and in-line during production, enabling real-time process monitoring and quality control [4].
MIR spectroscopy has demonstrated strong correlations for parameters such as original, apparent, and real extract, degrees of fermentation, and alcohol content. However, its ability to accurately estimate low-concentration compounds, such as α-acids and bitterness-related compounds, may be limited when calibration datasets do not adequately capture sample variability. Expanding the diversity of beer styles and production conditions in FT-NIR modeling may improve model performance and increase the applicability of the calibration models within the studied sample population [5].
Recent research has reinforced the potential of MIR-based approaches. Meza-Márquez et al. [2] developed Fourier-transform mid-infrared (FT-MIR) chemometric models capable of simultaneously predicting color, alcohol content, bitterness, turbidity, pH, and total acidity in craft beers from 24 styles. Their partial least squares (PLS) models achieved excellent calibration and validation statistics (R2 > 0.98) with analysis times of approximately six minutes, without the use of solvents or reagents. These findings demonstrate that FT-MIR can deliver rapid, accurate, and eco-friendly multi-parameter analysis, offering a viable alternative to conventional methods for small and medium-scale breweries.
While MIR has proven effective, NIR spectroscopy offers additional advantages for liquid samples. NIR radiation penetrates deeper into the sample matrix, allowing measurements via simple optical paths such as transmission or transflectance, with minimal sample preparation. This facilitates direct analysis of turbid or colored liquids, where MIR often requires dilution or specialized cells to mitigate absorption and scattering effects. Moreover, NIR spectra are less affected by water absorption bands dominant in the MIR region, enabling more reliable measurements in aqueous systems. The technique also supports fiber-optic probes for in-line or at-line monitoring under industrial conditions, without interrupting process flow [6].
Although NIR has been applied to monitor fermentation parameters online, most studies have been conducted under controlled conditions and limited style diversity [7]. The broader applicability of NIR across diverse beer styles—both during fermentation and in final products—remains underexplored.
Recent applications of NIR in brewing have expanded beyond basic compositional analysis. González Viejo et al. [3] demonstrated that NIR spectroscopy combined with machine learning could assess beer quality through the bottle, predicting sensory and physicochemical attributes without opening the container. The effectiveness of such approaches may depend on bottle characteristics, including color and optical properties, which can influence spectral transmission. Similarly, Harris et al. [8] applied non-invasive NIR and advanced modelling to authenticate beers, assess quality, and detect faults, highlighting the potential for rapid screening in commercial environments. These innovations position NIR as a tool not only for quality control but also for product authentication and market differentiation.
The reliability and performance of chemometric models in both MIR and NIR applications depend heavily on the diversity of calibration datasets, optimization of acquisition parameters, and management of spectral artefacts such as saturation and noise. Recent reviews emphasize that careful selection of accessories, control of measurement conditions, and appropriate pre-processing are critical to maximizing model performance and minimizing the risk of overfitting [9].
In this context, expanding the application of FT-NIR spectroscopy to a wider range of beer styles and production conditions could strengthen model generalizability and further support its application for both final product assessment and fermentation monitoring. Building on the demonstrated capabilities and operational advantages of NIR, the present study aims to develop and evaluate chemometric models for multi-parameter beer quality control, with a focus on enhancing speed, sustainability, and applicability across diverse brewing scenarios.
2. Materials and Methods
2.1. Sampling
Craft beer samples were provided by brewers affiliated with the Asociación de Cerveceros del Litoral, who commercialize their products at festivals and public events held in Resistencia, Chaco, Argentina. The beer samples were collected by the brewers themselves and packaged in amber-colored bottles. All samples were stored under refrigeration at 4 °C until analysis. The sampling methodology followed procedures previously established by the authors [10].
Beer samples were maintained in their original amber bottles until analysis. Prior to FT-NIR measurements, bottles were opened immediately before spectral acquisition and samples were gently degassed to minimize the influence of dissolved carbon dioxide and foam formation on the recorded spectra. Spectral measurements were performed immediately after sample preparation in order to minimize compositional changes associated with the loss of volatile compounds, particularly ethanol. All samples were handled using a standardized analytical procedure and measured under identical laboratory conditions throughout the study. The same protocol was applied consistently to both calibration and validation samples.
To maximize the variability represented in the dataset, no style-based separation was performed during the initial sampling phase. In addition, for the analysis of physicochemical parameters during the final stages of fermentation and maturation, beer was produced using a 40 L pilot-scale system available at the research facility, following protocols described in previous studies [11]. The exploratory monitoring experiment was performed during a single fermentation and maturation process. For the fermentation and maturation monitoring experiment, all physicochemical determinations were performed in triplicate. Results are reported as mean values, and the corresponding standard deviations were calculated from triplicate measurements.
The styles selected for targeted analysis were those with the highest production volume among regional craft brewers: British Golden Ale, English IPA, American Pale Ale, Irish Red Ale, American Amber Ale, American Porter, American Stout, and Dorada Pampeana, an Argentine style. A total of eight styles were included in the modeling phase, with fifty samples per style previously analyzed and classified according to their physicochemical parameters [10].
2.2. Physicochemical Attributes
International standards established by the Mitteleuropäische Brautechnische Analysenkommission (MEBAK) [12] were adopted as reference protocols for the determination of physicochemical parameters. Alcoholic strength (% ABV) was measured using refractometry and pycnometry, following the correlation outlined in MEBAK method 2.9.5. A manual refractometer (MLAT China), previously calibrated with distilled water, was employed to determine the refractive index required for alcohol calculation. Final gravity (FG) was assessed by pycnometry at 20 °C, in accordance with MEBAK method 2.9.2.2, expressed as a dimensionless unit relative to the FG of water at the same temperature × 1000. Titratable acidity (TA) was determined according to MEBAK method 3.2.3, using potentiometric titration with 0.25 mol/L sodium hydroxide, and results were expressed as % w/w lactic acid. Prior to analysis, beer samples were degassed to eliminate dissolved carbon dioxide. Bitterness (IBU) and α-acid content were determined according to MEBAK method 2.17.2 and quantified spectrophotometrically as previously described by Gómez Pamies et al. [11]. Results were expressed as IBU and mg/L, respectively. All physicochemical determinations were performed in triplicate, and the values used for chemometric model development correspond to the mean of the analytical replicates.
2.3. Spectral Acquisition and Processing
Spectral acquisition was carried out using a Spectrum Two FT-NIR spectrometer (PerkinElmer, Waltham, MA, USA), equipped with a tungsten halogen light source and an InGaAs detector. The instrument operated within the 10,000–4000 cm−1 range, at a resolution of 4 cm−1, averaging 32 scans per measurement.
A total of 400 independent craft beer samples representing eight beer styles (50 samples per style) were included in the study. Of these, 350 samples were employed for model calibration, while the remaining 50 samples were reserved for independent hold-out validation. Sample allocation was performed by random selection from the complete dataset. No formal stratification by beer style, brewery, production batch, or recipe was applied. Samples assigned to the validation subset were excluded from all stages of model development, calibration, and optimization to ensure an independent assessment of model performance. Prior to spectral acquisition, physicochemical parameters were determined using standard analytical methods, as previously described.
Spectral acquisition was conducted using quartz cuvettes with optical path lengths of 1.0 cm, 0.5 cm, and 0.1 cm in transmission mode, where infrared light passed directly through the liquid sample, with air used as the background reference. In parallel, the Near-Infrared Reflectance Sampling Accessory (NIRA) of the Spectrum Two FT-NIR spectrometer was employed using a 0.1 cm optical path length. In this configuration, 3 mL of beer were placed in 40 mm Petri dishes, and an aluminium transflectance adapter was positioned above the sample to serve as an inert reflective surface. This setup enabled transflectance measurements using an aluminium reflective surface to provide a fixed optical path length of 0.1 cm.
Spectral processing was performed using Spectrum Quant software version 10.7.2 (PerkinElmer Inc., Waltham, MA, USA), applying the Partial Least Squares (PLS) algorithm with ten latent variables per model. The same number of latent variables was maintained across all models to ensure consistent comparison among optical configurations and preprocessing strategies. Pre-processing steps included spectral normalization and baseline correction, using first- and second-derivative transformations as appropriate to enhance signal quality and minimize noise.
Model performance was assessed using statistical parameters automatically generated by the Spectrum Quant software, including the coefficient of determination (R2) for calibration and validation datasets, the Standard Error of Estimate (SEE), and the Standard Error of Prediction (SEP). The SEE describes the goodness of fit of the calibration models to the calibration dataset, whereas the SEP represents the prediction error estimated through the software validation procedure. Additionally, regression slopes and their corresponding standard errors were calculated from the independent hold-out validation subset to compare the performance of the different cuvette path lengths and NIRA configurations under identical evaluation conditions.
Statistical comparisons between physicochemical parameters obtained by conventional analytical methods and those estimated by the FT-NIR models during the fermentation and maturation monitoring experiment were performed using Student’s t-test. Differences were considered statistically significant at p < 0.05.
3. Results and Discussion
3.1. Physicochemical Characteristics of Beer Samples
The research group previously classified and characterized the most widely produced craft beer styles in Chaco and Corrientes provinces of Argentina, which are marketed at local artisanal fairs across the region [11]. The physicochemical parameters of beer samples under study are as follows: the pH ranged from 4.10 to 4.75, with a mean of 4.39; FG varied between 1000 and 1017, with an average of 1007; ABV spanned from 1.99% to 7.65%, with a mean of 4.50%; TA ranged from 0.107% to 0.448%, with an average of 0.240%; IBU ranged from 7.66 mg/L to 52.53 mg/L, with a mean of 29.72 mg/L; α-acid content (AA) varied from 0.76 mg/L to 21.28 mg/L, with an average value of 9.51 mg/L. The parameters studied exhibited wide variation, with IBU and α-acids showing the greatest dispersion across styles. The broad variability represented in the present dataset may contribute to improving model performance and extending the applicability of the calibration models within the studied sample population. This approach responds to a growing demand in the brewing sector for rapid, non-destructive analytical tools that support quality assurance and process optimization [13,14]. Although prior studies have confirmed the feasibility of NIR for estimating key parameters during fermentation, they often relied on limited experimental conditions [8]. By incorporating a broader range of styles and fermentation profiles, the present study aims to contribute to the development of a more generalizable chemometric framework.
3.2. Comparative Spectral Analysis and Modeling
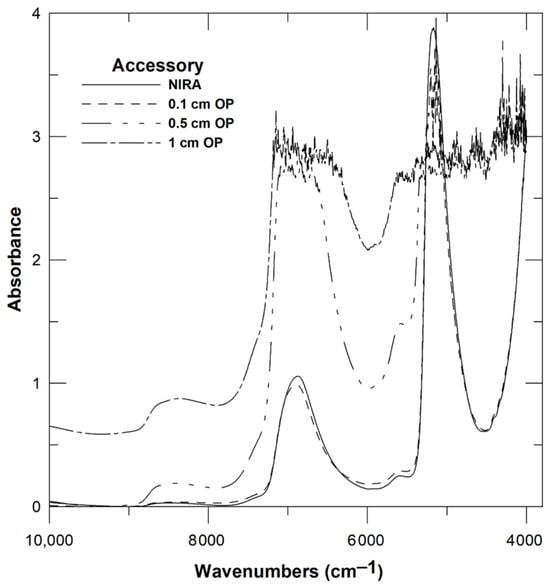
Figure 1 displays comparative spectra acquired using various optical accessories. For each quartz cuvette accessory, the optimal absorbance cutoff was individually configured to minimize spectral noise: 4.3 for a 0.1 cm path length, 4.1 for 0.5 cm, and 3.8 for 1 cm. These adjustments were necessary due to saturation zones and reduced resolution observed in the spectra obtained with quartz cuvettes. In contrast, no absorbance cutoff was required when using NIRA, as the spectra exhibited no detectable noise across the full spectral range, allowing for direct calibration without threshold adjustment.
Figure 1.
FT-NIR spectra obtained using quartz cuvettes with optical path lengths of 0.1 cm, 0.5 cm, and 1 cm, and NIRA transflectance accessory.
Optimizing the optical accessory geometry and acquisition parameters was decisive for improving calibration performance. Saturation in specific spectral regions can obscure relevant absorption features or introduce systematic calibration errors, particularly in FT-NIR applications, where the signal-to-noise ratio and baseline stability are critical [15]. Limiting maximum absorbance not only improves spectral clarity, but also enhances measurement reproducibility and reduces instrumental variability, both of which are essential for the reliable modeling of complex matrices such as beer. Recent studies have similarly emphasized the importance of optimizing instrumental configurations and managing saturation zones to maximize informative spectral data while minimizing the risk of overfitting [16].
The comparative analysis of accessory configurations revealed strong calibration performance across all evaluated parameters, with second-derivative models consistently outperforming those based on the first derivative. It is important to note that the statistics presented in Table 1 correspond to model development statistics generated during calibration and internal software validation procedures. These metrics describe the goodness of fit of the calibration models and should not be interpreted as evidence of predictive performance on unseen samples. The predictive ability of the models was subsequently assessed using an independent hold-out validation subset (n = 50 samples), and the corresponding results are presented in Table 2.
Table 1.
Statistical performance parameters (R2, SEE, and SEP) of the calibration models obtained using first- and second-derivative preprocessing for different cuvette and accessory configurations.
Table 2.
Regression slope and its standard error obtained from the independent hold-out validation subset using first- and second-derivative spectral preprocessing, assessed across different cuvette path lengths and accessory configurations.
As shown in Table 1, the calibration models exhibited high coefficients of determination (R2). For the second derivative, values ranged from 0.9436 for IBU prediction using the 0.1 cm cuvette to 0.9824 with NIRA, whereas the corresponding first-derivative models yielded lower values (0.8371 and 0.9454, respectively). This marked improvement indicates that second-derivative preprocessing improved the statistical performance of the calibration models obtained in the present study, thereby supporting the applicability of FT-NIR spectroscopy for beer analysis within the scope of the studied dataset. The superior performance was evident across most properties and configurations; for example, ABV prediction with NIRA achieved an R2 of 0.9759 using the second derivative compared to 0.9247 with the first. Estimation precision also improved, as reflected in lower Standard Error of Estimate (SEE) and Standard Error of Prediction (SEP) values for second-derivative models.
Using PLS regression, strong correlations were obtained across all variables, with particularly high accuracy for FG and ABV, parameters that typically exhibit stronger and more stable analytical relationships. These findings align with recent studies validating NIR spectroscopy and multivariate modeling for rapid beer quality assessment. For instance, Fulgêncio et al. [17] reported SEP values below 0.6% and R2 above 0.99 for ABV prediction across 92 beer samples using portable NIR and PLS regression. Similarly, González Viejo et al. [18] demonstrated classification accuracies above 0.95 for early fault detection in commercial beers using NIR data and artificial neural networks.
Although all accessory configurations yielded strong calibration statistics (Table 1), the results obtained from the independent hold-out validation subset (Table 2) revealed substantial differences between calibration and validation performance. The NIRA-based models produced validation slopes that were considerably closer to unity and exhibited lower standard errors than those obtained with quartz cuvettes. In contrast, the quartz-cuvette configurations failed to maintain the calibration relationships when evaluated using the hold-out validation subset, despite their high calibration R2 values. These findings highlight the importance of independently assessing model performance beyond calibration statistics alone.
As shown in Table 2, increasing the optical path length in quartz cuvettes was associated with a progressive deterioration in validation performance. The quartz-cuvette configurations exhibited regression slopes that deviated substantially from unity and, in some cases, approached zero or became negative. These results indicate reduced agreement between estimated and reference values and suggest that the calibration relationships observed during model development were not maintained when evaluated using the independent hold-out validation subset. In contrast, NIRA produced slopes closer to unity with lower standard errors, indicating more consistent performance under the evaluated conditions.
The independent hold-out validation subset was evaluated using regression slopes and their corresponding standard errors. These statistics enabled comparison of the different optical configurations under identical validation conditions. While this approach allowed identification of the most suitable measurement configuration, additional statistical parameters could provide a more comprehensive assessment of model performance and should be considered in future investigations.
NIRA was specifically designed to generate attenuated spectra across the full measurement range, particularly for aqueous samples. Its sealed architecture and integrated calibration standard minimize environmental interference, enhancing reproducibility and reducing error margins. A key advantage of NIRA is its support for transflectance measurements, ideal for gels and liquids. In this configuration, incident radiation passes through the sample and is reflected back via an inert mirror surface, effectively doubling the optical path length while maintaining fixed geometry [19,20]. This ensures consistent, rapid measurements with high analytical precision, as the adapter’s fixed height guarantees uniform path length across samples. The present study provides additional insights into FT-NIR workflow optimization, particularly regarding calibration and independent validation.
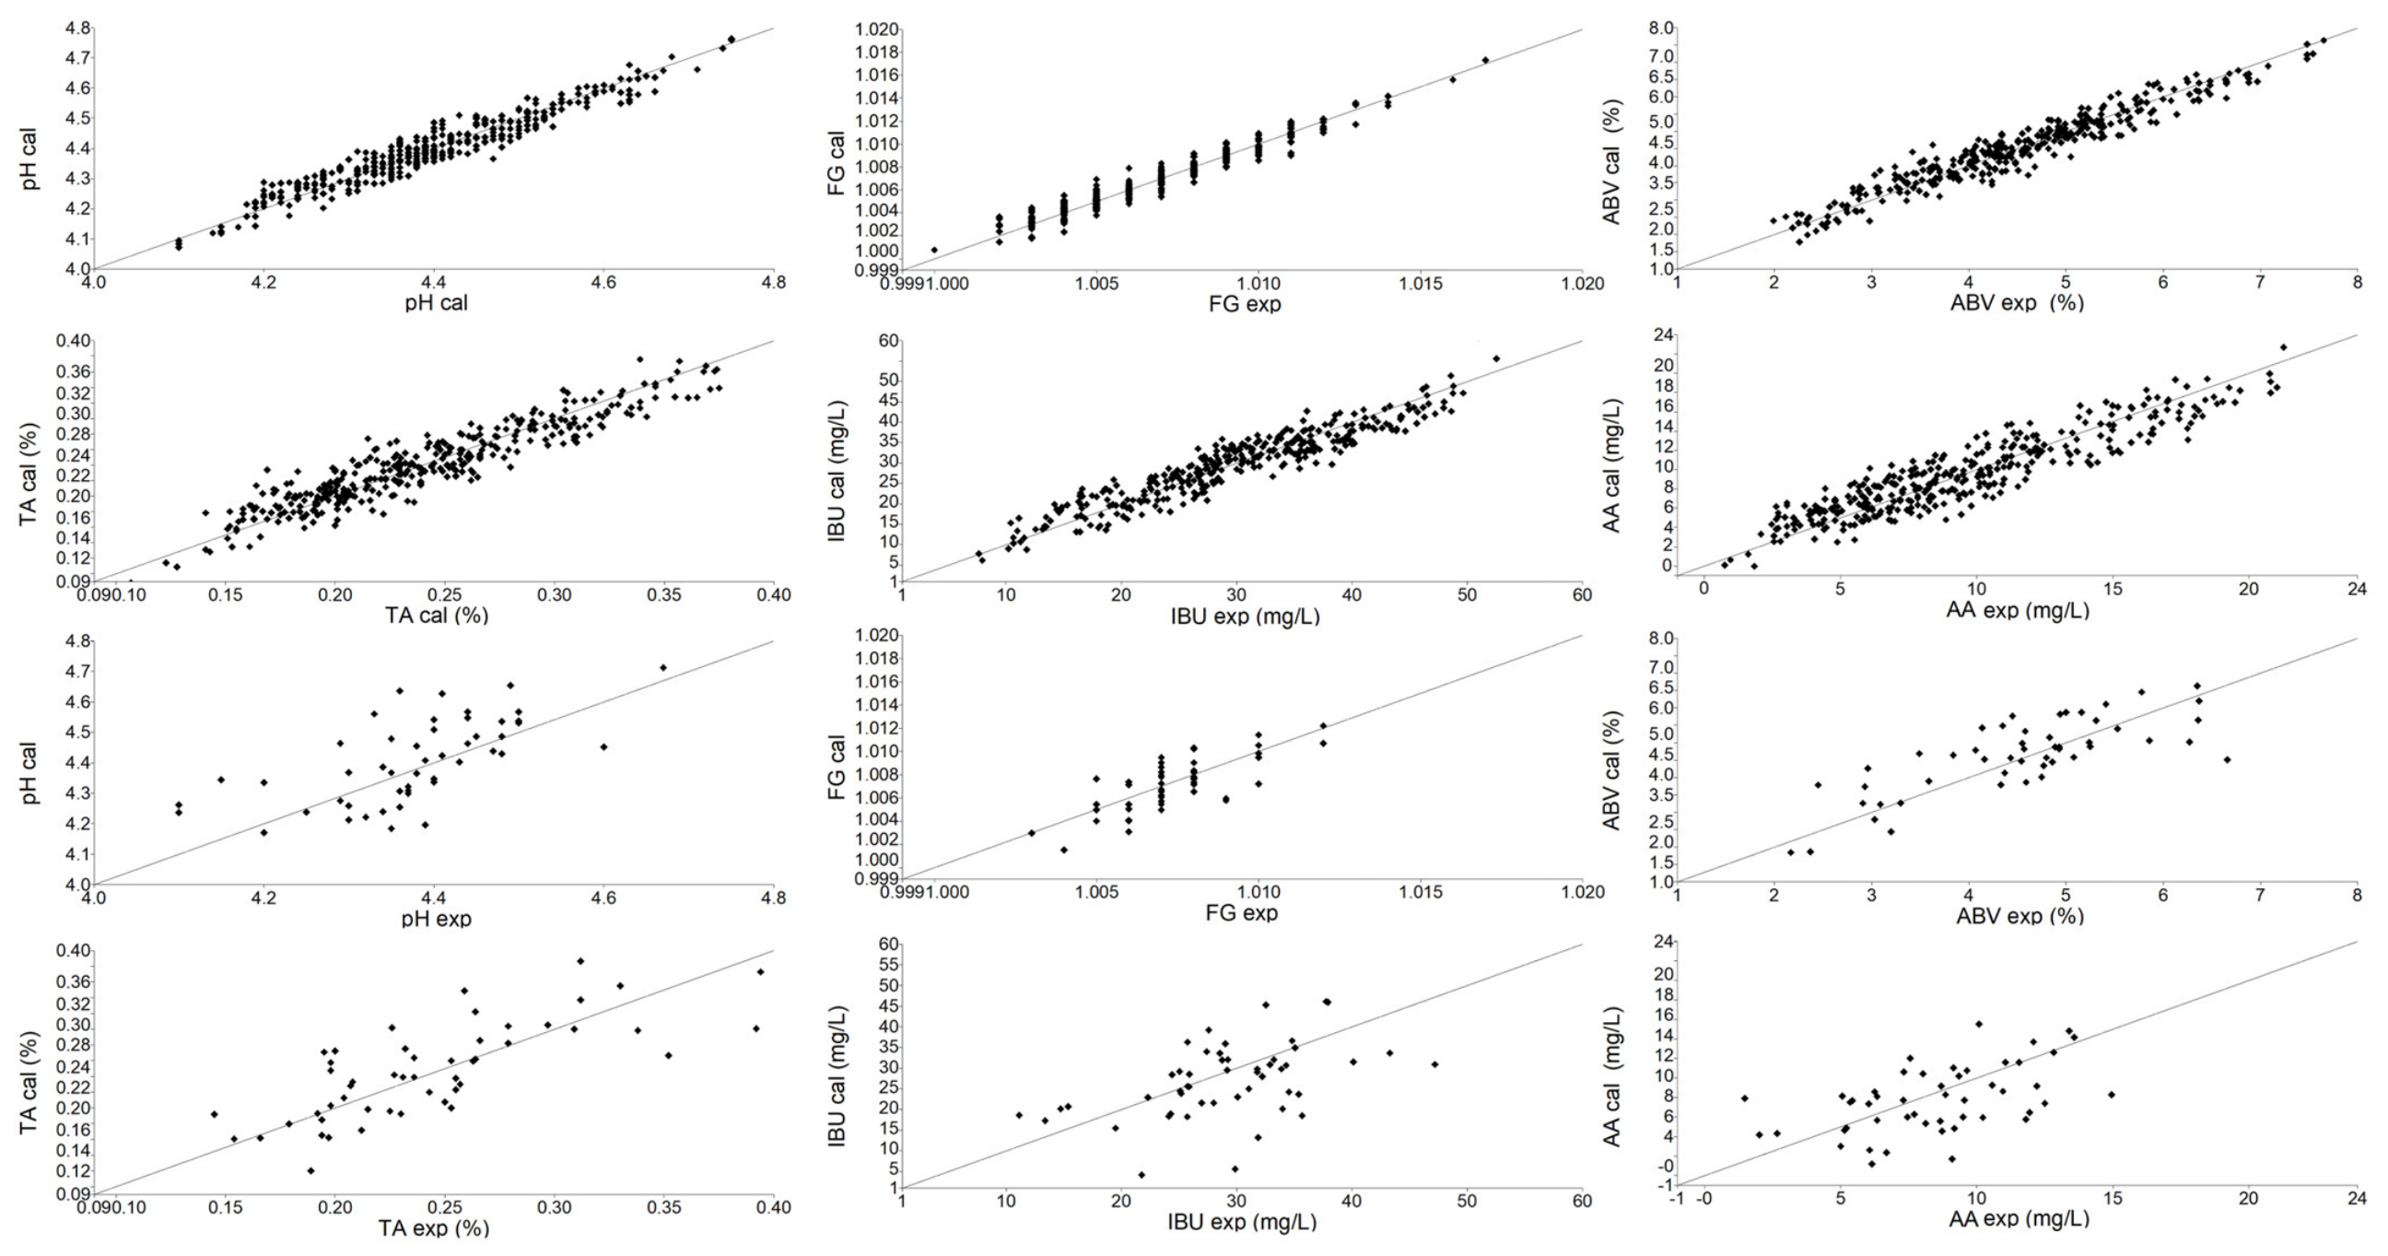
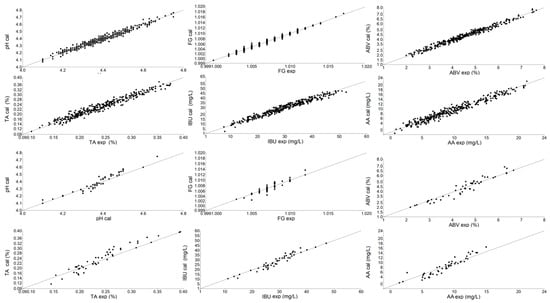
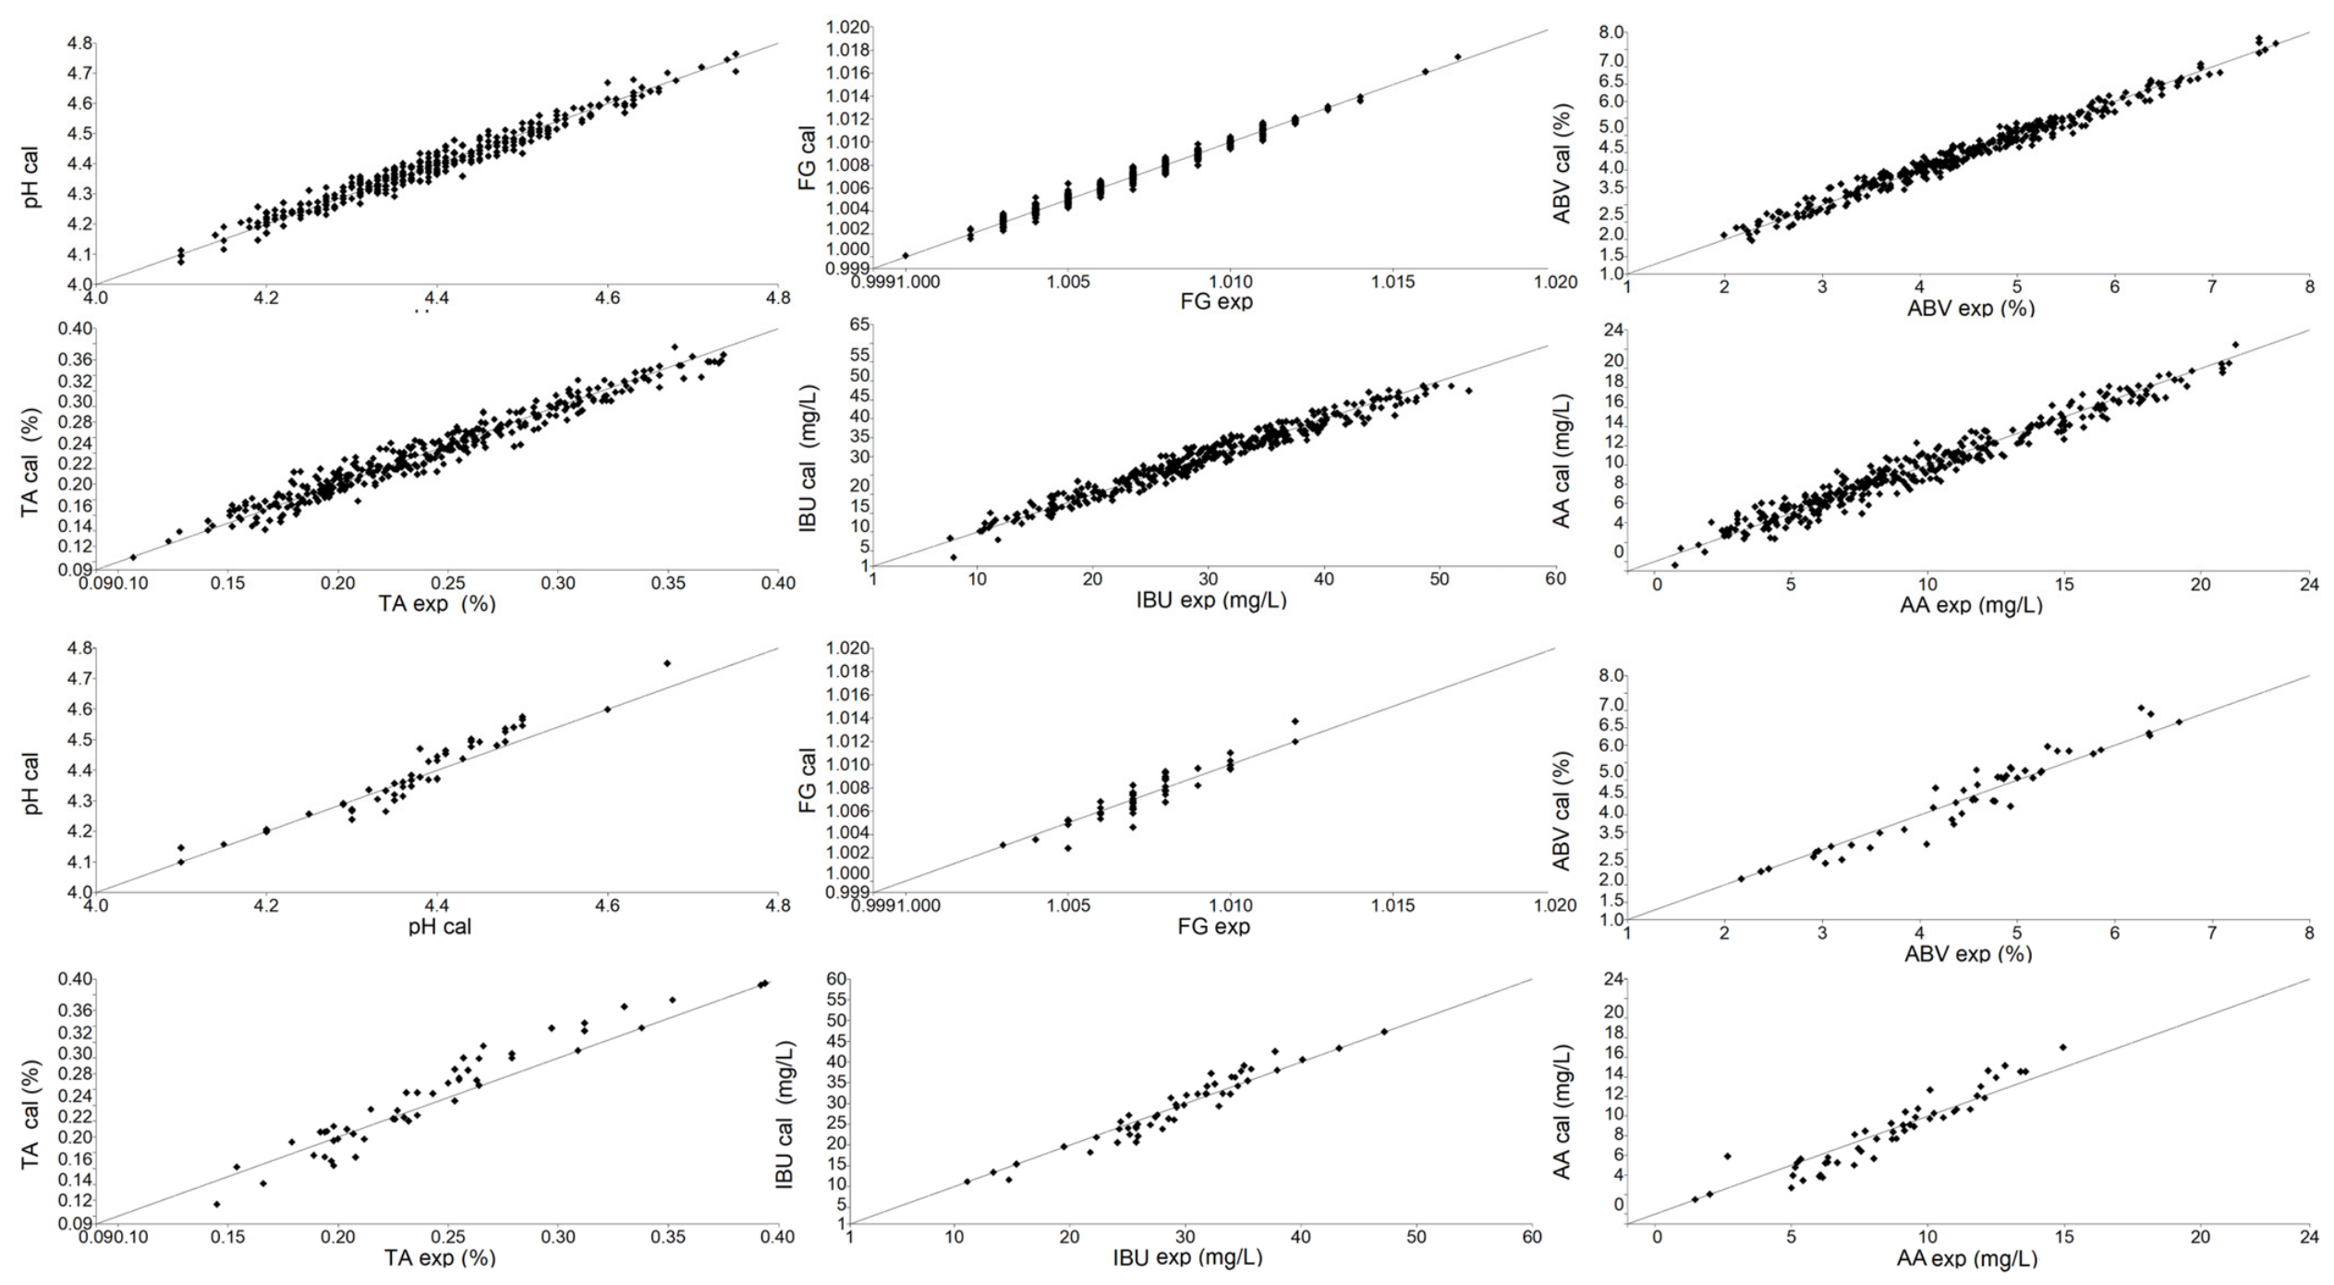
Figure 2 displays calibration plots using NIRA and first-derivative transformation. In all cases, verification yielded slope values below 1, indicating systematic underestimation of experimental values. Figure 3 presents the same analysis using the second derivative, showing significantly improved calibration and verification performance, with regression slopes approaching unity. This enhancement was especially notable for the estimation of IBU and α-acid content, which have previously been difficult to model accurately [21]. This may be one of the advantages of employing NIRA in combination with second-derivative preprocessing, as it improved the estimation of reference values associated with low-concentration analytes such as α-acids within the studied sample set. Furthermore, this precision complements the accurate simultaneous quantification of the other evaluated beer parameters.
Figure 2.
Calibration and verification models developed using the PLS algorithm and first-derivative transformation for pH, total acidity, final gravity, alcohol content, IBU, and α-acids.
Figure 3.
Calibration and verification models developed using the PLS algorithm and second derivative transformation for pH, total acidity, final gravity, alcohol content, IBU, and α-acids.
Although the results obtained for IBU and α-acids were encouraging, these models should be interpreted as empirical chemometric models calibrated against reference measurements rather than as direct spectroscopic quantification of isolated α-acids or iso-α-acids. The estimation performance observed may be influenced not only by spectral information associated with bitterness-related compounds but also by covariance with other compositional characteristics present in the studied beer samples. Further studies involving variable-importance analyses and additional validation strategies would be valuable to better understand the specificity of these models.
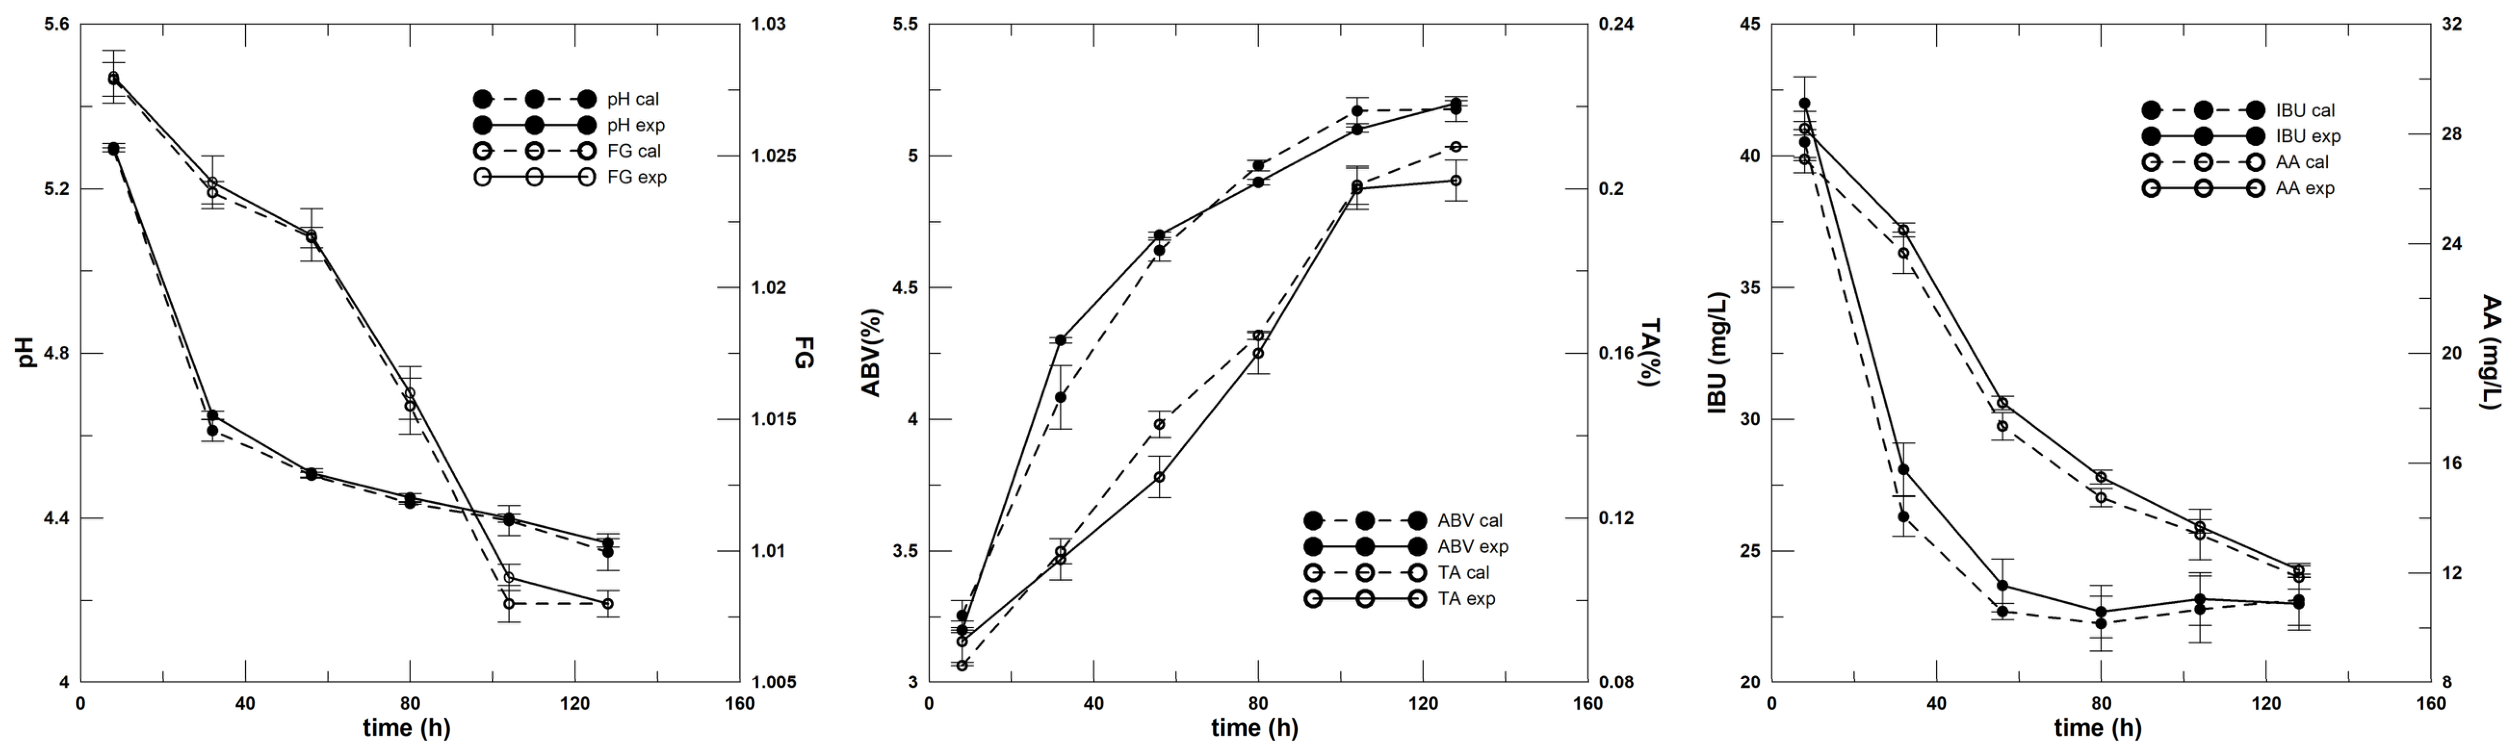
The second-derivative-based model was applied in an exploratory case study to evaluate physicochemical changes during the final stages of fermentation and maturation, with emphasis on the final stage, which plays a key role in beverage clarification and sensory stabilization. Recent studies have shown that NIR spectroscopy effectively tracks late-stage fermentation dynamics and maturation-related changes, including reductions in suspended particles and bitterness compounds [22]. Experimental and predicted values showed no statistically significant differences according to Student’s t-test (p > 0.05), as illustrated in Figure 4. The first three data points correspond to the final hours of fermentation, while the last three represent the maturation phase, monitored at 8-h intervals.
Figure 4.
Comparison between the selected predictive model and physicochemical parameters obtained through conventional analytical methods and chemometric estimation. Error bars represent standard deviations calculated from triplicate measurements.
During maturation, yeast cells undergo flocculation and sedimentation, facilitating the removal of suspended particles and contributing to visual and colloidal stability. This clarification process is crucial for improving filtration efficiency and shelf-life [23]. Sedimentation of yeast and solids during maturation also correlates with a measurable decline in bitterness compounds such as IBU, which stabilize once conditioning is complete. This phenomenon has been observed in both industrial and craft brewing, where premature or delayed flocculation can significantly affect flavor balance and product consistency [24].
The observed changes in selected parameters align with expectations for fermentation and maturation, particularly regarding yeast dynamics and flocculation behavior [25]. Physicochemical variations during maturation are typically less pronounced than during fermentation, suggesting that this approach may have potential for identifying the transition between fermentation and maturation, often marked by shifts in specific gravity and alcohol content [26]. However, additional validation would be required to confirm its applicability under different brewing conditions. In the current context, where craft brewers increasingly focus on yeast reuse, subtle batch-to-batch variations in these parameters may serve as indicators for determining whether continued yeast reuse is advisable or whether a fresh inoculum should be introduced [27].
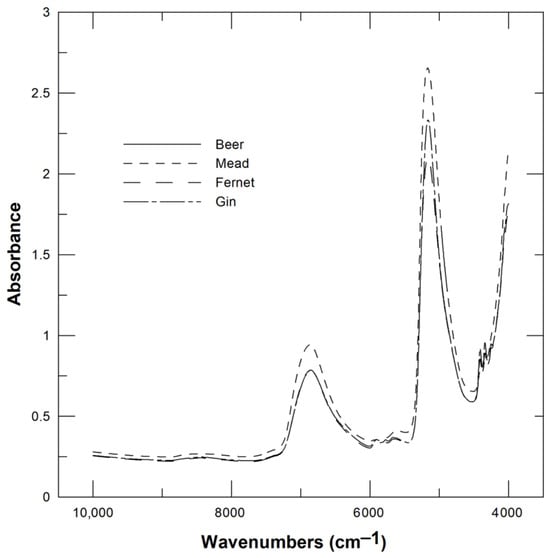
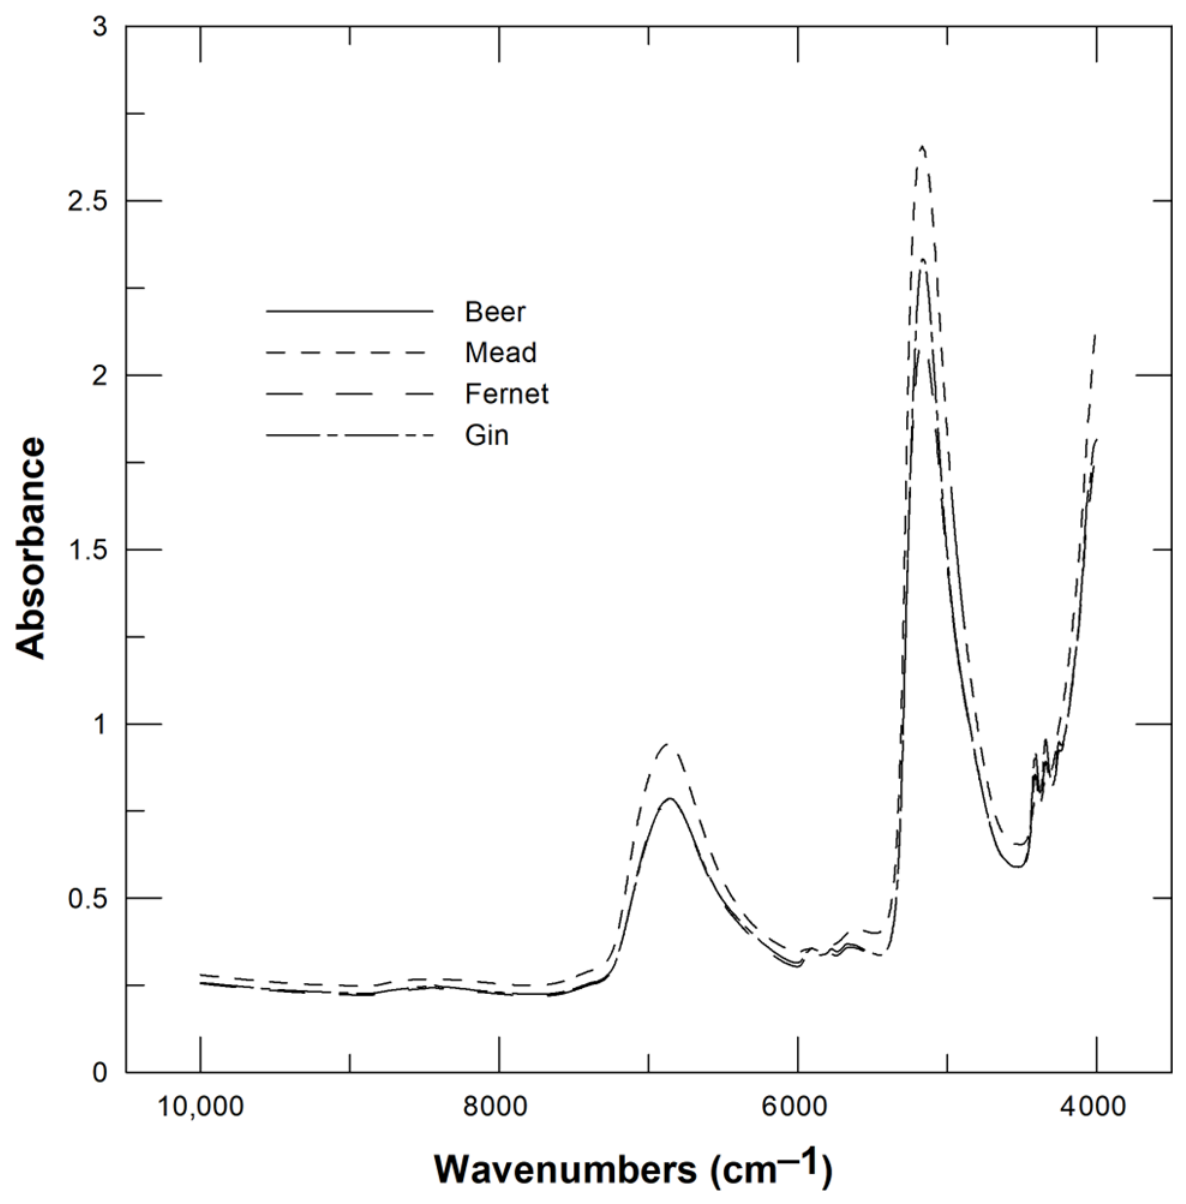
To explore the potential applicability of FT-NIR measurements beyond beer, spectra were also acquired from mead, fernet, and gin, beverages frequently offered by craft producers at regional fairs (Figure 5). These measurements were not included in model calibration or validation and should therefore be regarded as a preliminary exploratory assessment rather than a validation of model transferability across beverage matrices. In the spectral region between 4000 and 5000 cm−1, differences associated with alcohol content were observed, consistent with previous reports for alcoholic beverages [17]. Chemometric analysis yielded ABV values of 4.7 ± 0.2%, 22.3 ± 0.3%, and 28.7 ± 0.4%, and FG values of 1007 ± 1, 1027 ± 1, and 1030 ± 1 for mead, fernet, and gin, respectively. The corresponding estimates obtained using the developed models were 4.5 ± 0.2%, 22.8 ± 0.3%, and 29.4 ± 0.3% for ABV, and 1007 ± 1, 1026 ± 1, and 1029 ± 1 for FG. Although these observations suggest potential areas for future investigation, they do not constitute validation of the beer-derived models for other alcoholic beverages. Additional studies involving larger datasets and beverage-specific calibration strategies would be required to evaluate the applicability of the approach across different matrices. Furthermore, spectral differences were observed around 4560 cm−1, suggesting that this region may warrant further investigation in future studies involving different alcoholic beverages.
Figure 5.
FT-NIR spectra obtained using NIRA transflectance accessory for Beer, Mead, Fernet and Gin.
4. Limitations
The main limitations of this study relate to the transferability of the calibration models developed. The models were generated using a specific FT-NIR instrument and its accessories; therefore, their direct application with different equipment or optical configurations may require adjustments or recalibration procedures. In addition, the calibration and validation datasets consist of beer samples produced in the provinces of Chaco and Corrientes, in Argentina. These samples are representative of local craft brewing practices and share several characteristics, including commonly used raw materials and similar water sources. Consequently, prior to routine implementation, the applicability of the models to beers produced in other geographic regions—with substantially different raw materials, water composition, brewing practices, or product characteristics—should be evaluated. Nevertheless, the present results demonstrate the viability of FT-NIR spectroscopy as a rapid tool for monitoring relevant physicochemical parameters during beer production and provide a methodological foundation for future studies in other brewing contexts and, following appropriate beverage-specific validation, potentially other fermented beverages.
In addition, the calibration and validation samples originated from the same regional brewing population and were separated through random hold-out allocation rather than through independent external sampling. Consequently, the reported validation results should be interpreted within the scope of the current dataset. Further studies involving independent breweries, broader geographical origins, and leave-one-style-out validation approaches would be valuable for assessing model transferability and robustness.
5. Conclusions
This study confirms the effectiveness of FT-NIR spectroscopy combined with second-derivative transformation and NIRA transflectance for rapid, accurate, and solvent-free characterization of craft beer. The chemometric models enabled the estimation of key physicochemical parameters with minimal sample preparation and satisfactory reproducibility. Among all tested optical configurations, NIRA transflectance consistently delivered superior spectral quality, particularly in aqueous samples, while derivative correction improved baseline stability and model performance.
Beyond final product assessment, the methodology provided preliminary evidence of its applicability for monitoring physicochemical trends during a single fermentation and maturation process, including changes associated with clarification and sedimentation. These observations should be regarded as exploratory findings obtained under the specific conditions evaluated in the present study. Further investigations involving additional fermentation stages, independent production batches, and broader validation strategies will be necessary to assess the applicability of the approach throughout the brewing process.
Author Contributions
Conceptualization, L.C.G.P.; methodology, M.A.B., L.C.G.P., A.P.F., M.M.L.R. and E.I.B.; software, L.C.G.P. and M.M.L.R.; validation, M.A.B. and E.I.B.; formal analysis, A.P.F.; investigation, M.A.B.; L.C.G.P. and E.I.B.; data curation, L.C.G.P.; writing—original draft preparation, M.A.B.; writing—review and editing, M.A.B. and E.I.B.; visualization, M.A.B., L.C.G.P., M.M.L.R. and E.I.B.; supervision, E.I.B.; project administration, E.I.B.; funding acquisition, E.I.B. All authors have read and agreed to the published version of the manuscript.
Funding
Financial support enabled by Universidad Tecnológica Nacional—Facultad Regional Resistencia and Consejo Nacional de Investigaciones Científicas y Tecnológicas (CONICET). No specific grant number is associated with this work.
Institutional Review Board Statement
Not applicable.
Informed Consent Statement
Not applicable.
Data Availability Statement
The original contributions presented in this study are included in the article. Further inquiries can be directed to the corresponding author.
Acknowledgments
During the preparation of this manuscript, the authors used Microsoft Copilot (Microsoft, 2026) for the purposes of language editing and English-language improvement. Additionally, Gemini 3.5 (Google, 2026) was used to assist in generating visual elements for the graphical abstract. The authors have reviewed and edited the output and take full responsibility for the content of this publication.
Conflicts of Interest
The authors declare no conflicts of interest.
Abbreviations
The following abbreviations are used in this manuscript:
| NIR | Near-infrared spectroscopy |
| NIRA | Near-Infrared Reflectance Sampling Accessory |
| FT-NIR | Fourier-transform NIR |
| MID | Mid-infrared spectroscopy |
| PLS | Partial Least Squares |
| AA | α-acid content |
| FG | Final gravity |
| IBU | International Bitterness Units |
| ABV | Alcoholic strength |
| TA | Titratable acidity |
| R2 | Coefficient of determination |
| SEE | Standard Error of Estimate |
| SEP | Standard Error of Prediction |
| MEBAK | Mitteleuropäische Brautechnische Analysenkommission |
References
- Beer Judge Certification Program Style Guidelines. 2021. Available online: https://www.bjcp.org/style/2021/beer/ (accessed on 30 May 2025).
- Meza-Márquez, O.G.; Rodríguez-Híjar, A.R.; Gallardo-Velázquez, T.; Osorio-Revilla, G.; Ramos-Monroy, O.A. The Prediction of Quality Parameters of Craft Beer with FT-MIR and Chemometrics. Foods 2024, 13, 1157. [Google Scholar] [CrossRef] [Scilit] [PubMed]
- Gonzalez Viejo, C.; Fuentes, S. Beer Aroma and Quality Traits Assessment Using Artificial Intelligence. Fermentation 2020, 6, 56. [Google Scholar] [CrossRef] [Scilit]
- Cozzolino, D. Advantages, Opportunities, and Challenges of Vibrational Spectroscopy as Tool to Monitor Sustainable Food Systems. Food Anal. Methods 2022, 15, 1390–1396. [Google Scholar] [CrossRef] [Scilit]
- Mikyška, A.; Dušek, M.; Slabý, M. Effects of the Mashing Process on Polyphenols and Antiradical Activity of Beer. Eur. Food Res. Technol. 2023, 249, 71–80. [Google Scholar] [CrossRef] [Scilit]
- Ozaki, Y. Infrared Spectroscopy—Mid-Infrared, Near-Infrared, and Far-Infrared/Terahertz Spectroscopy. Anal. Sci. 2021, 37, 1193–1212. [Google Scholar] [CrossRef] [Scilit] [PubMed]
- Vann, L.; Layfield, J.B.; Sheppard, J.D. The Application of Near-Infrared Spectroscopy in Beer Fermentation for Online Monitoring of Critical Process Parameters and Their Integration into a Novel Feedforward Control Strategy. J. Inst. Brew. 2017, 123, 347–360. [Google Scholar] [CrossRef] [Scilit]
- Harris, N.; Gonzalez Viejo, C.; Zhang, J.; Pang, A.; Hernandez-Brenes, C.; Fuentes, S. Enhancing Beer Authentication, Quality, and Control Assessment Using Non-invasive Spectroscopy through Bottle and Machine Learning Modeling. J. Food Sci. 2025, 90, e17670. [Google Scholar] [CrossRef] [Scilit] [PubMed]
- Fodor, M.; Matkovits, A.; Benes, E.L.; Jókai, Z. The Role of Near-Infrared Spectroscopy in Food Quality Assurance: A Review of the Past Two Decades. Foods 2024, 13, 3501. [Google Scholar] [CrossRef] [Scilit] [PubMed]
- Gómez Pamies, L.C.; Bianchi, M.A.; Farco, A.P.; Vázquez, R.; Benítez, E.I. Improving Craft Beer Style Classification through Physicochemical Determination and the Application of Deep Learning Techniques. Food Sci. Technol. 2024, 44. [Google Scholar] [CrossRef] [Scilit]
- Gómez Pamies, L.C.; Lataza Rovaletti, M.M.; Martinez Amezaga, N.M.J.; Benítez, E.I. The Impact of Pirodextrin Addition to Improve Physicochemical Parameters of Sorghum Beer. LWT 2021, 149, 112040. [Google Scholar] [CrossRef] [Scilit]
- Mitteleuropäische Brautechnische Analysenkommission. Wort, Beer, Beer-Based Beverages; Hans Carl: Nuremberg, Germany, 2013. [Google Scholar]
- Fox, G. The Brewing Industry and the Opportunities for Real-Time Quality Analysis Using Infrared Spectroscopy. Appl. Sci. 2020, 10, 616. [Google Scholar] [CrossRef] [Scilit]
- França, L.; Grassi, S.; Pimentel, M.F.; Amigo, J.M. A Single Model to Monitor Multistep Craft Beer Manufacturing Using near Infrared Spectroscopy and Chemometrics. Food Bioprod. Process. 2021, 126, 95–103. [Google Scholar] [CrossRef] [Scilit]
- Zhang, F.; Tang, X.; Li, L. Origins of Baseline Drift and Distortion in Fourier Transform Spectra. Molecules 2022, 27, 4287. [Google Scholar] [CrossRef] [Scilit] [PubMed]
- Zheng, C.; Li, J.; Liu, H.; Wang, Y. Application of ATR-FTIR and FT-NIR Spectroscopy Coupled with Chemometrics for Species Identification and Quality Prediction of Boletes. Food Chem. X 2024, 23, 101661. [Google Scholar] [CrossRef] [Scilit] [PubMed]
- Fulgêncio, A.C.d.C.; Resende, G.A.P.; Teixeira, M.C.F.; Botelho, B.G.; Sena, M.M. Combining Portable NIR Spectroscopy and Multivariate Calibration for the Determination of Ethanol in Fermented Alcoholic Beverages by a Multi-Product Model. Talanta Open 2023, 7, 100180. [Google Scholar] [CrossRef] [Scilit]
- Gonzalez Viejo, C.; Fuentes, S.; Hernandez-Brenes, C. Smart Detection of Faults in Beers Using Near-Infrared Spectroscopy, a Low-Cost Electronic Nose and Artificial Intelligence. Fermentation 2021, 7, 117. [Google Scholar] [CrossRef] [Scilit]
- PerkinElmer Inc. NIRA II Near Infrared Reflectance Accessory: User’s Guide. 2013. Available online: https://pepolska.pl/app/uploads/2019/12/Near-Infrared_Reflectance_Sampling_Accessories_for_the_Frontier_and_Spectrum_Two_N_FT-NIR_Spectrometers_Product_Note.pdf (accessed on 18 May 2025).
- Ozaki, Y. Near-Infrared Spectroscopy; Huck, C., Tsuchikawa, S., Engelsen, S.B., Eds.; Springer: Singapore, 2021; ISBN 978-981-15-8647-7. [Google Scholar]
- Polshin, E.; Aernouts, B.; Saeys, W.; Delvaux, F.; Delvaux, F.R.; Saison, D.; Hertog, M.; Nicolaï, B.M.; Lammertyn, J. Beer Quality Screening by FT-IR Spectrometry: Impact of Measurement Strategies, Data Pre-Processings and Variable Selection Algorithms. J. Food Eng. 2011, 106, 188–198. [Google Scholar] [CrossRef] [Scilit]
- Yang, C.; Lingli, C.; Meijin, G.; Xu, L.; Jinsong, L.; Xiaofeng, L.; Zhongbing, C.; Xiaojun, T.; Haoyue, Z.; Xiwei, T.; et al. Application of Near-Infrared Spectroscopy Technology in the Complex Fermentation System to Achieve High-Efficiency Production. Bioresour. Bioprocess. 2021, 8, 96. [Google Scholar] [CrossRef] [Scilit] [PubMed]
- Zhou, X.; Suo, J.; Liu, C.; Niu, C.; Zheng, F.; Li, Q.; Wang, J. Genome Comparison of Three Lager Yeasts Reveals Key Genes Affecting Yeast Flocculation during Beer Fermentation. FEMS Yeast Res. 2021, 21, foab031. [Google Scholar] [CrossRef] [Scilit] [PubMed]
- Gibson, B.; He, Y. Why Settle? A Review of Timely and Premature Brewing Yeast Flocculation. J. Inst. Brew. 2025, 131, 3–26. [Google Scholar] [CrossRef] [Scilit]
- Stewart, G. Yeast Flocculation—Sedimentation and Flotation. Fermentation 2018, 4, 28. [Google Scholar] [CrossRef] [Scilit]
- Tessarini Estevão, S.; Lourenço, F.R. Real-Time Monitoring of Beer Parameters Using Infrared Spectroscopy—A Process Analytical Technology Approach. J. AOAC Int. 2020, 103, 1654–1659. [Google Scholar] [CrossRef] [Scilit] [PubMed]
- Cottrell, M.T. Sources of Variability in Determinations of Brewing Yeast Total Cell Counts and Viability Obtained by Microscopy. J. Am. Soc. Brew. Chem. 2025, 83, 80–87. [Google Scholar] [CrossRef] [Scilit]

Disclaimer/Publisher’s Note: The statements, opinions and data contained in all publications are solely those of the individual author(s) and contributor(s) and not of MDPI and/or the editor(s). MDPI and/or the editor(s) disclaim responsibility for any injury to people or property resulting from any ideas, methods, instructions or products referred to in the content. |
© 2026 by the authors. Licensee MDPI, Basel, Switzerland. This article is an open access article distributed under the terms and conditions of the Creative Commons Attribution (CC BY) license.