


Abstract
Franchise coffee shops now offer an increasingly diverse beverage portfolio with substantial variation in nutritional composition. However, cross-brand comparisons remain difficult because products are commonly organized according to proprietary menu names and marketing concepts rather than standardized nutritional attributes. This study developed and applied a standardized beverage classification framework based primarily on beverage ingredients and preparation characteristics to examine nutritional variation both within and across beverage categories. Nutritional information for 3586 beverages from 31 major franchise coffee brands was obtained from official websites. Beverages were systematically assigned to 10 standardized categories according to their ingredients and preparation methods. Serving size and per-serving contents of energy, total sugar, protein, saturated fat, sodium, and caffeine were analyzed and compared across beverage categories and between matched hot and iced products. All nutritional variables differed significantly among beverage categories (all p < 0.001). However, substantial within-category variability was also observed. For example, total sugar content among coffee beverages ranged from 13.0 g/serving at the 25th percentile to 48.0 g/serving at the 90th percentile. The findings demonstrate substantial nutritional variation both between and within standardized beverage categories, indicating that beverages sharing similar ingredient and preparation characteristics do not necessarily have similar nutritional profiles. The proposed framework provides a transparent and reproducible taxonomy for organizing heterogeneous beverage products across brands and may facilitate nutritional surveillance and comparative research.
1. Introduction
Excessive sugar intake is a major global public health concern because of its well-established associations with obesity and a broad range of chronic diseases. Among dietary sources, beverages are among the principal contributors to total sugar intake because they frequently contain large quantities of rapidly absorbable sugars while producing relatively weak satiety, thereby promoting excess energy consumption. Numerous epidemiological studies have consistently shown that frequent consumption of sugar-sweetened beverages (SSBs) is associated with increased risks of obesity, type 2 diabetes, cardiovascular disease, and several cancers [1,2,3,4]. Beyond these metabolic consequences, excessive sugar consumption has also been linked to adverse oral health outcomes, including periodontal disease [5,6].
In Korea, daily sugar intake has remained relatively stable at approximately 57–61 g, with a mean intake of 58.3 g reported in 2023 [7]. A substantial proportion of this intake is derived from processed foods, particularly beverages, followed by bakery products and rice cakes [8]. The Dietary Reference Intakes for Koreans recommend that total sugar intake be maintained within 10–20% of total energy intake and that added sugar intake remain below 10% [9]. Similarly, the World Health Organization recommends limiting free sugar intake to less than 10% of total energy intake and suggests reducing intake to below 5% to achieve additional health benefits [10]. Collectively, these recommendations highlight the importance of monitoring the nutritional composition of commercially available beverages.
The franchise coffee-shop market has expanded rapidly over the past decade. In addition to traditional espresso-based coffee, these establishments now offer a broad range of beverages prepared with milk, flavored syrups, whipped cream, fruit concentrates, tea, yogurt, and other ingredients. As a result, many commercially available beverages contain substantially more sugar and energy than consumers may anticipate. Previous studies have shown that some coffee-shop beverages contain more than 50 g of sugar per serving, suggesting that their sugar content may equal or exceed that of conventional sugar-sweetened beverages [11]. Given the widespread popularity of franchise coffee shops in Korea, these products have become an increasingly important potential source of daily sugar and energy intake.
As beverage menus have diversified, nutritional information has become an important tool for supporting healthier consumer choices. Most major franchise coffee brands now provide nutritional information through their websites or mobile applications; however, the mere availability of such information does not ensure that consumers can interpret or effectively use it when making purchasing decisions. Previous studies have shown that conventional nutrition labels may be difficult to interpret because they require consumers to compare multiple nutrients across numerous products. Simplified presentation formats have therefore been reported to improve product comparisons and facilitate healthier food choices. Consumer behavior studies have also indicated that purchasing decisions are more strongly influenced by menu names, product images, and other visual cues than by nutritional information itself, suggesting that the provision of nutrient values alone may be insufficient to promote healthier beverage selection [12,13,14].
Growing concern about excessive sugar consumption has prompted many countries to implement public health policies designed to reduce population-level sugar intake. Mexico introduced a nationwide excise tax on sugar-sweetened beverages in 2014, which was followed by significant reductions in purchases of taxed beverages, particularly among low-income households [15]. Similarly, the United Kingdom implemented the Soft Drinks Industry Levy in 2018, encouraging product reformulation and reducing the sugar content of commercially available beverages [16]. Comparable fiscal measures have also been adopted in countries including Chile and South Africa as components of broader public health strategies to reduce excessive sugar consumption [17]. These international initiatives underscore the need for continued surveillance of the nutritional composition of beverages available in the marketplace.
Despite the increasing availability of nutritional information, systematic comparisons of beverages sold by franchise coffee shops remain difficult because menus are typically organized according to brand-specific marketing concepts rather than standardized product characteristics. Consumers generally select beverages according to the menu names presented at the point of purchase; however, nomenclature varies considerably across franchise coffee brands and often reflects marketing strategies rather than underlying nutritional composition. Consequently, researchers seeking to evaluate nutritional patterns across the commercial beverage market lack a consistent taxonomy for organizing heterogeneous beverage products.
To address this limitation, the present study developed a standardized beverage classification framework based primarily on beverage ingredients, preparation methods, and nutritional characteristics (Table 1). Importantly, the framework was not intended to classify beverages according to nutritional quality or to assume that products within a category have equivalent nutritional profiles. Rather, it was designed to provide a transparent and reproducible taxonomy through which heterogeneous beverages marketed by different franchise brands could be systematically organized and evaluated. Using this framework, the present study aimed to (1) characterize differences in nutritional composition across standardized beverage categories, (2) examine the extent of nutritional variability within individual categories, and (3) evaluate nutritional differences between matched hot and iced versions of the same beverages.
Table 1.
Definitions, representative examples, and distribution of beverage menu categories.
2. Materials and Methods
2.1. Brand Selection and Data Collection
To obtain a representative sample of major franchise coffee shops in Korea, brands were selected according to two criteria: (1) brand reputation rankings and (2) the number of franchise outlets nationwide. Brand reputation data were obtained from the Korea Brand Reputation Index (BRIKOREA; http://brikorea.com), which assesses consumer perception and brand influence using big-data indicators, including media exposure, consumer participation, communication activity, and online community engagement. Monthly brand reputation rankings published in October and November 2025 were reviewed.
Information on the nationwide number of franchise outlets was obtained from the Public Data Portal of Korea (https://www.data.go.kr) (accessed on 15 October 2025). The 33 franchise coffee brands ranked from 1st to 33rd in the Korea Brand Reputation Index were initially selected for inclusion. The nationwide number of franchise outlets was additionally reviewed to confirm the market presence of the selected brands. Of these 33 brands, one was excluded because it did not provide publicly available nutritional information, and another was excluded because it was an express-format version of an existing franchise with a substantially overlapping beverage menu. Consequently, 31 franchise coffee brands were included in the final analysis. Nutritional information for all eligible beverages was obtained from the official websites of the selected franchise brands. The data collected for each beverage included the beverage name, serving size (mL), energy (kcal), total sugar (g), protein (g), saturated fat (g), sodium (mg), and caffeine (mg) per serving. Total sugars were defined as all monosaccharides and disaccharides present in a beverage, regardless of their source [18,19]. Added sugars were defined as sugars added during manufacturing or preparation, but excluded sugars naturally occurring in dairy products and fruit and vegetables [18]. Free sugars included all added sugars as well as sugars naturally present in honey, syrups, fruit juices, fruit juice concentrates, and fruit or vegetable purees, while excluding sugars naturally occurring in dairy products and intact, cooked, or dried fruit and vegetables [18,20]. Thus, all added sugars are included within free sugars, whereas free sugars additionally encompass naturally occurring sugars released from the cellular structure of fruit and vegetables through juicing or pureeing [20]. In the present study, however, sugar content refers exclusively to the total sugar values reported by the franchise brands. Because the available nutrition information did not distinguish naturally occurring sugars from added or free sugars, added and free sugar contents were not separately quantified. Data were obtained from the official websites and of the selected franchise brands between October and December 2025. The collected data were subsequently reviewed for completeness and consistency before analysis.
2.2. Data Processing and Beverage Classification
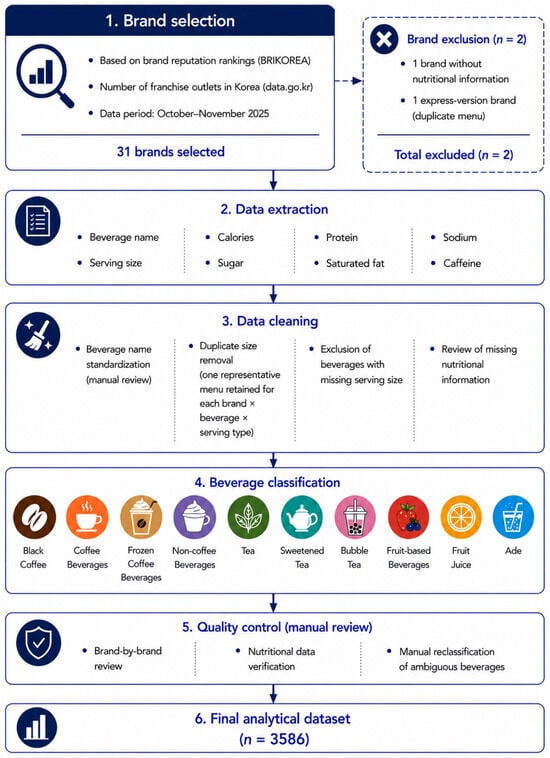
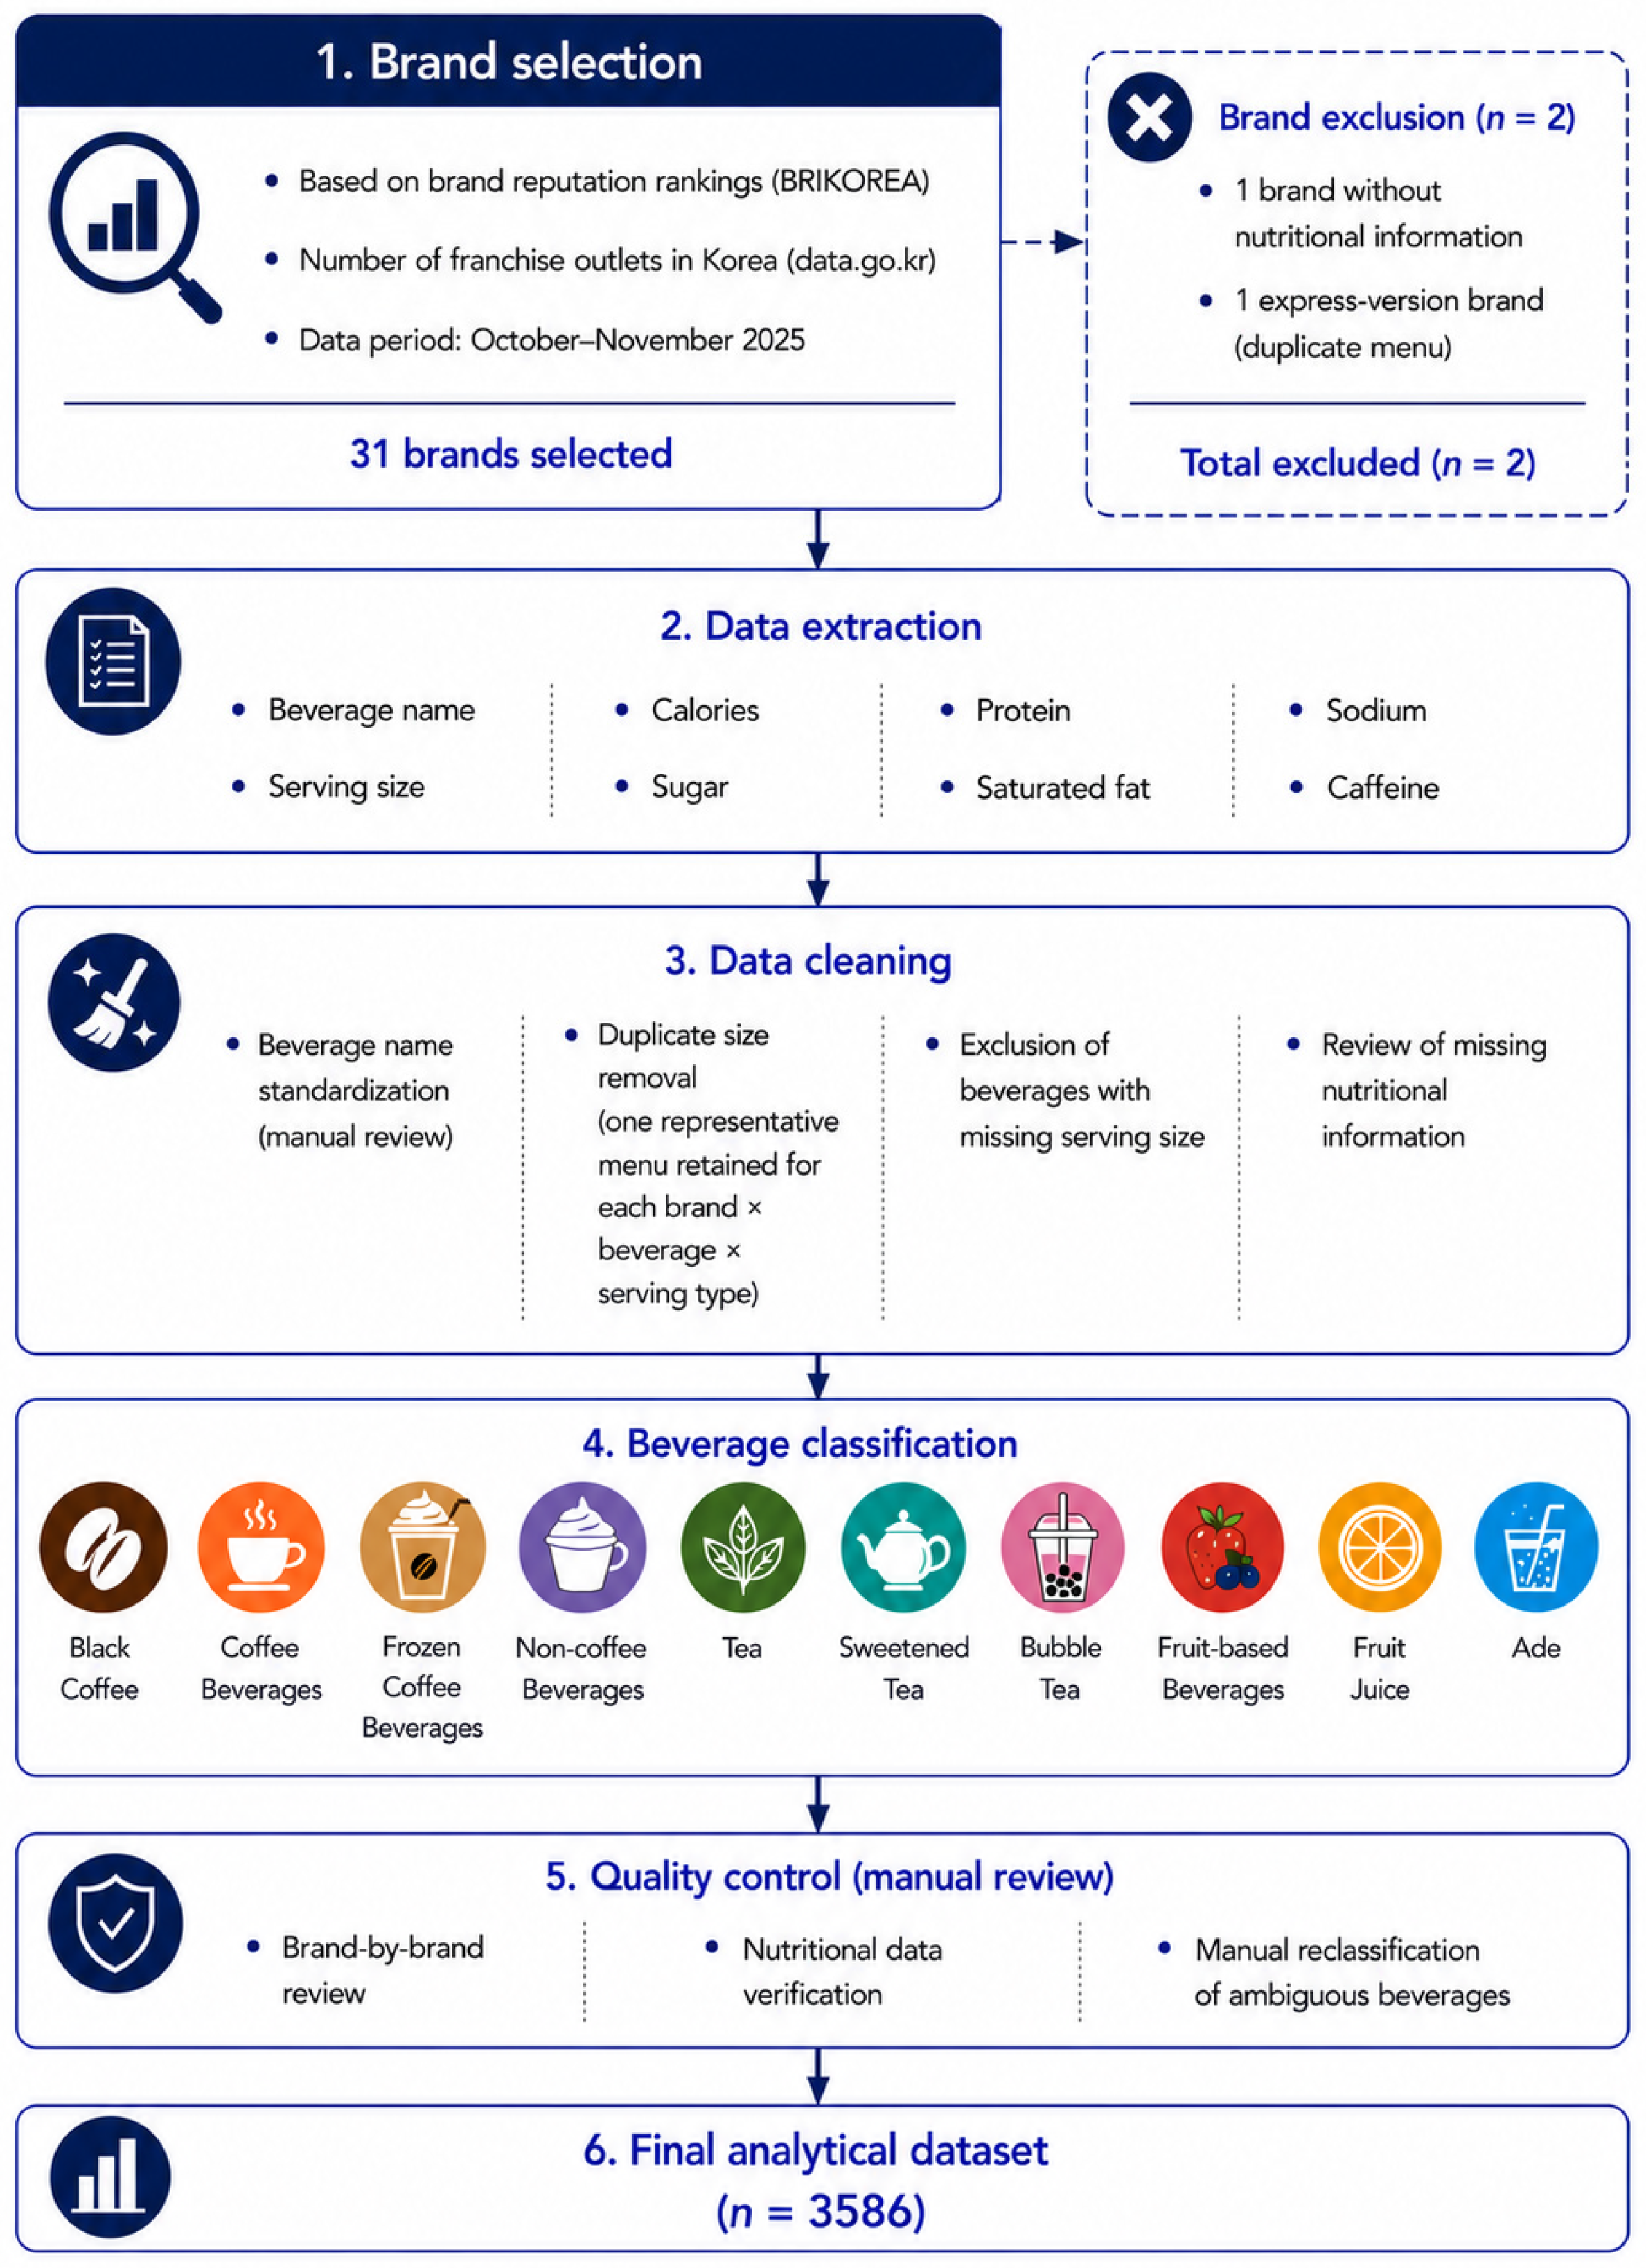
The overall workflow, including brand selection, data collection, data cleaning, standardized beverage classification, quality control, and construction of the final analytical dataset, is presented in Figure 1.
Figure 1.
Flow chart of brand selection, beverage selection, data extraction, data cleaning, classification, and quality control used to construct the final analytical dataset.
Initially, 3648 beverage menu items were identified across the 31 selected franchise coffee brands. Products lacking the nutritional information required for analysis were treated as having missing data and were excluded without imputation. Products that did not meet the operational definition of any predefined beverage category were classified as “Others.” Because the “Others” group consisted of heterogeneous products and did not constitute a conceptually meaningful analytical category, these products were also excluded from the category-based analyses. Before statistical analysis, a systematic data-cleaning procedure was conducted to improve consistency and eliminate duplicate observations. Beverage names were first standardized by correcting spelling and spacing inconsistencies and removing unnecessary descriptive terms. Beverages with similar names were then manually reviewed to distinguish duplicate menu items from products that differed in ingredients or formulation.
For beverages offered in multiple serving sizes, one representative menu item was retained because the nutrient contents had been standardized. Hot and iced versions were retained as separate products because their formulations and nutritional compositions could differ. Beverages lacking serving-volume data or essential nutritional information were excluded because their nutrient contents could not be standardized.
Because beverage names, ingredient descriptions, and menu structures varied considerably across franchise brands, direct cross-brand comparisons were difficult. A standardized beverage classification system was therefore developed to ensure consistent taxonomy for organizing commercially available beverages across brands. Beverages were assigned to 10 standardized categories according to menu names, ingredient-related keywords, and nutritional characteristics: black coffee, coffee beverages, frozen coffee beverages, milk-based non-coffee beverages, tea, sweetened tea, bubble tea, fruit-based beverages, fruit juice, ade, and others. The classification was not designed to group beverages according to equivalent nutrient content or nutritional quality. Accordingly, beverages within the same category were not assumed to have equivalent nutritional profiles. Beverages were classified by a single researcher using the predefined operational criteria presented in Table 1. When classification was uncertain, the official product descriptions, ingredient information, and nutritional information provided by the brands were re-examined. Products that could not be confidently assigned to one of the predefined categories were classified as “Others.” Because classification was performed by a single researcher, inter-rater agreement could not be assessed.
Of the 3648 beverages included in the classification dataset, 62 were classified as “Others” because of unique formulations or insufficient product information for reliable classification. These heterogeneous products were excluded from the category-based analyses, resulting in a final analytical sample of 3586 beverages.
2.3. Statistical Analysis
Nutritional data were entered into Microsoft Excel and analyzed using IBM SPSS Statistics, version 25.0 (IBM Corp., Armonk, NY, USA). Nutrient contents were expressed on a per-serving basis to characterize the nutritional composition of beverages as sold.
Descriptive statistics were calculated for the beverage categories and their nutritional composition. Continuous variables are presented as means ± standard deviations, whereas categorical variables are presented as frequencies and percentages. To assess within-category variability in total sugar content, the distribution of total sugar per serving was characterized for each beverage category using the mean, standard deviation, 25th percentile, median, 75th percentile, 90th percentile, and maximum value.
Differences in energy, total sugar, protein, saturated fat, sodium, and caffeine contents among beverage categories were assessed using one-way analysis of variance. Prior to conducting one-way ANOVA, the assumptions of normality and homogeneity of variance were assessed. Because homogeneity of variance was not satisfied for several nutritional variables, Games–Howell post hoc comparisons were performed. Because significant heterogeneity of variance was observed, Welch’s ANOVA was used as a robust omnibus test where estimable, followed by Games–Howell post hoc comparisons, which do not assume equal variances. For total sugar, Welch’s test could not be estimated because one beverage category had zero variance; therefore, the overall category difference was additionally evaluated using the Kruskal–Wallis test. Eta-squared (η2) values and their 95% confidence intervals were calculated to quantify the magnitude of differences among beverage categories. Given the skewed distributions and presence of extreme values in several nutritional variables, Kruskal–Wallis tests were additionally performed as sensitivity analyses to evaluate the robustness of the findings. All analyses were two-sided, and statistical significance was defined as p < 0.05. For beverages available in matched hot and iced versions from the same brand, paired t-tests were performed to evaluate differences in nutritional composition. Given the skewed distributions and presence of extreme values, Wilcoxon signed-rank tests were additionally performed as sensitivity analyses.
3. Results
3.1. Nutritional Composition by Beverage Category
Nutritional composition varied across beverage categories for all variables examined, including serving size, energy, total sugar, protein, saturated fat, sodium, and caffeine contents (Table 2).
Table 2.
Nutritional composition of beverages according to beverage category (per serving).
Frozen coffee beverages had the highest mean energy content (393.86 ± 137.1 kcal/serving), followed by milk-based non-coffee beverages (384.4 ± 145.47 kcal/serving) and fruit-based beverages (372.81 ± 141.66 kcal/serving). By contrast, black coffee and tea contained minimal energy (14.23 ± 36.1 and 3.94 ± 4.25 kcal/serving, respectively). Total sugar content also varied markedly across categories. Fruit-based beverages contained the highest mean total sugar content (61.24 ± 23.57 g/serving), followed by frozen coffee beverages (46.18 ± 16.64 g/serving), ade (45.64 ± 28.35 g/serving), milk-based non-coffee beverages (44.35 ± 20.45 g/serving), and bubble tea (43.77 ± 15.55 g/serving). Black coffee contained no sugar, whereas tea contained only trace amounts (0.02 ± 0.09 g/serving).
Beverages containing milk generally had higher protein and saturated fat contents than tea- or fruit-based beverages. Milk-based non-coffee beverages had the highest mean protein (8.88 ± 5.49 g/serving) and saturated fat (10.06 ± 15.75 g/serving) contents, whereas black coffee, tea, and ade contained negligible amounts of these nutrients. Sodium content was highest in frozen coffee beverages (188.2 ± 86.34 mg/serving), followed closely by milk-based non-coffee beverages (184.77 ± 127.75 mg/serving). Black coffee had the highest mean caffeine content (144.32 ± 165.28 mg/serving), followed by coffee beverages (132.64 ± 140.29 mg/serving), whereas fruit juice and fruit-based beverages contained negligible amounts of caffeine.
3.2. Post Hoc Comparisons Among Beverage Categories
Levene’s tests indicated significant heterogeneity of variance across beverage categories for all nutritional variables (all p < 0.001). Accordingly, Welch’s ANOVA was used as a robust omnibus test where estimable, followed by Games–Howell post hoc comparisons. Welch’s ANOVA showed significant differences among beverage categories in energy [Welch’s F(9, 617.31) = 1718.81, p < 0.001], protein [Welch’s F(9, 646.26) = 539.10, p < 0.001], saturated fat [Welch’s F(9, 620.06) = 124.69, p < 0.001], sodium [Welch’s F(9, 644.59) = 552.89, p < 0.001], and caffeine [Welch’s F(9, 632.37) = 173.07, p < 0.001]. For total sugar, Welch’s test could not be estimated because the black coffee category had zero within-group variance; however, the Kruskal–Wallis test confirmed a significant overall category difference (p < 0.001). The effect-size estimates were η2 = 0.435 (95% CI: 0.411–0.455) for energy, η2 = 0.358 (95% CI: 0.333–0.379) for total sugar, η2 = 0.091 (95% CI: 0.072–0.107) for protein, η2 = 0.129 (95% CI: 0.108–0.147) for saturated fat, η2 = 0.350 (95% CI: 0.325–0.371) for sodium, and η2 = 0.278 (95% CI: 0.253–0.299) for caffeine. Kruskal–Wallis sensitivity analyses showed significant differences among beverage categories for all nutritional variables examined (all p < 0.001), supporting the robustness of the overall findings despite skewed distributions and extreme observations. Games–Howell pairwise comparisons identified multiple significant between-category differences; a concise summary of the post hoc results is presented in Supplementary Table S1. Several beverage categories nevertheless exhibited comparable nutritional profiles. No significant differences in energy or total sugar content were observed between frozen coffee beverages and milk-based non-coffee beverages or between fruit juice and ade. Caffeine content also did not differ significantly among fruit juice, fruit-based beverages, and ade, whereas black coffee and coffee beverages contained significantly more caffeine than all non-coffee beverage categories (p < 0.05).
3.3. Comparison of Hot and Iced Beverages
Among matched beverages available in both hot and iced forms, iced beverages had significantly larger serving sizes than their hot counterparts (487.9 ± 123.2 vs. 469.3 ± 124.2 mL, p < 0.001; Table 3). Despite their smaller serving sizes, hot beverages contained significantly more energy (232.8 vs. 216.2 kcal), total sugar (27.7 vs. 26.0 g), saturated fat (5.8 vs. 4.8 g), and sodium (101.6 vs. 89.1 mg) per serving than the corresponding iced beverages (all p < 0.01). Protein and caffeine contents did not differ significantly between hot and iced versions (p = 0.482 and p = 0.851, respectively). Wilcoxon signed-rank sensitivity analyses yielded the same statistical conclusions for serving size, energy, total sugar, saturated fat, sodium, and caffeine. For protein, however, the Wilcoxon signed-rank test indicated a significant difference (p < 0.001), whereas the paired-samples t-test did not; therefore, the protein result was interpreted cautiously.
Table 3.
Comparison of nutritional composition between hot and iced versions of identical beverages.
3.4. Within-Category Variability in Total Sugar Content
Considerable within-category variability in total sugar content was observed in several beverage categories (Table 4). Fruit-based beverages had the highest median sugar content (62.0 g/serving) and 90th-percentile value (90.0 g/serving), followed by frozen coffee beverages (48.0 and 68.1 g/serving, respectively) and ade (40.0 and 71.4 g/serving, respectively). Bubble tea also contained substantial amounts of sugar, with a median of 39.0 g/serving and a maximum of 95.0 g/serving.
Table 4.
Total sugar content per serving by beverage category.
Although the mean total sugar contents of coffee beverages, sweetened tea, fruit juice, and ade ranged from approximately 36 to 45 g/serving, maximum values exceeded 100 g/serving in several categories. The highest observed maximum was 217.0 g/serving in ade, followed by 186.1 g/serving in fruit juice, 151.0 g/serving in milk-based non-coffee beverages, and 140.9 g/serving in fruit-based beverages. By contrast, black coffee contained no sugar, whereas tea contained negligible amounts, with a maximum of only 0.5 g/serving. These distributions demonstrate that category-level averages do not fully characterize the nutritional composition of individual products.
4. Discussion
This study comprehensively characterized the nutritional composition of 3586 beverages marketed by 31 major franchise coffee brands in Korea using a standardized beverage classification framework. Significant between-category differences were identified in serving size and the contents of energy, total sugar, protein, saturated fat, sodium, and caffeine. Fruit-based beverages, frozen coffee beverages, milk-based non-coffee beverages, bubble tea, and ade generally contained substantially more energy and total sugar than black coffee and unsweetened tea. However, substantial nutritional variability was also observed within several standardized beverage categories. Thus, although the classification captured broad differences among beverage types, category membership alone did not reliably characterize the nutritional composition of individual products.
These findings are consistent with previous epidemiological evidence showing that sugar-sweetened beverages are major contributors to dietary sugar intake and are associated with increased risks of obesity, type 2 diabetes, cardiovascular disease, and premature mortality [1,2,3,4]. In contrast to sugars naturally contained within intact foods, sugars consumed in beverages are ingested rapidly and elicit relatively weak satiety responses, potentially resulting in incomplete compensation for energy intake at subsequent meals [10]. Frequent consumption of sugar-rich beverages may therefore contribute substantially to excess energy intake and the long-term development of metabolic disorders.
Among the beverage categories evaluated, fruit-based beverages had the highest mean total sugar content, followed by frozen coffee beverages, milk-based non-coffee beverages, ade, and bubble tea. This pattern is consistent with previous reports that blended fruit beverages and specialty coffee drinks often contain substantially more sugar than consumers may anticipate [11,21]. Although fruit-containing beverages are frequently perceived as healthier alternatives because they include fruit-derived ingredients, many commercially available products also contain fruit concentrates, flavored syrups, sweetened yogurt, fruit purées, sauces, and other added ingredients that markedly increase total sugar content. Similarly, frozen coffee beverages commonly contain flavored syrups, sweetened powders, whipped cream, sauces, or ice cream in addition to espresso, resulting in considerably higher energy and sugar contents than conventional coffee beverages.
Bubble tea also contained relatively high amounts of sugar, likely reflecting the combined contributions of sweetened milk, flavored syrups, powders, and tapioca pearls. Ade beverages, although often perceived as refreshing fruit-based options, commonly contain concentrated fruit syrups and carbonated bases with substantial amounts of added sugar. These findings suggest that beverages selected for their perceived freshness, premium positioning, or dessert-like appeal may contribute considerably to daily sugar intake despite being marketed under distinct product concepts.
By contrast, black coffee and unsweetened tea contained negligible amounts of energy and sugar, underscoring the pronounced nutritional differences among beverages that consumers may broadly identify as “coffee” or “tea.” This observation supports previous evidence that beverage formulation, rather than product name alone, is a primary determinant of nutritional quality. Consumers may therefore be unable to infer nutritional characteristics reliably from beverage names or broad menu categories alone.
A key finding of the present study was the substantial nutritional heterogeneity observed within several standardized beverage categories. For example, total sugar content among coffee beverages ranged from 13.0 g/serving at the 25th percentile to 48.0 g/serving at the 90th percentile. Similar within-category variability was observed for several other beverage groups. These findings demonstrate that beverages sharing broadly similar ingredient and preparation characteristics do not necessarily have similar nutritional profiles. This distinction is important for interpreting the purpose of the proposed classification framework. The framework classifies beverages according to beverage type, ingredient composition, and preparation characteristics; it does not classify products according to nutritional quality. Consequently, category membership alone cannot reliably indicate whether an individual beverage is lower in sugar, energy, saturated fat, or other nutrients. Product-specific nutritional information therefore remains necessary for consumers seeking nutritionally preferable options. The substantial within-category heterogeneity may reflect differences in serving size, ingredient proportions, sweetening practices, toppings, syrups, milk or cream content, and brand-specific formulations. Accordingly, category-level averages should be interpreted as descriptions of broad market patterns rather than as indicators of the nutritional quality of individual products.
The comparison of hot and iced beverages further showed that serving format was associated with nutritional composition. Although iced beverages generally had larger serving volumes, hot beverages contained significantly more energy, total sugar, saturated fat, and sodium per serving. These findings were supported by Wilcoxon signed-rank sensitivity analyses. Protein showed discordant results between the parametric and non-parametric analyses and should therefore be interpreted cautiously, whereas caffeine did not differ significantly in either analysis. The observed differences cannot be attributed solely to serving size and may also reflect variation in formulation, including the relative proportions of milk, syrups, powders, cream, water, and ice used during preparation.
Beyond describing the nutritional composition of commercially available beverages, this study also addresses a key challenge in the communication and practical use of nutritional information. Nutritional data are now widely available through the websites and mobile applications of major franchise coffee brands; however, consumer behavior studies have shown that such information is often underused because conventional nutrition labels are difficult to interpret and compare across products [12,14]. Eye-tracking research has further demonstrated that consumers devote substantially more visual attention to menu names, prices, and product images than to nutritional information when selecting menu items [13]. Consequently, beverage purchasing decisions may be shaped more strongly by marketing cues than by objective nutritional characteristics.
The present findings also clarify the appropriate role of standardized beverage classification. The primary value of the proposed framework is methodological rather than as a direct consumer decision-making tool. Franchised coffee shops use heterogeneous and proprietary menu names, making it difficult to organize large numbers of commercial beverages consistently across brands. By applying explicit definitions based primarily on beverage type, ingredients, and preparation characteristics, the framework provides a common taxonomy that is independent of brand-specific marketing terminology.
Importantly, this taxonomy does not imply nutritional equivalence among products assigned to the same category. Rather, it enables researchers to examine two distinct sources of nutritional variation: differences between broadly different beverage types and heterogeneity among products sharing similar ingredient and preparation characteristics. The substantial within-category variability identified in this study illustrates the importance of making this distinction. Standardized classification and product-specific nutrition information therefore serve complementary rather than interchangeable purposes: classification provides a structure for market-level nutritional surveillance and comparative research, whereas product-specific nutritional information remains necessary for evaluating individual beverage choices.
The importance of product-specific nutritional information is also consistent with previous research on nutrition labeling. Simplified presentation of nutritional information has been shown to improve consumers’ ability to compare products and may facilitate healthier food choices [12], while recent research suggests that the usefulness of nutritional information depends not only on its availability but also on consumers’ ability and motivation to access, interpret, and verify it [14]. However, the substantial nutritional variability observed within the standardized categories in the present study indicates that category information alone cannot provide the product-specific information required for nutritional decision-making. Thus, the proposed classification should not be viewed as a substitute for existing nutrition-labeling systems. Rather, its role is to provide a standardized structure for organizing and evaluating heterogeneous beverage products, while product-level nutrition labeling remains essential for consumers comparing individual beverages. Future research should examine whether presenting standardized beverage categories together with product-specific nutritional information can improve consumers’’ understanding and use of nutritional information.
The findings have implications primarily for nutritional surveillance and comparative research rather than for direct consumer decision-making. The proposed classification provides a standardized approach for organizing heterogeneous beverage products across franchise brands, allowing researchers and public health professionals to examine category-level nutritional patterns and identify substantial variation within apparently similar beverage types. However, because considerable nutritional heterogeneity exists within several categories, category membership alone should not be used to infer the nutritional quality of an individual beverage. Product-specific nutrition information therefore remains essential for consumers seeking lower-sugar or lower-energy options. Future research should evaluate whether combining standardized beverage categories with product-level nutrition information can improve consumer understanding and beverage selection.
This study has several notable strengths. First, it developed a standardized beverage classification framework that provides a consistent and reproducible taxonomy for organizing beverages across franchise coffee brands despite differences in proprietary menu structures and marketing terminology. Second, nutritional information was collected for 3586 beverages from 31 major franchise coffee brands, constituting one of the most comprehensive evaluations of commercially available coffee-shop beverages conducted in Korea. Third, beverages were classified using predefined criteria and systematic manual review, thereby improving consistency across brands with highly heterogeneous menu structures. Fourth, the study examined not only nutritional differences across standardized beverage categories but also substantial nutritional variability within individual categories. Finally, the inclusion of matched hot and iced beverages enabled the assessment of formulation-related differences that have often been overlooked in previous research. Together, these strengths provide a practical methodological foundation for future nutritional surveillance, comparative research, and product reformulation.
5. Limitations
Several limitations should be considered when interpreting these findings. First, nutritional information was obtained from official franchise websites and mobile applications rather than through laboratory analyses. Although these data reflect the information available to consumers, actual nutrient contents may vary because of differences in preparation practices, ingredient composition, or portion sizes across individual stores. Second, customized beverage options, including modifications to syrup quantity, milk type, toppings, or serving size, were not evaluated because standardized nutritional information was unavailable for many optional combinations. Third, all beverages were weighted equally regardless of sales volume or consumption frequency; therefore, the findings characterize the nutritional profiles of available products rather than actual dietary intake. In addition, beverage classification was conducted by a single researcher; therefore, independent inter-rater reliability could not be assessed. Finally, because the study used a cross-sectional design, seasonal menu items and subsequent product reformulations could not be evaluated. An additional limitation concerns the interpretation of the standardized beverage categories. Because the classification framework was based primarily on shared ingredient and preparation characteristics rather than predefined thresholds for energy, sugar, or other nutrients, products assigned to the same category may exhibit substantially different nutritional profiles. Accordingly, the proposed framework should not be interpreted as a nutrient-profiling system or as a substitute for product-specific nutritional information. Its intended function is to provide a reproducible taxonomy for organizing heterogeneous beverage products and facilitating market-level national surveillance and comparative research.
Despite these limitations, the present study makes several important contributions to the literature. In addition to providing one of the largest assessments of the nutritional composition of beverages sold by major franchise coffee shops in Korea, it introduces a reproducible taxonomy for organizing products marketed under heterogeneous brand-specific menu names. Importantly, the study demonstrates that substantial nutritional heterogeneity exists not only between beverage categories but also within apparently similar beverage types. This finding highlights the limitations of inferring nutritional quality from beverage type or menu name alone and provides a methodological basis for examining both between-category differences and within-category variation in future nutritional surveillance and comparative research.
6. Conclusions
In conclusion, this study demonstrated substantial variation in the nutritional composition of beverages marketed by major franchise coffee shops in Korea across standardized beverage categories. Fruit-based beverages, frozen coffee beverages, milk-based non-coffee beverages, bubble tea, and ade generally contained the highest amounts of energy and total sugar, whereas black coffee and unsweetened tea contained negligible amounts of sugar. Importantly, considerable nutritional variability was also observed within several standardized categories, indicating that beverages sharing similar ingredient and preparation characteristics do not necessarily have similar nutritional profiles.
This study also developed and applied a standardized beverage classification framework based primarily on beverage ingredients and preparation characteristics rather than brand-specific menu names. The framework provides a transparent and reproducible taxonomy for organizing heterogeneous beverage products across franchise brands and enables systematic examination of nutritional variation both between and within beverage categories. Importantly, the classification was not designed to indicate nutritional equivalence among products within the same category or to predict the nutritional quality of individual beverages.
The proposed framework should therefore be viewed as complementary to, rather than a replacement for, existing nutrition-labeling systems. Because substantial nutritional heterogeneity exists within several beverage categories, category membership alone cannot identify lower-sugar, lower-energy, or otherwise nutritionally preferable products. Product-specific nutritional information remains essential for comparing individual beverage options, whereas the standardized classification provides a consistent structure for nutritional surveillance and comparative research. Thus, the proposed framework should not be interpreted as a direct consumer decision-making tool. From a research and public health perspective, the proposed framework may facilitate nutritional surveillance, cross-brand comparative research, and longitudinal evaluation of product reformulation by providing a common methodology for organizing commercially available beverages. Because consumer understanding and purchasing behavior were not directly examined in the present study, future research should investigate whether combining standardized beverage categories with product-specific nutritional information can improve consumers’ understanding and use of nutritional information in real-world purchasing settings. The applicability of similar standardized taxonomies to other food-service sectors and international beverage markets should also be evaluated.
Supplementary Materials
The following supporting information can be downloaded at: https://www.mdpi.com/article/10.3390/beverages12110130/s1, Table S1: Selected Games-Howell post-hoc comparisons of nutritional characteristics among beverage categories.
Author Contributions
Conceptualization, J.C.; methodology, J.C. and Y.C.; software, J.C.; validation, Y.C. and J.C.; formal analysis, J.C.; investigation, J.C.; resources, J.C.; data curation, Y.C. and J.C.; writing—original draft preparation, J.C.; writing—review and editing, Y.C.; visualization, Y.C. and J.C.; supervision, J.C.; project administration, J.C.; funding acquisition, J.C. All authors have read and agreed to the published version of the manuscript.
Funding
This work was supported by the Global Joint Research Program funded by Pukyong National University 202506360001.
Institutional Review Board Statement
Not applicable.
Informed Consent Statement
Not applicable.
Data Availability Statement
The data used in this study were collected from publicly accessible websites. Because the information available on these websites may be updated or modified over time, the dataset compiled and analyzed for this study has been archived by the corresponding author and is available from the corresponding author upon reasonable request.
Acknowledgments
During the preparation of this manuscript/study, the authors used ChatGPT (GPT-6 model) for the purposes of generating Figure 1. The authors have reviewed and edited the output and take full responsibility for the content of this publication.
Conflicts of Interest
The authors declare no conflicts of interest.
References
- Malik, V.S.; Li, Y.; Pan, A.; De Koning, L.; Schernhammer, E.; Willett, W.C.; Hu, F.B. Long-term consumption of sugar-sweetened beverages and risk of mortality. N. Engl. J. Med. 2019, 381, 1768–1778. [Google Scholar]
- Corrêa Café, A.; Lopes, C.A.; Novais, P.F.; Silva, M.R.; Marchioni, D.M.L.; Fisberg, R.M. Sugar-sweetened beverage consumption and the risk of cancer: A systematic review. Rev. Panam. Salud Publica 2018, 42, e1. [Google Scholar]
- Genkinger, J.M.; Li, R.; Spiegelman, D.; Anderson, K.E.; Albanes, D.; Bergkvist, L.; Bernstein, L.; Black, A.; van den Brandt, P.A.; English, D.R.; et al. Coffee, tea, and sugar-sweetened carbonated soft drink intake and pancreatic cancer risk: A pooled analysis. Cancer Epidemiol. Biomark. Prev. 2012, 21, 305–318. [Google Scholar] [CrossRef] [Scilit] [PubMed]
- Imamura, F.; O’Connor, L.; Ye, Z.; Mursu, J.; Hayashino, Y.; Bhupathiraju, S.N.; Forouhi, N.G. Consumption of sugar-sweetened beverages, artificially sweetened beverages, and fruit juice and incidence of type 2 diabetes: Systematic review and meta-analysis. BMJ 2015, 351, h3576. [Google Scholar] [CrossRef] [Scilit] [PubMed]
- Lee, H.J. Association between sugar consumption and periodontal disease in Korean adults. J. Dent. Hyg. Sci. 2020, 20, 85–92. [Google Scholar] [CrossRef] [Scilit]
- Kim, E.J.; Chae, H.R.; Park, J.Y.; Lee, S.H. Association between sugary snacking habits and oral disease in Korean adults. J. Korean Soc. Dent. Hyg. 2020, 20, 29–39. [Google Scholar] [CrossRef] [Scilit]
- Yeon, S.; Lee, J.; Yun, S.; Oh, K. Intake of dietary sugar in the Republic of Korea: Data from Korea National Health and Nutrition Examination survey. Public Health Wkly. Rep. 2026, 19, 253–267. [Google Scholar] [CrossRef] [Scilit] [PubMed]
- Korea Disease Control and Prevention Agency (KDCA). Korea National Health and Nutrition Examination Survey (KNHANES); Korea Disease Control and Prevention Agency (KDCA): Cheongju-si, Republic of Korea, 2024.
- Korean Nutrition Society. Dietary Reference Intakes for Koreans 2020; Korean Nutrition Society: Seoul, Republic of Korea, 2020. [Google Scholar]
- DiMeglio, D.P.; Mattes, R.D. Liquid versus solid carbohydrate: Effects on food intake and body weight. Int. J. Obes. 2000, 24, 794–800. [Google Scholar] [CrossRef] [Scilit] [PubMed]
- Yeon, J.Y.; Bae, Y.J.; Kim, E.Y.; Lee, J.Y.; Kim, M.H. Sugar content in coffee beverages from franchise stores in Korea. Korean J. Nutr. 2013, 46, 197–205. [Google Scholar] [CrossRef] [Scilit][Green Version]
- Nikolova, H.D.; Inman, J.J. Healthy Choice: The Effect of Simplified Point-of-Sale Nutritional Information on Consumer Food Choice. J. Mark. Res. 2015, 52, 817–835. [Google Scholar] [CrossRef] [Scilit]
- Min, K.; Lee, K.; Chung, H. Relationship between consumer behavior, perception of nutritional information, and menu factors on fast food using eye-tracking: A study on university students in Jeonju. Food Sci. Preserv. 2024, 31, 408–422. [Google Scholar] [CrossRef] [Scilit]
- Von-Polheim, L.; Moreno-Castro, C. Assessing motivations and channels for nutritional information verification in Spanish university communities. Int. J. Environ. Res. Public Health 2025, 22, 357. [Google Scholar] [CrossRef] [Scilit] [PubMed]
- Colchero, M.A.; Popkin, B.M.; Rivera, J.A.; Ng, S.W. Beverage purchases from stores in Mexico under the excise tax on sugar sweetened beverages: Observational study. BMJ 2016, 352, h6704. [Google Scholar] [CrossRef] [Scilit] [PubMed]
- Scarborough, P.; Adhikari, V.; Harrington, R.A.; Elhussein, A.; Briggs, A.; Rayner, M.; Adams, J. Impact of the UK Soft Drinks Industry Levy on sugar content of beverages: Interrupted time series analysis. Lancet Public Health 2020, 5, e107–e117. [Google Scholar]
- Taillie, L.S.; Rivera, J.A.; Popkin, B.M.; Batis, C. Do high vs. low purchasers respond differently to a nonessential energy-dense food tax? PLoS Med. 2020, 17, e1003248. [Google Scholar] [PubMed]
- Mela, D.J.; Woolner, E.M. Perspective: Total, added, or free? What kind of sugars should we be talking about? Adv. Nutr. 2018, 9, 63–69. [Google Scholar] [CrossRef] [Scilit] [PubMed]
- Codex Alimentarius Commission. Guidelines on Nutrition Labelling CAG/GL 2-1985; Food and Agriculture Organization of the United Nations and World Health Organization: Rome, Italy, 1985; Available online: https://www.fao.org/fao-who-codexalimentarius/ (accessed on 22 September 2026).
- World Health Organization. Guideline: Sugars Intake for Adults and Children; World Health Organization: Geneva, Switzerland, 2015; Available online: https://www.who.int/publications/i/item/9789241549028 (accessed on 22 September 2026).
- Boulton, J.; Hashem, K.M.; Jenner, K.H.; Lloyd-Williams, F.; Bromley, H.; Capewell, S.; He, F.J.; MacGregor, G.A. How much sugar is hidden in drinks marketed to children? A survey of fruit juices, juice drinks and smoothies. BMJ Open 2016, 6, e010330. [Google Scholar] [CrossRef] [Scilit] [PubMed]

Disclaimer/Publisher’s Note: The statements, opinions and data contained in all publications are solely those of the individual author(s) and contributor(s) and not of MDPI and/or the editor(s). MDPI and/or the editor(s) disclaim responsibility for any injury to people or property resulting from any ideas, methods, instructions or products referred to in the content. |
© 2026 by the authors. Licensee MDPI, Basel, Switzerland. This article is an open access article distributed under the terms and conditions of the Creative Commons Attribution (CC BY) license.