


Abstract
Older adults use furniture during sit-to-stand (STS), but effects of small surface modifications remain unclear. This exploratory within-participant study examined hand forces across table-surface configurations and millimeter-scale edge-protrusion heights during two preparatory trunk movements followed by STS. Of 59 participants, 56 were analyzed. Participants performed trials using the Normal surface, PVC sheet, silicone rubber, grooved MDF, and edge protrusions of 3, 5, and 7 mm. Condition order was randomized within two fixed-order blocks; Normal served as the surface-block reference. Peak horizontal pulling and downward vertical forces were normalized by body weight. PVC and silicone rubber showed significantly higher horizontal peaks than Normal (mean paired differences: +0.62 and +0.81 percentage points of body weight, respectively). Exploratory height comparisons showed higher horizontal peaks at 7 than 3 mm (+1.18 percentage points, 95% confidence interval: 0.55–1.90). No significant vertical-force differences were detected within either block. These findings suggest that local furniture surface configurations and protrusion heights may influence task-level hand-force use. However, small surface differences may not be distinguishable from condition-dependent measurement error; functional benefits, attachment security, and furniture stability remain unestablished.
1. Introduction
Older adults use not only dedicated handrails and grab bars but also ordinary furniture, walls, and other nearby objects to support everyday movements [1,2]. Environmental-object contact also occurs when balance is challenged; video analysis of real-life falls in long-term care found that intentional hand contacts commonly involved furniture and other nearby supports [3]. The local interfaces that people actually contact—including table edges and furniture corners—are, therefore, relevant targets for support-oriented design.
Conventional home modifications, including handrail installation, remain important, but intervention components vary and their effectiveness depends on person–environment fit [4,5,6]. Practical and psychological barriers can also limit extensive modifications [5]. A complementary strategy is, therefore, to augment, rather than replace, environmental features that people already use. Our observations in real homes showed localized contacts with furniture edges and corners, motivating a distributed environmental support approach based on small modifications to existing furniture [2].
The feasibility of this distributed environmental support approach depends in part on whether the local hand–environment interface can meaningfully alter supportive interaction. Finger-pad friction plays a central role in grip and touch and is influenced by surface material, roughness, and contact conditions [7]. Contact geometry and deformation affect friction forces during tactile surface exploration [8], and the curvature of a contacted surface influences grip-force regulation [9]. Handrail profile dimensions have also been shown to affect graspability and the forces that users can exert on the rail [10]. Older adults show greater difficulty maintaining precise, well-directed fingertip forces under low-friction conditions [11]. Nevertheless, they retain the ability to perceive three-dimensional surface shape through haptic exploration and to adapt finger-position and force coordination according to task demands, although age-related differences remain [12,13]. In a mobility task distinct from STS, light fingertip contact with an environmental boundary also altered subsequent obstacle-passing behavior in older adults [14]. If supportive interaction is governed partly by this local finger–surface interface, even subtle changes in material or millimeter-scale geometry may alter the task-level force components applied to the environment.
Sit-to-stand (STS) provides a suitable daily task in which to evaluate this design concept. STS is mechanically demanding, and upper-limb assistance can contribute to reducing the joint torques required from the lower limbs [15]. Vertical forces transmitted through each upper limb during assisted STS have been reported to reach approximately 20–30% of body weight [16]. Reaction forces generated through upper-limb support can also influence the forward and upward movement of the body during STS [17]. Studies in older adults further show that the position and orientation of grab rails influence assistance strategy, joint kinetics, and the direction of applied forces [18]. Handrail height alters joint motion and center-of-gravity displacement [19], while handrail geometry can substantially change the anterior–posterior and vertical reaction forces generated during STS [20]. However, this literature has focused mainly on dedicated handrails and grab bars. It remains unclear how the local surface material and millimeter-scale edge geometry of ordinary furniture alter hand–environment supportive interaction during STS. Older adults with mobility-related support needs or risk of physical-function decline were, therefore, selected because they are especially likely to use surrounding furniture during transfers, while dedicated supports may not be available at every point of use. The practical question was whether small, retrofittable changes to an already-used table edge alter the task-level hand forces applied during a prescribed support-assisted movement sequence.
This study examined how peak hand forces during support-assisted STS varied with local modifications to an everyday table. We tested four surface configurations and three millimeter-scale edge-protrusion heights. The surface-block comparisons examined whether configurations expected to offer greater frictional resistance were associated with higher horizontal pulling peaks than the Normal surface. We additionally explored differences in hand forces among the three protrusion heights within the same sensing configuration. Horizontal pulling and downward vertical peaks were evaluated separately.
2. Materials and Methods
2.1. Participants and Ethical Approval
A total of 59 older adults (43 females and 16 males; mean age: 83.4 ± 7.8 years; range: 65–98 years) participated in this study. Participants were recruited through two pathways: community-dwelling adults aged 65 years and older attending the 2024 health examination of the Otassha Study 2011 cohort, a long-term longitudinal study conducted by the Tokyo Metropolitan Institute for Geriatrics and Gerontology, and senior care facilities in Kawasaki City. Recruitment at the care facilities focused on older adults with mobility-related support needs or risk of physical-function decline.
For the Otassha cohort, invitations were sent to all examinees who met either of two criteria: severe sarcopenia or habitual cane/walker use. Severe sarcopenia was operationally defined by the combination of appendicular skeletal muscle mass index below 7.0 kg/m2 in men or 5.7 kg/m2 in women, grip strength at or below 28.0 kg in men or 18.0 kg in women, and usual gait speed below 1.0 m/s. These recruitment thresholds were informed by AWGS 2019 [21]; the inclusive grip-strength boundaries describe the reported operational selection rule. Habitual cane/walker use was determined by an affirmative response to the question, “Do you usually use a cane or walker when walking?”
Grip-strength and gait-speed assessments at the health examination were withheld for examinees with systolic blood pressure ≥ 180 mmHg or diastolic blood pressure ≥ 100 mmHg, stroke or heart-failure episodes within the preceding six months, or difficulty walking independently. These were safety-related rules for omitting assessments, not exclusion criteria for the subsequent experiment.
For the Otassha subgroup, the health examination was conducted from 26 September to 6 October 2024. Grip strength, knee-extension strength, J-CHS, and other health-examination measures were obtained during this period. The sit-to-stand experiment reported in this study was conducted from 9 to 23 December 2024 for the Otassha subgroup and during December 2024 and January 2025 at the care facilities in Kawasaki City. The Short Physical Performance Battery (SPPB) was assessed at the same visit as the experiment for the Otassha subgroup, rather than at the earlier health examination. Frailty was classified using the 2020 revised Japanese version of the Cardiovascular Health Study criteria (revised J-CHS) [22], with zero criteria indicating robust status, one or two indicating pre-frailty, and three or more indicating frailty. The cohort-specific recruitment and assessment procedures were not assumed to apply to participants recruited from care facilities.
This study was exploratory, and no a priori power analysis was performed. Sample size was determined by recruitment feasibility and practical constraints at the collaborating institutions. After the first two participants were tested, the procedure was modified based on feasibility during these initial trials and the final standardized protocol was established; their data were, therefore, excluded from the analysis. One additional participant was excluded because body-weight data required for force normalization were unavailable. Consequently, 56 participants were included in the force analyses. A subsequent quality audit excluded one PVC trial from all force components without excluding the participant’s other six trials.
Age, sex, and height were available for all 59 participants, and body weight was available for 58. All four characteristics were available for the 56 analyzed participants. Notes on daily living conditions and support-related behaviors, including walking-aid use, furniture use during sit-to-stand, stair negotiation, and fall-related concerns, were recorded when available. Detailed physical-function data were available only for the Otassha subgroup and were used to characterize participants and support exploratory interpretation rather than as primary explanatory variables.
The experimental protocol was approved by the Research Ethics Committee of the Tokyo Metropolitan Institute for Geriatrics and Gerontology on 10 October 2024 (Approval No. R23-053). All participants provided written informed consent before participation.
2.2. Experimental Apparatus
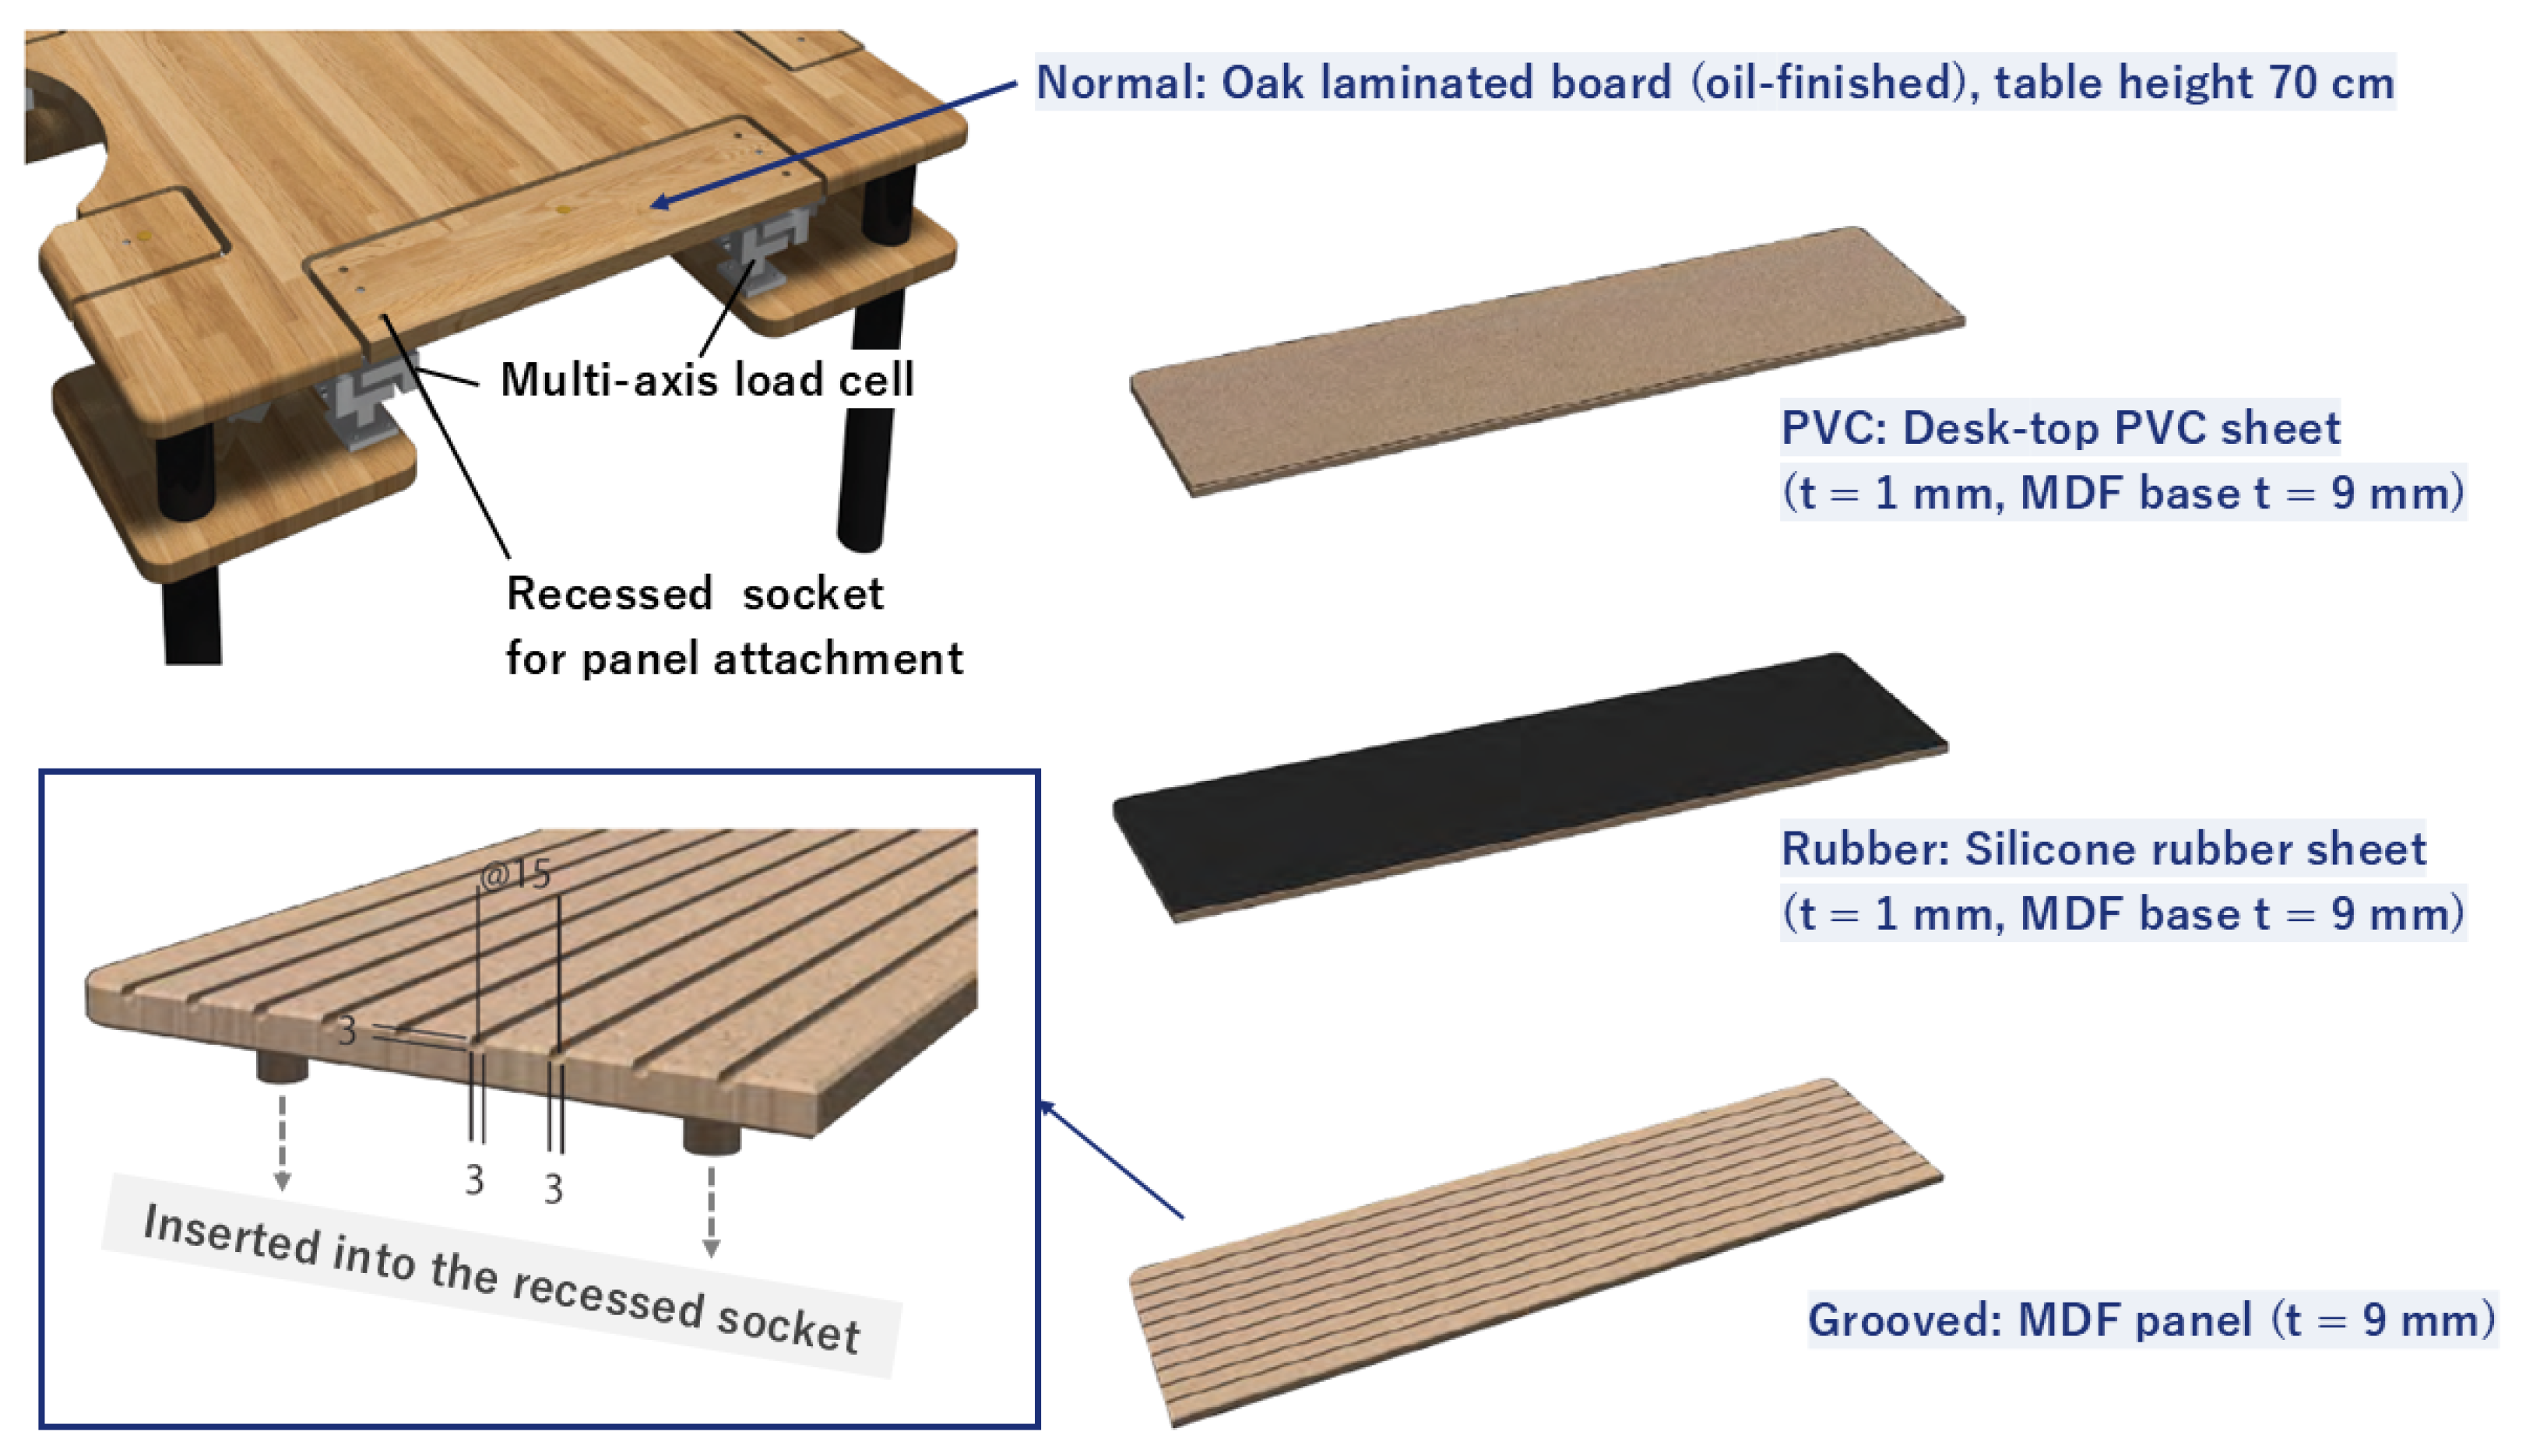
The two experimental blocks used separate instrumented hand-contact regions of the same table, each equipped with a distinct pair of custom-built three-axis force sensors of the same design (Figure 1 and Figure 2). A separate affine calibration matrix was used for each sensor pair in the offline force conversion. Each unit comprised three bolted A5052 aluminum components with strain gauges connected through bridge circuits to amplifiers and a dedicated control unit. The wooden contact member was bolted to the two load cells, which were mounted on support plates attached to the table structure. A clearance gap separated the member from the surrounding tabletop (Appendix Figure A4). The apparatus measured forces transmitted through both hands during the task, complementing prior instrumented STS systems [23].
Figure 1.
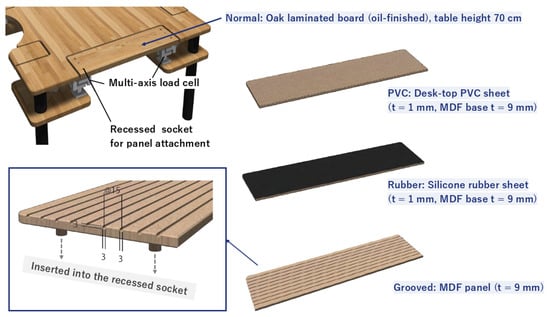
Experimental apparatus for the tested surface conditions. A custom table apparatus equipped with two embedded multi-axis load cells was used to measure supportive forces at the table edge. Interchangeable surface panels—polyvinyl chloride (PVC) sheet, silicone-rubber sheet, and grooved medium-density fiberboard (MDF) panel—were inserted into a recessed socket at the front edge of the table. These interchangeable panels enabled controlled manipulation of surface properties while using the same underlying table and sensing structure.
Figure 2.
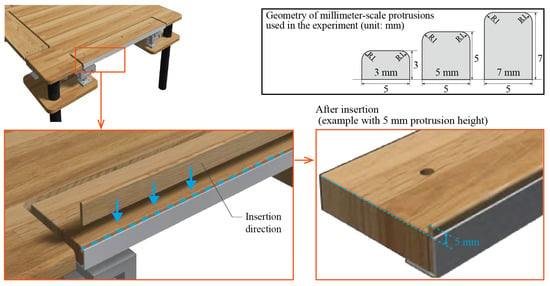
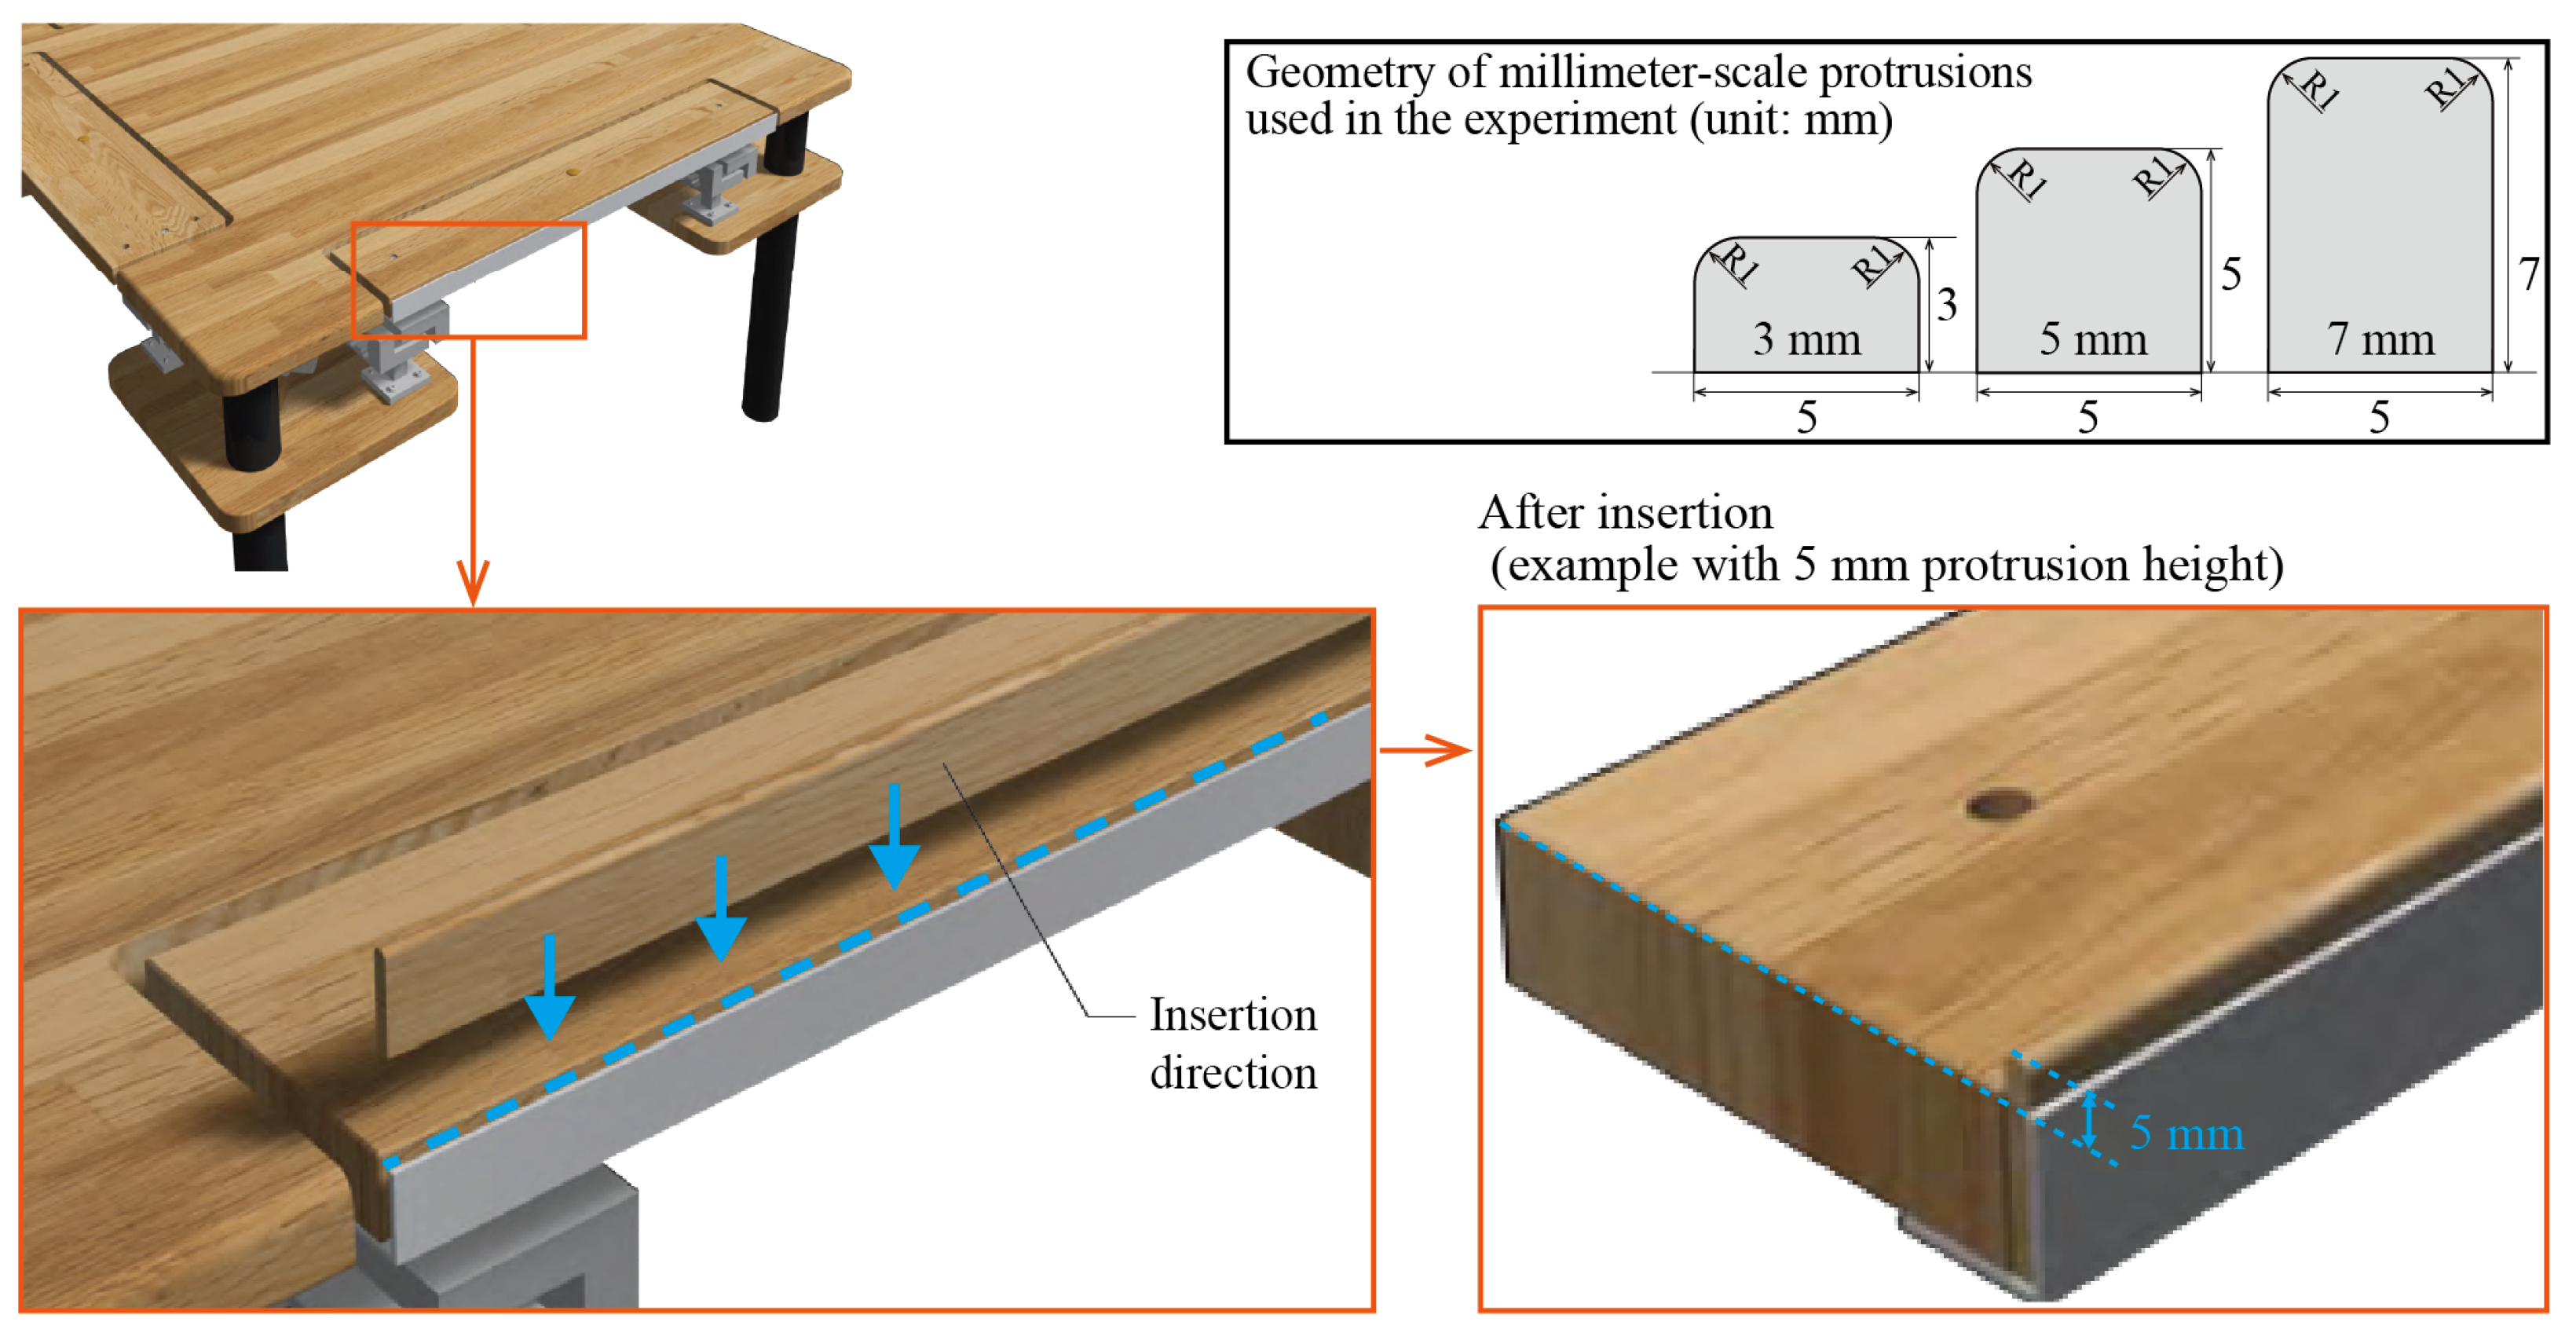
Experimental apparatus and edge-protrusion geometry. Interchangeable wooden inserts provided heights of 3, 5, and 7 mm, a common protrusion width of 5 mm, and a 1-mm radius at both upper corners in every condition. The inserts fitted into the aluminum-angle mounting structure at the instrumented region without additional screws or adhesive. Protrusion height was defined from the common plane of the flush tabletop and aluminum-angle upper surfaces. Enlarged views illustrate insertion and the installed 5-mm condition.
The surface-configuration block comprised Normal, PVC sheet, silicone rubber, and grooved MDF (Figure 1). Normal was a flat, oil-finished oak laminated board. The PVC and silicone-rubber configurations each used a 1-mm sheet on a 9-mm MDF base; the grooved MDF panel was 9 mm thick. Interchangeable panels fitted into the recessed mounting socket. Effective table-surface heights were 70.0 cm for Normal, 71.0 cm for PVC and silicone rubber, and 70.9 cm for grooved MDF.
The edge-protrusion block used interchangeable wooden inserts with heights of 3, 5, and 7 mm, a common exposed width of 5 mm, and 1-mm radii (R1) at both upper corners (Figure 2). The inserts shared the same cross-sectional design apart from height and fitted into an aluminum-angle mount without additional screws or adhesive. The angle’s upper surface was flush with the tabletop, and protrusion height was defined from this common plane. The heights and 2-mm spacing were exploratory design choices informed by small everyday furniture edges and anticipated finger engagement.
Original sensor gains were calibrated by applying a static load corresponding to a 10.5-kg mass to each axis; the procedure was evaluated across ten sensor units. The sensor documentation specified a nominal maximum load of approximately 30–40 kg per sensor unit. Additional static calibration and separate-recording validation of a current same-design assembly were performed in 2026. Detailed methods, calibration calculations, and results are provided in Appendix A.1.
2.3. Experimental Procedure
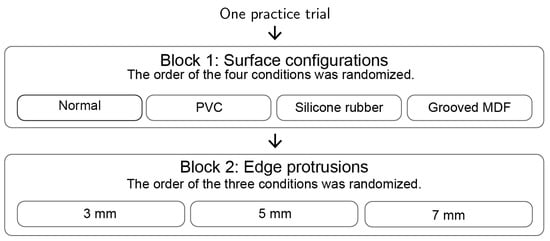
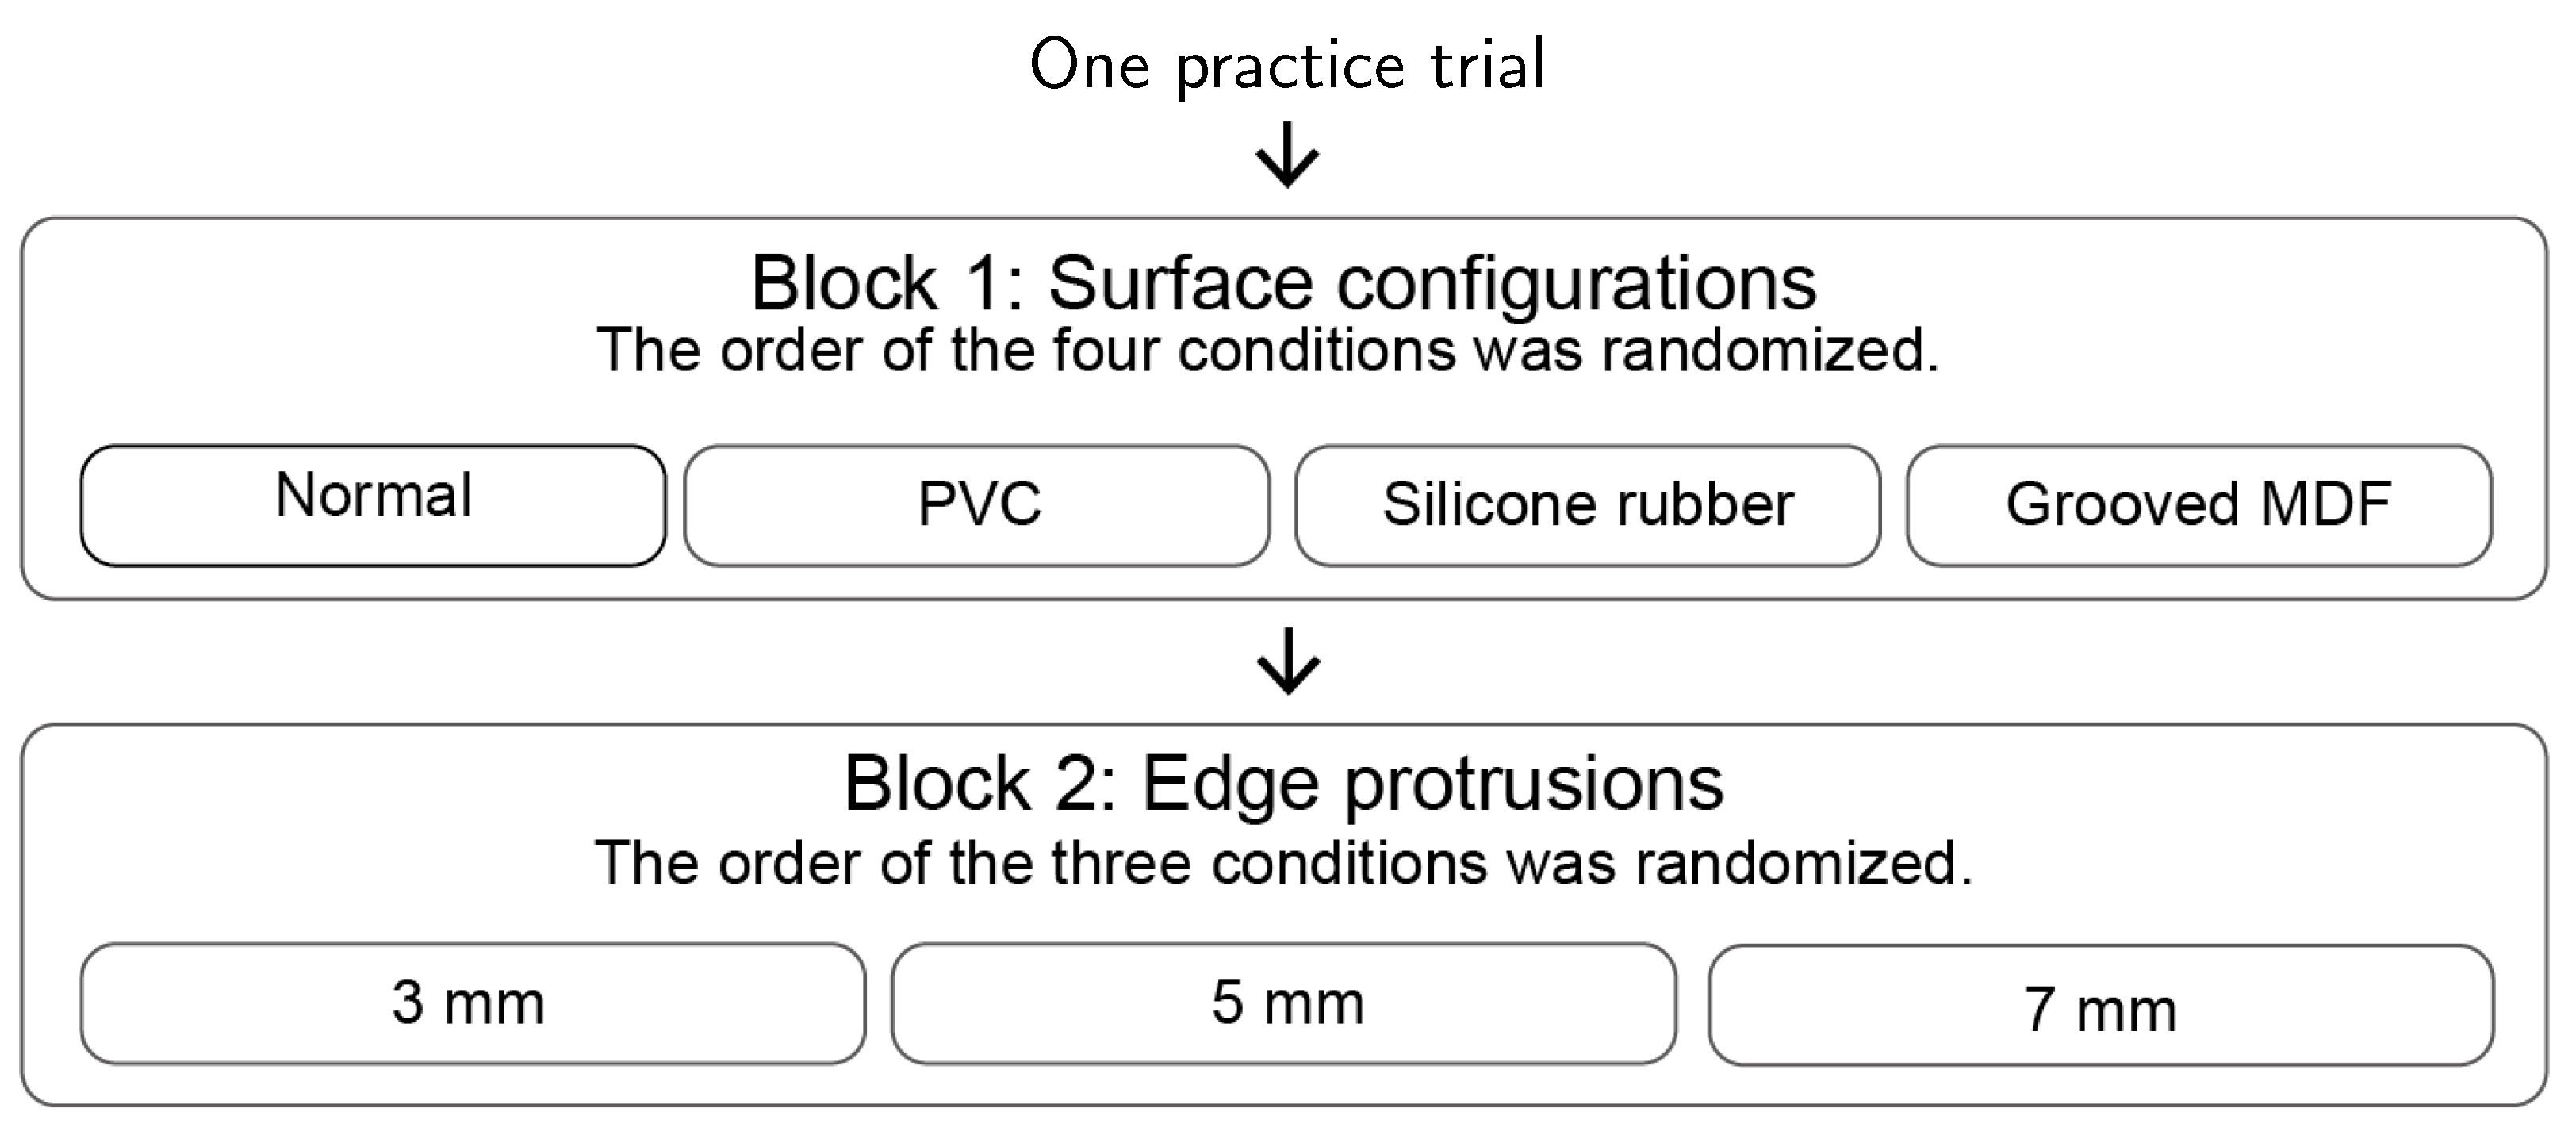
Figure 3 shows the experimental setup and STS task. After one practice trial, participants completed seven experimental conditions in two fixed-order blocks (Figure 4).
Figure 3.
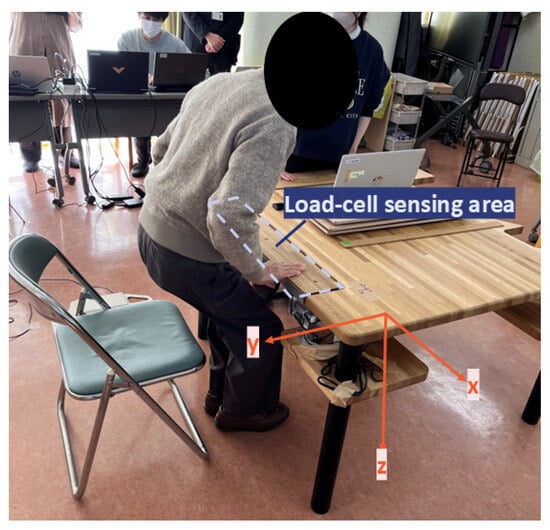
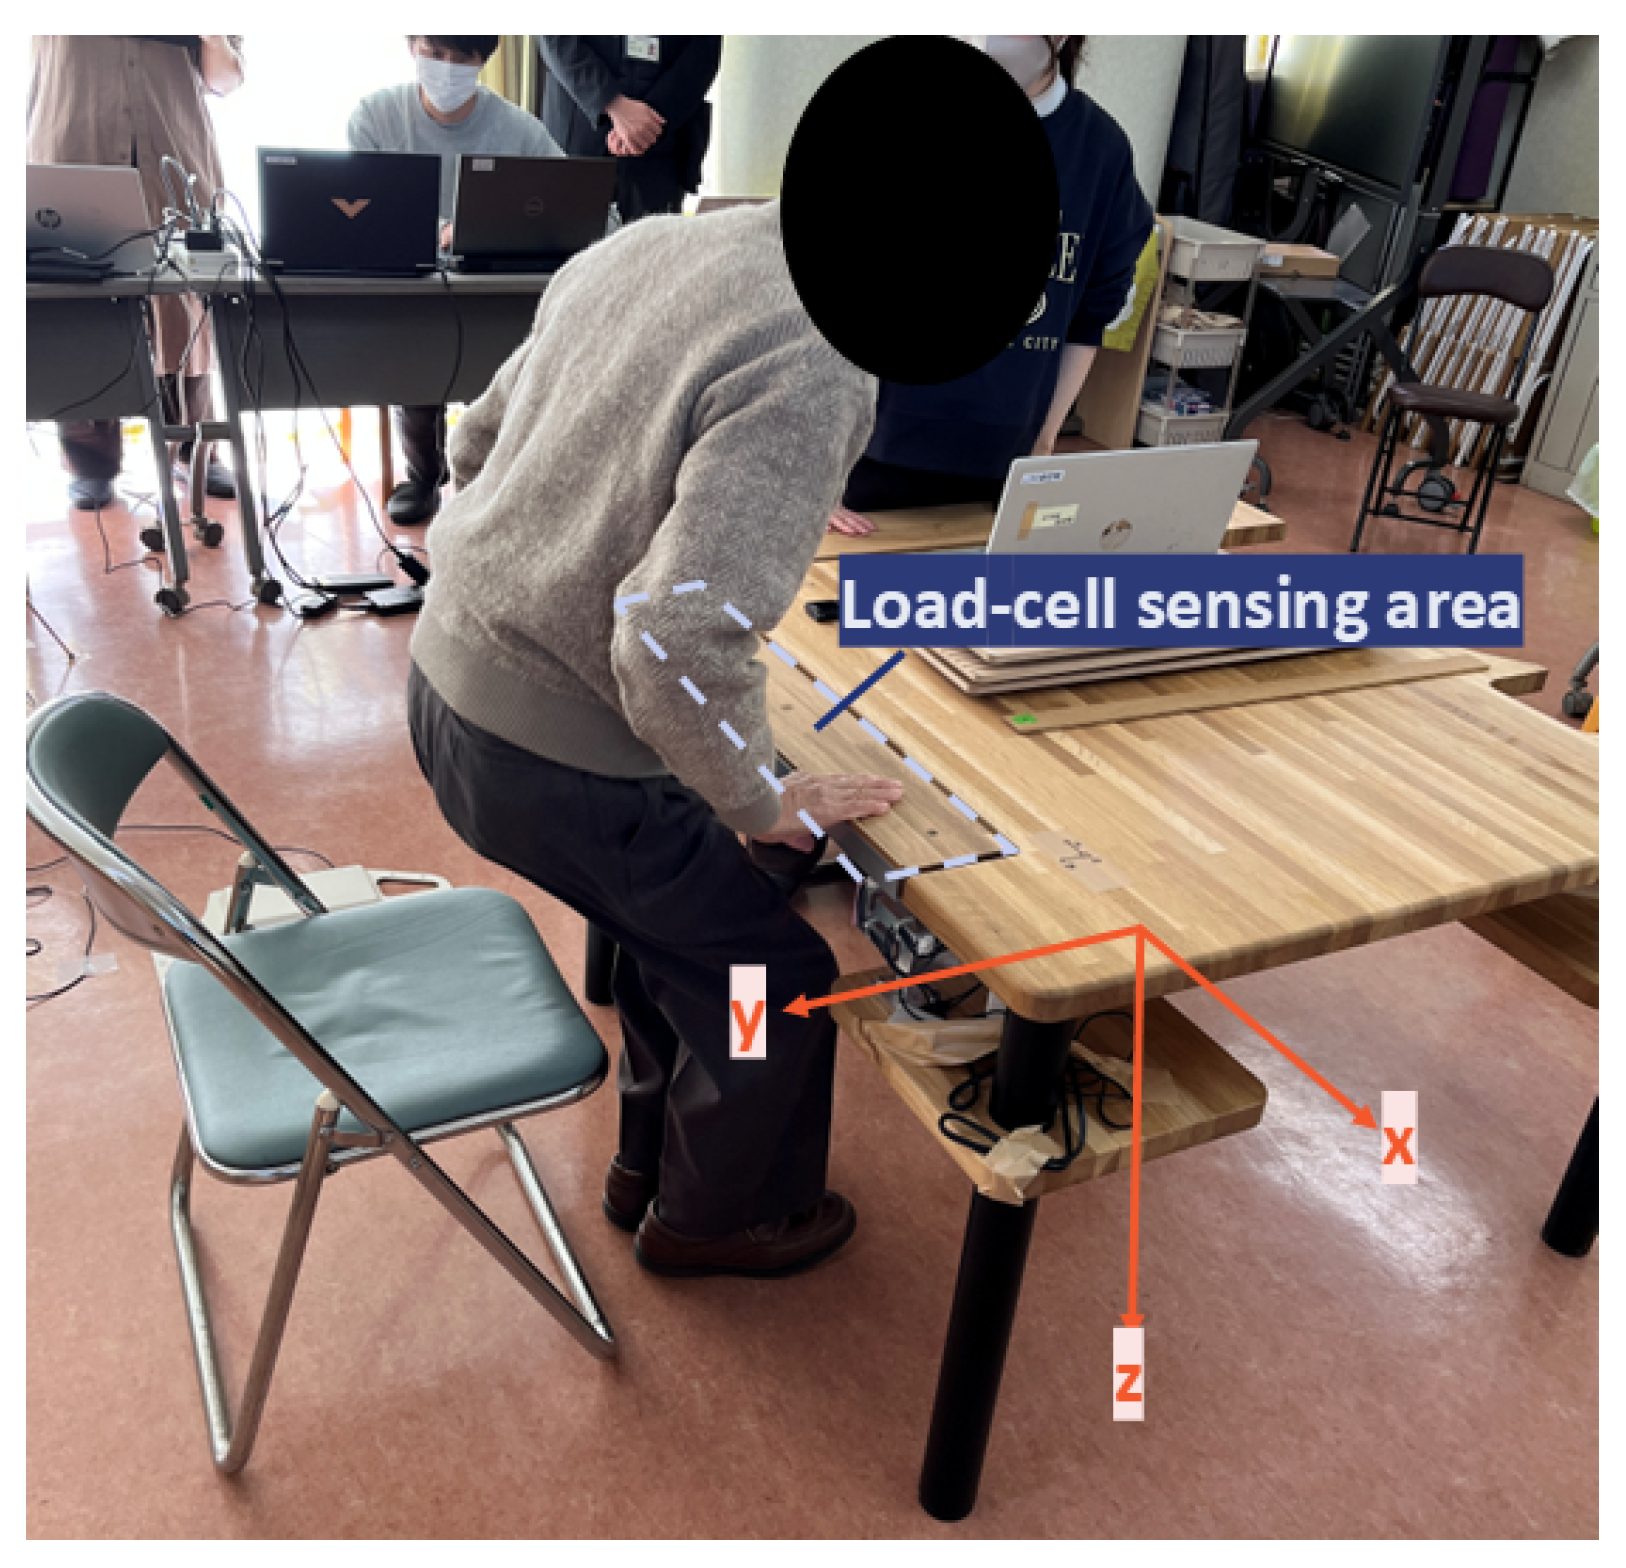
Experimental setup illustrating the sit-to-stand task. The participant places both hands on the load-cell sensing regions of the table (blue outline), which are directly connected to the two embedded tri-axial load cells beneath the surface. The arrows define the reporting directions: positive Y points toward the participant and positive downward Z points toward the floor. The stored Z component is negative for downward loading, so downward force is reported as .
Figure 4.
Schematic overview of the experimental sequence. One practice trial preceded the seven experimental conditions. The surface-configuration block was performed first, followed by the edge-protrusion block. Condition order was randomized within each block, whereas block order was fixed. The arrangement of conditions within each block is schematic and does not represent their chronological order.
The surface-configuration block was conducted first, with the order of the Normal, PVC, silicone rubber, and grooved MDF conditions randomized within the block. The edge-protrusion block followed, with the order of the 3-, 5-, and 7-mm conditions randomized within that block. The Normal condition was measured only in the surface-configuration block, and the edge-protrusion block did not include a no-protrusion control condition. One usable trial per condition was analyzed.
Participants began seated, placed both palms on the instrumented contact member, and were instructed to perform two preparatory forward trunk movements, stand after the second movement, and release their hands after reaching standing. An experimenter demonstrated the sequence simultaneously beside each participant, who was instructed to follow the demonstration.
A conventional chair with an estimated seat height of approximately 42 cm was used (Figure 3); seat height was not systematically recorded. Chair-to-table distance, foot placement, and hand position within the sensing regions were self-selected. Both palms maintained contact with the sensing region used for that condition. Hooking fingers onto the step between the sensing region and surrounding tabletop, or supporting the tabletop underside with the palms, was not permitted. No positioning markers were used.
Sessions lasted approximately 15 min, with rest as needed and an experimenter remaining nearby for safety. Conditions were repeated when a sensor-startup malfunction prevented a usable recording. The relatively heavy table was freestanding and was not mechanically anchored. Although informal qualitative comments on comfort and pain were noted during the sessions, neither standardized assessment of these outcomes nor systematic recording of slipping and adverse events was conducted.
2.4. Data Analysis
2.4.1. Data Processing
Each experimental condition was recorded separately. At the start of each recording, including after attachment changes, automatic zero-point adjustment was performed while participants kept their hands off the sensing surface. The three ADC channels were summed channel-wise across the two sensing units and converted to X, Y, and Z forces using a fixed affine matrix with a fitted intercept and no additional trial-specific baseline subtraction.
For the surface-configuration block, including Normal, and for the edge-protrusion block, forces were calculated using separate calibration matrices derived from the respective records of 11 December 2024. Details of the matrix derivation and the sensitivity analysis of calibration-matrix selection for the protrusion block are provided in Appendix A.3.
The saved timestamps indicated a median recording interval of approximately 47.5 ms (21.054 Hz). Signals were linearly resampled using these timestamps to a uniform 21-Hz grid and processed using a fifth-order Butterworth low-pass filter with a 1-Hz cutoff and zero-phase forward–backward filtering. This cutoff focused the primary analysis on the low-frequency component of the support-assisted movement. Sensitivity analyses repeated peak extraction and statistical comparisons at 0.5, 2, and 3 Hz and without low-pass filtering; the unfiltered signals were also resampled to 21 Hz.
The primary outcomes were horizontal pulling toward the participant (positive Y) and vertically downward loading (positive reporting Z); the mediolateral X component was outside the primary outcome scope. Stored Z values were negative for downward loading, so (Figure 3). For each trial, the maximum positive Y and the magnitude of the minimum stored Z, , were extracted independently over the first to last resampled sample, including the preparatory movements and STS transition. Synchronized movement-event markers were unavailable. Peak forces were normalized as , where is body mass. Absolute-force summaries are reported in Appendix Table A5.
All 392 selected recordings were checked for channels with fixed values throughout a trial among those used for force conversion. One defective PVC trial was excluded from both Y and Z; the participant’s other six conditions were retained. The recording quality checks are described in Appendix A.3, and exclusion and complete-case sensitivity results are reported in Appendix Table A10.
2.4.2. Statistical Analysis
Within the surface-configuration block, PVC, silicone rubber, and grooved MDF were each compared with Normal within participants. After data collection, three exploratory paired comparisons within the edge-protrusion block were conducted among the 3-, 5-, and 7-mm conditions (5 minus 3, 7 minus 5, and 7 minus 3 mm). Comparisons between Normal in the surface-configuration block and the edge-protrusion conditions were excluded from the primary analysis because they were confounded by differences in measurement configuration and block order.
The supplementary analysis scripts were tested with Python 3.12.14, NumPy 2.3.5, and pandas 2.2.3. All comparisons used two-sided paired Wilcoxon signed-rank tests in Python 3 with Holm adjustment over the three contrasts separately for each block and force component. PVC used 55 matched pairs and the other comparisons used 56. Complete-case sensitivity analyses used 55 participants. The surface-block exclusion sensitivity analysis also included the defective PVC trial for comparison.
Mean paired differences and 95% percentile-bootstrap confidence intervals were calculated from 20,000 participant-paired resamples. Rank-biserial correlations were reported for all comparisons. Bootstrap confidence intervals for rank-biserial correlations were available for the surface comparisons. The signed-rank test evaluates ranked paired differences, whereas the mean-difference interval quantifies uncertainty in the arithmetic mean; these are not corresponding inferential summaries. The median paired difference and its bootstrap interval were additionally reported for PVC as a robust summary.
The number and percentage of participants with positive horizontal-force differences from Normal were summarized descriptively for the surface block. Test implementation, tie and zero handling, bootstrap seeds, and software versions are documented in Appendix A.3 and Supplementary File S1.
3. Results
3.1. Participant Characteristics
A total of 59 older adults participated in the study: 27 were recruited from the Otassha health examination cohort and 32 from senior care facilities. After the three participant-level exclusions described in Section 2.1, the analyzed sample comprised 56 participants (25 from the Otassha cohort and 31 from care facilities). Table 1 summarizes the basic characteristics of both the full enrolled sample and the analyzed sample. The facility-recruited participants were older on average than the Otassha subgroup.
Table 1.
Characteristics of all enrolled and analyzed participants, with recruitment-pathway summaries.
Daily-living/support-related information was available for 58 participants, including standardized questionnaire items for the Otassha subgroup and experiment notes for facility-recruited participants. These records indicated that many participants had mobility-related support needs, including use of walking aids, reliance on furniture or surrounding objects during daily movements, and stair-related support or difficulty. Detailed physical-function data were available for the Otassha subgroup and are summarized in Appendix Table A1.
3.2. Effect of Tested Surface Configurations on Supportive Forces
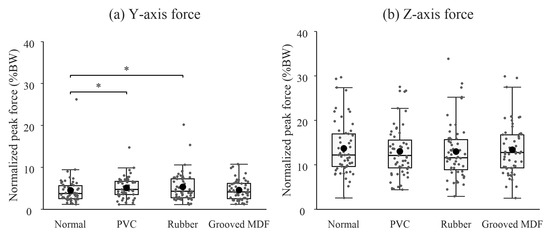
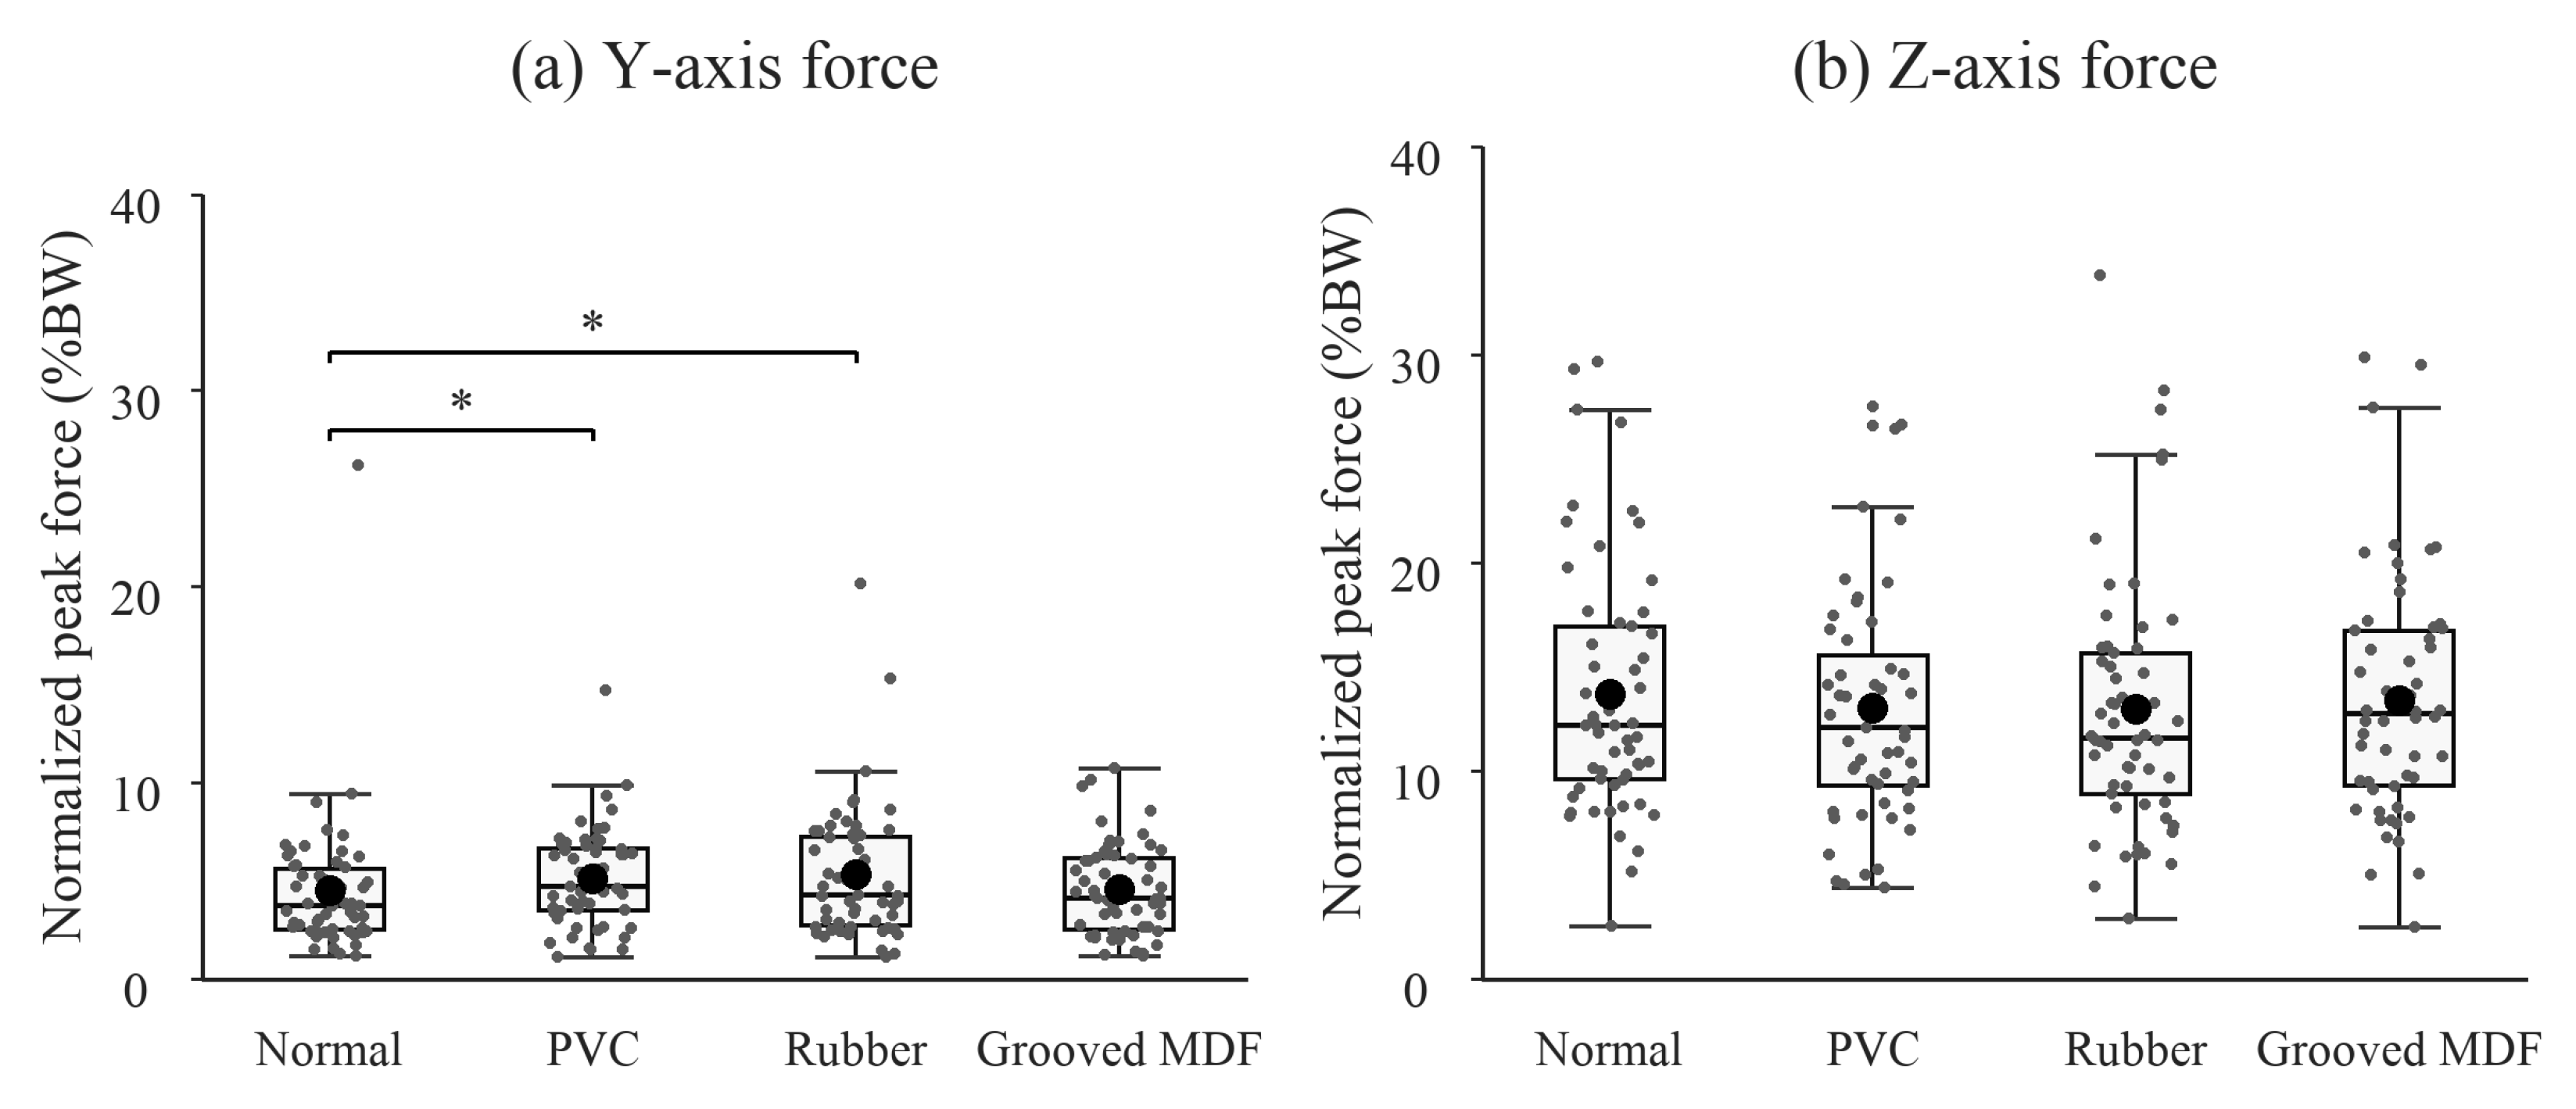
Figure 5 compares normalized peak forces across the tested surface configurations over the full recordings of the prescribed support-assisted STS task. Because panel thickness and construction differed along with the nominal surface material, these comparisons are interpreted as configuration-level rather than material-isolated effects.
Figure 5.
Normalized peak horizontal pulling (Y) and downward vertical (Z) forces in the surface block. Boxes show the interquartile range and median, whiskers extend to the most extreme observations within 1.5 times the interquartile range, black dots indicate means, and gray points indicate individual observations. PVC has 55 observations and each other condition has 56. The PVC test uses the corresponding 55 Normal trials. Horizontal comparisons with Normal were significant for PVC and silicone rubber after Holm adjustment. Brackets with * denote Holm-adjusted .
For horizontal pulling force (Y), PVC and silicone rubber showed significant paired differences toward higher peaks relative to Normal (Holm-adjusted and , respectively; rank-biserial correlations and ). Mean peak forces were BW (SD BW) for PVC, BW (SD BW) for silicone rubber, and BW (SD BW) for all 56 Normal trials. The PVC comparison used the 55 matched Normal trials.
The mean paired differences were 0.62 percentage points of body weight (95% CI: to ) for PVC and 0.81 (95% CI: to ) for silicone rubber. For PVC, 40 of 55 paired differences were positive, and the median paired difference was 0.65 percentage points (95% bootstrap CI: to ). The body-weight-normalized mean difference interval included zero despite the significant signed-rank result. The grooved-MDF mean paired difference was 0.06 percentage points (95% CI: to ; Holm-adjusted , rank-biserial correlation ).
No statistically significant differences in downward vertical peaks (Z) were detected in the surface block. The mean Normal peak was BW (SD BW).
3.3. Exploratory Comparisons Among Edge-Protrusion Heights
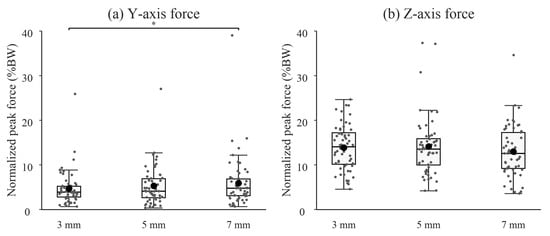
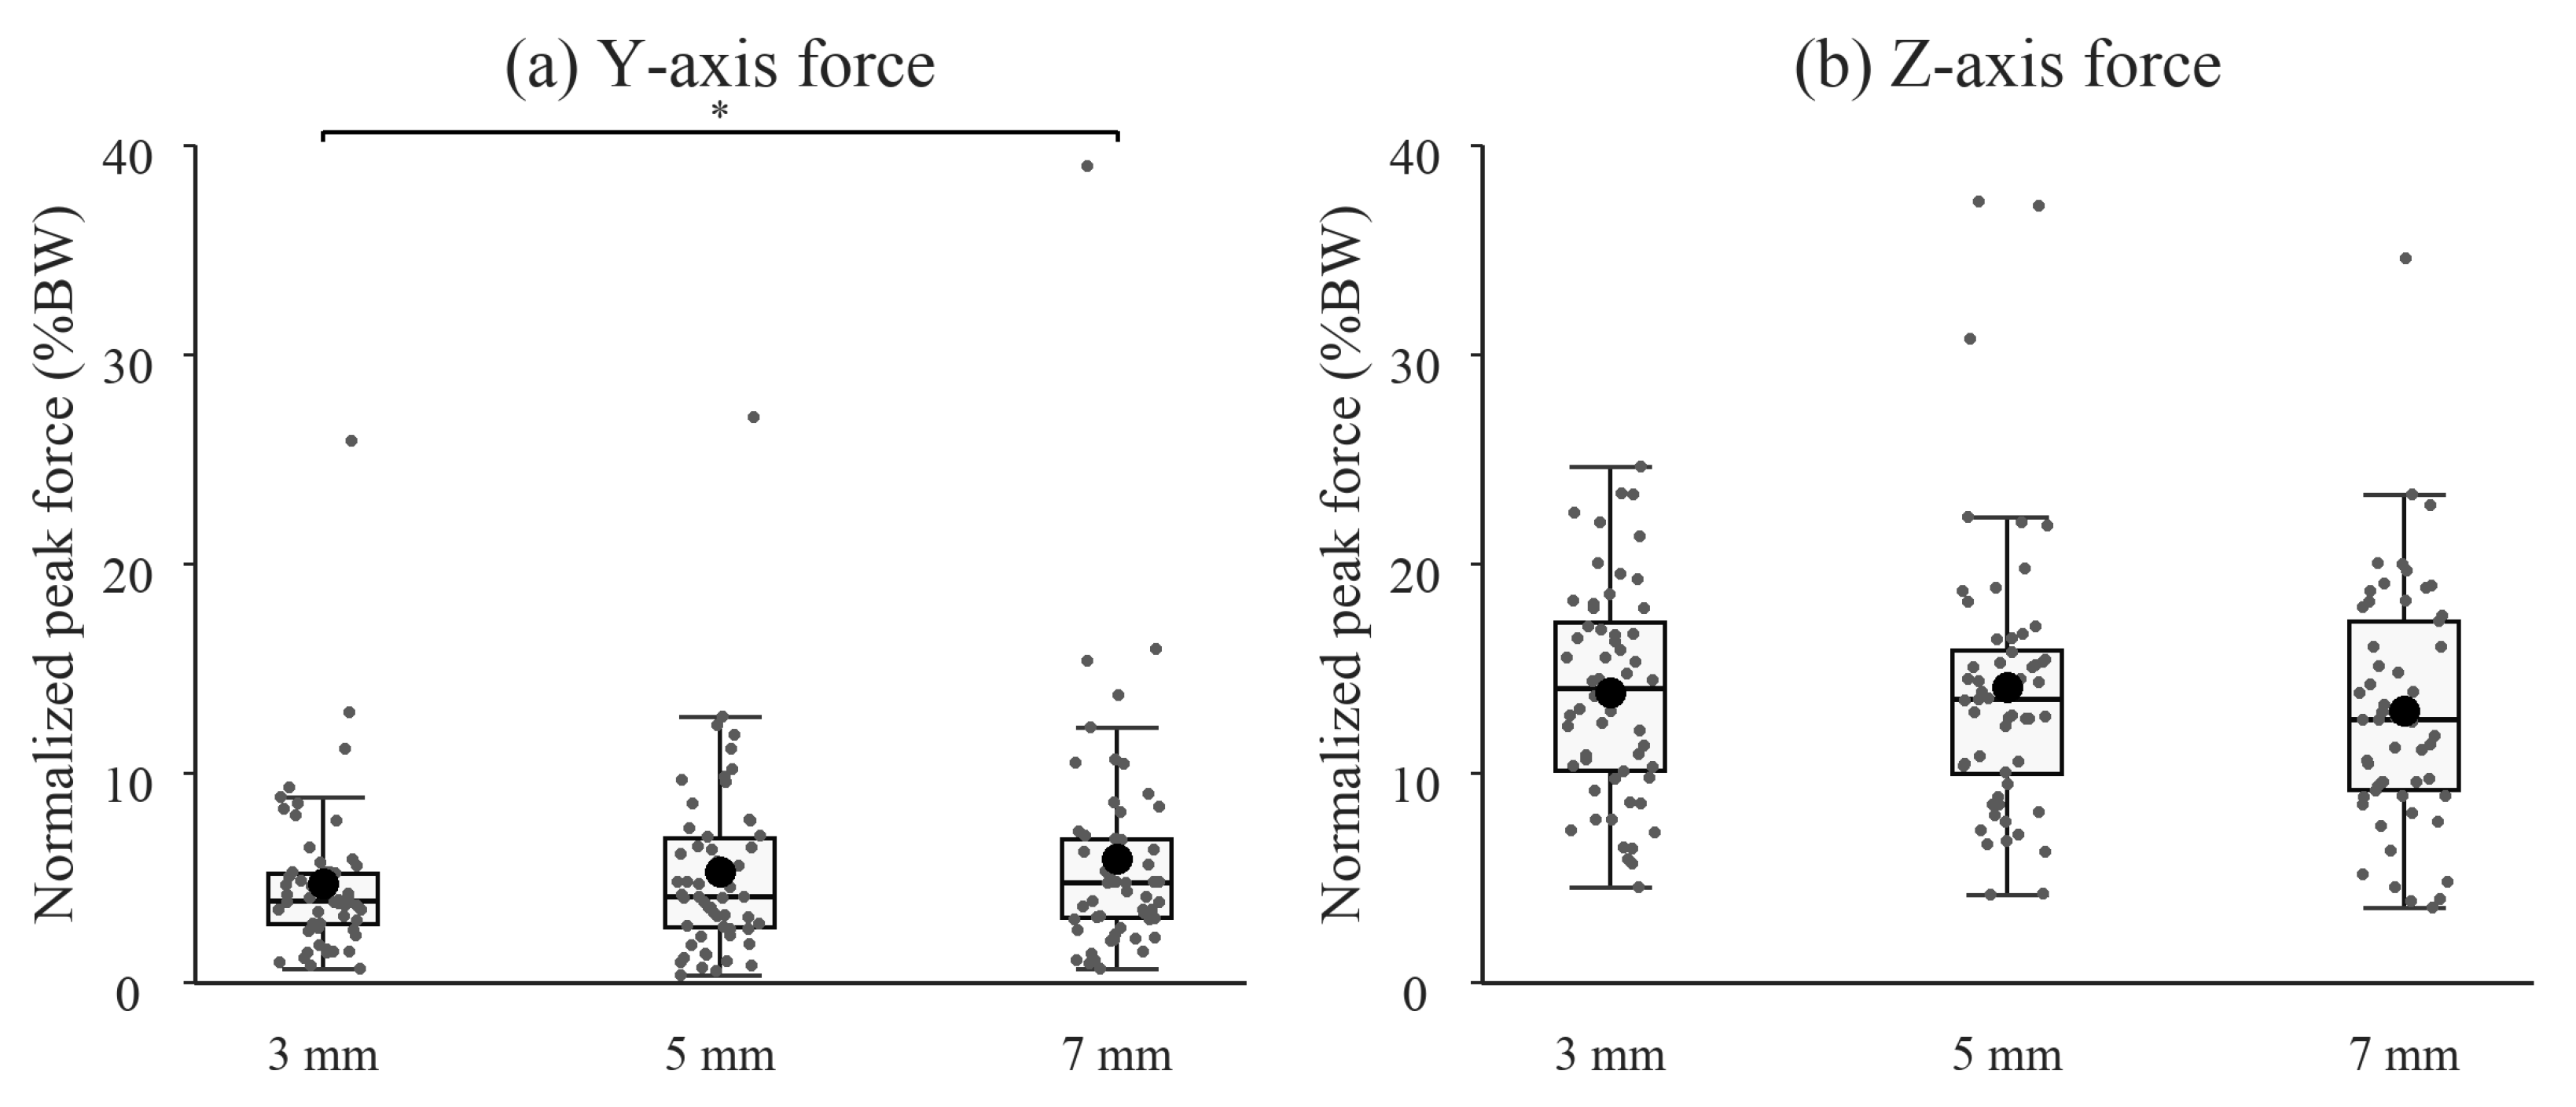
Figure 6 shows the three protrusion conditions. In the exploratory within-block analysis of 56 participants, horizontal pulling peaks were higher at 7 mm than at 3 mm (mean paired difference: 1.18 percentage points of body weight, 95% CI: to ; Holm-adjusted ; rank-biserial correlation ). The 5-minus-3 mm and 7-minus-5 mm differences were 0.53 (95% CI: to ) and 0.64 (95% CI: to ) percentage points, respectively. Neither contrast reached significance after Holm adjustment of the signed-rank tests ( and , respectively). None of the three height contrasts was statistically significant for downward vertical peaks.
Figure 6.
Normalized peak horizontal pulling (Y) and downward vertical (Z) forces at the three protrusion heights, with 56 observations per condition. Box, whisker, and point conventions match Figure 5. The exploratory within-block 7-minus-3 mm horizontal contrast was significant after Holm adjustment (). Brackets with * denote Holm-adjusted .
The horizontal 7-minus-3 mm contrast remained significant across the tested filter settings in both the primary and complete-case samples, whereas adjacent-height results were sensitive to the filter setting or analysis sample. With the alternative protrusion calibration from February 2025, the mean horizontal 7-minus-3 mm difference at 1 Hz was +1.29 percentage points of body weight (95% CI: 0.67 to 2.03; Holm-adjusted ); neither adjacent horizontal contrast was significant at 1 Hz in the primary sample. No vertical height contrast was significant at 1 Hz under either calibration (Appendix Table A4 and Table A10).
4. Discussion
4.1. Summary of Main Findings
Peak horizontal pulling forces were higher for PVC and silicone rubber than for Normal within the surface block. Within the protrusion block, the exploratory analysis found higher horizontal peaks at 7 mm than at 3 mm. The adjacent-height comparisons were inconclusive at the primary setting. No statistically significant vertical differences were detected in either block.
The mean Normal vertical peak was BW. These combined bilateral forces cannot be directly compared with prior measurements for individual upper limbs during assisted STS [16].
4.2. Possible Mechanisms of Increased Horizontal Force
The higher horizontal pulling-force peaks observed with the PVC-sheet and silicone-rubber configurations may be related to differences in the local hand–surface interface. Previous studies have shown that surface properties and contact conditions influence fingertip friction and force coordination, including in older adults [7,8,9,11,12,13]. During the prescribed task, differences in frictional resistance or surface compliance might have influenced how participants maintained hand contact while applying horizontal forces. However, neither friction coefficients nor finger–surface contact behavior were directly measured. Furthermore, the tested panels differed in thickness and construction as well as material. Therefore, the present results reflect differences among the tested surface configurations, and the contribution of individual surface properties cannot be determined.
Finger engagement with the raised edge is one possible explanation for the observed difference between the 7- and 3-mm conditions. The difference in height may have changed how participants engaged their fingers with the edge and applied horizontal force. This interpretation is consistent with the concept of affordances, whereby environmental features shape the actions available to users [24,25]. However, finger placement and contact mechanisms were not directly observed, and it remains unclear whether participants actually engaged the protrusions in this manner. Direct observation of hand-contact strategies, together with measurements of local contact properties, would be needed to distinguish these possible mechanisms.
4.3. Biomechanical and Design Implications
Horizontal hand forces during assisted STS can contribute to the mechanics of body support, but their effects depend on the direction and timing of force application, support geometry, and movement strategy [15,20,26]. The surface-configuration and exploratory height comparisons motivate direct testing of how local contact interfaces contribute to force application during the task. However, greater horizontal force should not necessarily be interpreted as greater assistance. The mechanical implications of these forces for body movement and lower-limb loading require further investigation.
From a design perspective, the findings motivate further investigation of small, retrofittable features at familiar furniture-contact locations. By extending support-oriented design to local surface materials and geometries, such features could complement dedicated handrails and grab bars. Importantly, the design objective would not simply be to maximize the force applied to furniture, but to create contact interfaces that enable appropriate and comfortable support during everyday movements. Future research should, therefore, examine hand-contact strategies together with movement performance and user experience to determine whether these interface-level changes offer meaningful functional benefits.
4.4. Limitations
Several limitations affect the interpretation of these findings. First, force peaks were extracted from complete recorded trials without synchronized movement-phase annotations, and only one valid trial per condition was analyzed. Consequently, phase-specific effects and trial-to-trial repeatability could not be determined. Independently extracted component peaks do not establish changes in resultant-force direction. Counts of positive single-trial differences do not establish stable individual benefit or a reproducible responder subgroup. In addition, hand and foot positions were self-selected within the prescribed contact restrictions, chair height was estimated rather than systematically recorded, and the interchangeable panels differed in effective surface height and construction. These factors limit the isolation of individual surface properties.
Experimental notes indicated that one participant with notably high horizontal pulling peaks did not complete the prescribed STS movement during the retained protrusion recordings. The horizontal 7-minus-3 mm contrast remained positive and statistically significant in both calibration cases when that participant was omitted in a sensitivity analysis (Appendix Table A13). Because full-record peaks may arise from different movement phases or from additional movements in incomplete trials, higher peaks cannot be interpreted as evidence of successful, easier, or safer STS.
Second, the surface-configuration block always preceded the edge-protrusion block, and the blocks used different sensor pairs, contact regions, and geometries. Normal was recorded only in the surface block, so the height comparisons address relative differences among existing protrusions. The exploratory comparison does not establish the effect of adding a protrusion or identify an optimal height. A flat reference within the same sensing configuration would be needed to study the effect of adding a protrusion. The clearance gap represents the intended load path, but quantitative load isolation and absence of contact under load were not verified.
Third, force conversion relied on block-specific calibration matrices derived from archived static reference-load and sensor-output recordings (Appendix A.3). Automatic unloaded zero adjustment was performed at the start of each condition recording, including after attachment changes. The archived static records do not establish equivalent response across sessions or quantify measurement uncertainty under the original experimental conditions. In particular, we cannot determine whether the smaller PVC and silicone-rubber differences exceeded potential condition-dependent measurement error. The 2026 tests quantify static performance for a separate assembly of the same design using its own fitted matrix (Appendix A.1). They cannot establish error bounds for the participant recordings. Dynamic and combined loading remain uncharacterized. The nominal per-unit maximum load does not establish a calibrated system operating range or a safe support-load rating.
Finally, the exploratory adjacent-height results depended on the filter setting or analysis sample. Informal session notes included comments about pain or discomfort as well as little discomfort; these qualitative observations do not establish their frequency or condition-specific tolerability. Discomfort and safety-related outcomes were not systematically assessed, and the mass, stability thresholds, and attachment security of the freestanding, unanchored table were not quantitatively evaluated. These aspects, together with the absence of direct functional outcome measures, require further investigation before practical implementation.
5. Conclusions
This study investigated how tested panel configurations and millimeter-scale edge protrusions were associated with hand forces during a prescribed STS task involving preparatory trunk movements in older adults. Within the surface block, the PVC-sheet and silicone-rubber configurations showed higher peak horizontal pulling forces than Normal. Exploratory within-block comparisons among protrusion heights showed higher horizontal peaks at 7 mm than at 3 mm, whereas no statistically significant differences in peak downward vertical force were detected within either block. However, the small surface-configuration differences may not be distinguishable from condition-dependent measurement error. These measurements do not establish improved STS performance, reduced lower-limb loading, greater force-generating capacity, or reduced fall risk. The findings, therefore, support further investigation of small furniture-surface modifications, including assessment of functional benefit, attachment reliability, furniture stability, and user experience, before practical implementation can be recommended.
Supplementary Materials
The following supporting information can be downloaded at: https://www.mdpi.com/article/10.3390/bioengineering13111378/s1, Supplementary File S1 contains analysis scripts, a redacted copy of the investigator-confirmed acquisition program and configuration, a data dictionary, calibration documentation, and a synthetic example with an invented calibration matrix. The example data are invented and contain no participant records; the example matrix is not a matrix used in the experiment. Actual calibration coefficients are omitted from the acquisition copy and its optional live-force display is disabled. The package documents acquisition logic and demonstrates the computational workflow, but does not reproduce the original participant recordings, sensor-pair or trial-file selection, or complete apparatus measurement characteristics.
Author Contributions
Conceptualization, A.N., S.H., S.K., K.K. and Y.N.; methodology, A.N., S.H., S.K., K.K., H.K. and Y.N.; software, A.N., S.H. and K.K.; validation, A.N. and S.H.; formal analysis, A.N.; investigation, A.N., S.H., S.K. and H.K.; resources, K.K., H.K. and Y.N.; data curation, A.N., S.H. and S.K.; writing—original draft preparation, A.N.; writing—review and editing, Y.N.; visualization, A.N.; supervision, H.K. and Y.N.; project administration, Y.N.; funding acquisition, K.K. and Y.N. All authors have read and agreed to the published version of the manuscript.
Funding
This research was supported by a research project commissioned by the Ministry of Economy, Trade and Industry (METI), Japan, as part of a study on safety standards and accident prevention for products used by older adults. This research was also supported by JST Grant Number JPMJPF2101. Ayano Nomura was supported by JSPS KAKENHI Grant Number 24KJ1108.
Institutional Review Board Statement
The study protocol was approved by the Research Ethics Committee of the Tokyo Metropolitan Institute for Geriatrics and Gerontology on 10 October 2024 (Approval No. R23-053).
Informed Consent Statement
Written informed consent was obtained from all subjects involved in the study.
Data Availability Statement
The participant-level data supporting the findings of this study are not publicly available because of ethical and privacy restrictions. Requests for access may be considered by the corresponding authors, subject to approval from the relevant ethics committee and collaborating institutions. The publicly provided computational resources are listed under Supplementary Materials (File S1); they do not include participant-level data and do not reproduce the numerical study results.
Acknowledgments
We sincerely thank all participants for their time and cooperation in this study. During the preparation of this manuscript, the authors used ChatGPT and Codex (OpenAI), with GPT-5 and GPT-6 models, to assist with literature synthesis, discussion development, manuscript drafting, and language refinement. The authors critically reviewed and edited the AI-generated content, verified the scientific claims and references, and take full responsibility for the content of this publication.
Conflicts of Interest
The authors declare no conflicts of interest. The funders had no role in the design of the study; in the collection, analyses, or interpretation of data; in the writing of the manuscript; or in the decision to publish the results.
Abbreviations
The following abbreviations are used in this manuscript:
| AWGS | Asian Working Group for Sarcopenia |
| BW | Body weight |
| J-CHS | Japanese version of the Cardiovascular Health Study criteria |
| MDF | Medium-density fiberboard |
| PVC | Polyvinyl chloride |
| SPPB | Short Physical Performance Battery |
| STS | Sit-to-stand |
Appendix A. Detailed Participant and Statistical Summaries
Table A1.
Detailed mobility- and function-related characteristics of participants recruited from the Otassha cohort.
Table A2.
Positive participant-level horizontal differences from Normal within the surface block.
Case A denotes the primary protrusion calibration derived from the 11 December 2024 records for sensor IDs 3 and 4. Case B denotes the alternative protrusion calibration derived from the 6 February 2025 records for the same IDs. Both cases use the same surface-block matrix (M1/2), based on the 11 December 2024 records for IDs 1 and 2. Appendix A.3 describes the derivation of these matrices.
Table A3.
Primary analysis (Case A): normalized peak-force distributions and within-block contrasts at 1 Hz.
Table A4.
Filter sensitivity of the within-block contrasts.
Table A5.
Primary analysis (Case A): absolute peak-force distributions at 1 Hz.
Appendix A.1. Additional Static Characterization of a Same-Design Sensing Assembly
Additional static calibration and validation were conducted in 2026, after the participant experiments, using a same-design table-mounted sensing assembly. These subsequent tests characterize the tested assembly and do not retrospectively establish the measurement accuracy of the sensor pairs or installations used in the 2024 experiment. Calibration and validation recordings were obtained separately, and performance was evaluated using the actual mean reference force for each hold. Preliminary bench testing recorded unloaded-axis outputs during single-axis loading. Z loading had little influence on X and Y, whereas X or Y loading produced a small Z response with little effect on the other horizontal axis. These vise-fixed measurements were treated as reference observations because fixation differed from the installed configuration.
Appendix A.1.1. Calibration and Validation Methods
In the subsequent static characterization, the tested assembly was labeled sensor pair A (sensor IDs 1 and 2). Loads were applied at the central location permitted by the fixture, one axis at a time, using a force gauge configured as an FGP-50 (NIDEC-SHIMPO, Muko, Kyoto, Japan). Alternative contact positions and simultaneous horizontal–vertical loading were not tested.
The final calibration used 72 separately recorded holds: 40 loaded holds and 32 unloaded holds. Loaded calibration targets were , , and N for X and Y, with additional Y+ targets of 75 and 100 N, and , , and N for Z; each loaded target/direction had two holds. Unloaded recordings were obtained before X loading, after X loading, after Y loading, and after Z loading. The calibration fit used only the afternoon recordings because earlier recordings were obtained under different measurement states. Target values denote nominal settings, whereas the actual mean force-gauge readings were used as the reference values (Appendix Table A6).
For paired observations from sensor IDs 1 and 2, the corresponding ADC channels were summed. Each hold contributed one vector of mean channel sums and one mean reference-force vector; individual samples within a hold were not counted as independent repeated holds. An affine transformation was fitted by ordinary least squares to calibration holds only:
Here, M is a matrix, with forces in newtons. Each calibration hold had equal weight, including the unloaded holds. The off-diagonal coefficients permit linear cross-axis correction; they do not imply complete removal of interference under untested loading conditions. Full matrix coefficients are reported in Appendix Table A8. The reference sign was assigned from the operator-selected axis/direction and the magnitude of the force-gauge reading; the other reference components were set to zero under the single-axis loading assumption. Thus, those other components were not independently measured by a multi-axis reference instrument.
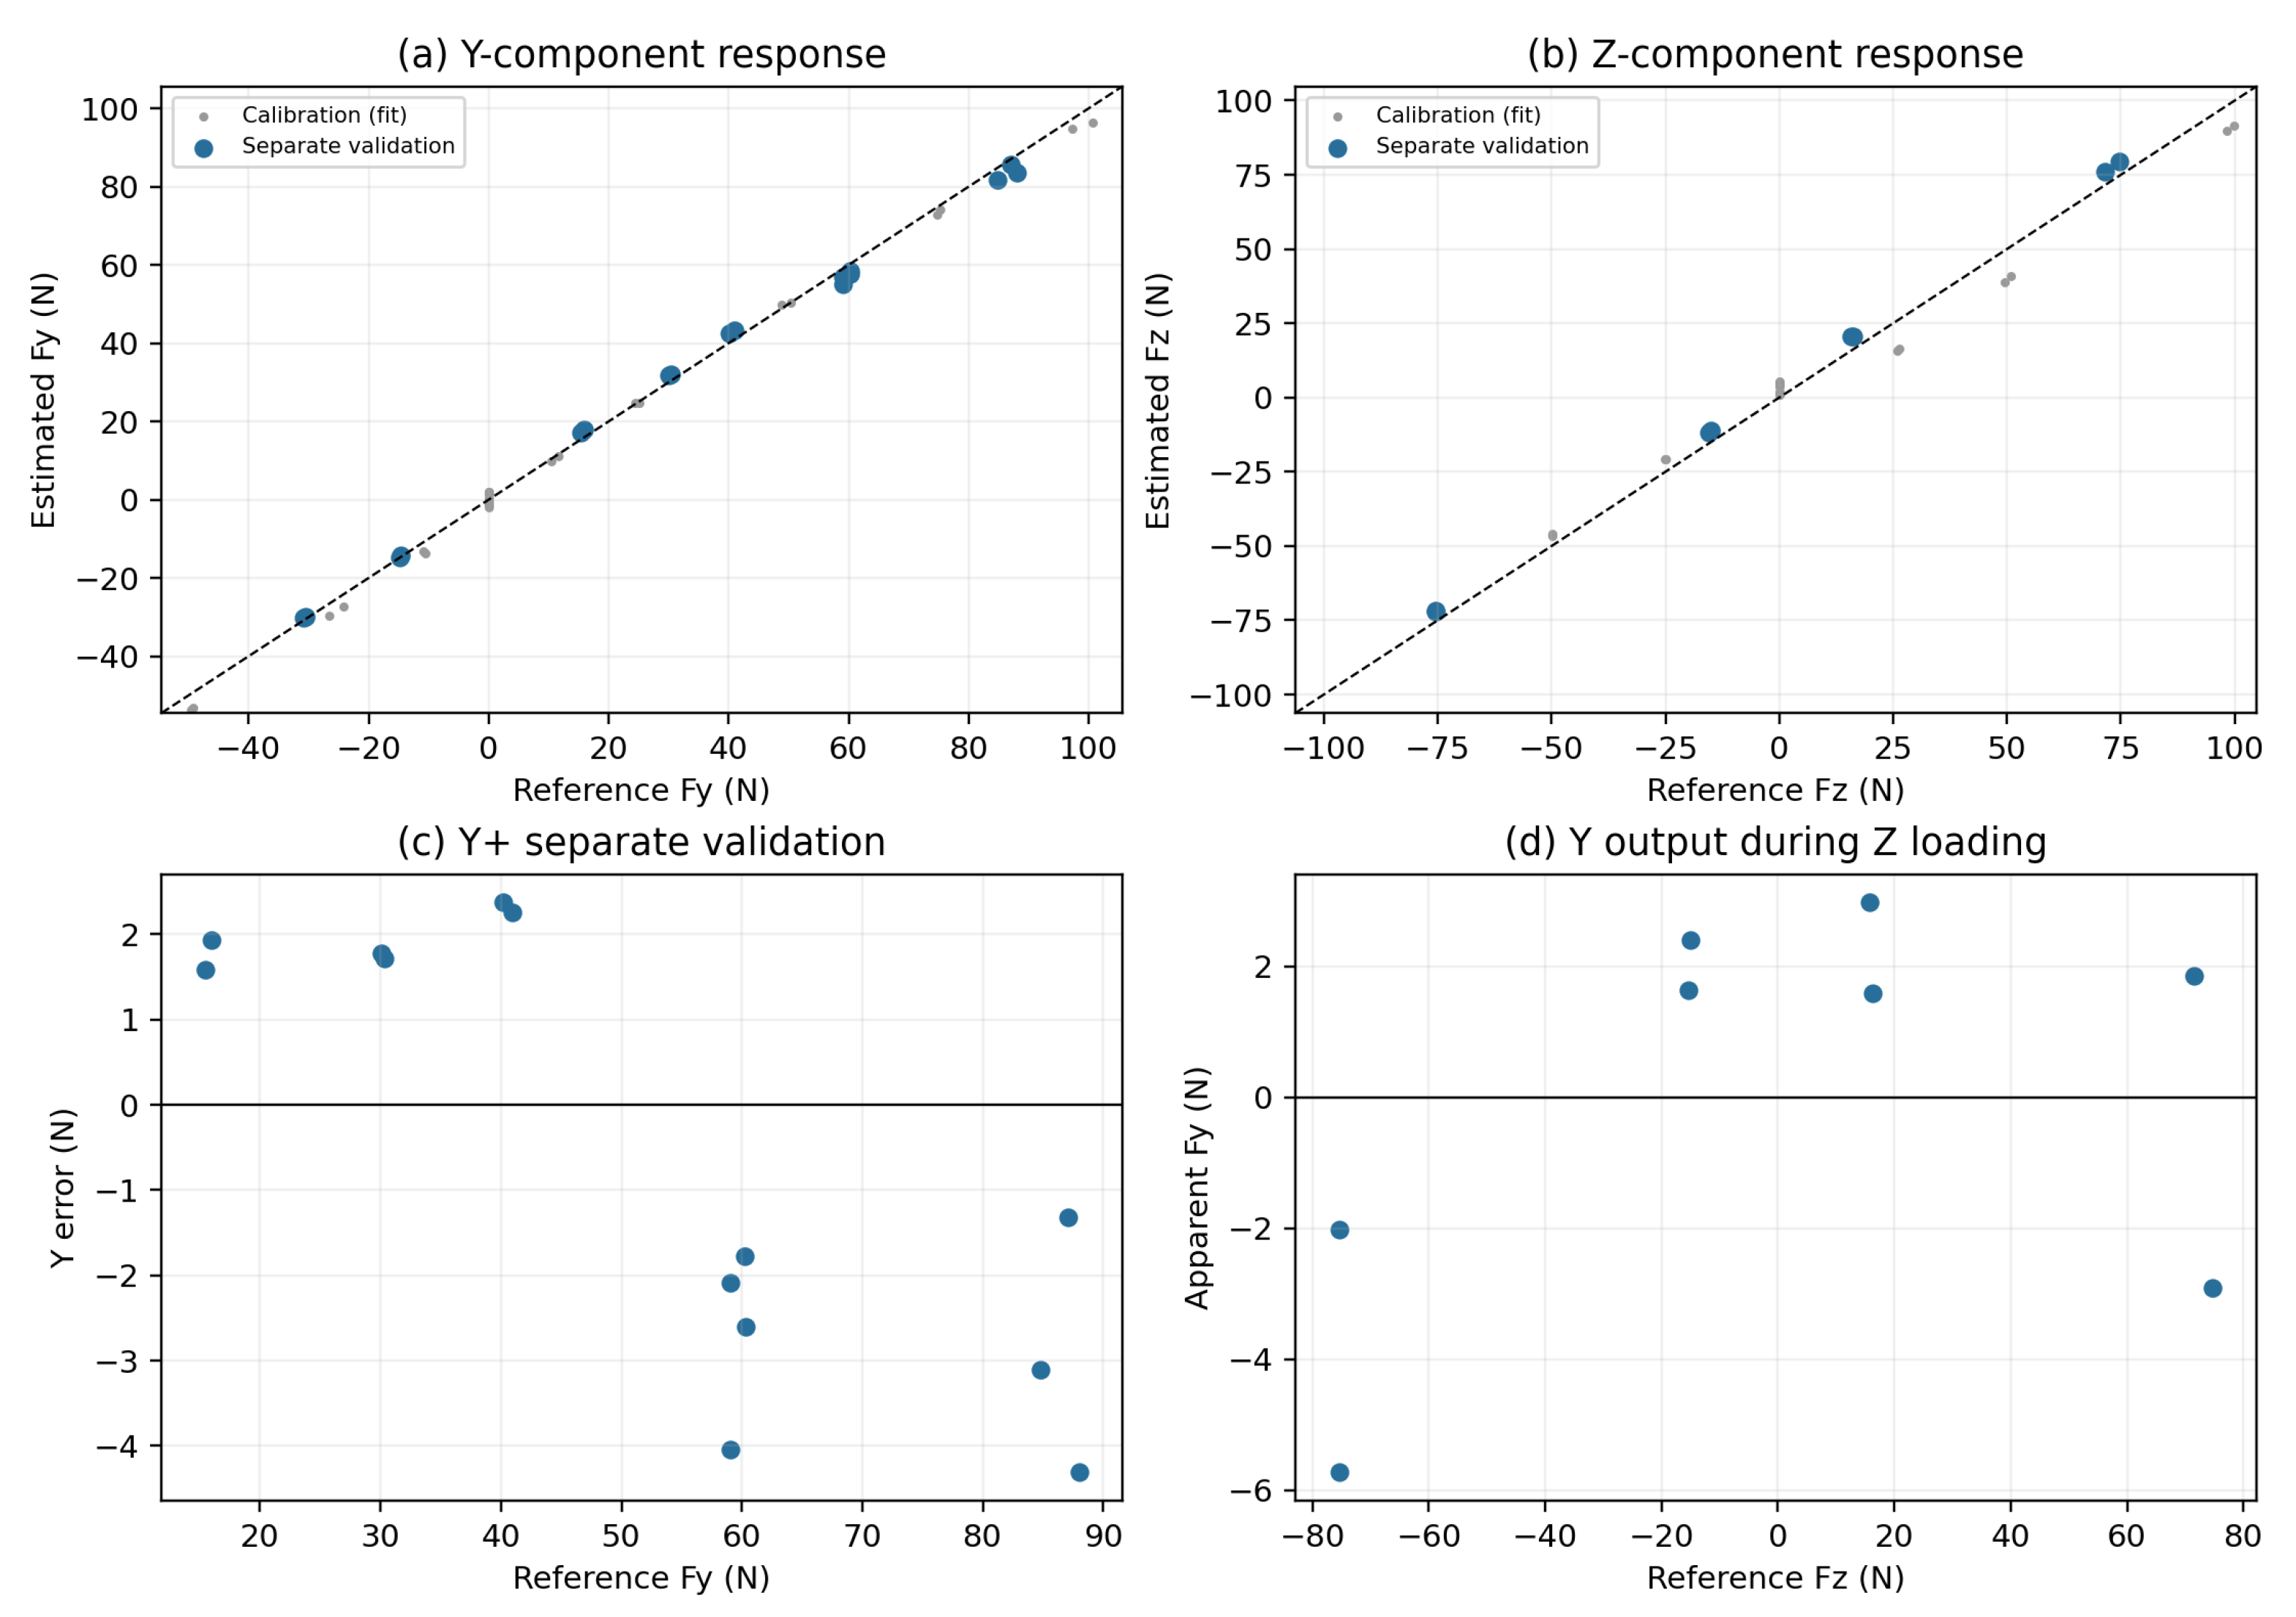
Separate validation comprised 29 loaded holds: Y+ at 15, 30, and 40 N (two holds each), 60 N (four holds), and 90 N (three holds); Y- at 15 and 30 N (two each); X+ and X- at 15 N (two each) and Z+ and Z- at 15 and 75 N (two each). Consequently, 13 validation holds concerned Y+, and 17 concerned Y across both signs. No validation hold was used to fit the matrix. The Y+ calibration range was extended after the first low-load validation recordings had been examined, and all validation holds were subsequently evaluated using the final matrix. Validation, therefore, denotes separate recorded holds excluded from fitting, rather than a wholly unseen confirmatory test of a matrix finalized before all validation. The 2026 matrix was used only to characterize the assembly tested in 2026.
Performance was evaluated from hold means without applying the 1-Hz STS peak-processing procedure. Error was estimated minus reference force; bias, mean absolute error (MAE), root-mean-square error (RMSE), and maximum absolute error were calculated by component, sign, and Y+ target load. Off-axis outputs during single-axis validation were summarized separately as apparent cross-axis output under the assumption that the other reference components were zero. No hold was removed using a post-hoc residual or reference-stability threshold. Two 60-N files reused the trial label 3 but contained distinct, non-overlapping recordings and were both retained.
Unloaded ADC means and corresponding fitted force outputs were compared across the calibration session. Because these unloaded holds contributed to fitting, their force outputs are calibration residuals, not independent zero-load validation. No unloaded validation hold was obtained during or after the validation sequence, and no additional unloaded hold bracketed the later Y+ high-load extension. No retrospective zero subtraction or validation-derived bias correction was applied. The original participant-experiment zero-adjustment procedure is described in Section 2.4.1.
Appendix A.1.2. Results and Measurement Limitations
The final 2026 calibration matrix reproduced the saved calibration and validation calculations. For the principal Y+ direction, the 13 separate validation holds covered actual mean reference forces of 15.435–87.982 N. Bias was N, MAE was 2.375 N, RMSE was 2.537 N, and maximum absolute error was 4.312 N. At target loads of 15, 30, 40, 60, and 90 N, the respective RMSEs were 1.766, 1.743, 2.317, 2.769, and 3.160 N. In particular, the 90-N targets corresponded to actual mean reference loads of 84.756–87.982 N. Overall estimates weighted individual holds equally rather than weighting the five load levels equally (Appendix Table A7).
Across the four Y- validation holds, RMSE was 0.446 N and maximum absolute error was 0.624 N. Across both Y signs (17 holds), RMSE was 2.229 N. X validation at N had RMSE 5.691 N and maximum absolute error 8.615 N; Z validation at and N had RMSE 4.089 N, maximum absolute error 4.776 N, and bias N. During the eight Z-loading validation holds, the apparent Y output had bias N, MAE 2.639 N, RMSE 2.928 N, and maximum absolute value 5.731 N. This output cannot be attributed uniquely to intrinsic sensor cross-talk because actual off-axis loading was not independently measured. Response plots distinguish calibration fits from separate validation in Appendix Figure A1.
Unloaded ADC means changed over the session (Appendix Table A9). From the initial to final unloaded periods, the mean fitted force output changed by N in X, N in Y, and N in Z. These calibration residuals indicate that one fixed offset did not reproduce all unloaded periods, but they do not isolate the cause. The 60-N hold with reference SD 1.964 N and range 8.2 N was retained together with all other validation holds.
Table A6.
Calibration and separate validation holds acquired on 30 October 2026.
Table A7.
Separate-recording validation of the final 2026 calibration matrix.
Table A8.
Final 2026 calibration matrix for channel-wise sums of sensor IDs 1 and 2.
Table A9.
Unloaded recordings during the 2026 calibration session.
Figure A1.
Static characterization of the 2026 sensing assembly. (a,b) Estimated versus reference Y and Z forces, distinguishing calibration holds used for fitting from separate validation holds; dashed lines indicate identity. (c) Y+ error for the 13 validation holds. (d) Apparent Y output during eight Z-loading validation holds. Each point represents one hold mean. This static-test figure retains the signed reference-instrument coordinates, distinct from the participant downward-positive reporting convention. Other-axis reference forces were assumed to be zero under nominal single-axis loading; a multi-axis reference instrument was not used. The figure does not establish dynamic peak accuracy or full-load-path equivalence with the participant experiment.
Appendix A.2. Detailed Filter Sensitivity and Representative Waveforms
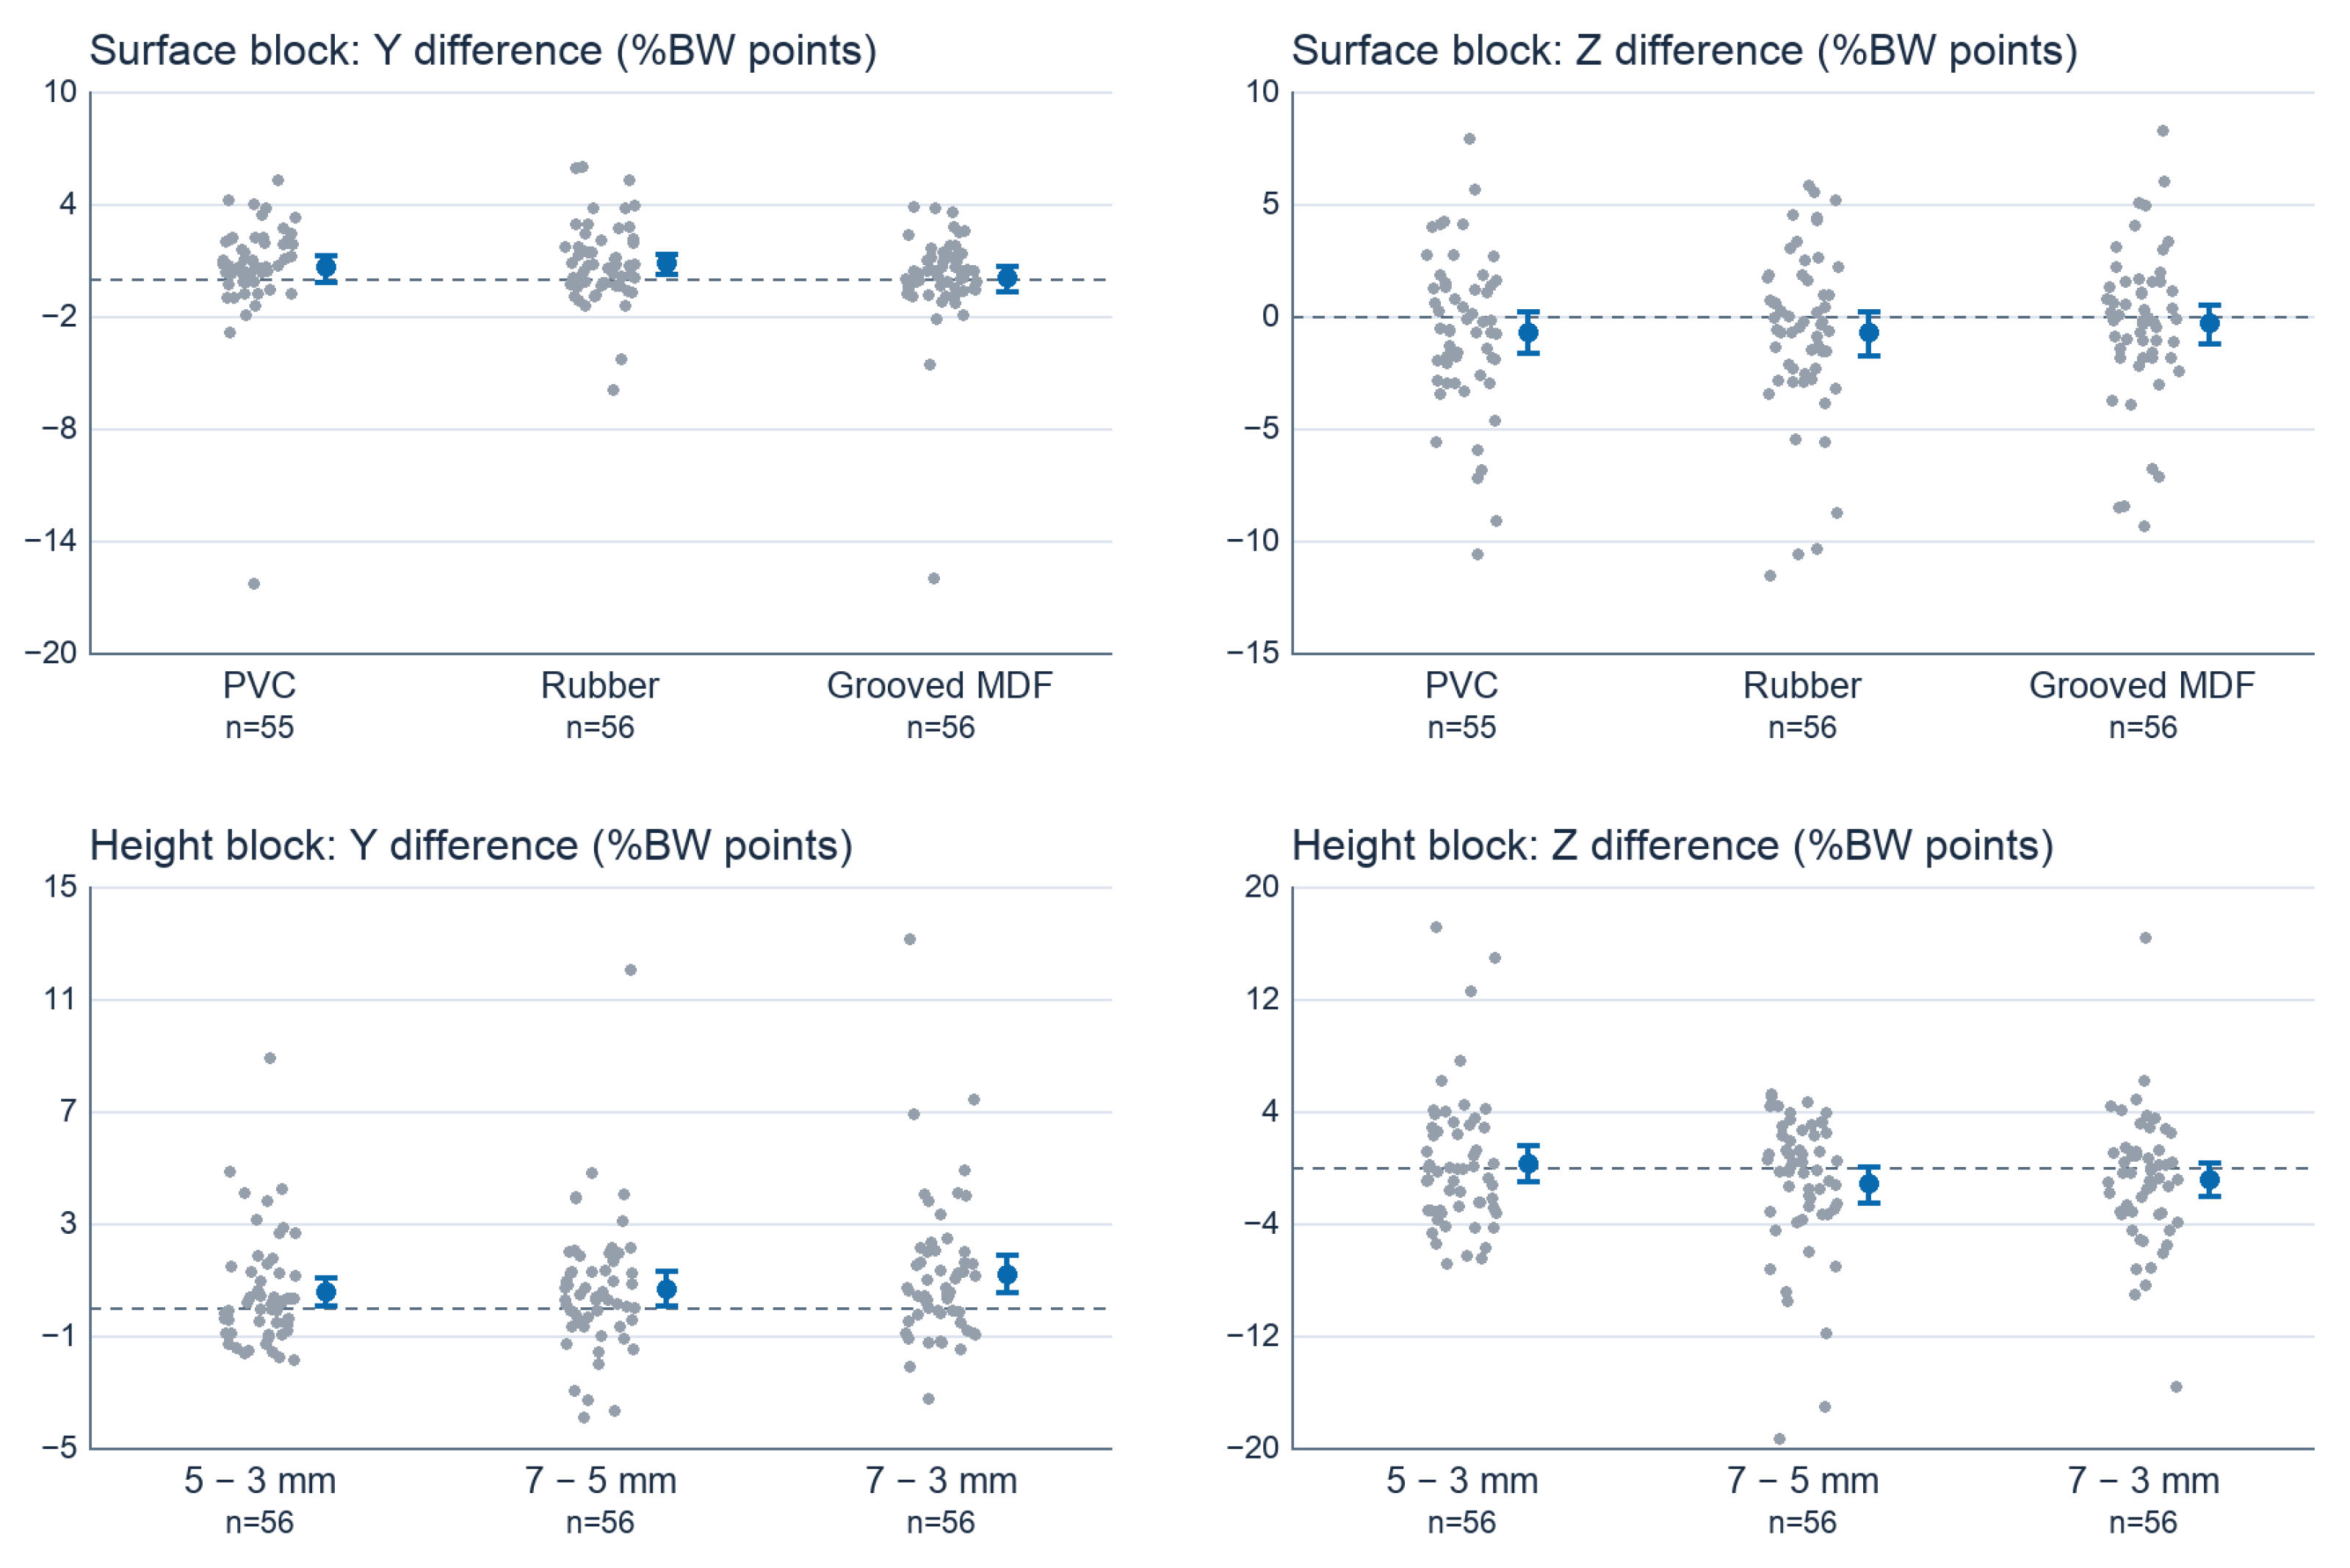
The surface-block contrasts retain the 1-Hz significance decisions across all tested filter settings in the primary sample. The horizontal 7-minus-3 mm contrast remains significant across those settings in both the primary and complete-case samples under Cases A and B. The adjacent-height decisions vary across specifications. The horizontal grooved-MDF contrast reached significance under 0.5-Hz filtering in the complete-case sample (Holm-adjusted ). Table A4 and Table A10 give the filter and sample sensitivity results, respectively.
Figure A2.
Complete-task force traces for one Normal trial from the surface block, converted with the surface matrix (M1/2), shared by both cases. The trial was selected from the 56 Normal recordings by proximity to the sample median 1-Hz Y and Z peaks, after scaling each distance by the corresponding sample SD. Each panel shows the uniformly resampled trace and the fifth-order forward–backward Butterworth results at 0.5, 1, 2, and 3 Hz. Dots mark the independent component peaks on the 1-Hz traces. The recorded sequence includes the preparatory movements and STS transition.
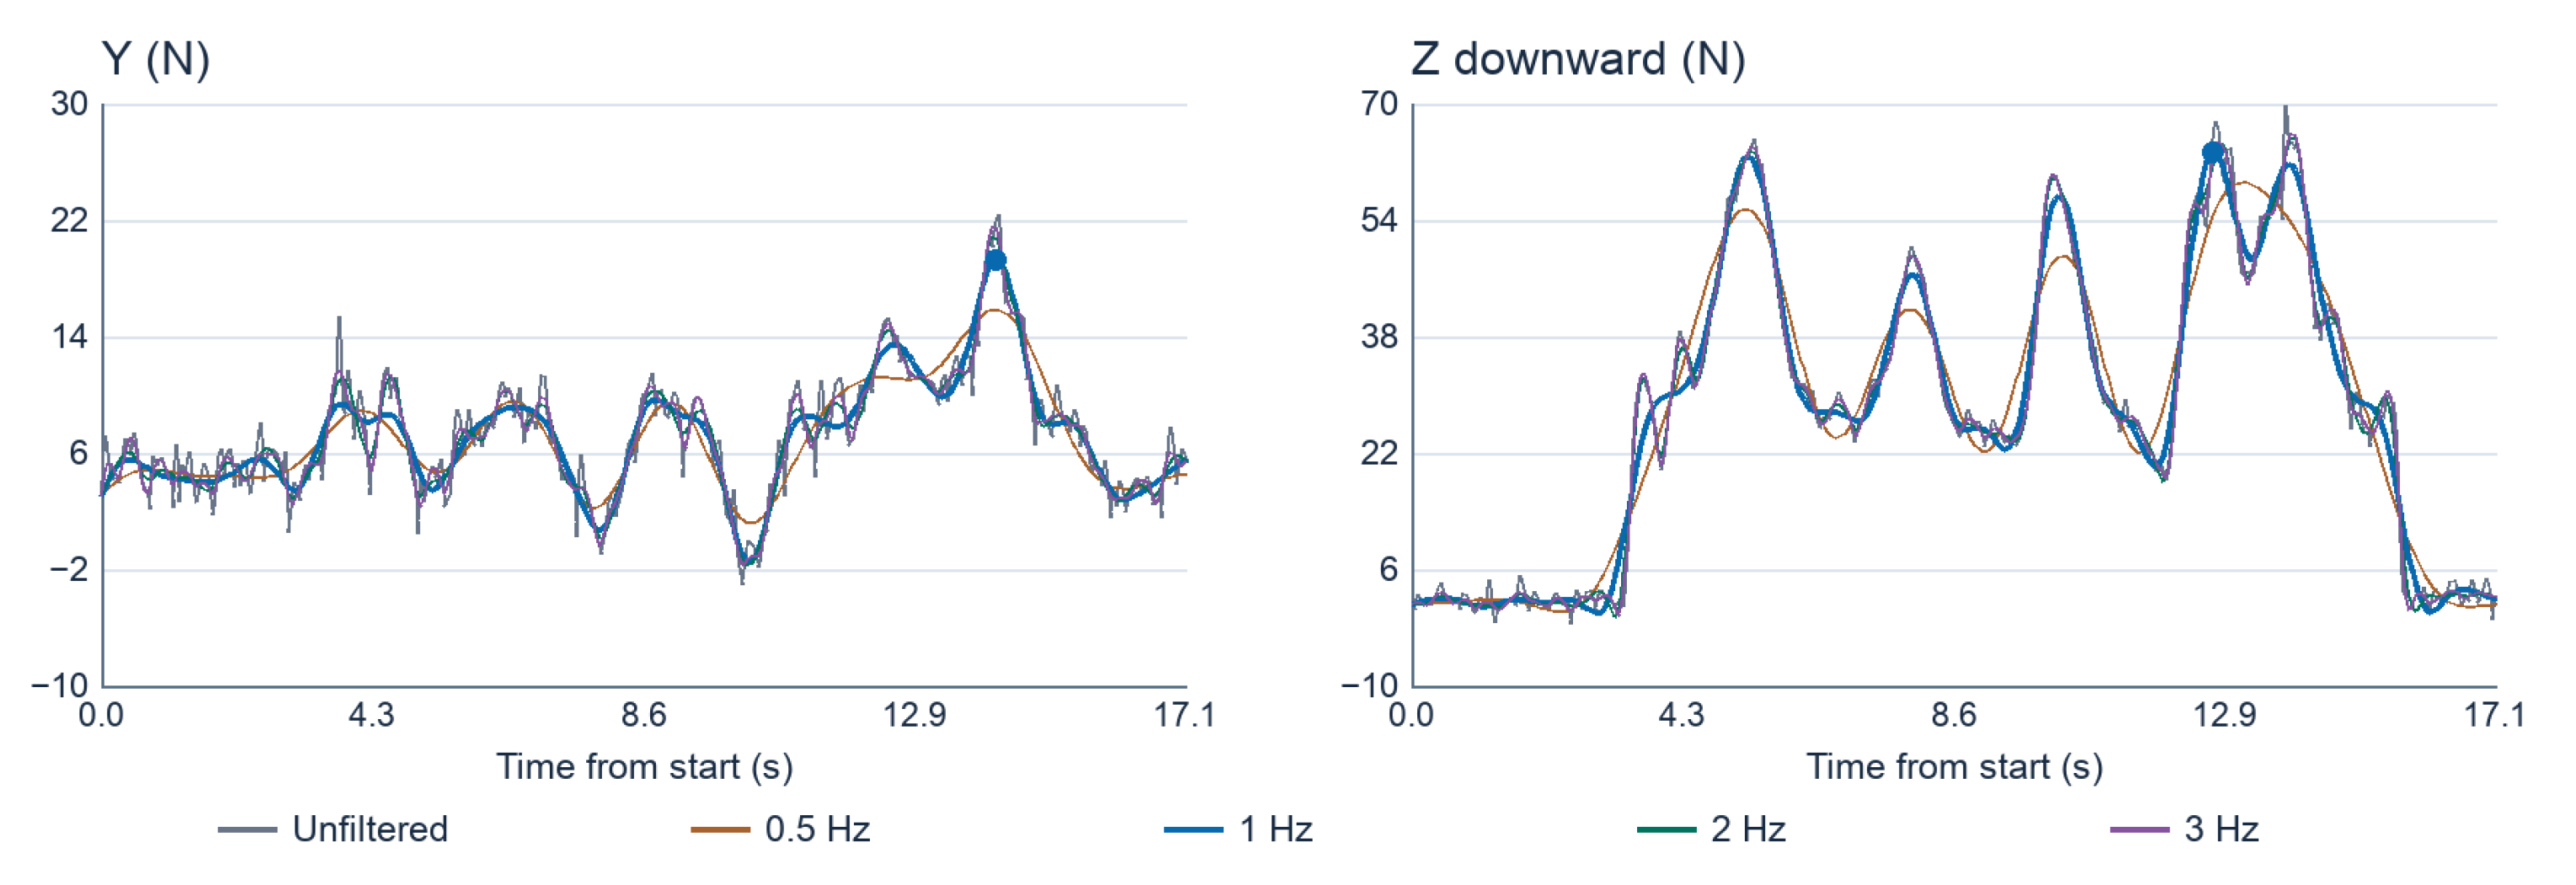
Figure A3.
Case A participant-level paired differences in peak force. The upper row compares surface configurations with the matching Normal trial (PVC: 55 pairs; other contrasts: 56). The lower row compares protrusion heights within the second block (higher minus lower, 56 pairs each). Left panels show horizontal pulling and right panels show downward vertical force. Gray points are individual differences; blue points and bars show paired means and individual 95% bootstrap confidence intervals. The dashed line indicates zero.
Appendix A.3. Processing, Statistical Implementation, and Source Records
Appendix A.3.1. Recording Provenance, Calibration, and Quality Audit
Experimental notes were used to identify 392 selected condition recordings from 56 participants. The number of unsuccessful recording attempts and the criteria for selecting among otherwise usable recordings were not documented. Sensor IDs 1 and 2 were used for the surface block, and IDs 3 and 4 for the protrusion block.
The historical matrix fitting counted the pair-level reference load twice. The surface-block matrix derived from the 11 December 2024 calibration (M1) was, therefore, corrected by halving its slopes and intercept. The historical protrusion matrix (M2) was fitted using IDs 1 and 2 from the 6 February 2025 calibration, although the participant protrusion recordings used IDs 3 and 4.
For the primary protrusion analysis, the matrix was fitted using IDs 3 and 4 from the 11 December 2024 calibration, with channel-wise sums of paired ADC outputs and the mean of the two logged values of each reference-force component. The December record was selected for its proximity to participant testing and the authors’ identification of the physical sensor pair. Independent serial-number and wiring records were unavailable, and some participant recordings preceded the December calibration. An alternative matrix fitted to IDs 3 and 4 from the February record with the same procedure was used for sensitivity analysis. No corresponding alternative surface-block calibration was available.
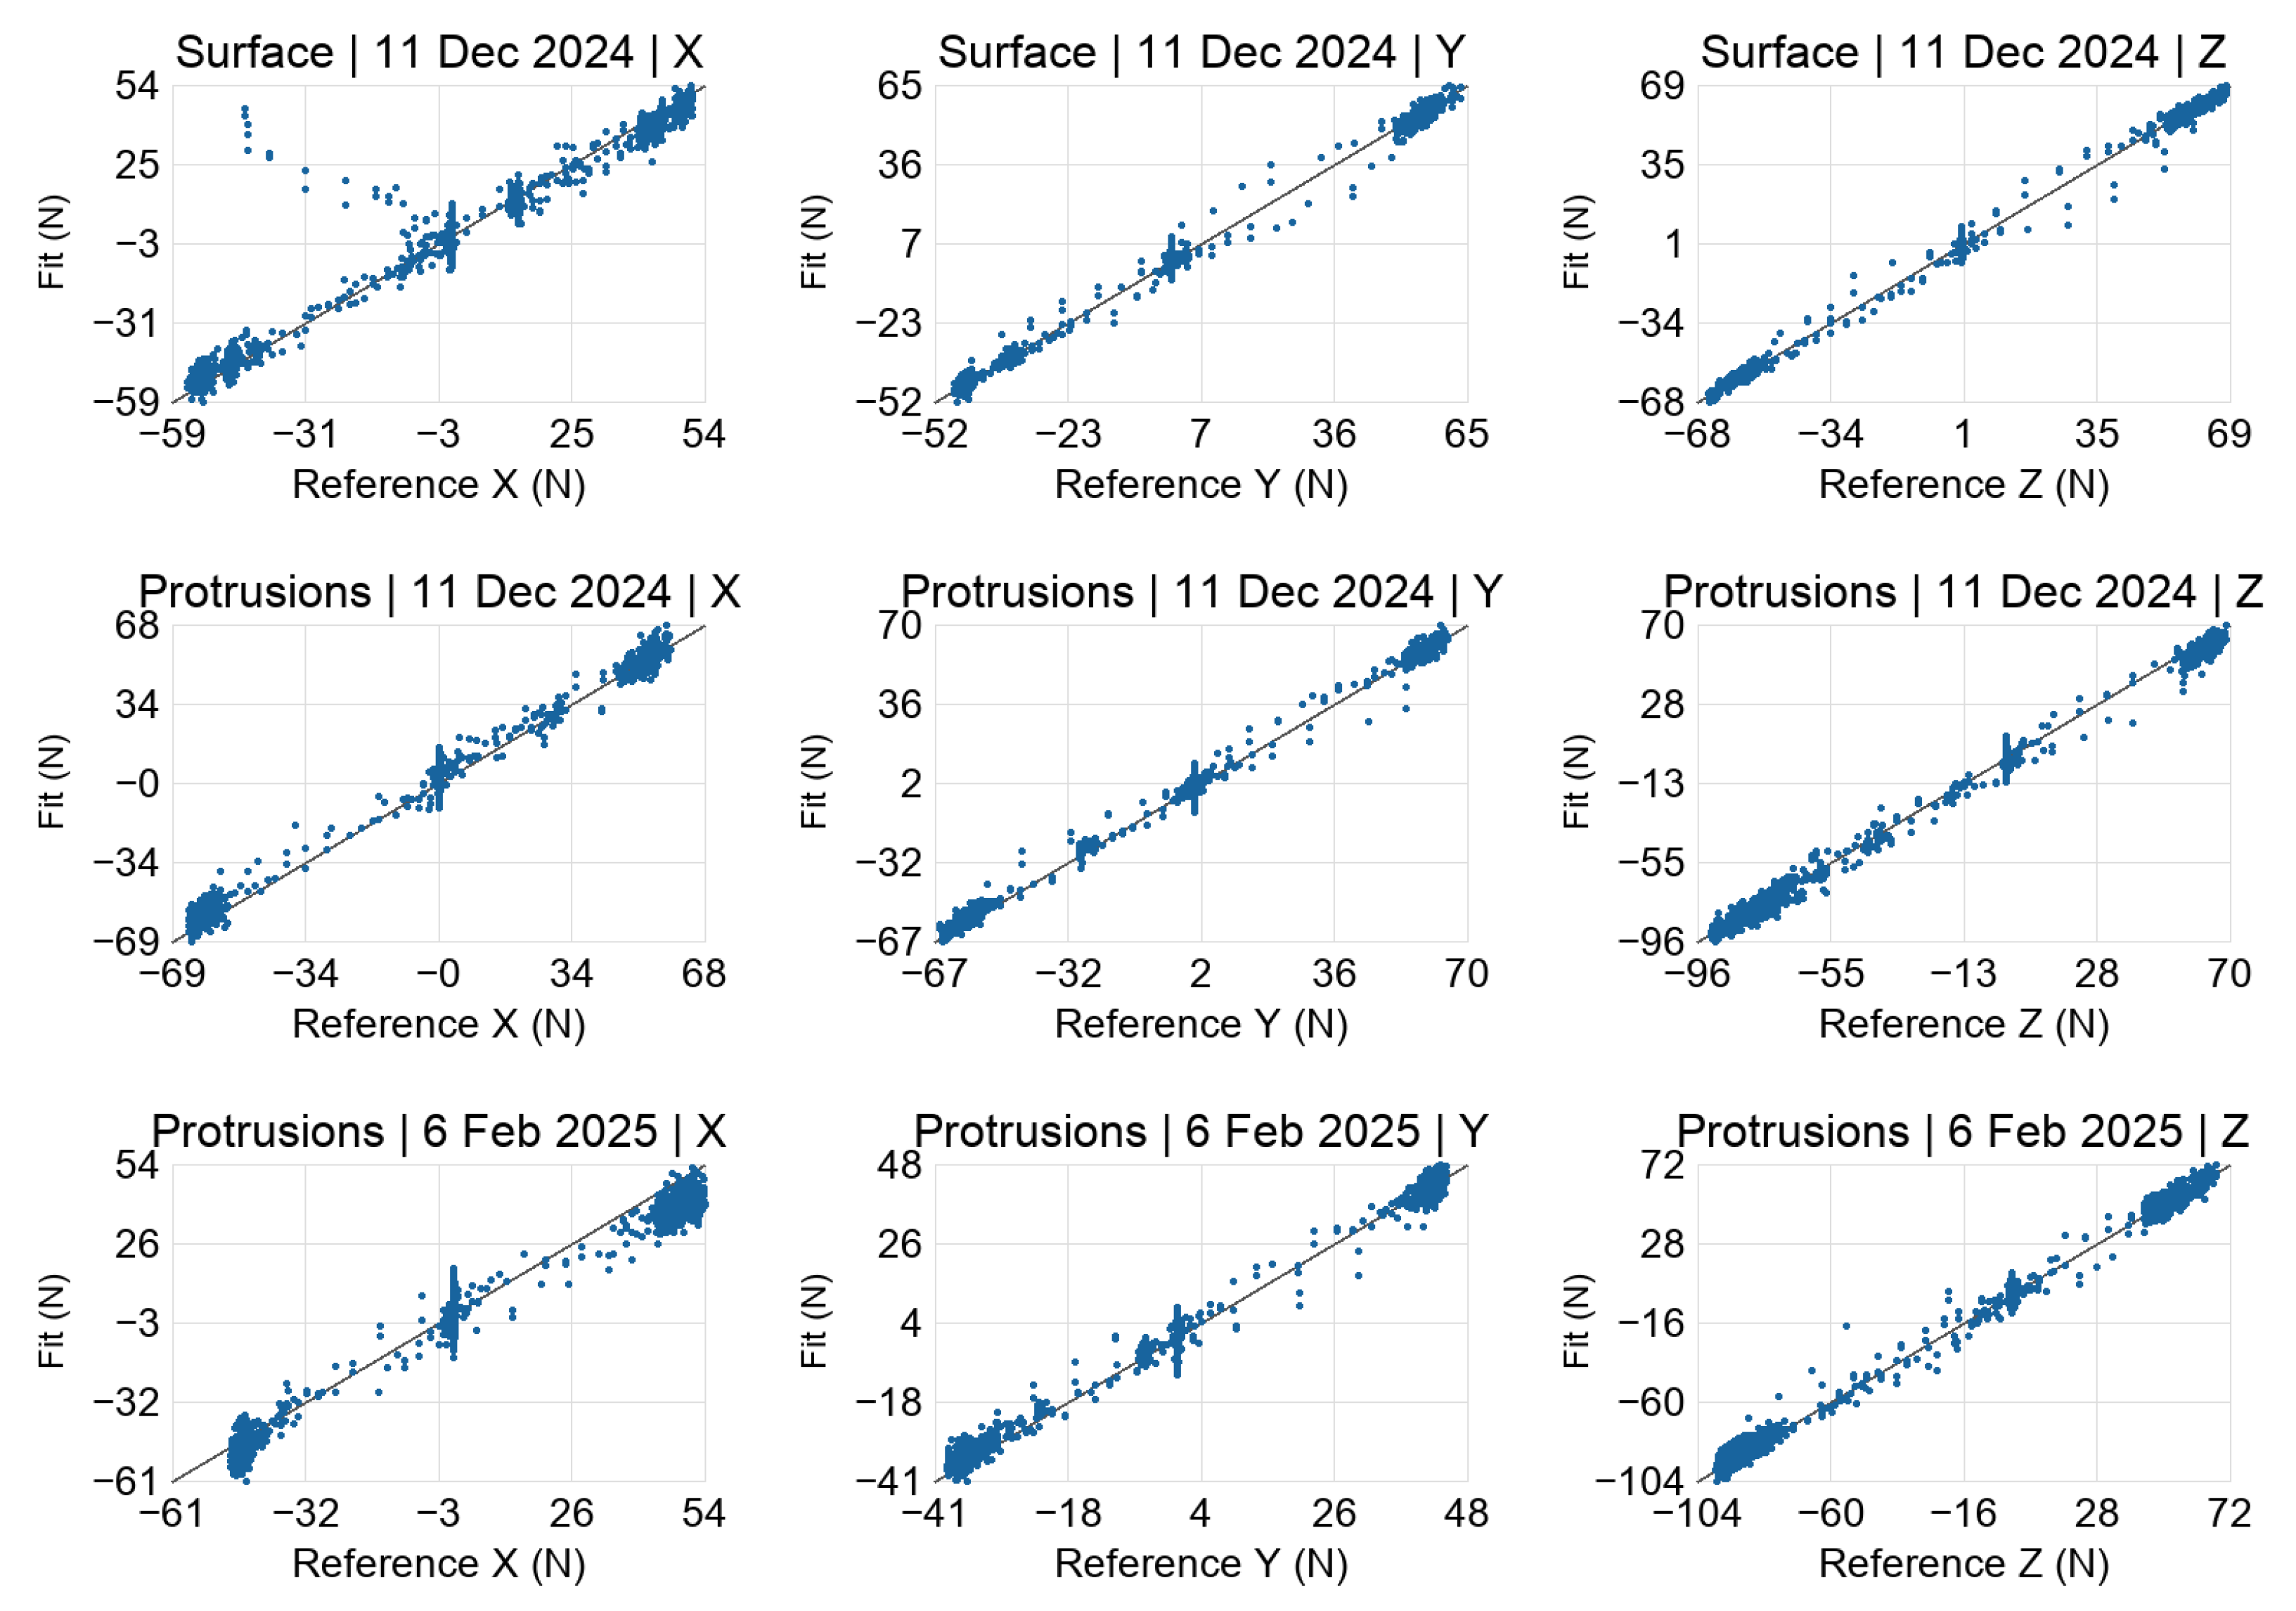
The archived static records show how the matrices fit the calibration data (Figure A5). Measurement uncertainty under the dynamic loading conditions of the participant experiments remains undetermined. All 392 recordings were screened for fixed values in the channels used for force conversion. One defective PVC trial was excluded, leaving 391 trials. One grooved-MDF trial had been assigned to the protrusion channels and was converted using the surface sensor pair and M1/2.
Appendix A.3.2. Processing and Statistical Implementation
Signals were linearly interpolated from their recorded timestamps onto a uniform 21-Hz grid. All filter specifications, including the unfiltered setting, used the same grid and full-record peak extraction. The fifth-order Butterworth filter was applied forward and backward, using odd-reflection padding of 18 samples and steady-state initialization.
The paired Wilcoxon tests used a two-sided, tie-corrected normal approximation without continuity correction. Zero paired differences were removed and average ranks assigned to ties. Rank-biserial correlation was the difference between positive and negative signed-rank sums divided by their total. Holm adjustment covered three contrasts separately per block and force component. In the surface block, each modified condition was paired with Normal. In the protrusion block, the exploratory contrasts were 5 minus 3, 7 minus 5, and 7 minus 3 mm. Table A12 separately reports exploratory contrasts between the surface-block Normal condition and the protrusion conditions for reference.
Mean-difference 95% percentile-bootstrap intervals used 20,000 participant-paired resamples (seed 20261021). The PVC median-difference interval used seed 20261022. Surface-block rank-biserial intervals used 20,000 paired resamples with seed 20261103 plus the axis and condition offset. Height rank-biserial estimates are presented without confidence intervals. Individual mean-difference intervals and adjusted signed-rank p-values address different inferential quantities.
One participant exhibited notably high horizontal pulling peaks across all three protrusion conditions in Case A (25.87, 26.99, and 39.00%BW at 3, 5, and 7 mm, respectively). Experimental notes indicated that the participant did not complete the prescribed STS movement during the retained recordings. Given the experimental note indicating task noncompletion and the notably high force peaks, we assessed the influence of this participant by repeating the within-block height comparisons without their three protrusion recordings. All 56 participants remained in the primary analysis. This 55-participant sample differs from the complete-case sample defined by the unusable PVC trial. At 1 Hz, the Case A mean horizontal 7-minus-3 mm difference decreased by approximately 18%, but its direction and Holm-adjusted significance were maintained in both cases (Table A13). Neither adjacent horizontal contrast nor any vertical height contrast was significant after Holm adjustment.
Table A10.
Trial-exclusion and complete-case sensitivity at 1 Hz.
Table A11.
Rank-biserial effect sizes for the within-block contrasts at 1 Hz.
Table A12.
Exploratory cross-block contrasts between the Normal and edge-protrusion conditions (reference only).
Table A13.
Sensitivity of the horizontal 7-minus-3 mm contrast to omission of one participant with possible task noncompletion (1 Hz).
Figure A4.
Schematic side view of the force-sensing assembly. The wooden hand-contact member was connected to two three-axis load cells through bolted connections. Each load cell was mounted to a support plate attached to the table structure. A clearance gap separated the instrumented wooden member from the surrounding non-instrumented tabletop. The schematic illustrates one of the two symmetrically arranged load cells and the intended mechanical load-transfer path. The drawing is not to scale. Protrusion inserts and surface-panel mounting grooves are omitted; these configurations are described in Figure 1 and Figure 2.
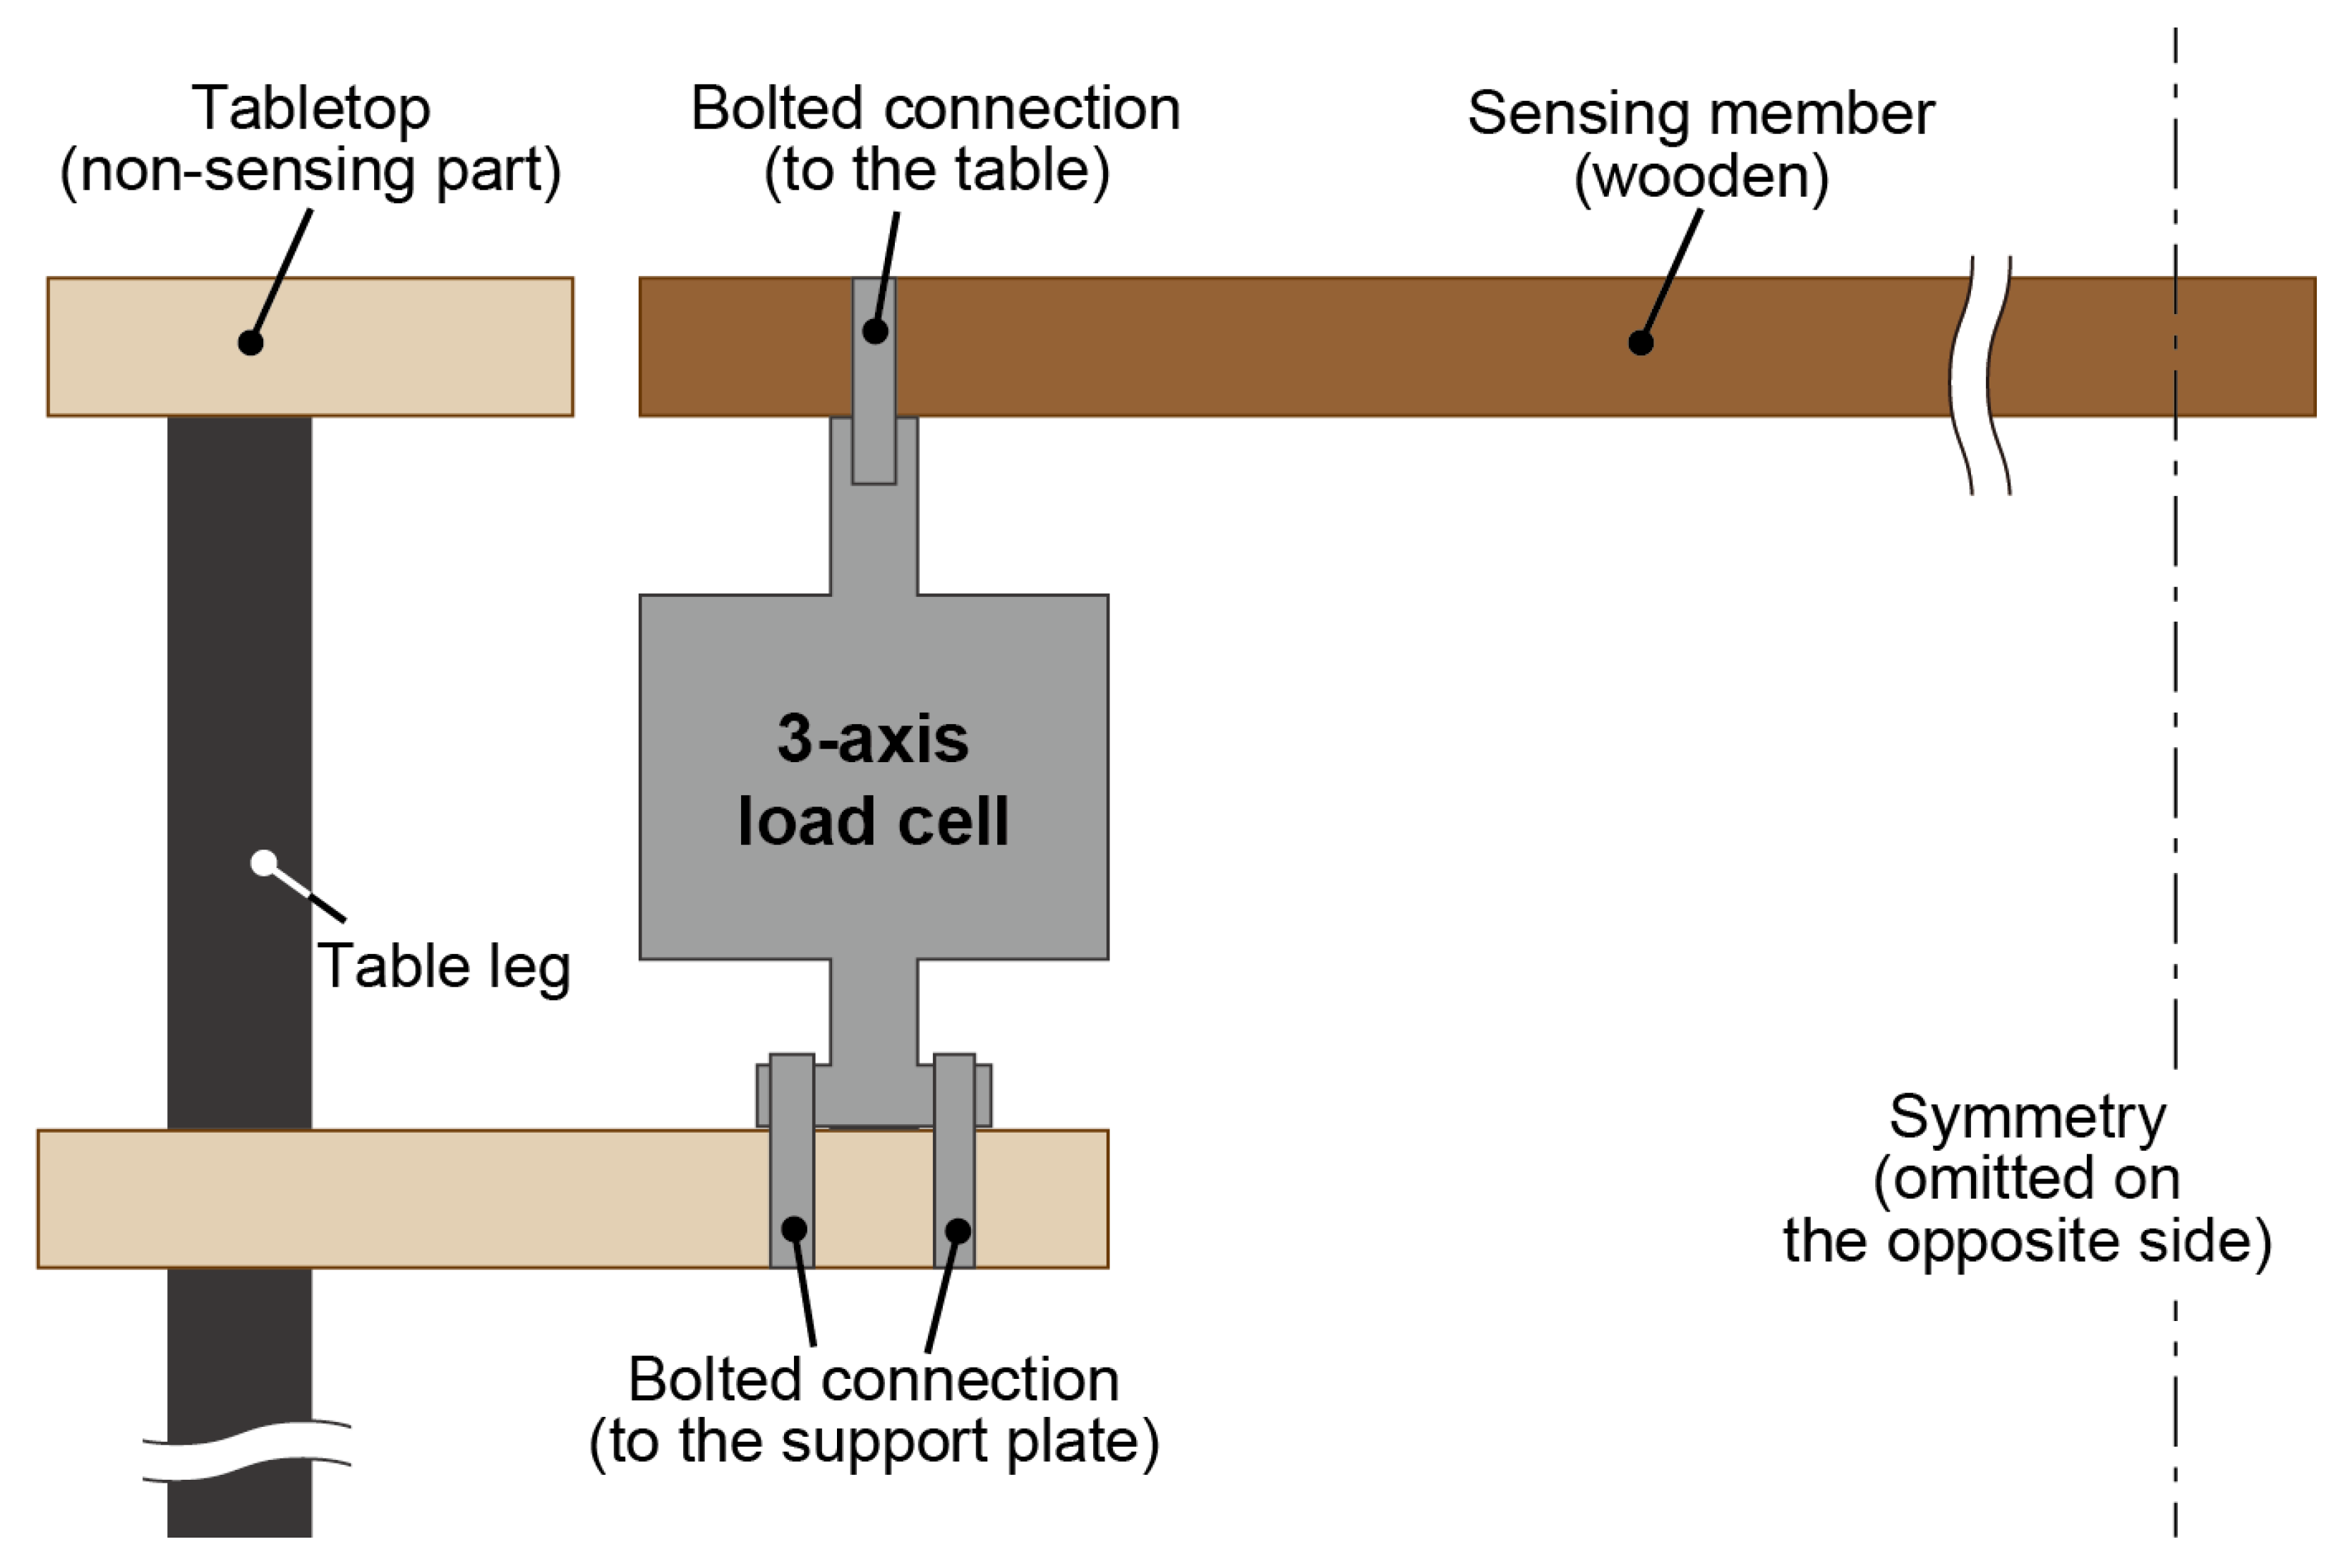
Figure A5.
In-record static calibration fits for the surface matrix (M1/2, December), primary protrusion matrix (Case A, December), and alternative protrusion matrix (Case B, February). Each point compares an estimated component with the mean of the two logged reference values for the pair. The diagonal denotes equality. These records contributed to matrix estimation and, therefore, characterize fit to the calibration data.
References
- Miyazaki, Y.; Hirano, K.; Kitamura, K.; Nishida, Y. Analysis of Relationship between Natural Standing Behavior of Elderly People and a Class of Standing Aids in a Living Space. Sensors 2022, 22, 1178. [Google Scholar] [CrossRef] [Scilit] [PubMed]
- Nomura, A.; Nishida, Y. Portable Technology to Measure and Visualize Body-Supporting Force Vector Fields in Everyday Environments. Sensors 2025, 25, 3961. [Google Scholar] [CrossRef] [Scilit] [PubMed]
- Shishov, N.; Komisar, V.; Marigold, D.S.; Blouin, J.S.; Robinovitch, S.N. Interactions during Falls with Environmental Objects: Evidence from Real-Life Falls in Long-Term Care Captured on Video. BMC Geriatr. 2024, 24, 726. [Google Scholar] [CrossRef] [Scilit] [PubMed]
- Sheth, S.; Cogle, C.R. Home Modifications for Older Adults: A Systematic Review. J. Appl. Gerontol. 2023, 42, 1151–1164. [Google Scholar] [CrossRef] [Scilit] [PubMed]
- Kato, Y.; Muramatsu, K.; Yamamoto, Y.; Suzuki, Y.; Momosaki, R. Strategies for Effective Home Modification in Older Adults. Geriatr. Orthop. Surg. Rehabil. 2021, 12, 21514593211020704. [Google Scholar] [CrossRef] [Scilit] [PubMed]
- Lektip, C.; Chaovalit, S.; Wattanapisit, A.; Lapmanee, S.; Nawarat, J.; Yaemrattanakul, W. Home Hazard Modification Programs for Reducing Falls in Older Adults: A Systematic Review and Meta-Analysis. PeerJ 2023, 11, e15699. [Google Scholar] [CrossRef] [Scilit] [PubMed]
- Adams, M.J.; Johnson, S.A.; Lefèvre, P.; Lévesque, V.; Hayward, V.; André, T.; Thonnard, J.L. Finger pad friction and its role in grip and touch. J. R. Soc. Interface 2013, 10, 20120467. [Google Scholar] [CrossRef] [Scilit] [PubMed]
- Janko, M.; Wiertlewski, M.; Visell, Y. Contact Geometry and Mechanics Predict Friction Forces during Tactile Surface Exploration. Sci. Rep. 2018, 8, 4868. [Google Scholar] [CrossRef] [Scilit] [PubMed]
- Goodwin, A.W.; Jenmalm, P.; Johansson, R.S. Control of Grip Force When Tilting Objects: Effect of Curvature of Grasped Surfaces and Applied Tangential Torque. J. Neurosci. 1998, 18, 10724–10734. [Google Scholar] [CrossRef] [Scilit] [PubMed]
- Dusenberry, D.O.; Simpson, H.; DelloRusso, S.J. Effect of handrail shape on graspability. Appl. Ergon. 2009, 40, 657–669. [Google Scholar] [CrossRef] [Scilit] [PubMed]
- Keenan, K.G.; Massey, W.V. Control of Fingertip Forces in Young and Older Adults Pressing against Fixed Low- and High-Friction Surfaces. PLoS ONE 2012, 7, e48193. [Google Scholar] [CrossRef] [Scilit] [PubMed]
- Norman, J.F.; Kappers, A.M.L.; Beers, A.M.; Scott, A.K.; Norman, H.F.; Koenderink, J.J. Aging and the Haptic Perception of 3D Surface Shape. Atten. Percept. Psychophys. 2011, 73, 908–918. [Google Scholar] [CrossRef] [Scilit] [PubMed]
- Schneider, T.R.; Hermsdörfer, J. Intention to Be Force Efficient Improves High-Level Anticipatory Coordination of Finger Positions and Forces in Young and Elderly Adults. J. Neurophysiol. 2021, 125, 1663–1680. [Google Scholar] [CrossRef] [Scilit] [PubMed]
- Hakamata, T.; Muroi, D.; Kodama, K.; Kondo, Y.; Higuchi, T. Haptic Feedback Intervention Decreases the Spatial Margin When Older Adults Walk through a Narrow Space. J. Physiol. Anthropol. 2022, 41, 41. [Google Scholar] [CrossRef] [Scilit] [PubMed]
- Bagheri, A.; Alexander, K. Optimum Handle Location for the Hand-Assisted Sit-to-Stand Transition: A Tool. Biomechanics 2023, 3, 267–277. [Google Scholar] [CrossRef] [Scilit]
- Turner, H.; Yate, R.; Giddins, G.; Miles, A. A method for measuring vertical forces applied to the upper limb during sit-to-stand. Proc. Inst. Mech. Eng. 2004, 218, 461–465. [Google Scholar] [CrossRef] [Scilit] [PubMed]
- Takeda, K.; Katsuhira, J.; Takano, A. Effects of handrail use during sit-to-stand in the third trimester. Int. J. Ind. Ergon. 2009, 39, 988–994. [Google Scholar] [CrossRef] [Scilit]
- O’Meara, D.; Smith, R. Differences between grab rail position and orientation during the assisted Sit-To-Stand for able-bodied older adults. J. Appl. Biomech. 2005, 21, 57–71. [Google Scholar] [CrossRef] [Scilit]
- Kinoshita, S.; Kiyama, R.; Yoshimoto, Y. Effect of Handrail Height on Sit-To-Stand Movement. PLoS ONE 2015, 10, e0133747. [Google Scholar] [CrossRef] [Scilit] [PubMed]
- Kato, T.; Sekiguchi, Y.; Honda, K.; Izumi, S.; Kanetaka, H. Comparison of handrail reaction forces between two different handrails during sit-to-stand movement in the elderly. Clin. Biomech. 2020, 80, 105130. [Google Scholar] [CrossRef] [Scilit] [PubMed]
- Chen, L.K.; Woo, J.; Assantachai, P.; Auyeung, T.W.; Chou, M.Y.; Iijima, K.; Jang, H.C.; Kang, L.; Kim, M.; Kim, S.; et al. Asian Working Group for Sarcopenia: 2019 Consensus Update on Sarcopenia Diagnosis and Treatment. J. Am. Med. Dir. Assoc. 2020, 21, 300–307.e2. [Google Scholar] [CrossRef] [Scilit] [PubMed]
- Satake, S.; Arai, H. The revised Japanese version of the Cardiovascular Health Study criteria (revised J-CHS criteria). Geriatr. Gerontol. Int. 2020, 20, 992–993. [Google Scholar] [CrossRef] [Scilit] [PubMed]
- Oliveira, N.; Carvalho, F.; Laíns, J.; Rasteiro, D.; Roseiro, L. Development of a Biomechanical Device for Parameter Quantification Associated with the Sit-to-Stand Movement. Sensors 2023, 23, 1837. [Google Scholar] [CrossRef] [Scilit] [PubMed]
- Gibson, J.J. The Ecological Approach to Visual Perception; Houghton Mifflin: Boston, MA, USA, 1979. [Google Scholar]
- Lederman, S.J.; Klatzky, R.L. Hand movements: A window into haptic object recognition. Cogn. Psychol. 1987, 19, 342–368. [Google Scholar] [CrossRef] [Scilit] [PubMed]
- Kaneda, Y.; Kuzuyama, M.; Kobayasi, T.; Furuya, M.; Yosida, D.; Myongi, S.; Katsuhira, J. Analysis of Joint Moment during Sit-to-Stand with Handrail. Rigakuryoho Kagaku 2006, 21, 227–232. [Google Scholar] [CrossRef] [Scilit]
- Nishihara, K.; Kawai, H.; Kera, T.; Hirano, H.; Fujiwara, Y.; Ihara, K.; Kim, H.; Obuchi, S. Comparisons of muscle thicknesses, echo intensities, and motor functions between community-dwelling older Japanese adults with and without diabetes. Arch. Gerontol. Geriatr. 2021, 97, 104516. [Google Scholar] [CrossRef] [Scilit] [PubMed]
- Tinetti, M.E.; Richman, D.; Powell, L. Falls efficacy as a measure of fear of falling. J. Gerontol. 1990, 45, P239–P243. [Google Scholar] [CrossRef] [Scilit] [PubMed]
- Ministry of Health, Labour and Welfare. Manual for Improvement of Musculoskeletal Function (Revised Edition): Fall Concern Scale, 2009. pp. 32+73–74 (printed pagination). Available online: https://www.mhlw.go.jp/topics/2009/05/dl/tp0501-1d.pdf (accessed on 5 November 2026). (In Japanese)
- Toba, K.; Okochi, J.; Takahashi, T.; Matsubayashi, K.; Nishinaga, M.; Yamada, S.; Takahashi, R.; Nishijima, R.; Kobayashi, Y.; Machida, A.; et al. Development of a portable fall risk index for elderly people living in the community. Jpn. J. Geriatr. 2005, 42, 346–352. (In Japanese) [Google Scholar] [CrossRef] [Scilit] [PubMed]

Disclaimer/Publisher’s Note: The statements, opinions and data contained in all publications are solely those of the individual author(s) and contributor(s) and not of MDPI and/or the editor(s). MDPI and/or the editor(s) disclaim responsibility for any injury to people or property resulting from any ideas, methods, instructions or products referred to in the content. |
© 2026 by the authors. Licensee MDPI, Basel, Switzerland. This article is an open access article distributed under the terms and conditions of the Creative Commons Attribution (CC BY) license.