


Abstract
Background: Electroencephalography (EEG) is increasingly used to investigate consumer preferences; however, most predictive studies rely on local spectral or temporal features, and the predictive and statistical relevance of functional connectivity remains underexplored. This study evaluated the statistical significance, predictive performance, and feature-selection stability of EEG functional connectivity measures associated with consumer preference. Methods: Phase Locking Value (PLV) and Normalized Mutual Information (NMI) were computed for the delta, theta, alpha, beta, and gamma frequency bands using product-related EEG recordings from the NeuMa dataset. Subject-level paired statistical analyses were performed with false discovery rate correction. PLV, NMI, and early feature-level PLV+NMI fusion were evaluated using LASSO-based feature selection and five machine-learning classifiers under stratified 10-fold and subject-independent leave-one-subject-out (LOSO) validation. Feature-selection stability was assessed under both validation strategies. Results: Preferred-product viewing was associated with widespread reductions in functional connectivity for both PLV and NMI, with NMI showing particularly extensive differences in the delta band. PLV and NMI yielded broadly comparable predictive performance, with the highest balanced accuracy of 0.699 achieved by PLV combined with Naive Bayes under both stratified 10-fold and LOSO validation. Early PLV+NMI fusion did not improve predictive performance. In contrast, NMI-derived features dominated the fused stability ranking, accounting for 18 of the 20 highest-ranked stable features, predominantly in the delta band. Conclusions: EEG functional connectivity provides complementary information about consumer preference at the statistical, predictive, and feature-stability levels. PLV combined with Naive Bayes provided the highest balanced accuracy, whereas NMI exhibited greater statistical sensitivity and feature-selection stability. These findings highlight low-frequency, particularly delta-band, connectivity as a relevant target for further investigation and demonstrate the importance of evaluating EEG representations beyond classification performance alone.
1. Introduction
Understanding the neurophysiological patterns associated with consumer preferences and purchase decisions is an important objective in neuromarketing research. Beyond predicting consumer choices, identifying how interactions among distributed brain signals differ between preferred and non-preferred products may provide additional insight into the neural correlates of product evaluation. EEG functional connectivity offers a network-level perspective for investigating these relationships, complementing conventional approaches that focus on local neural activity. Consumer decision-making is generally considered a multistage process involving need recognition, information search, evaluation of alternatives, purchase decisions, and post-purchase behavior [1].
Traditional marketing research methods have long been used to explain and predict consumer responses to products and advertising campaigns. However, these approaches frequently rely on self-report methods such as questionnaires, face-to-face interviews and focus groups, which may not fully capture the cognitive and emotional processes underlying consumer decisions. Such methods assume that individuals can accurately report their internal cognitive processes, although a substantial proportion of decision-making may occur outside conscious awareness. Moreover, social desirability, time pressure and peer influence can systematically bias reported preferences. These limitations have motivated growing interest in more objective approaches capable of capturing the neurophysiological mechanisms involved in consumer behavior [2,3].
Neuromarketing has emerged within this context as an interdisciplinary field integrating neuroscience, marketing and psychology to investigate both conscious and non-conscious processes underlying consumer responses [4]. Since the term was introduced by Smidts in 2002 [5], neuromarketing has increasingly been applied to areas such as advertising, product design, branding, pricing and promotional strategy [6]. By complementing conventional market-research methods with physiological and neurobiological measurements, neuromarketing offers the potential to provide more objective insights into cognitive and affective responses to marketing stimuli [4,6,7].
Among the neurophysiological techniques used in neuromarketing, electroencephalography (EEG) has become particularly prominent because of its high temporal resolution, relatively low cost, portability, and suitability for real-time monitoring [3]. EEG enables neural responses to marketing stimuli to be captured at the millisecond scale and can therefore provide information about rapidly changing cognitive and emotional processes associated with attention, perception, evaluation and decision-making [3]. EEG has also been applied in more ecologically relevant consumer settings, including virtual shopping environments, to investigate neural activity and functional connectivity during purchasing decisions [8].
EEG-based neuromarketing studies commonly employ preprocessing and feature-extraction procedures to transform raw neural signals into informative representations of consumer responses. Filtering, artifact removal, segmentation and normalization are frequently applied before feature extraction to improve signal quality and analytical reliability [9]. Subsequently, EEG-derived features, including spectral, time-domain, asymmetry, entropy and event-related measures, have been combined with machine-learning and deep-learning classifiers to identify consumer preferences and purchase-related responses [3,9,10,11].
Although these conventional EEG representations have yielded promising classification results, most characterize local activity at individual electrodes or restricted channel groups. Consequently, they may not adequately represent the coordinated interactions among distributed brain regions that support complex cognitive functions. Consumer decisions involve attention, memory, affective evaluation, and valuation processes that are unlikely to depend on isolated neural regions alone; rather, they emerge from interactions within distributed functional networks [1,12]. Functional connectivity analysis therefore provides a complementary perspective by characterizing the temporal and statistical relationships between neural signals recorded from different brain regions [12,13].
Phase Locking Value (PLV) is a widely used functional connectivity measure that characterizes the consistency of phase differences between pairs of EEG signals within a specified frequency band [13,14]. Intuitively, when two EEG signals maintain a relatively stable phase relationship over time, their PLV approaches one, whereas highly variable phase differences result in values closer to zero. For example, two signals may exhibit consistently aligned oscillatory phases even when their amplitudes differ. Thus, PLV reflects the consistency of phase synchronization rather than the magnitude of neural activation.
In contrast, normalized mutual information (NMI) is an information-theoretic measure that quantifies statistical dependence between EEG signals [15,16]. Unlike PLV, which focuses on phase relationships, NMI evaluates how much information is shared between two signals based on their observed amplitude distributions. Higher NMI values indicate stronger statistical dependence, whereas lower values indicate weaker dependence under the adopted estimation procedure. Importantly, NMI can capture nonlinear statistical relationships that may not be adequately represented by conventional linear correlation.
Consequently, PLV and NMI provide complementary perspectives on EEG functional connectivity. PLV characterizes the temporal consistency of oscillatory phase relationships, whereas NMI describes broader statistical dependencies between signal amplitudes. In the context of consumer preference, differences in these measures between preferred and non-preferred products may indicate changes in inter channel EEG coordination or statistical dependence during product evaluation. However, higher connectivity values should not automatically be interpreted as more efficient cognitive processing, and neither PLV nor NMI alone establishes direct anatomical connectivity, directional information transfer, or causal interactions between brain regions [14,15,16].
Despite the extensive use of EEG in neuromarketing, functional connectivity has been investigated less frequently than conventional spectral, temporal, and channel-based EEG features for characterizing consumer responses [1,17]. For example, Khushaba et al. examined EEG responses during consumer choice and reported phase-synchronization patterns between frontal and occipital regions using PLV, together with mutual-information-based analyses of product attributes [17]. EEG functional connectivity has also been investigated during exposure to commercial advertisements, demonstrating that network-level interactions can provide information beyond local cortical activation alone [18]. More recently, the NeuMa dataset has provided a multimodal framework for investigating consumer behavior by combining EEG, eye-tracking, mouse-interaction, questionnaire and product-choice information from 42 participants during a supermarket brochure-browsing task [19]. Subsequent studies using NeuMa have investigated consumer choice through EEG-based and multimodal machine-learning approaches [10,20,21]. In particular, İlhan and Dağdevir investigated PLV, coherence, and mutual information as connectivity-based features and applied Support Vector Machine (SVM), k-Nearest Neighbors (KNN), Random Forest (RF), and Artificial Neural Network (ANN) classifiers to distinguish preferred/non-preferred decisions [21]. Beyond consumer-choice classification, Kyrou et al. analyzed EEG functional connectivity in the NeuMa dataset to investigate associations between network organization and consumer personality traits [22]. Their analysis focused on connectivity patterns derived from EEG amplitude-envelope correlations and examined network states in relation to personality characteristics rather than supervised preferred/non-preferred prediction [22]. These studies demonstrate the relevance of EEG connectivity to consumer-related research but address different analytical objectives. In particular, previous connectivity-based classification studies [21] and network-level investigations of consumer characteristics [22] do not provide the same integrated assessment of preference-related statistical connectivity differences, subject-independent predictive performance, and feature-selection stability undertaken in the present study. Despite these advances, the statistical organization and predictive stability of frequency-specific EEG connectivity patterns associated with consumer preference remain insufficiently characterized. In particular, comparatively limited attention has been given to frameworks that jointly examine edge-wise statistical differences across canonical frequency bands, connectivity-based consumer-preference classification, and the stability of selected connectivity features across validation folds. In addition, the complementary predictive value of phase-based and information-theoretic connectivity measures requires further investigation [23].
To address these gaps, the present study investigates frequency-specific EEG functional connectivity associated with consumer preference using PLV and NMI across five canonical frequency bands. First, edge-wise statistical analyses are performed to identify connectivity differences between preferred and non-preferred consumer responses. Second, PLV, NMI, and their fused representation are evaluated as feature spaces for machine-learning-based consumer-preference classification under both stratified 10-fold cross-validation and leave-one-subject-out (LOSO) validation. Third, the stability of connectivity features selected across validation folds is examined to identify recurrent network signatures associated with consumer preference.
Accordingly, the main contributions of this study are: (i) comparative evaluation of phase-based PLV and information-theoretic NMI representations across five EEG frequency bands; (ii) subject-level statistical characterization of preference-related connectivity differences; (iii) evaluation of individual and early-fused connectivity representations using LASSO-based feature selection and machine-learning classification under stratified 10-fold and subject-independent LOSO validation; and (iv) identification of consistently selected connectivity features through stability analysis across validation folds.
Unlike approaches focusing primarily on connectivity-based classification, the present study integrates statistical sensitivity, predictive performance, and feature-selection stability within a unified analytical framework. Its methodological contribution does not lie in introducing a new connectivity estimator or classification algorithm, but in systematically examining whether connectivity representations showing widespread statistical differences or greater feature-selection stability also provide stronger predictive performance. This integrated evaluation offers a more comprehensive characterization of preference-related EEG connectivity patterns while allowing the relative advantages and limitations of PLV, NMI, and their early fusion to be assessed.
2. Materials and Methods
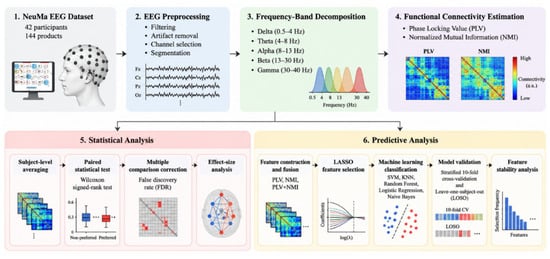
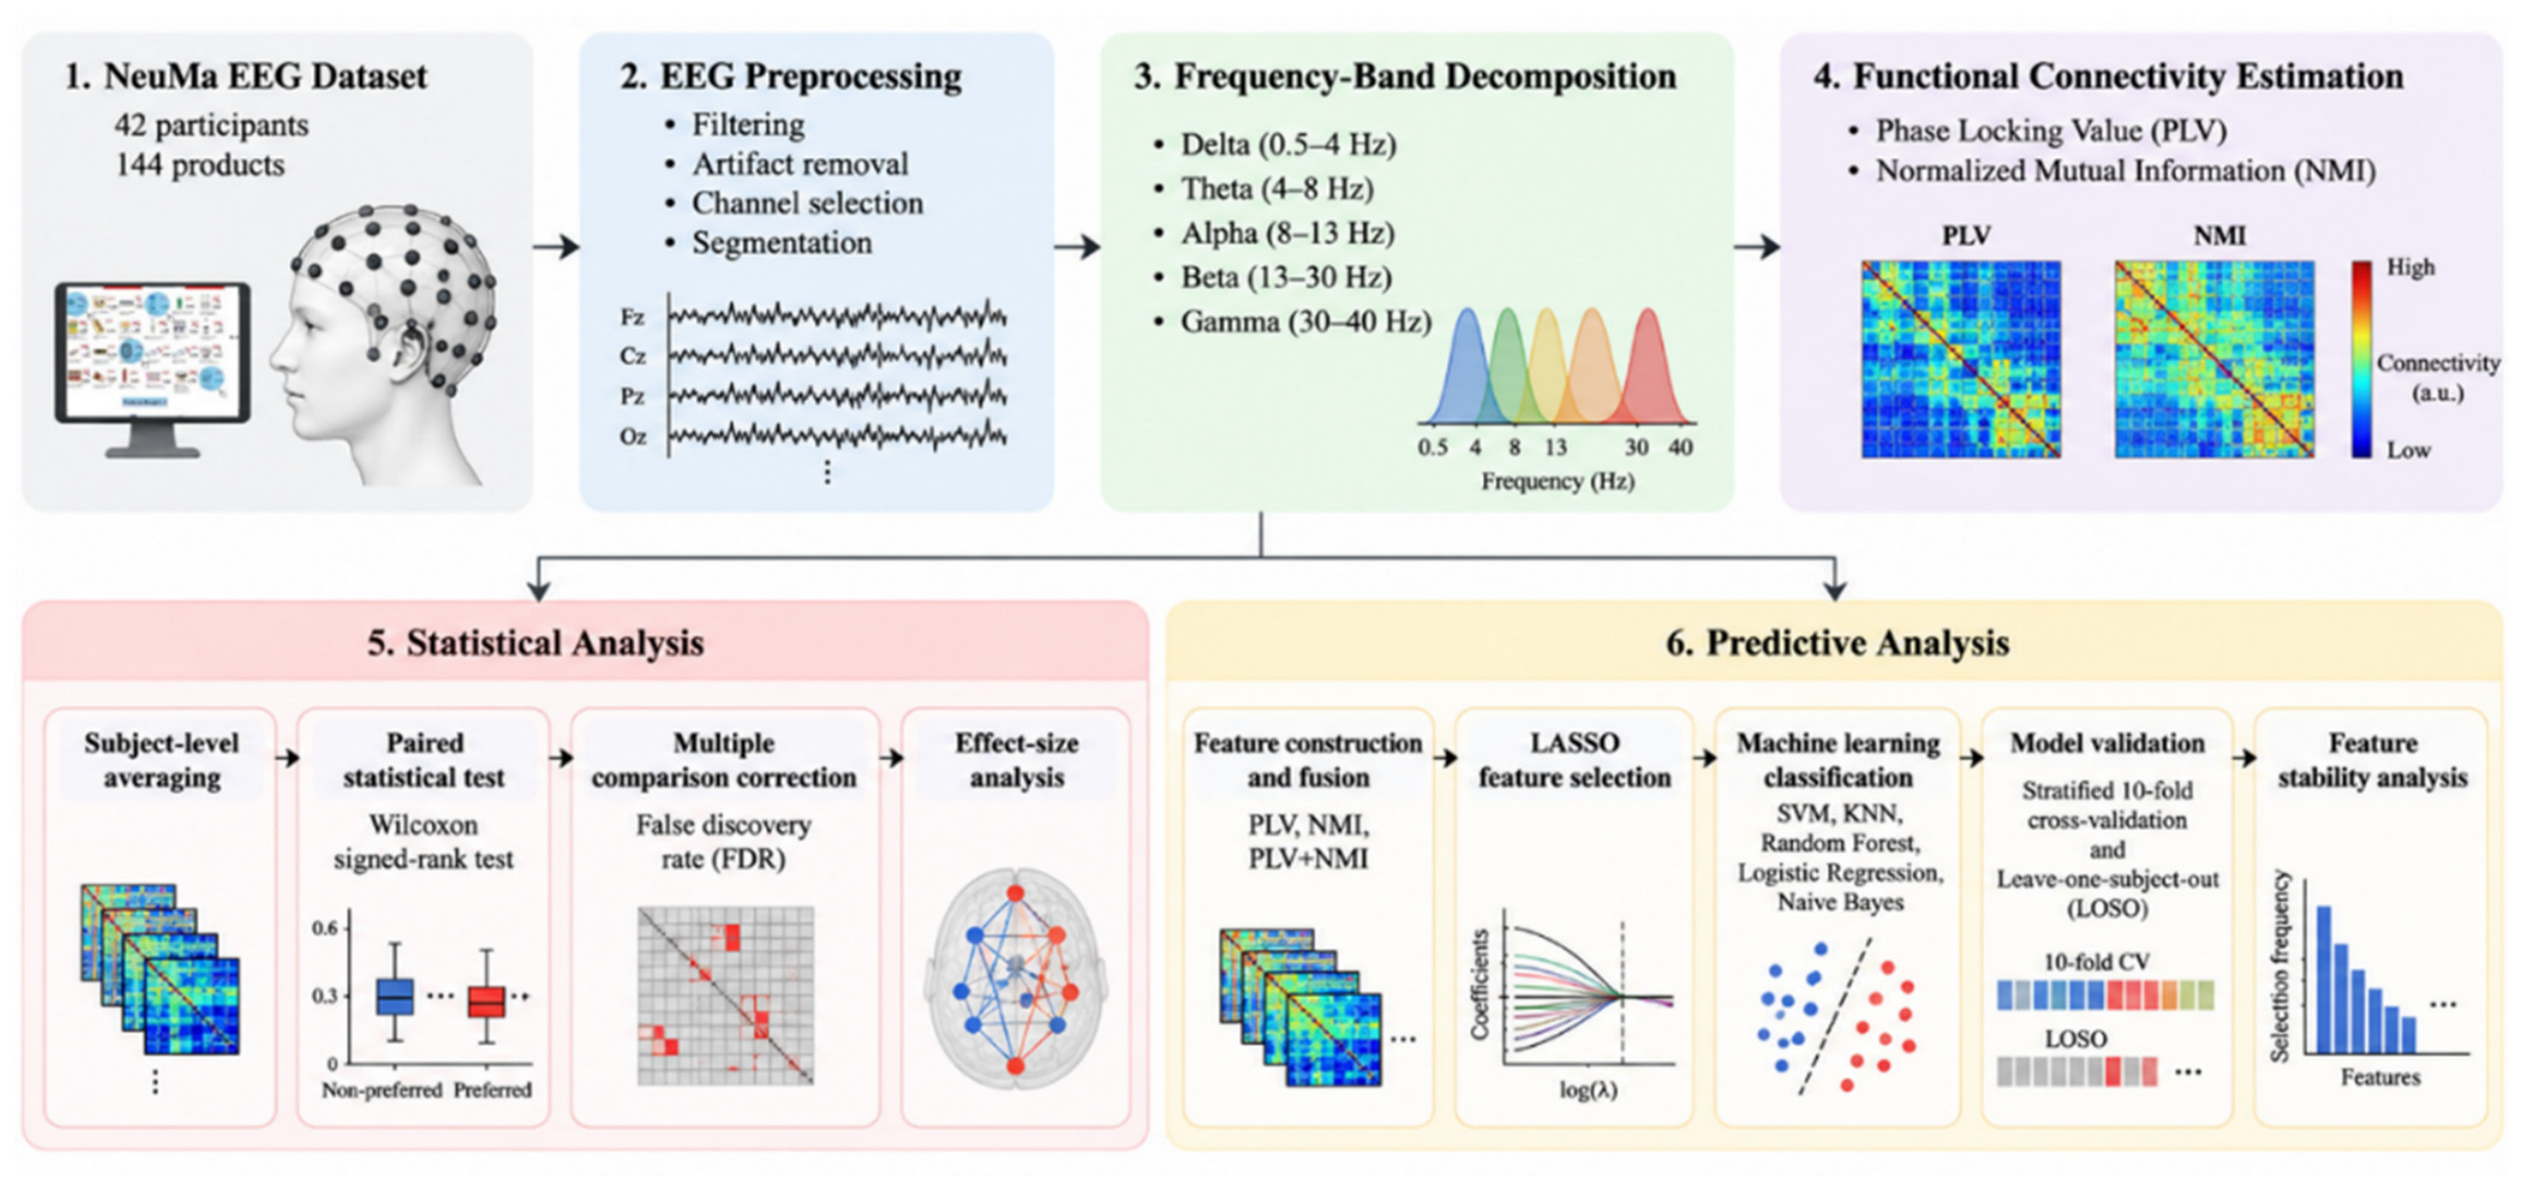
The overall methodology adopted in this study is summarized in Figure 1. Following EEG preprocessing, functional connectivity matrices were generated using PLV and NMI. The proposed framework consisted of two complementary components: (i) subject-level statistical analysis to identify significant functional connectivity differences associated with consumer preference and (ii) a machine-learning framework comprising connectivity feature construction, feature fusion, LASSO-based feature selection, classification, and feature-stability analysis. The details of each stage are described in the following subsections.
Figure 1.
Overall workflow of the proposed functional connectivity framework.
2.1. Dataset
This study employed the publicly available NeuMa dataset to investigate consumer preference prediction using electroencephalography (EEG) signals. The dataset comprises recordings from 42 participants (23 males and 19 females) during a simulated supermarket shopping experiment. A total of 144 supermarket products were presented across six digital brochure pages, with 24 products displayed on each page. Participants were instructed to freely browse the brochure pages and select the products they intended to purchase by clicking on them with a computer mouse [19]. The general characteristics of the NeuMa dataset are summarized in Table 1.
Table 1.
General characteristics of the NeuMa dataset.
During the experiment, participants were seated approximately 50 cm from a 28-inch LCD monitor and freely browsed the digital supermarket brochures. Navigation between brochure pages was performed using the left and right arrow keys, while products intended for purchase were selected using mouse clicks. EEG recordings, eye-tracking (ET) data, mouse-click events, cursor positions, and experimental markers were synchronously acquired throughout the experiment [19]. EEG signals were recorded using the Wearable Sensing DSI-24 system with 21 dry electrodes positioned according to the international 10–20 system at a sampling frequency of 300 Hz. The A1 and A2 electrodes were positioned over the mastoids and used to form the recording reference while electrode impedances were maintained below 10 kΩ before data acquisition [19].
The present analysis used the preprocessed EEG signals provided with the NeuMa dataset. As described by Georgiadis et al., the original EEG recordings were band-pass filtered between 0.5 and 45 Hz using a third-order zero-phase Butterworth filter, followed by artifact removal using Artifact Subspace Reconstruction (ASR) and FORCe [19]. Only EEG recordings were considered in the present study. Since A1 and A2 served as reference electrodes, they were excluded from the functional connectivity analysis, resulting in 19 EEG channels. Product-level observations with missing EEG recordings or unavailable product-related EEG intervals were excluded. In addition, only EEG intervals with a duration of at least 0.50 s were retained for functional connectivity estimation. Products for which no valid EEG interval remained after application of this criterion were excluded from subsequent analyses. After quality-control procedures, the final dataset comprised 3252 product-level observations from 42 participants. Of these, 2553 observations (78.5%) belonged to the non-preferred class (Label 0), whereas 699 observations (21.5%) belonged to the preferred class (Label 1).
2.2. EEG Preprocessing
The preprocessed EEG signals provided with the NeuMa dataset were used as the input to the present connectivity-analysis pipeline. Before functional connectivity estimation, each EEG channel was detrended and decomposed into five frequency bands using third-order Butterworth band-pass filters: delta (0.5–4 Hz), theta (4–8 Hz), alpha (8–13 Hz), beta (13–30 Hz), and gamma (30–45 Hz). Zero-phase forward–backward filtering was applied to avoid phase distortion.
Frequency-band filtering was performed on the continuous EEG signals before extraction of the product-related intervals. For PLV estimation, the analytic signal of each band-limited EEG channel was obtained using the Hilbert transform, from which the instantaneous phase was extracted. For NMI estimation, the corresponding band-limited signal amplitudes were used.
2.3. Functional Connectivity Analysis
Functional connectivity was calculated independently for the delta (0.5–4 Hz), theta (4–8 Hz), alpha (8–13 Hz), beta (13–30 Hz), and gamma (30–45 Hz) frequency bands using PLV and NMI. These metrics provide complementary information regarding phase synchronization and statistical dependency between EEG signals [14,15,16]. The analysis included 19 EEG channels: P3, C3, F3, Fz, F4, C4, P4, Cz, Pz, Fp1, Fp2, T3, T5, O1, O2, F7, F8, T6, and T4. For each valid product-related interval and frequency band, pairwise connectivity was calculated between all channel pairs, resulting in symmetric 19 × 19 PLV and NMI matrices. Connectivity estimation was initially performed at the interval level. For products represented by more than one valid EEG interval, the corresponding connectivity matrices were subsequently averaged across intervals to obtain one product-level PLV matrix and one product-level NMI matrix for each frequency band.
2.3.1. Phase Locking Value (PLV)
PLV was used to quantify the consistency of the instantaneous phase difference between pairs of EEG channels within each frequency band [14]. For each frequency band, the analytic signal of the continuous band-limited EEG signal was obtained using the Hilbert transform, and the instantaneous phase was extracted before segmentation into product-related intervals.
For two EEG channels i and j, the instantaneous phase difference at time sample t was defined as
where and denote the instantaneous phases of the corresponding EEG signals.
For each valid interval containing N temporal samples, PLV was calculated as
PLVs range from 0 to 1, with values approaching 0 indicating weak phase synchronization and values approaching 1 indicating strong phase locking. The resulting matrices were symmetrized and their diagonal elements were set to 1. When multiple valid intervals were available for a product, interval-level PLV matrices were averaged to obtain the final product-level PLV matrix. PLV was computed separately for each of the 171 unique channel pairs within each frequency band. The diagonal elements of the connectivity matrices were not included in subsequent statistical or machine-learning analyses.
2.3.2. Normalized Mutual Information (NMI)
Normalized Mutual Information (NMI) was used as an information-theoretic measure of statistical dependence between pairs of band-limited EEG signals. Unlike phase-based PLV, mutual information (MI) quantifies shared information between two signals and is not restricted to linear statistical relationships [15,16].
For two discrete random variables and MI is defined as
where denotes the joint probability distribution, and and denote the corresponding marginal probability distributions, respectively [16]. Prior to MI estimation, the band-limited amplitude values of each EEG signal were discretized into four approximately equiprobable bins using quantile-based thresholds. The discretization thresholds were determined separately for each signal within the analyzed interval. MI was subsequently normalized using the geometric mean of the marginal entropies:
where and denote the Shannon entropies of the discretized signals. The same logarithm base was used consistently for MI and entropy calculations. NMI values approaching 0 indicate weak statistical dependence between the two signals, whereas higher values indicate stronger statistical dependence. As with PLV, NMI was calculated separately for all 171 unique channel pairs in each of the five frequency bands, and self-connections represented by the matrix diagonal were excluded from subsequent analyses.
2.4. Subject-Level Statistical Analysis
To characterize the functional connectivity differences associated with consumer preference, subject-level statistical analyses were performed separately for the PLV and NMI connectivity matrices. Because each participant evaluated multiple products, statistical comparisons were performed at the subject level to avoid treating repeated observations from the same participant as independent.
For each participant, product-level functional connectivity matrices corresponding to Label 0 (non-preferred products) and Label 1 (preferred products) were averaged separately for each frequency band and connectivity metric. Only participants with observations in both preference conditions were included, thereby enabling paired comparisons between the two conditions. Consequently, each included participant contributed one representative connectivity matrix for Label 0 and one for Label 1 for each frequency band and connectivity metric.
Pairwise statistical analyses were performed independently for each unique connection in the upper triangular portion of the 19 × 19 connectivity matrices, resulting in 171 unique connections per frequency band. Differences between preferred and non-preferred conditions were evaluated using the two-sided Wilcoxon signed-rank test for paired observations. The Benjamini–Hochberg false discovery rate (FDR) correction was applied to the 171 tested connections separately for each frequency band and connectivity metric. Statistical significance was defined as an FDR-adjusted q-value below 0.05 [24]. In addition to statistical significance, the magnitude and direction of the paired differences were quantified using the matched-pairs rank-biserial correlation [25]. Paired differences were defined as Label 1 − Label 0; therefore, positive rank-biserial values indicated a tendency toward stronger connectivity for preferred products (Label 1), whereas negative values indicated a tendency toward stronger connectivity for non-preferred products (Label 0).
For visualization, subject-level mean connectivity matrices were generated separately for Label 0 and Label 1, together with difference matrices calculated as Label 1 − Label 0. Connections that remained significant after FDR correction were additionally displayed using frequency-specific network graphs. The complete statistical analysis pipeline was applied independently to PLV and NMI across all five EEG frequency bands.
2.5. Connectivity Feature Construction and Fusion
For machine-learning analysis, the upper triangular elements of each symmetric connectivity matrix, excluding the main diagonal, were vectorized to obtain the unique pairwise connectivity features. With 19 EEG channels, each frequency band yielded 171 unique channel-pair features. Since five frequency bands were analyzed, the PLV and NMI representations each comprised 855 connectivity features (171 connections × 5 frequency bands) for each product-level observation. In addition to the individual PLV and NMI feature representations, early feature-level fusion was performed by concatenating the complete PLV and NMI feature vectors. The resulting fused representation contained 1710 candidate connectivity features (855 PLV + 855 NMI) per product-level observation. Accordingly, three connectivity feature representations were evaluated: PLV (855 features), NMI (855 features), and PLV+NMI (1710 features).
2.6. Linear LASSO Feature Selection
Consumer preference prediction was formulated as a binary classification problem in which Label 0 represented non-preferred products and Label 1 represented preferred products. Separate classification pipelines were evaluated for the PLV, NMI, and fused PLV+NMI feature representations. Before model training, observations containing invalid labels or unavailable connectivity features were excluded. Features containing non-finite values or showing no variability across the available observations were removed before cross-validation without using class-label information. Within each cross-validation split, feature standardization was performed using only the corresponding training data. For each feature, the training-set mean and standard deviation were used to obtain z-score-normalized values, and the same parameters were subsequently applied to the held-out test data.
Feature selection was performed using the LASSO, which applies a penalty to promote sparse model coefficients [26]. LASSO feature selection was implemented using MATLAB’s lasso function, which fits an L1-regularized linear regression model. To prevent information leakage, LASSO feature selection was performed exclusively within the training portion of each outer validation fold. The held-out test observations were not used during feature selection, standardization, or hyperparameter determination. Within each outer training fold, the LASSO regularization parameter was determined using an internal three-fold cross-validation procedure across 20 candidate regularization values. The one-standard-error rule was used to select a parsimonious regularization solution. Features with non-zero LASSO coefficients at the selected regularization level were retained for subsequent classifier training. LASSO was used solely as a supervised feature-selection procedure; final prediction was subsequently performed using the classifiers described below.
2.7. Machine Learning Classification
Five machine-learning classifiers were evaluated using the LASSO-selected connectivity features: Support Vector Machine (SVM), k-Nearest Neighbors (KNN), Random Forest (RF), Logistic Regression (LR), and Gaussian Naïve Bayes (NB). Linear SVM was implemented using a linear kernel; KNN employed five nearest neighbors with Euclidean distance and equal weighting; RF consisted of 100 bagged decision trees; LR was trained using ridge regularization with the LBFGS optimizer; and Gaussian NB modeled each feature using a class-conditional Gaussian distribution. Within each validation fold, the same LASSO-selected feature subset was provided as input to all classifiers to ensure that classifier comparisons were based on an identical feature representation. The minimum leaf size for Random Forest was set to one. Uniform class priors were used for KNN and Gaussian Naive Bayes.
Predictive performance was evaluated using two complementary validation strategies: stratified 10-fold cross-validation and leave-one-subject-out (LOSO) cross-validation. In stratified 10-fold cross-validation, product-level observations were randomly partitioned into ten approximately equal folds while preserving the class distribution. Each fold was used once as the test set, while the remaining nine folds were used for model development. To provide a more rigorous assessment of subject-independent generalization, LOSO cross-validation was also performed. In each LOSO iteration, all product-level observations belonging to one participant were reserved as the test set, while observations from all remaining participants were used for model development. This procedure was repeated until each eligible participant had served once as the independent test subject. Because stratification was performed at the product-observation level, observations from the same participant could occur in both the training and test folds. Accordingly, stratified 10-fold cross-validation was used to evaluate observation-level predictive performance and was not interpreted as a subject-independent validation strategy. In contrast, LOSO cross-validation provided a subject-independent out-of-sample evaluation by testing the models on participants whose observations were entirely excluded from the corresponding training sets. Nevertheless, because all participants originated from the same NeuMa dataset, LOSO constitutes internal subject-independent validation rather than external validation using an independently collected cohort.
In both validation strategies, training-dependent preprocessing, feature standardization, LASSO feature selection, and classifier training were performed using only the corresponding training partition and were repeated independently within each outer validation fold. The held-out observations were not used during these model-development steps. To address class imbalance, cost-sensitive learning was implemented for SVM, RF, and LR using class-dependent misclassification costs derived from the class frequencies in each training fold. These costs were determined exclusively from the training data to avoid information leakage. KNN and Gaussian NB were evaluated without cost-sensitive modification.
Classifier performance was quantified using accuracy, balanced accuracy, precision, recall (sensitivity), specificity, F1-score, Matthews correlation coefficient (MCC), and the area under the receiver operating characteristic curve (AUC). Given the class imbalance, balanced accuracy was used as the primary performance criterion for model comparison, while F1-score, MCC, AUC, and conventional accuracy were considered complementary performance measures. All analyses were implemented in MATLAB (R2023b, MathWorks, Natick, MA, USA) using custom-developed scripts. For reproducibility, the random number generator was initialized with a fixed seed of 20260727.
2.8. Feature Stability Analysis
To evaluate the stability of the LASSO-based feature-selection process, the consistency of selected connectivity features was examined across the outer validation folds [23]. For each outer validation fold, the selected connectivity features and their corresponding LASSO coefficients were recorded. For each feature, selection frequency was calculated as the proportion of outer validation folds in which that feature was selected. In addition, the mean absolute LASSO coefficient was calculated across the folds in which the feature was selected to characterize the magnitude of its contribution when retained.
Feature-selection stability was evaluated separately for the PLV, NMI, and PLV+NMI representations under stratified 10-fold and LOSO validation. To identify features that remained consistently selected across both validation strategies, features were ranked according to their mean selection frequency across stratified 10-fold and LOSO validation, with the mean absolute LASSO coefficient used to resolve ties. Features with high selection frequencies across both validation strategies were interpreted as stable connectivity features within the present dataset and analytical framework [23].
3. Results
3.1. Subject-Level Functional Connectivity Analysis
Subject-level functional connectivity patterns were examined by averaging the connectivity matrices for non-preferred products (Label 0) and preferred products (Label 1) separately across participants with valid observations. For each connectivity metric, mean matrices were generated for the delta, theta, alpha, beta, and gamma frequency bands. Difference matrices were subsequently calculated as Label 1 minus Label 0 to visualize the direction and spatial distribution of preference-related connectivity alterations. This analysis was conducted using the same 19-channel ordering applied throughout the connectivity pipeline.
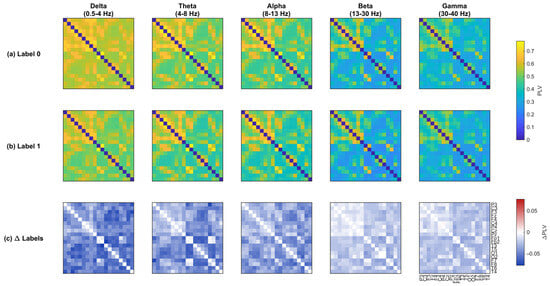
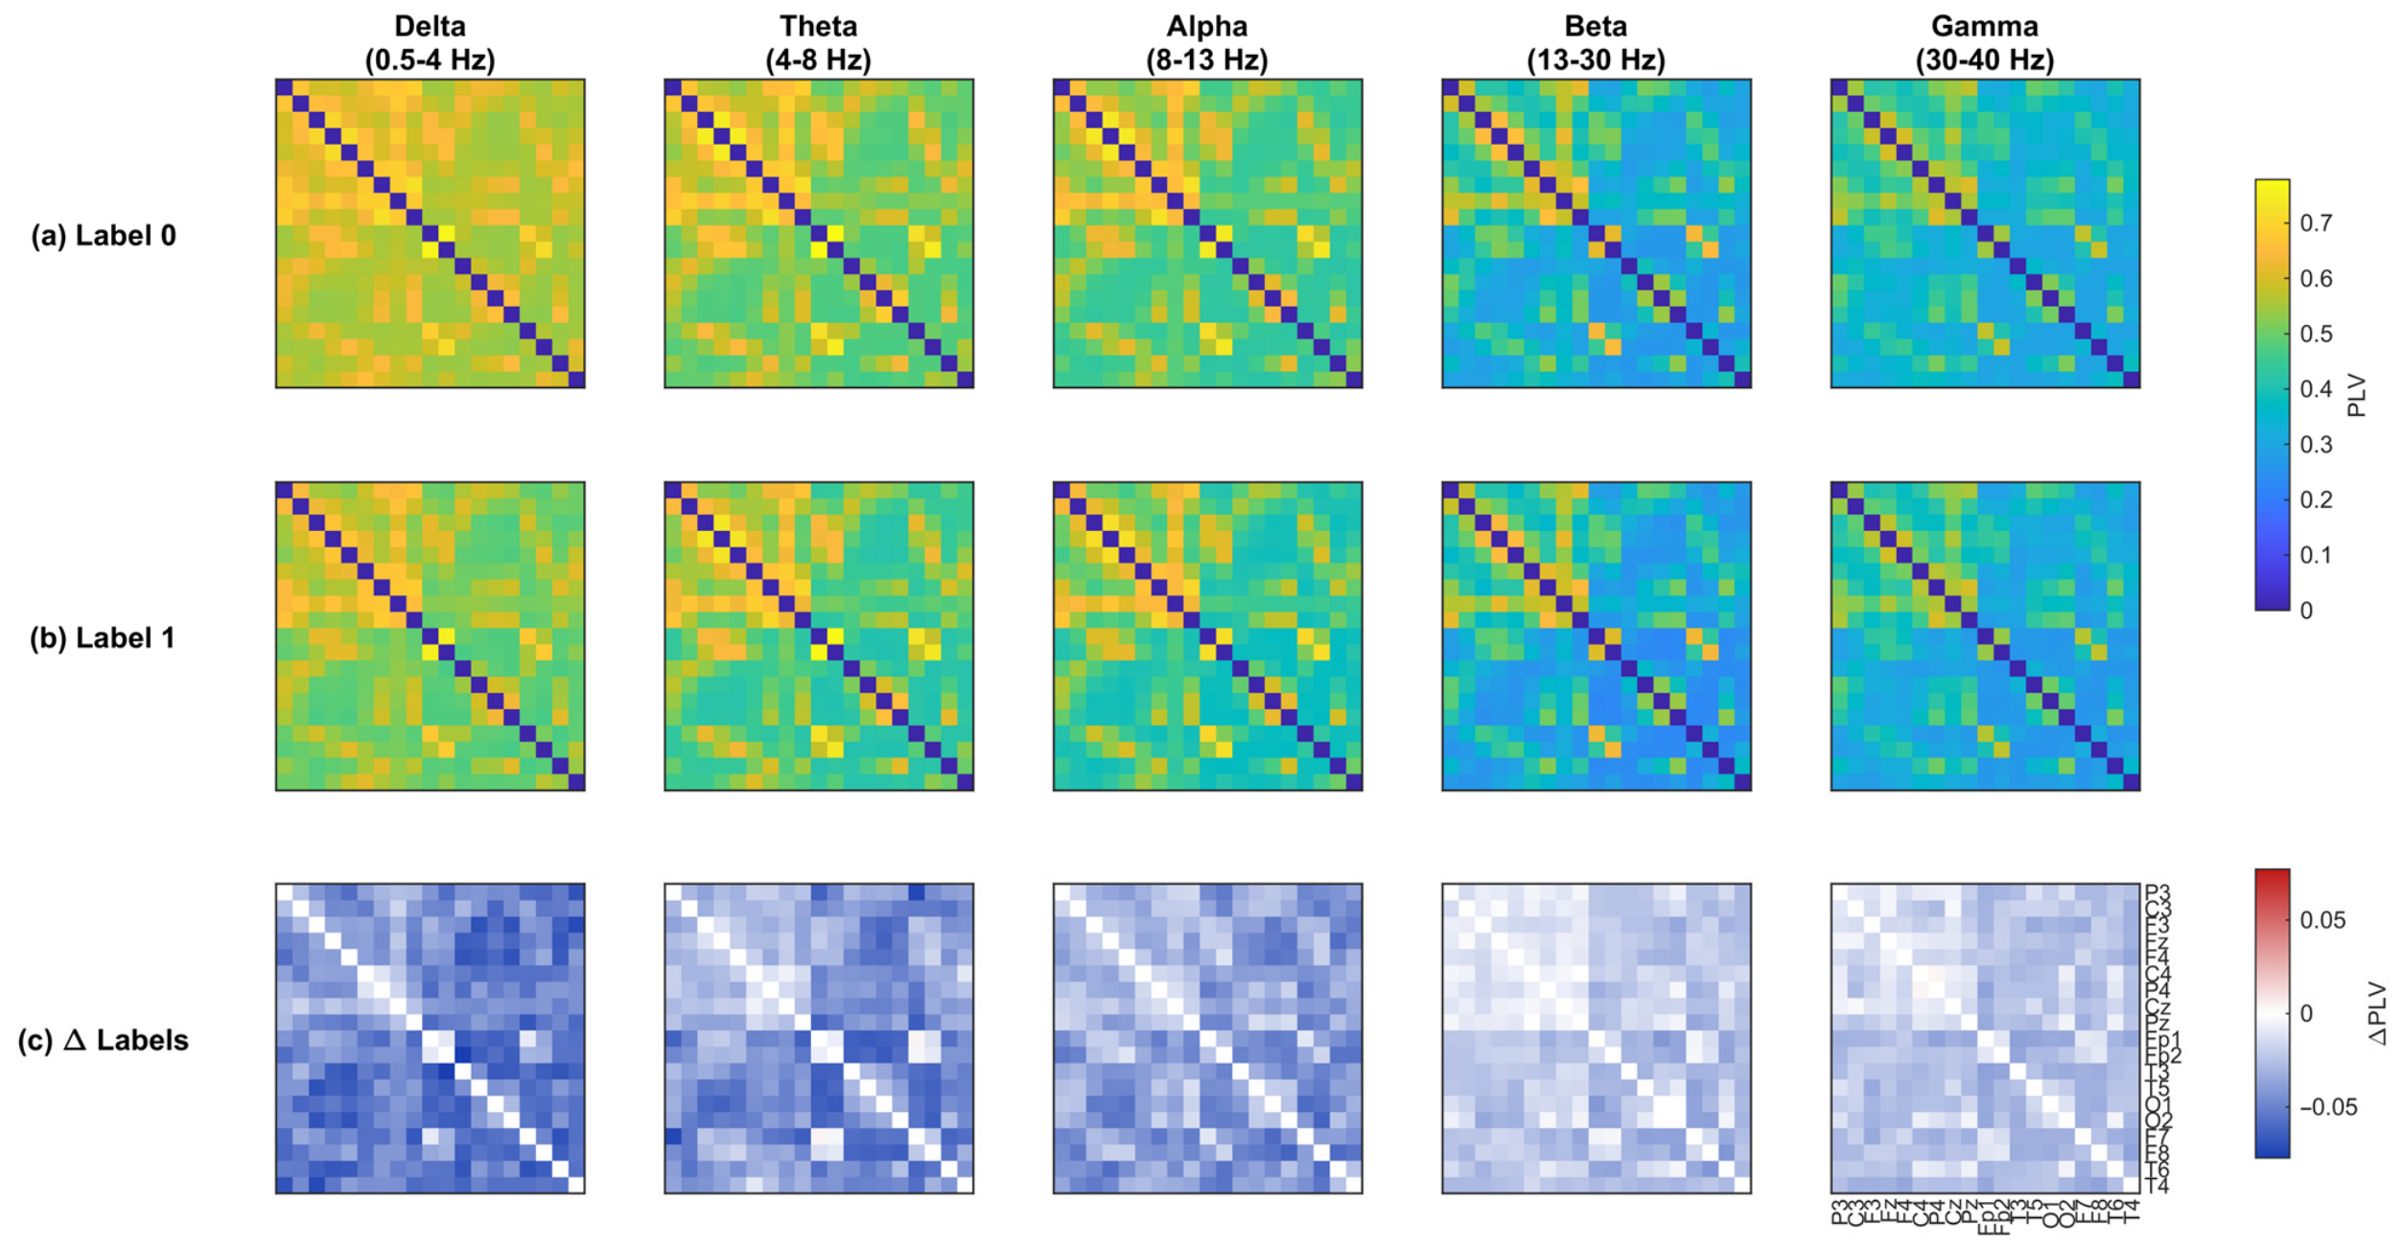
Figure 2 presents the group-level mean PLV matrices for the two preference conditions and their corresponding differences. The non-preferred-product condition generally exhibited higher PLVs than the preferred-product condition across the analyzed frequency bands. This pattern was particularly evident in the delta, theta, and alpha bands, where the difference matrices showed widespread negative values, indicating lower phase synchronization during preferred-product viewing.
Figure 2.
PLV connectivity matrices across five frequency bands for (a) non-preferred (Label 0) and (b) preferred (Label 1) products, and (c) their difference (Label 1 – Label 0). Rows and columns represent 19 EEG channels. Color scales indicate PLVs (a,b) and differences (c), with negative and positive differences indicating lower and higher phase synchronization for Label 1, respectively.
Although the magnitude of the differences varied across channel pairs and frequency bands, the overall direction of the PLV changes was largely consistent. Lower-frequency bands exhibited more spatially widespread connectivity differences, whereas differences in the beta and gamma bands were more localized.
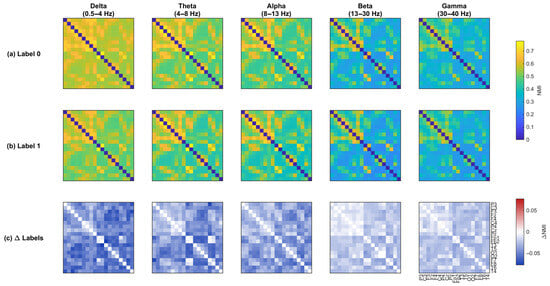
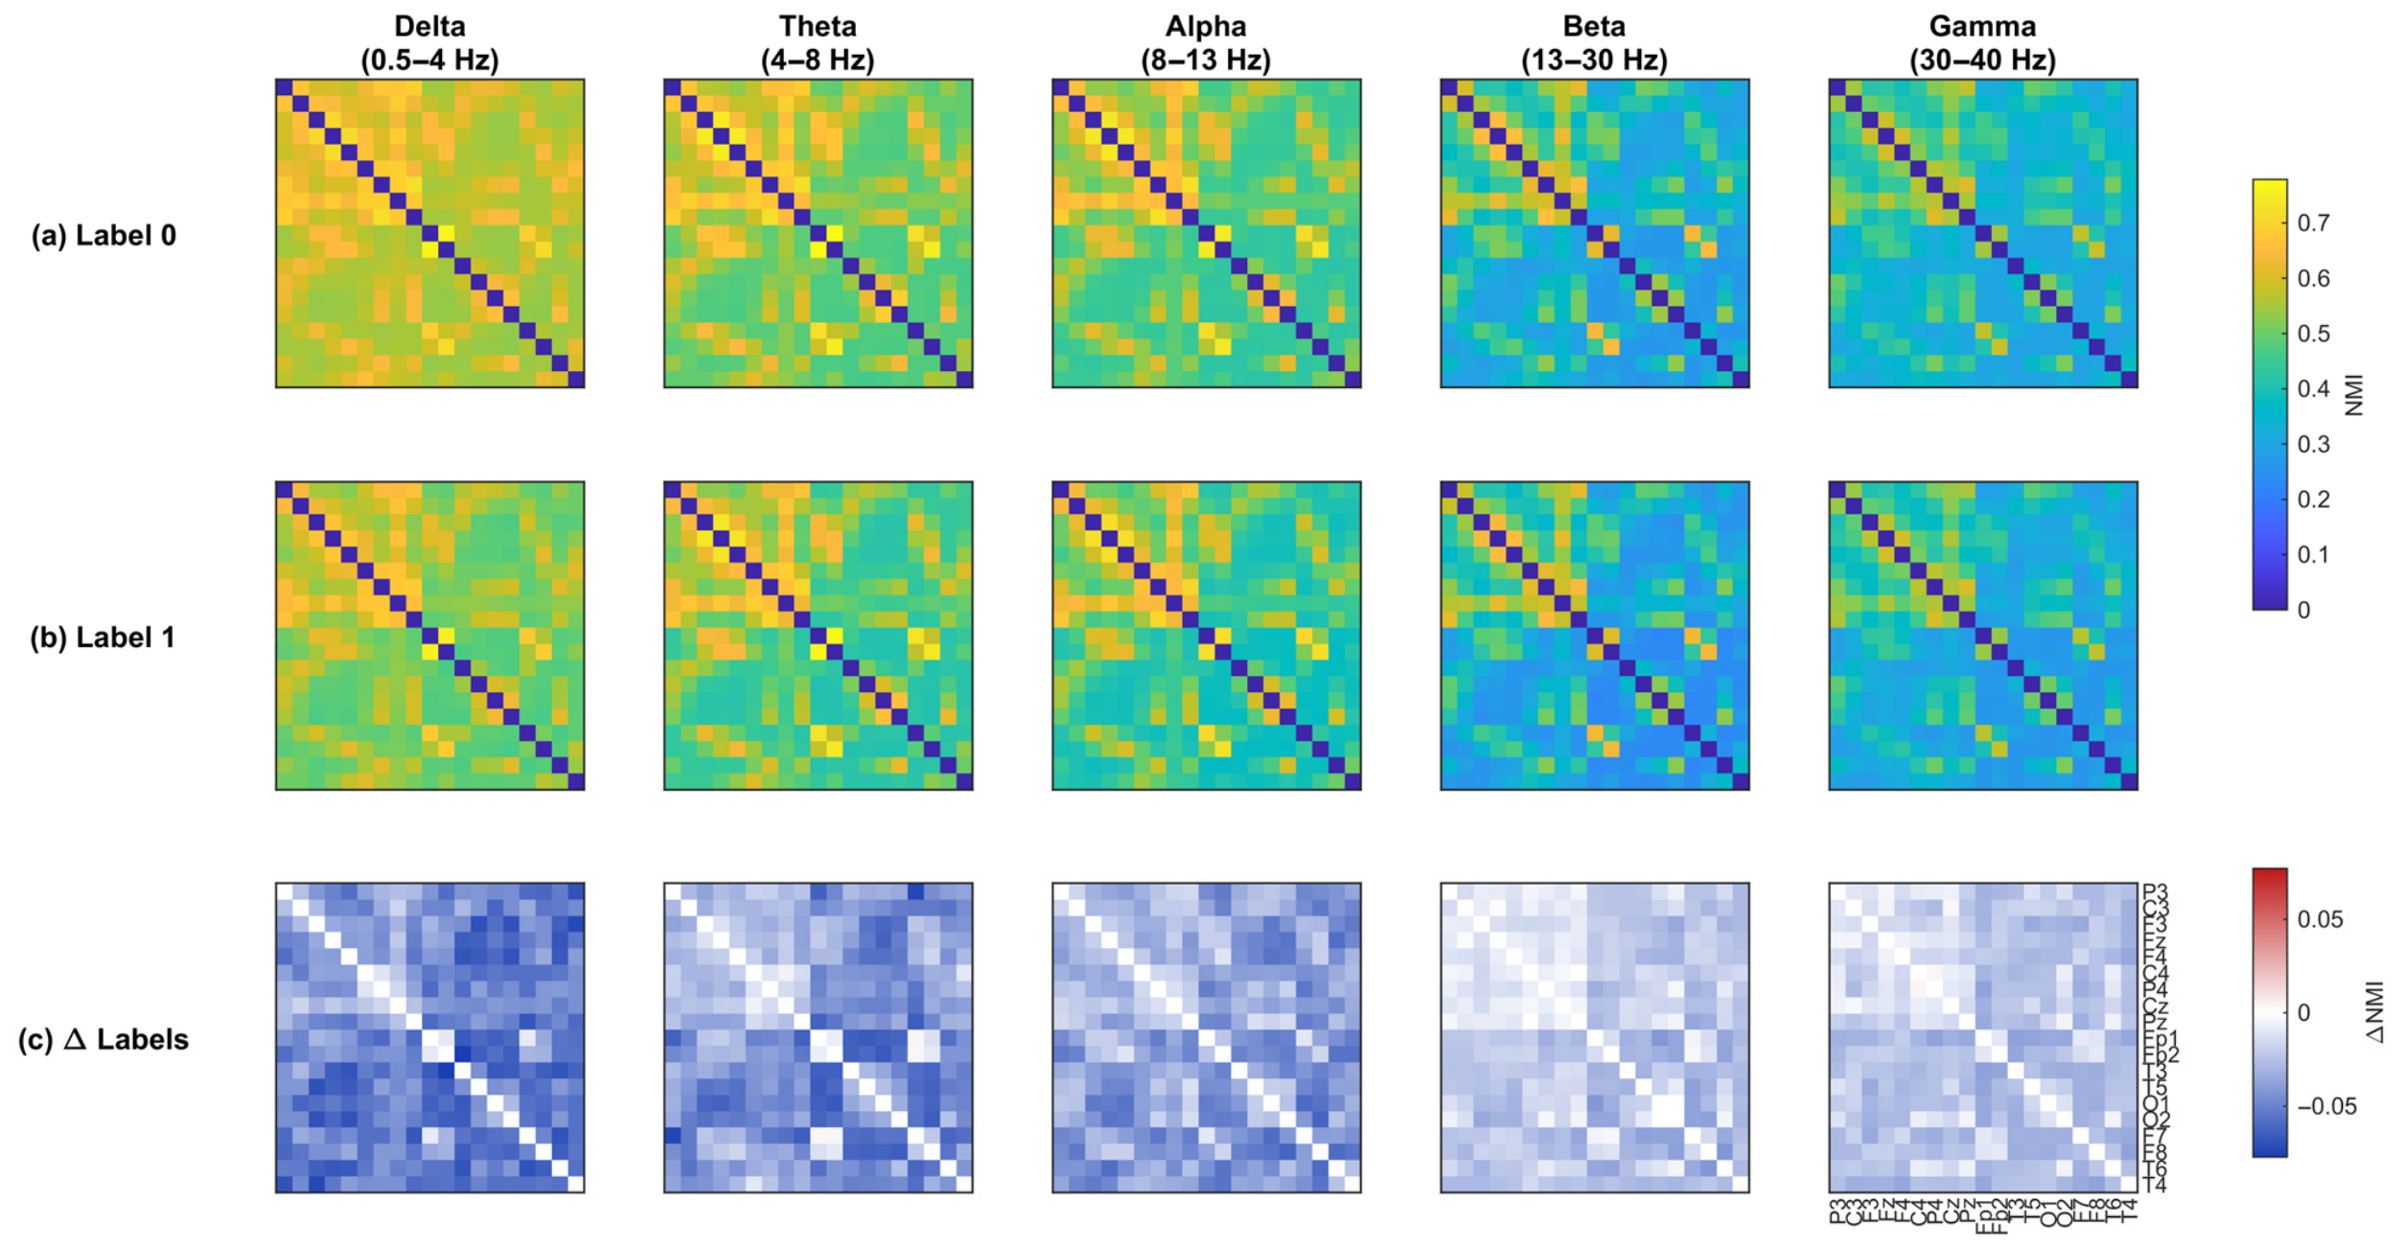
The mean NMI connectivity matrices are shown in Figure 3. Similar to the PLV findings, NMI values were generally lower for preferred products than for non-preferred products. However, the NMI difference matrices revealed a more widespread and visually pronounced reduction in connectivity, particularly in the delta band. Substantial negative differences were also observed in the theta, alpha, beta, and gamma bands, indicating reduced information sharing between distributed EEG channels during preferred-product viewing.
Figure 3.
NMI connectivity matrices across five frequency bands for (a) non-preferred (Label 0) and (b) preferred (Label 1) products, and (c) their difference (Label 1 − Label 0). Rows and columns represent 19 EEG channels. Color scales indicate PLVs (a,b) and differences (c), with negative and positive differences indicating lower and higher phase synchronization for Label 1, respectively.
Taken together, the mean connectivity matrices demonstrated a consistent tendency toward reduced functional connectivity during preferred-product viewing for both PLV and NMI. Nevertheless, visual inspection alone cannot establish statistical significance. Therefore, the observed frequency- and connection-specific differences were subsequently evaluated using paired subject-level statistical analyses with false discovery rate correction.
3.2. Statistical Connectivity Analysis
Subject-level paired statistical analyses were performed to identify functional connectivity differences between preferred (Label 1) and non-preferred (Label 0) products. For each frequency band and connectivity metric, the 171 unique channel pairs were compared using the Wilcoxon signed-rank test. The resulting p-values were adjusted using the Benjamini–Hochberg FDR procedure, with statistical significance defined as an FDR-adjusted q-value below 0.05. The magnitude and direction of the differences were quantified using paired rank-biserial effect sizes.
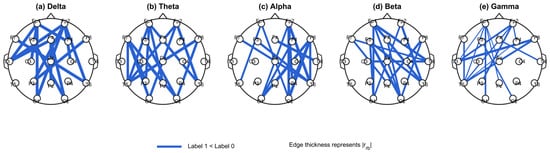
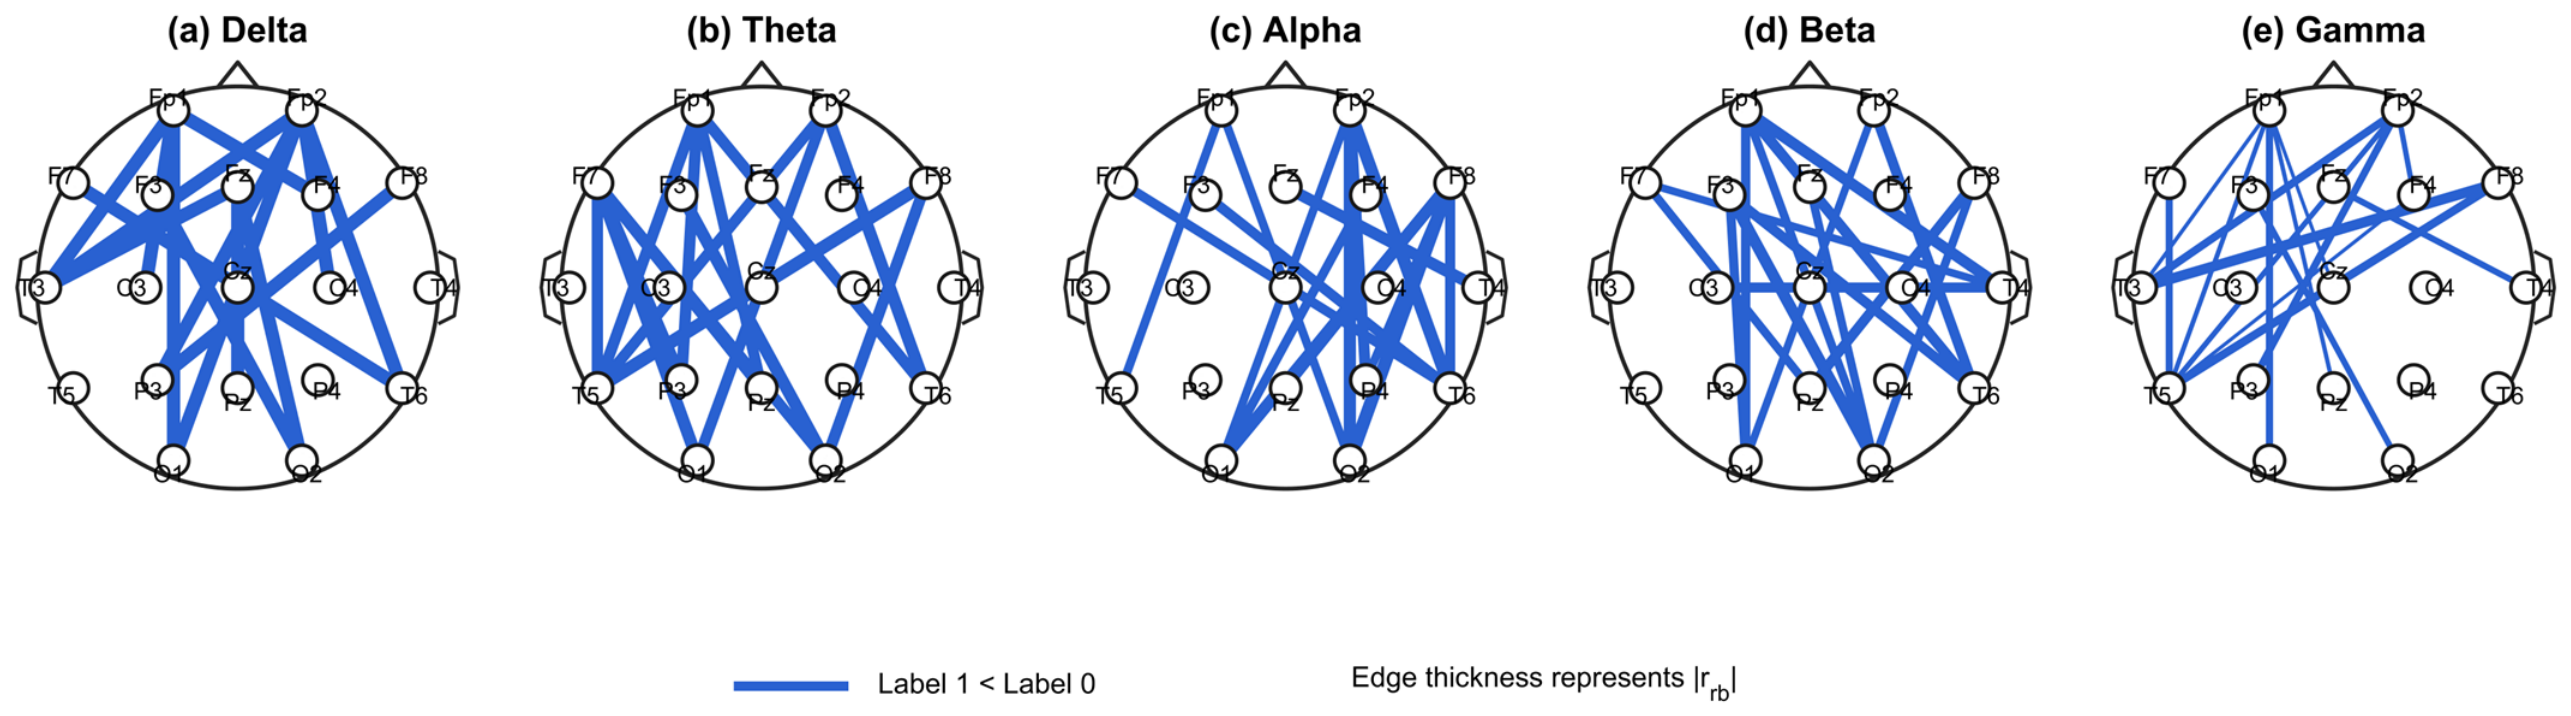
The PLV analysis revealed widespread and consistently directed connectivity differences between the two preference conditions (Figure 4). Significant differences were identified in 168 (98.2%), 160 (93.6%), 163 (95.3%), 126 (73.7%), and 135 (78.9%) of the 171 tested channel pairs in the delta, theta, alpha, beta, and gamma bands, respectively.
Figure 4.
Top 15 FDR-significant PLV connections in each frequency band, ranked by absolute paired rank-biserial effect size (). All displayed connections showed lower PLV for (Label 1) than (Label 0) products. Edge thickness represents using a consistent scale across frequency bands.
All FDR-significant PLV connections showed negative paired rank-biserial effect sizes, indicating consistently lower phase synchronization during preferred-product viewing than during non-preferred-product viewing. For visual clarity, Figure 4 displays only the 15 FDR-significant connections with the largest absolute paired rank-biserial effect sizes for each frequency band. Edge thickness is proportional to the absolute effect size and is scaled consistently across all frequency bands to facilitate visual comparison.
The quantitative results are summarized in Table 2. The delta band exhibited the highest proportion of significant PLV connections (98.2%). The alpha and theta bands also demonstrated widespread connectivity alterations, with more than 93% of all tested channel pairs remaining significant after FDR correction. Although fewer significant connections were identified in the beta (73.7%) and gamma (78.9%) bands, their median absolute effect sizes remained substantial (0.674 and 0.679, respectively). The strongest individual PLV effects were observed for Pz–F7 (delta), Pz–Fp1 (theta), Fp2–T6 (alpha), Fp1–T6 (beta), and Fp1–O1 (gamma).
Table 2.
Subject-level statistical comparison of PLV connectivity between Label 0 and Label 1 across frequency bands.
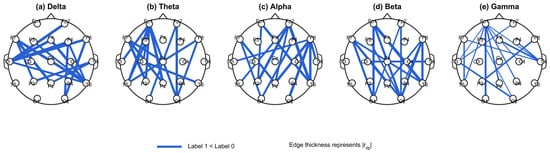
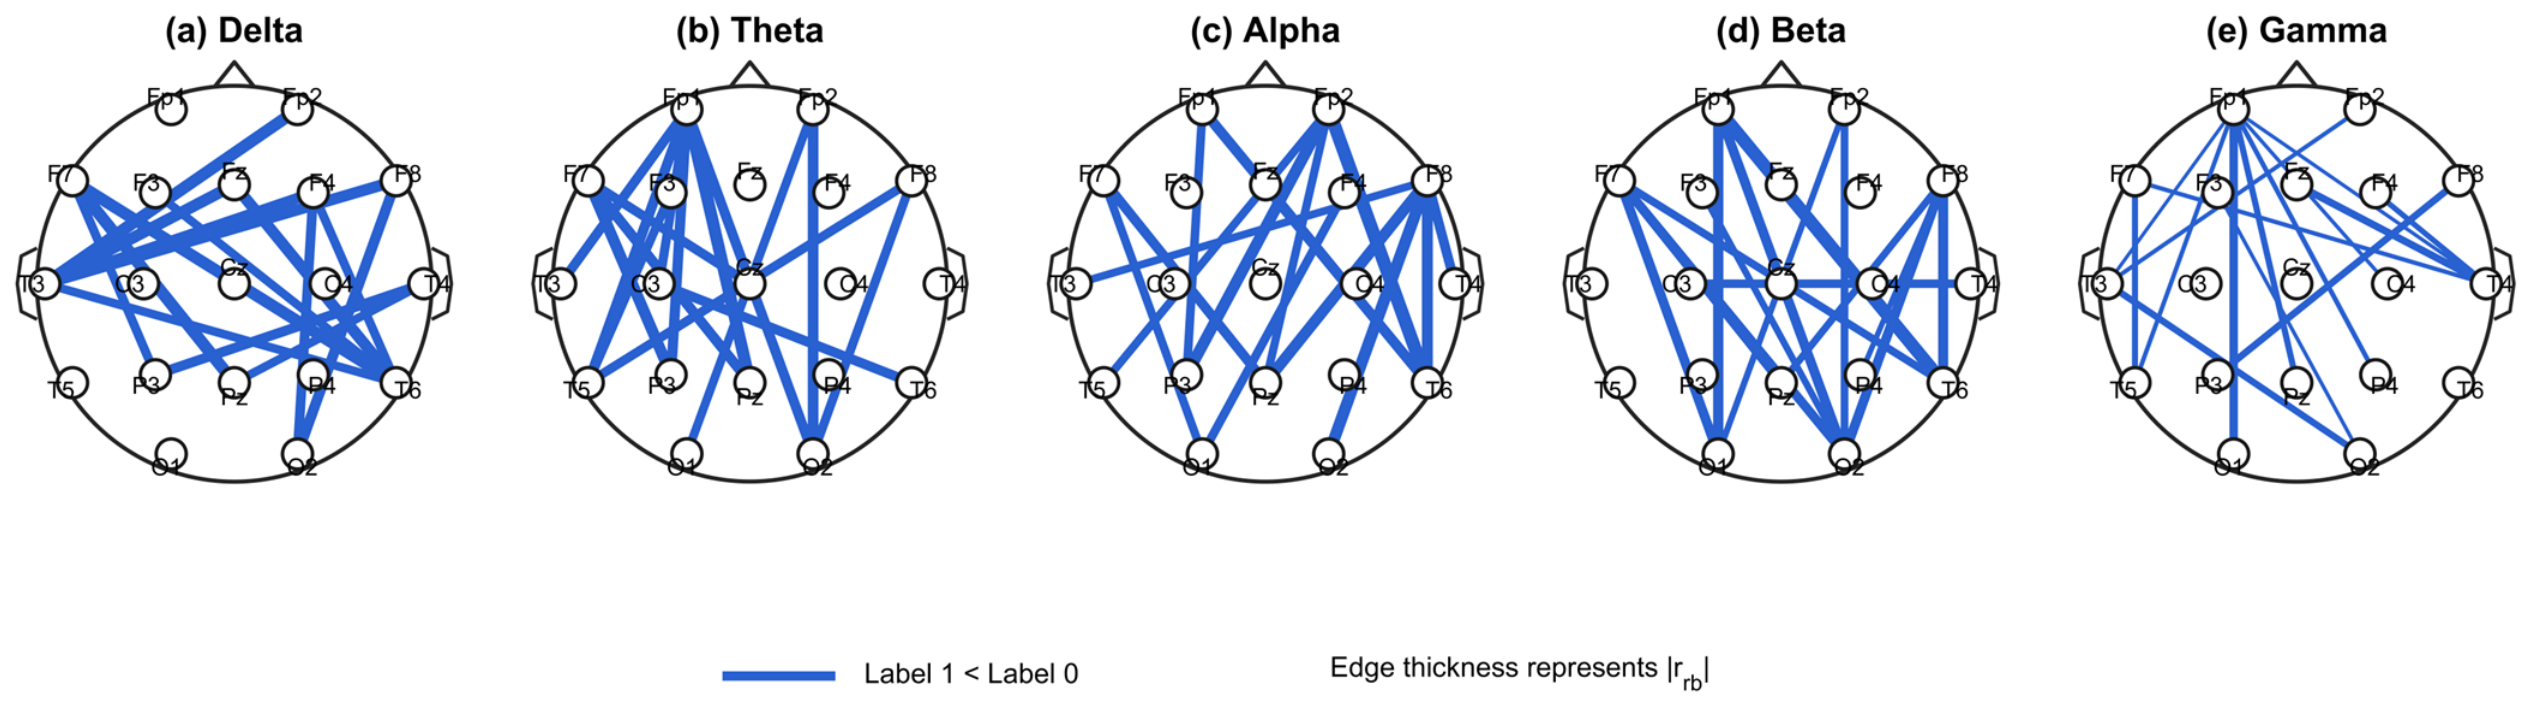
The NMI analysis demonstrated even more extensive connectivity differences across the five frequency bands (Figure 5). Statistically significant differences were identified in 171 (100.0%), 166 (97.1%), 166 (97.1%), 161 (94.2%), and 163 (95.3%) of the 171 tested channel pairs in the delta, theta, alpha, beta, and gamma bands, respectively.
Figure 5.
Top 15 FDR-significant NMI connections in each frequency band, ranked by absolute paired rank-biserial effect size (). All displayed connections showed lower NMI for (Label 1) than (Label 0) products. Edge thickness represents using a consistent scale across frequency bands.
Similar to the PLV analysis, all FDR-significant NMI connections showed negative paired rank-biserial effect sizes, indicating consistently lower NMI values during preferred-product viewing. For visual clarity, Figure 5 displays only the 15 FDR-significant connections with the largest absolute paired rank-biserial effect sizes for each frequency band. Edge thickness is proportional to the absolute effect size and is scaled consistently across all five frequency bands.
The numerical summary is presented in Table 3. The delta band exhibited the largest median absolute effect size and all 171 tested channel pairs remained statistically significant after FDR correction. The theta, alpha, beta, and gamma bands also demonstrated extensive connectivity differences, with significance rates ranging from 94.2% to 97.1%. The strongest individual NMI effects were observed for C3–Fp1 (delta), T5–F8 (theta), O2–F8 (alpha), F3–O2 (beta), and T3–F8 (gamma). Compared with PLV, the NMI analysis identified a higher proportion of FDR-significant connections across all frequency bands.
Table 3.
Subject-level statistical comparison of NMI connectivity between Label 0 and Label 1 across frequency bands.
Overall, both connectivity metrics revealed widespread statistically significant reductions in functional connectivity during preferred-product viewing. The statistical analysis and machine-learning analysis were conducted as complementary but independent analytical procedures. Statistical significance was not used as a pre-selection criterion for the machine-learning models.
3.3. Machine Learning Performance
To evaluate the predictive utility of the functional connectivity representations, five supervised classifiers (Linear SVM, KNN, Random Forest, Logistic Regression, and Naive Bayes) were trained using Linear LASSO-selected features derived separately from PLV, NMI, and fused PLV+NMI connectivity representations. Model performance was assessed under both stratified 10-fold cross-validation and leave-one-subject-out (LOSO) validation. Because of the class imbalance, balanced accuracy was considered the primary performance metric, while accuracy, precision, recall, specificity, positive-class F1-score, AUC, and MCC were used as complementary measures.
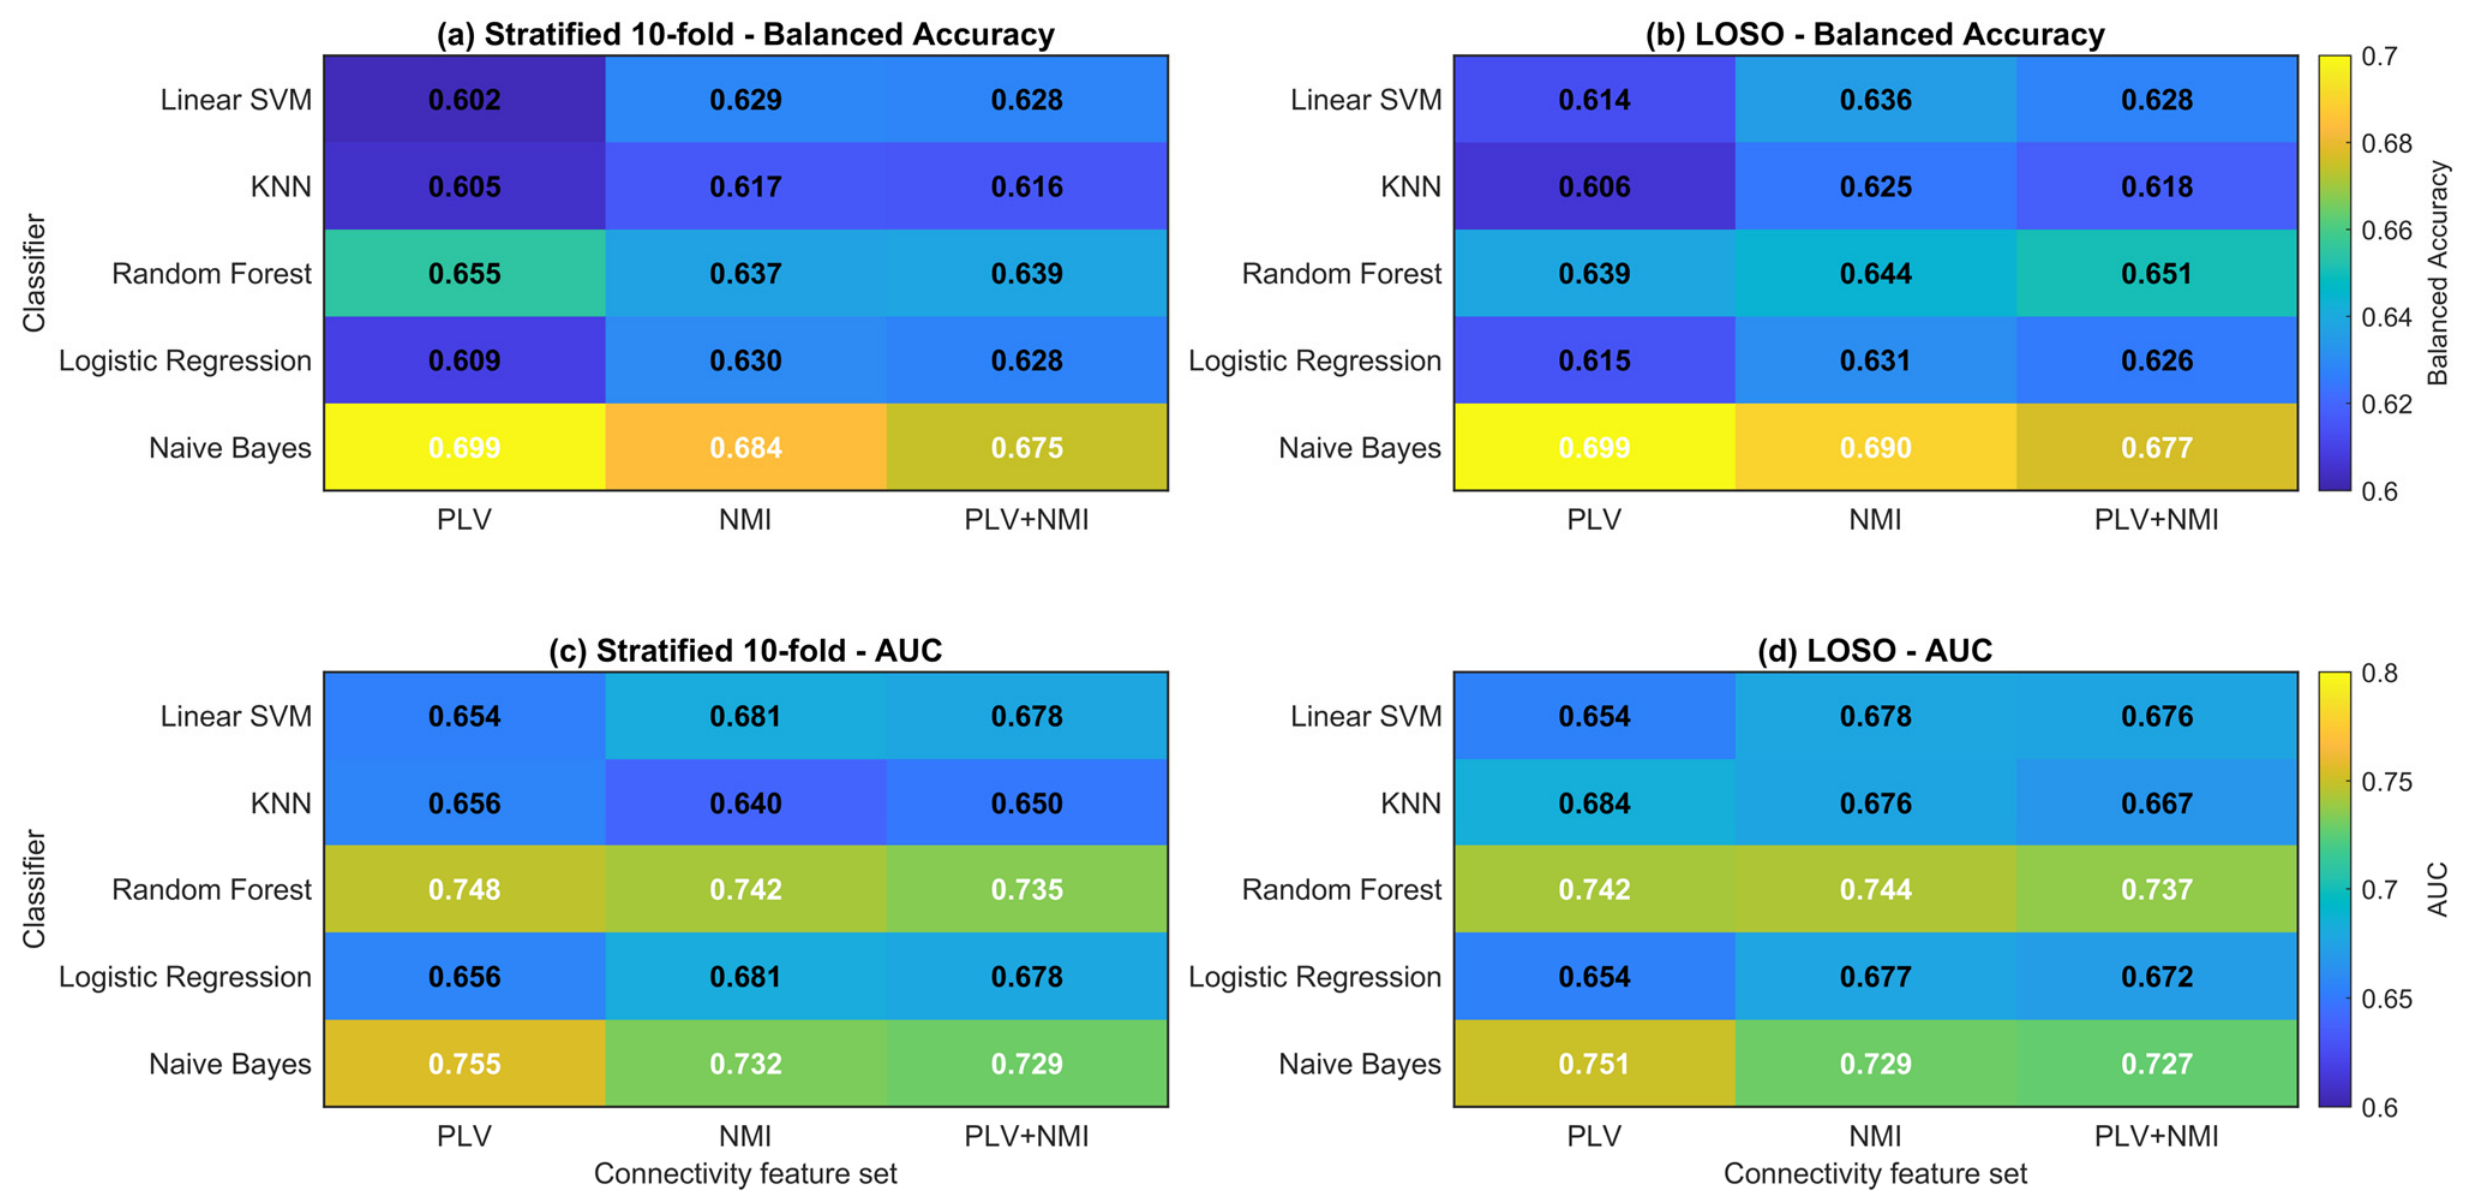
The classification results are summarized in Table 4. Under stratified 10-fold cross-validation, Naive Bayes achieved the highest balanced accuracy within each of the three feature representations. The highest overall balanced accuracy was obtained using PLV features with Naive Bayes (0.699), accompanied by an AUC of 0.760, recall of 0.765, specificity of 0.633, and MCC of 0.330. Using the same classifier, NMI and fused PLV+NMI features yielded balanced accuracies of 0.684 and 0.675, respectively.
Table 4.
Classification performance of machine-learning classifiers using LASSO-selected PLV, NMI, and fused PLV+NMI features under stratified 10-fold and LOSO validation. The highest balanced accuracy for each feature set and validation strategy is shown in bold.
A similar performance pattern was observed under LOSO validation. Naive Bayes again achieved the highest balanced accuracy for the PLV (0.699), NMI (0.690), and fused PLV+NMI (0.677) representations. The PLV-based Naive Bayes model therefore retained a balanced accuracy of 0.699 when evaluated on previously unseen participants, with an AUC of 0.750, recall of 0.767, specificity of 0.632, and MCC of 0.330. The similarity between the stratified 10-fold and LOSO results suggests that this classifier–feature-set combination maintained comparable predictive performance under subject-independent validation.
Although Random Forest achieved the highest overall accuracy for each feature representation under both validation strategies, its balanced accuracy was comparatively lower due to its reduced recall for the preferred-product class. For example, under stratified 10-fold validation, Random Forest with PLV features achieved an accuracy of 0.780 but a recall of only 0.435, resulting in a balanced accuracy of 0.655. Conversely, KNN showed high recall, reaching 0.890 with PLV features under LOSO validation, but this was accompanied by low specificity (0.323) and a balanced accuracy of 0.606. These results illustrate the importance of considering class-balanced performance rather than overall accuracy alone in the present imbalanced dataset.
Across feature representations, PLV and NMI demonstrated broadly comparable predictive performance, although PLV combined with Naive Bayes yielded the highest balanced accuracy observed in the study. The relative performance of PLV and NMI varied across individual classifiers, indicating that neither connectivity representation consistently outperformed the other across all classification algorithms. Moreover, early feature-level fusion did not improve upon the highest balanced accuracy achieved using PLV alone, suggesting that combining the two connectivity representations offered no additional benefit in terms of the best observed balanced accuracy within the present classification framework.
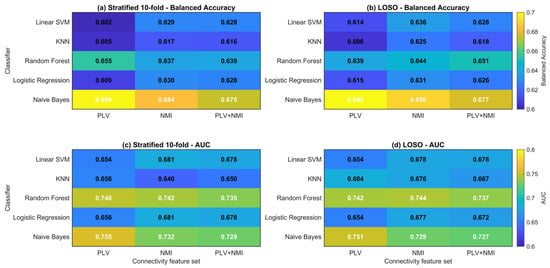
Following the quantitative comparison presented in Table 4, Figure 6 provides a visual comparison of balanced accuracy and ROC-AUC across the PLV, NMI, and fused PLV+NMI feature representations for each classifier under stratified 10-fold and LOSO validation.
Figure 6.
Balanced accuracy (a,b) and AUC (c,d) across classifiers and connectivity feature sets under stratified 10-fold (a,c) and LOSO (b,d) validation.
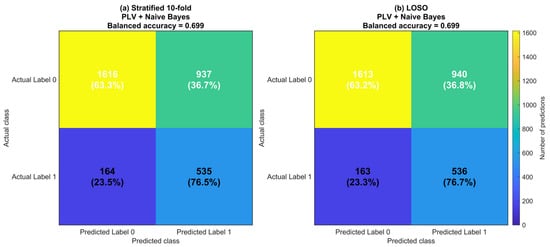
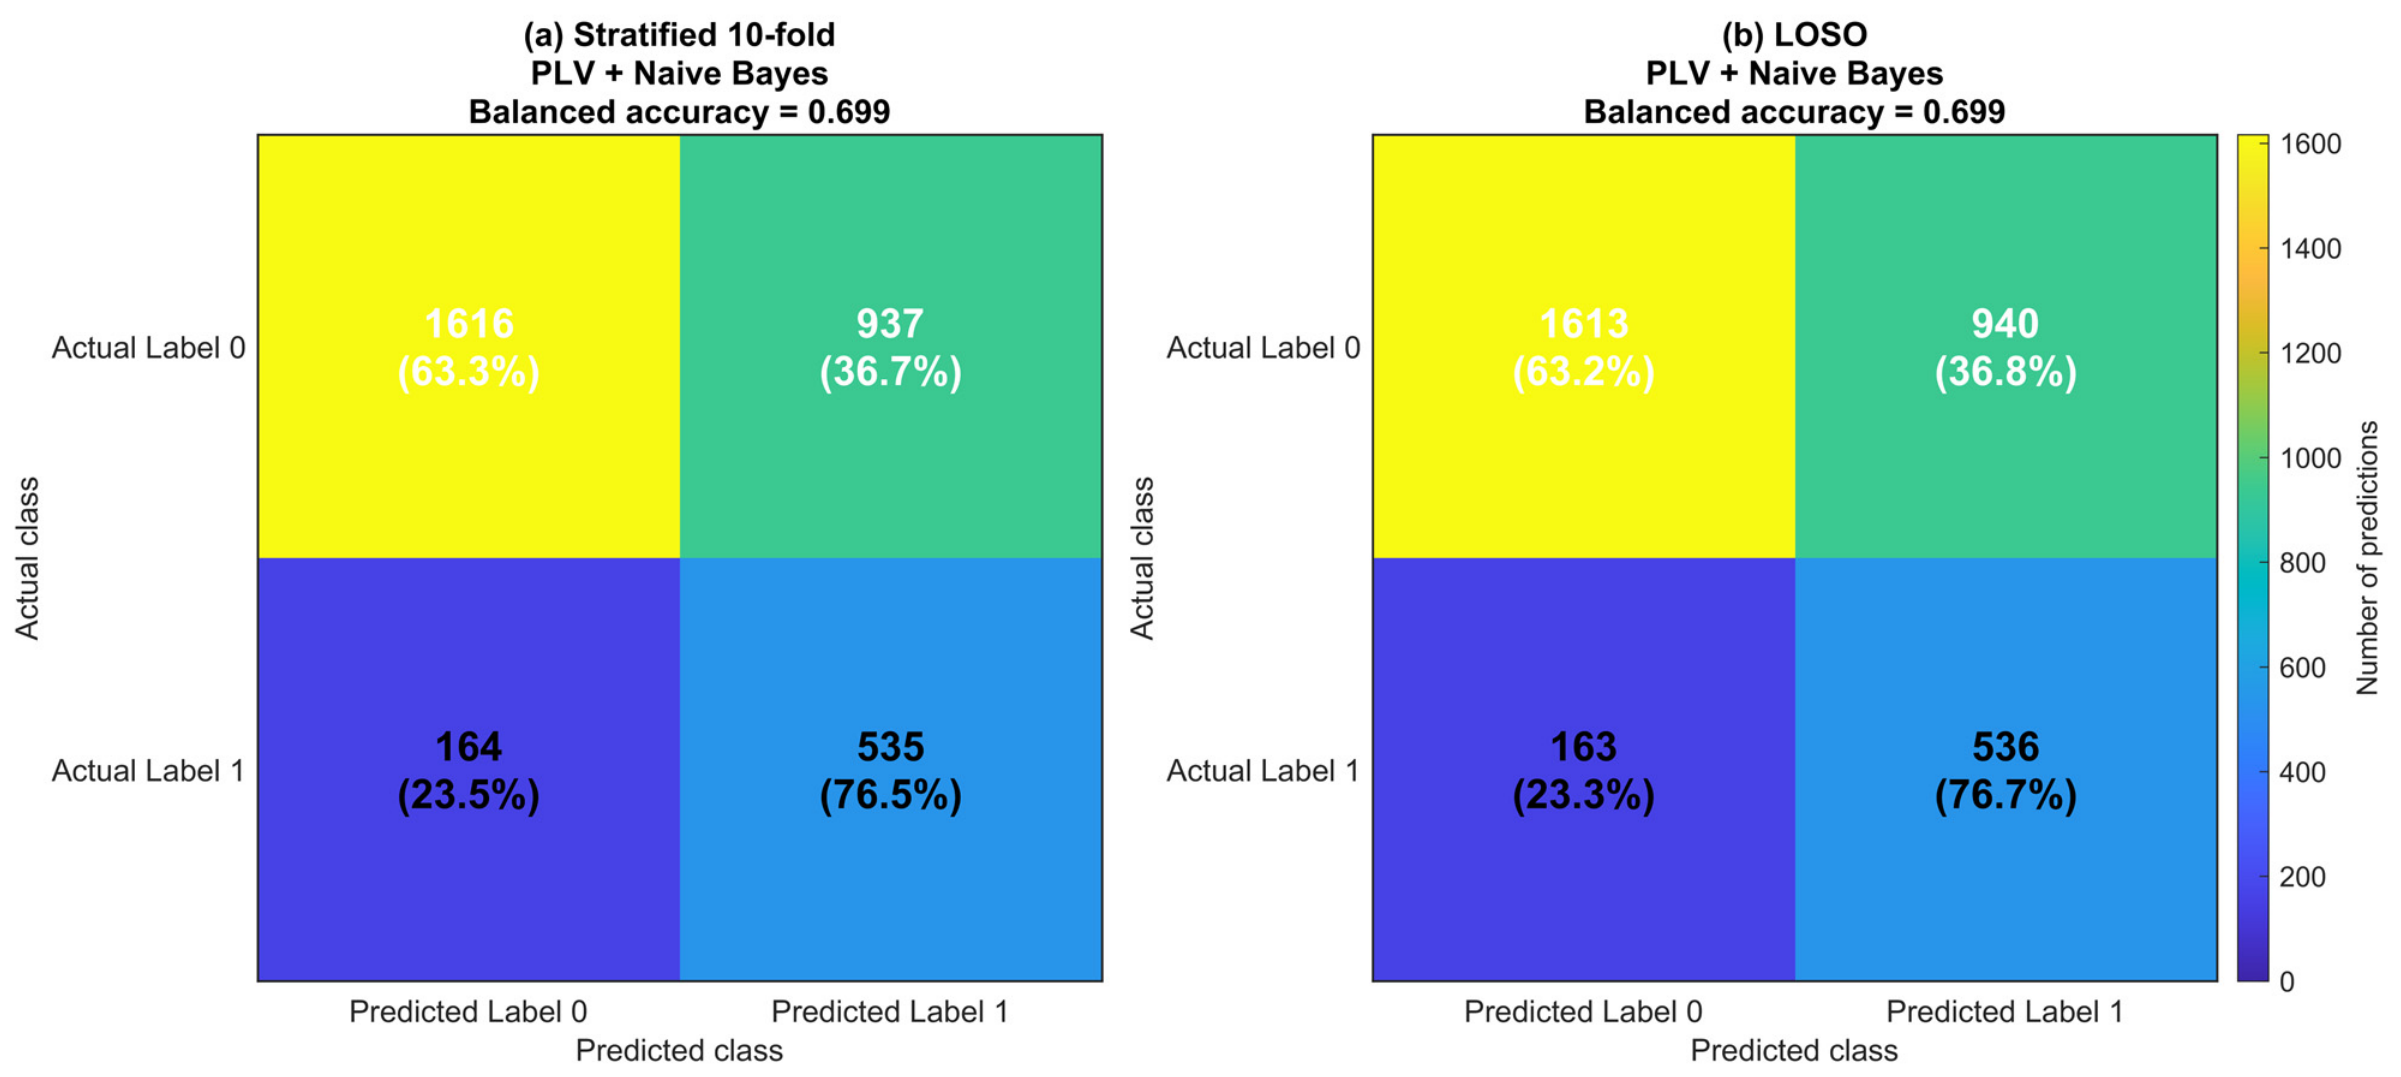
Figure 6 confirms the broadly comparable performance patterns observed across the two validation strategies. Naive Bayes achieved the highest balanced accuracy within each connectivity representation, while the differences among PLV, NMI, and fused PLV+NMI features remained relatively modest. To further examine the prediction behavior of the model achieving the highest balanced accuracy, confusion matrices were generated for the PLV-based Naive Bayes classifier under both stratified 10-fold and LOSO validation (Figure 7).
Figure 7.
Confusion matrices of the Phase Locking Value (PLV)-based Naive Bayes classifier under (a) stratified 10-fold, and (b) leave-one-subject-out (LOSO) cross-validation.
As illustrated in Figure 7, the confusion matrices were highly similar across the two validation strategies. Under stratified 10-fold validation, the pooled predictions comprised 1616 true negatives, 937 false positives, 164 false negatives, and 535 true positives. Under LOSO validation, the corresponding values were 1613 true negatives, 940 false positives, 163 false negatives, and 536 true positives. Consistent with Table 4, the PLV-based Naive Bayes classifier achieved a balanced accuracy of approximately 0.699 under both validation strategies, indicating that its classification behavior was largely maintained when entire participants were held out during validation.
3.4. Feature Stability Analysis
The stability of the connectivity features selected by Linear LASSO was evaluated separately for the PLV, NMI, and fused PLV+NMI representations under both stratified 10-fold cross-validation and leave-one-subject-out (LOSO) validation. For each representation, features were ranked primarily according to their mean selection frequency across the two validation strategies, with the mean absolute LASSO coefficient used as a secondary criterion to resolve ties. The ten highest-ranked stable connectivity features for each representation are summarized in Table 5, whereas the spatial distributions of the twenty highest-ranked features are illustrated in Figure 8.
Table 5.
Top 10 stable connectivity features selected by LASSO for each connectivity representation across stratified 10-fold and LOSO validation.
Figure 8.
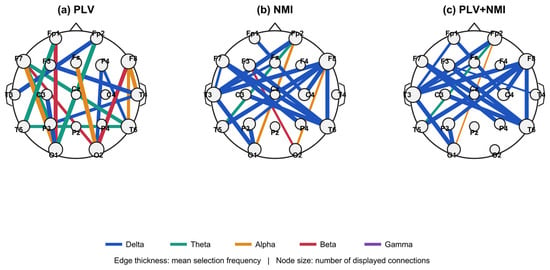
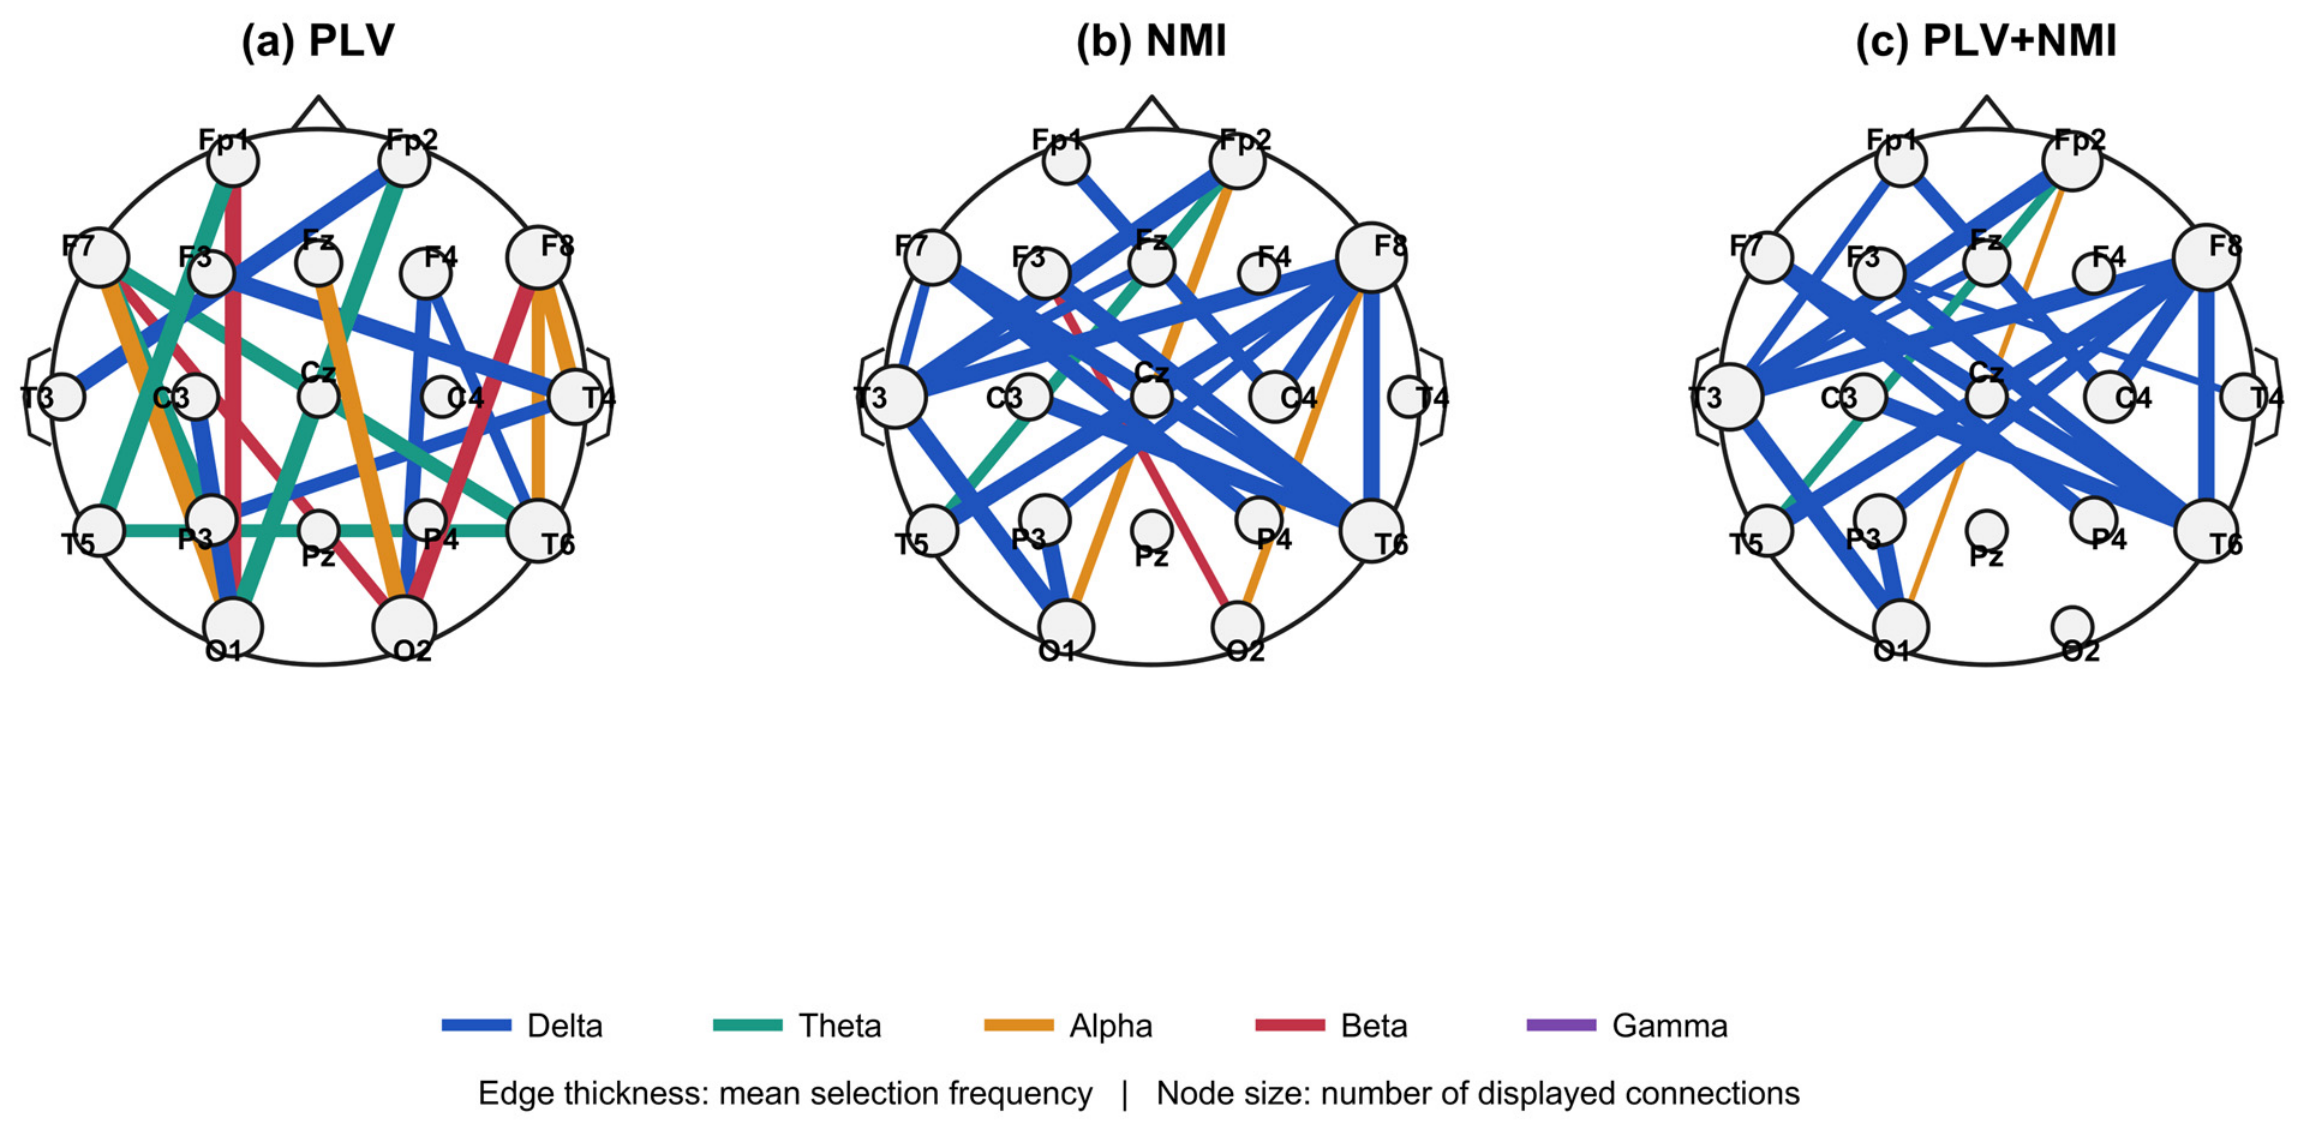
Spatial distribution of the top 20 stable connectivity features for (a) PLV, (b) NMI, and (c) fused PLV+NMI representations. Edge color indicates frequency band, edge thickness represents mean selection frequency, and node size indicates the number of displayed connections involving each EEG channel.
The PLV representation exhibited a distributed stability profile across multiple frequency bands. As shown in Table 5, the eight highest-ranked PLV features were selected in every outer fold of both validation strategies, corresponding to a mean selection frequency of 1.00. These features included F3–T4, Fp2–T3, and C3–O1 in the delta band; P3–F7, Fp2–O1, and Fp1–T5 in the theta band; and O1–F7 and Fz–O2 in the alpha band. The remaining two features among the top ten, Fp1–O1 and O2–F8, were beta-band connections with mean selection frequencies of 0.95. The broader top-20 network shown in Figure 8 indicates that the stable PLV pattern extended across delta, theta, alpha, and beta bands rather than being concentrated within a single frequency band.
The NMI representation showed a more frequency-concentrated stability profile. All ten features reported in Table 5 were derived from delta-band connectivity. Nine of these features achieved a mean selection frequency of 1.00, whereas P3–O1 had a mean selection frequency of 0.98. Examination of the broader top-20 network in Figure 8 further showed that delta-band connections predominated among the most stable NMI features, indicating a stronger low-frequency concentration than that observed for PLV.
The fused PLV+NMI representation provided a direct assessment of feature-selection stability when features from both connectivity measures were simultaneously available to Linear LASSO. Notably, all ten highest-ranked features reported in Table 5 were NMI-derived, and all belonged to the delta band. Examination of the twenty highest-ranked fused features illustrated in Figure 8 showed that 18 originated from NMI and only two from PLV. The fused stability profile therefore closely resembled the NMI pattern and was strongly dominated by delta-band connectivity. These findings suggest that NMI-derived features were selected more consistently than PLV-derived features within the fused feature space. However, this greater selection stability did not translate into higher balanced accuracy for NMI-based classification. Figure 8 illustrates the spatial distribution of the twenty highest-ranked stable connectivity features for each representation. PLV exhibited a comparatively distributed pattern involving multiple frequency bands and channel pairs, whereas NMI showed a more pronounced concentration of delta-band connections. The fused representation closely resembled the NMI stability profile, reflecting the predominance of NMI-derived features among the highest-ranked fused features. Edge color indicates frequency band, edge thickness represents the mean selection frequency across the two validation strategies, and node size reflects the number of displayed connections involving each EEG channel.
4. Discussion
The present study investigated consumer preference prediction using two complementary EEG functional connectivity measures, PLV and NMI, through subject-level statistical analysis, LASSO-based feature selection, machine-learning classification, and feature-stability assessment. Three principal findings emerged. First, preferred-product viewing was associated with widespread reductions in functional connectivity relative to non-preferred-product viewing for both PLV and NMI. Second, PLV and NMI yielded broadly comparable predictive performance, although the highest balanced accuracy was obtained with PLV combined with Naive Bayes. Third, feature-stability analysis revealed a different pattern from classification performance: NMI-derived features, particularly those in the delta band, dominated the stable features selected from the fused PLV+NMI representation. These findings indicate that statistical sensitivity, predictive utility, and feature-selection stability represent complementary but distinct properties of EEG functional connectivity representations. Beyond predictive performance, these findings provide insights into the EEG functional connectivity patterns associated with consumer preference. The consistent reductions in PLV and NMI during preferred-product viewing indicate that product preference is associated with differences in inter channel EEG relationships, rather than being reflected solely in local signal characteristics. Thus, the contribution of the present study extends beyond predicting consumer choices to characterizing the network-level EEG signatures associated with product preference. Nevertheless, these associations should not be interpreted as evidence of causal neural mechanisms underlying purchase decisions.
The subject-level statistical analyses revealed extensive preference-related connectivity differences across all examined frequency bands. For PLV, 98.2%, 93.6%, and 95.3% of the tested connections were FDR-significant in the delta, theta, and alpha bands, respectively, with somewhat lower but still substantial proportions in beta (73.7%) and gamma (78.9%). NMI showed even more widespread differences, including all tested connections in the delta band and more than 94% of connections in each of the remaining bands. Importantly, all FDR-significant effects were negative for both connectivity measures, indicating lower functional coupling during preferred-product viewing. Because PLV characterizes phase synchronization whereas NMI quantifies statistical dependence between EEG signals [14,15,16], the convergence in the direction of the effects suggests that the observed preference-related differences were not restricted to a single mathematical representation of EEG connectivity.
Nevertheless, the interpretation of these findings requires consideration of the distinct properties of the two measures. A reduction in PLV indicates less consistent phase relationships between EEG channels, whereas a reduction in NMI indicates weaker statistical dependence between their amplitude distributions under the adopted estimation procedure. Although both measures showed a similar direction of preference-related differences, their numerical values should not be directly compared because they quantify different signal properties. Furthermore, reduced functional connectivity should not automatically be interpreted as diminished cognitive engagement or impaired neural processing. As emphasized in the functional connectivity literature, connectivity estimates describe statistical relationships between recorded signals and may be influenced by methodological factors, including common-source effects and volume conduction [14,15]. Therefore, the observed PLV and NMI differences should be interpreted as preference-associated changes in EEG signal relationships rather than direct evidence of anatomical or causal interactions between brain regions.
However, these widespread reductions should not be interpreted as evidence of a general decline in neural activity. PLV and NMI quantify the relationships between EEG signals rather than the magnitude of local neural activation [13,14,15,16]. Lower connectivity may therefore reflect altered coordination or differentiation among distributed neural processes during product evaluation. This network-level perspective complements much of the previous EEG neuromarketing literature, which has predominantly relied on spectral, time–frequency, asymmetry, event-related, and other local EEG measures for consumer-preference analysis [1,3,27]. The systematic review by Byrne et al. examined 174 EEG neuromarketing studies and reported considerable variability in the EEG measures and analytical approaches used to characterize consumer preference and purchase-related behavior [27]. Accordingly, the present results support examining distributed functional relationships as an additional dimension of consumer-related EEG activity rather than interpreting preference solely through changes at individual electrodes or regions.
The relevance of a network-level representation is also supported by previous work using the NeuMa paradigm. Georgiadis et al. represented EEG trials from the NeuMa dataset using sample covariance matrices (SCMs), which encode multichannel relationships, and analyzed these representations using Riemannian alignment and a deep-learning-based model [19]. Their findings demonstrated that multivariate inter channel EEG representations can contribute to preferred/non-preferred discrimination. Moreover, Kyrou et al. examined functional connectivity states in the NeuMa dataset and reported associations between distributed EEG connectivity patterns and consumer-related personality characteristics [22]. Although these studies addressed research questions different from the direct preferred/non-preferred connectivity comparison performed here, they provide complementary evidence that consumer-related information in the NeuMa paradigm can be represented through relationships among EEG channels rather than solely through isolated channel activity.
A particularly notable finding of the present study was the prominence of the delta band. NMI identified FDR-significant differences in all 171 delta-band connections and showed its largest median absolute effect size in this frequency range. Delta connectivity also dominated the feature-stability results. Among the top 20 stable NMI features illustrated in Figure 8, 15 were delta-band connections, and the fused representation was similarly dominated by delta-band NMI features. Nevertheless, this finding should be interpreted cautiously. Previous EEG research has associated delta oscillatory activity with motivational processes, attention, and salience-related processing [28]. However, these previous findings primarily concern delta-band activity or oscillatory responses and should not be interpreted as direct evidence for the functional-connectivity patterns observed in the present study. Scalp-recorded low-frequency EEG may also be influenced by methodological and physiological factors. Therefore, the present findings do not establish a specific cognitive mechanism for delta connectivity; rather, they identify low-frequency inter channel relationships as particularly prominent components of the statistical and feature-stability results in the present consumer-preference paradigm.
The machine-learning results provide a complementary perspective to the statistical findings. Under stratified 10-fold cross-validation, the highest balanced accuracy was obtained with PLV and Naive Bayes (0.699), and the same balanced accuracy was retained under subject-independent LOSO validation. NMI with Naive Bayes achieved balanced accuracies of 0.684 and 0.690 under stratified 10-fold and LOSO validation, respectively. Thus, despite the more extensive statistical differences observed for NMI, this did not translate into systematically superior predictive performance. This distinction is important because statistical separability and classification utility address different properties of the data: a connectivity feature may exhibit a consistent group-level difference without necessarily providing optimal discrimination of individual product-level observations.
Previous studies using the NeuMa dataset have investigated consumer-related EEG information using different signal representations, analytical approaches, and validation strategies. Table 6 provides a dataset-specific comparison of these EEG-based studies. Although all studies included in the table used the NeuMa dataset, direct numerical comparisons should be interpreted cautiously because they differ in their analytical objectives, EEG representations, input modalities, class-balancing procedures, feature-selection strategies, validation protocols, and reported performance metrics.
Table 6.
Methodological comparison of EEG-based studies using the NeuMa dataset.
Within this dataset-specific comparison, Usman et al. combined EEG and eye-tracking data with handcrafted and deep-learning features for multimodal consumer-choice prediction [20], whereas Kyrou et al. investigated amplitude-envelope-based functional connectivity and identified connectivity states associated with consumer-related personality traits [22]. These studies illustrate the diversity of analytical objectives and EEG representations that have been investigated within the NeuMa dataset. A particularly relevant methodological comparison is provided by our previous study, which also investigated connectivity-based consumer-preference prediction using the NeuMa dataset [21]. That study extracted PLV, coherence, and mutual-information features and evaluated these representations using SVM, KNN, Random Forest, and ANN classifiers. The highest reported accuracy was 89.93%, obtained with Random Forest using combined connectivity features [21]. However, direct numerical comparison with the present results should be made cautiously because the two studies differ in feature construction, feature-selection procedures, performance criteria, and analytical objectives. The present study extends connectivity-based preference analysis by examining frequency-specific PLV and NMI at three complementary levels: subject-level statistical differences, predictive performance, and feature-selection stability.
The behavior of the individual classifiers further illustrates why conventional accuracy alone can be misleading in the present dataset. Random Forest produced the highest conventional accuracy for several feature representations but showed comparatively low recall for the preferred-product class. Conversely, KNN achieved high preferred-class recall but substantially lower specificity. Naive Bayes provided a more balanced trade-off between sensitivity and specificity, resulting in the highest balanced accuracy. The similarity of its PLV-based performance under stratified 10-fold and LOSO validation is particularly relevant because the latter excludes all observations from the held-out participant during model development. Therefore, the LOSO results provide stronger evidence that the selected connectivity representation contains predictive information applicable to previously unseen participants within the NeuMa dataset, although external validation on an independent dataset remains necessary.
Feature-level fusion did not improve predictive performance. The highest balanced accuracies obtained using fused PLV+NMI features were 0.675 under stratified 10-fold validation and 0.677 under LOSO validation, both below the 0.699 obtained with PLV alone. Although PLV and NMI characterize different aspects of inter channel EEG relationships, their combination did not yield additional discriminative benefit within the present classification framework. PLV and NMI may contain partially overlapping information about inter channel statistical dependence, while fusion increased the initial feature dimensionality from 855 to 1710 before feature selection. The enlarged feature space may have introduced additional complexity into feature selection without providing sufficiently complementary information to improve classification performance. However, this explanation remains hypothetical because redundancy between PLV and NMI features was not directly quantified. More structured fusion strategies, including decision-level integration or representation-learning approaches, could therefore be investigated in future studies.
Interestingly, the feature-stability analysis produced a different picture from predictive performance. Whereas PLV yielded the highest balanced accuracy, NMI-derived features dominated the fused stability ranking. All ten highest-ranked fused features reported in Table 5 were NMI-derived and belonged to the delta band, while 18 of the 20 highest-ranked fused features illustrated in Figure 8 originated from NMI. This result should not be interpreted as evidence that NMI was the superior predictor. Rather, it indicates that NMI contained features that were selected more consistently by LASSO across changes in the training data and validation strategy. PLV, by contrast, exhibited a more distributed stability profile across delta, theta, alpha, and beta bands. The dissociation between predictive performance and selection stability reinforces the value of assessing feature-selection stability in addition to aggregate classification metrics, particularly in high-dimensional applications where feature subsets can vary across data partitions [23].
The study nevertheless has several limitations. First, the analysis was based on the publicly available NeuMa dataset, comprising 42 participants [19]. This dataset was selected because it provides EEG recordings associated with product-level purchase decisions, enabling a systematic investigation of preference-related functional connectivity. Although multiple product-level observations were available for each participant, these observations do not represent independent individuals. Consequently, the relatively limited number of participants may restrict the generalizability of the findings. To partially address this limitation, subject-independent leave-one-subject-out (LOSO) validation was employed alongside stratified 10-fold cross-validation. Nevertheless, LOSO validation within a single dataset cannot replace external validation, and larger independent cohorts are required to establish the robustness and generalizability of the identified connectivity patterns. Second, the preference classes were substantially imbalanced, which influenced classifier behavior and produced clear trade-offs between sensitivity and specificity. Class-frequency-based misclassification costs were used for the supported classifiers, and multiple class-sensitive performance measures were reported; nevertheless, larger and more balanced datasets would provide more reliable estimates of predictive performance. Third, scalp-level EEG connectivity can be affected by volume conduction and common-source effects, and phase-based connectivity measures such as PLV require careful interpretation in this context [15]. Consequently, the observed channel-pair relationships should not be interpreted as direct anatomical interactions between cortical regions.
A further limitation concerns NMI estimation. Continuous band-limited EEG amplitudes were discretized into four quantile-based bins before mutual-information estimation. Although this provided a standardized and computationally tractable representation, MI-based estimates can be influenced by the estimation procedure and the amount of data available. Product-related EEG intervals also varied according to participants’ viewing behavior. The exclusion of intervals shorter than 0.50 s ensured a minimum duration for connectivity estimation, but averaging multiple intervals into one product-level representation may obscure dynamic changes occurring during different stages of product evaluation. These considerations are particularly relevant to the interpretation of the prominent delta-band findings and should be examined systematically in future work.
Future studies should therefore validate the present connectivity patterns in larger independent cohorts and determine whether the stable connections generalize across product categories, experimental paradigms, participant populations, and EEG acquisition systems. Connectivity measures designed to reduce sensitivity to volume conduction, source-space analysis, and dynamic functional-connectivity approaches could provide more physiologically specific descriptions of preference-related network organization [15]. Multimodal integration with eye tracking or behavioral measures may also improve predictive performance, as suggested by recent multimodal consumer-choice studies [20], but such gains should be evaluated under subject-independent and leakage-controlled validation. Finally, the stable connections identified here could support the development of lower-dimensional and more interpretable consumer-neuroscience models in which feature-selection stability is considered alongside predictive performance.
5. Conclusions
This study investigated EEG functional connectivity for consumer preference prediction using PLV and NMI across five frequency bands through an integrated analytical framework encompassing subject-level statistical analysis, LASSO-based feature selection, machine-learning classification, and feature-stability assessment. Preferred-product viewing was associated with widespread reductions in functional connectivity for both PLV and NMI, with NMI showing particularly extensive differences in the delta band.
PLV and NMI provided broadly comparable predictive performance, although PLV combined with Naive Bayes achieved the highest balanced accuracy of 0.699 under both stratified 10-fold and subject-independent LOSO validation. Early feature-level fusion of PLV and NMI did not improve the highest balanced accuracy achieved using PLV alone. In contrast, feature-stability analysis revealed that NMI-derived features dominated the fused stability ranking: all ten highest-ranked features reported in Table 5 were NMI-derived and belonged to the delta band, while 18 of the 20 highest-ranked features illustrated in Figure 8 originated from NMI. Thus, greater feature-selection stability did not necessarily translate into higher predictive performance.
Overall, the findings indicate that statistical sensitivity, predictive utility, and feature-selection stability capture complementary aspects of EEG functional connectivity associated with consumer preference. The convergence of the statistical and stability findings further identifies low-frequency, particularly delta-band, connectivity as an important target for future investigation. However, validation in larger and independent cohorts is required to determine the generalizability of these connectivity patterns. Future studies incorporating dynamic or source-space connectivity, connectivity measures less sensitive to volume conduction, and multimodal information may further clarify the neural network characteristics associated with consumer decision-making.
Author Contributions
Conceptualization, E.D.; methodology, E.D. and N.İ.; software, E.D.; validation, E.D.; formal analysis, E.D. and N.İ.; investigation, E.D.; data curation, E.D.; writing—original draft preparation, E.D. and N.İ.; writing—review and editing, E.D. and N.İ.; visualization, E.D.; supervision, E.D.; project administration, E.D. All authors have read and agreed to the published version of the manuscript.
Funding
This research received no external funding.
Institutional Review Board Statement
Ethical review and approval were waived for this study because it involved secondary analysis of a publicly available, previously collected dataset, and no new data were collected from human participants in the present study.
Informed Consent Statement
Not applicable. This study involved secondary analysis of a publicly available dataset, and no new participants were recruited or directly involved in the present study.
Data Availability Statement
The data analyzed in this study are publicly available in the NeuMa dataset described by Georgiadis et al. [19]. No new primary data were collected in the present study.
Acknowledgments
The authors acknowledge the creators of the NeuMa dataset for making the data publicly available. During the preparation of this manuscript, the authors used ChatGPT (GPT-6, OpenAI) for assistance with the preparation of Figure 1 and language editing of the manuscript. The authors reviewed and edited the output and take full responsibility for the content of this publication.
Conflicts of Interest
The authors declare no conflicts of interest.
References
- Khondakar, M.F.K.; Sarowar, M.H.; Chowdhury, M.H.; Majumder, S.; Hossain, M.A.; Dewan, M.A.A.; Hossain, Q.D. A Systematic Review on EEG-Based Neuromarketing: Recent Trends and Analyzing Techniques. Brain Inform. 2024, 11, 17. [Google Scholar] [CrossRef] [Scilit] [PubMed]
- Morin, C. Neuromarketing: The New Science of Consumer Behavior. Society 2011, 48, 131–135. [Google Scholar] [CrossRef] [Scilit]
- Khurana, V.; Gahalawat, M.; Kumar, P.; Roy, P.P.; Dogra, D.P.; Scheme, E.; Soleymani, M. A Survey on Neuromarketing Using EEG Signals. IEEE Trans. Cogn. Dev. Syst. 2021, 13, 732–749. [Google Scholar] [CrossRef] [Scilit]
- Casado-Aranda, L.-A.; Sánchez-Fernández, J. Advances in Neuroscience and Marketing: Analyzing Tool Possibilities and Research Opportunities. Span. J. Mark.-ESIC 2022, 26, 3–22. [Google Scholar] [CrossRef] [Scilit]
- Smidts, A. Kijken in Het Brein: Over de Mogelijkheden van Neuromarketing; ERIM Inaugural Lectures; Erasmus Research Institute of Management, Erasmus University Rotterdam: Rotterdam, The Netherlands, 2002; ISBN 978-90-5892-036-2. [Google Scholar]
- Alsharif, A.H.; Md Salleh, N.Z.; Abdullah, M.; Khraiwish, A.; Ashaari, A. Neuromarketing Tools Used in the Marketing Mix: A Systematic Literature and Future Research Agenda. SAGE Open 2023, 13, 21582440231156563. [Google Scholar] [CrossRef] [Scilit]
- Kajla, T.; Raj, S.; Kansra, P.; Gupta, S.L.; Singh, N. Neuromarketing and Consumer Behavior: A Bibliometric Analysis. J. Consum. Behav. 2024, 23, 959–975. [Google Scholar] [CrossRef] [Scilit]
- Saffari, F.; Zarei, S.; Kakaria, S.; Bigné, E.; Bruni, L.E.; Ramsøy, T.Z. The Role of Stimuli-Driven and Goal-Driven Attention in Shopping Decision-Making Behaviors—An EEG and VR Study. Brain Sci. 2023, 13, 928. [Google Scholar] [CrossRef] [Scilit] [PubMed]
- Aldayel, M.; Ykhlef, M.; Al-Nafjan, A. Recognition of Consumer Preference by Analysis and Classification EEG Signals. Front. Hum. Neurosci. 2020, 14, 604639. [Google Scholar] [CrossRef] [Scilit] [PubMed]
- Georgiadis, K.; Kalaganis, F.P.; Nikolopoulos, S.; Kompatsiaris, I. RNeuMark: A Riemannian EEG Analysis Framework for Neuromarketing. Brain Inform. 2022, 9, 14. [Google Scholar] [CrossRef] [Scilit] [PubMed]
- Al-Nafjan, A. Feature Selection of EEG Signals in Neuromarketing. PeerJ Comput. Sci. 2022, 8, e944. [Google Scholar] [CrossRef] [Scilit] [PubMed]
- Bassett, D.S.; Sporns, O. Network Neuroscience. Nat. Neurosci. 2017, 20, 353–364. [Google Scholar] [CrossRef] [Scilit] [PubMed]
- Sakkalis, V. Review of Advanced Techniques for the Estimation of Brain Connectivity Measured with EEG/MEG. Comput. Biol. Med. 2011, 41, 1110–1117. [Google Scholar] [CrossRef] [Scilit] [PubMed]
- Lachaux, J.-P.; Rodriguez, E.; Martinerie, J.; Varela, F.J. Measuring Phase Synchrony in Brain Signals. Hum. Brain Mapp. 1999, 8, 194–208. [Google Scholar] [CrossRef] [Scilit]
- Bastos, A.M.; Schoffelen, J.-M. A Tutorial Review of Functional Connectivity Analysis Methods and Their Interpretational Pitfalls. Front. Syst. Neurosci. 2016, 9, 175. [Google Scholar] [CrossRef] [Scilit] [PubMed]
- Ibáñez-Molina, A.J.; Soriano, M.F.; Iglesias-Parro, S. Mutual Information of Multiple Rhythms for EEG Signals. Front. Neurosci. 2020, 14, 574796. [Google Scholar] [CrossRef] [Scilit] [PubMed]
- Khushaba, R.N.; Wise, C.; Kodagoda, S.; Louviere, J.; Kahn, B.E.; Townsend, C. Consumer Neuroscience: Assessing the Brain Response to Marketing Stimuli Using Electroencephalogram (EEG) and Eye Tracking. Expert Syst. Appl. 2013, 40, 3803–3812. [Google Scholar] [CrossRef] [Scilit]
- Babiloni, F.; Cincotti, F.; Mattia, D.; Mattiocco, M.; Bufalari, S.; De Vico Fallani, F.; Tocci, A.; Bianchi, L.; Marciani, M.G.; Meroni, V.; et al. Neural Basis for the Brain Responses to the Marketing Messages: An High Resolution EEG Study. In Proceedings of the 28th Annual International Conference of the IEEE Engineering in Medicine and Biology Society, New York, NY, USA, 30 August–3 September 2006; pp. 3676–3679. [Google Scholar] [CrossRef] [Scilit] [PubMed]
- Georgiadis, K.; Kalaganis, F.P.; Riskos, K.; Matta, E.; Oikonomou, V.P.; Yfantidou, I.; Chantziaras, D.; Pantouvakis, K.; Nikolopoulos, S.; Laskaris, N.A.; et al. NeuMa—The Absolute Neuromarketing Dataset en Route to an Holistic Understanding of Consumer Behaviour. Sci. Data 2023, 10, 508. [Google Scholar] [CrossRef] [Scilit] [PubMed]
- Usman, S.M.; Khalid, S.; Tanveer, A.; Imran, A.S.; Zubair, M. Multimodal Consumer Choice Prediction Using EEG Signals and Eye Tracking. Front. Comput. Neurosci. 2025, 18, 1516440. [Google Scholar] [CrossRef] [Scilit] [PubMed]
- İlhan, N.; Dağdevir, E. Nöropazarlama Araştırmaları için EEG Bağlantısallık Analizi ile Tüketici Karar Alma Tercihlerinin Belirlenmesi. Niğde Ömer Halisdemir Üniversitesi Mühendis. Bilim. Derg. 2026, 15, 1–10. [Google Scholar] [CrossRef] [Scilit]
- Kyrou, M.; Kalaganis, F.P.; Georgiadis, K.; Nikolopoulos, S.; Laskaris, N.A.; Kompatsiaris, I. Decoding Consumer Behavior: A Neuroscientific Exploration of Personality Traits through EEG Functional Connectivity. In Proceedings of the 32nd European Signal Processing Conference (EUSIPCO), Lyon, France, 26–30 August 2024; pp. 967–971. [Google Scholar] [CrossRef] [Scilit]
- Nogueira, S.; Sechidis, K.; Brown, G. On the Stability of Feature Selection Algorithms. J. Mach. Learn. Res. 2018, 18, 1–54. [Google Scholar]
- Benjamini, Y.; Hochberg, Y. Controlling the False Discovery Rate: A Practical and Powerful Approach to Multiple Testing. J. R. Stat. Soc. Ser. B 1995, 57, 289–300. [Google Scholar] [CrossRef] [Scilit]
- Kerby, D.S. The Simple Difference Formula: An Approach to Teaching Nonparametric Correlation. Compr. Psychol. 2014, 3, 11.IT.3.1. [Google Scholar] [CrossRef] [Scilit]
- Tibshirani, R. Regression Shrinkage and Selection via the Lasso. J. R. Stat. Soc. Ser. B 1996, 58, 267–288. [Google Scholar] [CrossRef] [Scilit]
- Byrne, A.; Bonfiglio, E.; Rigby, C.; Edelstyn, N. A Systematic Review of the Prediction of Consumer Preference Using EEG Measures and Machine-Learning in Neuromarketing Research. Brain Inform. 2022, 9, 27. [Google Scholar] [CrossRef] [Scilit] [PubMed]
- Knyazev, G.G. EEG Delta Oscillations as a Correlate of Basic Homeostatic and Motivational Processes. Neurosci. Biobehav. Rev. 2012, 36, 677–695. [Google Scholar] [CrossRef] [Scilit] [PubMed]

Disclaimer/Publisher’s Note: The statements, opinions and data contained in all publications are solely those of the individual author(s) and contributor(s) and not of MDPI and/or the editor(s). MDPI and/or the editor(s) disclaim responsibility for any injury to people or property resulting from any ideas, methods, instructions or products referred to in the content. |
© 2026 by the authors. Licensee MDPI, Basel, Switzerland. This article is an open access article distributed under the terms and conditions of the Creative Commons Attribution (CC BY) license.