Article

Validation of Downscaled and Bias-Corrected WorldClim 2.1– CRU-TS v4.09 Climate Dataset for Hydrological Modeling in a Semi-Arid Ecotonal Catchment of Central South Africa


Department of Civil Engineering, Central University of Technology, Bloemfontein 9301, South Africa
*
Author to whom correspondence should be addressed.
Hydrology 2026, 13(8), 206; https://doi.org/10.3390/hydrology13080206

Submission received: 18 June 2026 / Revised: 16 July 2026 / Accepted: 20 July 2026 / Published: 28 July 2026

Abstract

Reliable climate data are essential for hydroclimatic assessment and water-resources management in data-scarce regions. This study evaluated the performance of the WorldClim 2.1 historical weather dataset (WC2.1– CRU-TS v4.09), downscaled and bias-corrected from CRU-TS v4.0 using WorldClim 2.1 climatology, against observed meteorological records within the semi-arid C5 Secondary Drainage Region (C5 SDR; comprising the Riet and Modder River catchments) in central South Africa for the period 1950–2023. Precipitation, maximum temperature (TMAX), and minimum temperature (TMIN) were assessed using statistical performance evaluation metrics, scatter and residual analyses, Innovative Trend Analysis (ITA), Rescaled Adjusted Partial Sums (RAPS), and extreme-event evaluation based on the 95th-percentile threshold. The results showed strong agreement between observed and gridded precipitation records, with correlation coefficients ranging (R) from 0.78 to 0.90 and Nash–Sutcliffe Efficiency (NSE) values between 0.61 and 0.90. Temperature datasets exhibited similarly good performance, with TMAX showing stronger agreement than TMIN. ITA and RAPS analyses demonstrated that the dataset successfully reproduced long-term climatic trends, hydroclimatic regime shifts, and interannual variability observed in station records. Performance varied spatially, with the strongest agreement occurring at lower-elevation stations and comparatively lower performance at stations influenced by localized convective rainfall and topographic variability. Extreme-event analysis revealed that although the dataset effectively reproduced the timing and occurrence of high-rainfall years (R2 = 0.974–0.997), it systematically underestimated the magnitude of extreme precipitation events, with percent bias values ranging from −5.5% to −21.0%. In contrast, extreme temperature events were reproduced with very high accuracy and minimal bias. Overall, the WC2.1– CRU-TS v4.09 dataset provides a reliable climatic baseline for hydroclimatic assessments in the C5 SDR. However, caution is required when applying the dataset to analyses sensitive to localized precipitation extremes. The results provide confidence in the use of this dataset for climate characterization, drought assessment, hydrological modeling, ecosystem service evaluation, and future climate-change impact investigations in data-scarce semi-arid environments.

1. Introduction

Climate change is a major driver of global hydrological variability, influencing precipitation patterns, temperature regimes, evapotranspiration, and overall water availability [1,2,3,4,5]. Hydrological models are widely used to assess these impacts; however, their reliability is strongly dependent on the quality, consistency, and spatial resolution of input climate data [6]. Most global climate datasets are available at coarse spatial resolutions, limiting their capacity to represent local-scale variability, particularly in heterogeneous and data-scarce regions. Consequently, downscaling and bias correction techniques have become essential tools for transforming coarse-resolution climate data into locally relevant inputs for hydrological applications [7,8].
Among widely used datasets, the Climatic Research Unit Time Series (CRU-TS) provides long-term, globally consistent monthly climate variables [9]. In contrast, the WorldClim dataset offers high-resolution climatological surfaces derived from station observations and physiographic variables [10]. These datasets are frequently combined through statistical downscaling approaches to generate high-resolution climate time series suitable for environmental and hydrological modeling [9,10]. Although such approaches enhance spatial detail, they may introduce uncertainties and biases inherited from the original datasets or from the downscaling process itself, necessitating careful validation before application [9,11,12].
Globally, numerous studies have evaluated the performance of downscaled and bias-corrected climate datasets for hydrological modeling [7,13]. Recent research (2021–2025) demonstrates that techniques such as quantile mapping and delta-based downscaling significantly improve the representation of precipitation and temperature [6]; however, their performance varies across climatic regions and requires site-specific validation [11,14,15]. These uncertainties are particularly critical in semi-arid environments, where hydrological responses are highly sensitive to small variations in climatic inputs [16].
In Africa, the challenge is intensified by limited and unevenly distributed meteorological observations [17]. Several studies have emphasized that gridded and downscaled climate datasets must be validated against observed station data prior to their use in hydrological modeling [18,19,20]. Evaluations across African basins have demonstrated that dataset performance varies substantially among climatic regions, elevation zones and observational network densities, underscoring the need for localized validation prior to hydrological application [20,21,22,23].
In South Africa, water resources are particularly vulnerable due to the predominantly semi-arid climate, pronounced interannual rainfall variability, and an increasing frequency of droughts [24,25]. The country receives relatively low annual rainfall, making hydrological systems highly sensitive to climatic fluctuations. Recent studies indicate that projected increases in temperature and potential declines in precipitation may further exacerbate water scarcity and reduce water yield in many regions of Southern Africa [25,26]. These conditions underscore the importance of accurate and spatially representative climate inputs for hydrological modeling and water resource management. Hydrological models, such as process-based and ecosystem service models, are highly sensitive to input climate data. For instance, the Integrated Valuation of Ecosystem Services and Tradeoffs (InVEST) seasonal and annual water yield models rely heavily on accurate precipitation and evapotranspiration inputs to estimate spatial water yield [27]. In semi-arid catchments, even small biases in rainfall can lead to large deviations in modeled outputs due to the nonlinear response of hydrological processes [28]. Therefore, evaluating the performance of downscaled and bias-corrected climate datasets using statistical performance evaluation metrics such as coefficient of determination (R2), root mean square error (RMSE), Nash–Sutcliffe efficiency (NSE), and percent bias (PBIAS) is essential to ensure model robustness and credibility [29,30].
At the regional scale, central South Africa, particularly the Free State Province, encompasses semi-arid catchments such as the Modder and Riet River systems within the C5 Secondary Drainage Region (SDR) (Upper Orange) hydrological region. These catchments are characterized by strong summer rainfall seasonality, high potential evapotranspiration rates, and limited surface- and groundwater availability, making them highly sensitive to climate variability [31]. As a result, the Modder–Riet system has increasingly been used as a representative case study for hydrological modeling and climate-change impact assessments in water-scarce environments [32,33]. Although numerous studies in South Africa have employed downscaled climate data and hydrological models such as SWAT to assess hydrological responses and climate-change impacts, these investigations have largely focused on historical impact analysis, with comparatively limited emphasis on rigorous validation of historical downscaled datasets against observed station data [34,35,36,37]. This limitation is further highlighted by flood-hydrology studies in South Africa, which demonstrate that design rainfall estimates, including those linked to critical storm durations, are frequently applied despite substantial uncertainties related to rainfall measurement, storm duration representation, and spatial variability, often without systematic verification against observed rainfall records [38].
Although numerous gridded climate datasets are currently available, their performance varies considerably across regions because of differences in climate regimes, topography, observational network density, interpolation techniques, and bias-correction procedures. Consequently, regional validation is essential before these datasets are applied in hydrological, ecological, and climate impact assessments [9,18,39]. This requirement is particularly important in semi-arid, data-scarce environments, where limited meteorological observations increase uncertainty in climate inputs and subsequently affect environmental modeling results [40].
The Climatic Research Unit Time Series (CRU-TS) dataset is among the most widely used gridded climate products for climatological and hydrological studies worldwide. Previous evaluations have demonstrated its ability to represent long-term spatial and temporal climate variability across diverse climatic regions and applications [9]. However, although CRU-TS datasets have been extensively evaluated and applied globally [41,42,43,44], the performance of the recently released WorldClim 2.1 historical weather dataset (WC2.1–CRU-TS v4.09), which is statistically downscaled and bias-corrected from CRU-TS v4.09 using WorldClim 2.1 climatology [45], remains insufficiently documented globally, especially for semi-arid regions, including Southern Africa and the C5 Secondary Drainage Region (SDR).
Despite the growing use of WC2.1– CRU-TS v4.09 datasets in hydroclimatic research, comprehensive validation against ground-based observations in semi-arid ecotonal environments remains limited. To the best of our knowledge, no published study has specifically assessed its suitability for hydrological applications within the C5 SDR (Riet–Modder system) of central South Africa. Existing studies either validate climate model outputs against gridded datasets such as CRU-TS rather than ground-based observations [46], or apply downscaled datasets without rigorous validation against long-term observational records at the catchment scale. Given the well-documented sensitivity of semi-arid hydrological systems to uncertainties in climate inputs, where even small biases in precipitation and temperature can propagate non-linearly into significant errors in simulated runoff, evapotranspiration, and water balance components [47,48,49], rigorous regional evaluation of climate datasets remains essential. To address this gap, the present study comprehensively evaluates the WC2.1– CRU-TS v4.09 dataset by assessing its temporal variability, long-term trends, cumulative climatic anomalies, extreme events, and statistical performance across the C5 SDR catchment of central South Africa.
In contrast to previous validation studies that rely primarily on conventional statistical indicators, this study adopts a more comprehensive framework by integrating Innovative Trend Analysis (ITA), Rescaled Adjusted Partial Sums (RAPS), and extreme-event diagnostics. Although conventional statistical metrics such as the coefficient of determination (R2), Nash–Sutcliffe efficiency (NSE), root mean square error (RMSE), mean absolute error (MAE), and percent bias (PBIAS) are widely used to quantify the agreement, accuracy, and systematic bias between observed and gridded climate datasets [49,50], they provide limited information on whether a dataset preserves long-term temporal trends, hydroclimatic regime shifts, cumulative climatic anomalies, and the representation of climatic extremes. Therefore, ITA [51,52] and RAPS [50,53] were incorporated as complementary methods to evaluate trend behavior across different magnitudes of the climate distribution and to identify cumulative climatic anomalies and regime shifts. Together with extreme-event diagnostics based on the 95th_percentile, these complementary approaches provide a more comprehensive assessment of dataset reliability by evaluating not only statistical agreement but also the preservation of long-term hydroclimatic behavior that is essential for reliable hydrological modeling in highly variable semi-arid environments. Such an integrated evaluation is particularly important in semi-arid ecotonal environments, where high climatic variability and non-stationary hydroclimatic processes can strongly influence hydrological responses [49]. The findings are expected to improve confidence in the application of WC2.1– CRU-TS v4.09 climate datasets and provide a robust climatic baseline for future hydrological modeling, climate-change impact assessment, and water-resources management in data-scarce semi-arid regions.
Therefore, the primary objective of this study was to validate the reliability of the WC2.1– CRU-TS v4.09 climate time series against observed meteorological records within the semi-arid C5 Secondary Drainage Region (C5 SDR) of central South Africa. The evaluation encompassed precipitation and temperature using conventional statistical performance metrics and complementary diagnostic analyses, including time-series comparison, scatterplot evaluation, residual analysis, ITA, RAPS, and 95th-percentile extreme-event analysis, thereby assessing statistical agreement, temporal variability, long-term trend consistency, cumulative climatic anomalies, and the representation of extreme precipitation to provide a comprehensive evaluation of the dataset’s suitability for hydrological and climate-impact applications.

2. Materials and Methods

2.1. Description of Study Area

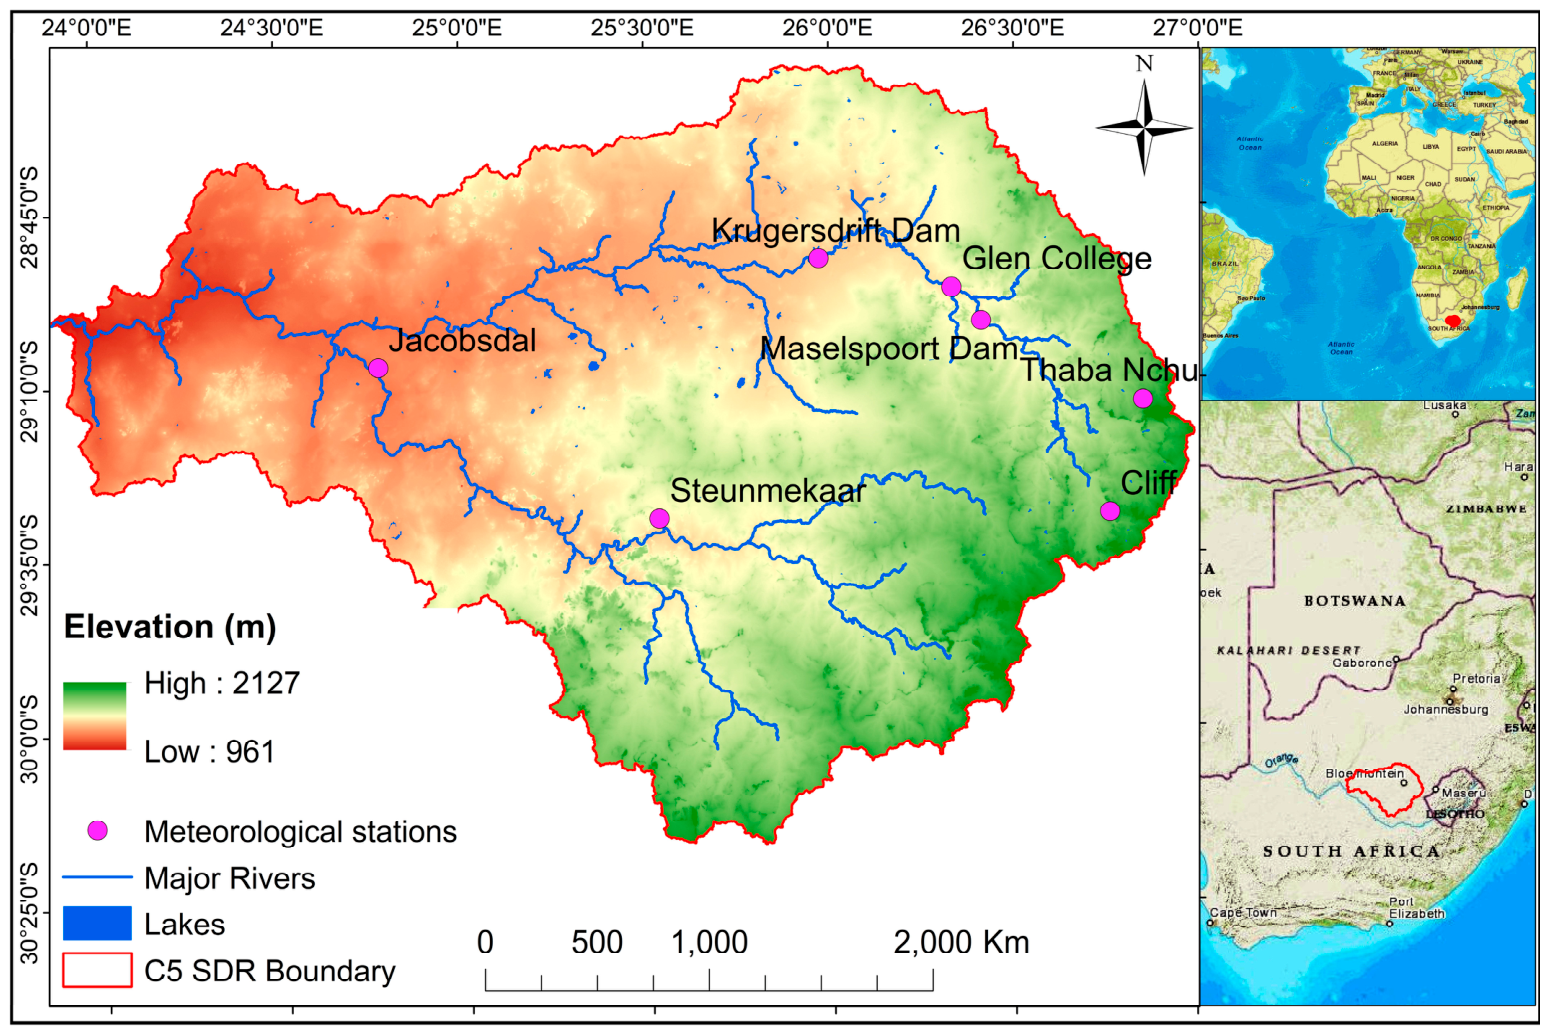
This study was conducted in a semi-arid ecotonal region of central South Africa, located within the Free State Province and covering approximately 35,570 km2 (Figure 1). The study area corresponds to the C5 SDR, which forms part of Primary Drainage Region C [54]. Geographically, the catchment extends between approximately 28–30° S latitude and 24–27° E longitude. The catchment boundary was delineated using a 30 m spatial resolution Digital Elevation Model (DEM) acquired from the United States Geological Survey (USGS) EarthExplorer platform [55]. The delineation process was executed using the watershed delineation workflow implemented in QGIS v3.34.8, including depression filling, flow-direction, flow-accumulation, stream-network generation, outlet definition, and watershed extraction [56].
Hydrologically, South Africa is subdivided into 22 primary drainage regions and 148 secondary drainage regions [57]. The C5 SDR encompasses the Riet (C51) and Modder (C52) River systems, both of which form integral tributaries of the Orange–Vaal River system. These river basins are further divided into 23 quaternary catchments that collectively contribute surface runoff to the regional drainage network [54].
Ecologically, the C5 SDR is situated within a transitional ecotone separating the Grassland and Eastern Nama Karoo biomes [58]. Beyond its biophysical setting, the region functions as a representative natural laboratory for examining coupled hydro-climatic and eco-environmental processes under semi-arid and data-limited conditions. The western sections of the catchment are predominantly semi-arid, receiving a mean annual rainfall of approximately 275 mm [54]. These areas are characterized by shallow stony soils and vegetation dominated by drought-resistant grasses such as Themeda triandra and Eragrostis species, together with dwarf shrub communities including Pentzia incana and Eriocephalus species. In contrast, the eastern section falls within the Grassland biome, where mean annual precipitation exceeds 500 mm and supports continuous grass cover dominated by T. triandra, Tristachya leucothrix, and Eragrostis curvula [59]. Woody vegetation is generally confined to drainage lines and riparian zones. Owing to its ecological transition characteristics, the region is highly sensitive to climatic variability and land-use change, both of which may significantly alter vegetation dynamics and ecosystem-service provision [60,61].
The climate of the C5 SDR catchment is predominantly semi-arid and exhibits substantial spatial and seasonal variability. Mean annual precipitation (MAP) ranges from approximately 275 mm in the western low-lying regions to more than 686 mm in the eastern uplands, with a basin-wide average of nearly 424 mm [54,62]. Rainfall is strongly seasonal and occurs mainly during the austral summer months (September–April), with peak rainfall intensities typically observed in January and February. Conversely, the winter season (May–August) is generally dry. Temperature patterns also demonstrate considerable seasonal variability. Average maximum monthly temperatures range from approximately 18.1 °C during winter to 31.2 °C in summer, whereas average minimum monthly temperatures vary from about −1.3 °C in winter to 15.4 °C during summer [60].
Topographically, the region is characterized by gently undulating terrain with elevations ranging from approximately 961 m above mean sea level in the western parts to 2127 m in the eastern highlands (Figure 1). Slope gradients generally vary between 1.7% and 10.3%, contributing to spatial variability in hydrological and ecological processes across the basin.
The selected meteorological stations span a considerable elevation gradient across the C5 SDR catchment, ranging from 1133 m at Jacobsdal to 1535 m at Thaba Nchu (Figure 1 and Table S1). Station elevation was considered when interpreting spatial variations in validation performance, particularly for precipitation, owing to topographic influences on local rainfall patterns. Intermediate elevations include Krugersdrift Dam (1252 m), Glen College (1289 m), Steunmekaar (1292 m), Maselspoort Dam (1303 m), and Cliff (1474 m) (Figure 1 and Table S1). This elevation range reflects the physiographic heterogeneity of the catchment and contributes to spatial variations in precipitation and temperature through differences in atmospheric circulation, convective activity, and local topographic influences. Consequently, station elevation and associated microclimatic variability are expected to influence the performance of gridded climate datasets and should be considered when interpreting validation results.
For climatic monitoring, the catchment is supported by a network of 223 South African Weather Service (SAWS) daily rainfall stations, of which 185 are located within the C5 SDR, and 38 are situated in surrounding areas [54]. From the available rainfall stations, seven stations with long-term continuous rainfall records and high data completeness were selected for detailed analysis (Figure 1). The selected stations contained either no missing observations or only minimal data gaps, thereby ensuring temporal consistency, reliability, and robustness for climatic validation and hydroclimatic assessments. Together, the rainfall and hydrometric station networks establish a robust observational framework for climatic and hydrological investigations within the catchment.
Within this context, the Riet–Modder basin system offers a representative natural laboratory for examining coupled hydro-climatic and eco-environmental interactions under semi-arid, ecotonal, and data-scarce conditions. The region is characterized by low and highly variable rainfall, strong summer-dominant seasonality, and potential evapotranspiration that frequently exceeds precipitation [63]. In addition, the C5 SDR receives predominantly convective rainfall, with high-intensity precipitation events and frequent thunderstorm activity during the summer months [54]. Consequently, the study area provides a suitable benchmark environment for evaluating climate and hydrological datasets and processes in semi-arid transitional systems, with findings that are transferable to other climate-sensitive dryland regions.

2.2. Dataset Overview

The historical monthly weather dataset for the period 1950–2023 was obtained from the WC2.1– CRU-TS v4.09, which provides downscaled and bias-corrected versions of CRU-TS v4.09 [9]. The underlying climate data originates from CRU-TS v4.09, developed by the Climatic Research Unit (CRU), University of East Anglia, and were subsequently statistically downscaled and bias-corrected using WorldClim 2.1 climatology [10]. The processed monthly datasets were accessed directly from the WorldClim website https://worldclim.org/data/monthlywth.html (accessed on 5 January 2026).
WorldClim applies a high-resolution climatological baseline to correct systematic biases in CRU-TSv4.09 data and to spatially downscale the time series to finer resolutions, producing climate surfaces suitable for regional and catchment-scale analyses [45]. The datasets are provided in GeoTIFF format. The variables include average minimum temperature (°C), average maximum temperature (°C), and total precipitation (mm) [10,45].
Observed daily precipitation data were obtained from meteorological stations located within C5 SDR from the South African Weather Service (SAWS). From the available station network, only seven stations were selected based on three criteria: (i) continuous records spanning more than 30 years, (ii) data completeness exceeding 95% over the study period, and (iii) spatial representation of the principal hydroclimatic and elevation gradients across the C5 SDR catchment. Stations with more than 5% missing observations or major discontinuities were excluded to ensure reliable long-term comparison with the gridded climate dataset. The retained stations contained either complete records or less than 5% missing observations. Because the limited missing data did not affect the calculation of annual climate variables, no data infilling was performed. Details of the selected meteorological stations are provided in Table S1.
Jacobsdal and Krugersdrift represent the drier western sector, Thaba Nchu and Glen College represent the relatively wetter eastern uplands, while Cliff and Steunmekaar represent transitional central zones influenced by localized convective rainfall (Figure 1). Together, the seven stations provide coverage of the principal rainfall gradients, elevation ranges, and ecotonal conditions within the C5 SDR, supporting assessment of both regional-scale and station-scale dataset performance.
The observed daily temperature data were collected from Glen College. This is because Glen College is the only meteorological station within the C5 SDR catchment providing sufficiently complete, continuous, and quality-controlled long-term temperature records suitable for comparison with the gridded climate dataset covering the study period. Other available stations either do not include temperature observations or contain substantial temporal gaps that preclude reliable long-term statistical validation. Consequently, Glen College represents the best available observational reference for evaluating the historical temperature performance of the WC2.1– CRU-TS v4.09 dataset within the study area. This limitation is acknowledged when interpreting the spatial representativeness of the temperature validation results.
The observation periods were generally consistent across the meteorological stations, except for Krugersdrift Dam (1951–2010), which had a shorter record because of data availability (Table S1). Validation statistics were calculated separately for each station using the full period of overlapping observed and gridded data available for that station.
Stations exhibiting extensive data gaps were excluded, while those with complete records or only minimal missing data (<5% of observations) were retained. The observed data underwent standard quality-control procedures, including consistency checks and screening for missing or anomalous values, prior to analysis.

2.3. Data Preprocessing and Temporal Aggregation

Following data acquisition, the observed and gridded climate datasets were standardized to a common annual temporal resolution to facilitate direct comparison. The observed meteorological records consisted of daily precipitation, maximum temperature (TMAX), and minimum temperature (TMIN) observations obtained from the selected SAWS stations. Following quality control, the observed daily meteorological records were processed in Microsoft Excel 365. Daily precipitation records were aggregated to annual precipitation totals by summing daily rainfall amounts, whereas annual maximum and minimum temperatures were calculated as the arithmetic mean of the corresponding daily observations for each calendar year. The WorldClim 2.1 downscaled and bias-corrected CRU-TS v4.09 historical dataset was available as monthly gridded precipitation, maximum temperature, and minimum temperature rasters. Monthly precipitation rasters were aggregated to annual precipitation totals, whereas monthly maximum and minimum temperature rasters were aggregated to annual mean TMAX and TMIN, respectively, using QGIS v3.34.8.
Spatially gridded climate data (GeoTIFF format) were processed using Geographic Information System (GIS) techniques in QGIS v3.34.8. Prior to extraction, the meteorological station coordinates were projected to the same coordinate reference system as the raster datasets to ensure accurate spatial correspondence. Annual climate values corresponding to each meteorological station were subsequently extracted using the nearest-neighbor sampling method, which preserves the original raster grid-cell values without introducing interpolation-induced smoothing. This procedure ensured direct and spatially consistent comparison between the observed station records and the WC2.1– CRU-TS v4.09 climate dataset. Consequently, both the observed and gridded datasets were standardized to a common annual temporal scale for all subsequent validation analyses.

2.4. Validation Methods

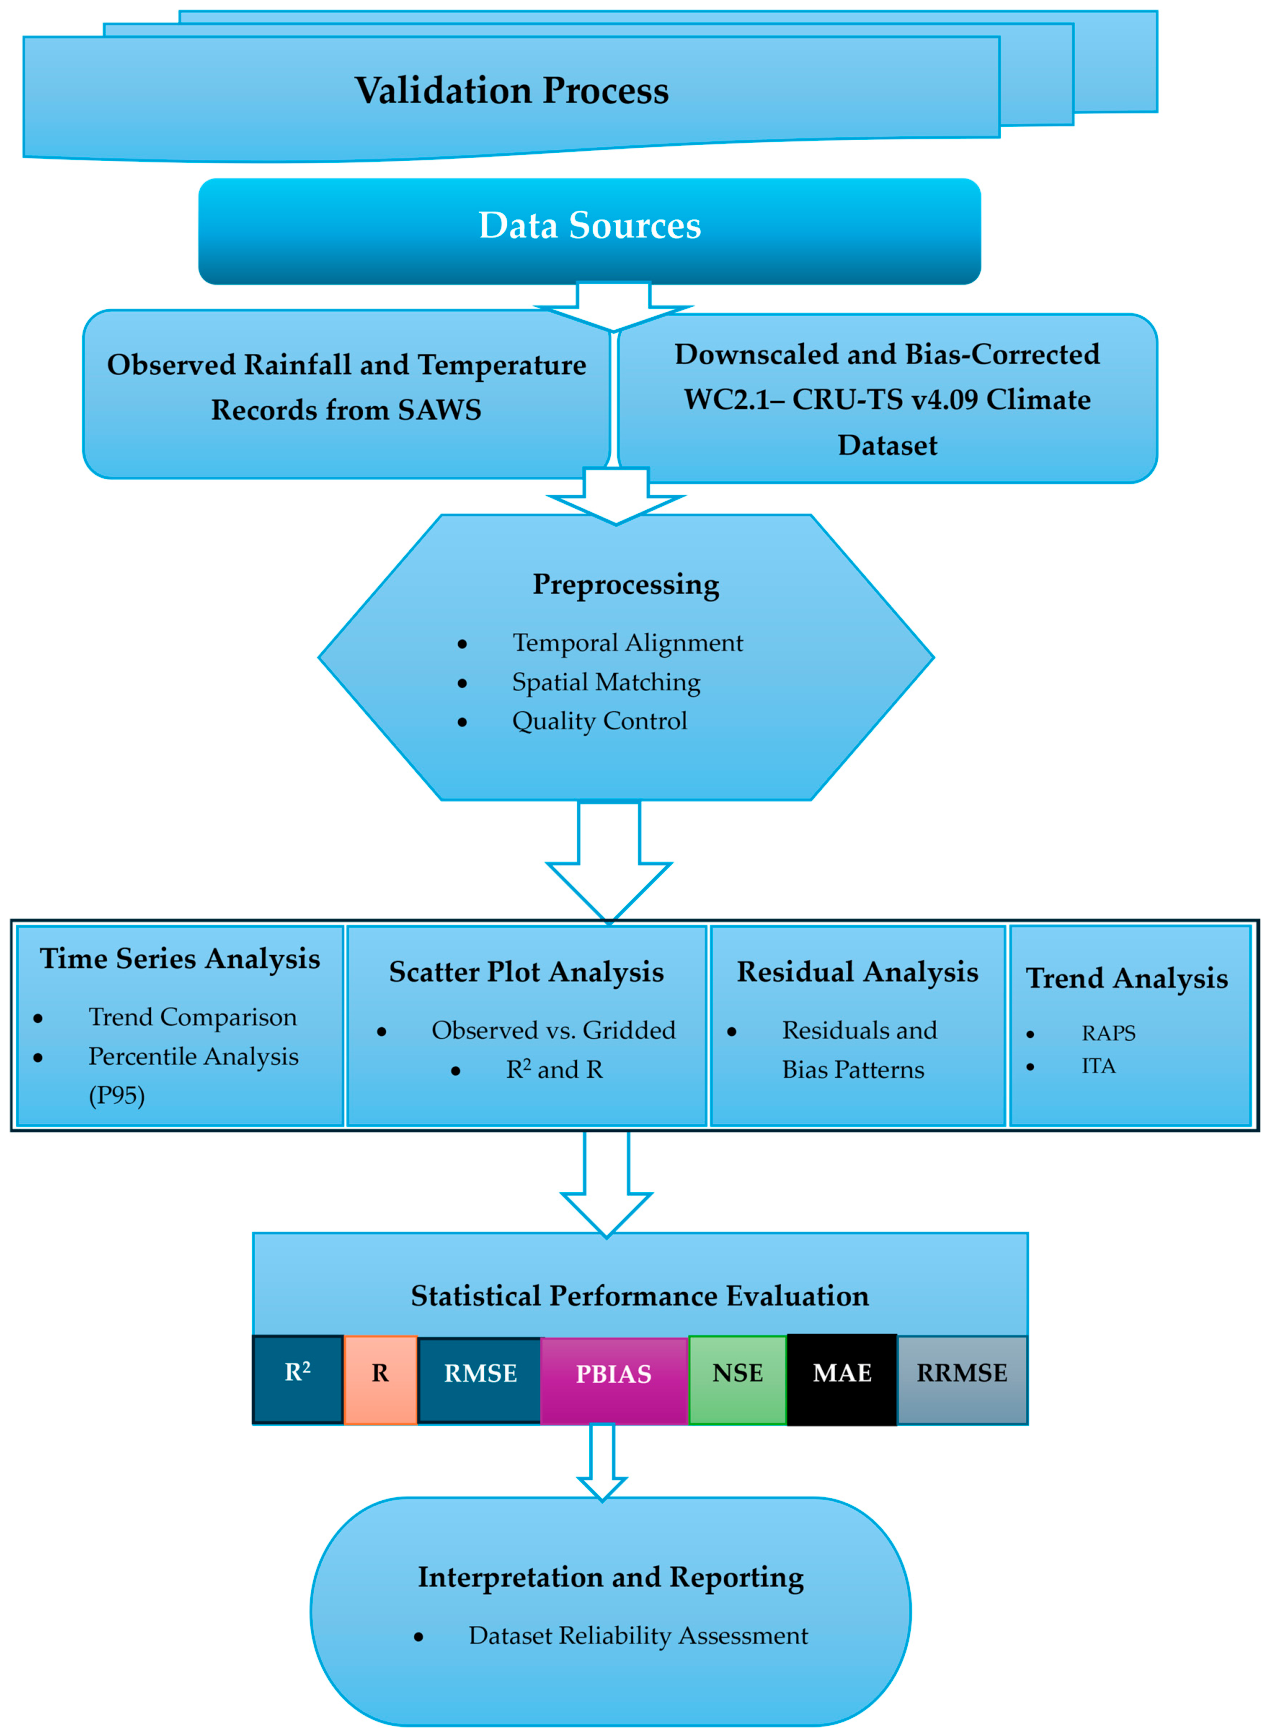
As illustrated in Figure 2, the validation framework combines complementary analytical approaches to evaluate multiple dimensions of climate dataset performance. It integrated time-series analysis, scatter-plot comparison, and residual diagnostics, trend analysis and statistical performance evaluations to comprehensively assess dataset performance. Time-series analysis was used to examine temporal consistency and trend agreement between observed and gridded precipitation and temperature across the study period. Scatter-plot analysis was applied to evaluate the strength of the relationship between observed and modeled precipitation and temperature values and to identify systematic deviations across different rainfall magnitudes. Residual analysis was conducted to quantify errors and reveal station-specific bias patterns, with particular attention to the behaviors of residuals under higher precipitation conditions.
The performance of the WC2.1– CRU-TS v4.09 dataset was quantified using widely applied statistical performance evaluation metrics including R2, Pearson correlation coefficient (R), RMSE, relative root mean square error (RRMSE), MAE, PBIAS, and NSE. These metrics measure agreement between observed and gridded climate data in terms of correlation, accuracy, bias, and predictive efficiency [49,64].
To complement the conventional statistical evaluation, ITA and RAPS were employed to assess the preservation of long-term climatic behavior [51,52,65]. While conventional performance metrics (R2, NSE, RMSE, MAE, and PBIAS) quantify the statistical agreement, accuracy, and bias between observed and gridded climate data, they do not evaluate whether the dataset preserves long-term temporal trends or changes across different segments of the climate distribution [66]. Therefore, ITA was applied as a complementary method because it detects trends without requiring assumptions of normality, serial independence, or monotonicity and enables separate assessment of trends in low-, intermediate-, and high-value observations [52]. In addition, RAPS was used to identify cumulative climatic anomalies and detect persistent shifts or regime changes in the climate series through cumulative deviations from the long-term mean [53,65].
Moreover, the 95th-percentile (P95) was included to complement conventional statistical metrics by evaluating the ability of the gridded dataset to capture the magnitude of extreme climatic conditions. Since hydrological processes are highly sensitive to extreme precipitation and temperature events, particularly in semi-arid catchments, assessing only average performance may overlook important biases in the distribution tails. The P95 therefore provides an additional measure of the dataset’s reliability for representing high-impact climate events that strongly influence runoff, evapotranspiration, drought severity, and flood generation [67].
Together, these statistical, diagnostic, and trend-analysis methods provide a comprehensive evaluation of dataset performance by assessing not only its statistical agreement, accuracy, and bias but also its ability to preserve long-term climatic variability and trend characteristics. This integrated assessment demonstrates the suitability of the dataset as a reliable climate-data source for regional hydroclimatic analyses and as a baseline dataset for hydrological and environmental modeling.
The mathematical formulations of the statistical performance evaluation metrics used in this study are presented below. The R2, which quantifies the strength of the linear relationship between observed and simulated values, is defined as follows:
R 2 = ( O i O - ) ( S i S - ) ( O i O - ) 2 ( S i S - ) 2 2
The R was used to assess the direction and strength of linear association:
R = ( O i O - ) ( S i S - ) ( O i O - ) 2 ( S i S - ) 2
The RMSE was used to quantify the magnitude of prediction errors:
R M S E = 1 n ( S i O i ) 2
The NSE was used to evaluate model predictive performance relative to observed mean values:
N S E = 1 ( S i O i ) 2 ( O i O - ) 2
According to commonly accepted hydrological performance criteria, NSE values greater than 0.75 indicate very good performance, values between 0.65 and 0.75 indicate good performance, values between 0.50 and 0.65 indicate satisfactory performance, and values below 0.50 indicate unsatisfactory performance [49]. These thresholds provide a practical benchmark for interpreting the reliability of the gridded climate dataset relative to observed station records.
The BIAS was used to assess systematic overestimation or underestimation:
P B I A S = 100 × ( S i O i ) O i
The MAE was used to measure the average magnitude of absolute errors:
M A E = 1 n S i O i
The RRMSE was calculated to express prediction error relative to the observed mean:
R R M S E = R M S E O - × 100
where O i represents observed values, S i represents WC2.1– CRU-TS v4.09 values, O -   and S -   are the mean observed and simulated values, respectively, and n is the number of observations.
To further investigate rainfall variability, trend characteristics, and hydroclimatic extremes, the RAPS, ITA, and 95th-percentile extreme rainfall threshold methods were additionally applied.
The RAPS method was used to detect temporal fluctuations, wet and dry periods, and abrupt changes in rainfall variability. The RAPS statistics were computed as:
R A P S k = t = 1 k ( Y t Y - ) S y
where
R A P S k = cumulative rescaled adjusted partial sum up to time k ;
Y t = rainfall value at time t ;
Y - = long-term mean rainfall;
S y = standard deviation of the rainfall series.
Positive RAPS values indicate wetter-than-average conditions, whereas negative values indicate drier-than-average conditions. Abrupt changes in slope were interpreted as possible hydroclimatic shifts.
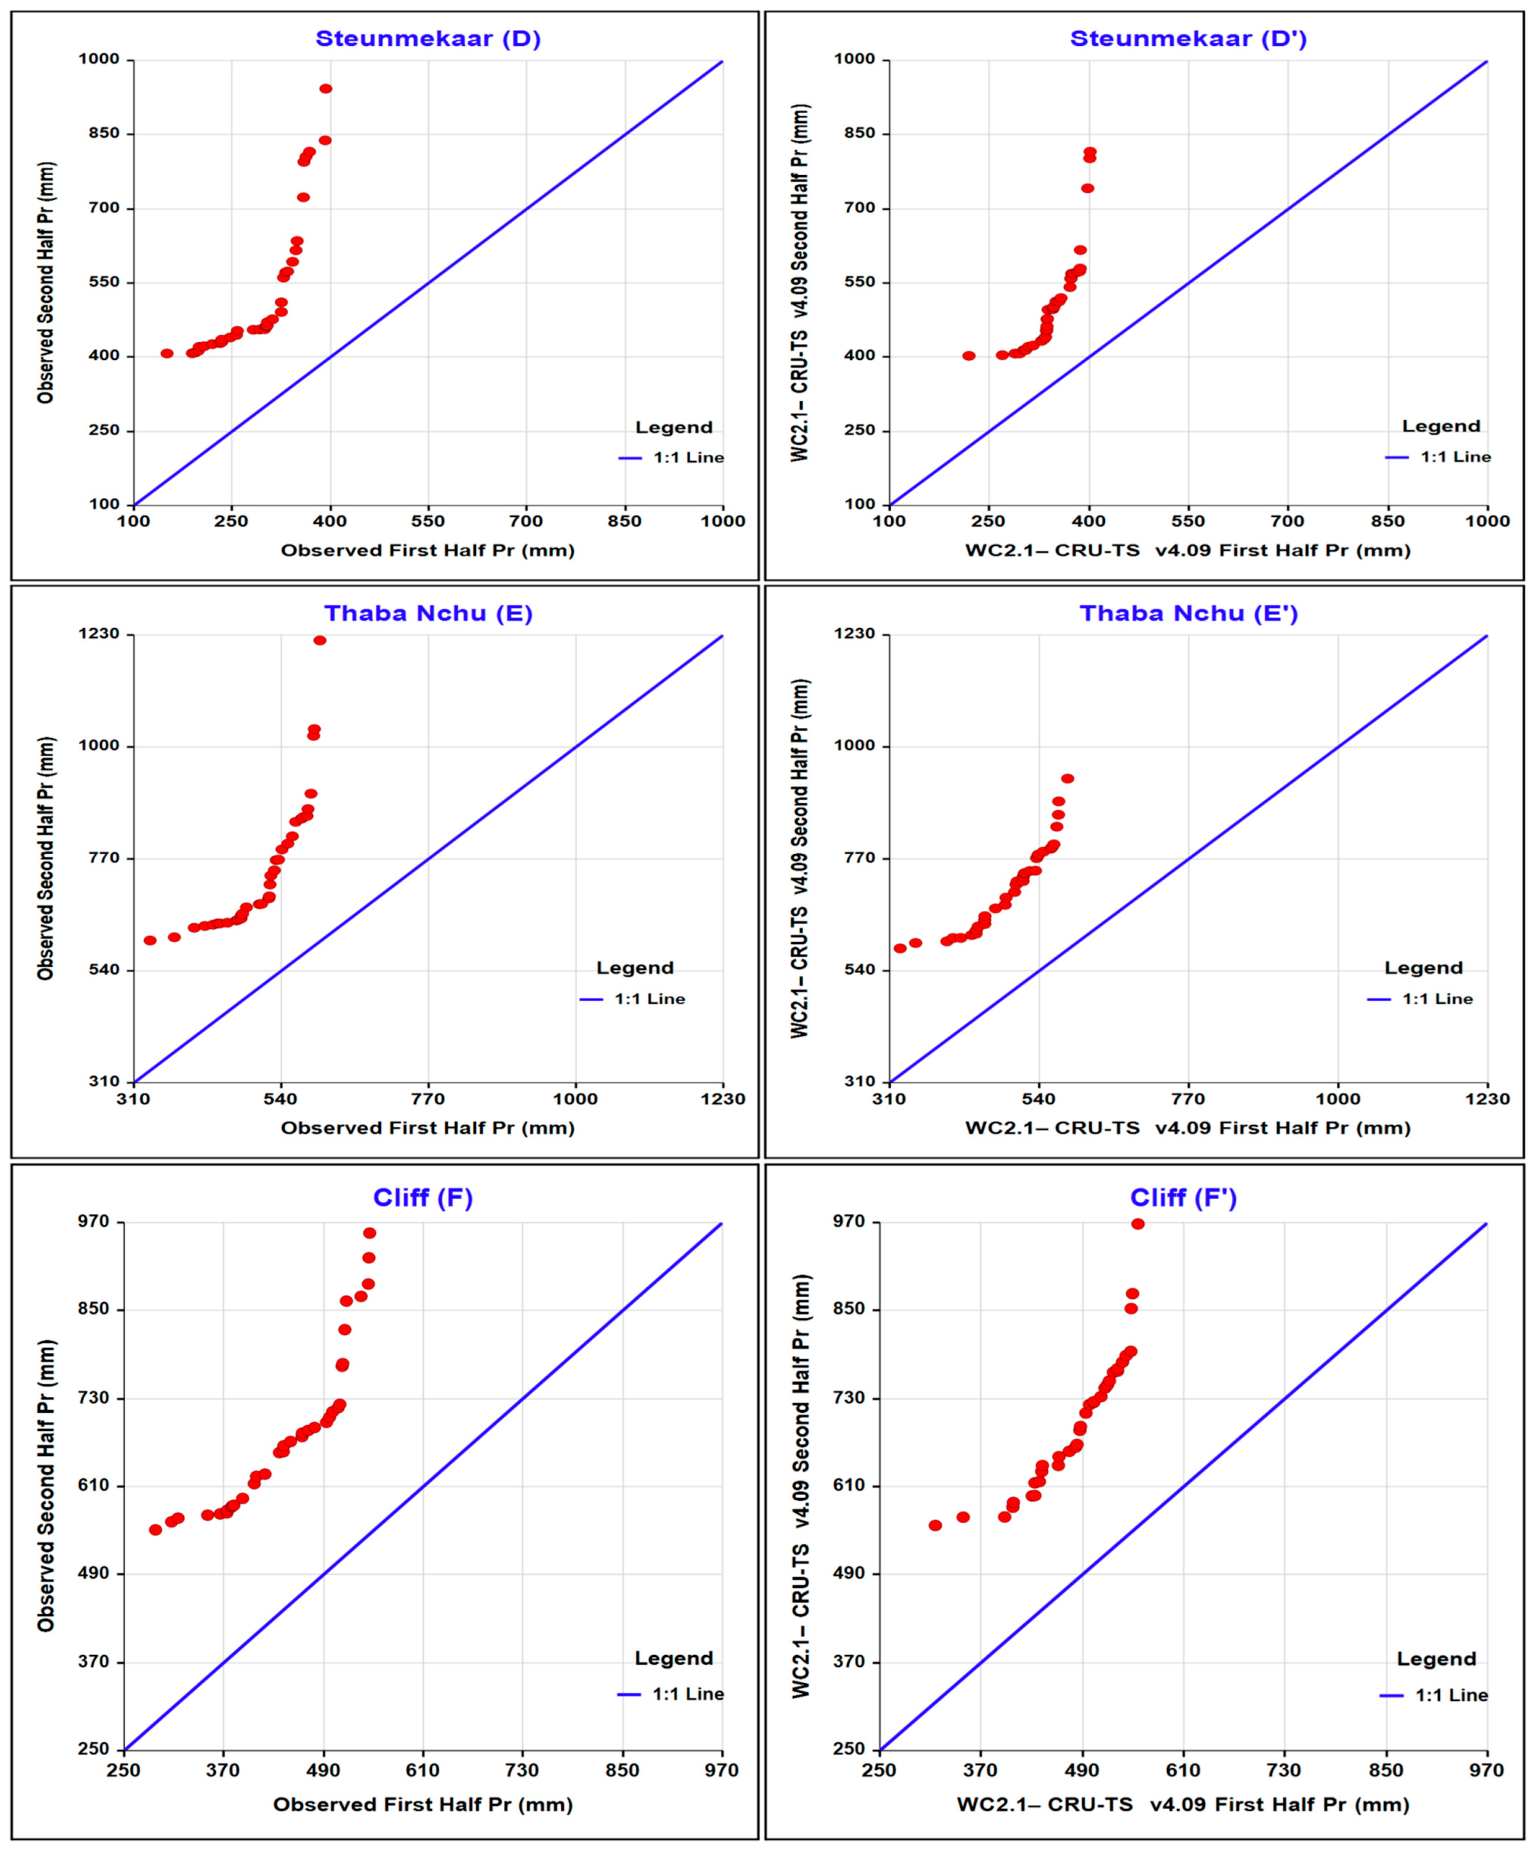
The ITA method proposed by Zekai Şen [51,52]. This method was employed to identify increasing, decreasing, or stable rainfall trends without assumptions of normality or serial independence. In the ITA procedure, the rainfall time series was divided into two halves, sorted in ascending order, and plotted against each other relative to the 1:1 reference line:
y = x
where
x = ordered values of the first half of the series;
y = ordered values of the second half of the series.
Points above the 1:1 line indicate increasing trends, whereas points below the line indicate decreasing trends.
Extreme climate events were evaluated using the 95th-percentile threshold method, which identifies unusually high rainfall events corresponding to the upper 5% of rainfall observations. The percentile position was calculated as:
P 95 = 0.95 × ( N + 1 )
where
P 95 = position of the 95th percentile;
N = total number of rainfall observations.
The rainfall value corresponding to the calculated percentile position was considered the extreme rainfall threshold. Rainfall amounts exceeding this threshold were classified as extreme precipitation events.
These statistical and hydroclimatic analyses were conducted at an annual time scale to evaluate the reliability, variability, and performance of the WC2.1– CRU-TS v4.09 dataset. The assessment was particularly important for semi-arid environments, where even small climatic biases can substantially affect hydrological responses and ecosystem-service estimations.
The analysis focused on rainfall and temperature variability, trend structure, and extreme climate characteristics, providing a comprehensive evaluation of dataset behaviors under hydroclimatic conditions.
Overall, the statistical indicators provided an objective assessment of dataset’s performance and confirmed its suitability for providing reliable climate inputs for regional hydroclimatic analyses. The validated dataset also represents an appropriate baseline for future hydrological and environmental modeling in data-scarce semi-arid catchments [6,27].

3. Results

3.1. Temporal Validation of Climate Data

3.1.1. Temporal Validation of Precipitation

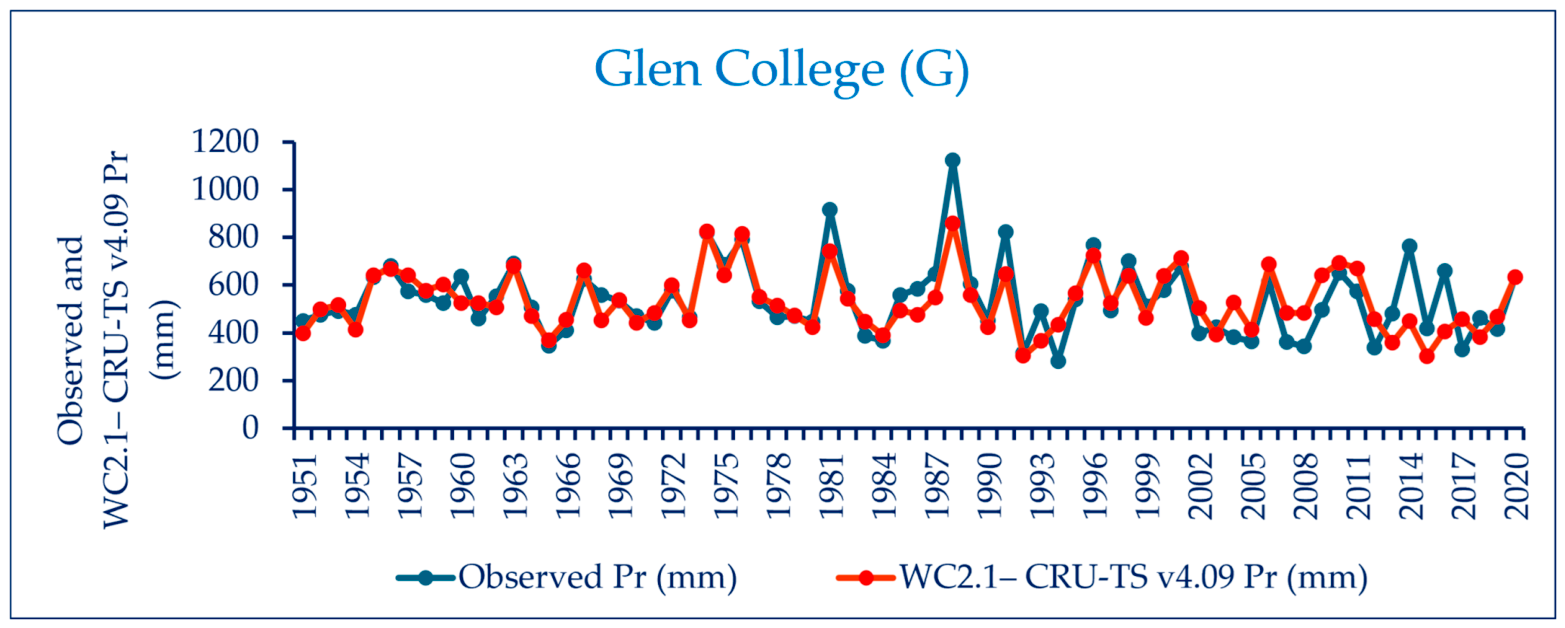
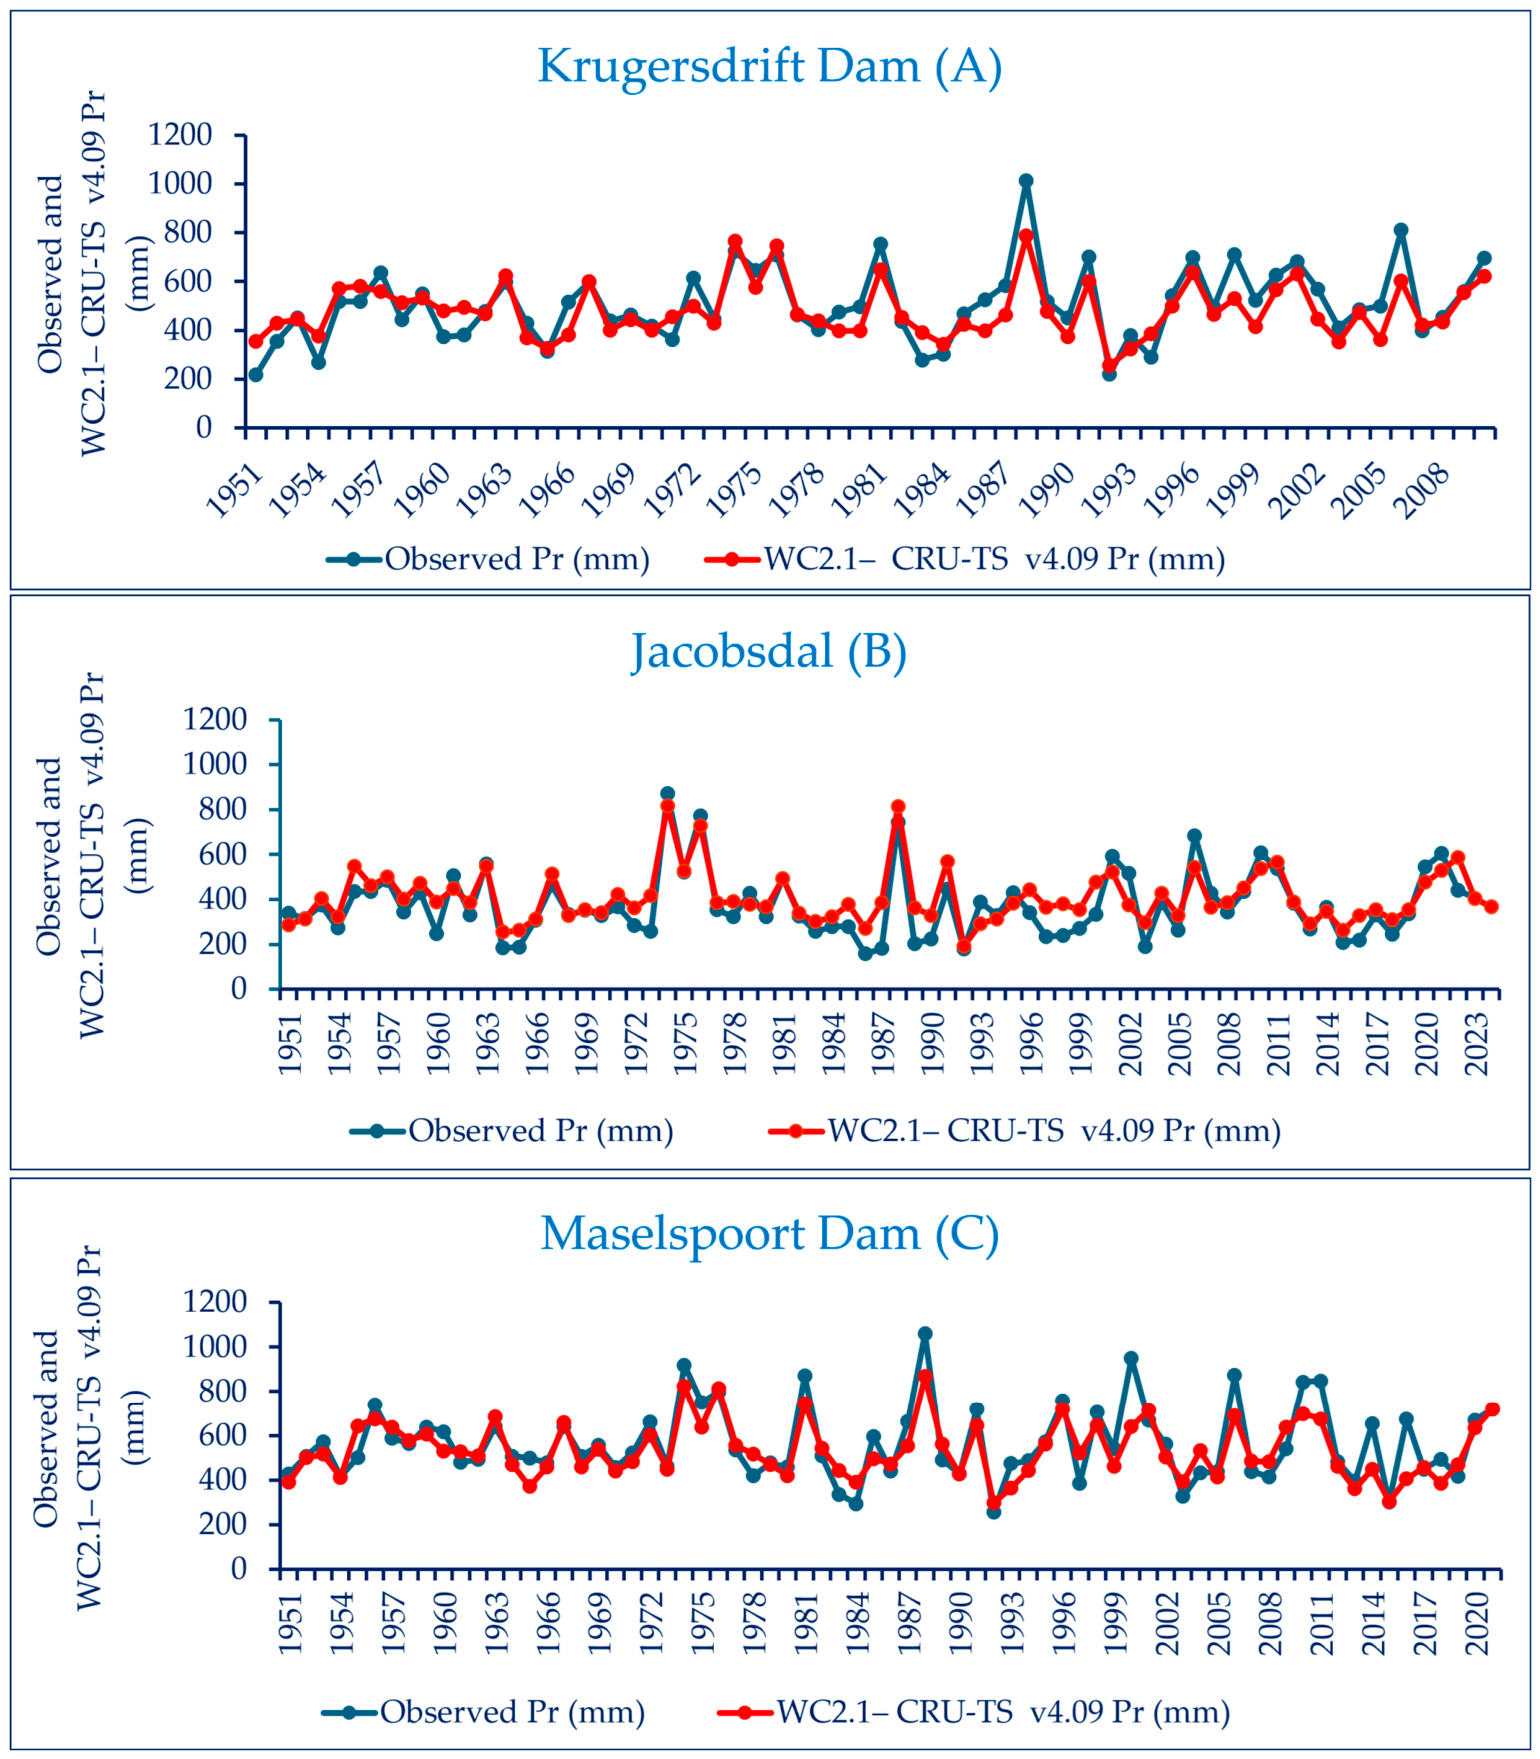
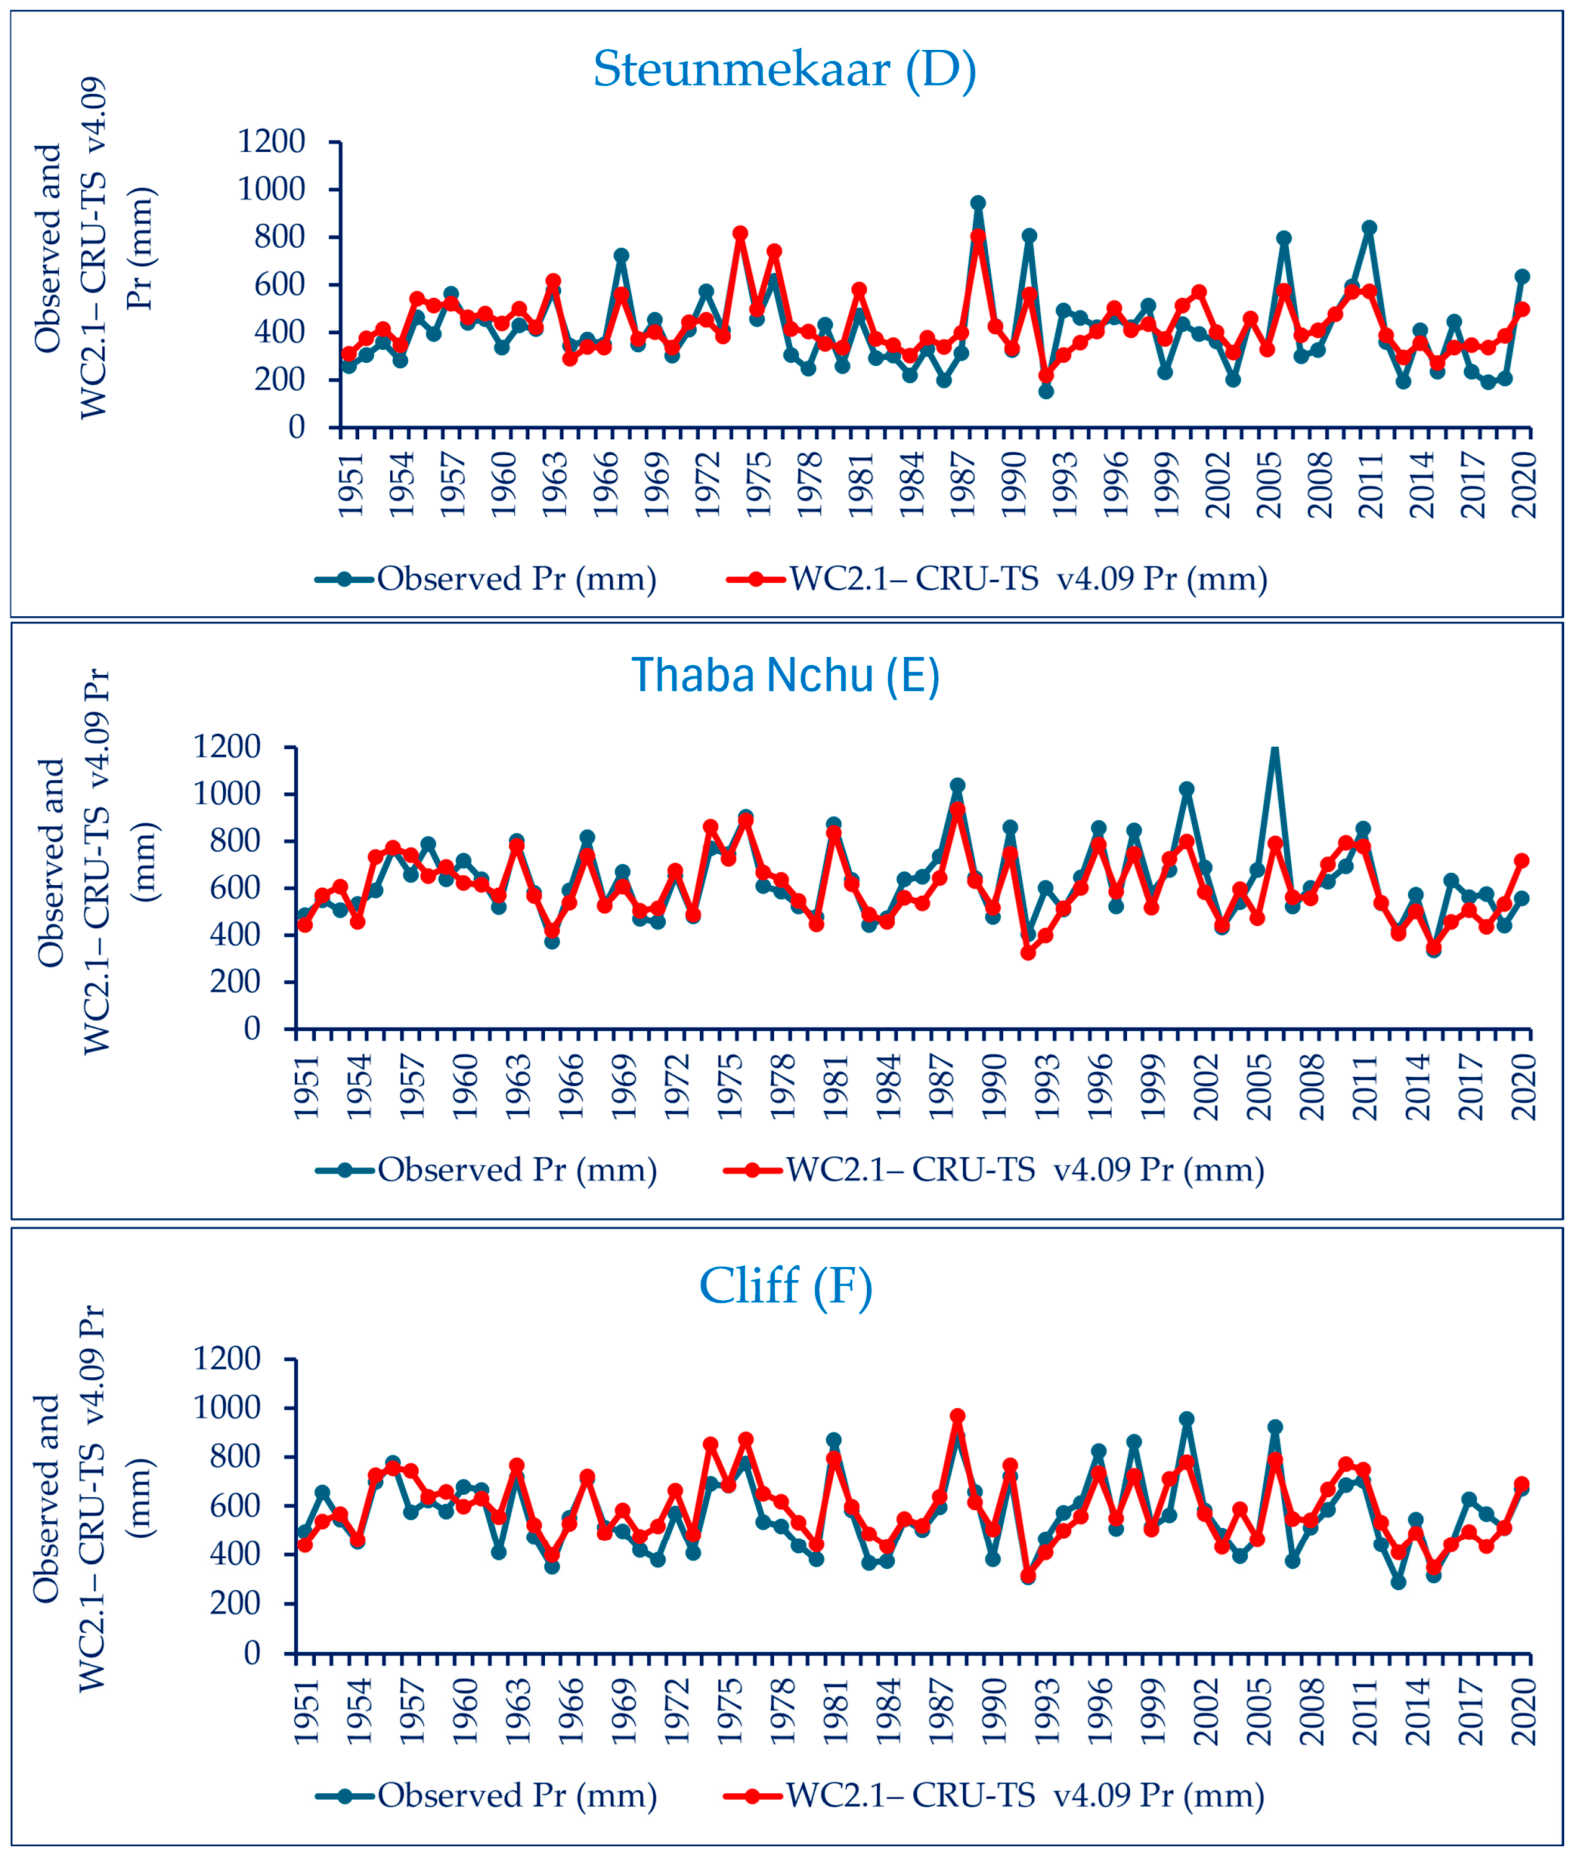
The performance of the WC2.1– CRU-TS v4.09 precipitation and temperature dataset was evaluated against observed records from seven meteorological stations located within the C5 SDR catchment of South Africa. Figure 3 presents annual time-series comparisons between observed and gridded precipitation at each station. Strong temporal correspondence between the observed and gridded datasets was demonstrated by high correlation coefficients (R = 0.78–0.90), coefficients of determination (R2 = 0.62–0.80), and positive NSE values (0.61–0.90) across the evaluated stations, indicating that the gridded dataset successfully reproduced the observed interannual variability (Table 3).
Despite the generally good agreement, spatial variability in performance is evident among stations. The highest temporal correspondence is observed at the Jacobsdal (R2 = 0.80, R = 0.90) station, where the gridded data closely matches both the timing and magnitude of observed precipitation events. In contrast, comparatively lower agreement is observed at Glen College (R2 = 0.62, R = 0.78) and Steunmekaar (R2 = 0.63, R = 0.79), where greater rainfall variability and localized climatic influences contribute to larger discrepancies between observed and gridded values. These differences likely reflect localized influences of elevation, topographic variability, and convective rainfall processes, which may contribute to spatial heterogeneity in precipitation and consequently influence the agreement between observed station measurements and gridded climate estimates.
A common limitation identified across several stations, most notably Krugersdrift Dam, Maselspoort Dam, and Steunmekaar, is the systematic underestimation of high-magnitude precipitation events. While the timing and occurrence of rainfall events are generally well captured, peak precipitation values are consistently attenuated in the gridded datasets. This behavior is characteristic of spatially interpolated climate products, where localized rainfall extremes are smoothed because of averaging over grid cells.
Overall, the temporal validation demonstrates that the WC2.1– CRU-TS v4.09 dataset successfully reproduces the seasonal cycle and interannual variability of precipitation across the study area. This indicates strong temporal agreement with the observed records. Although the dataset exhibits slight underestimation of high-magnitude rainfall events, particularly at stations characterized by stronger local rainfall variability, the dataset successfully preserves the dominant temporal characteristics of observed precipitation and provides a reliable representation of long-term hydroclimatic variability for regional hydrological applications.

3.1.2. Temporal Validation of Temperature

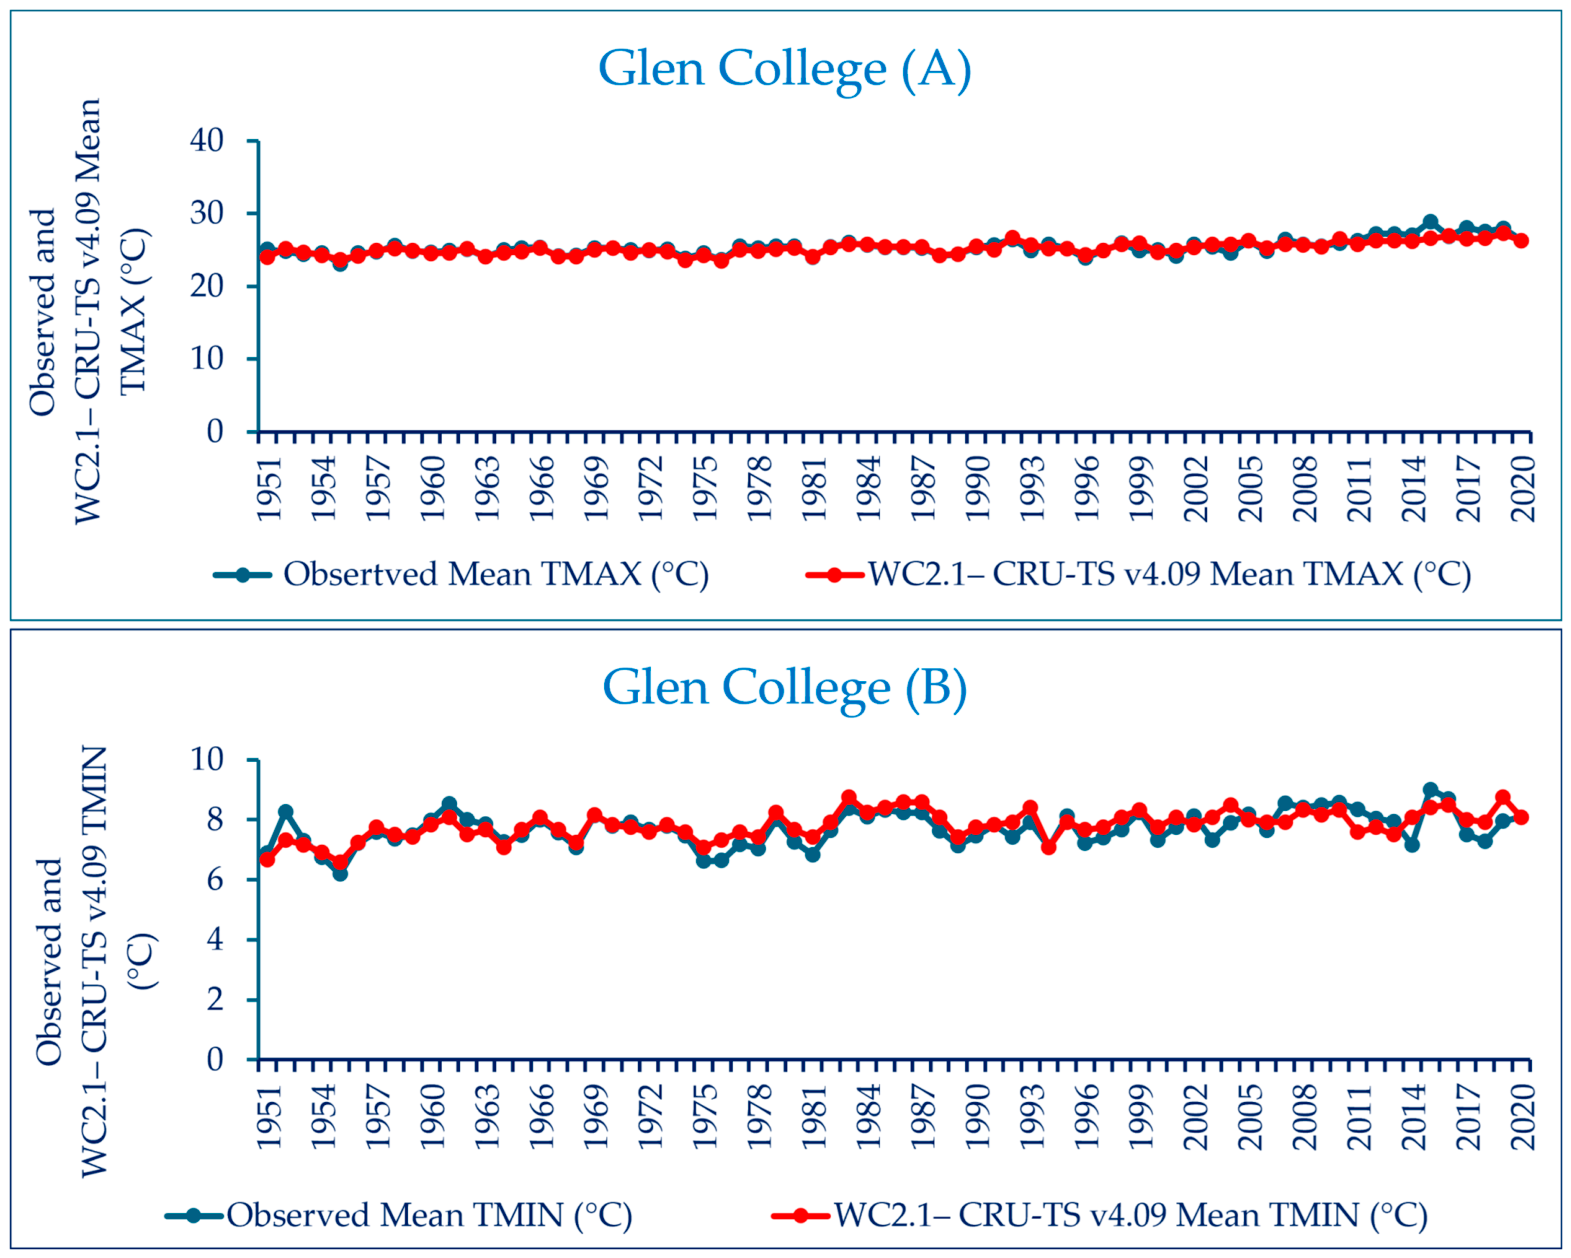
The temporal comparison between observed and WC2.1– CRU-TS v4.09 temperature series demonstrated strong agreement for both annual maximum (TMAX) and minimum (TMIN) temperatures at Glen College station (Figure 4). The gridded dataset closely reproduced the observed interannual variability and successfully captured both warmer and cooler periods throughout the study period. Long-term warming tendencies evident in the observed records were also reproduced by the gridded dataset.
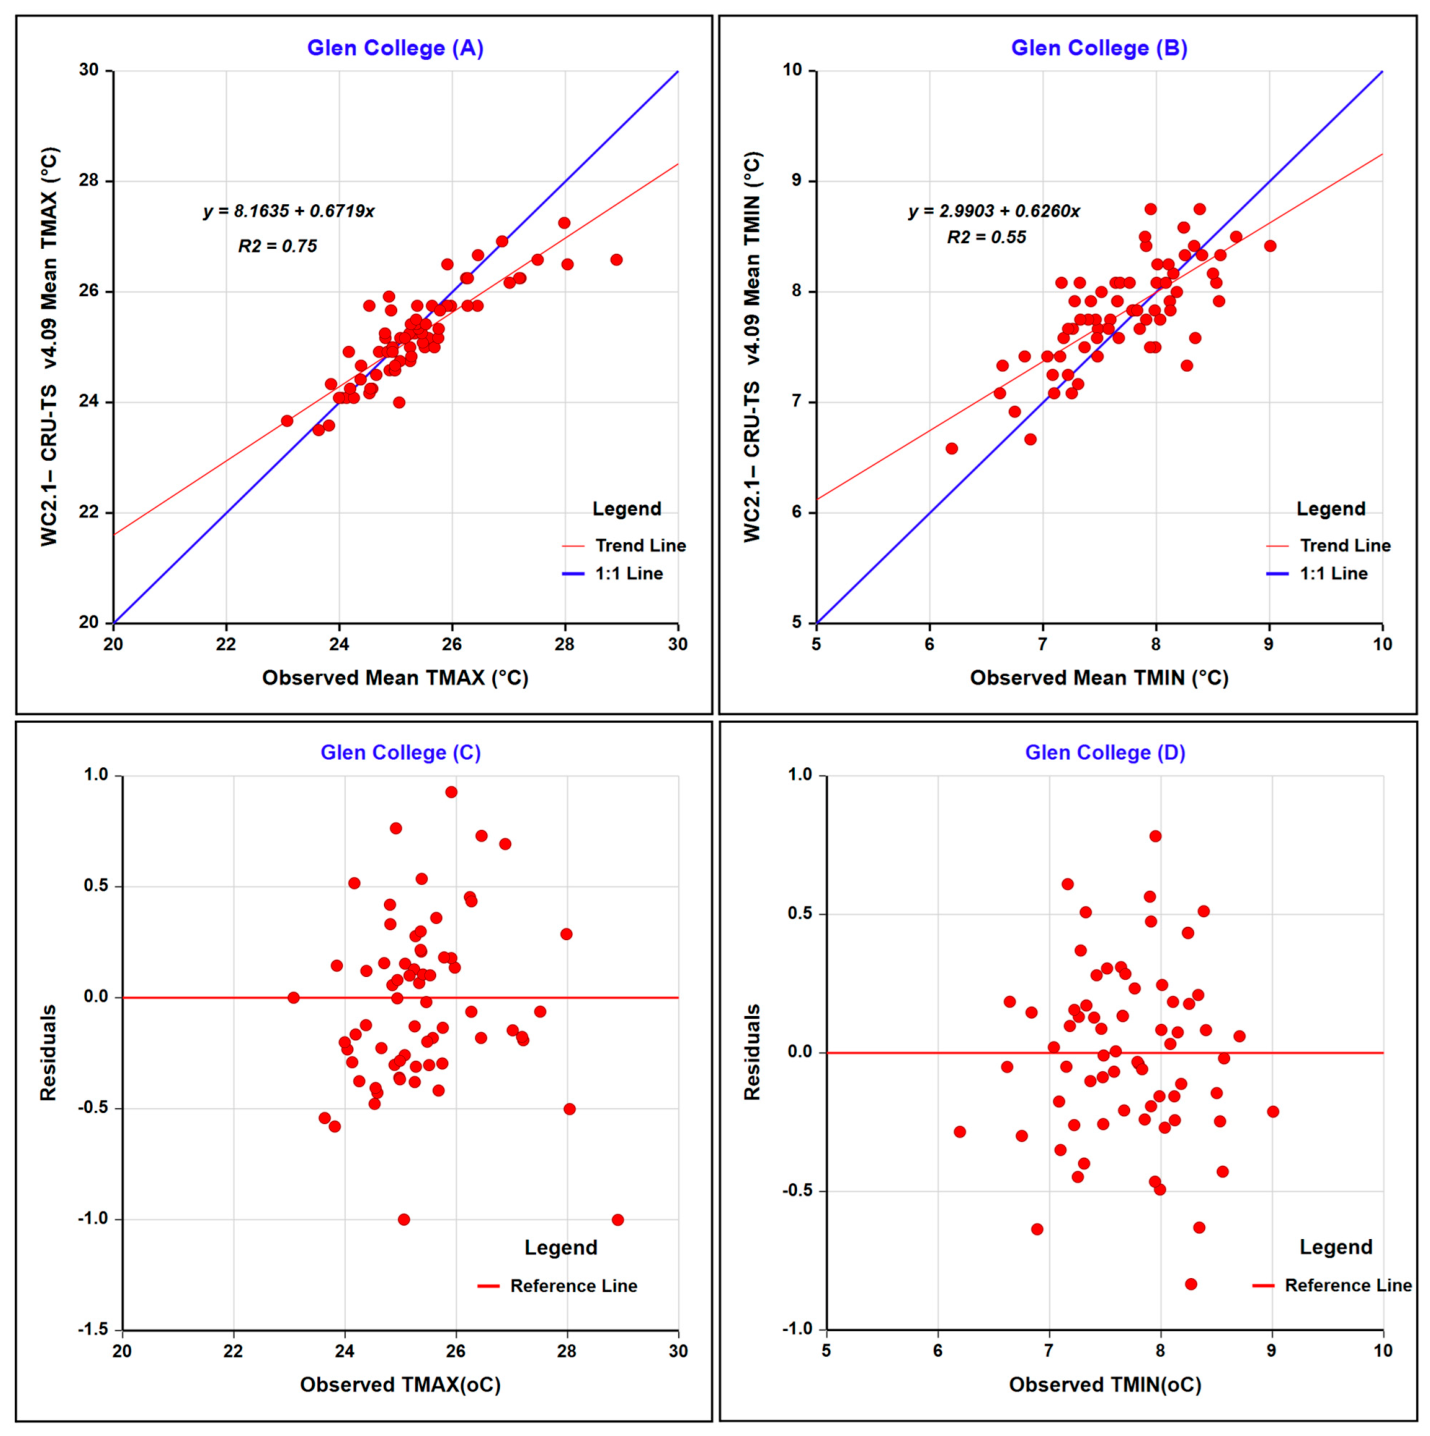
Agreement was generally stronger for TMAX than for TMIN. The TMAX series closely followed observed year-to-year fluctuations with only minor deviations (Figure 4A), whereas TMIN exhibited slightly greater departures during certain periods (Figure 4B). Nevertheless, both variables showed consistent temporal behavior and preserved the principal characteristics of the observed temperature record. These results indicate that the WC2.1– CRU-TS v4.09 dataset provides a reliable representation of historical temperature variability and is suitable for subsequent hydroclimatic analyses requiring continuous temperature inputs.

3.2. Innovative Trend Analysis (ITA)

3.2.1. Precipitation

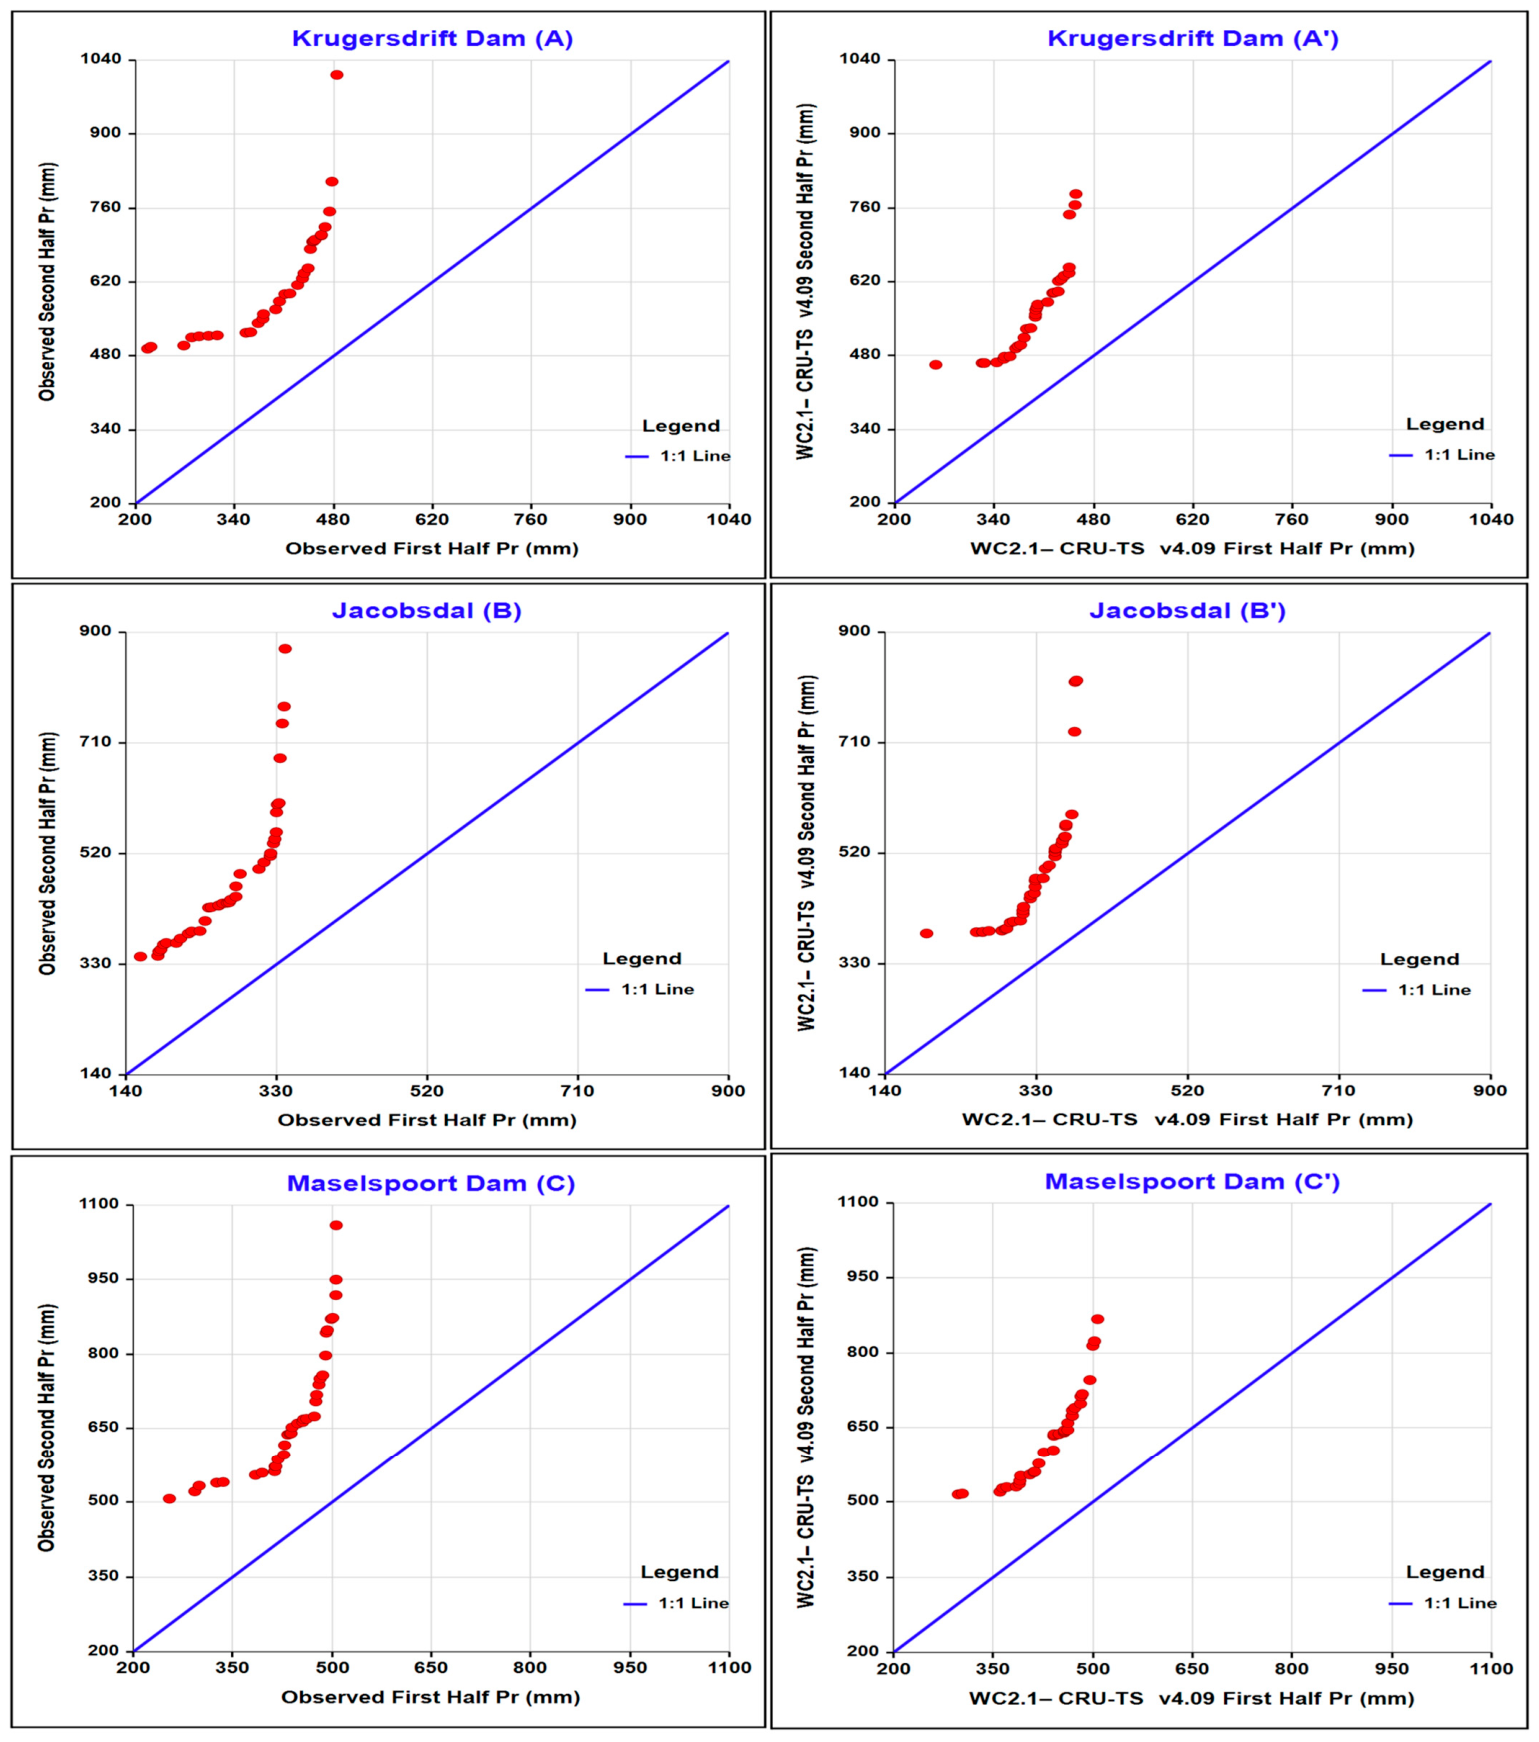
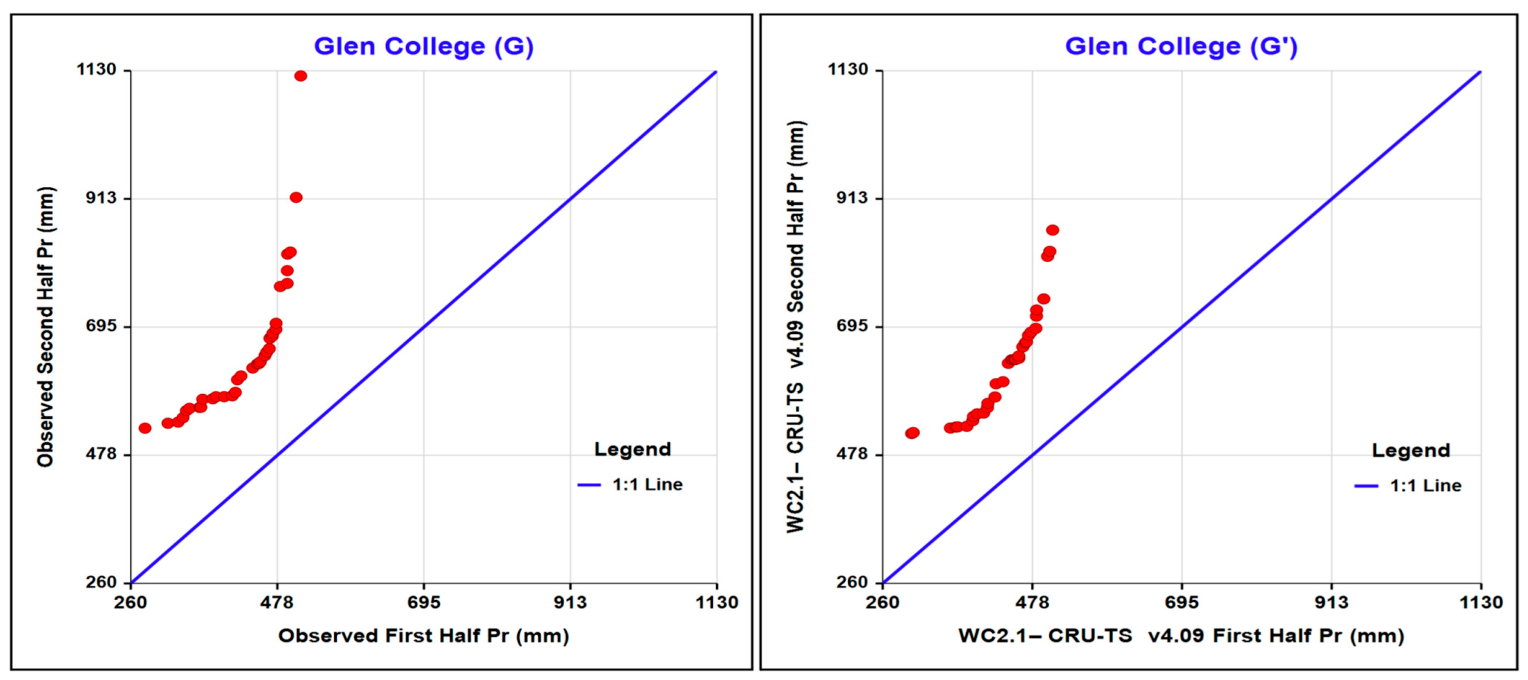
The ITA plots revealed similar trend structures between the observed and gridded precipitation series across all stations (Figure 5). The Jacobsdal station exhibited the closest agreement, with low-, medium-, and high-value ranges distributed near the 1:1 line, indicating strong consistency between the first and second halves of the record (Figure 5B,B’). In contrast, Glen College displayed the greatest deviation from the reference line, particularly within the upper-value range, suggesting greater differences in high precipitation conditions (Figure 5G,G’).
Krugersdrift Dam, Maselspoort Dam, Thaba Nchu, and Cliff exhibited moderate departures from the 1:1 line, with most points concentrated near the reference line. The tendency for greater deviations in the upper range indicates that changes were more pronounced during wetter years than during low-precipitation years. Overall, the ITA results demonstrate that the gridded dataset preserves the principal precipitation trend observed at the station level while exhibiting varying degrees of agreement among stations.

3.2.2. Minimum and Maximum Temperature

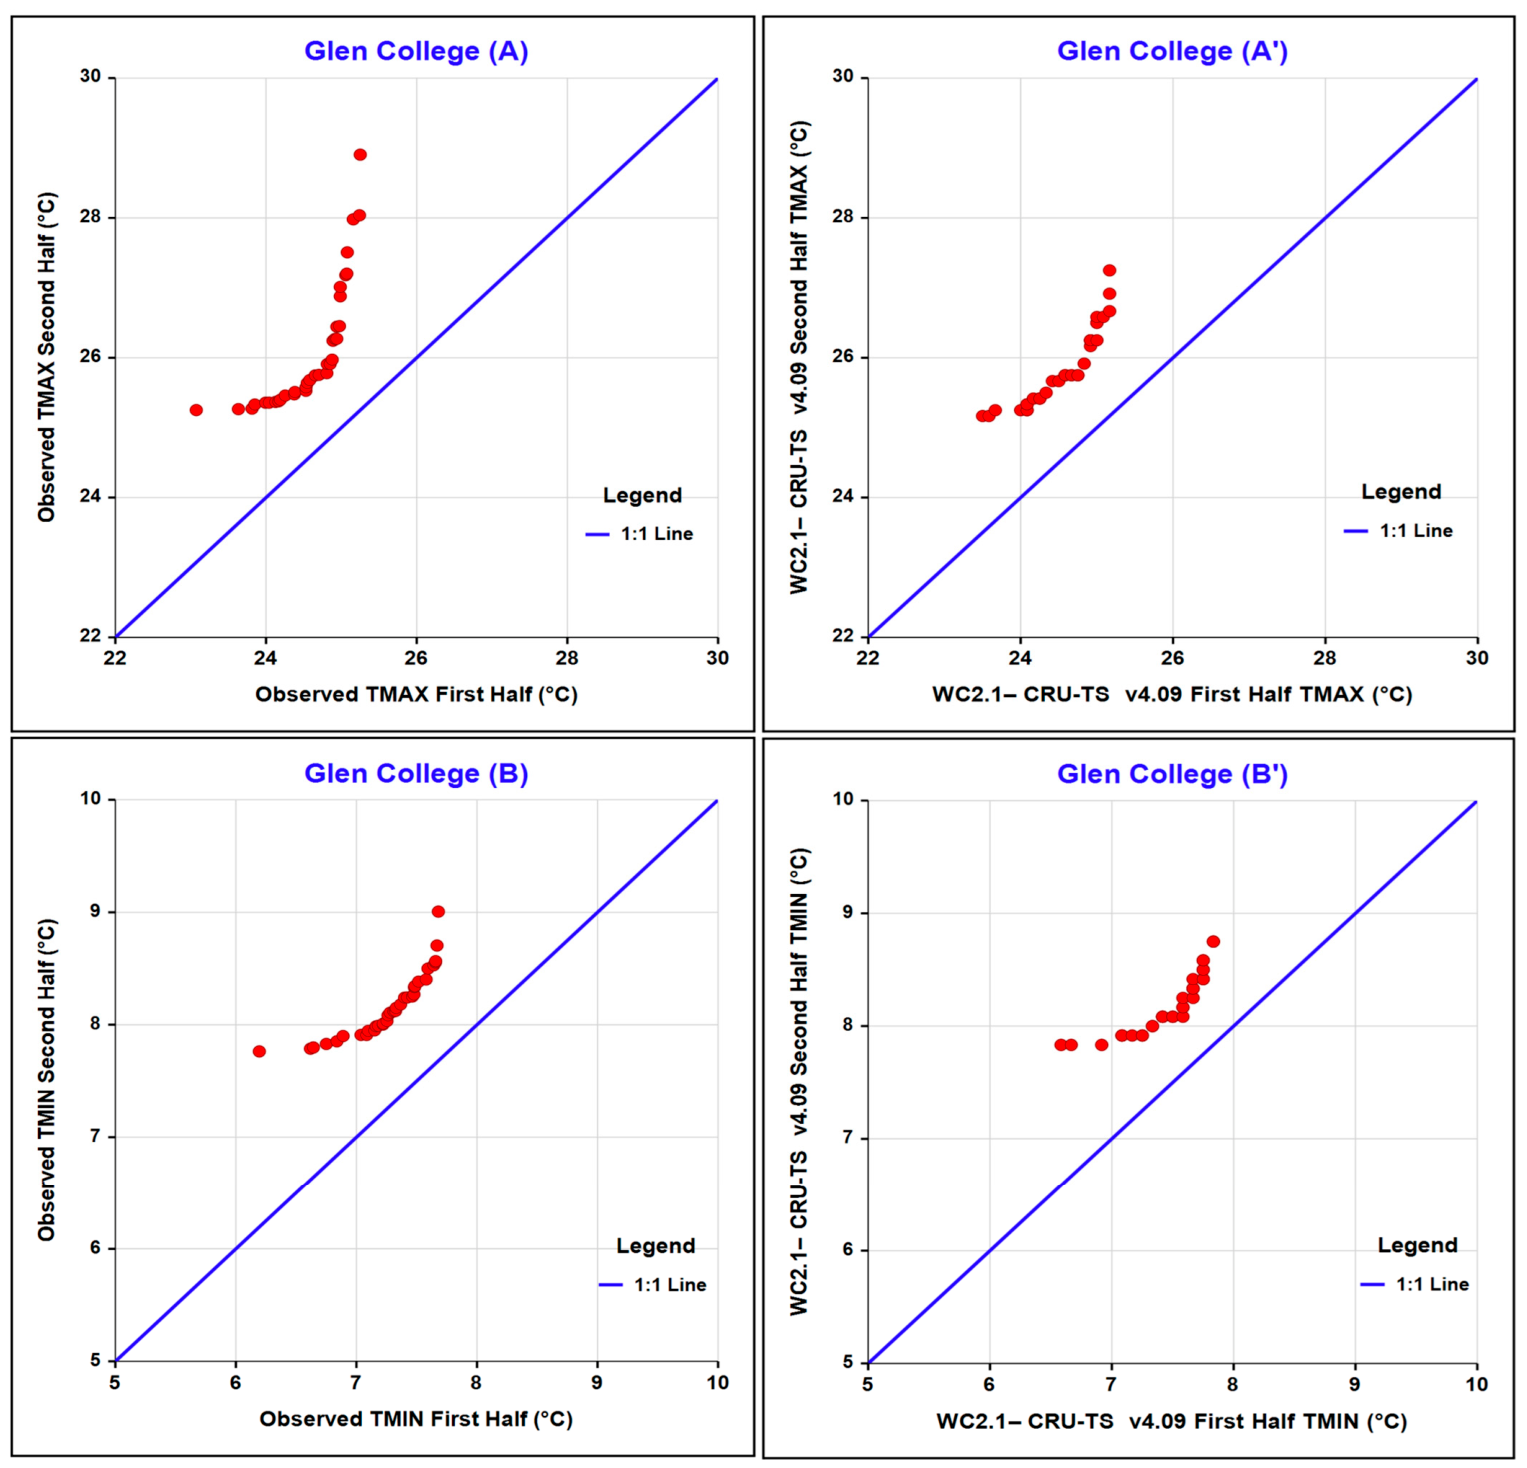
The ITA results revealed consistent warming tendencies for both TMAX and TMIN (Figure 6). Most points were distributed above the 1:1 line, indicating that temperature values in the second half of the record were generally higher than those in the first half. TMAX exhibited closer alignment with the reference line and smaller departures across the lower, intermediate, and upper value ranges, suggesting more stable long-term behavior (Figure 6A,A’). TMIN displayed slightly larger deviations, particularly within the upper range, indicating greater variability in minimum temperature conditions. Nevertheless, the observed and gridded series showed highly similar trend structures, demonstrating that the WC2.1– CRU-TS v4.09 dataset successfully reproduces the long-term temperature evolution of the study area.

3.3. Scatter Plot and Residual Analysis

3.3.1. Precipitation

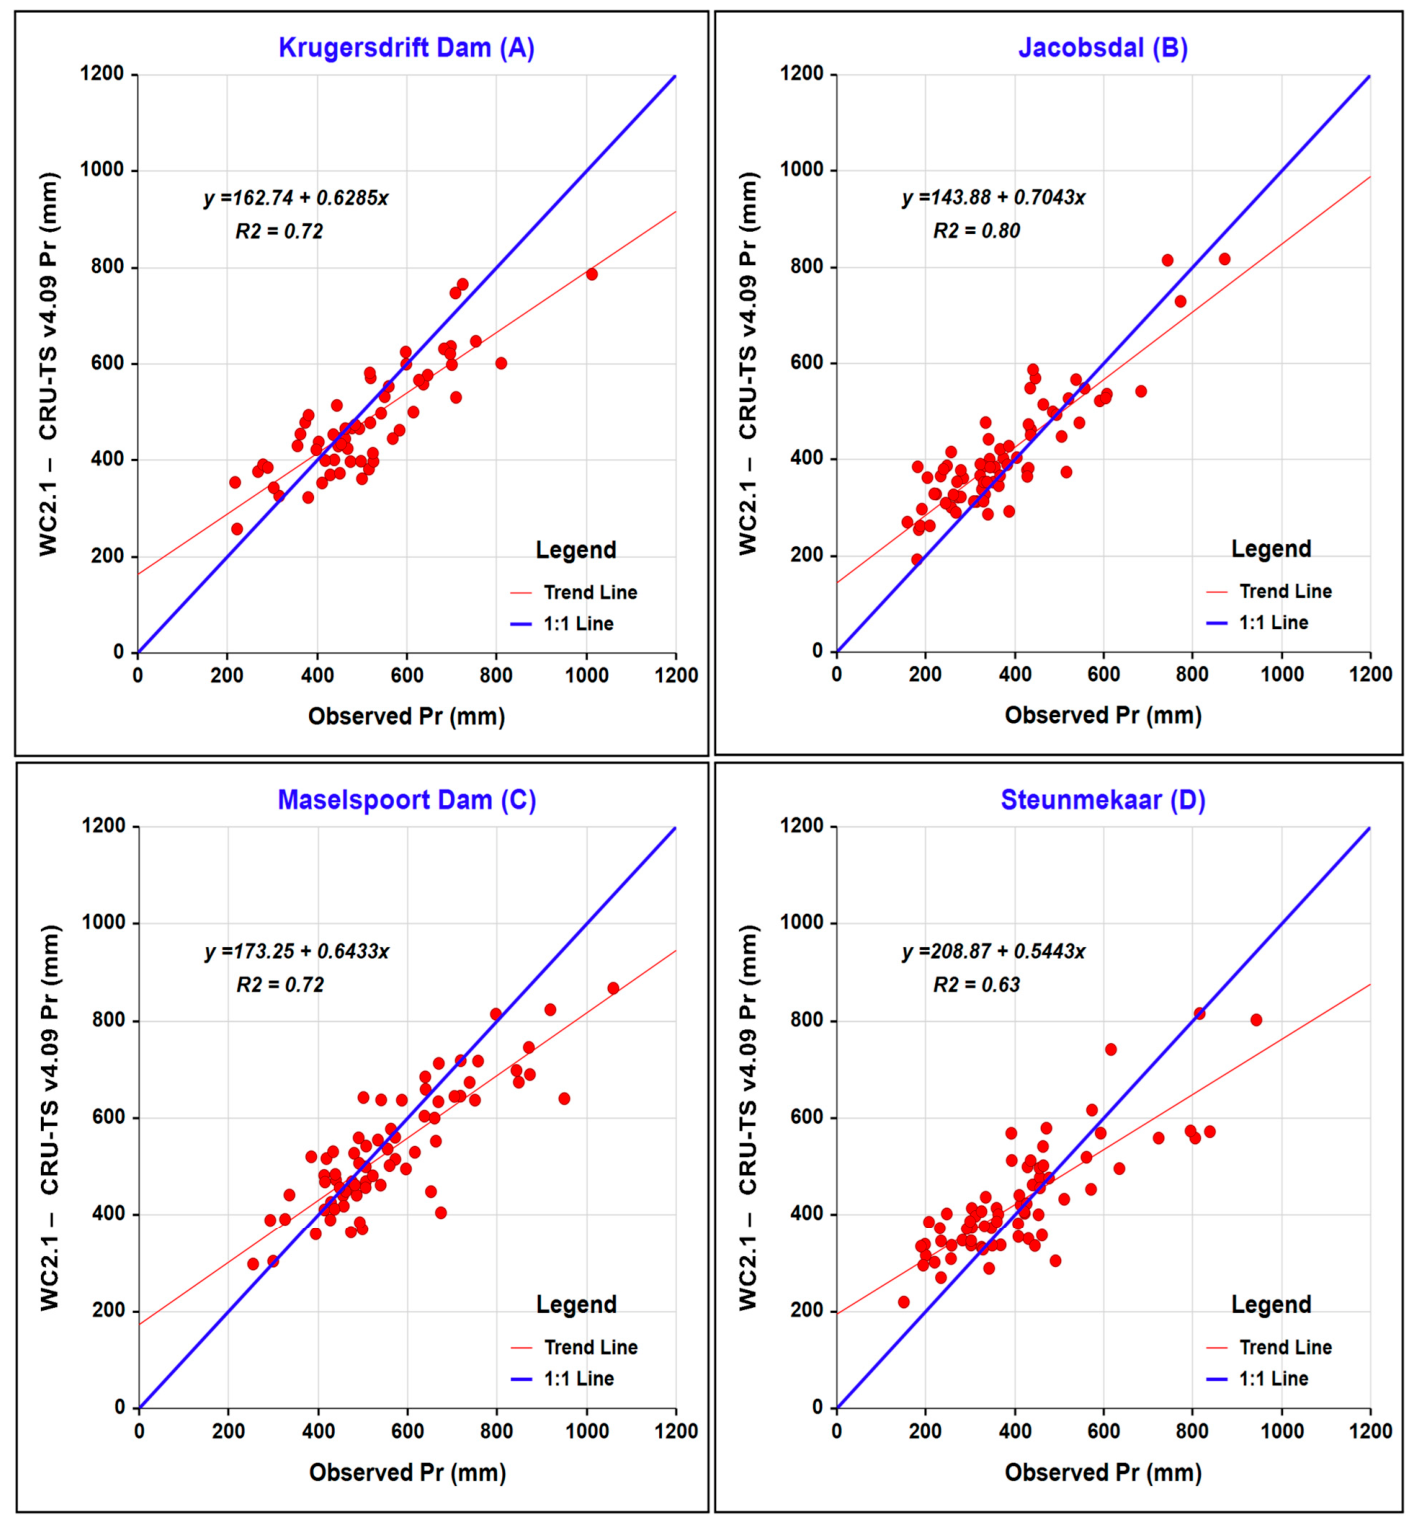
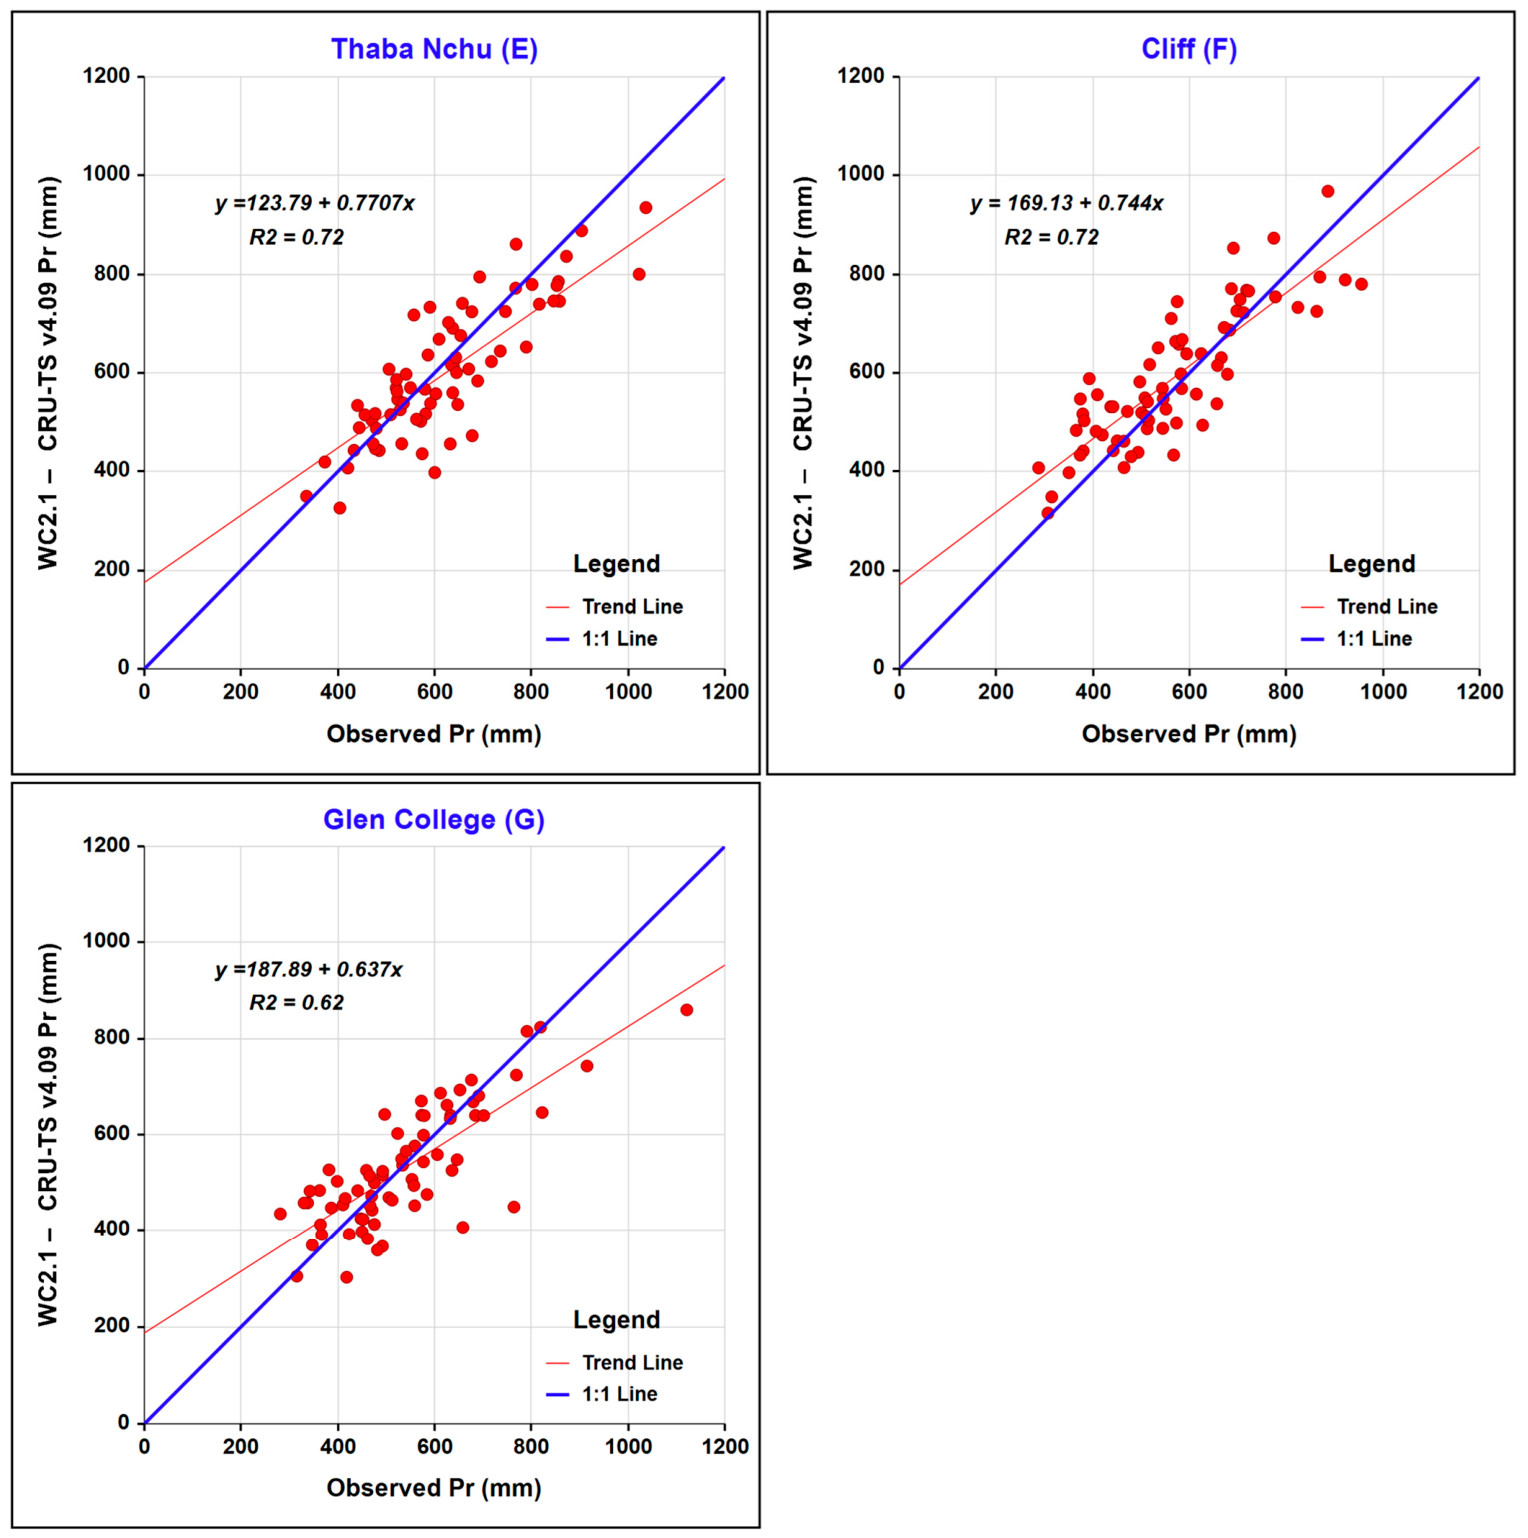
The scatter plots presented in Figure 7 complement the temporal validation results shown in Figure 3 by providing a detailed point-to-point comparison between observed and gridded annual precipitation across the seven stations. The distribution of points relative to the 1:1 reference line illustrates both the strength of the linear relationship and the direction of bias identified in the time-series analysis.
At Krugersdrift Dam (Figure 7A), most points lie below the 1:1 line, indicating a tendency toward underestimation, consistent with the reduced peak magnitudes observed in the temporal series. Despite this bias, the close clustering of points along the fitted trend line reflects a strong linear association between observed and gridded values. At Jacobsdal (Figure 7B), points predominantly fall above the 1:1 line, indicating slight overestimation, while the tight clustering and strong alignment with the trend line are consistent with the high level of agreement observed in the time-series comparison.
For Thaba Nchu (Figure 7E), points are generally located slightly below the 1:1 line, indicating mild underestimation, while their close clustering around the trend line reflects stable dataset performance. At Cliff (Figure 7F), points are distributed on both sides of the 1:1 line, with a slight tendency toward overestimation and strong alignment with the trend line, indicating minimal systematic bias.
Overall, the scatter plots confirm the findings of the temporal validation by demonstrating strong linear relationships between observed and gridded precipitation across all stations. While station-specific tendencies toward under- or overestimation are evident, the close alignment of points with the trend lines indicates that the WC2.1– CRU-TS v4.09 dataset reliably reproduces precipitation variability. Differences between visual patterns in the scatter plots and point-wise errors at more variable stations further emphasize the value of combining time-series, scatter-based, and residual analyses for comprehensive dataset evaluation.
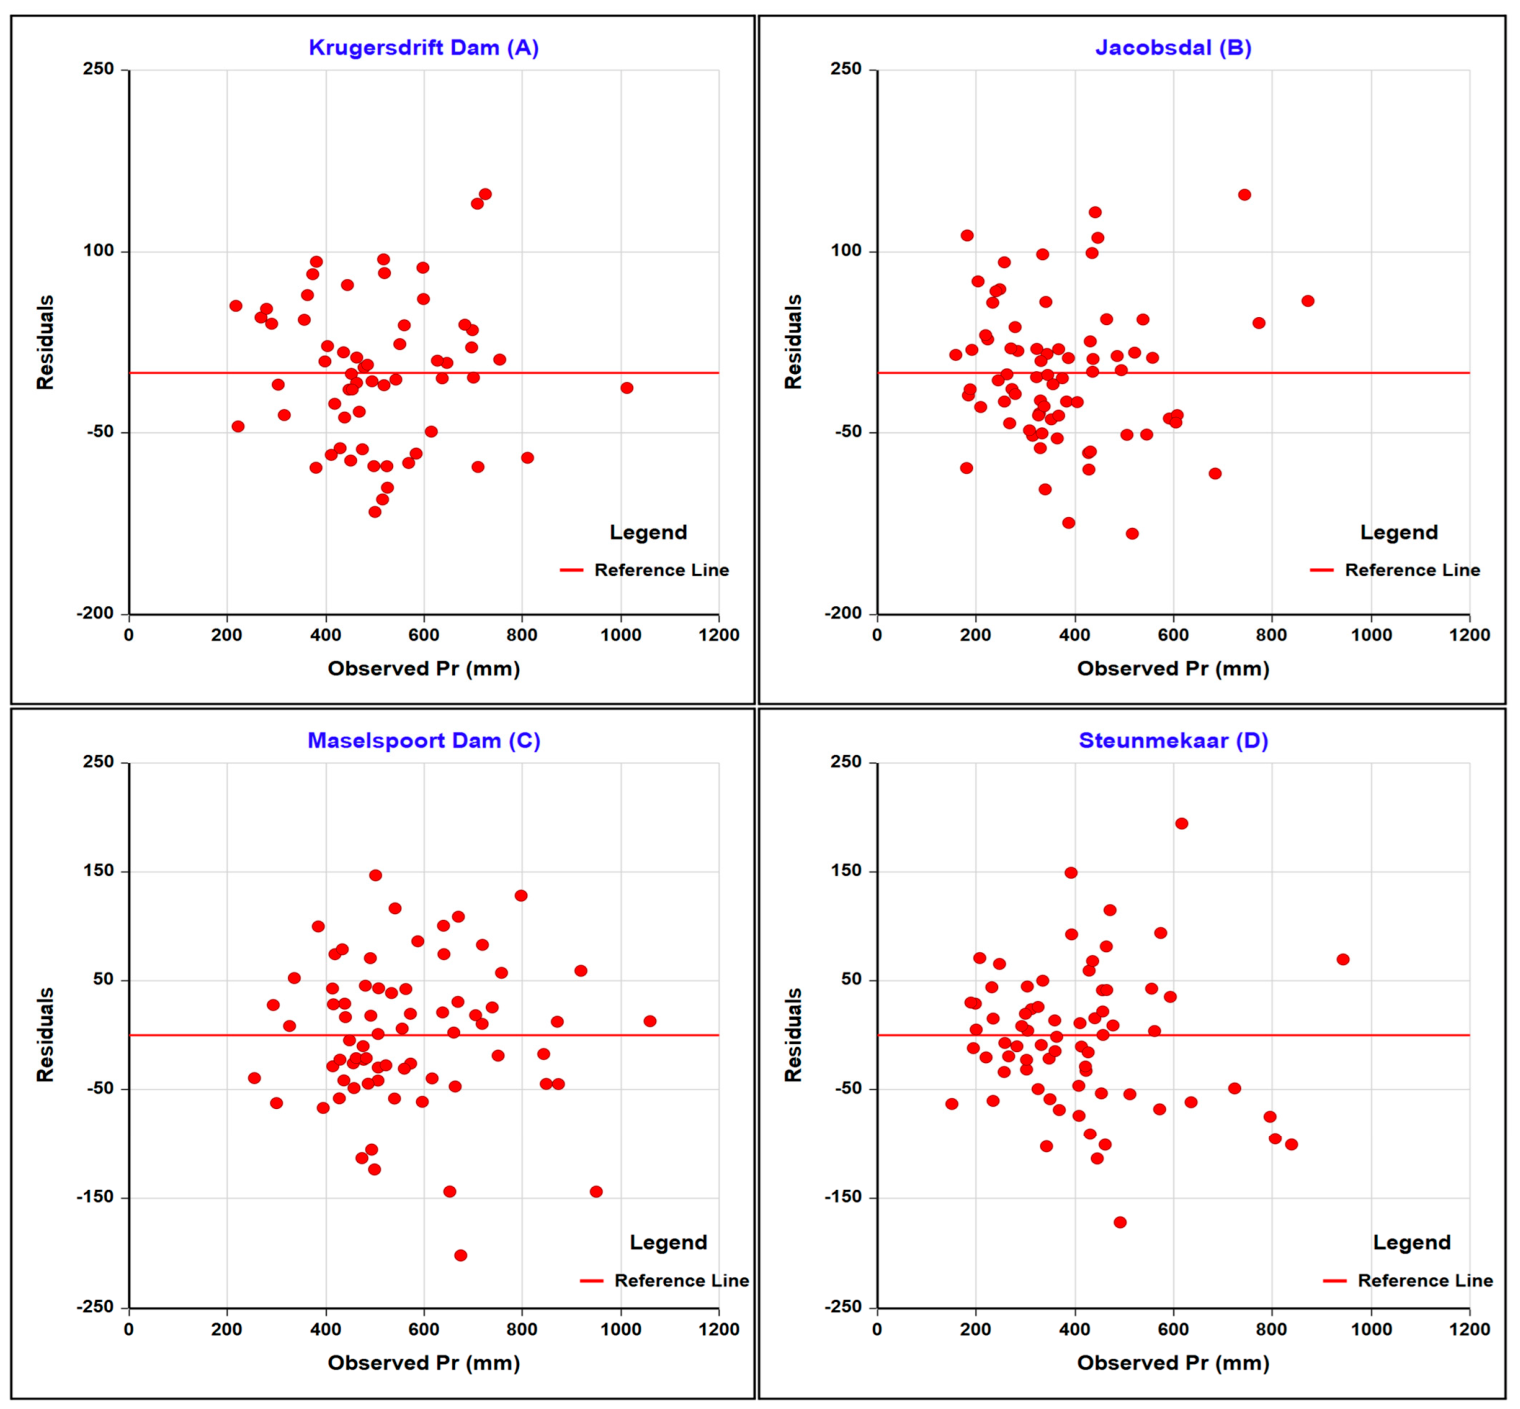
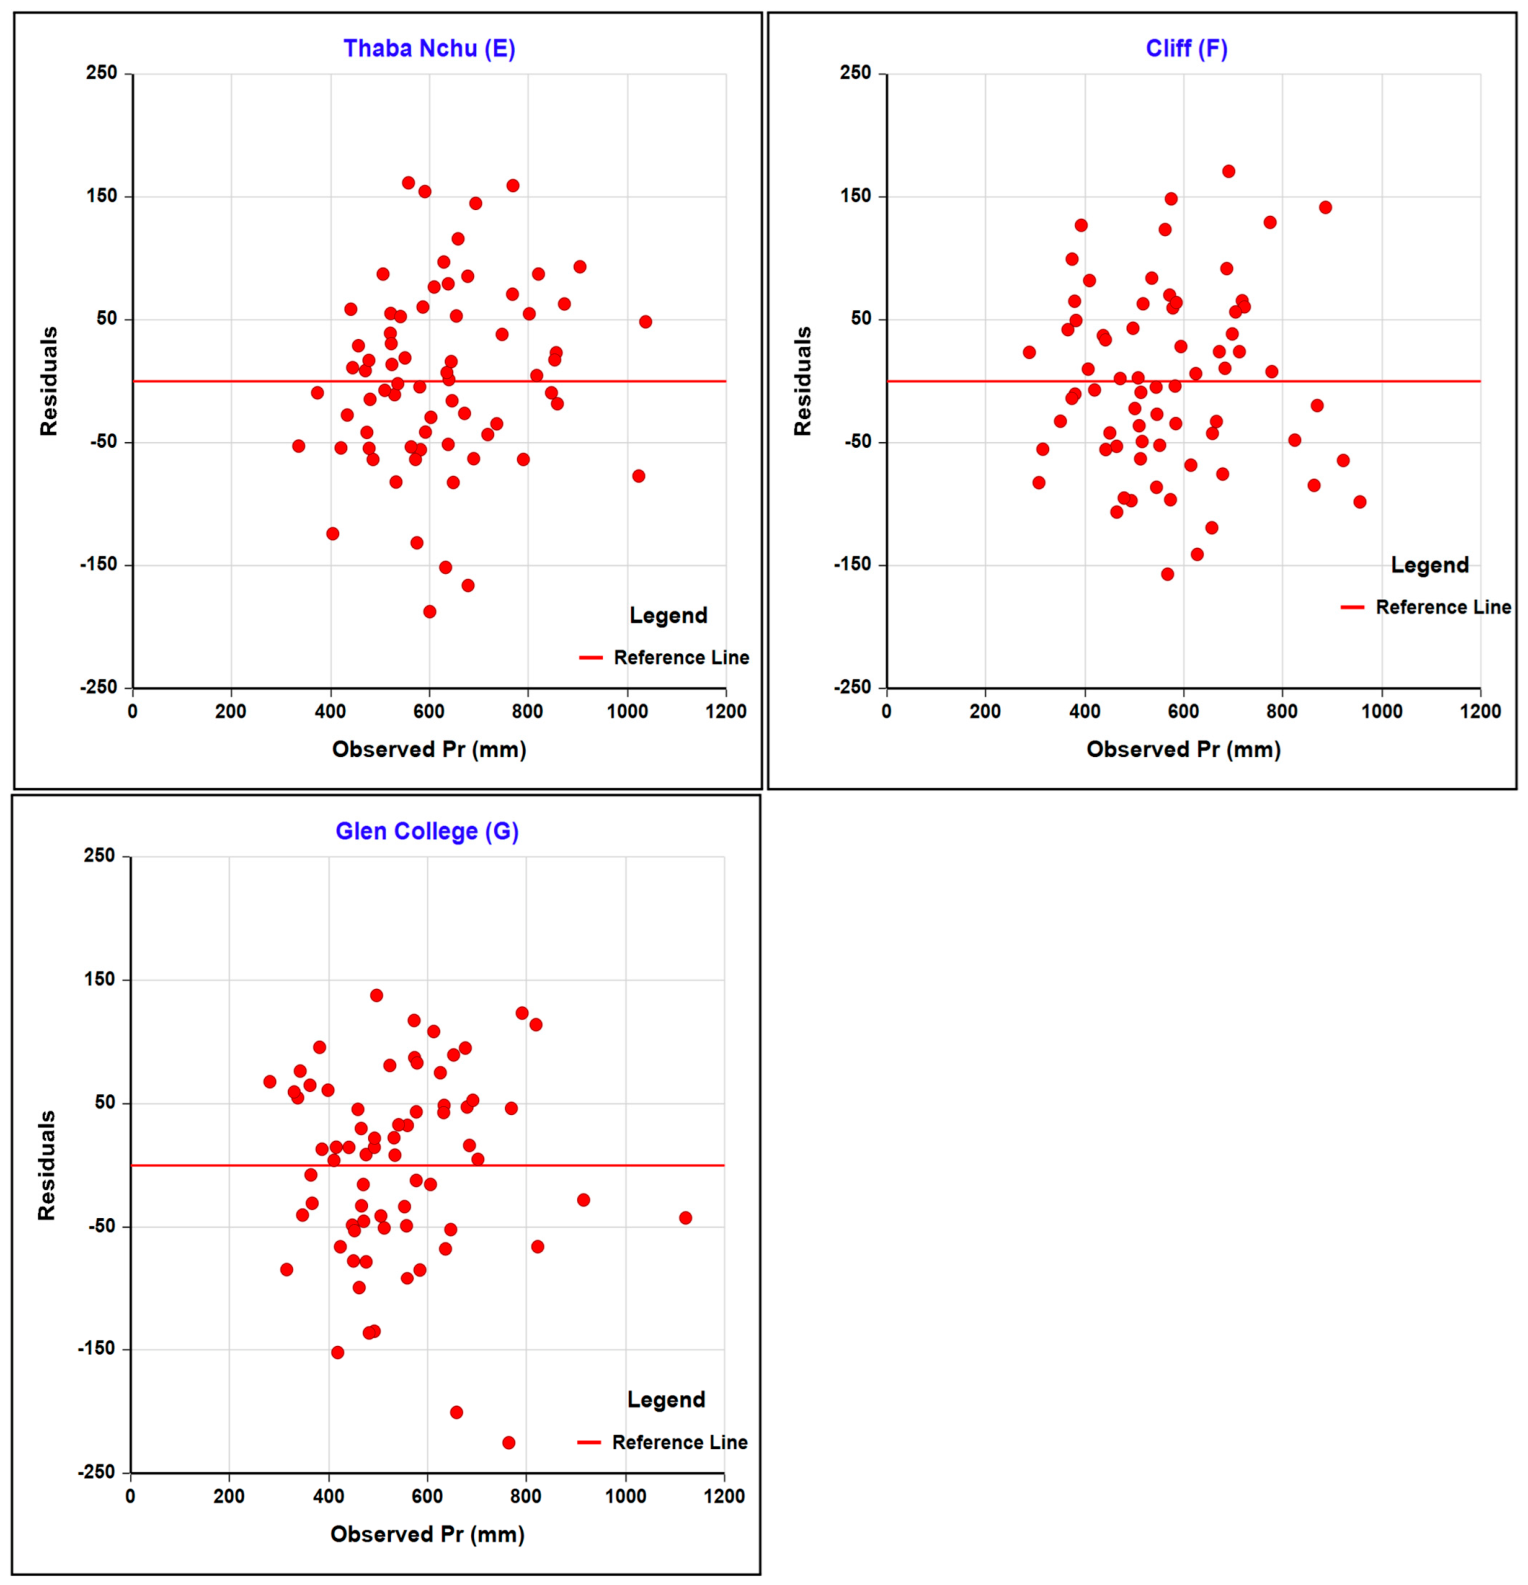
Residual analysis (Figure 8) provides a quantitative assessment of the differences between observed and gridded precipitation, complementing the temporal validation and scatter-based comparisons. Residuals are evaluated relative to the horizontal zero-residual reference line, where positive values indicate underestimation by the gridded dataset and negative values indicate overestimation.
At Krugersdrift Dam (Figure 8A), residuals are predominantly positive, confirming the systematic underestimation. The spread of residuals is moderate, indicating consistent but non-negligible errors. At Jacobsdal (Figure 8B), residuals are mainly negative, reflecting slight overestimation. The tight clustering around the zero line indicates stable model performance.
At Maselspoort Dam (Figure 8C), residuals are largely positive, confirming a tendency toward underestimation. The dispersion is slightly wider than at Jacobsdal, indicating moderate variability in model performance. At Steunmekaar (Figure 8D), residuals are slightly negative on average, indicating mild overestimation in numerical terms. This behavior is consistent with the scatter-plot results, where many points appear above the 1:1 line, and reflects the high temporal variability at this station. The wider spread of residuals highlights comparatively lower reliability at Steunmekaar relative to the other stations.
For Thaba Nchu (Figure 8E), residuals are slightly positive, indicating mild underestimation, but remain closely clustered around the zero line, reflecting stable performance with minimal bias. At Cliff (Figure 8F), residuals are symmetrically distributed around zero with a slight negative tendency, indicating mild overestimation. The narrow residual spread suggests consistent model behavior and minimal systematic error.
Across all stations, residual magnitudes generally increase with higher precipitation amounts, indicating that errors become more pronounced during high-intensity rainfall events. This heteroscedastic pattern is consistent with the temporal and scatter-based analyses and reflects the reduced ability of gridded datasets to fully capture localized precipitation extremes.
Overall, the residuals were generally centered around zero, indicating limited systematic bias across most stations. However, residual dispersion increased during high-intensity rainfall events, reflecting the reduced ability of the gridded dataset to reproduce localized precipitation extremes.

3.3.2. Minimum and Maximum Temperature

Scatter plots and residual analyses demonstrated excellent correspondence between observed and modeled temperatures for both TMAX and TMIN (Figure 9). Most observations clustered closely around the 1:1 reference line, indicating strong agreement between observed and gridded values. The correspondence was particularly strong for TMAX, where the dispersion around the reference line was minimal (Figure 9A).
Residuals for both temperature variables remained closely centered around zero and showed no obvious systematic temporal pattern, indicating limited bias and stable model performance throughout the study period. TMAX exhibited smaller residual dispersion than TMIN, confirming slightly stronger predictive skill (Figure 9C). Overall, the results demonstrate that the WC2.1– CRU-TS v4.09 dataset reproduces both maximum and minimum temperature variability with high accuracy and considerably lower uncertainty than observed for precipitation.

3.4. Rescaled Adjusted Partial Sums (RAPS) Analysis

3.4.1. Precipitation

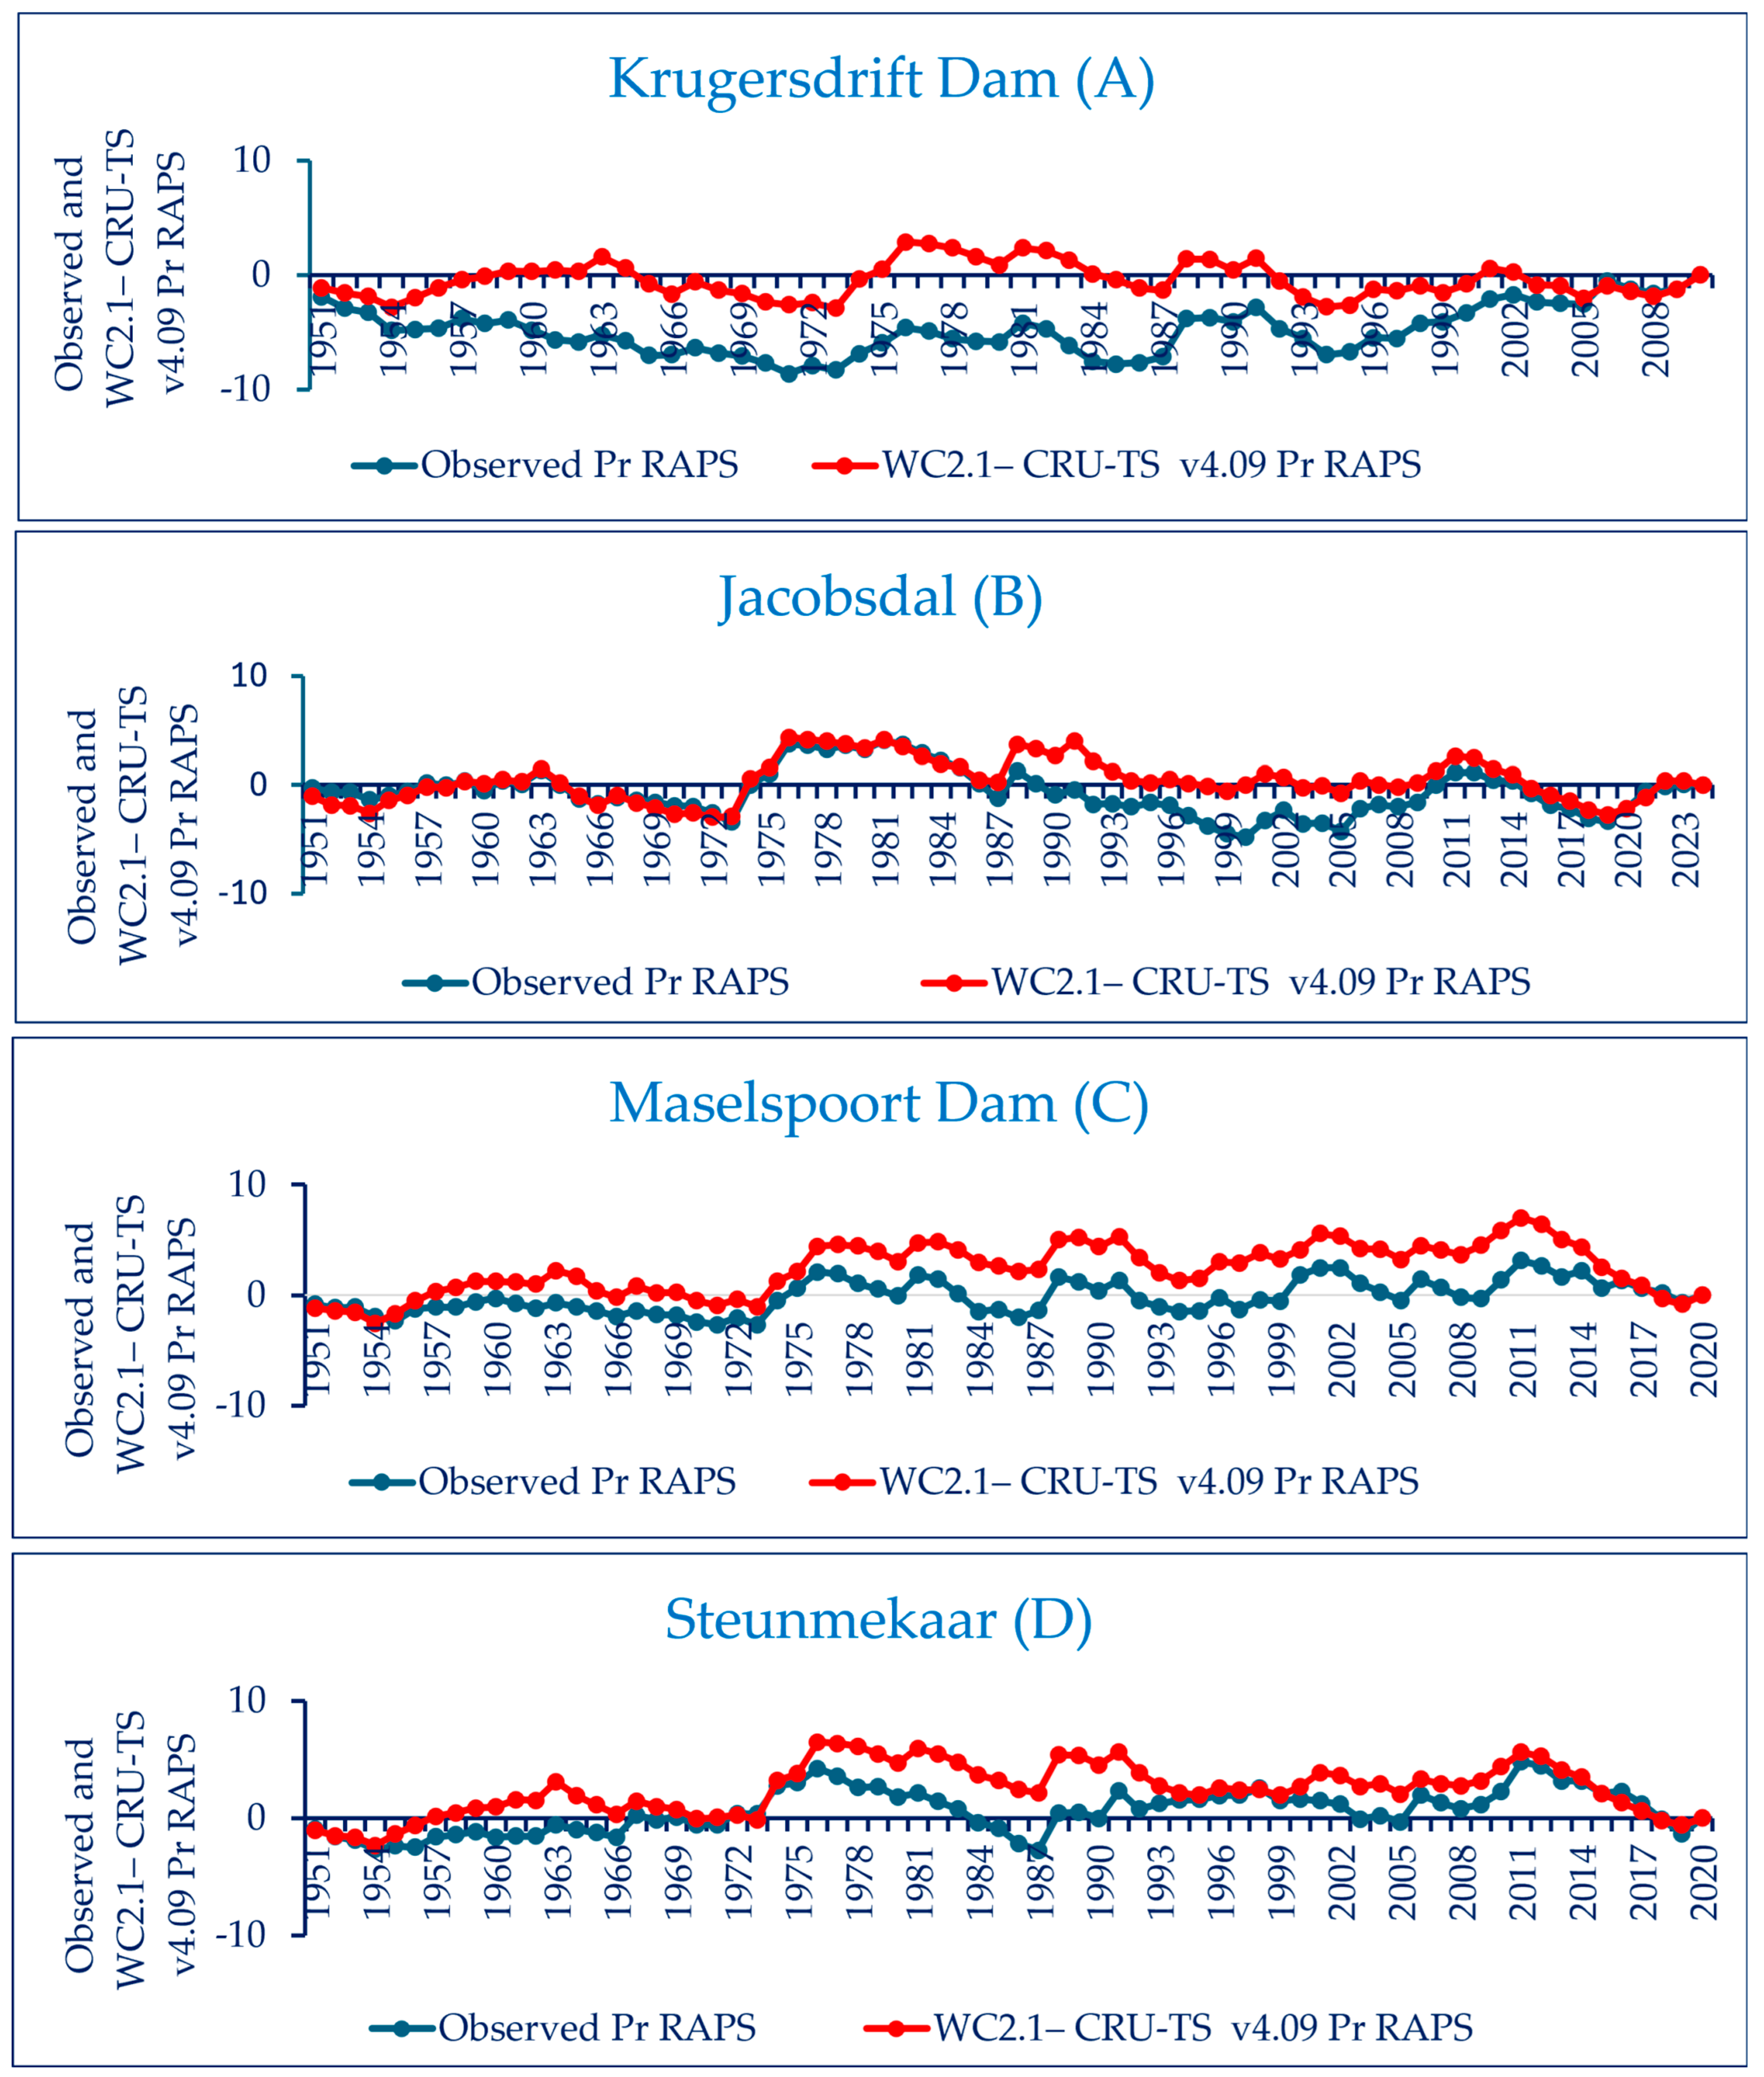
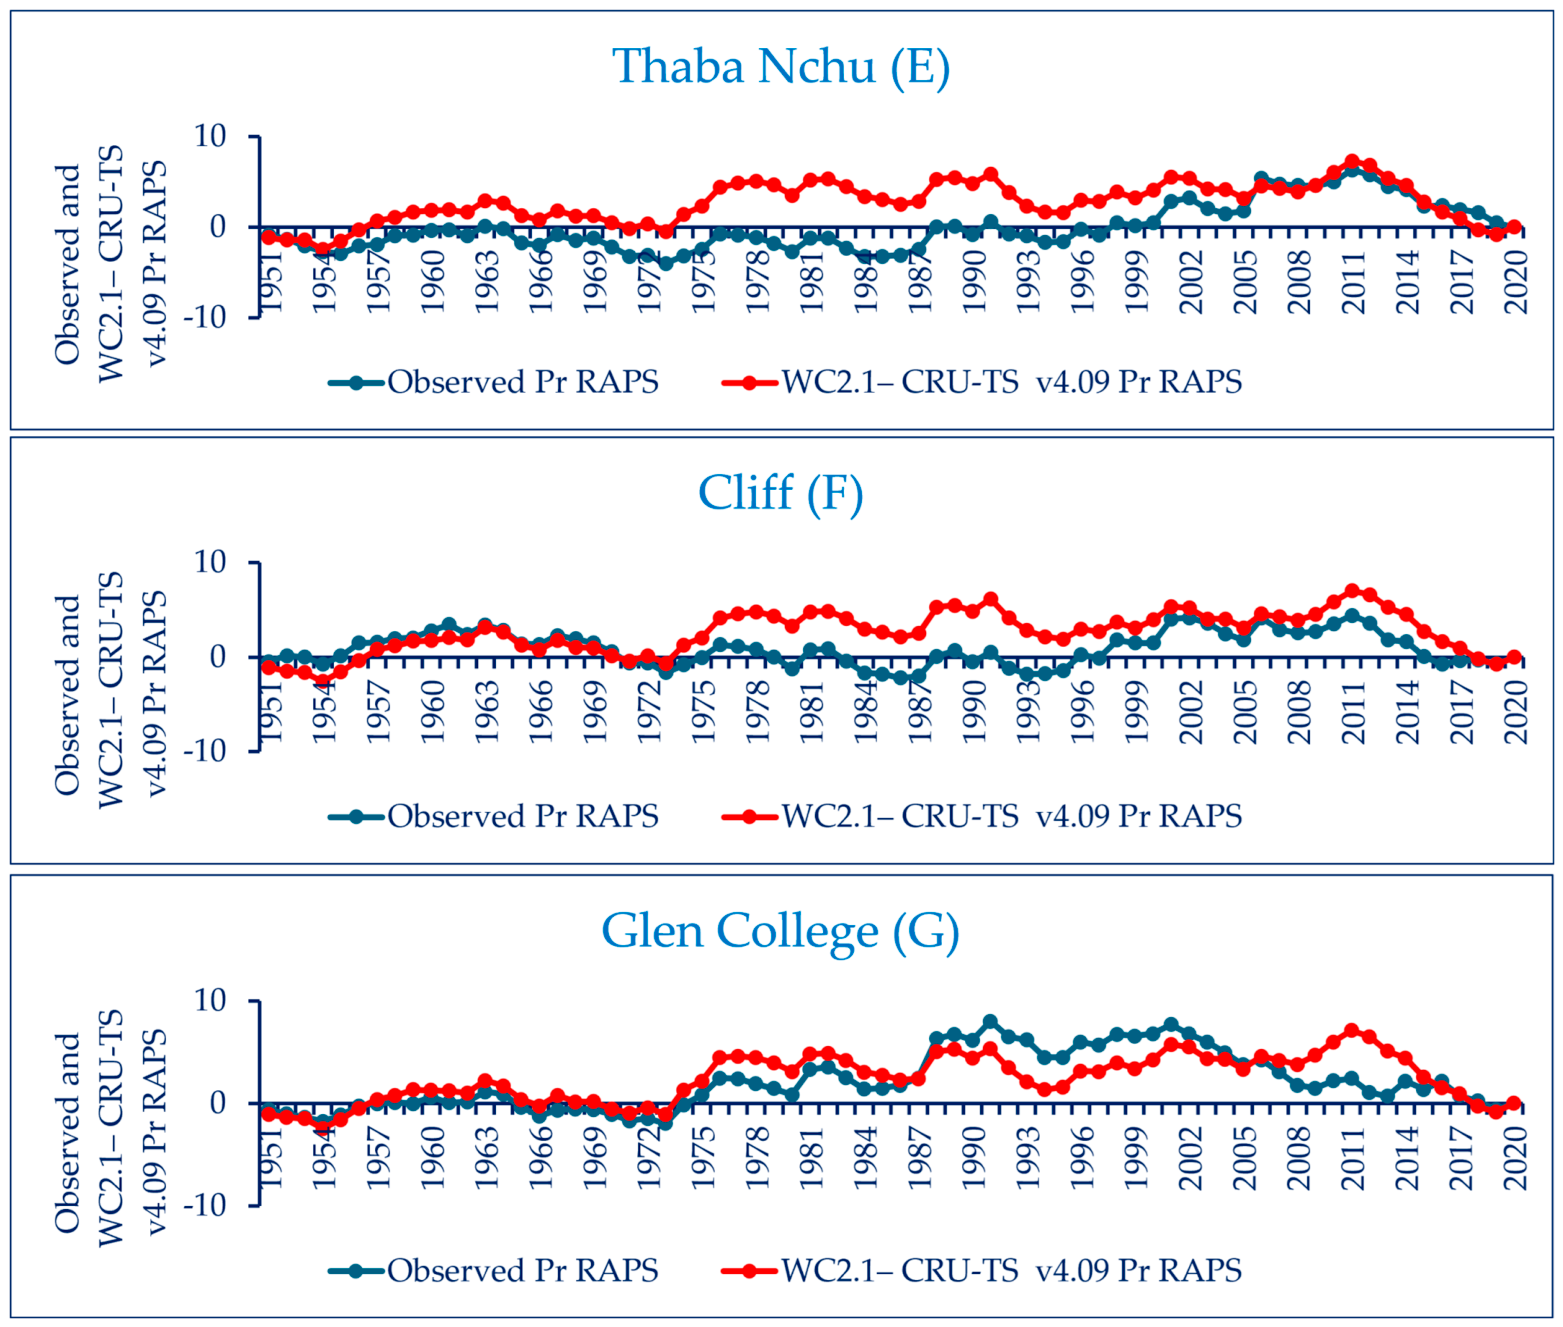
The RAPS analysis revealed that both observed station records and the WC2.1– CRU-TS v4.09 dataset captured the major temporal transitions between dry and wet periods across the C5 SDR catchment, although differences in the magnitude and persistence of cumulative anomalies were evident (Figure 10). At most stations, the observed series exhibited stronger, more persistent drought conditions, whereas the gridded dataset showed smoother fluctuations and generally weaker negative departures. At Krugersdrift Dam, the WC2.1– CRU-TS v4.09 dataset reproduced the general temporal pattern of rainfall variability but attenuated the magnitude and persistence of long-term negative anomalies (Figure 10A). Consequently, the dataset underestimated the severity of prolonged drought conditions while preserving the overall hydroclimatic regime. In contrast, Maselspoort, Steunmekaar, Cliff, and Thaba Nchu showed a tendency for the WC2.1– CRU-TS v4.09 dataset to overestimate cumulative wetness, particularly after the mid-1970s. Jacobsdal exhibited the closest agreement between observed and gridded series, indicating better representation of local rainfall variability. Importantly, both observed and gridded series consistently identified the principal hydroclimatic transition from relatively dry conditions during the 1950s–early 1970s to wetter conditions thereafter. The ability of the gridded dataset to reproduce these major regime shifts demonstrates that it preserves long-term climatic signals despite attenuating the magnitude of local anomalies.
Despite these station-specific differences, both datasets consistently identified the dominant hydroclimatic regime shift from relatively dry conditions during the 1950s–early 1970s to wetter conditions thereafter. This suggested that the gridded product adequately reproduces the regional temporal rainfall variability of the catchment. Overall, the results indicate that WC2.1– CRU-TS v4.09 captures broad-scale hydroclimatic signals but tends to smooth local extremes and attenuate the magnitude of cumulative rainfall anomalies. Consequently, while the dataset may be less suitable for station-scale drought characterization, it provides a reasonable representation of long-term rainfall variability at the catchment scale.

3.4.2. Minimum and Maximum Temperature

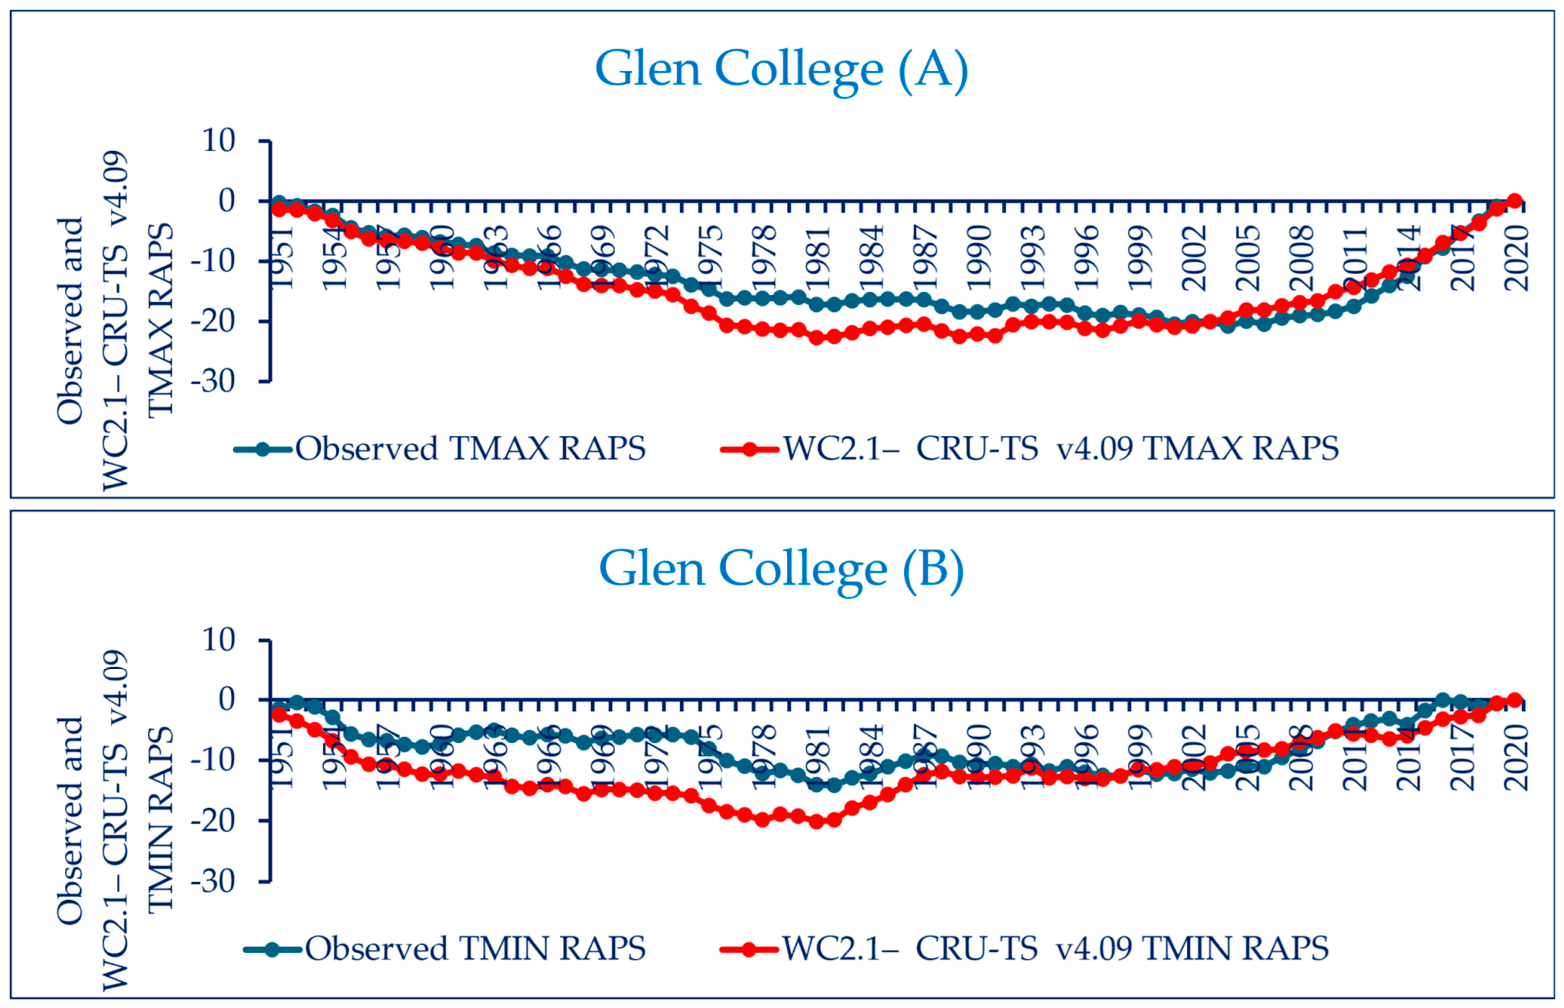
The RAPS analysis revealed strong consistency between observed and gridded temperature records for both TMAX and TMIN (Figure 11). The cumulative anomaly curves identified similar transitions between relatively cooler and warmer periods and consistently indicated a long-term warming tendency. Agreement was strongest for TMAX, where the magnitude and timing of cumulative anomalies closely matched observations (Figure 11A). Although slightly larger deviations were evident for TMIN, the principal temperature regime shifts were reproduced successfully, indicating that the WC2.1– CRU-TS v4.09 dataset preserves the dominant long-term temperature signals of the study area.

3.5. Analysis of Extreme Events Using the 95th Percentile

3.5.1. Precipitation Extremes

The 95th-percentile analysis quantitatively confirms the reduced performance of the WC2.1– CRU-TS v4.09 dataset during extreme rainfall events (Table 1). Extreme-event thresholds ranged from 633.9 mm at Jacobsdal to 889.8 mm at Thaba Nchu. This reflected substantial spatial variability in annual precipitation regimes across the catchment. Despite very high coefficients of determination (R2 = 0.974–0.997), indicating that the dataset successfully reproduces the timing and relative variability of extreme events, error magnitudes increased considerably under extreme rainfall conditions. RMSE values ranged from 86.6 mm at Jacobsdal to 246.7 mm at Thaba Nchu, while MAE values varied between 77.7 mm and 192.1 mm. Negative PBIAS values (−5.5% to −21.0%) indicate a systematic tendency to underestimate high-intensity precipitation across most stations. The largest maximum residual (427.8 mm at Thaba Nchu) and the highest residual variability were observed at stations characterized by stronger convective rainfall influences, demonstrating the difficulty of reproducing localized precipitation extremes using gridded interpolation. In contrast, Jacobsdal exhibited the lowest error statistics and residual variability, indicating the most reliable representation of extreme rainfall conditions.
Overall, the results demonstrate that although the dataset effectively captures the occurrence and temporal variability of extreme precipitation events, uncertainty increases substantially beyond the 95th-percentile threshold owing to the attenuation of localized high-intensity rainfall. These findings highlight the suitability of the dataset for regional hydroclimatic assessments while emphasizing the need for caution when applying it to flood-risk analysis, design-storm estimation, and other applications sensitive to precipitation extremes.

3.5.2. Temperature Extremes

The evaluation of extreme temperature events based on the 95th-percentile threshold demonstrated excellent agreement between the observed records and the WC2.1– CRU-TS v4.09 dataset for both maximum and minimum temperatures at Glen College station (Table 2). The threshold values were 27.4 °C for TMAX and 8.5 °C for TMIN, with four extreme events identified for each variable, indicating that the analysis captured the most anomalously warm years within the historical record.
The coefficients of determination were exceptionally high, reaching 1.000 for TMAX and 0.999 for TMIN, indicating that the gridded dataset almost perfectly reproduced the temporal occurrence and variability of extreme temperature events. Between the two variables, TMAX exhibited slightly better agreement, although both variables showed nearly identical correspondence with the observed records.
Error statistics further confirmed the strong performance of the dataset. TMIN exhibited the smallest deviations, with RMSE and MAE values of 0.5 °C and 0.42 °C, respectively, together with a residual standard deviation of only 0.1 °C, indicating highly accurate representation of extreme minimum temperature conditions. In comparison, TMAX showed slightly larger errors, with RMSE and MAE values of 1.5 °C and 1.4 °C, respectively, and a residual standard deviation of 0.4 °C. Nevertheless, these values remained low, reflecting excellent agreement between observed and modeled extreme temperatures.
Bias statistics revealed only minor underestimation of extreme temperatures, with PBIAS values of −4.9% for TMAX and −4.8% for TMIN. The maximum residual reached 2.32 °C for TMAX and 0.64 °C for TMIN, while minimum residuals were equal to zero for both variables, indicating the absence of substantial overestimation. Overall, the results demonstrate that the WC2.1– CRU-TS v4.09 dataset accurately captures both the timing and magnitude of extreme temperature events. Compared with precipitation extremes, temperature extremes were reproduced with considerably smaller errors and lower residual variability, highlighting the greater robustness of the gridded dataset in representing temperature variability.

3.6. Statistical Performance Evaluation

3.6.1. Precipitation

The quantitative evaluation of the WC2.1– CRU-TS v4.09 precipitation dataset against observed station records provides a robust statistical complement to the temporal, scatter-based, and residual analyses. The performance metrics summarized in Table 3 assess temporal agreement, magnitude accuracy, and systematic bias across the seven stations.
Correlation analysis indicates strong temporal agreement between observed and gridded precipitation, with R2 ranging from 0.62 at Glen College to 0.80 at Jacobsdal, and R ranging from 0.78 to 0.90. These results quantitatively confirm the strong linear relationships observed in the time-series comparisons (Figure 3) and scatter plots (Figure 7). The highest correlation values at Jacobsdal are consistent with the strong visual correspondence identified in earlier analyses, while lower correlations at Glen College reflect the greater temporal variability observed at this station.
Error magnitude metrics further support these findings. RMSE values range from 77.86 mm at Jacobsdal to 95.12 mm at Steunmekaar, while MAE values range between 62.66 mm and 72.74 mm. The RRMSE varies from 13.30% at Thaba Nchu to 22.70% at Steunmekaar, indicating generally good magnitude accuracy across stations, with larger relative errors occurring at sites characterized by higher rainfall variability. These results are consistent with the increased residual dispersion observed at Steunmekaar.
Bias assessment using PBIAS reveals small but station-specific systematic deviations, ranging from −5.02% to +8.64%. Negative PBIAS values at Krugersdrift Dam, Maselspoort Dam, and Thaba Nchu indicate slight underestimation, in agreement with the tendencies identified in the scatter and residual analyses. Conversely, positive PBIAS values at Jacobsdal, Steunmekaar, and Cliff reflect mild overestimation, consistent with the relative positioning of points above the 1:1 line in Figure 7 and the residual patterns in Figure 8.
Model efficiency assessed using the NSE, ranges from 0.61 at Glen College to 0.90 at Krugersdrift Dam. These values indicate good to very good model performance at most stations and confirm that the WC2.1– CRU-TS v4.09 dataset reliably reproduces observed precipitation dynamics, particularly in terms of temporal variability.
Overall, the statistical metrics corroborate the results of the temporal, scatter-based, and residual analyses, demonstrating that the gridded dataset provides a robust representation of precipitation patterns across the study area. While station-specific under- or overestimation persists, most notably at highly variable sites such as Glen College, the combined evidence indicates that the dataset is suitable for regional-scale climate analysis and baseline hydrological applications, with appropriate caution required for applications sensitive to extreme precipitation.

3.6.2. Maximum and Minimum Temperature

The statistical evaluation demonstrated good agreement between the observed and WC2.1– CRU-TS v4.09 temperature series for both maximum and minimum temperatures at Glen College station (Table 4).
Among the two variables, TMAX exhibited the strongest performance, with R2 of 0.75 and R of 0.87, indicating a strong linear relationship between observed and modeled values. The associated RMSE and MAE values were 0.56 °C and 0.40 °C, respectively, while the RRMSE was only 2.22%, reflecting very small deviations relative to the observed temperature range. Furthermore, the PBIAS value of −0.61% indicates negligible underestimation, and the NSE of 0.72 demonstrates good predictive capability.
In comparison, TMIN exhibited relatively weaker but still satisfactory performance. The coefficient of determination (R2 = 0.55) and correlation coefficient (R = 0.74) indicate a moderate to strong association between observed and modeled minimum temperatures. TMIN showed lower absolute errors, with RMSE and MAE values of 0.40 °C and 0.30 °C, respectively; however, the relative error was larger, as indicated by an RRMSE of 5.04%. In contrast to TMAX, TMIN displayed a slight tendency toward overestimation, with a PBIAS value of 1.4%, and a lower NSE value (0.50), suggesting comparatively reduced predictive skill.
Despite these differences, both temperature variables exhibited low error magnitudes and acceptable efficiency values, indicating that the WC2.1– CRU-TS v4.09 dataset effectively reproduces historical temperature variability at Glen College station. Overall, TMAX demonstrated the highest overall accuracy and predictive performance, whereas TMIN showed comparatively lower agreement but remained within acceptable limits for hydroclimatic and water-resource applications.

4. Discussion

4.1. Performance Evaluation of the WC2.1– CRU-TS v4.09 Climate Dataset and Its Implications for Semi-Arid Hydrology

The present study demonstrates that the WC2.1– CRU-TS v4.09 dataset successfully reproduces the principal temporal characteristics of precipitation across the C5 SDR catchmen (Figure 3, Figure 5, Figure 7, Figure 8 and Figure 10, and Table 1 and Table 3). The validation results demonstrate that the WC2.1– CRU-TS v4.09 dataset reproduced historical temperature variability well at Glen College station (Figure 4, Figure 6, Figure 9 and Figure 11, and Table 2 and Table 4). However, because only one station possessed sufficiently complete long-term temperature observations, these findings should be interpreted cautiously and should not be generalized to the entire C5 SDR catchment.
The observed spatial differences in precipitation performance are likely influenced by physiographic and climatic variability across the catchment, particularly variations in topography and elevation, which are known to significantly affect rainfall distribution and dataset accuracy [68,69,70]. The study area spans an elevation gradient exceeding 400 m, ranging from 1133 m at Jacobsdal to 1535 m at Thaba Nchu (Figure 2 and Table S1), and includes transitions between the Grassland and Nama Karoo biomes [58,61]. Stations located at lower elevations, particularly Jacobsdal, exhibited the strongest agreement with observed precipitation records, whereas comparatively weaker performance was observed at Glen College and Steunmekaar (Table 3). These differences are likely associated with the increasing influence of localized convective storms, topographic effects, and microclimatic variability at higher elevations, which have been widely documented in semi-arid and topographically complex environments [71,72,73]. Because gridded climate datasets represent spatial averages over grid cells, localized rainfall processes are inherently more difficult to reproduce than broad-scale precipitation patterns. Similar elevation-dependent behavior has been reported for gridded precipitation products in semi-arid and topographically heterogeneous environments [20,71,72,74,75].
The scatterplot and residual analyses of precipitation provide deeper insight into dataset behavior. Despite strong linear correlations across all stations, clear station-specific bias patterns were evident. Underestimation was more pronounced at Krugersdrift Dam, Maselspoort Dam, and Thaba Nchu, whereas Jacobsdal and Cliff exhibited slight overestimation (Figure 7). Residual analysis further revealed that error magnitudes increased with precipitation intensity, indicating heteroscedastic behavior and reduced model performance under high-rainfall conditions (Figure 8). This intensity-dependent bias is widely reported in precipitation datasets, where errors tend to increase with rainfall magnitude due to difficulties in capturing extreme events [76].
Such mixed bias behavior reflects the combined influence of local climatic variability, rainfall regimes, station representativeness, and interpolation methodologies [77]. Empirical studies from regions including Madagascar, the Western Mediterranean, and West Africa have shown that gridded datasets can effectively reproduce long-term mean precipitation and broad climatic patterns but often exhibit systematic location- and season-dependent biases, particularly under convective and extreme rainfall conditions [23,76,78]. This behavior is consistent with a well-recognized limitation of gridded precipitation products, whereby spatial interpolation and grid-cell averaging dampen localized rainfall peaks and smooth precipitation extremes, thereby reducing their ability to accurately represent high-intensity precipitation events [77,79,80,81].
In contrast, temperature residuals based on data from a single station were centered near zero and showed lower dispersion than precipitation residuals (Figure 9). While spatial interpretation is limited, this reflects the smoother and more continuous nature of temperature fields compared to the localized variability of precipitation. Notably, maximum temperature is generally reproduced more accurately than minimum temperature, as observational uncertainty and model errors are typically greater for minimum temperatures, as demonstrated in studies over the Iberian Peninsula [82].
Agreement between observed and gridded data was consistently supported by multiple independent validation approaches, including temporal comparison, scatter and residual analyses, statistical performance metrics, ITA, RAPS, and extreme-event assessment (Figure 3, Figure 4, Figure 5, Figure 6, Figure 7, Figure 8, Figure 9, Figure 10 and Figure 11 and Table 1, Table 2, Table 3 and Table 4). The consistency among these complementary methods provides stronger evidence of dataset reliability than reliance on a single statistical indicator because it demonstrates that the dataset preserves not only numerical agreement but also the long-term evolution, variability, and persistence of regional climatic conditions. This integrated evaluation approach is consistent with established model-assessment guidelines, which recommend the combined use of graphical techniques and statistical performance measures to achieve a comprehensive and robust evaluation of dataset performance [49].
While conventional performance metrics (R2, NSE, RMSE, MAE, and PBIAS) demonstrate statistical agreement between the observed and gridded climate data, they primarily evaluate correlation, prediction accuracy, and systematic bias and do not determine whether the dataset preserves long-term temporal behavior across different magnitudes of the climate distribution [49,83]. Moreover, published model-evaluation guidelines recommend the combined use of graphical techniques and dimensionless and error-index statistics because no single measure can adequately assess all aspects of dataset performance [49]. Accordingly, conventional performance metrics (R2, NSE, RMSE, MAE, and PBIAS) were complemented by ITA, RAPS, and extreme-value analyses to provide a more comprehensive evaluation of statistical agreement, temporal variability, trend behavior, cumulative anomalies, and climate extremes (Figure 5, Figure 6, Figure 10 and Figure 11, and Table 1 and Table 2).
The ITA was employed as a complementary approach to evaluate trends separately for low-, medium-, and high-value observations without requiring assumptions of normality or serial independence [52]. The close agreement between the observed and gridded ITA patterns indicates that the WC2.1– CRU-TS v4.09 dataset preserves the long-term evolution of hydroclimatic conditions (Figure 5 and Figure 6). This is particularly important for hydrological applications because trends in low precipitation influence drought persistence and water availability, whereas changes in high precipitation affect runoff generation, groundwater recharge, and flood risk. Likewise, preserving long-term temperature trends is essential for representing evapotranspiration and catchment water balance under changing climatic conditions [16]. Furthermore, RAPS complements ITA by identifying cumulative climatic anomalies and regime shifts (Figure 10 and Figure 11), while the 95th-percentile analysis evaluates the dataset’s ability to reproduce climate extremes (Table 1). Such information is particularly valuable in semi-arid catchments, where long-term climatic variability strongly influences hydrological processes, water-resource availability, and environmental management. Thus, ITA and RAPS analyses provide valuable information beyond conventional validation metrics by assessing temporal variability, trend characteristics, and annual temperature and precipitation extremes [51,53]. Collectively, these complementary methods provide a comprehensive validation framework that assesses statistical performance, temporal trend preservation, cumulative anomalies, regime shifts, and climate extremes, thereby providing greater confidence in the suitability of the dataset for hydrological modeling and climate-change impact assessments than any single evaluation metric alone [49].
For precipitation, the strongest agreement was observed at Jacobsdal, whereas greater departures at Glen College suggest increased sensitivity to local rainfall variability (Figure 5). This finding agrees with a well-documented limitation in regions influenced by convective processes and spatial heterogeneity [79,84,85,86]. For temperature, both TMAX and TMIN exhibited consistent warming tendencies, with TMAX showing slightly greater agreement (Figure 6), in line with studies indicating higher uncertainty in minimum temperature estimates [82].
The RAPS analysis similarly demonstrated that the gridded dataset successfully reproduced major hydroclimatic regime shifts, including the transition from relatively dry conditions during the 1950s–early 1970s to wetter conditions thereafter (Figure 10). However, the magnitude of cumulative anomalies was generally attenuated in the gridded series, indicating that local hydroclimatic extremes are partially smoothed during the downscaling and interpolation process (Figure 10).
The extreme-event analysis based on the 95th-percentile threshold further highlights the strengths and limitations of the dataset (Table 1 and Table 2). Although very high coefficients of determination (R2 = 0.974–0.997) demonstrate that the timing and occurrence of extreme precipitation events are reproduced successfully, this shows that error magnitudes increased substantially during extreme years (Table 1). RMSE values reached 246.7 mm, maximum residuals exceeded 400 mm at Thaba Nchu, and negative PBIAS values indicated systematic underestimation of high-intensity rainfall (Table 1). These results confirm that uncertainty increases beyond the 95th-percentile threshold, particularly in areas influenced by localized convective rainfall and topographical variation. Similar limitations have been reported for a wide range of gauge-based, satellite-derived, and reanalysis precipitation products, where interpolation and spatial averaging reduce the magnitude of localized precipitation extremes [77,87]. In contrast, extreme temperature events were reproduced with very high accuracy, exhibiting minimal residual variability and negligible bias, further demonstrating the greater robustness of gridded temperature products relative to precipitation. This is consistent with previous studies showing that temperature datasets generally exhibit lower uncertainty and more consistent performance, whereas precipitation products display variability [88,89].
The present findings are consistent with previous evaluations of WorldClim and CRU-derived climate datasets conducted in semi-arid and climatically heterogeneous regions. Several studies have reported that these gridded products reproduce long-term temperature variability with high accuracy, while precipitation is generally represented more reliably at regional than at local scales because spatial interpolation and bias-correction procedures tend to smooth localized rainfall extremes and convective precipitation [9,10,90]. The observed attenuation of high-intensity precipitation and cumulative rainfall anomalies in the present study is therefore consistent with the documented limitations of gridded climate datasets in representing station-scale variability, despite their ability to preserve regional hydroclimatic patterns. These findings further support the application of the WC2.1– CRU-TS v4.09 dataset for regional hydrological modeling and climate-change impact assessments, while highlighting the need for caution in applications requiring accurate representation of localized precipitation extremes, such as flood-frequency analysis and design-storm estimation.
Moreover, the results obtained in this study are consistent with previous evaluations of CRU-TS and other gridded climate datasets. Studies conducted across Africa, Asia, and other semi-arid regions have demonstrated that bias correction and statistical downscaling substantially improve the representation of mean climatic conditions and seasonal variability, although limitations associated with localized precipitation extremes often remain only partially resolved [41,87,91]. Similarly, evaluations in the Three-River Headwaters Region demonstrated that CRU-TS tends to underestimate precipitation magnitude while adequately preserving temporal variability and broad spatial patterns [44]. In data-sparse regions, multi-criteria assessments have further shown that CRU-TS exhibits moderate to high performance for monthly precipitation estimation and ranks among the better-performing gridded climate products for long-term climatological applications. Although satellite- and multi-source products may better capture localized and high-intensity rainfall events, CRU-TS provides a robust representation of seasonal precipitation patterns and long-term climate variability, making it well suited for climate and environmental studies where observational records are limited [88]. Consistent with these findings, CRU-TS has also been reported to exhibit strong agreement with observed climatic records [42]. Furthermore, a recent study reported that both raw and downscaled CRU-TS datasets demonstrated acceptable performance when compared with observed monthly precipitation records [41]. Comparative assessments further indicate that uncertainties are inherent across all major precipitation products, including CRU-TS, CHIRPS, CPCU, GPCC, ERA5, and TAMSAT, with performance varying according to station desity, topography, climatic regime, and methodological framework [21,22,23,70,77,92]. Therefore, the strong agreement observed in the present study further supports the suitability of the WorldClim– CRU-TS framework as a reliable climatic baseline for hydroclimatic investigations and hydrological modeling in data-scarce environments.
From a hydrological modeling perspective, these findings indicate that the WC2.1– CRU-TS v4.09 dataset is suitable for long-term simulations of water balance, evapotranspiration, and climate-change impacts. However, the slight underestimation of high-intensity precipitation identified in the extreme-event analysis should be considered when applying the dataset to precipitation-extreme-sensitive analyses and modeling such as flood frequency analysis. Smoothing precipitation extremes may lead to underestimation of runoff, groundwater recharge, flood peaks, and water-yield estimates, particularly in semi-arid catchments where a few intense storms contribute substantially to annual runoff. Nevertheless, the strong agreement in long-term precipitation and temperature characteristics suggests that the dataset provides a reliable climatic baseline for regional hydrological modeling and climate-change impact assessments, provided that limitations in representing localized extreme rainfall are acknowledged [27,37].
Overall, the findings demonstrate that the WC2.1– CRU-TS v4.09 dataset effectively represents annual climate variability across the C5 SDR catchment. While caution is required when analyzing localized precipitation extremes, the dataset provides a robust basis for climate characterization, hydroclimatic assessment, drought analysis, and future climate-change studies.

4.2. Implications for Hydrological Modeling and Climate Applications

The validation results indicate that the WC2.1– CRU-TS v4.09 dataset provides a reliable climatic baseline for hydroclimatic assessments in the C5 SDR and similar semi-arid environments. Strong agreement between observed and gridded precipitation records, together with satisfactory reproduction of temperature variability, demonstrates that the dataset effectively captures the dominant climatic processes governing seasonal and interannual hydroclimatic variability. Consequently, the dataset is particularly suitable for applications operating at annual temporal scales, including climate characterization, drought monitoring, hydrological modeling, climate-change impact studies, and regional hydroclimatic analyses.
The combined use of statistical performance metrics, ITA, RAPS, and extreme-event diagnostics further demonstrates that the dataset preserves not only mean climatic conditions but also long-term climatic tendencies and major hydroclimatic regime shifts. The successful reproduction of observed warming trends, wet–dry transitions, and interannual variability enhances confidence in its application for climate variability and climate-change investigations. These findings are particularly relevant in data-scarce regions where long-term observational records are limited or spatially discontinuous.
Although the present study did not directly implement a hydrological model, the observed performance metrics indicate that the dataset provides a robust climatic foundation for future hydroclimatic and ecosystem-service modeling applications. Because the dataset reliably reproduces seasonal variability, long-term climatic trends, and hydroclimatic regime shifts, it is well suited for annual climate assessments at the regional scale and provides robust climatic forcing for watershed-scale hydrological modeling, ecosystem service assessments, and water resource evaluations. However, the systematic underestimation of extreme precipitation events identified in the 95th-percentile analysis indicates that caution is required when applying the dataset to hydrological investigations focused on flood generation, peak-flow estimation, or design-storm analysis. For such applications, additional local bias adjustment and validation procedures are recommended.
Overall, the strong agreement between the WC2.1– CRU-TS v4.09 historical dataset and the observed climatic records indicates that the dataset reliably reproduces the spatial and temporal characteristics of precipitation across the study area and temperature variability at Glen College station. These findings support its suitability as a reliable historical baseline for hydrological modeling, climate-change impact assessments, and related environmental applications.

4.3. Limitations and Future Research

Despite the generally strong agreement between observed and gridded climate data, several limitations should be acknowledged. First, the analysis was restricted to stations possessing sufficiently long and quality-controlled records. Although this approach improves the reliability of the validation results, the spatial representativeness of station observations remains constrained by the distribution of available meteorological stations within the catchment.
Second, although precipitation, maximum temperature (TMAX), and minimum temperature (TMIN) were evaluated, temperature validation was only possible at Glen College because long-term continuous temperature observations were unavailable at the remaining stations. Consequently, additional temperature validation across a broader spatial network would further strengthen confidence in the regional applicability of the dataset.
Third, the results demonstrate that uncertainty increases substantially during extreme rainfall conditions. While the WC2.1– CRU-TS v4.09 dataset successfully reproduces the timing and occurrence of extreme precipitation events, it systematically underestimates their magnitude. This limitation is consistent with the well-documented tendency of gridded climate products to smooth localized convective rainfall through spatial interpolation and grid-cell averaging [77]. As a result, caution is required when applying the dataset to analyses focused on flood hazards, rainfall intensity estimation, or infrastructure design.
Future research should extend the validation framework through the incorporation of additional meteorological variables, expanded temperature observations, and more comprehensive analyses of climatic extremes. Furthermore, direct implementation of the validated dataset within hydrological and ecosystem-service modeling frameworks would provide a practical assessment of how climatic uncertainty propagates into model outputs.

5. Conclusions

This study evaluated the performance of the WC2.1– CRU-TS v4.09 climate dataset against long-term meteorological observations from seven stations distributed across the C5 SDR catchment of central South Africa. The assessment integrated temporal validation, statistical performance metrics, scatter and residual analyses, ITA, RAPS, and extreme-event evaluation to provide a comprehensive assessment of dataset reliability for hydroclimatic applications.
The results demonstrate that the precipitation dataset successfully reproduces the dominant temporal variability of observed rainfall, with strong agreement across stations (R = 0.78–0.90, R2 = 0.62–0.80, and NSE = 0.61–0.90). The temperature datasets, evaluated only at Glen College due to the unavailability of comparable long-term temperature records at the other stations, also performed well, with TMAX exhibiting stronger agreement than TMIN and both variables reproducing observed interannual variability with low error magnitudes and acceptable efficiency values. These findings indicate that the downscaling and bias-correction procedures effectively preserve the major climatic characteristics of the study area.
The analyses further revealed that dataset performance varies according to local physiographic and climatic conditions. Stations located in areas characterized by stronger topographic influences and localized convective rainfall, particularly Thaba Nchu, Cliff, and Steunmekaar, exhibited greater uncertainty than lower-elevation stations such as Jacobsdal. ITA and RAPS analyses demonstrated that the gridded dataset successfully reproduces long-term climatic tendencies, major hydroclimatic regime shifts, and transitions between wetter and drier periods, although the magnitude of local anomalies is generally attenuated.
The 95th-percentile analysis showed that precipitation uncertainty increases substantially during extreme rainfall conditions. While the timing and occurrence of extreme events were reproduced successfully (R2 = 0.974–0.997), the dataset systematically underestimated the magnitude of high-intensity rainfall, with PBIAS values ranging from −5.5% to −21.0%. In contrast, extreme temperature events were reproduced with very high accuracy and minimal bias. These results indicate that precipitation extremes remain a principal source of uncertainty and should be interpreted cautiously in applications sensitive to flood-generating rainfall.
Overall, the findings indicate that the WC2.1– CRU-TS v4.09 dataset provides a reliable climatic baseline for annual-scale climate analyses across the C5 SDR catchment. The dataset is particularly suitable for regional hydroclimatic assessment, drought studies, water-balance investigations, and climate-change impact analyses. However, additional local correction and validation are recommended when applying the dataset to station-scale studies or analyses requiring accurate representation of precipitation extremes.

Supplementary Materials

The following supporting information can be downloaded at: https://www.mdpi.com/article/10.3390/hydrology13080206/s1, Table S1 provides the metadata for the seven meteorological stations selected for climate data validation, including station name, geographic coordinates (latitude and longitude), elevation (m a.s.l.), climatic variable(s) measured (precipitation and/or temperature), period of record, and the overlapping period used for comparison with the WC2.1– CRU-TS v4.09 dataset. Stations exhibiting extensive data gaps were excluded from the analysis, whereas stations with complete records or less than 5% missing observations were retained. Validation statistics were computed independently for each station using the full period of overlapping observed and gridded data. Krugersdrift Dam station had a shorter overlapping period than the remaining stations because of differences in data availability.

Author Contributions

Conceptualization, K.H. and Y.E.W.; methodology, K.H.; software, K.H. and Y.E.W.; validation, K.H.; formal analysis, K.H.; investigation, K.H.; resources, K.H. and Y.E.W.; data curation, K.H. and Y.E.W.; writing—original draft preparation, K.H. and Y.E.W.; writing—review and editing, Y.E.W.; visualization, K.H., supervision, Y.E.W.; project administration, Y.E.W.; funding acquisition, Y.E.W. All authors have read and agreed to the published version of the manuscript.

Funding

This research received no external funding.

Data Availability Statement

Observed meteorological data used in this study were obtained from the South African Weather Service (SAWS) under data-sharing arrangements applicable to research use. Gridded climate datasets used in this study were sourced from the WorldClim database, which provides high-resolution global climate surfaces based on interpolated station observations. The historical monthly climate data is publicly available at: https://worldclim.org/data/monthlywth.html (accessed on 5 January 2026). Observed data supporting the findings of this study will be made available through an accessible web link or upon reasonable request, subject to data-use agreements.

Acknowledgments

The authors acknowledge the South African Weather Service (SAWS) for providing access to the observed meteorological data used in this study. The Central University of Technology (CUT) is also acknowledged for providing institutional support and research resources. Gridded climate data were obtained from the WorldClim database, and the developers of this dataset are gratefully acknowledged.

Conflicts of Interest

The authors declare no conflicts of interest.

Abbreviations

The following abbreviations are used in this manuscript:
CRU TSClimatic Research Unit Time Series
InVESTIntegrated Valuation of Ecosystem Services and Tradeoffs
MAEMean Absolute Error
NSENash–Sutcliffe efficiency
RSMERoot Mean Square Error
ITAInnovative Trend Analysis
RAPSRescaled Adjusted Partial Sums

References

  1. Onyutha, C. Climate Change Impacts on Hydrology and Water Resources in East Africa Considering CMIP3, CMIP5, and CMIP6. Front. Clim. 2024, 6, 1453726. [Google Scholar] [CrossRef]
  2. Xiang, Y.; Wang, Y.; Chen, Y.; Zhang, Q. Impact of Climate Change on the Hydrological Regime of the Yarkant River Basin, China: An Assessment Using Three SSP Scenarios of CMIP6 GCMs. Remote. Sens. 2021, 14, 115. [Google Scholar] [CrossRef]
  3. Enawgaw, A.; Asmare, A.; Nigussie, B.; Worku, D.; Fikru, A. Evaluating Climate Change Impact on the Hydrology of Kessie Watershed, Upper Blue Nile Basin, Ethiopia International Panel for Climate Change. Appl. Water Sci. 2023, 13, 148. [Google Scholar] [CrossRef]
  4. Xander, W.; Lirong, L. The Impacts of Climate Change on the Hydrological Cycle and Water Resource Management. Water 2023, 15, 2342. [Google Scholar] [CrossRef]
  5. Manuel, J.; Chivambo, F.; Bonde, F.; Chichava, I.; Abuchir, J.; Cuinica, S.; Muhala, V. Effect of Climate Change on Water Resources Management: A Review of the Literature. Urban Plan. Transp. Res. 2025, 13, 2504488. [Google Scholar] [CrossRef]
  6. Gebrechorkos, S.; Leyland, J.; Slater, L.; Wortmann, M.; Ashworth, P.J.; Bennett, G.L.; Boothroyd, R.; Cloke, H.; Delorme, P.; Griffith, H.; et al. A High-Resolution Daily Global Dataset of Statistically Downscaled CMIP6 Models for Climate Impact Analyses. Sci. Data 2023, 10, 611. [Google Scholar] [CrossRef] [PubMed]
  7. Michalek, A.T.; Villarini, G.; Kim, T. Understanding the Impact of Precipitation Bias—Correction and Statistical Downscaling Methods on Projected Changes in Flood Extremes. Earth’s Futur. 2024, 12, e2023EF004179. [Google Scholar] [CrossRef]
  8. Alasqah, A.; Tayyeh, H.K.; Mohammed, R.; Hussein, A.M.; Khedher, K.M.; Benzougagh, B. Integrating Double Techniques of Statistical Downscaling and Bias Correction to Reduce Bias in Projections Trends of Future Climate Datasets. Sci. Rep. 2025, 15, 30654. [Google Scholar] [CrossRef] [PubMed]
  9. Harris, I.; Osborn, T.J.; Jones, P.; Lister, D. Version 4 of the CRU TS Monthly High-Resolution Gridded Multivariate Climate Dataset. Sci. Data 2020, 7, 109. [Google Scholar] [CrossRef] [PubMed]
  10. Fick, S.E.; Hijmans, R.J. WorldClim 2: New 1-Km Spatial Resolution Climate Surfaces for Global Land Areas. Int. J. Climatol. 2017, 37, 4302–4315. [Google Scholar] [CrossRef]
  11. Maraun, D.; Widmann, M.; Gutiérrez, J.M. Statistical Downscaling Skill under Present Climate Conditions: A Synthesis of the VALUE Perfect Predictor Experiment. Int. J. Clim. 2019, 2018, 3692–3703. [Google Scholar] [CrossRef]
  12. Berio, L.; Lauren, F.; Abby, R.K.; Giambelluca, T.W. Examining Current Bias and Future Projection Consistency of Globally Downscaled Climate Projections Commonly Used in Climate Impact Studies. Clim. Change 2023, 176, 169. [Google Scholar] [CrossRef]
  13. Chen, J.; Brissette, F.P.; Chaumont, D.; Braun, M. Performance and Uncertainty Evaluation of Empirical Downscaling Methods in Quantifying the Climate Change Impacts on Hydrology over Two North American River Basins. J. Hydrol. 2013, 479, 200–214. [Google Scholar] [CrossRef]
  14. Gudmundsson, L.; Bremnes, J.B.; Haugen, J.E. Technical Note: Downscaling RCM Precipitation to the Station Scale Using Statistical Transformations—A Comparison of Methods. Hydrol. Earth Syst. Sci. 2012, 16, 3383–3390. [Google Scholar] [CrossRef]
  15. Maraun, D. Bias Correcting Climate Change Simulations—A Critical Review. Curr. Clim. Change Rep. 2016, 2, 211–220. [Google Scholar] [CrossRef]
  16. Leitzell, K.; Berger, S. Climate Change 2021: The Physical Science Basis Climate Change; Cambridge University Press: Cambridge, UK, 2021; ISBN 9781009157896. [Google Scholar]
  17. World Meteorological Organization (WMO). 2019 State of Climate Services: Agriculture and Food Security; WMO-No. 1242; World Meteorological Organization: Geneva, Switzerland, 2019; ISBN 978-92-63-11242-2. [Google Scholar]
  18. Beck, H.E.; Van Dijk, A.I.J.M.; Levizzani, V.; Schellekens, J.; Miralles, D.G.; Martens, B.; De Roo, A. MSWEP: 3-Hourly 0.25° Global Gridded Precipitation (1979–2015) by Merging Gauge, Satellite, and Reanalysis Data. Hydrol. Earth Syst. Sci. 2017, 21, 589–615. [Google Scholar] [CrossRef]
  19. Macharia, D.; Fankhauser, K.; Selker, J.S.; Neff, J.C.; Thomas, E.A.; Macharia, D.; Fankhauser, K.; Selker, J.S.; Neff, J.C.; Thomas, E.A. Validation and Intercomparison of Satellite-Based Rainfall Products over Africa with TAHMO In Situ Rainfall Observations. J. Hydrometeorol. 2022, 23, 1131–1154. [Google Scholar] [CrossRef]
  20. Dinku, T.; Ceccato, P.; Grover-Kopec, E.; Lemma, M.; Connor, S.J.; Ropelewski, C.F. Validation of Satellite Rainfall Products over East Africa’s Complex Topography. Int. J. Remote Sens. 2007, 28, 1503–1526. [Google Scholar] [CrossRef]
  21. Satgé, F.; Defrance, D.; Sultan, B.; Bonnet, M.-P.; Seyler, F.; Rouché, N.; Pierron, F.; Paturel, J.-E. Evaluation of 23 Gridded Precipitation Datasets across West Africa. J. Hydrol. 2020, 581, 124412. [Google Scholar] [CrossRef]
  22. Dembele, M.; Schaefli, B.; Van De Giesen, N. Suitability of 17 Gridded Rainfall and Temperature Datasets for Large-Scale Hydrological Modelling in West Africa. Hydrol. Earth Syst. Sci. 2020, 24, 5379–5406. [Google Scholar] [CrossRef]
  23. Goudiaby, O.; Bodian, A.; Dezetter, A.; Diouf, I.; Ogilvie, A. Evaluation of Gridded Rainfall Products in Three West African Basins. Hydrology 2024, 11, 75. [Google Scholar] [CrossRef]
  24. Matimolane, S.; Madubye, M.; Mathivha, F.I. Variability and Impacts of Hydrometeorological Variables on Surface Water Resources in Mokolo River Catchment, South Africa. Sustain. Water Resour. Manag. 2025, 11, 106. [Google Scholar] [CrossRef]
  25. Mengistu, A.G.; Tesfuhuney, W.A.; Woyessa, Y.E. Analysis of the Spatio-Temporal Variability of Precipitation and Drought Intensity in an Arid Catchment in South Africa. Climate 2020, 8, 70. [Google Scholar] [CrossRef]
  26. Maure, G.; Pinto, I.; Ndebele-Murisa, M.; Muthige, M.; Lennard, C.; Nikulin, G.; Dosio, A.; Meque, A. The Southern African Climate under 1.5° and 2 °C of Global Warming as Simulated by CORDEX Models. Environ. Res. Lett. 2018, 13, 065002. [Google Scholar] [CrossRef]
  27. Natural Capital Alliance InVEST 3.18.0. Stanford University, University of Minnesota, Chinese Academy of Sciences, The Nature Conservancy, World Wildlife Fund, Stockholm Resilience Centre and the Royal Swedish Academy of Sciences. Available online: https://storage.googleapis.com/releases.naturalcapitalproject.org/invest-userguide/latest/en/index.html (accessed on 1 April 2026).
  28. Liu, Y.; Li, Z.; Liu, Z.; Luo, Y. Impact of Rainfall Spatiotemporal Variability and Model Structures on Flood Simulation in Semi-Arid Regions. Stoch. Environ. Res. Risk Assess. 2021, 36, 785–809. [Google Scholar] [CrossRef]
  29. Chakri, A.; Abakarim, S.; Rodrigues, J.C.A.; Laftouhi, N.E.; Ibouh, H.; Zouhri, L.; Zaitseva, E. Spatial Bias Correction of ERA5_Ag Reanalysis Precipitation Using Machine Learning Models in Semi-Arid Region of Morocco. Atmosphere 2025, 16, 1234. [Google Scholar] [CrossRef]
  30. Hydrological Modelling in Arid and Semi-Arid Areas. Available online: https://assets.cambridge.org/97805218/69188/excerpt/9780521869188_excerpt.htm (accessed on 2 April 2026).
  31. Roland, E.S. Approaches towards Practical Adaptive Management Options for Selected Water-Related Sectors in South Africa in a Context of Climate Change. Available online: https://scielo.org.za/scielo.php?script=sci_arttext&pid=S1816-79502011000500005 (accessed on 2 April 2026).
  32. Oke, S.A.; Alowo, R. Groundwater of the Modder River Catchment of South Africa: A Sustainability Prediction. Water 2021, 13, 936. [Google Scholar] [CrossRef]
  33. Hughes, D.A.; Mantel, S.K. Estimating the Uncertainty in Simulating the Impacts of Small Farm Dams on Streamflow Regimes in South Africa. Hydrol. Sci. J. 2010, 55, 578–592. [Google Scholar] [CrossRef]
  34. Yves, T.; Villarini, G.; El Khalki, E.M.; Gründemann, G.; Hughes, D. Evaluation of the Drivers Responsible for Flooding in Africa. Water Resour. Res. 2021, 57, e2021WR029595. [Google Scholar] [CrossRef]
  35. Woyessa, Y.E. Sustainable Management of Water Resources in a Semi-Arid River Basin Under Climate Change: A Case Study in South Africa. In BRICS Countries: Sustainable Water Resource Management and Pollution Control: Challenges and Opportunities; Springer Nature: Singapore, 2024; pp. 183–209. [Google Scholar] [CrossRef]
  36. Woyessa, Y.E.; Welderufael, W.A. Impact of Land-Use Change on Catchment Water Balance: A Case Study in the Central Region of South Africa. Geosci. Lett. 2021, 8, 34. [Google Scholar] [CrossRef]
  37. Gassman, P.W.; Reyes, M.R.; Green, C.H.; Arnold, J.G.; Gassman, P.W. The Soil and Water Assessment Tool: Historical Development, Applications, and Future Research Directions. Trans. ASABE 2007, 50, 1211–1250. [Google Scholar] [CrossRef]
  38. Gericke, O.J.; du Plessis, J.A. Evaluation of Critical Storm Duration Rainfall Estimates Used in Flood Hydrology in South Africa. Water SA 2011, 37, 453–470. [Google Scholar] [CrossRef]
  39. Raimonet, M.; Oudin, L.; Thieu, V.; Silvestre, M.; Vautard, R.; Rabouille, C.; Le Moigne, P.; Raimonet, M.; Oudin, L.; Thieu, V.; et al. Evaluation of Gridded Meteorological Datasets for Hydrological Modeling. J. Hydrometeorol. 2017, 18, 3027–3041. [Google Scholar] [CrossRef]
  40. Dembélé, M.; Zwart, S.J. Evaluation and Comparison of Satellite-Based Rainfall Products in Burkina Faso, West Africa. Int. J. Remote Sens. 2016, 37, 3995–4014. [Google Scholar] [CrossRef]
  41. Salvacion, A.R.; Magcale-Macandog, D.B.; Cruz, P.C.S.; Saludes, R.B.; Pangga, I.B.; Cumagun, C.J.R. Evaluation and Spatial Downscaling of CRU TS Precipitation Data in the Philippines. Model. Earth Syst. Environ. 2018, 4, 891–898. [Google Scholar] [CrossRef]
  42. Mutti, P.R.; Dubreuil, V.; Bezerra, B.G.; Arvor, D.; de Oliveira, C.P.; Santos E Silva, C.M. Assessment of Gridded CRU TS Data for Long-Term Climatic Water Balance Monitoring over the São Francisco Watershed, Brazil. Atmosphere 2020, 11, 1207. [Google Scholar] [CrossRef]
  43. Abbas, H.; Song, W.; Wang, Y.; Xiang, K.; Chen, L.; Feng, T.; Linghu, S.; Alam, M. Validation of CRU TS v4.08, ERA5-Land, IMERG V07B, and MSWEP v2.8 Precipitation Estimates Against Observed Values over Pakistan. Remote Sens. 2024, 16, 4803. [Google Scholar] [CrossRef]
  44. Shi, H.; Li, T.; Wei, J. Evaluation of the Gridded CRU TS Precipitation Dataset with the Point Raingauge Records over the Three-River Headwaters Region. J. Hyd. 2017, 548, 322–332. [Google Scholar] [CrossRef]
  45. Historical Monthly Weather Data—WorldClim 1 Documentation. Available online: https://worldclim.org/data/monthlywth.html (accessed on 2 April 2026).
  46. Chauke, H.; Pongrácz, R. Monthly Scale Validation of Climate Models’ Outputs Against Gridded Data over South Africa. Atmosphere 2025, 16, 1200. [Google Scholar] [CrossRef]
  47. Beven, K. Rainfall-Runoff Modelling: The Primer, 2nd ed.; Wiley: Hoboken, NJ, USA, 2012; pp. 1–457. [Google Scholar] [CrossRef]
  48. Biemans, H.; Hutjes, R.W.A.; Kabat, P.; Strengers, B.J.; Gerten, D.; Rost, S.; Biemans, H.; Hutjes, R.W.A.; Kabat, P.; Strengers, B.J.; et al. Effects of Precipitation Uncertainty on Discharge Calculations for Main River Basins. J. Hydrometeorol. 2009, 10, 1011–1025. [Google Scholar] [CrossRef]
  49. Moriasi, D.N.; Arnold, J.G.; Van Liew, M.W.; Bingner, R.L.; Harmel, R.D.; Veith, T.L. Model Evaluation Guidelines for Systematic Quantification of Accuracy in Watershed Simulations. Trans. ASABE 2007, 50, 885–900. [Google Scholar] [CrossRef]
  50. Buishand, T.A. Some Methods for Testing the Homogeneity of Rainfall Records. J. Hydrol. 1982, 58, 11–27. [Google Scholar] [CrossRef]
  51. Şen, Z. Innovative Trend Analysis Methodology. J. Hydrol. Eng. 2011, 17, 1042–1046. [Google Scholar] [CrossRef]
  52. Şen, Z. Innovative Trend Methodologies in Science and Engineering. In Innovative Trend Methodologies in Science and Engineering; Springer International Publishing: New York, NY, USA, 2017; pp. 1–349. [Google Scholar] [CrossRef]
  53. Garbrecht, J.; Fernandez, G.P. Visualization of Trends and Fluctuations in Climatic Records. JAWRA J. Am. Water Resour. Assoc. 1994, 30, 297–306. [Google Scholar] [CrossRef]
  54. Gericke, O.J.; Pietersen, J.P.J. Disaggregation of Fixed Time Interval Rainfall to Continuous Measured Rainfall for the Purpose of Design Rainfall Estimation. Water SA 2018, 44, 557–568. [Google Scholar] [CrossRef]
  55. USGS EarthExplorer.U.S. Geological Survey. Available online: https://earthexplorer.usgs.gov/?utm_source=chatgpt.com (accessed on 2 September 2025).
  56. Hydrological Analysis—QGIS Documentation Documentation. Available online: https://docs.qgis.org/3.44/en/docs/training_manual/processing/hydro.html (accessed on 11 July 2026).
  57. Gericke, O.J. GIS Applications to Investigate the Linkage between Geomorphological Catchment Characteristics and Response Time: A Case Study in Four Climatological Regions, South Africa. Water 2019, 11, 1072. [Google Scholar] [CrossRef]
  58. Vegetation of South Africa|PlantZAfrica. Available online: https://pza.sanbi.org/vegetation/vegetation-south-africa (accessed on 15 June 2026).
  59. Mucina, L.; Rutherford, M.C. The Vegetation of South Africa, Lesotho and Swaziland. Available online: https://archive.org/details/vegetationofsout19muci (accessed on 15 June 2026).
  60. Hussien, K.; Woyessa, Y.E. Forest Landscape Transformation in the Ecotonal Watershed of Central South Africa: Evidence from Remote Sensing and Asymmetric Land Change Analysis. Forests 2025, 17, 64. [Google Scholar] [CrossRef]
  61. Hussien, K.; Woyessa, Y.E. Land Use and Land Cover Dynamics and Spatial Reconfiguration in Semi-Arid Central South Africa: Insights from TerrSet–LiberaGIS Land Change Modelling and Patch-Based Analysis. Earth 2026, 7, 12. [Google Scholar] [CrossRef]
  62. Gericke, O.J.; Smithers, J.C. Derivation and Verification of Empirical Catchment Response Time Equations for Medium to Large Catchments in South Africa. Hydrol. Process. 2016, 30, 4384–4404. [Google Scholar] [CrossRef]
  63. Pitman, W.V.; Midgley, D.C.; Middleton, B.J. Surface Water Resources of South Africa 1990. Civ. Eng. = Siviele Ingenieurswese. Available online: https://journals.co.za/doi/10.10520/AJA10212019_22385 (accessed on 15 June 2026).
  64. Moriasi, D.N.; Gitau, M.W.; Pai, N.; Daggupati, P. Hydrologic and Water Quality Models: Performance Measures and Evaluation Criteria. Trans. ASABE 2015, 58, 1763–1785. [Google Scholar] [CrossRef]
  65. Đurin, B.; Kranjčić, N.; Kanga, S.; Singh, S.K.; Sakač, N.; Pham, Q.B.; Hunt, J.; Dogančić, D.; Nunno, F. Di Application of Rescaled Adjusted Partial Sums (RAPS) Method in Hydrology-an Overview. Adv. Civ. Archit. Eng. 2022, 13, 58–72. [Google Scholar] [CrossRef]
  66. Gupta, H.V.; Kling, H.; Yilmaz, K.K.; Martinez, G.F. Decomposition of the Mean Squared Error and NSE Performance Criteria: Implications for Improving Hydrological Modelling. J. Hydrol. 2009, 377, 80–91. [Google Scholar] [CrossRef]
  67. Karl, T.R.; Nicholls, N.; Ghazi, A. CLIVAR/GCOS/WMO Workshop on Indices and Indicators for Climate Extremes—Workshop Summary. Clim. Change 1999, 42, 3–7. [Google Scholar] [CrossRef]
  68. Gampe, D.; Ludwig, R. Evaluation of Gridded Precipitation Data Products for Hydrological Applications in Complex Topography. Hydrology 2017, 4, 53. [Google Scholar] [CrossRef]
  69. Mankin, K.R.; Mehan, S.; Green, T.R.; Barnard, D.M. Review of Gridded Climate Products and Their Use in Hydrological Analyses Reveals Overlaps, Gaps, and Need for a More Objective Approach to Selecting Model Forcing Datasets. Hydrol. Earth Syst. Sci. 2025, 29, 85–108. [Google Scholar] [CrossRef]
  70. Randriatsara, H.H.R.H.; Hu, Z.; Xu, X.; Ayugi, B.; Sian, K.T.C.L.K.; Mumo, R.; Ongoma, V. Evaluation of Gridded Precipitation Datasets over Madagascar. Int. J. Climatol. 2022, 42, 7028–7046. [Google Scholar] [CrossRef]
  71. Mwanthi, A.M.; Mutemi, J.N.; Opijah, F.J.; Mutua, F.M.; Atheru, Z.; Artan, G. Implications of WRF Model Resolutions on Resolving Rainfall Variability with Topography over East Africa. Front. Clim. 2024, 6, 1311088. [Google Scholar] [CrossRef]
  72. Lim Kam Sian, K.T.C.; Ayugi, B.O.; Onyutha, C.; Sagero, P.; Ait Brahim, Y. Rainfall Variability across Africa. In Climate Change and Rainfall Extremes in Africa: Occurrence, Impacts and Adaptation; Elsevier: Amsterdam, The Netherlands, 2025; pp. 3–26. [Google Scholar] [CrossRef]
  73. Iqbal, M.F.; Athar, H. Validation of Satellite Based Precipitation over Diverse Topography of Pakistan. Atmos. Res. 2018, 201, 247–260. [Google Scholar] [CrossRef]
  74. Qi, W.; Wang, S.; Chen, J. Inter-Comparison of Multiple Gridded Precipitation Datasets over Different Climates at Global Scale. Water 2024, 16, 1553. [Google Scholar] [CrossRef]
  75. Oettli, P.; Camberlin, P. Influence of Topography on Monthly Rainfall Distribution over East Africa. Clim. Res. 2005, 28, 199–212. [Google Scholar] [CrossRef]
  76. Peinó, E.; Bech, J.; Udina, M.; Polls, F. Disentangling Satellite Precipitation Estimate Errors of Heavy Rainfall at the Daily and Sub-Daily Scales in the Western Mediterranean. Remote Sens. 2024, 16, 457. [Google Scholar] [CrossRef]
  77. Sun, Q.; Miao, C.; Duan, Q.; Ashouri, H.; Sorooshian, S.; Hsu, K.L. A Review of Global Precipitation Data Sets: Data Sources, Estimation, and Intercomparisons. Rev. Geophys. 2018, 56, 79–107. [Google Scholar] [CrossRef]
  78. Macron, C.; Richard, Y.; Garot, T.; Bessafi, M.; Pohl, B.; Ratiarison, A.; Razafindrabe, A. Intraseasonal Rainfall Variability over Madagascar. Mon. Weather Rev. 2016, 144, 1877–1885. [Google Scholar] [CrossRef]
  79. Chen, H.; Yong, B.; Kirstetter, P.E.; Wang, L.; Hong, Y. Global Component Analysis of Errors in Three Satellite-Only Global Precipitation Estimates. Hydrol. Earth Syst. Sci. 2021, 25, 3087–3104. [Google Scholar] [CrossRef]
  80. Ollivier, C.C.; Carrière, S.D.; Heath, T.; Olioso, A.; Rabefitia, Z.; Rakoto, H.; Oudin, L.; Satgé, F. Ensemble Precipitation Estimates Based on an Assessment of 21 Gridded Precipitation Datasets to Improve Precipitation Estimations across Madagascar. J. Hydrol. Reg. Stud. 2023, 47, 101400. [Google Scholar] [CrossRef]
  81. Ramahaimandimby, Z.; Randriamaherisoa, A.; Jonard, F.; Vanclooster, M.; Bielders, C.L. Reliability of Gridded Precipitation Products for Water Management Studies: The Case of the Ankavia River Basin in Madagascar. Remote Sens. 2022, 14, 3940. [Google Scholar] [CrossRef]
  82. Herrera, S.; González Rouco, F.; Serrano-Notivoli, R.; Garrido, J.L.; Beguería, S.; Gutiérrez, J.M.; Quintana-Seguí, P.; Iturbide, M.; Rodríguez, E.; Morata, A.; et al. Intercomparison of Daily Maximum and Minimum Temperature Gridded Products Over Mainland Spain. Int. J. Climatol. 2025, 45, e70111. [Google Scholar] [CrossRef]
  83. Willmott, C.J.; Matsuura, K. Advantages of the Mean Absolute Error (MAE) over the Root Mean Square Error (RMSE) in Assessing Average Model Performance. Clim. Res. 2005, 30, 79–82. [Google Scholar] [CrossRef]
  84. Matsunobu, T.; Puh, M.; Keil, C. Flow- and Scale-Dependent Spatial Predictability of Convective Precipitation Combining Different Model Uncertainty Representations. Q. J. R. Meteorol. Soc. 2024, 150, 2364–2381. [Google Scholar] [CrossRef]
  85. Köcher, G.; Zinner, T. The Spatial Distribution of Convective Precipitation-an Evaluation of Cloud Microphysics Schemes with Polarimetric Radar Observations. Geosci. Model Dev. 2025, 18, 8363–8377. [Google Scholar] [CrossRef]
  86. Valencia, S.; Marín, D.E.; Gómez, D.; Hoyos, N.; Salazar, J.F.; Villegas, J.C. Spatio-Temporal Assessment of Gridded Precipitation Products across Topographic and Climatic Gradients in Colombia. Atmos. Res. 2023, 285, 106643. [Google Scholar] [CrossRef]
  87. Addisuu, A.A.; Mengistu Tsidu, G.; Basupi, L.V. Improving Daily CMIP6 Precipitation in Southern Africa Through Bias Correction—Part 1: Spatiotemporal Characteristics. Climate 2025, 13, 95. [Google Scholar] [CrossRef]
  88. Lawal, I.M.; Bertram, D.; White, C.J.; Jagaba, A.H.; Hassan, I.; Shuaibu, A. Multi-Criteria Performance Evaluation of Gridded Precipitation and Temperature Products in Data-Sparse Regions. Atmosphere 2021, 12, 1597. [Google Scholar] [CrossRef]
  89. Tarek, M.; Brissette, F.; Arsenault, R. Uncertainty of Gridded Precipitation and Temperature Reference Datasets in Climate Change Impact Studies. Hydrol. Earth Syst. Sci. 2021, 25, 3331–3350. [Google Scholar] [CrossRef]
  90. Beck, H.E.; Wood, E.F.; Pan, M.; Fisher, C.K.; Miralles, D.G.; Van Dijk, A.I.J.M.; McVicar, T.R.; Adler, R.F. MSWep v2 Global 3-Hourly 0.1° Precipitation: Methodology and Quantitative Assessment. Bull. Am. Meteorol. Soc. 2019, 100, 473–500. [Google Scholar] [CrossRef]
  91. Teutschbein, C.; Seibert, J. Bias Correction of Regional Climate Model Simulations for Hydrological Climate-Change Impact Studies: Review and Evaluation of Different Methods. J. Hydrol. 2012, 456–457, 12–29. [Google Scholar] [CrossRef]
  92. Ahmed, K.; Shahid, S.; Wang, X.; Nawaz, N.; Najeebullah, K. Evaluation of Gridded Precipitation Datasets over Arid Regions of Pakistan. Water 2019, 11, 210. [Google Scholar] [CrossRef]
Figure 1. Study area map showing elevation (m above mean sea level), river network, and the spatial distribution of the seven selected meteorological stations used for validation across the C5 SDR catchment (Riet–Modder system) of central South Africa.
Hydrology 13 00206 g001
Figure 2. Flowchart illustrating the validation framework used to validate WC2.1– CRU-TS v4.09 climate time series against observed precipitation and temperature from meteorological stations in the C5 SDR catchment of central South Africa.
Hydrology 13 00206 g002
Figure 3. Annual precipitation time series comparing observed station records with the WC2.1– CRU-TS v4.09. Figures show the results for the following stations: (A) Krugersdrift Dam, (B) Jacobsdal, (C) Maselspoort Dam, (D) Steunmekaar, (E) Thaba Nchu, (F) Cliff, and (G) Glen College. The gridded dataset reproduces the observed interannual variability and seasonal precipitation patterns across all stations, while peak precipitation associated with convective rainfall events is generally underestimated at some locations.
Hydrology 13 00206 g003aHydrology 13 00206 g003bHydrology 13 00206 g003c
Figure 4. Time-series comparison of observed and WC2.1– CRU-TS v4.09: (A) annual mean maximum (TMAX) and (B) annual mean minimum (TMIN) temperatures at Glen College station.
Hydrology 13 00206 g004
Figure 5. ITA plot for annual precipitation (Pr), showing trends across the lower, intermediate, and upper value ranges over the study period: observed precipitation at Krugersdrift Dam (A) and WC2.1– CRU-TS v4.09 precipitation at Krugersdrift Dam (A′); observed and WC2.1– CRU-TS v4.09 precipitation at Jacobsdal (B,B′); Maselspoort Dam (C,C′); Steunmekaar (D,D′); Thaba Nchu (E,E′); Cliff (F,F′); and Glen College (G,G′). Red dots represent paired values from the first and second halves of the sorted precipitation time series in the ITA.
Hydrology 13 00206 g005aHydrology 13 00206 g005bHydrology 13 00206 g005c
Figure 6. ITA plots for annual maximum (TMAX) and minimum (TMIN) temperatures indicate trends across the lower, intermediate, and upper value ranges over the study period: observed TMAX (A) and WC2.1– CRU-TS v4.09 TMAX (A′); observed TMIN (B) and WC2.1– CRU-TS v4.09 TMIN (B′) at Glen College station. Red dots represent paired values from the first and second halves of the sorted temperature time series used in the ITA.
Hydrology 13 00206 g006
Figure 7. Scatter plots comparing observed and WC2.1– CRU-TS v4.09 annual precipitation at seven meteorological stations: (A) Krugersdrift Dam, (B) Jacobsdal, (C) Maselspoort Dam, (D) Steunmekaar, (E) Thaba Nchu, (F) Cliff and (G) Glen College. The solid 1:1 reference line indicates perfect agreement between observed and gridded values. Points above the line represent overestimation, while points below indicate underestimation. The fitted regression lines indicate generally strong correspondence between the datasets, although station-specific deviations reveal a tendency to underestimate precipitation at Krugersdrift Dam, Maselspoort Dam, Steunmekaar, and Thaba Nchu, and slight overestimation at Jacobsdal and Cliff, reflecting spatial variability in precipitation representation.
Hydrology 13 00206 g007aHydrology 13 00206 g007b
Figure 8. Residuals between observed and WC2.1– CRU-TS v4.09 annual precipitation for seven stations relative to the zero-residual reference line. Positive values indicate underestimation and negative values indicate overestimation by the gridded dataset. Residuals are generally centered around zero, indicating limited systematic bias, although increasing residual dispersion at higher precipitation reflects reduced performance during extreme events. Red dots represent residual values (observed − WC2.1– CRU-TS v4.09).
Hydrology 13 00206 g008aHydrology 13 00206 g008b
Figure 9. Validation of annual mean maximum (TMAX) and minimum (TMIN) temperatures at Glen College station: (A) TMAX scatter plot, (B) TMIN scatter plot, (C) TMAX residuals, and (D) TMIN residual plot. Residuals (Red dots) represent the differences between observed and WC2.1– CRU-TS v4.09 temperatures. The close clustering of observations around the 1:1 reference line and residuals centered near zero indicate excellent agreement between observed and WC2.1– CRU-TS v4.09 temperatures, with slightly stronger performance for TMAX than TMIN.
Hydrology 13 00206 g009
Figure 10. RAPS of annual precipitation illustrating cumulative departures from the long-term mean for observed and WC2.1– CRU-TS v4.09 datasets. The analysis identifies persistent wet and dry phases and major hydroclimatic regime shifts, demonstrating that the gridded dataset preserves the dominant temporal variability despite attenuating the magnitude of localized cumulative anomalies.
Hydrology 13 00206 g010aHydrology 13 00206 g010b
Figure 11. RAPS of annual maximum temperature (TMAX) (A), and minimum temperature (TMIN) (B) illustrating cumulative departures from the long-term mean and revealing persistent warm and cool phases as well as potential regime shifts in the temperature series over the study period. The close agreement between observed and gridded series demonstrates that the WC2.1– CRU-TS v4.09 dataset successfully preserves long-term temperature variability and major warming regime shifts.
Hydrology 13 00206 g011
Table 1. Statistical evaluation of extreme precipitation events based on the 95th-percentile threshold.
Station95th-Percentile ThresholdCount of ExtremesRMSEMAEPBIASMean ResidualMax ResidualMin ResidualResidual SDR2
Krugersdrift Dam725.83187.9180.3−21180.3226041.40.997
Jacobsdal633.9486.677.7−5.542.2141.7−71.120.10.989
Maselspoort Dam8724209.4195−20.5195309.7049.10.989
Steunmekaar800.84194.6163.3−19.2163.3266.3045.90.975
Thaba Nchu889.84246.7192.1−18.4192.1427.8058.40.974
Cliff866.54123.6116.6−8.3175.6175.9−81.929.40.986
Glen College806.34179.8153.7−16.5151.4261.6−4.742.70.988
Table 2. Extreme temperature event validation using the 95th-percentile threshold.
StationVariable95th-Percentile ThresholdCount of ExtremesRMSEMAEPBIASMean ResidualMax ResidualMin ResidualResidual SDR2
Glen CollegeTMAX27.441.51.4−4.91.42.3200.41
Glen CollegeTMIN8.540.50.42−4.80.40.6400.10.999
Table 3. Statistical performance of WC2.1– CRU-TS v4.09 precipitation data relative to observed station records. Metrics include R2, R, RMSE, RRMSE, PBIAS, NSE, and MAE.
Stations NameR2RRMSE (mm)RRMSE (%)PBIAS (%)NSEMAE (mm)
Krugersdrift Dam0.720.8585.216.8−5.020.9068.79
Jacobsdal0.800.9077.920.88.640.7262.66
Maselspoort Dam0.720.859316.6−4.980.7270
Steunmekaar0.630.7995.122.72.690.6272.74
Thaba Nchu0.720.8583.113.3−3.270.7566.23
Cliff0.720.8585.715.14.190.6969.10
Glen College0.620.789417.4−1.60.6170
Table 4. Statistical performance of modeled TMAX/TMIN at Glen College station.
Station NameVariableR2RRMSE (°C)RRMSE (%)PBIAS (%)NSEMAE (°C)
Glen CollegeTMAX0.750.870.562.22−0.610.720.4
Glen CollegeTMIN0.550.740.45.041.40.500.3
Disclaimer/Publisher’s Note: The statements, opinions and data contained in all publications are solely those of the individual author(s) and contributor(s) and not of MDPI and/or the editor(s). MDPI and/or the editor(s) disclaim responsibility for any injury to people or property resulting from any ideas, methods, instructions or products referred to in the content.