


Abstract
Understanding long-term hydroclimatic variability in the central Alps is essential when placing recent changes in precipitation and streamflow within a broader temporal context. This study reconstructs warm-season hydroclimatic variability in the central Alps using tree-ring-based hydroclimatic proxies from the Old World Drought Atlas (OWDA). Seasonal April–May–June–July–August (AMJJA) precipitation at Innsbruck, Austria, and seasonal May–June–July–August (MJJA) streamflow at the St. Jodok gauge were reconstructed using OWDA self-calibrating Palmer Drought Severity Index (scPDSI) predictors and moving-window Stepwise Linear Regression (SLR) models. Calibration windows of 30, 40, and 50 years were developed to account for temporal variability in predictor–climate relationships, and reconstruction uncertainty was quantified using multi-model ensemble bounds. An independent Deep Learning reconstruction was also developed for precipitation to provide an assessment of reconstruction skill and long-term climate trends. Specifically, the results demonstrate a robust reconstruction skill, with mean calibration R2 values of 0.65 for streamflow and 0.59 for precipitation. The streamflow reconstruction indicates that recent sustained increases represent the strongest positive anomaly in approximately 650 years, while reconstructed precipitation suggests recent decades are among the wettest sustained intervals of the last ~2000 years. Both records reveal a pronounced transition from severe late 19th-century drought conditions to persistent modern pluvial conditions. Agreement between regression and Deep Learning reconstructions supports the robustness of the identified long-term wetting trend and highlights the exceptional nature of recent hydroclimatic conditions in the central Alps.
1. Introduction
Mountain regions function as critical hydrological “water towers,” storing and releasing freshwater that sustains downstream populations, agriculture, hydropower production, navigation, and ecosystem requirements. The European Alps are among the most important water towers in Europe, supplying runoff to major river systems including the Rhine, Rhône, Po, and Danube basins, and providing water resources for millions of people downstream [1]. Consequently, understanding long-term hydroclimatic variability within Alpine watersheds is essential for sustainable water management and climate adaptation planning.
The European Alps region has experienced substantial climatic changes during the instrumental era. Temperature records indicate that the warming of the European Alps since the late 19th century has exceeded the global average rate, resulting in widespread impacts on glacier mass balance, snowpack accumulation, and seasonal runoff generation [2,3,4,5]. Numerous studies have documented reductions in glacier volume, declining snow cover duration, earlier snowmelt timing, changes in drought and flood timing, and shifts in streamflow seasonality throughout the Alps [6,7,8,9,10,11,12]. While long-term warming trends are well established, precipitation trends remain more spatially heterogeneous and less understood. Investigations have identified regionally varying changes in precipitation magnitude, seasonality, and extremes, with portions of the central Alps exhibiting increasing warm-season precipitation and enhanced hydroclimatic variability during recent decades [13,14,15,16].
These hydroclimatic changes have important implications for water availability, flood risk, and hydropower production throughout the Alpine river systems. Increasing atmospheric moisture availability associated with a warming climate has contributed to observed changes in extreme precipitation occurrence across many mountain regions [17,18,19,20]. However, the degree to which recent precipitation departures increase from natural hydroclimatic variability remains uncertain because instrumental observations are generally limited to approximately the past ~50 years and rarely to ~150 years.
The Inn River Basin, located within the central Alps and forming one of the largest tributaries of the Danube River, provides an ideal setting for investigating long-term hydroclimatic variability. The basin encompasses extensive high-elevation terrain and is influenced by complex interactions among Atlantic, Mediterranean, and continental atmospheric circulation patterns [21]. Previous studies have demonstrated that streamflow variability within the Inn Basin and neighboring Alpine catchments is strongly linked to warm-season precipitation, snowpack accumulation, and temperature-driven melt processes [21,22]. As a result, the basin is particularly sensitive to both short-term climatic fluctuations and longer-term hydroclimatic change.
Although instrumental records provide valuable information regarding recent climatic variability, they are insufficient when looking to characterize the full range of natural hydroclimatic variability, which operates on multi-decadal to centennial timescales. Most precipitation and streamflow observations within the Alps begin during the 20th century, limiting assessments of the rarity and significance of recent hydroclimatic conditions [23]. Tree-ring records provide an opportunity to extend hydroclimatic information beyond the instrumental period, and have become one of the most widely applied proxies for reconstructing past climate variability [24,25].
Dendroclimatological reconstructions have been used extensively to investigate precipitation, drought, snowpack, and streamflow variability throughout North America and Europe [26,27,28,29,30,31,32]. Within Alpine environments, tree growth is commonly influenced by both temperature and moisture availability, with moisture-sensitive species and sites preserving hydroclimatic signals suitable for climate reconstruction [33,34,35]. Continued improvements in chronology development, statistical reconstruction techniques, and observational datasets have increased confidence in tree-ring-based hydroclimatic reconstructions and enhanced their utility for water resources applications in Europe [36,37].
Despite considerable progress in understanding Alpine hydroclimatic variability, relatively few studies have reconstructed both precipitation and streamflow for the central Alps using common dendroclimatic predictors over centennial- to millennial-scale periods. Previous investigations have primarily focused on temperature reconstructions, drought indices, or runoff variability in Alpine and broader European catchments [29,30,31,32,33,34,35], whereas relatively few studies have developed long-term hydroclimatic reconstructions specifically for the Inn River Basin [21,22,23]. Furthermore, most dendrohydrologic reconstruction approaches rely on a single calibration interval, implicitly assuming stationary predictor–climate relationships through time [27,28,29]. Such an assumption may not fully account for temporal changes in atmospheric circulation, climate teleconnections, or tree-growth responses that influence reconstruction skill under changing climatic conditions. In addition, few studies have compared traditional statistical reconstruction techniques with modern Deep Learning approaches using identical paleoclimate predictor datasets [37]. Consequently, uncertainty remains regarding both the robustness of the long-term hydroclimatic reconstructions and the degree to which recent precipitation and streamflow conditions exceed the natural range of variability observed over previous centuries. This study investigates long-term warm-season hydroclimatic variability in the Inn River Basin by developing tree-ring-based reconstructions of April–May–June–July–August (AMJJA) precipitation for Innsbruck, Austria, and May–June–July–August (MJJA) streamflow at the hydrologically unimpaired St. Jodok gauge. A moving-window calibration framework is used to assess the temporal stability of predictor–climate relationships and quantify reconstruction uncertainty via a multi-model ensemble approach. Reconstructed precipitation is subsequently compared with observed and reconstructed streamflow to evaluate long-term precipitation–runoff coherence within the basin. In addition, an independent Deep Learning reconstruction of precipitation is developed to assess methodological consistency and provide an independent evaluation of long-term hydroclimatic trends. Collectively, these approaches provide a more comprehensive assessment of recent hydroclimatic change within the context of approximately two millennia of natural variability.
The objectives of this study are to: (1) develop robust tree-ring-based reconstructions of warm-season precipitation and streamflow for the central Inn River Basin using a moving-window calibration framework; (2) evaluate long-term relationships between precipitation and streamflow variability and the temporal stability of reconstruction models; (3) compare traditional regression and Deep Learning approaches for reconstructing warm-season precipitation; (4) characterize multi-decadal to millennial-scale hydroclimatic variability; and (5) determine whether recent wet conditions observed during the instrumental period represent exceptional departures from natural variability. The resulting reconstructions improve understanding of Alpine hydroclimate dynamics, provide a long-term context for evaluating recent hydroclimatic change, and offer information relevant to water resources management, hydrologic resilience, and climate adaptation planning throughout the European Alps.
2. Materials and Methods
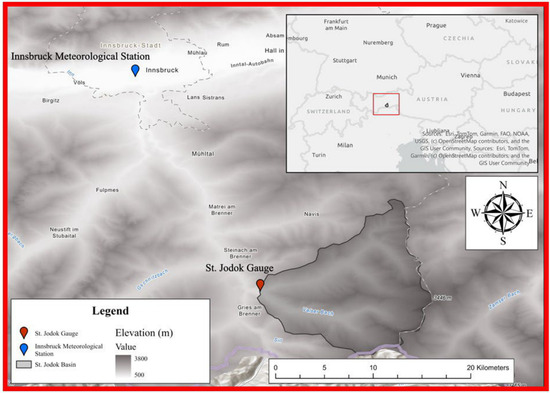
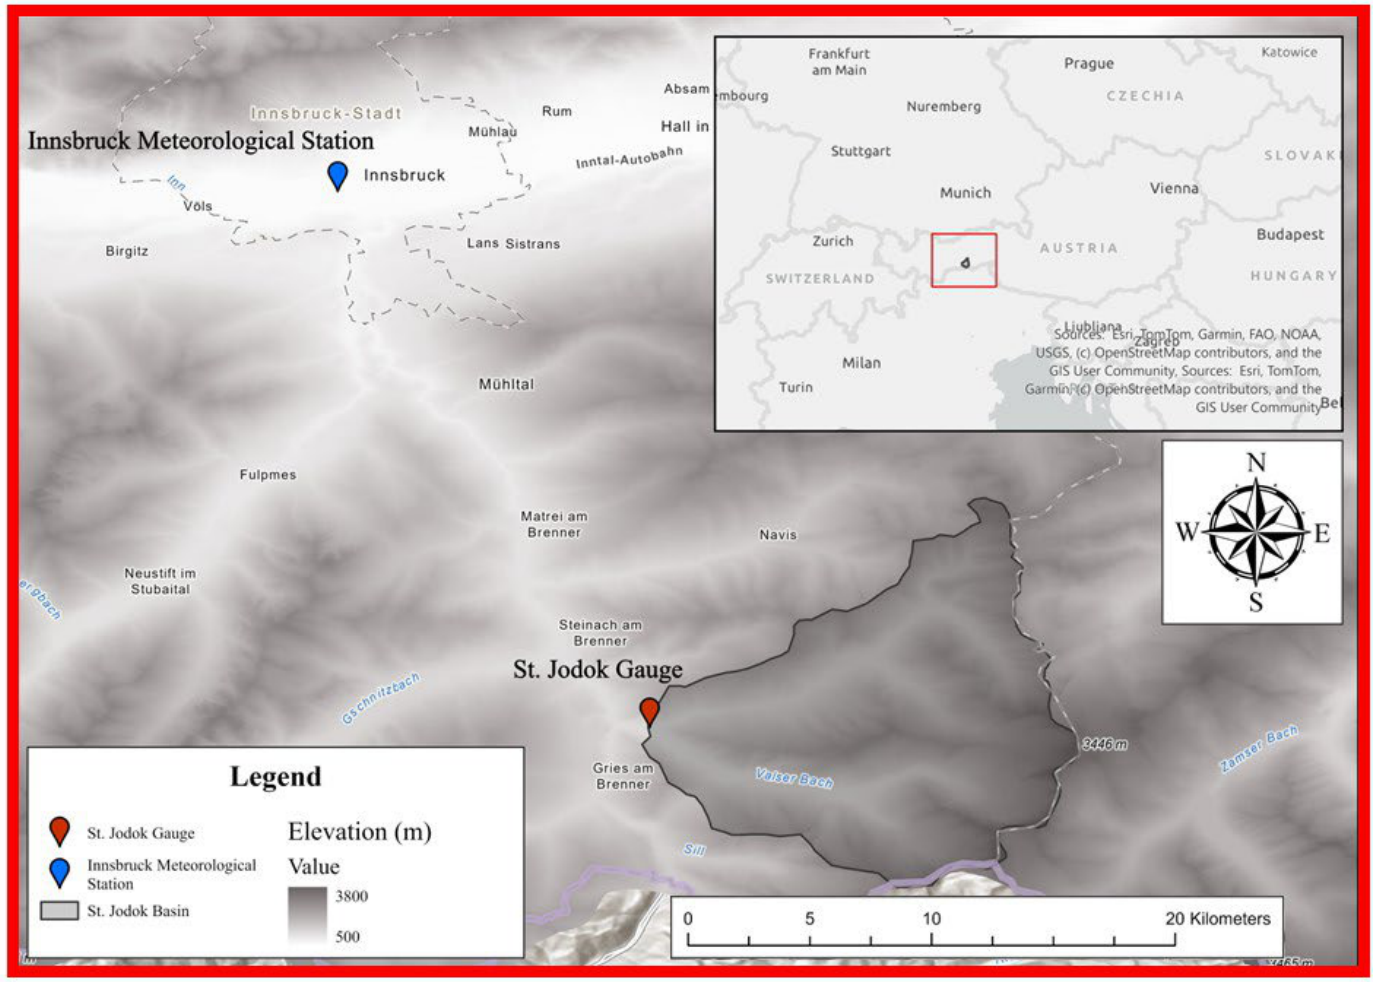
Seasonal precipitation data for Innsbruck, Austria, were acquired from the Historical Instrumental Climatological Surface Time Series of the Greater Alpine Region (HISTALP) database, maintained by the Austrian national meteorological service, GeoSphere Austria (formerly ZAMG) (Figure 1) [23]. Seasonal precipitation was calculated as cumulative AMJJA precipitation totals (mm) from the instrumental station record. The Innsbruck station was selected due to its long observational record and hydroclimatic relevance within the central Alpine region. The overlap period between tree-ring-based proxies and observed precipitation data used for model calibration and validation extends from 1859 to 2012. Observed streamflow data for the St. Jodok gauge, Austria, were obtained from the Austrian national hydrologic database administered through the eHYD platform (Figure 1) [38]. Seasonal streamflow volume was calculated as the cumulative MJJA streamflow volume and expressed in million cubic meters (MCM). The St. Jodok gauge was selected because of its hydrologic sensitivity to Alpine snowmelt and warm-season precipitation variability, making it suitable for dendro-hydrologic reconstruction. Additionally, the St. Jodok gauge is considered hydrologically unimpaired, with minimal upstream anthropogenic influences (e.g., withdrawals, diversions, and impoundments), thereby improving its suitability for reconstructing natural hydroclimatic variability. The overlap period between tree-ring-based proxies and observed streamflow data used for model calibration and validation extended from 1951 to 2012.
Figure 1.
Overview of the study area, including the Innsbruck Meteorological Station (blue marker), the St. Jodok streamflow gauge (red marker), and the contributing St. Jodok watershed (gray polygon). The inset map places the study area within Central Europe; the red rectangle outlines the extent of the larger map shown. Shaded relief indicates topography.
Tree-ring-based proxy data were obtained from the Old World Drought Atlas (OWDA), a spatially explicit, tree-ring-based reconstruction of warm-season hydroclimatic variability across Europe and surrounding regions [39,40]. The OWDA reconstructs an annual self-calibrating Palmer Drought Severity Index (scPDSI) using networks of tree-ring chronologies and provides gridded estimates of hydroclimatic conditions spanning multiple centuries. Because scPDSI integrates both precipitation and evaporative demand, OWDA grid cells provide a spatially distributed representation of regional moisture variability relevant to hydroclimatic conditions in the central Alps. Gridded OWDA scPDSI data located within 450 km of the precipitation (or streamflow) gauge location were considered candidate predictor variables for reconstruction model development [41]. Predictor grid cells deemed hydro-climatically relevant to the study region were evaluated within each moving calibration window.
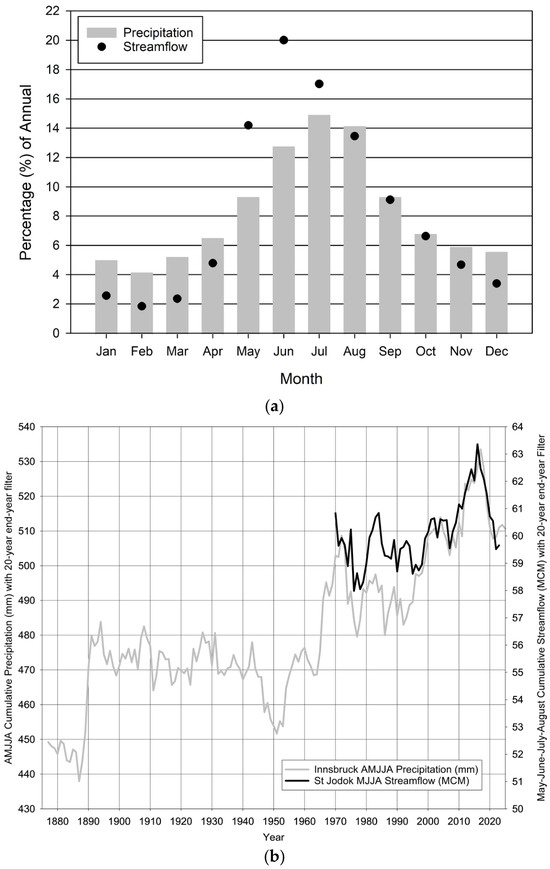
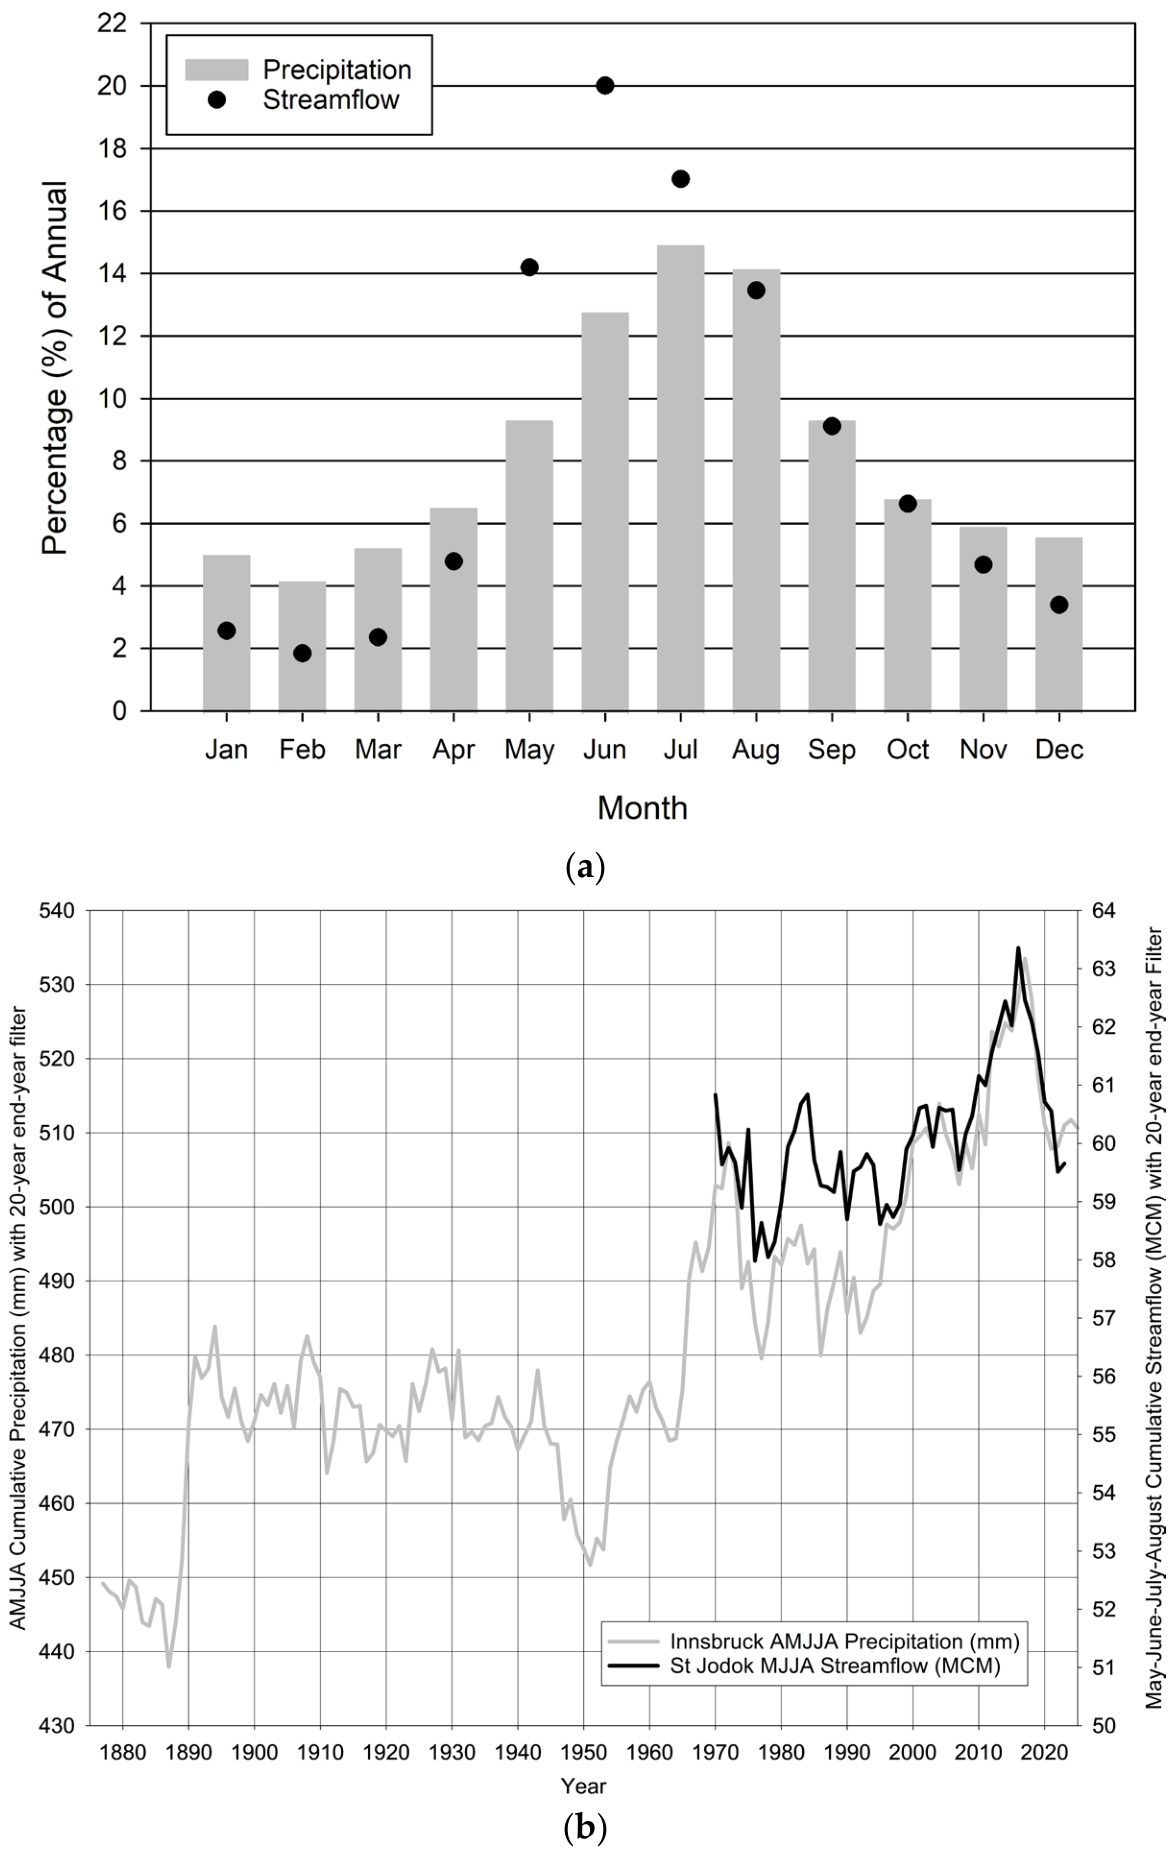
The seasonal periods selected for precipitation (AMJJA) and streamflow (MJJA) reconstruction were based on the climatological distribution of annual precipitation and streamflow at Innsbruck and the St. Jodok gauge, respectively (Figure 2a). These months correspond to the period of greatest hydroclimatic contribution, encompassing the highest percentage of annual precipitation and streamflow volume. Late spring through summer captures the dominant warm-season precipitation regime and snowmelt-driven runoff response characteristic of the central Alps. Restricting reconstruction efforts to these high-contribution months maximizes hydroclimatic signal strength and improves the likelihood of identifying robust relationships between OWDA scPDSI predictors and observed precipitation and streamflow variability. Application of a 20-year end-year filter reveals a pronounced long-term increase in both Innsbruck AMJJA precipitation and St. Jodok MJJA streamflow during the instrumental period (Figure 2b). Although interannual and decadal variability are evident, both variables exhibit a persistent upward trajectory beginning in the mid-20th century and extending into the early 21st century. The close interaction between increasing warm-season precipitation and streamflow suggests a strong hydroclimatic linkage, whereby enhanced seasonal moisture availability contributes to increased runoff generation within the St. Jodok watershed. The observed increase in streamflow likely reflects enhanced warm-season precipitation driving changes in Alpine hydrologic processes, including shifts in snowpack dynamics and meltwater contributions. Given the hydrologically unimpaired nature of the St. Jodok gauge, the observed trends are more likely to reflect the regional climatic forcing than results marred by anthropogenic watershed modification. The magnitude and persistence of the upward trend are particularly notable when viewed through the 20-year smoothing framework, with recent decades exhibiting sustained increases in both precipitation and streamflow (Figure 2b).
Figure 2.
(a) Monthly precipitation and streamflow distribution as a percentage of annual; (b) historic AMJJA cumulative precipitation (mm) and historic MJJA streamflow volume (MCM) with a 20-year end-year filter.
Methods applied in previous reconstruction studies [36] were adapted to reconstruct seasonal hydroclimatic variability in the central Alpine region. Specifically, reconstructions were developed for: (1) seasonal precipitation at Innsbruck, Austria, defined as cumulative AMJJA precipitation totals (mm); and (2) seasonal streamflow volume at the St. Jodok gauge, Austria, defined as cumulative MJJA streamflow volume (MCM). Forward–Backward SLR techniques [28] were applied to identify statistically significant OWDA scPDSI predictors and reconstruct the target variables.
A two-step screening procedure was used to identify OWDA scPDSI grid cells suitable for inclusion in reconstruction models. Because models were developed using moving calibration windows, predictor screening was conducted independently within each 30-year, 40-year, and 50-year calibration window, rather than across the full instrumental overlap period. First, the grid cells were correlated with observed hydroclimatic targets (AMJJA precipitation and MJJA streamflow volume) within each moving calibration window. Predictor grid cells (scPDSI cells within 450 km) [41] were required to exhibit statistically significant positive correlations at the 99% confidence level (p ≤ 0.01), consistent with prior reconstruction methods [36]. This step identified candidate predictors demonstrating strong hydroclimatic sensitivity specific to each calibration interval. Second, predictor stability was evaluated using moving correlation analysis to assess temporal consistency in scPDSI–hydroclimate relationships. A moving correlation window representing approximately one-third of the calibration period was applied, and all correlation coefficients were required to remain positive [36]. Predictor grid cells failing to demonstrate stable positive relationships within the calibration interval were excluded from further analysis [36].
To evaluate reconstruction robustness and quantify model uncertainty, multiple reconstruction models were developed for both Innsbruck AMJJA precipitation and St. Jodok MJJA streamflow volume using a moving-window calibration approach. Models were generated using 30-year, 40-year, and 50-year moving calibration windows spanning the full instrumental overlap periods (1859–2012 for precipitation and 1951–2012 for streamflow) [36], with windows sequentially advanced through the record (e.g., Year 1–30, Year 2–31, etc.) to assess temporal stability in predictor–hydroclimate relationships across varying climatic conditions [36].
For each moving calibration window, the two-step OWDA scPDSI screening procedure was first applied to identify interval-specific candidate predictor grid cells (Supplementary Materials—Workflow Diagram). Subsequently, Forward–Backward SLR models [28] were developed using retained OWDA scPDSI predictors. Predictor variables were iteratively added or removed based on statistical significance to optimize reconstruction skill while minimizing model complexity [28].
Model skill and robustness were evaluated using multiple complementary evaluation metrics. The coefficient of determination (R2) and predicted R2 were used to assess explained variance and predictive performance, respectively, with predicted R2 estimated using leave-one-out (drop-one) cross-validation. Because reconstruction models were developed using multiple moving calibration windows rather than a single fixed calibration period, leave-one-out cross-validation provided a consistent assessment of predictive skill across all calibration windows while maximizing use of the available instrumental record without requiring an arbitrary calibration–verification split.
To ensure adequate explanatory skill, only models with a calibration R2 ≥ 0.50 were retained. Model predictive stability was further evaluated by requiring the predicted R2 to be within 0.10 of the calibration R2, thereby minimizing overfitting and ensuring comparable calibration and cross-validation performance. Multicollinearity among predictor variables was assessed using the Variance Inflation Factor (VIF), and all retained models were required to exhibit VIF values less than 10 [42]. Serial autocorrelation in model residuals was evaluated using the Durbin–Watson (DW) statistic, with only models satisfying the significance criteria described by Durbin and Watson [43] retained. Model bias was assessed using the non-parametric one-sample Sign Test (ST), in which the median prediction error was tested against a value of zero. Only models for which the ST failed to reject the null hypothesis (p > 0.05), indicating no evidence of systematic over- or underestimation, were retained for reconstruction.
Collectively, these complementary evaluation criteria provided a rigorous assessment of model explanatory skill, predictive performance, predictor stability, multicollinearity, residual independence, and systematic bias prior to model retention.
Reconstruction models were retained only if they satisfied statistical performance criteria across evaluation metrics. Models exhibiting insufficient explanatory or predictive skill, problematic multicollinearity, residual autocorrelation, or systematic bias were excluded from subsequent analyses.
To reduce systematic bias between reconstructed and observed hydroclimatic values, reconstructed AMJJA precipitation and MJJA streamflow series were bias corrected using a quantile mapping approach [44]. This method adjusted reconstructed values according to the statistical distributions of observed and reconstructed data during the instrumental overlap period. Quantile mapping was implemented by matching the empirical cumulative distribution function (CDF) of each reconstructed series to the corresponding observed instrumental distribution over the calibration period. The resulting monotonic transformation corrected systematic distributional biases while preserving the temporal ordering of reconstructed values. To evaluate whether quantile mapping influenced low-frequency hydroclimatic variability, all precipitation and streamflow reconstructions were repeated without bias correction. Comparison of the bias-corrected and non-bias-corrected reconstructions (Supplementary Materials) demonstrated that the principal multi-decadal trends and rankings of wet and dry periods were preserved.
A 20-year end-year filter was applied to the ensemble of retained reconstruction models that were subsequently used to characterize reconstruction uncertainty. For each reconstructed year, the ensemble mean of retained model outputs was calculated and used as the primary reconstruction estimate, while the 5th and 95th percentile bounds were computed to quantify reconstruction uncertainty. This multi-model moving-window framework improves reconstruction robustness by accounting for temporal sensitivity in calibration periods and predictor selection while explicitly quantifying uncertainty associated with model structure and potential non-stationarity in predictor–climate relationships.
The extended instrumental record of the Innsbruck precipitation gauge provided a sufficiently robust calibration period to develop an independent precipitation reconstruction using a six-layer Deep Learning framework. For the independent precipitation reconstruction, the Deep Learning model was developed following the general ML-based precipitation reconstruction framework described in [37]. The model used AMJJA precipitation at Innsbruck as the response variable and the 272 OWDA scPDSI grid cells located within 450 km of the precipitation gauge as predictor variables. No additional feature-reduction step was applied, allowing the Deep Learning model to use the same initial predictor pool considered in the regression-based reconstruction framework. The final model consisted of a feed-forward neural network with six hidden layers containing 248, 124, 62, 31, 15, and 7 nodes, respectively, using a Rectifier (ReLU) activation function. The instrumental overlap period was divided into an 80:20 training–validation split. Model training was limited to 40 epochs and repeated across 2000 iterations, with the best-performing model retained based on validation performance. Predictor values were standardized prior to training. To reduce overfitting, the model incorporated early stopping with three stopping rounds and a stopping tolerance of 0.001, L1 regularization of 1.0 × 10⁻⁵, and a maximum squared weight constraint of 10. Model performance was evaluated using the independent validation subset.
Unlike the regression-based reconstruction, uncertainty bounds were not estimated for the Deep Learning reconstruction because it was developed as an independent methodological comparison rather than the primary reconstruction used for interpretation. Consequently, the Deep Learning reconstruction was evaluated primarily on its validation performance and its agreement with the regression-based reconstruction in reproducing long-term hydroclimatic variability. The final Deep Learning reconstruction was subsequently bias-corrected using the same quantile-mapping procedure applied to the regression-based reconstructions, allowing direct comparison between the Deep Learning and SLR precipitation reconstructions.
Application of a 20-year end-year filter to the resulting reconstruction permits direct comparison with the traditional SLR model, thereby enabling evaluation of methodological agreement in capturing long-term hydroclimatic variability and trends.
3. Results
To facilitate comparison with the longer instrumental precipitation record from the Innsbruck gauge, St. Jodok MJJA streamflow was the first to be reconstructed, due to the observed streamflow record being substantially shorter than the precipitation series (Figure 3a). Reconstruction models were developed using 30-, 40-, and 50-year calibration windows spanning the full St. Jodok MJJA streamflow observational period. This process yielded 22 unique reconstruction models (Supplementary Materials), each satisfying all predefined model skill criteria (R2 > 0.50; predicted R2 within 0.10 of calibration R2; variance inflation factor [VIF] < 10; Durbin–Watson [DW] test = pass; Sign Test [ST] = pass). Model uniqueness was confirmed by differences in the retained scPDSI grid-cell predictors across all regression equations.
Figure 3.
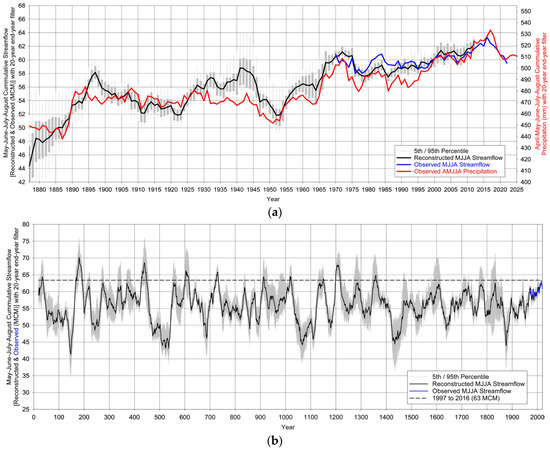
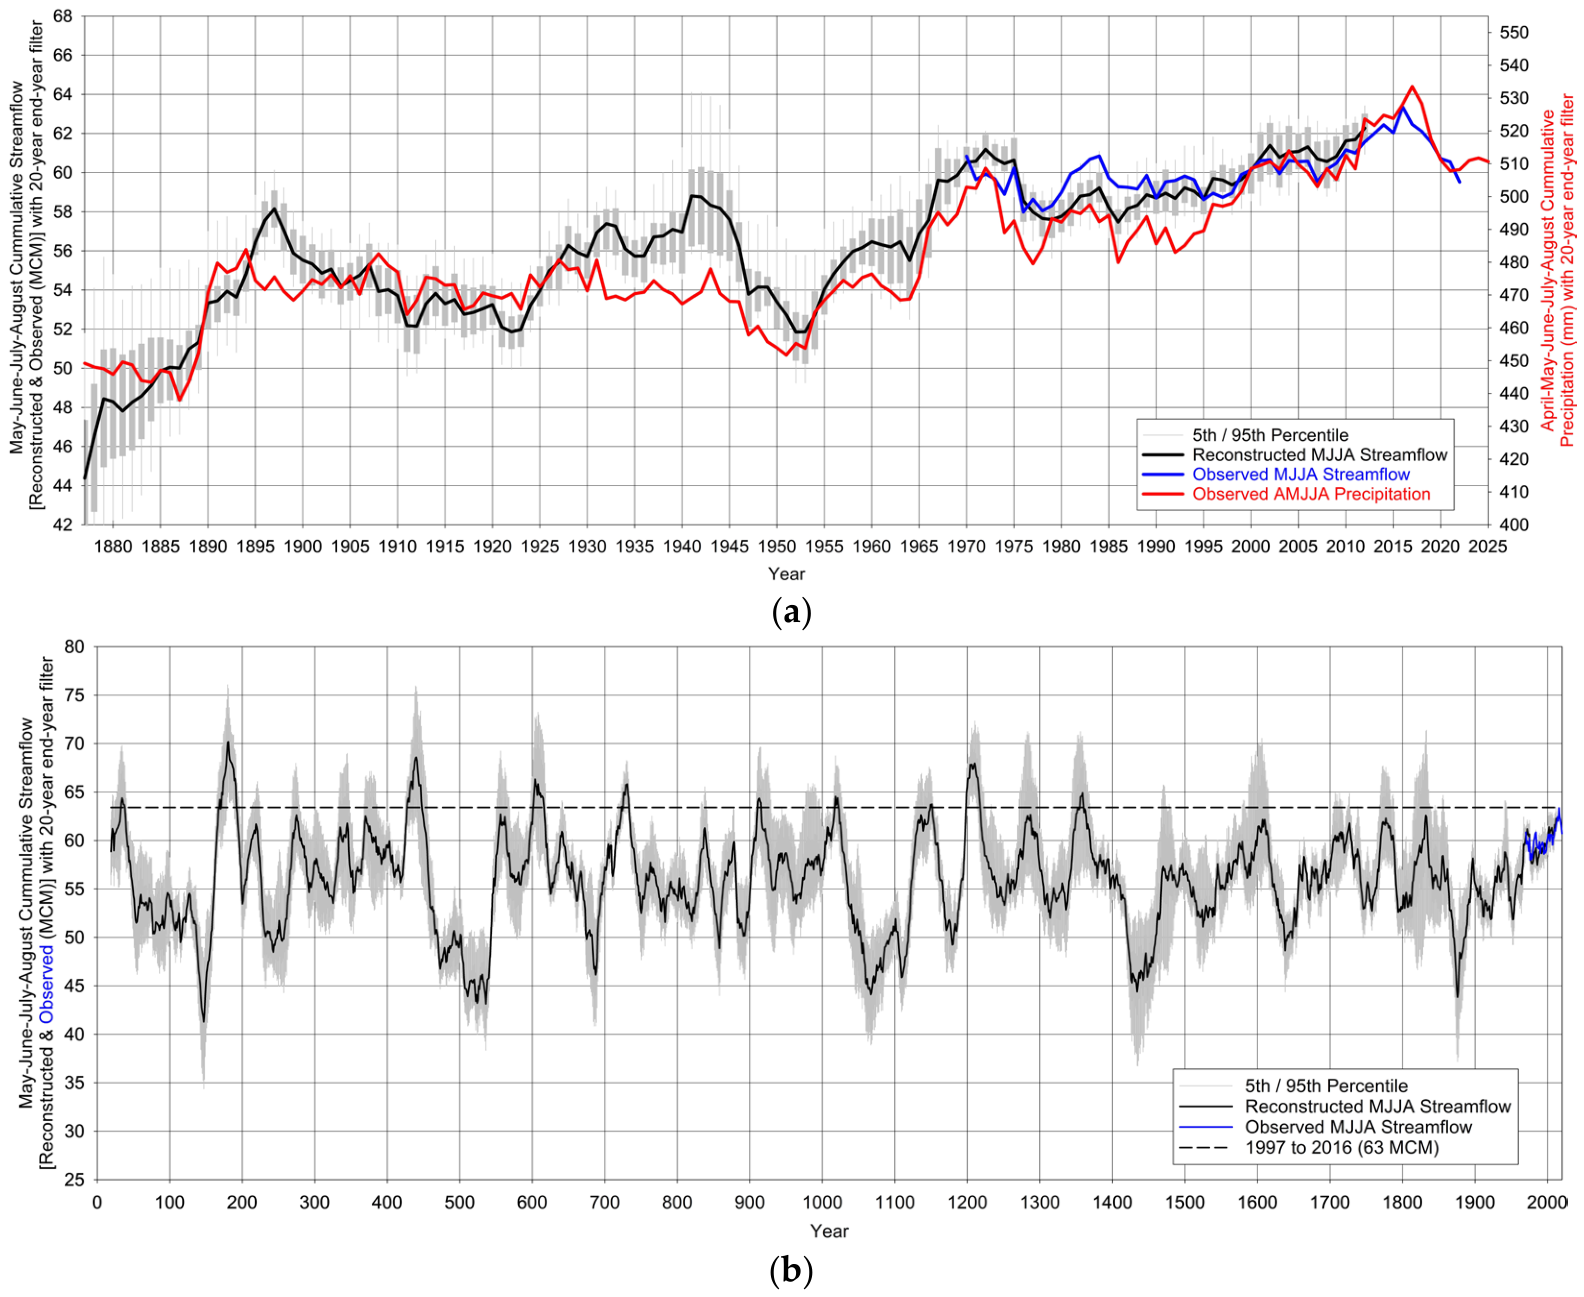
(a) Observed (blue line) and reconstructed mean (black line) with uncertainty (gray bars) MJJA streamflow with 20-year, end-year filter. Observed (red line) AMJJA precipitation with 20-year, end-year filter. (b) Observed (blue line) and reconstructed mean (black line) with uncertainty (gray bars) MJJA streamflow with 20-year, end-year filter. The observed 20-year peak is provided as a dashed line.
Overall reconstruction performance was strong, with a mean calibration R2 of 0.65 across the 22 models, indicating substantial skill in reproducing observed streamflow variability. To evaluate long-term hydroclimatic behavior, the ensemble mean of the 22 reconstructed MJJA streamflow series was smoothed using a 20-year end-year filter and compared with observed MJJA streamflow and observed Innsbruck AMJJA precipitation (Figure 3a). Uncertainty was quantified using the 5th and 95th percentile bounds of the reconstruction ensemble (gray shading/bars). The reconstructed streamflow series exhibited a long-term upward trajectory broadly consistent with the trend observed in instrumental precipitation, indicating coherent hydroclimatic variability between the two records.
Extension of the ensemble mean MJJA streamflow reconstruction (22-model average) using a 20-year end-year filter indicates that the recent increase in streamflow represents the most pronounced sustained positive anomaly in approximately 650 years, extending back to the mid-14th century (Figure 3b). The onset of this persistent upward trajectory began in the late 19th century, immediately following one of the most severe low-flow periods in the ~2000-year reconstruction. Specifically, the reconstructed 20-year low centered on 1876 (43.8 MCM) ranks among the driest intervals in the full record, exceeded only twice—during the early 6th century and mid-2nd century (Figure 3b).
The transition from this late 19th-century low-flow regime to the sustained increase observed during the instrumental and recent reconstructed period represents an exceptional hydroclimatic shift, characterized by a pronounced change from prolonged drought conditions to persistently elevated (pluvial) streamflow (Figure 3b).
Regression-based precipitation reconstruction models were developed using 30-, 40-, and 50-year calibration windows spanning the full instrumental Innsbruck AMJJA precipitation record. This procedure yielded 10 unique reconstruction models (Supplementary Materials), each satisfying all predefined model skill thresholds (R2 > 0.50; predicted R2 within 0.10 of calibration R2; variance inflation factor [VIF] < 10; Durbin–Watson [DW] test = pass; Sign Test [ST] = pass). Model uniqueness was confirmed by differences in the retained scPDSI grid-cell predictors across all regression equations.
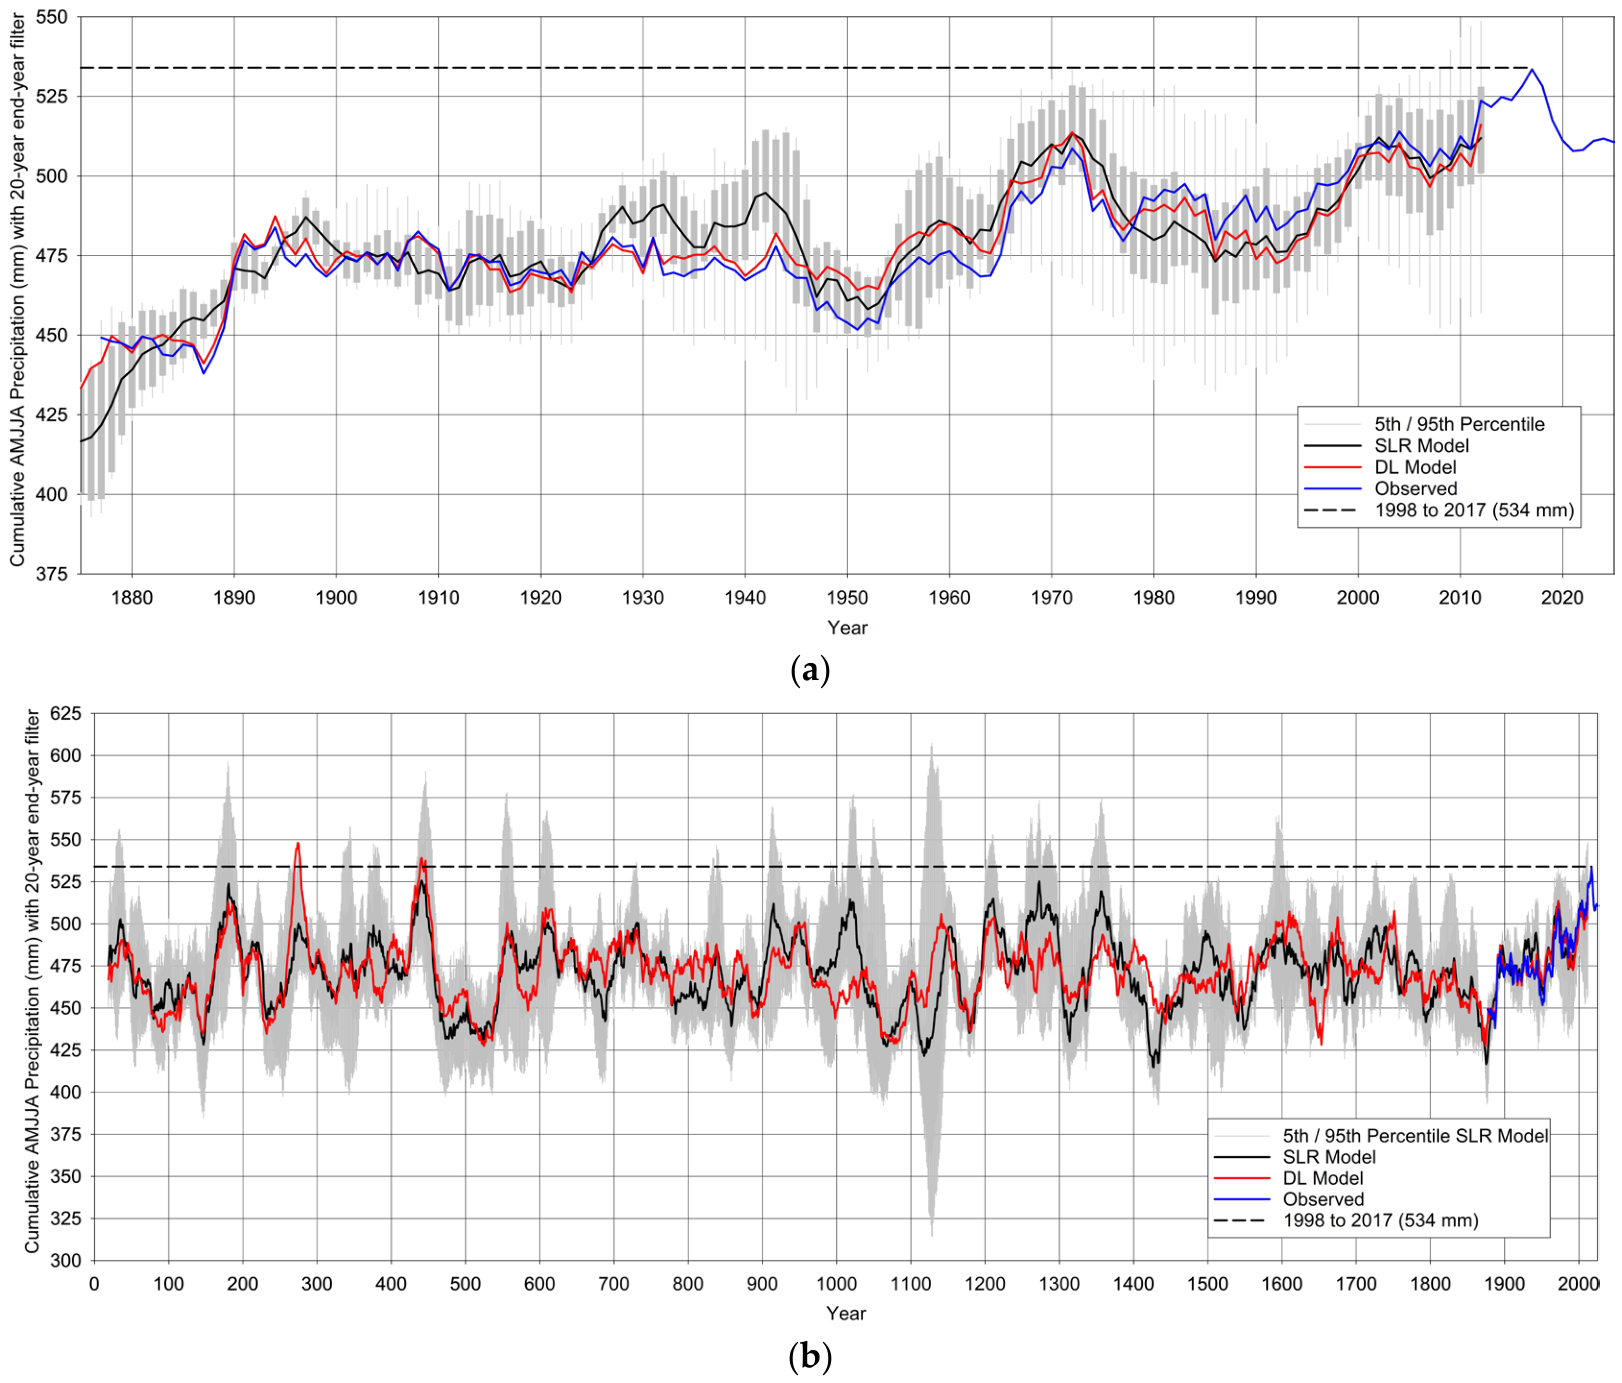
Overall reconstruction performance was robust, with a mean calibration R2 of 0.59 across the 10 regression models, indicating substantial skill in reproducing observed precipitation variability. To assess long-term hydroclimatic variability, the ensemble mean of the 10 reconstructed AMJJA precipitation series was smoothed using a 20-year end-year filter and compared with instrumental AMJJA precipitation and the independently reconstructed AMJJA precipitation derived from the Deep Learning framework (validation Root Mean Square Error—RMSE = 47.27 mm and validation R2 = 0.52) (Figure 4a). Reconstruction uncertainty for the regression ensemble was quantified using the 5th and 95th percentile bounds (gray shading/bars). Both the regression ensemble mean and Deep Learning reconstruction displayed a persistent long-term upward trajectory broadly consistent with trends observed in the instrumental precipitation record.
Figure 4.
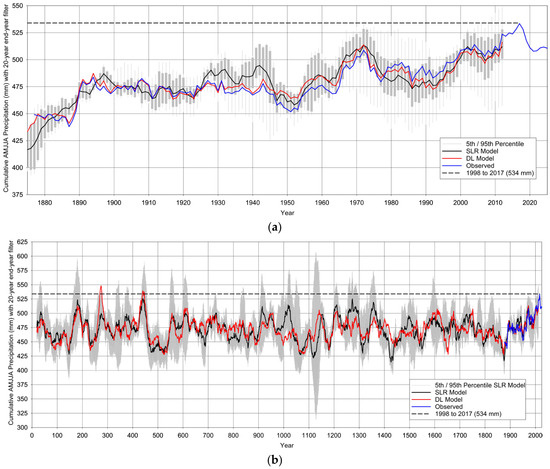
(a) Instrumental record—observed AMJJA precipitation (blue line), regression reconstructed mean (black line) with uncertainty (gray bars), Deep Learning reconstructed (red line), with a 20-year end-year filter. The observed 20-year peak is provided as a dashed line. (b) Paleo Record—observed (blue line), regression reconstructed mean (black line) with uncertainty (gray bars), Deep Learning Reconstructed (red line), and observed (blue line) AMJJA precipitation with a 20-year end-year filter. The observed 20-year peak is provided as a dashed line.
The observed 20-year precipitation maximum (1998–2017; 534 mm) represents the wettest sustained AMJJA interval in the instrumental record (Figure 4a). When evaluated within the full paleo reconstruction context (Figure 4b), this recent 20-year pluvial period was not exceeded in the ensemble mean of the 10 regression reconstructions and was exceeded only twice in the Deep Learning reconstruction, during the mid-5th and mid-3rd centuries. These results indicate that recent precipitation conditions are among the most anomalously wet sustained periods of the last ~2000 years.
Like the reconstructed streamflow record, the precipitation reconstructions reveal a marked transition from severe drought conditions in the late 19th century to persistently elevated precipitation during the recent period. The observed 20-year precipitation minimum centered on 1887 (438 mm) represents one of the most severe sustained drought intervals in the instrumental period. In the paleo context, drier 20-year periods than 1887 occurred intermittently in both reconstruction approaches. The regression ensemble identified lower precipitation intervals during the mid-16th, early-15th, early-14th, early and late 12th, late 11th, early 6th, late 5th, and mid-2nd centuries, whereas the Deep Learning reconstruction identified drier intervals during the mid-17th, late 12th, mid-to-late 11th, mid-6th, mid-3rd, mid-2nd, and mid-1st centuries (Figure 4b). Sensitivity analyses performed without quantile mapping produced nearly identical reconstructed trajectories and preserved the ranking of recent wet and historical dry periods (Supplementary Materials), indicating that the principal findings are insensitive to the bias-correction procedure.
4. Discussion
The reconstructed precipitation and streamflow records presented in this study are broadly consistent with previously reported hydroclimatic changes across the European Alps while extending the observational perspective from approximately 150 years to nearly two millennia. Numerous observational studies have documented widespread warming throughout the Alpine region together with changes in snowpack, glacier mass balance, runoff timing, and, in portions of the central Alps, increasing warm-season precipitation and hydroclimatic variability [2,3,4,5,6,7,8,9,10,11,12,13,14,15,16,17,18,19,20]. The present reconstructions demonstrate that these recent hydroclimatic changes are not only continuing but also represent some of the most sustained wet conditions observed within the context of the longer paleo record. By extending precipitation and streamflow records beyond the instrumental period, this study provides the temporal perspective necessary to evaluate whether recent hydroclimatic conditions fall within the range of natural variability.
The reconstructed MJJA streamflow record for the St. Jodok watershed indicates that recent sustained increases represent the strongest positive anomaly in approximately the last 650 years. Previous studies throughout the Alps have reported increasing streamflow, earlier runoff timing, and changing hydrologic regimes associated with warming temperatures, changing snowmelt dynamics, and increasing atmospheric moisture availability [8,9,10,11,20,21,22]. The reconstructed streamflow presented here agrees with these observed trends while substantially extending their temporal context. Rather than representing ordinary decadal variability, the recent increase in streamflow appears exceptional relative to the preceding several centuries, suggesting that contemporary hydrologic conditions occupy the upper range of reconstructed natural variability.
Similarly, the reconstructed AMJJA precipitation record indicates that recent decades rank among the wettest sustained intervals of approximately the last two millennia. Previous climatological investigations have documented increasing precipitation intensity and enhanced warm-season precipitation across portions of the central Alps during the twentieth and twenty-first centuries [13,14,15,16,17]. Increased atmospheric moisture associated with regional warming has also been linked to changes in extreme precipitation occurrence throughout European mountain regions [17,18,19,20]. The precipitation reconstruction developed in this study supports these observed trends in extreme precipitation across European Alpine regions, while demonstrating that recent pluvial conditions are exceptionally rare within the longer hydroclimatic history of the region. Although the regression reconstruction does not exceed the modern observed 20-year maximum, only two intervals in the independent Deep Learning reconstruction approach exceed recent precipitation, emphasizing the unusual nature of current hydroclimatic conditions.
The close correspondence between reconstructed precipitation and streamflow further supports the strong hydroclimatic linkage previously identified within the Inn River Basin and neighboring Alpine watersheds [21,22]. Previous studies have demonstrated that streamflow variability within the basin is strongly influenced by warm-season precipitation together with snow accumulation and temperature-driven melt processes. The nearly synchronous transition from late nineteenth-century drought conditions to sustained twentieth-century pluvial conditions observed in both reconstructions suggests that increasing moisture availability has become an increasingly important driver of runoff generation within this hydrologically unimpaired watershed. Because the St. Jodok gauge experiences minimal anthropogenic influence, the reconstructed changes are most reasonably interpreted as reflecting regional climatic forcing rather than watershed modification.
The late nineteenth-century drought identified in both reconstructions provides an important hydroclimatic benchmark against which recent changes can be evaluated. Instrumental observations have long recognized relatively dry conditions during the late nineteenth century within portions of the European Alps [2,5,23]. The present reconstructions demonstrate that this drought was not simply an isolated dry period within the instrumental record but instead ranks among the most severe sustained hydroclimatic deficits of approximately the last two millennia. The transition from this prolonged drought to the persistent pluvial conditions observed during the twentieth and twenty-first centuries therefore represents one of the most pronounced hydroclimatic regime shifts identified within the reconstructed record. Such abrupt transitions between sustained drought and pluvial conditions illustrate the capacity of Alpine hydroclimatic systems to undergo substantial long-term departures from historical norms and highlight the importance of considering extended paleoclimate records when evaluating modern climate variability.
Comparison with previous paleohydrologic reconstructions further supports the robustness of the present findings. Continental-scale reconstructions have demonstrated that European hydroclimate has historically been characterized by alternating multi-decadal drought and pluvial periods driven by natural climate variability [29,30,31,32]. Likewise, dendroclimatological investigations throughout Europe have documented substantial long-term fluctuations in moisture availability extending well beyond the instrumental record [30,31,32,33,34,35,36,37]. The present study is consistent with these broader reconstructions while providing a higher-resolution assessment focused specifically on the central Inn River Basin. Unlike many previous studies that reconstructed either drought indices or streamflow independently, the combined precipitation and streamflow reconstructions presented here provide mutually supporting evidence that recent hydroclimatic conditions are exceptional relative to long-term natural variability.
Methodologically, the moving-window calibration framework represents an advance over traditional dendrohydrologic reconstruction approaches that typically rely upon a single calibration interval and implicitly assume stationary predictor–climate relationships [27,28,29]. By developing independent reconstructions using sequential 30-, 40-, and 50-year calibration windows, the present study explicitly accounts for temporal variability in predictor sensitivity while reducing dependence on any individual calibration period. Ensemble averaging of statistically robust models further improves reconstruction stability and provides a quantitative estimate of structural uncertainty. The close agreement between the regression and Deep Learning reconstructions demonstrates that the principal long-term hydroclimatic trends are not dependent upon the statistical framework employed, providing additional confidence in the reconstructed transition from late nineteenth-century drought to modern pluvial conditions.
Because the principal conclusions depend upon the ranking of recent hydroclimatic conditions within the full paleo reconstruction, the influence of bias correction was explicitly evaluated. Repeating the complete reconstruction workflow without quantile mapping produced nearly identical multi-decadal precipitation and streamflow trajectories while preserving the relative ranking of both the late nineteenth-century drought and recent pluvial period (Supplementary Materials). Differences between the bias-corrected and non-bias-corrected reconstructions were limited primarily to small changes in reconstructed magnitudes rather than changes in temporal evolution or low-frequency variability. These results indicate that the principal conclusions are robust and are not artifacts of the bias-correction procedure.
Several limitations should also be acknowledged. First, the reconstructions rely upon OWDA-derived scPDSI predictors, which represent integrated moisture conditions rather than direct measurements of precipitation or streamflow. Second, although the moving-window framework partially addresses potential predictor non-stationarity, future climate conditions may differ from those represented during the instrumental calibration period. Third, the comparatively short instrumental streamflow record necessarily limits calibration under some hydroclimatic conditions. Nevertheless, the combination of rigorous predictor screening, multiple independent calibration windows, ensemble uncertainty estimation, sensitivity analyses, and independent Deep Learning comparison provides additional evidence that the reconstructed hydroclimatic signals are robust.
Although the climatic mechanisms responsible for the reconstructed transition from late nineteenth-century drought to modern pluvial conditions were beyond the scope of this study, the long-term reconstructions developed here provide an observational framework upon which future attribution studies can be based. Future research should evaluate whether similar late nineteenth-century to present hydroclimatic transitions are evident across other Alpine watersheds and precipitation records. Expanding comparable reconstructions throughout the European Alps would improve understanding of the spatial coherence of recent pluvial conditions and help distinguish localized watershed responses from broader climatic forcing. An equally important next step will be to investigate the climatic mechanisms responsible for the transition from late nineteenth-century drought to modern pluvial conditions by integrating long-term hydroclimatic reconstructions with atmospheric circulation analyses, climate model simulations, and other independent paleoclimate records.
5. Conclusions
This study developed tree-ring-based reconstructions of warm-season precipitation and streamflow for the central Inn River Basin using OWDA-derived hydroclimatic proxies and a moving-window ensemble calibration framework. By combining multiple statistically robust regression models with an independent Deep Learning reconstruction, the study provides a comprehensive assessment of hydroclimatic variability spanning approximately two millennia for precipitation and streamflow. The strong agreement among reconstruction approaches demonstrates the robustness of the identified long-term hydroclimatic trends.
The reconstructions reveal a remarkable transition from severe late nineteenth-century drought conditions to persistent modern pluvial conditions. Reconstructed MJJA streamflow indicates that recent sustained flows represent the strongest positive anomaly of approximately the last 650 years, while reconstructed AMJJA precipitation demonstrates that recent decades rank among the wettest sustained intervals of the past two millennia. These findings show that contemporary hydroclimatic conditions in the central Alps are exceptional when viewed within the context of long-term natural variability.
Comparison of reconstructed precipitation and streamflow demonstrates a strong and persistent hydroclimatic linkage within the Inn River Basin, supporting previous observations that warm-season precipitation, snow accumulation, and melt processes collectively govern regional runoff generation. Agreement between the regression and Deep Learning reconstructions, together with sensitivity analyses demonstrating that quantile mapping did not materially affect long-term variability or the ranking of hydroclimatic extremes, provides additional confidence that the principal conclusions are robust.
Beyond reconstructing past climate, this study provides an important long-term perspective for interpreting contemporary hydroclimatic change. Instrumental observations document that portions of the central Alps have become wetter during recent decades; however, the present reconstructions demonstrate that these recent pluvial conditions are exceptional within the context of centuries to millennia of natural hydroclimatic variability. This long-term perspective provides valuable information for water-resource management, hydropower planning, ecosystem conservation, and climate adaptation throughout Alpine river systems.
Finally, the moving-window ensemble reconstruction framework developed in this study provides a transferable methodology for dendrohydrologic investigations in other mountain regions. Application of this approach to additional Alpine watersheds and climate-sensitive river basins stands to improve understanding of long-term hydroclimatic variability while also providing a more robust framework for evaluating future climatic change.
As the Earth’s climate continues to evolve, distinguishing natural variability from emerging climatic change will require perspectives extending well beyond the instrumental record. Long-term hydroclimatic reconstructions such as those presented here provide an essential benchmark, enabling scientists and water managers to place contemporary changes within their proper historical context and supporting more resilient management of water resources throughout the European Alps.
Supplementary Materials
The following supporting information can be downloaded at https://alabama.box.com/s/ahbah4rc4i63slphluqwsxat3kd2zrqq (accessed on 6 July 2026).
Author Contributions
Conceptualization, G.T. and W.G.; methodology, A.A.R.M. and G.T.; software, A.A.R.M. and G.T.; validation, G.T. and J.W.; formal analysis, G.T., J.W. and M.D.; investigation, G.T. and W.G.; resources, G.T.; data curation, W.G. and G.T.; writing—original draft preparation, J.W. and M.D.; writing—review and editing, J.W., M.D. and G.T.; visualization, J.W., M.D. and G.T.; supervision, G.T. and W.G.; project administration, G.T. and W.G. All authors have read and agreed to the published version of the manuscript.
Funding
This study was supported by the National Science Foundation under Award No. 2152140.
Data Availability Statement
Instrumental precipitation data are publicly available through the HISTALP database (https://www.zamg.ac.at/histalp/, accessed on 6 July 2026) maintained by GeoSphere Austria. Streamflow data are publicly available through the Austrian eHYD hydrologic database (https://ehyd.gv.at/, accessed on 6 July 2026). Old World Drought Atlas (OWDA) data are publicly available through NOAA/NCEI Paleoclimatology archives (https://www.ncei.noaa.gov/access/paleo-search/study/19419, accessed on 6 July 2026). Reconstruction outputs and model results generated during this study are available from the corresponding author and are provided in Supplementary Materials (https://alabama.box.com/s/ahbah4rc4i63slphluqwsxat3kd2zrqq) (accessed on 6 July 2026).
Acknowledgments
The authors acknowledge The University of Alabama, Alabama Water Institute (AWI), and the Cooperative Institute for Research to Operations in Hydrology (CIROH) for their institutional support. The authors also thank the anonymous reviewers for their thoughtful comments and constructive suggestions, which substantially improved the quality and clarity of this manuscript.
Conflicts of Interest
The authors declare no conflicts of interest.
Abbreviations
The following abbreviations are used in this manuscript:
| AMJJA | April–May–June–July–August |
| MJJA | May–June–July–August |
| scPDSI | Self-calibrating Palmer Drought Severity Index |
| SLR | Stepwise Linear Regression |
| HISTALP | Historical Instrumental Climatological Surface Time Series of the Greater Alpine Region |
| OWDA | Old World Drought Atlas |
| VIF | Variation Inflation Factor |
| DW | Durbin Watson |
| ST | Sign Test |
References
- Viviroli, D.; Dürr, H.H.; Messerli, B.; Meybeck, M.; Weingartner, R. Mountains of the world, water towers for humanity: Typology, mapping, and global significance. Water Resour. Res. 2007, 43, W07447. [Google Scholar] [CrossRef] [Scilit]
- Brunetti, M.; Lentini, G.; Maugeri, M.; Nanni, T.; Auer, I.; Böhm, R.; Schöner, W. Climate variability and change in the Greater Alpine Region over the last two centuries based on multi-variable analysis. Int. J. Climatol. 2009, 29, 2197–2225. [Google Scholar] [CrossRef] [Scilit]
- Gobiet, A.; Kotlarski, S.; Beniston, M.; Heinrich, G.; Rajczak, J.; Stoffel, M. 21st century climate change in the European Alps—A review. Sci. Total Environ. 2014, 493, 1138–1151. [Google Scholar] [CrossRef] [Scilit] [PubMed]
- Beniston, M.; Farinotti, D.; Stoffel, M.; Andreassen, L.M.; Coppola, E.; Eckert, N.; Fantini, A.; Giacona, F.; Hauck, C.; Huss, M.; et al. The European mountain cryosphere: A review of its current state, trends, and future challenges. Cryosphere 2018, 12, 759–794. [Google Scholar] [CrossRef] [Scilit]
- Böhm, R.; Auer, I.; Brunetti, M.; Maugeri, M.; Nanni, T.; Schöner, W. Regional temperature variability in the European Alps: 1760–1998 from homogenized instrumental time series. Int. J. Climatol. 2001, 21, 1779–1801. [Google Scholar] [CrossRef] [Scilit]
- Brunner, M.I.; Van Loon, A.F.; Stahl, K. Moderate and severe hydrological droughts in Europe differ in their hydrometeorological drivers. Water Resour. Res. 2022, 58, e2022WR032871. [Google Scholar] [CrossRef] [Scilit]
- Ljungqvist, F.C.; Krusic, P.J.; Sundqvist, H.S.; Zorita, E.; Brattström, G.; Frank, D. Northern Hemisphere hydroclimate variability over the past twelve centuries. Nature 2016, 532, 94–98. [Google Scholar] [CrossRef] [Scilit] [PubMed]
- Pérez Ciria, T.; Chiogna, G. Intra-catchment comparison and classification of long-term streamflow variability in the Alps using wavelet analysis. J. Hydrol. 2020, 587, 124927. [Google Scholar] [CrossRef] [Scilit]
- Huss, M.; Hock, R. Global-scale hydrological response to future glacier mass loss. Nat. Clim. Change 2018, 8, 135–140. [Google Scholar] [CrossRef] [Scilit]
- Matiu, M.; Crespi, A.; Bertoldi, G.; Carmagnola, C.M.; Marty, C.; Morin, S.; Schöner, W.; Cat Berro, D.; Chiogna, G.; De Gregorio, L.; et al. Observed snow depth trends in the European Alps: 1971 to 2019. Cryosphere 2021, 15, 1343–1382. [Google Scholar] [CrossRef] [Scilit]
- Blöschl, G.; Hall, J.; Parajka, J.; Perdigão, R.A.P.; Merz, B.; Arheimer, B.; Aronica, G.T.; Bilibashi, A.; Bonacci, O.; Borga, M.; et al. Changing climate shifts timing of European floods. Science 2017, 357, 588–590. [Google Scholar] [CrossRef] [Scilit] [PubMed]
- Sonny, F.Z.; Moradian, S.; Olbert, A.I. Hydrological drought projections across Europe under climate change. npj Nat. Hazards 2026, 3, 37. [Google Scholar] [CrossRef] [Scilit]
- Isotta, F.A.; Frei, C.; Weilguni, V.; Perčec Tadić, M.; Lassègues, P.; Rudolf, B.; Pavan, V.; Cacciamani, C.; Antolini, G.; Ratto, S.M.; et al. The climate of daily precipitation in the Alps: Development and analysis of a high-resolution grid dataset from pan-Alpine rain-gauge data. Int. J. Climatol. 2014, 34, 1657–1675. [Google Scholar] [CrossRef] [Scilit]
- Rajczak, J.; Schär, C. Projections of future precipitation extremes over Europe: A multimodel assessment of climate simulations. J. Geophys. Res. Atmos. 2017, 122, 10773–10800. [Google Scholar] [CrossRef] [Scilit]
- Ménégoz, M.; Valla, E.; Jourdain, N.C.; Blanchet, J.; Beaumet, J.; Wilhelm, B.; Gallée, H.; Fettweis, X.; Morin, S.; Anquetin, S. Contrasting seasonal changes in total and intense precipitation in the European Alps from 1903 to 2010. Hydrol. Earth Syst. Sci. 2020, 24, 5355–5377. [Google Scholar] [CrossRef] [Scilit]
- Tabari, H. Climate change impact on flood and extreme precipitation increases with water availability. Sci. Rep. 2020, 10, 13768. [Google Scholar] [CrossRef] [Scilit] [PubMed]
- Hattermann, F.F.; Huang, S.; Koch, H. Climate change impacts on hydrology and water resources. Meteorol. Z. 2015, 24, 201–211. [Google Scholar] [CrossRef] [Scilit]
- Viviroli, D.; Zappa, M.; Gurtz, J.; Weingartner, R. An introduction to the hydrological modelling system PREVAH and its pre- and post-processing tools. Environ. Model. Softw. 2009, 24, 1209–1222. [Google Scholar] [CrossRef] [Scilit]
- Barnett, T.P.; Adam, J.C.; Lettenmaier, D.P. Potential impacts of a warming climate on water availability in snow-dominated regions. Nature 2005, 438, 303–309. [Google Scholar] [CrossRef] [Scilit] [PubMed]
- Bard, A.; Renard, B.; Lang, M.; Giuntoli, I.; Korck, J.; Koboltschnig, G.; Janža, M.; d’Amico, M.; Volken, D. Trends in the hydrologic regime of Alpine rivers. J. Hydrol. 2015, 529, 1823–1837. [Google Scholar] [CrossRef] [Scilit]
- Korck, J.; Danneberg, J.; Willems, W. Impacts of climate change on the water regime of the Inn River basin—Extracting adaptation-relevant information from climate model ensembles and impact modelling. Adv. Geosci. 2012, 32, 99–107. [Google Scholar] [CrossRef] [Scilit]
- Kormann, C.; Francke, T.; Bronstert, A. Detection of regional climate change effects on alpine hydrology by daily resolution trend analysis in Tyrol, Austria. J. Water Clim. Change 2015, 6, 124–143. [Google Scholar] [CrossRef] [Scilit]
- Auer, I.; Böhm, R.; Jurkovic, A.; Lipa, W.; Orlik, A.; Potzmann, R.; Schöner, W.; Ungersböck, M.; Matulla, C.; Briffa, K.; et al. HISTALP—Historical instrumental climatological surface time series of the Greater Alpine Region. Int. J. Climatol. 2007, 27, 17–46. [Google Scholar] [CrossRef] [Scilit]
- Fritts, H.C. Tree Rings and Climate; Academic Press: London, UK, 1976. [Google Scholar]
- Cook, E.R.; Kairiukstis, L.A. Methods of Dendrochronology: Applications in the Environmental Sciences; Kluwer Academic Publishers: Dordrecht, The Netherlands, 1990. [Google Scholar]
- Cook, E.R.; Seager, R.; Heim, R.R., Jr.; Vose, R.S.; Herweijer, C.; Woodhouse, C.A. Megadroughts in North America: Placing IPCC projections of hydroclimatic change in a long-term palaeoclimate context. J. Quat. Sci. 2010, 25, 48–61. [Google Scholar] [CrossRef] [Scilit]
- Woodhouse, C.A.; Gray, S.T.; Meko, D.M. Updated streamflow reconstructions for the Upper Colorado River Basin. Water Resour. Res. 2006, 42, W05415. [Google Scholar] [CrossRef] [Scilit]
- Woodhouse, C.A. A 431-yr reconstruction of western Colorado snowpack from tree rings. J. Clim. 2003, 16, 1551–1561. [Google Scholar] [CrossRef] [Scilit]
- Nasreen, S.; Součková, M.; Vargas Godoy, M.R.; Singh, U.; Markonis, Y.; Kumar, R.; Rakovec, O.; Hanel, M. A 500-year annual runoff reconstruction for 14 selected European catchments. Earth Syst. Sci. Data 2022, 14, 4035–4056. [Google Scholar] [CrossRef] [Scilit]
- Büntgen, U.; Frank, D.C.; Nievergelt, D.; Esper, J. Summer temperature variations in the European Alps, A.D. 755–2004. J. Clim. 2006, 19, 5606–5623. [Google Scholar] [CrossRef] [Scilit]
- Esper, J.; Krusic, P.J.; Ljungqvist, F.C.; Luterbacher, J.; Carrer, M.; Cook, E.; Davi, N.K.; Hartl-Meier, C.; Kirdyanov, A.; Konter, O.; et al. Ranking of tree-ring based temperature reconstructions of the past millennium. Quat. Sci. Rev. 2016, 145, 134–151. [Google Scholar] [CrossRef] [Scilit]
- Ljungqvist, F.C.; Seim, A.; Krusic, P.J.; González-Rouco, J.F.; Werner, J.P.; Cook, E.R.; Zorita, E.; Luterbacher, J.; Xoplaki, E.; Destouni, G.; et al. European warm-season temperature and hydroclimate since 850 CE. Earth-Sci. Rev. 2019, 194, 084015. [Google Scholar] [CrossRef] [Scilit]
- Carrer, M.; Urbinati, C. Age-dependent tree-ring growth responses to climate in Larix decidua and Pinus cembra. Ecology 2004, 85, 730–740. [Google Scholar] [CrossRef] [Scilit]
- Babst, F.; Bouriaud, O.; Poulter, B.; Trouet, V.; Girardin, M.P.; Frank, D.C. Twentieth century redistribution in climatic drivers of global tree growth. Sci. Adv. 2019, 5, eaat4313. [Google Scholar] [CrossRef] [Scilit] [PubMed]
- Büntgen, U.; Tegel, W.; Nicolussi, K.; McCormick, M.; Frank, D.; Trouet, V.; Kaplan, J.O.; Herzig, F.; Heussner, K.-U.; Wanner, H.; et al. 2500 years of European climate variability and human susceptibility. Science 2011, 331, 578–582. [Google Scholar] [CrossRef] [Scilit] [PubMed]
- Ramírez Molina, A.A.; Tootle, G.; Formetta, G.; Piechota, T.; Gong, J. Extraordinary 21st Century Drought in the Po River Basin (Italy). Hydrology 2024, 11, 219. [Google Scholar] [CrossRef] [Scilit]
- Ramírez Molina, A.A.; Bezak, N.; Tootle, G.; Wang, C.; Gong, J. Machine-Learning-Based Precipitation Reconstructions: A Study on Slovenia’s Sava River Basin. Hydrology 2023, 10, 207. [Google Scholar] [CrossRef] [Scilit]
- Austrian Federal Ministry of Agriculture and Forestry, Climate and Environmental Protection, Regions and Water Management (BML). eHYD—Electronic Hydrography Data Portal of Austria. Available online: https://ehyd.gv.at (accessed on 31 May 2026).
- National Integrated Drought Information System (NIDIS). Old World Drought Atlas (OWDA). Available online: https://www.drought.gov/data-maps-tools/old-world-drought-atlas (accessed on 31 May 2026).
- Cook, E.R.; Seager, R.; Kushnir, Y.; Briffa, K.R.; Büntgen, U.; Frank, D.; Krusic, P.J.; Tegel, W.; Van der Schrier, G.; Andreu-Hayles, L.; et al. Old World megadroughts and pluvials during the Common Era. Sci. Adv. 2015, 1, e1500561. [Google Scholar] [CrossRef] [Scilit] [PubMed]
- Ho, M.; Lall, U.; Cook, E.R. Can a paleodrought record be used to reconstruct streamflow? A case study for the Missouri River Basin. Water Resour. Res. 2016, 52, 5195–5212. [Google Scholar] [CrossRef] [Scilit]
- O’Brien, R.M. A Caution Regarding Rules of Thumb for Variance Inflation Factors. Qual. Quant. 2007, 41, 673–690. [Google Scholar] [CrossRef] [Scilit]
- Durbin, J.; Watson, G.S. Testing for Serial Correlation in Least Squares Regression. I. Biometrika 1950, 37, 409–428. [Google Scholar] [CrossRef] [Scilit] [PubMed]
- Robeson, S.M.; Maxwell, J.T.; Ficklin, D.L. Bias Correction of Paleoclimatic Reconstructions: A New Look at 1200+ Years of Upper Colorado River Flow. Geophys. Res. Lett. 2020, 47, e2019GL086689. [Google Scholar] [CrossRef] [Scilit]
Disclaimer/Publisher’s Note: The statements, opinions and data contained in all publications are solely those of the individual author(s) and contributor(s) and not of MDPI and/or the editor(s). MDPI and/or the editor(s) disclaim responsibility for any injury to people or property resulting from any ideas, methods, instructions or products referred to in the content. |
© 2026 by the authors. Licensee MDPI, Basel, Switzerland. This article is an open access article distributed under the terms and conditions of the Creative Commons Attribution (CC BY) license.