


Abstract
Landslides constitute one of the most lethal and costly hydrometeorological hazards at the global scale. There is a growing trend associated with the increase in extreme precipitation and the expansion of urban development on unstable slopes. In the tropical Andes, this problem is intensified under climate change scenarios. The objective of this study is to develop a logistic regression model to analyze socioeconomic risk due to landslides in the Bogotá Savannah (Colombia). An integrated risk model was developed using binary logistic regression and a socioeconomic vulnerability index. A total of 12 physical–biotic variables and SSP climate projections (2021–2040) were used. A GIS-based environment was implemented to generate prospective spatial risk scenarios. The model demonstrated high robustness and predictive capability, with an improvement in statistical goodness-of-fit of 8.2% (AIC: 2574–2367), adequate probabilistic calibration (Pseudo-R2: 0.675; Brier Score: 0.084), and excellent predictive performance (AUC: 0.935; sensitivity: 84.7%; specificity: 90.0%). Simulations estimated maximum risk probabilities close to 0.600 (scale between 0 and 1), concentrated in geomorphologically critical sectors. Simulations under SSP scenarios showed a progressive increase in risk toward 2040 (up to 0.673), associated with precipitation increases between 10 and 30%. Integrated modeling constitutes a reliable technical tool for land-use planning, climate adaptation, and prospective landslide risk management in urbanized Andean regions.
1. Introduction
Landslides constitute one of the most lethal hydrometeorological geohazards at the planetary scale. These events generate economic losses exceeding USD 20 billion annually and thousands of fatalities documented each year in international databases such as EM-DAT and the Global Fatal Landslide Database [1,2]. In the context of global climate variability, these phenomena have shown an upward trend in both frequency and magnitude since the late twentieth century. This trend is primarily driven by the increase in the intensity of extreme precipitation events associated with global warming [3,4]. The highest density of fatal events concentrate in tropical mountainous regions. Currently, approximately 13% of the global land surface is classified under conditions of very high landslide susceptibility, with the Andes Mountain Range representing one of the principal global hotspots. In Latin America, Colombia, Mexico, and Brazil record the highest rates of landslide-induced disasters. This phenomenon is exacerbated by unplanned urban expansion on unstable slopes and by limited institutional capacity in risk management [5,6,7].
Intense precipitation constitutes the primary trigger of landslides at the global scale, with consolidated evidence linking increases in the frequency and intensity of extreme rainfall events. There is a significant increase in susceptibility and risk associated with these phenomena, projected under the Shared Socioeconomic Pathway (SSP) scenarios of CMIP6 [8,9]. The Sixth Assessment Report of the IPCC (AR6, 2021) establishes that global warming will intensify hydroclimatic anomalies in tropical mountainous regions. The northwestern Andes of South America, including Colombia, represent one of the areas with the highest projected variability in precipitation regimes for the 2021–2040 horizon. This occurs under all SSP scenarios considered. Available projections for tropical South America indicate significant increases in precipitation variability and intensification of extreme events toward the mid-twenty-first century, particularly under SSP3-7.0 and SSP5-8.5 scenarios [10,11]. Nevertheless, a significant gap persists in the scientific literature. Operational landslide risk models at the regional scale in Latin America rarely integrate SSP projections as prospective inputs for land-use planning and risk management [12,13,14].
Landslide risk modeling has evolved from heuristic and bivariate statistical approaches, such as the frequency ratio index and weight-of-evidence analysis, toward machine learning (ML) methods and physically based models. This capacity to capture nonlinear relationships among conditioning factors has substantially improved predictive accuracy [15]. However, high-complexity ML models present critical limitations in interpretability and transferability that restrict their applicability in land-use planning and institutional landslide risk management contexts [16,17]. In contrast, logistic regression maintains a central role in the specialized literature due to its statistical robustness, methodological transparency, and efficiency with limited datasets. Logistic regression is consistently validated in comparative studies as a robust technique for hazard estimation at the regional scale [18]. In the present study, logistic regression was selected because the objective extended beyond predictive optimization toward the development of an interpretable and operational framework for prospective territorial risk assessment. Although ensemble machine learning methods may achieve higher predictive performance, their limited interpretability may constrain applicability in land-use planning. Logistic regression enables transparent estimation of predictor effects, probabilistic interpretation, and straightforward integration of SSP-based climate projections within a reproducible modeling framework. The most commonly used physical and biotic variables in these models include slope, lithology, vegetation cover, cumulative precipitation, and land use [15]. However, the literature identifies three persistent limitations: the predominance of static susceptibility models, the limited integration of socioeconomic vulnerability indicators (scientific production <15% of the total published on risk), and the low incorporation of future climate scenarios as prospective inputs [19,20].
Landslide risk is commonly defined as a function of three interdependent components: physical hazard, exposure, and vulnerability. The latter represents the dimension that introduces the greatest spatial heterogeneity in total risk estimation at the regional scale [21,22]. Socioeconomic indicators, including poverty levels, population density, access to basic services, and urban informality, critically determine the response and recovery capacity of exposed communities facing landslide events [23]. Empirical evidence is conclusive. Ronco et al. [24] demonstrated, through analysis conducted between 2016 and 2021 in 90 countries, that displacement due to landslides can be primarily attributed to the combination of deficient housing conditions and precipitation intensity. This confirms that differential vulnerability significantly amplifies human and material losses under the same level of physical hazard. In the Colombian tropical Andes, this issue acquires particular relevance. Colombian communities informally settled on unstable slopes in cities such as Bogotá and Medellín concentrate the highest historically recorded mortality rates due to landslides [7,25]. Nevertheless, a critical scientific gap persists in the literature. Integrated models that simultaneously combine physical hazard and socioeconomic vulnerability for hillside zones in the tropical Andes remain scarce [26,27]. This limitation reduces the effectiveness of land-use planning instruments and landslide risk management strategies.
The analysis of the specialized literature allows the identification of three scientific gaps that justify the present study. First, there is a scarcity of quantitative landslide risk models that simultaneously integrate physical, biotic, and socioeconomic variables for the tropical Andes and the Bogotá Savannah. Available studies in the region address either physical susceptibility or social vulnerability in isolation [19,26], without a systemic perspective on landslide risk. Second, SSP scenarios from CMIP6 (climate projections to 2040 from IDEAM) have been scarcely incorporated into operational territorial risk management tools at the regional scale in the tropical Andes and Colombia, limiting the prospective capacity of land-use planning decisions [28]. Third, the predominance of partial approaches (focused solely on hazard or vulnerability) prevents a holistic estimation of landslide risk required for effective planning [29]. In response to these gaps, the present study contributes an integrated logistic regression model that incorporates physical, biotic, and socioeconomic variables, projected under SSP scenarios for the 2040 horizon. Its results can be directly applied to land-use planning instruments in regions of the tropical Andes and contribute to the achievement of the Sustainable Development Goals (11: Sustainable Cities and Communities, and 13: Climate Action).
In this context, the objective of this study is to develop a logistic regression model to analyze socioeconomic landslide risk in the Bogotá Savannah (Colombia) through the integration of physical, biotic, and socioeconomic variables under climate change scenarios. The study addresses three scientific gaps identified in the literature: the limited integration of territorial vulnerability in landslide models, the scarce incorporation of SSP climate projections in operational risk assessments, and the lack of integrated approaches for tropical Andean regions. Prospective risk scenarios for 2040 were evaluated using regional SSP climate projections.
2. Materials and Methods
2.1. Study Area
The characterization of the study area is presented as an integral component of the methodological framework, given that the geomorphological, hydroclimatic, and territorial conditions of the Bogotá Savannah directly determine the selection of conditioning variables, model structure, and spatial interpretation of landslide susceptibility and socioeconomic risk.
The Bogotá Savannah is located in the Department of Cundinamarca, within the Eastern Cordillera of the Colombian Andes, approximately at coordinates 4.848° N and −74.020° W (Figure 1). The study area covers an approximate surface of 427,163 hectares and has a perimeter of 433.7 km, comprising 49 municipalities and the megacity of Bogotá. From a land cover perspective, the region includes nearly 230 km2 of forested areas and approximately 4041 km2 of non-forested land, predominantly characterized by agricultural and urban uses. The hydroclimatic regime presents annual precipitation ranging between 500 and 2000 mm, with maximum values in the northeastern sector of the territory, and temperatures ranging between 0 and 18 °C, characteristic of high-Andean ecosystems. According to the Caldas–Lang climate classification [30], ten climatic zones are identified, with cold semi-arid zones predominating (approximately 1160 km2). Likewise, the aridity index presents values >0.20, with nearly 1991 km2 under conditions of water deficit. These environmental characteristics, combined with territorial transformation processes, establish a context of particular environmental vulnerability in the study region.
Figure 1.
Location of the Bogotá Savannah, Colombia. Regional location and location of instability zones.
From a hydrological and geomorphological perspective, the study region is predominantly located within the Bogotá River basin, with a small fraction in the Garagoa River basin. The study area contains 21 sub-basins, among which the Tibitoc–Soacha sub-basin stands out, with an approximate extent of 718 km2. The territory includes four moor complexes and nine units of the Cundiboyacense high plateau, with the Cruz Verde–Sumapaz moor being the largest (276 km2), located in the southeastern sector. Additionally, approximately 398 km2 of wetlands are recorded, representing key ecosystems for regional hydrological regulation. In terms of land cover, grasslands predominate (1650 km2), followed by crop–pasture mosaics (798 km2), artificialized territories (523 km2), and dense herbaceous vegetation (338 km2). Soil degradation processes are also significant, with approximately 2660 km2 affected by very slight salinization and 2374 km2 exhibiting moderate erosion. These conditions, together with urban expansion on slopes and geologically susceptible zones, increase territorial exposure to slope instability processes in the tropical Andes (Figure 1). These biophysical and socio-environmental conditions make the Bogotá Savannah a particularly relevant territory for evaluating risks associated with mass movement processes under climate change scenarios, especially in urban and peri-urban contexts of the Andean tropics.
2.2. Preliminary Scope Review and Selection of Conditioning Variables
To identify the most widely used modeling approaches and explanatory variables in landslide susceptibility studies, a preliminary scope review was conducted for the period 2020–2024. The following scientific databases were considered: Scopus, ScienceDirect, Taylor & Francis, and Google Scholar. The preliminary scope review was structured into three consecutive stages: (i) characterization of the bibliographic universe, (ii) identification of modeling approaches, and (iii) identification of explanatory variables. In the first stage, the combination of keywords “Landslides” and “Susceptibility” was used, allowing the identification of an initial universe of 3647 documents. A preliminary analysis was conducted on this information universe using descriptive statistics. In the second stage, the term “Model” was incorporated into the search algorithm, enabling the identification of 13 predominant modeling approaches employed in landslide susceptibility studies. Based on inclusion criteria related to thematic relevance, methodological quality, and recurrence in the literature, 29 scientific articles were selected for detailed analysis of modeling approaches. Lastly, in the third stage, the term “Variable” was incorporated into the search strategy, enabling the identification of 12 explanatory variables with the highest recurrence in landslide susceptibility models. This was achieved through the analysis of an additional 44 articles, resulting in a total of 73 documents analyzed in the preliminary scope review. In other words, the information exclusion rate corresponded to 99.7% of the initial universe of records.
This preliminary scope review was conducted exclusively to support the selection of conditioning variables and the modeling approach used in the present study. Therefore, it should be interpreted as a methodological justification step rather than as a systematic or standalone review of landslide susceptibility literature.
To evaluate the relative relevance of the identified modeling approaches and explanatory variables, a normalized relative citation index was applied [31], calculated from the citation frequency of each approach or variable across the considered databases. This index was classified into bibliographic influence quartiles with values ranging between 0 and 1, defined as: Q1 (1–0.75), Q2 (0.75–0.50), Q3 (0.50–0.25), and Q4 (0.25–0). The Q1 quartile represented the highest level of scientific relevance (highest citation frequency). The final index value was obtained through the arithmetic mean of the values recorded in each database, reducing potential bias derived from differences in bibliographic coverage among the databases considered. The bibliometric analysis was conducted in RStudio V.4.x (Boston, MA, USA) using the bibliometrix package and its Biblioshiny interface (Naples, CAM, Italy), tools widely used in scientometric analyses for the evaluation of scientific trends [32]. Initially, descriptive statistics were applied to characterize the temporal, geographic, and thematic distribution of the bibliographic universe. Subsequently, the citation frequency of modeling approaches and explanatory variables was evaluated, as well as their geographic distribution in the analyzed studies. The potential association between approaches and variables was evaluated using Fisher’s exact test (α = 0.05), recommended for contingency matrices with small frequencies [33]. Lastly, a Principal Component Analysis (PCA) was applied based on presence–absence matrices of variables in the selected documents. This procedure aimed to identify co-occurrence patterns and reduce the dimensionality of the set of variables used in landslide susceptibility models.
2.3. Socioeconomic Landslide Risk Modeling Framework
The construction of the socioeconomic landslide risk model was carried out through the integration of a probabilistic hazard model and a socioeconomic vulnerability model. The conceptual framework for risk assessment proposed by United Nations Office for Disaster Risk Reduction (UNDRR) and Intergovernmental Panel on Climate Change (IPCC) [34] was followed, in which risk was defined as a function of hazard and vulnerability. The hazard model was developed using binary logistic regression, a technique widely applied in landslide susceptibility studies due to its capacity to estimate occurrence probabilities from continuous and categorical explanatory variables [35]. The analysis was implemented in RStudio V.4.x (Boston, MA, USA) for statistical modeling and ArcGIS ArcMap V.10.8.2 (Redlands, CA, USA) for spatial processing and analysis of variables.
For prospective simulations under SSP scenarios (2021–2040), only the maximum 24 h precipitation variable was dynamically modified using regional climate projections from IDEAM [36]. Land use, socioeconomic vulnerability, population distribution, and other physical conditioning variables were kept constant to isolate the climatic effect on landslide risk. This assumption was considered appropriate given the relatively short projection horizon and the absence of harmonized spatial projections of urban expansion and demographic redistribution at the regional scale of the Bogotá Savannah. In this study, climate-related effects were operationalized exclusively through projected changes in maximum 24 h precipitation derived from regional SSP scenarios (2021–2040). Therefore, prospective simulations should be interpreted as precipitation-driven modifications in landslide susceptibility and socioeconomic risk rather than as a comprehensive representation of climate change impacts. Other physical, land-use, and socioeconomic variables were kept constant to isolate the influence of projected hydroclimatic variability on slope instability processes within the Bogotá Savannah.
Socioeconomic vulnerability was estimated using a composite index constructed from three territorial indicators [37,38]: socioeconomic status (https://www.dane.gov.co/index.php/servicios-al-ciudadano/servicios-informacion/estratificacion-socioeconomica, accessed on 1 January 2024), poverty classification—SISBEN IV (https://www.sisben.gov.co/Paginas/conoce_el_sisben.html, accessed on 1 January 2024), and the Multidimensional Poverty Index (MPI) from DANE (https://microdatos.dane.gov.co/index.php/catalog/903, accessed on 1 January 2024). These indicators were integrated through normalized weighting. Lastly, landslide risk was obtained through the spatial combination of hazard and vulnerability surfaces, generating probabilistic risk maps applicable to land-use planning and prospective risk management.
2.3.1. Landslide Inventory and Sample Construction
The model was constructed from an inventory of 2450 mass movement events. This inventory was obtained through the integration of records from the Mass Movement Information System (SIMMA–SGC) (Table S1), identification using official orthophotographs from IGAC, and visual verification in Google Earth for the period 1900–2024. The inventory was divided into 70% for training (n = 1715), 10% for calibration (n = 245), and 20% for validation (n = 490). To construct the binary logistic regression model, both landslide and non-landslide samples were incorporated. The susceptibility database consisted of 4900 records, including 2450 documented landslide events and 2450 non-slide observations. Non-slide samples were generated from areas without documented landslide occurrence to represent absence conditions and support probabilistic discrimination between stable and unstable terrain. This strategy has been recommended to evaluate model stability and avoid overfitting problems in predictive models of natural hazards [39]. The dataset was divided into 70% for training, 10% for calibration, and 20% for validation.
2.3.2. Conditioning Factors and Spatial Standardization
The model incorporated 12 physical and biotic variables related to slope stability, previously identified in the literature review: maximum precipitation in 24 h, elevation, slope, slope aspect, topographic wetness index (TWI), plan curvature, normalized difference vegetation index (NDVI), distance to roads, distance to rivers, distance to geological faults, lithology, and land use. The information for these variables was obtained from the digital elevation model (DEM) generated by the Phased Array L-band Synthetic Aperture Radar (PALSAR) on the Advanced Land Observing Satellite (ALOS)—ALOS PALSAR DEM (12.5 m) (https://www.earthdata.nasa.gov/data/tools/vertex, accessed on 1 January 2024), Sentinel-2 (10 m) (https://dataspace.copernicus.eu/data-collections/copernicus-sentinel-missions/sentinel-2, accessed on 1 January 2024), thematic cartography from Agustín Codazzi Geographic Institute—IGAC (https://www.colombiaenmapas.gov.co/inicio, accessed on 1 January 2024), and Colombian Geological Survey—SGC (https://www2.sgc.gov.co/sgc/mapas/Paginas/geoportal.aspx, accessed on 1 January 2024). These variables were standardized to an approximate spatial resolution of 12.5 × 12.5 m, consistent with common practices in regional landslide susceptibility modeling [40].
A detailed layout of the conditioning parameters used in the landslide susceptibility model is presented in Table S2, including variable type, thematic classification, spatial resolution, source, and role within the modeling framework. The conditioning variables were spatially standardized to a resolution of 12.5 × 12.5 m (Figure S1). Land-use information corresponded to the official IGAC land-cover cartography for the year 2021, which was used as the baseline territorial condition for model calibration and maintained constant during SSP-based prospective simulations (2021–2040) to isolate the climatic effect on landslide risk.
2.3.3. Derivation of Geomorphological and Biophysical Variables
The variables used represented the principal geomorphological, hydrological, and anthropogenic controls on slope stability. Elevation, slope, slope aspect, and plan curvature were derived from the ALOS PALSAR DEM (12.5 m), with altitudinal values ranging between 2532 and 3991 m above sea level in the Bogotá Savannah. These variables were derived from ALOS PALSAR DEM (12.5 m), Sentinel-2 (10 m), and official cartography from IGAC and SGC. The Topographic Wetness Index (TWI) [41] was calculated using Equation (1):
where corresponded to the specific catchment area and β represented the local slope. The obtained values ranged between 0.8 and 27, indicating spatial gradients of moisture accumulation. The Normalized Difference Vegetation Index (NDVI) [42] was estimated from Sentinel-2 imagery using the following spectral relationship (Equation (2)):
with values ranging between −1–0.76, representing gradients of vegetation cover. Proximity variables (distance to rivers, roads, and faults) were calculated using Euclidean distance based on official cartography from IGAC (1:25,000) and the Colombian Geological Survey (1:100,000), with maximum ranges of 3.6 km for rivers and 40 km for roads and faults. Maximum precipitation in 24 h was estimated from 73 meteorological stations of Colombian Institute of Hydrology, Meteorology, and Environmental Studies—IDEAM (1996–2024) using ordinary Kriging interpolation [43], generating continuous climatic surfaces with a resolution of 12.5 m.
2.3.4. Logistic Regression Formulation and Model Calibration
The conditional probability of landslide occurrence was estimated using the following logistic model (Equation (3)):
where , fi represents the 12 physical and biotic factors considered.
A manual backward simplification strategy was applied to refine the preliminary logistic regression model. Variable selection was not based exclusively on p-values, but on the combined evaluation of statistical significance (p-value < 0.050), parameter stability, and overall model performance. Variables showing non-significant effects, unstable parameter estimation (quasi-complete separation), or limited explanatory contribution were sequentially assessed for removal. After each adjustment, model performance was re-evaluated using residual deviance, Akaike Information Criterion (AIC), and probabilistic calibration metrics to improve model parsimony while minimizing overfitting risk and preserving predictive robustness.
Model selection was performed using the training dataset (n = 1715) through residual analysis and statistical significance testing of coefficients. The relevance of each predictor was evaluated using the z-statistic, the Akaike Information Criterion (AIC), and multicollinearity analysis using the Variance Inflation Factor (VIF), considering VIF values >5 as indicative of problematic collinearity [44,45]. Statistical standardization of predictors (e.g., z-score normalization) was not applied prior to logistic regression because the objective of the model emphasized interpretability in original measurement units and probabilistic inference rather than coefficient comparability or algorithmic optimization. Moreover, multicollinearity diagnostics (VIF < 5) indicated stable parameter estimation despite differences in predictor scales. All predictors were spatially harmonized to a common analytical resolution (12.5 × 12.5 m) to ensure model consistency. For variables exhibiting nonlinear behavior, cubic spline functions were applied, enabling flexible modeling of relationships between covariates and occurrence probability [9].
Model calibration was conducted with the 10% subset (n = 245) using goodness-of-fit tests, including Likelihood Ratio, Hosmer–Lemeshow, Spiegelhalter’s Z-statistic, Brier Score, and Pseudo-R2 [46]. External validation was performed with the 20% dataset (n = 490) using the Receiver Operating Characteristic (ROC) curve and the Area Under the Curve (AUC), in addition to metrics derived from the confusion matrix (accuracy, precision, sensitivity, specificity, F1-score, and Kappa coefficient) [47,48]. Although an independent validation subset (20% of the inventory; n = 490) was used to evaluate predictive performance, the dataset was randomly partitioned from the same regional landslide inventory and therefore did not constitute a temporally or geographically independent validation dataset. This limitation may constrain model generalizability beyond the calibration domain. However, this approach was adopted due to the absence of temporally stratified and spatially independent landslide inventories for the Bogotá Savannah. Future studies should evaluate model transferability using independent temporal inventories and geographically withheld validation domains. Model sensitivity was evaluated using Equation (4) and specificity using Equation (5):
where VP, VN, FP, and FN represent true positives, true negatives, false positives, and false negatives, respectively. These metrics allowed evaluation of the discriminative capacity of the model to correctly classify zones with and without landslide occurrence. This procedure has been widely applied in recent studies of probabilistic landslide susceptibility modeling in mountainous regions [49,50].
2.3.5. Socioeconomic Vulnerability Assessment
Socioeconomic vulnerability was conceptualized as the differentiated capacity of households to anticipate, withstand, and recover from landslide events. This definition is consistent with the conceptual frameworks of the IPCC (AR6) [51] and UNDRR [52]. Its quantification was carried out using a multicriteria composite index (IVSE) [53], constructed from three indicators representative of the socioeconomic conditions of the territory: Stratification-Based Vulnerability Indicator (IVE) [54], poverty classification—SISBEN IV (IVS) [55], and the Multidimensional Poverty Index (MPI) [55]. These indicators were integrated under an equal-weighting scheme. The adopted formulation was as follows (Equation (6)):
where each indicator was previously normalized within the range between 0 and 1, ensuring comparability and metric consistency. Data were obtained from the following official sources in Colombia: DANE (2018 Census and MPI 2024) and the Government of Cundinamarca (SISBEN IV). The information was obtained at a spatial resolution equivalent to urban census sections (20–22 city blocks) and rural sections (20 km2), enabling analysis at a scale of 1:25,000. Additionally, the Stratification-Based Vulnerability Indicator (IVE) was estimated from the distribution of households across six socioeconomic strata, assigning weights between 1 (stratum 1, <195 USD/month) and 0.1 (stratum 6, >840 USD/month), and calculated as a weighted average by number of households. The equation used was as follows (Equation (7)):
where Vi represented the number of households and Gvi the degree of vulnerability. The Poverty Indicator—SISBEN IV (IVS) was calculated analogously, considering four population groups (A–D), with weights between 1 (extreme poverty) and 0.1 (non-poverty). The MPI was incorporated directly as a continuous indicator (0–1), derived from 15 variables grouped into five dimensions (education, health, employment, childhood, and services) (Table S3), in accordance with DANE standards. The three indicators were classified into five categories (low to high vulnerability) with consistent intervals between 0.1 and 1.0, enabling direct integration without additional transformations. This procedure followed multicriteria approaches widely applied in territorial vulnerability assessments and risk analysis in complex socio-environmental systems [56,57], ensuring statistical coherence and applicability in spatial risk models. Although an equal-weighting scheme was adopted to ensure methodological transparency, reproducibility, and consistency among normalized indicators, it is acknowledged that multicriteria socioeconomic indices may be sensitive to weighting assumptions. The selected approach was considered appropriate given the absence of a validated regional weighting framework for the Bogotá Savannah and the operational objective of developing a transparent territorial risk assessment model. Nevertheless, alternative weighting strategies (e.g., expert-based, entropy-based, or sensitivity-driven methods) may influence the relative contribution of socioeconomic dimensions. Future research should incorporate formal sensitivity and robustness analyses to evaluate IVSE stability under alternative weighting configurations.
2.3.6. Risk Quantification and Spatial Mapping
Spatial quantification of risk was performed through raster-based integration of physical, biotic, and socioeconomic variables, ensuring prior spatial homogeneity and analytical resolution. All geographic layers were reprocessed and resampled to a common resolution of 12.5 × 12.5 m, using bilinear interpolation for continuous variables [58] and nearest-neighbor interpolation [59] for categorical variables in ArcGIS ArcMap V.10.8.2 (Redlands, CA, USA). This ensured consistency with the resolution of the ALOS PALSAR DEM and avoided distortions in probability calculations. This procedure was consistent with spatial analysis standards for raster-based susceptibility modeling [60]. The variables included comprised 12 environmental factors, 3 socioeconomic indicators (IVE, IVS, and MPI), and the spatial distribution of the population (DANE projection 2024). These were integrated into a coherent cartographic database at a scale of 1:25,000 (Figure S1). Pixel alignment (co-registration) was verified to prevent overlay errors in raster operations, a critical condition in multivariable spatial risk models [61]. Risk estimation was performed using Equation (8):
where R corresponded to landslide risk, A to the probability of occurrence (probabilistic hazard model), and V to the socioeconomic vulnerability index (IVSE). Both variables were normalized within a range between 0 and 1, allowing direct combination through map algebra in a GIS environment [38]. The resulting risk classification was conducted using a five-category matrix scheme (low, low–medium, medium, medium–high, and high), derived from the cross-combination of hazard and vulnerability intervals (Figure S2). Additionally, population exposure was incorporated through the overlay of demographic projections from DANE (2018–2024), enabling identification of critical zones where high landslide probability, high vulnerability, and high population density coexisted. The complete methodological workflow for this phase was synthesized in an operational model framework (Figure 2), integrating the probabilistic hazard model, the vulnerability model, and spatial risk assessment within a GIS environment. This approach is consistent with standard practices in territorial risk analysis in mountainous regions [62,63].
Figure 2.
Methodological flow diagram for the development of the socioeconomic landslide risk model.
2.4. Risk Simulation Under Climate Change Scenarios
Prospective risk simulation was based on the modification of the climatic variable maximum precipitation in 24 h (Pmax24h). Climate change projections for the period 2021–2040 derived from the Fourth National Communication of Colombia were incorporated [36]. These projections, based on an ensemble of 25 global climate models (GCMs) from CMIP6, were previously adjusted using statistical downscaling techniques (Bias Correction–Quantile Mapping, Delta Q–Q, and KNN) [64]. This ensured statistical consistency and spatial coherence at resolutions of 10 × 10 km. In accordance with international methodological frameworks [65], four representative SSP trajectories were selected: SSP1-2.6, SSP2-4.5, SSP3-7.0, and SSP5-8.5. These scenarios showed spatial precipitation increases between 0 and 30%. At the territorial scale, the SSP1-2.6 scenario presented increases of 10–20% in 53% of the area, while SSP2-4.5 concentrated increases of 10–20% in 71% and up to 30% in 4% of the territory. The SSP3-7.0 and SSP5-8.5 scenarios exhibited more heterogeneous distributions, with predominance of increases between 0 and 20% across more than 90% of the territory (Figure S3). These variations were integrated as direct perturbation factors applied to the variable Pmax24h, given its high statistical significance in hazard modeling. To ensure compatibility between the 10 × 10 km SSP climatic projections and the 12.5 m analytical grid, a constant-value spatial assignment procedure was implemented. Each 10 km climate grid cell was treated as a homogeneous precipitation perturbation unit, and its associated SSP percentage change was uniformly assigned to all nested 12.5 m cells contained within its spatial extent. Grid boundaries were handled through direct cell intersection without interpolative smoothing or nearest-neighbour resampling. This approach preserved the original spatial structure of the observed maximum 24 h precipitation (Pmax24h) raster while consistently incorporating SSP-driven precipitation perturbations into the landslide hazard model. Adjusted precipitation was estimated using Equation (9):
where represented projected precipitation, observed precipitation, and the relative increase associated with each scenario. Subsequently, these surfaces were incorporated into the previously calibrated logistic model to generate new probabilities of occurrence , while keeping non-climatic variables constant. Future risk was estimated as , allowing the construction of risk maps comparable across scenarios. This controlled univariate perturbation approach has been widely applied in susceptibility studies to isolate the contribution of climatic forcing on landslide dynamics [66,67]. This framework enabled evaluation of spatial changes in risk intensity under contrasting climate trajectories.
In the present framework, climate change influenced socioeconomic landslide risk indirectly through modifications in landslide hazard rather than through direct changes in socioeconomic conditions. SSP-based increases in maximum 24 h precipitation altered the probability of landslide occurrence, while socioeconomic vulnerability remained constant during the 2021–2040 horizon. Therefore, projected socioeconomic risk patterns reflected the interaction between climate-driven hazard intensification and pre-existing territorial vulnerability, whereby highly vulnerable populations experienced greater increases in risk under equivalent hydroclimatic forcing. Although this controlled modeling framework enables isolation of the hydroclimatic signal associated with SSP-driven precipitation changes, it may underestimate or overestimate future landslide risk in rapidly urbanizing sectors of the Bogotá Savannah, where land-use transitions, demographic redistribution, and expanding hillside occupation may alter exposure and territorial vulnerability by 2040. Thus, prospective simulations should be interpreted as precipitation-driven scenarios rather than fully dynamic territorial forecasts. Future research should incorporate harmonized urban growth and demographic projection datasets to evaluate the sensitivity of risk estimates to territorial change.
3. Results and Discussion
3.1. Preliminary Scope Review and Selection of Conditioning Variables
The query “Landslides AND Susceptibility” identified 26,519 documents, with 15.5% indexed in ScienceDirect, 13.8% in Scopus, and 4.8% in Taylor & Francis (Table 1). Scientific output increased substantially between 2020 and 2024, rising from 463 to 1223 publications in ScienceDirect (+164%) and from 466 to 1000 in Scopus (+114%). Research was concentrated in China (24.8%), India (6.61%), and Italy (3.97%), whereas Colombia represented only 0.43%. These trends were consistent with previous reports [68,69], which documented exponential growth in the application of spatial modeling and machine learning approaches for landslide susceptibility assessment.
Table 1.
Modeling approaches and variables in landslide susceptibility studies: Preliminary scope review (2020–2024).
Scopus-based filtering identified 13 landslide susceptibility models, dominated by artificial intelligence approaches (71.6%), followed by statistical–probabilistic (23.9%) and numerical models (4.5%). Logistic regression showed the highest application frequency (9.09%), followed by regression analysis (7.90%) and probability-based models (6.90%). The principal variables identified in the models were as follows: elevation, land use, slope, precipitation, slope aspect, distance to roads, distance to rivers, distance to faults, lithology, Topographic Wetness Index (TWI), plan curvature, and Normalized Difference Vegetation Index (NDVI). Additionally, Fisher’s exact test revealed statistically significant associations between the models and the identified variables (p-value: 3.5 × 10⁻⁶–0.00142), confirming functional dependence between territorial factors and the selection of modeling approaches (Table S4). These findings were consistent with studies demonstrating that artificial intelligence models and logistic regression achieved predictive accuracy levels exceeding 80%, particularly when geomorphological and climatic variables were integrated in mountainous environments [70,71].
Regarding the identified variables, the following were highlighted as those with the highest recurrence in the models: elevation (Q-index = 0.72), land use (0.69), slope (0.64), and precipitation (0.64). These variables were likely the predictors with the greatest statistical relevance, all classified within the Q2 quartile, indicating a high level of methodological consistency in the scientific literature. Correlation analysis revealed 33 significant relationships and six negative correlations, with the association between distance to rivers and distance to roads (ρ = 0.49) being the strongest (Figure 3). The results suggested spatial convergence between road infrastructure and hydrographic networks in landslide-prone areas. Additionally, PCA showed that the first two dimensions explained 41.5% of the total variance, where the first component (28.1%) was dominated by geomorphological and locational variables (elevation, lithology, and distances to roads, rivers, and faults). The second component (13.4%) reflected the influence of hydrological and morphometric variables (Figure S4). The greatest relative contribution corresponded to distance to rivers and elevation, confirming their structural role in the spatial configuration of landslide risk. These findings were consistent with studies that have consistently identified topography, precipitation, and proximity to drainage networks as the principal determinants of landslide susceptibility in tropical mountainous regions [72,73].
Figure 3.
Correlation between the variables considered by the models for studying landslide susceptibility. Identified in the preliminary scope review. Colors represent quartile-based groupings of the observed values for each variable (Q1–Q4). * = p-value < 0.010, ** p-value < 0.050, and *** p-value < 0.001.
3.2. Development, Calibration, and Validation of the Probabilistic Hazard Model
Exploratory analysis revealed low significant correlation among the numerical covariates, with linear correlation coefficients ranging between 0.00 and 0.20, with the maximum value observed between distance to roads and plan curvature (r = 0.20) (Figure 4). The minimum relationship corresponded to maximum precipitation in 24 h and distance to faults (r ≈ 0.00). The results suggested the absence of significant multicollinearity and supported the simultaneous inclusion of variables in the preliminary logistic model. From a methodological viewpoint, correlations <0.30 were reported as acceptable in spatial susceptibility models, as they reduce coefficient instability and improve model interpretability [15,18,68]. Thus, the observed dependency structure suggested that the selected variables provided complementary information on geomorphological and climatic processes associated with landslide occurrence in the study area.
Figure 4.
Linear correlation coefficients among the numerical covariates considered for the development of the preliminary logistic model. The red line represents the linear trend of the data under consideration. * = p-value < 0.010.
The preliminary model, estimated with 12 predictor variables and 1715 training observations, showed that 10 of the 12 evaluated variables exhibited statistical significance (p-value < 0.050). Elevation (z = −10.97, p-value < 0.001) and NDVI (z = −24.38, p-value < 0.001) were identified as the most influential predictors. Likewise, the geological categories of the Paleogene (z = 8.81) and Cretaceous (z = 8.13) presented significant positive effects on the probability of landslide occurrence. These findings suggested the importance of lithological control in slope instability dynamics. In contrast, the slope aspect variable and the Neogene geological category did not show statistical significance (p-value > 0.050) (Table S5), suggesting redundancy or low explanatory capacity in the regional study context. From a statistical perspective, the presence of elevated standard errors (3.18 × 10²) in the slope aspect variable suggested potential quasi-complete separation problems, a phenomenon frequently reported in logistic models applied to landslide inventories [18,19]. The removal of these variables allowed optimization of model parsimony without compromising predictive capacity. This approach was consistent with variable selection criteria commonly applied in landslide susceptibility studies in tropical mountainous regions [48,74].
Model refinement led to a reduction in residual deviance from 2536 to 2329, equivalent to an approximate 8.20% relative improvement in model fit. This indicated greater agreement between predicted probabilities and observed events (Figure 5). This result was corroborated using the Akaike Information Criterion (AIC), which decreased from 2574 to 2367, reflecting a substantial improvement in the statistical efficiency of the selected model. Moreover, goodness-of-fit tests confirmed model robustness. The Hosmer–Lemeshow test yielded a value of χ2 = 14.38 (p-value = 0.072), while Spiegelhalter’s Z-statistic showed a value of −0.64 (p-value = 0.523), indicating the absence of systematic bias in risk estimation. The Brier Score (0.084) and the Nagelkerke Pseudo-R2 (0.675) demonstrated high predictive power and adequate probabilistic calibration of the model. These values were comparable to those reported in logistic models applied to landslide susceptibility in mountainous regions [15,19].
Figure 5.
Deviance residuals versus predicted probabilities of the preliminary logistic regression model.
The final model enabled estimation of the spatial distribution of landslide hazard in the study area, classifying occurrence probabilities into five categories ranging between 0 and 1 (Tables S6 and S7). In this study, values greater than 0.81 corresponded to high-hazard zones. Cartographic analysis revealed that areas with the highest occurrence probability were concentrated in the northern, southern, and eastern sectors of the territory (Figure 6). In contrast, the central region of the study area exhibited predominantly low probabilities (<0.40). This spatial pattern was consistent with the geomorphological and lithological distribution of the region, characterized by steep slopes and sedimentary formations susceptible to mass movement processes. Moreover, the incorporation of 95% confidence intervals allowed identification of uncertainty scenarios associated with model predictions. An increase in areas classified as high hazards was observed at the upper bound of the confidence interval. These results were consistent with studies highlighting the importance of integrating statistical uncertainty into landslide susceptibility mapping to improve decision-making in risk management [21,24,52].
Figure 6.
Spatial simulation of landslide hazard in the study area. Predicted values: (a) mean, (b) lower limit of the confidence interval (CI = 95%), and (c) upper limit of the confidence interval (CI = 95%).
3.3. Spatial Assessment of Socioeconomic Vulnerability
Estimation of the Socioeconomic Vulnerability Index (SVI) revealed a predominance of the medium vulnerability category, with values ranging between 0.41 and 0.60, followed by the low–medium category (0.21–0.40) across most of the territory (Figure 7 and Table S6). The results suggested an intermediate level of social resilience to mass movement events. Areas with medium–high vulnerability were primarily concentrated in the southern portion of the study region (cities of Soacha and Bogotá), where higher values of sub-indices associated with income and housing conditions were observed. These findings suggested that vulnerability in the study area was primarily determined by indirect socioeconomic factors (socioeconomic stratum, poverty indicator—SISBEN IV; Table S7). Moreover, the Multidimensional Poverty Index (MPI) exhibited relatively low values (0.08–0.48) in the study region, suggesting better access to basic services compared with other regions of the country. This pattern was similar to that reported in urbanized regions of Latin America, where social vulnerability has typically been driven by socio-spatial inequalities rather than absolute structural deprivation.
Figure 7.
Spatial simulation of the socioeconomic vulnerability index in the study region.
3.4. Spatial Quantification of Socioeconomic Landslide Risk
Integration of the probabilistic hazard model with the vulnerability index enabled estimation of socioeconomic landslide risk in the study region. The predominant category corresponded to medium risk, followed by low–medium risk (Figure 8 and Table S8). The maximum simulated risk values were approximately 0.60 (scale from 0.0 to 1.0), while mean values were around 0.20. These results revealed a spatial distribution of risk concentrated primarily in the northern and southwestern sectors of the territory, where unfavorable geomorphological conditions converged with moderate levels of socioeconomic vulnerability. The observed spatial risk patterns may also be influenced by future land-use transitions, urban expansion, and vegetation-cover changes. In the Bogotá Savannah, urban growth on geomorphologically unstable slopes and reductions in vegetation cover may increase territorial exposure and susceptibility, particularly in peri-urban sectors. Although these dynamics were not explicitly projected in the SSP simulations, their interaction with precipitation-driven hazard may amplify future landslide risk.
Figure 8.
Spatial simulation of socioeconomic landslide risk in the study region. Predicted values: (a) mean, (b) lower limit of the confidence interval (CI = 95%), and (c) upper limit of the confidence interval (CI = 95%).
The results showed that while steep slopes were associated with a higher physical risk, areas with moderate or gentler slopes could also pose a high socioeconomic risk when combined with high territorial vulnerability and high population exposure. In these areas, poor housing quality, poverty, and limited adaptive capacity could exacerbate human and material losses despite lower geomorphological susceptibility, reinforcing the multiplicative interaction between risk and vulnerability in shaping landslide risk. This pattern likely confirmed the multiplicative nature of risk, in which areas with moderate hazard may present elevated risk levels when coinciding with vulnerable populations. Similar findings have been reported in tropical mountainous regions, where the interaction between territorial exposure and socioeconomic conditions explained more than 60% of the variability in landslide risk [25,34].
Analysis of 95% confidence intervals enabled evaluation of uncertainty associated with model predictions, revealing a systematic increase in risk classes under the upper-limit scenario (Figure 8c). In particular, the number of sections classified as medium–high risk increased from 100 to 195, representing an approximate spatial increase of 2.5%. The medium and low–medium risk categories increased by 7% and 3.6%, respectively, while the low-risk category decreased by 13.1%. These results suggested that model uncertainty was primarily manifested in transitions between intermediate risk levels rather than at the extremes of the distribution. Moreover, from a risk management perspective, these findings indicated that territorial planning should consider probabilistic rather than deterministic scenarios, particularly in regions characterized by high geomorphological variability. This approach is consistent with reports emphasizing the importance of incorporating uncertainty analysis into landslide risk mapping to improve decision-making under climate change conditions [13,18].
Joint analysis of hazard and vulnerability models enabled identification of territorial conditions associated with the highest landslide risk levels in the study region. In this study, priority areas for risk management were characterized by elevations between 2676 and 2850 m above sea level, slopes < 12°, NDVI values between 0.17 and 0.32, and proximity to geological faults and water bodies. These conditions increased the probability of terrain instability. Moreover, these areas coincided primarily with Cretaceous and Paleogene geological units and with municipalities exhibiting medium or medium–high socioeconomic vulnerability levels. Although landslides are frequently associated with steeper terrain in purely geomorphological analyses, the identified pattern in this study reflected the combined interaction of multiple conditioning factors incorporated into the logistic regression model. Therefore, areas with slopes <12° may still exhibit elevated landslide risk when occurring jointly with susceptible lithological units, proximity to geological faults and water bodies, vegetation conditions, and medium to medium–high socioeconomic vulnerability. From a territorial planning perspective, this pattern suggested that risk in the study region was determined by the interaction between physical and social factors rather than by the individual intensity of each component or variable considered in the developed risk model. This result was consistent with the conceptual risk framework proposed by UNDRR, which defines risk as a function of hazard, exposure, and vulnerability. Studies conducted in Andean regions have demonstrated that identification of these factor combinations can reduce economic losses associated with landslides by up to 30% through preventive land-use planning strategies [19,27,28]. Consequently, the proposed risk model may constitute a useful technical tool for prospective risk planning in urban and peri-urban regions of the tropical Andes.
Validation results demonstrated high predictive performance of the landslide hazard model, reflected in an Area Under the ROC Curve (AUC) value of 0.935 (Figure 9). This indicated excellent discrimination capacity between landslide and non-landslide events. The optimal classification threshold was established at 0.590, enabling correct identification of 84.7% of landslide events (sensitivity) and 90.0% of non-landslide cases (specificity). The false positive rate was 10%, and the false negative rate was 15.3%. This behavior confirmed that the model maintained an appropriate balance between omissions and false alarms, a condition essential for territorial risk management applications. From a comparative perspective, the obtained AUC values exceeded the performance threshold commonly considered acceptable in regional landslide susceptibility studies, generally established between 0.80 and 0.90. Research conducted in tropical mountainous regions has reported AUC values between 0.82 and 0.92 for models based on logistic regression and machine learning approaches [15,35,48]. This positioned the performance of the developed model within the upper range of predictive accuracy reported in the literature.
Figure 9.
ROC/AUC for the proposed socioeconomic landslide risk model.
Analysis of the confusion matrix and complementary metrics confirmed the statistical robustness of the model, evidenced by an overall accuracy of 0.875, a precision of 0.894, a negative predictive value of 0.855, and an F1-score of 0.87 (Table 2). These indicators reflected an adequate balance between sensitivity and specificity. The Kappa coefficient of 0.747 indicated a substantial level of agreement between predictions and observed outcomes. The McNemar test value (p-value = 0.0247) indicated a slight asymmetry in the distribution of errors, characterized by a higher proportion of false negatives relative to false positives. In operational terms, the model correctly identified 42.4% of observations as landslides, compared with a true prevalence of 50%, suggesting consistent performance, albeit with a slight underestimation of events. From a practical risk management perspective, this asymmetry suggests a slight tendency of the model to underestimate landslide occurrence in localized sectors, implying that some areas with actual instability potential may be classified under lower risk levels. Thus, risk maps should be interpreted with particular caution in transitional or geomorphologically heterogeneous zones, where complementary local-scale assessments may be necessary to support territorial planning and prospective risk management decisions. This behavior was consistent with studies indicating that logistic regression models applied at regional scales tend to exhibit omission rates slightly higher than commission rates, particularly in scenarios characterized by high geomorphological heterogeneity [15,37,48].
Table 2.
Performance Indicators of the Confusion Matrix for the Proposed Socioeconomic Landslide Risk Model.
The principal limitations of the model were associated with the temporal availability and spatial resolution of input data, factors that introduced structural uncertainty into risk estimates. In particular, geomorphological data derived from the ALOS PALSAR sensor (2011) and socioeconomic data corresponding to 2018 represented temporal lags of approximately 7 to 13 years relative to the analysis period. This may have affected the representativeness of current territorial conditions. Likewise, the spatial resolution used (12.5 × 12.5 m) constrained the model’s capacity to identify instability processes at the local scale, particularly in urban environments where topographic and anthropogenic variability is high. Studies have demonstrated that spatial resolution in susceptibility models may explain up to 20–30% of variability in predictive accuracy, particularly in regions characterized by highly fragmented land use [58,59,61]. In this context, the incorporation of higher-resolution and temporally updated datasets constitutes a priority for improving the accuracy of future estimates.
From a methodological viewpoint, another limitation was related to the statistical assumptions inherent to logistic regression, particularly the functional relationship between predictor variables and event occurrence probability. In the developed model, variables such as NDVI, elevation, and slope exhibited nonlinear behavior, requiring the application of cubic spline adjustment functions to improve statistical representation of their effects. Although this procedure reduced model fitting error, evidence indicates that machine learning algorithms, such as Random Forest or artificial neural networks, may capture complex nonlinear relationships with greater accuracy in geospatial contexts. Research has reported performance increases between 3 and 8% in AUC when machine learning models are used compared with traditional logistic models in landslide susceptibility studies [35,37]. Furthermore, estimation of the potentially affected population was based on demographic projections from DANE for the years 2024 and 2040, introducing uncertainty associated with unforeseen demographic changes. These limitations do not invalidate the robustness of the model but rather delimit its spatial and temporal applicability and should be considered in prospective landslide risk planning processes.
3.5. Prospective Landslide Risk Under SSP Climate Change Scenarios
Prospective simulations should be interpreted as precipitation-driven modifications in landslide susceptibility and socioeconomic risk rather than as a comprehensive representation of climate change impacts. In the present study, SSP scenarios were operationalized exclusively through projected changes in maximum 24 h precipitation derived from regional IDEAM climate projections (2021–2040). Therefore, simulated variations in risk reflect the potential influence of hydroclimatic variability on slope instability while keeping other territorial conditions constant.
Simulation results indicated that the SSP1-2.6 scenario, characterized by maximum precipitation increases close to 20%, exhibited the most stable risk levels compared with the other evaluated scenarios. The spatial distribution of risk maintained a predominance of medium and low–medium risk categories, with localized clusters of medium–high risk (up to 0.635) in the northeastern and southwestern sectors of the study region (Figure 10a). These results suggested that, under conditions of climate mitigation and institutional strengthening, the territorial system exhibited relative risk stability, although critical hotspots associated with unfavorable geomorphological and socioeconomic conditions persisted. This behavior was consistent with studies conducted in tropical mountainous regions reporting marginal reductions in risk under low-emission trajectories, without complete elimination of territorial exposure [8,9].
Figure 10.
Spatial simulation of socioeconomic landslide risk under climate change scenarios: (a) SSP1-2.6, (b) SSP2-4.5, (c) SSP3-7.0, and (d) SSP5-8.5.
The SSP2-4.5 scenario exhibited the greatest generalized increase in precipitation, with maximum values close to 30% and a predominance of 20% increases. This translated into a significant expansion of areas classified as medium and medium–high risk (up to 0.648, Figure 10b). This increase in both the magnitude and spatial extent of risk suggested that the continuation of current urban development trends and anthropogenic pressure could amplify territorial vulnerability to landslide events. These results were consistent with studies demonstrating that intermediate emission scenarios generate moderate but persistent increases in landslide susceptibility due to intensified extreme precipitation events [3,8,13].
The SSP3-7.0 scenario showed a predominant 10% increase in precipitation, accompanied by a significant expansion of areas classified as medium risk, maintaining a spatial structure similar to that observed under the SSP2-4.5 scenario (Figure 10c). Maximum risk values reached a magnitude of 0.635. Analysis of the upper confidence interval revealed additional increases in occurrence probability, reaching values of up to 0.673. This confirmed the persistence of critical zones under conditions of institutional fragmentation and territorial inequality. This behavior was consistent with studies indicating that scenarios characterized by high social vulnerability increase exposure to landslide risk, even when climatic changes are moderate [22,24].
The SSP5-8.5 scenario exhibited one of the highest levels of intensification in socioeconomic landslide risk, associated with precipitation increases of up to 30% and expansion of areas classified as medium–high risk (up to 0.635; Figure 10d), particularly in the southwestern and northeastern sectors of the study region. Analysis of the upper confidence interval revealed additional increases in risk probability, reaching maximum values of up to 0.673. This confirmed a systematic trend toward increasing risk under conditions of high emissions and carbon-intensive economic growth. These results were consistent with global assessments demonstrating that high-emission scenarios increase the frequency and intensity of extreme events, thereby amplifying landslide risk in tropical mountainous regions [8,11].
The observed increase in projected socioeconomic landslide risk toward 2040 should be interpreted cautiously. Within the methodological framework of this study, changes in risk were associated exclusively with projected increases in maximum 24 h precipitation under SSP scenarios, identified as the principal hydroclimatic trigger of slope instability. Consequently, the results do not represent the full spectrum of climate change impacts but rather the sensitivity of landslide occurrence to precipitation-driven hydroclimatic variability in the Bogotá Savannah.
In simulations conducted under climate change scenarios, the developed model integrated 12 physical, biotic, and socioeconomic variables and was constructed from a dataset of 4900 records, including 2450 landslide events and 2450 non-events. This structure enabled robust estimation of landslide occurrence probabilities. The division of data into training (70%), calibration (10%), and validation (20%) subsets ensured statistical stability and reproducibility of model results. Model performance was high, with sensitivity of 84.7%, specificity of 90%, and discriminatory power of 93.5% (AUC ≈ 0.935). These values exceeded performance thresholds commonly considered adequate in landslide susceptibility and risk studies [15,48]. Moreover, the methodological framework based on integration of a hazard submodel and a vulnerability submodel enabled explicit representation of the interaction between physical processes and socioeconomic conditions. This constituted a relevant advancement compared with traditional approaches focused solely on geomorphological susceptibility. Studies have reported that integrated hazard–vulnerability models exhibit greater predictive capacity and practical utility in territorial planning processes, particularly in rapidly expanding urban regions [23,34].
The principal limitations of the simulation were associated with the spatial and temporal resolution of climatic data used in the SSP scenarios, which were generated at an approximate resolution of 10 km × 10 km. This required rescaling procedures to integrate them with local hydrometeorological information at a resolution of 12.5 m × 12.5 m. This process may have introduced uncertainty in the spatial representation of extreme precipitation, particularly in areas characterized by high topographic heterogeneity. Likewise, estimation of the potentially exposed population was based on demographic projections derived from 2018, which may underestimate recent demographic changes in rapidly expanding urban areas. A methodological limitation of this study is that prospective simulations kept land use, socioeconomic vulnerability, population distribution, and geomorphological variables constant throughout the 2021–2040 horizon. This assumption was adopted to isolate the specific contribution of projected precipitation variability to landslide risk. Future studies should incorporate dynamic territorial scenarios, including urban expansion, demographic redistribution, and land-use transitions, to provide a more comprehensive assessment of long-term socioeconomic landslide risk. Despite these limitations, the simulated climate scenarios enabled identification of medium-term trends in the evolution of socioeconomic risk. These trends were consistent with methodological recommendations from the IPCC, which recognizes the use of SSP scenarios as valid tools for prospective risk assessment under conditions of climatic uncertainty [10,12].
4. Conclusions
The developed logistic regression model demonstrates statistical robustness and predictive capability for estimating socioeconomic landslide risk in the study region. The absence of significant multicollinearity (r ≤ 0.20) and the statistical significance of 10 of the 12 variables considered support the strength of the model’s explanatory structure. The reduction in residual deviance from 2536 to 2329 and in the Akaike Information Criterion from 2574 to 2367 suggests an 8.2% improvement in model fit. The Pseudo-R2 value of 0.675 and the Brier Score of 0.084 indicate adequate probabilistic calibration of the model. Validation results show high performance (AUC = 0.935, sensitivity = 84.7%, specificity = 90.0%, accuracy = 0.874, and Kappa = 0.747), positioning the model within the upper performance range reported in the literature. The resulting cartography identifies maximum risk probabilities close to 0.600 (scale between 0 and 1) and confirms spatial concentration of risk in geomorphologically critical sectors. These findings suggest the operational utility of the model as a technical tool to prioritize spatial planning interventions and prospective risk management in urbanized Andean regions.
Simulation under climate change scenarios indicates a consistent trend of increasing risk toward the year 2040, particularly under intermediate and high emission trajectories. The SSP1-2.6 scenario maintains the most stable risk levels, with maximum risk values close to 0.635, whereas the SSP2-4.5, SSP3-7.0, and SSP5-8.5 scenarios show progressive expansion of areas classified as medium and medium–high risk, reaching magnitudes of up to 0.648 and probabilities exceeding 0.673 within 95% confidence intervals. This behavior suggests that precipitation increases between 10 and 30% generate systematic increases in territorial risk, particularly in areas characterized by intermediate socioeconomic vulnerability. In this study, the effects of climate change are quantified through changes in 24-h maximum precipitation (Pmax24h) based on social and economic development scenarios (SSPs). This suggests that the projected increases in the socioeconomic risk of landslides primarily reflect an intensification of landslide hazard driven by precipitation by around 2040. The results indicate that prospective modeling based on SSP scenarios constitutes a useful tool for anticipating the spatial evolution of risk. Moreover, it can support decision-making in urban planning, climate adaptation, and disaster risk reduction in tropical Andean regions.
The study presents two principal limitations. First, the spatial resolution and temporal updating of input data introduce uncertainty in the representation of local instability processes. Second, the functional structure of the logistic model limits the ability to capture complex nonlinear relationships among geomorphological and climatic variables. Consequently, future research should prioritize the integration of high-resolution geospatial datasets and updated temporal series. Furthermore, machine learning and hybrid algorithms should be comparatively implemented to improve representation of nonlinear dynamics and reduce predictive uncertainty under climate change scenarios.
Supplementary Materials
The following supporting information can be downloaded at: https://www.mdpi.com/article/10.3390/hydrology13060161/s1, Figure S1: Landslide parameters that were taken into account in the development of the risk management model; Figure S2: Conceptual arrangement of risk classification; Figure S3: Scenarios of climate variability according to the IDEAM period (2040); Figure S4: Analysis of principal components of the selected factors; Table S1: SIMMA Inventory Point Attributes (Example of a sample of the data used); Table S2: Detailed layout of conditioning parameters used in the integrated socioeconomic landslide risk model; Table S3: MPI classification; Table S4: Fisher Test Models and Variables; Table S5: Metrics of the Complete Model of Mass Movements for the Bogotá Savannah; Table S6: SVI classification for the Bogotá savannah; Table S7: Socioeconomic Vulnerability Index by Municipality of Bogotá savannah; Table S8: Classification of the socioeconomic risk due to landslides for the Bogotá savannah.
Author Contributions
Conceptualization, D.C.O.-H.; Data curation, D.C.O.-H., C.A.Z.-M. and A.B.P.; Formal analysis, D.C.O.-H., C.A.Z.-M. and A.B.P.; Funding acquisition, C.A.Z.-M. and A.B.P.; Investigation, D.C.O.-H. and C.A.Z.-M.; Methodology, D.C.O.-H. and C.A.Z.-M.; Project administration, C.A.Z.-M.; Resources, C.A.Z.-M. and A.B.P.; Software, D.C.O.-H. and C.A.Z.-M.; Supervision, C.A.Z.-M.; Validation, D.C.O.-H. and C.A.Z.-M.; Visualization, C.A.Z.-M. and A.B.P.; Writing—original draft, D.C.O.-H. and C.A.Z.-M.; Writing—review and editing, C.A.Z.-M. and A.B.P. All authors have read and agreed to the published version of the manuscript.
Funding
This research received no external funding.
Data Availability Statement
The original contributions presented in this study are included in the article. Further inquiries can be directed to the corresponding author.
Acknowledgments
The authors would like to thank the Environmental Engineering Research Group (GIIAUD) and the Sustainable Development Research Group (INDESOS) at the Universidad Distrital Francisco José de Caldas (Colombia).
Conflicts of Interest
The authors declare no conflicts of interest.
References
- Fidan, S.; Tanyaş, H.; Akbaş, A.; Lombardo, L.; Petley, D.N.; Görüm, T. Understanding Fatal Landslides at Global Scales: A Summary of Topographic, Climatic, and Anthropogenic Perspectives. Nat. Hazards 2024, 120, 6437–6455. [Google Scholar] [CrossRef] [Scilit]
- Gómez, D.; García, E.F.; Aristizábal, E. Spatial and Temporal Landslide Distributions Using Global and Open Landslide Databases. Nat. Hazards 2023, 117, 25–55. [Google Scholar] [CrossRef] [Scilit]
- Gariano, S.L.; Guzzetti, F. Landslides in a Changing Climate. Earth-Sci. Rev. 2016, 162, 227–252. [Google Scholar] [CrossRef] [Scilit]
- Giraldo, E.V.A.; Aristizábal, E.G.; Sánchez, R.M.; Cardona, F.G.; Martínez, J.C.G. Rainfall-Intensity Effect on Landslide Hazard Assessment Due to Climate Change in North-Western Colombian Andes. Rev. Fac. Ing. Univ. Antioq. 2022, 103, 51–66. [Google Scholar] [CrossRef] [Scilit]
- Pacheco Quevedo, R.; Velastegui-Montoya, A.; Montalván-Burbano, N.; Morante-Carballo, F.; Korup, O.; Daleles Rennó, C. Land Use and Land Cover as a Conditioning Factor in Landslide Susceptibility: A Literature Review. Landslides 2023, 20, 967–982. [Google Scholar] [CrossRef] [Scilit]
- Puente-Sotomayor, F.; Egas, A.; Teller, J. Land Policies for Landslide Risk Reduction in Andean Cities. Habitat Int. 2021, 107, 102298. [Google Scholar] [CrossRef] [Scilit]
- Nieto, S.; Aristizábal, E.; Ozturk, U. Coupled Evolution of a City and Landslides. Environ. Res. Lett. 2025, 20, 054001. [Google Scholar] [CrossRef] [Scilit]
- Wang, X.; Wang, Y.; Lin, Q.; Yang, X. Assessing Global Landslide Casualty Risk Under Moderate Climate Change Based on Multiple GCM Projections. Int. J. Disaster Risk Sci. 2023, 14, 751–767. [Google Scholar] [CrossRef] [Scilit]
- Yin, H.; Zhang, J.; Mondal, S.K.; Wang, B.; Zhou, L.; Wang, L.; Lin, Q. Projected Rainfall Triggered Landslide Susceptibility Changes in the Hengduan Mountain Region, Southwest China under 1.5–4.0 °C Warming Scenarios Based on CMIP6 Models. Atmosphere 2023, 14, 214. [Google Scholar] [CrossRef] [Scilit]
- Almazroui, M.; Ashfaq, M.; Islam, M.N.; Rashid, I.U.; Kamil, S.; Abid, M.A.; O’Brien, E.; Ismail, M.; Reboita, M.S.; Sörensson, A.A.; et al. Assessment of CMIP6 Performance and Projected Temperature and Precipitation Changes Over South America. Earth Syst. Environ. 2021, 5, 155–183. [Google Scholar] [CrossRef] [Scilit]
- Huang, Y.; Xue, M.; Hu, X.-M.; Martin, E.; Novoa, H.M.; McPherson, R.A.; Liu, C.; Chen, M.; Hong, Y.; Perez, A.; et al. Increasing Frequency and Precipitation Intensity of Convective Storms in the Peruvian Central Andes: Projections from Convection-Permitting Regional Climate Simulations. Q. J. R. Meteorol. Soc. 2024, 150, 4371–4390. [Google Scholar] [CrossRef] [Scilit]
- Thomas, J.; Rohith, A.N.; Sebastian, D.E.; Nizar, S.; Jainet, P.J.; Vema, V.K.; Sudheer, K.P. Climate Warming Modifies Hydrological Responses in the Southern Western Ghats and the Western Coastal Plains (India): Insights from CMIP6-VIC Simulations. J. Environ. Manag. 2025, 381, 125252. [Google Scholar] [CrossRef] [Scilit] [PubMed]
- Zong, H.; Dai, Q.; Zhu, J. Ensemble Predictions of Rainfall-Induced Landslide Risk under Climate Change in China Integrating Antecedent Soil-Wetness Factors. Atmosphere 2024, 15, 1013. [Google Scholar] [CrossRef] [Scilit]
- Lin, Q.; Steger, S.; Pittore, M.; Zhang, Y.; Zhang, J.; Zhou, L.; Wang, L.; Wang, Y.; Jiang, T. Contrasting Population Projections to Induce Divergent Estimates of Landslides Exposure Under Climate Change. Earths Future 2023, 11, e2023EF003741. [Google Scholar] [CrossRef] [Scilit]
- Ikram, N.; Basharat, M.; Ali, A.; Usmani, N.A.; Gardezi, S.A.H.; Hussain, M.L.; Riaz, M.T. Comparison of Landslide Susceptibility Models and Their Robustness Analysis: A Case Study from the NW Himalayas, Pakistan. Geocarto Int. 2022, 37, 9204–9241. [Google Scholar] [CrossRef] [Scilit]
- Chen, W.; Pourghasemi, H.R.; Zhao, Z. A GIS-Based Comparative Study of Dempster-Shafer, Logistic Regression and Artificial Neural Network Models for Landslide Susceptibility Mapping. Geocarto Int. 2017, 32, 367–385. [Google Scholar] [CrossRef] [Scilit]
- Kalantar, B.; Pradhan, B.; Naghibi, S.A.; Motevalli, A.; Mansor, S. Assessment of the Effects of Training Data Selection on the Landslide Susceptibility Mapping: A Comparison between Support Vector Machine (SVM), Logistic Regression (LR) and Artificial Neural Networks (ANN). Geomat. Nat. Hazards Risk 2018, 9, 49–69. [Google Scholar] [CrossRef] [Scilit]
- Wang, H.; Xu, J.; Tan, S.; Zhou, J. Landslide Susceptibility Evaluation Based on a Coupled Informative–Logistic Regression Model—Shuangbai County as an Example. Sustainability 2023, 15, 12449. [Google Scholar] [CrossRef] [Scilit]
- Puente-Sotomayor, F.; Mustafa, A.; Teller, J. Landslide Susceptibility Mapping of Urban Areas: Logistic Regression and Sensitivity Analysis Applied to Quito, Ecuador. Geoenviron. Disasters 2021, 8, 19. [Google Scholar] [CrossRef] [Scilit]
- Kumar, A.; Kanga, S.; Choudhury, U.; Singh, S.K.; Rana, R.S.; Meraj, G.; Kumar, P. Landslide Susceptibility Mapping Using Statistical Information Value Model: A Case Study of Part of Chamoli District, Uttarakhand India. Risk Anal. 2025, 45, 4726–4742. [Google Scholar] [CrossRef] [Scilit] [PubMed]
- Alcántara-Ayala, I.; Sassa, K. Landslide Risk Management: From Hazard to Disaster Risk Reduction. Landslides 2023, 20, 2031–2037. [Google Scholar] [CrossRef] [Scilit]
- Pollock, W.; Wartman, J. Human Vulnerability to Landslides. GeoHealth 2020, 4, e2020GH000287. [Google Scholar] [CrossRef] [Scilit] [PubMed]
- Acosta-Quesada, M.; Quesada-Román, A. Landslide and Flood Risk Assessment in a Rapidly Urbanizing Municipality of Costa Rica. J. South Am. Earth Sci. 2025, 152, 105330. [Google Scholar] [CrossRef] [Scilit]
- Ronco, M.; Tárraga, J.M.; Muñoz, J.; Piles, M.; Marco, E.S.; Wang, Q.; Espinosa, M.T.M.; Ponserre, S.; Camps-Valls, G. Exploring Interactions between Socioeconomic Context and Natural Hazards on Human Population Displacement. Nat. Commun. 2023, 14, 8004. [Google Scholar] [CrossRef] [Scilit] [PubMed]
- Aristizábal, E.; Sánchez, O. Spatial and Temporal Patterns and the Socioeconomic Impacts of Landslides in the Tropical and Mountainous Colombian Andes. Disasters 2020, 44, 596–618. [Google Scholar] [CrossRef] [Scilit] [PubMed]
- Valdés Carrera, A.C.; Mendoza, M.E.; Allende, T.C.; Macías, J.L. A Review of Recent Studies on Landslide Hazard in Latin America. Phys. Geogr. 2023, 44, 243–286. [Google Scholar] [CrossRef] [Scilit]
- Vargas-Cuervo, G.; Hernández-Peña, Y.T.; Zafra-Mejía, C.A. Challenges for Sustainable Urban Planning: A Spatiotemporal Analysis of Complex Landslide Risk in a Latin American Megacity. Sustainability 2024, 16, 3133. [Google Scholar] [CrossRef] [Scilit]
- Marín-Rodríguez, N.J.; Vega, J.; Zanabria, O.B.; González-Ruiz, J.D.; Botero, S. Towards an Understanding of Landslide Risk Assessment and Its Economic Losses: A Scientometric Analysis. Landslides 2024, 21, 1865–1881. [Google Scholar] [CrossRef] [Scilit]
- Alcántara-Ayala, I. Landslides in a Changing World. Landslides 2025, 22, 2851–2865. [Google Scholar] [CrossRef] [Scilit]
- Ospina-Noreña, J.E.; Domínguez-Ramírez, C.A.; Vega-Rodríguez, E.E.; Darghan-Contreras, A.E.; Rodríguez-Molano, L.E. Analysis of the Water Balance under Regional Scenarios of Climate Change for Arid Zones of Colombia. Atmósfera 2017, 30, 63–76. [Google Scholar] [CrossRef] [Scilit]
- Enciso-Díaz, W.C.; Zafra-Mejía, C.A.; Hernández-Peña, Y.T. Global Trends in Air Pollution Modeling over Cities Under the Influence of Climate Variability: A Review. Environments 2025, 12, 177. [Google Scholar] [CrossRef] [Scilit]
- Lee, S.H.; Kim, H.; Kwon, S. Fishing Vessel Risk and Safety Analysis: A Bibliometric Analysis, Clusters Review and Future Research Directions. Appl. Sci. 2024, 14, 10439. [Google Scholar] [CrossRef] [Scilit]
- Melba, T.-M.; Andrea, M.-T.; Erika, B.-J.; Melissa, M.-N.; Maria, M.-R. Statistical Analysis of Risk Factors with Overweight-Diabetes and Gut Microbiota, a Bibliometric Analysis Using Bibliometrix. Acta Sci. Nutr. Health 2023, 8, 2–11. [Google Scholar]
- Ahmad, H.; Alam, M.; Yinghua, Z.; Najeh, T.; Gamil, Y.; Hameed, S. Landslide Risk Assessment Integrating Susceptibility, Hazard, and Vulnerability Analysis in Northern Pakistan. Discov. Appl. Sci. 2024, 6, 7. [Google Scholar] [CrossRef] [Scilit]
- Nhu, V.-H.; Mohammadi, A.; Shahabi, H.; Ahmad, B.B.; Al-Ansari, N.; Shirzadi, A.; Geertsema, M.; Kress, V.R.; Karimzadeh, S.; Valizadeh Kamran, K.; et al. Landslide Detection and Susceptibility Modeling on Cameron Highlands (Malaysia): A Comparison between Random Forest, Logistic Regression and Logistic Model Tree Algorithms. Forests 2020, 11, 830. [Google Scholar] [CrossRef] [Scilit]
- Instituto de Hidrología. Meteorología y Estudios Ambientales ESCENARIOS DE CAMBIO CLIMÁTICO. Available online: https://visualizador.ideam.gov.co/portal/apps/storymaps/stories/660ec48de9454157b54adc074b1f38fd (accessed on 27 April 2026).
- Pyakurel, A.; K.C., D.; Dahal, B.K. Enhancing Co-Seismic Landslide Susceptibility, Building Exposure, and Risk Analysis through Machine Learning. Sci. Rep. 2024, 14, 5902. [Google Scholar] [CrossRef] [Scilit] [PubMed]
- Arrogante-Funes, P.; Bruzón, A.G.; Arrogante-Funes, F.; Ramos-Bernal, R.N.; Vázquez-Jiménez, R. Integration of Vulnerability and Hazard Factors for Landslide Risk Assessment. Int. J. Environ. Res. Public Health 2021, 18, 11987. [Google Scholar] [CrossRef] [Scilit] [PubMed]
- Zhang, C.; Liu, D.; Tsangaratos, P.; Ilia, I.; Ma, S.; Chen, W. Enhancing Predictive Accuracy of Landslide Susceptibility via Machine Learning Optimization. Appl. Sci. 2025, 15, 6325. [Google Scholar] [CrossRef] [Scilit]
- Adnan, M.S.G.; Rahman, M.S.; Ahmed, N.; Ahmed, B.; Rabbi, M.F.; Rahman, R.M. Improving Spatial Agreement in Machine Learning-Based Landslide Susceptibility Mapping. Remote Sens. 2020, 12, 3347. [Google Scholar] [CrossRef] [Scilit]
- Roy, J.; Saha, S.; Arabameri, A.; Blaschke, T.; Bui, D.T. A Novel Ensemble Approach for Landslide Susceptibility Mapping (LSM) in Darjeeling and Kalimpong Districts, West Bengal, India. Remote Sens. 2019, 11, 2866. [Google Scholar] [CrossRef] [Scilit]
- Gao, J.; Shi, X.; Li, L.; Zhou, Z.; Wang, J. Assessment of Landslide Susceptibility Using Different Machine Learning Methods in Longnan City, China. Sustainability 2022, 14, 16716. [Google Scholar] [CrossRef] [Scilit]
- Licata, M.; Buleo Tebar, V.; Seitone, F.; Fubelli, G. The Open Landslide Project (OLP), a New Inventory of Shallow Landslides for Susceptibility Models: The Autumn 2019 Extreme Rainfall Event in the Langhe-Monferrato Region (Northwestern Italy). Geosciences 2023, 13, 289. [Google Scholar] [CrossRef] [Scilit]
- Muhimbula, J.; Sumari, N.S.; Balz, T. Landslide Susceptibility Assessment Using AHP, Frequency Ratio, and LSI Models: Understanding Topographical Controls in Hanang District, Tanzania. GeoHazards 2025, 6, 58. [Google Scholar] [CrossRef] [Scilit]
- Kumal, P.; Joshi, P.C.; Mandal, A.K. GIS-Based Landslide Susceptibility Mapping in Gorkha Municipality: A Comparison of Frequency Ratio and Logistic Regression Models. OODBODHAN 2025, 8, 19–30. [Google Scholar] [CrossRef] [Scilit]
- Zhao, X.; Chen, W. Optimization of Computational Intelligence Models for Landslide Susceptibility Evaluation. Remote Sens. 2020, 12, 2180. [Google Scholar] [CrossRef] [Scilit]
- Nguyen, B.-Q.-V.; Ho, L.-H.-P.; Kim, Y.-T. An Ensemble Model of Logistic Regression, Naïve Bayes, and Adaboost for Assessing the Landslide Spatial Probability—Study Case: Phuoc Son, Quang Nam, Vietnam and Umyeon, Seoul, Korea. Civ. Eng. Archit. 2024, 12, 2010–2028. [Google Scholar] [CrossRef] [Scilit]
- Raut, S.; Dutta, D.; Bera, D.; Samanta, R. Assessment of Landslide Susceptibility Using Geospatial Techniques: A Comparative Evaluation of Machine Learning and Statistical Models. Geol. J. 2025, 60, 1129–1149. [Google Scholar] [CrossRef] [Scilit]
- Razavi-Termeh, S.V.; Sadeghi-Niaraki, A.; Ali, F.; Pradhan, B.; Choi, S.-M. Optimizing Ensemble Learning for Satellite-Based Multi-Hazard Monitoring and Susceptibility Assessment of Landslides, Land Subsidence, Floods, and Wildfires. Sci. Rep. 2025, 15, 30968. [Google Scholar] [CrossRef] [Scilit] [PubMed]
- Bui, Q.D.; Ha, H.; Khuc, D.T.; Nguyen, D.Q.; von Meding, J.; Nguyen, L.P.; Luu, C. Landslide Susceptibility Prediction Mapping with Advanced Ensemble Models: Son La Province, Vietnam. Nat. Hazards 2023, 116, 2283–2309. [Google Scholar] [CrossRef] [Scilit]
- Estoque, R.C.; Ishtiaque, A.; Parajuli, J.; Athukorala, D.; Rabby, Y.W.; Ooba, M. Has the IPCC’s Revised Vulnerability Concept Been Well Adopted? Ambio 2023, 52, 376–389. [Google Scholar] [CrossRef] [Scilit] [PubMed]
- Lapietra, I.; Colacicco, R.; Capolongo, D.; La Salandra, M.; Rinaldi, A.; Dellino, P. Unveiling Social Vulnerability to Natural Hazards in the EEA and UK: A Systematic Review with Insights for Enhanced Emergency Planning and Risk Reduction. Int. J. Disaster Risk Reduct. 2024, 108, 104507. [Google Scholar] [CrossRef] [Scilit]
- Navarro, D.; Cantergiani, C.; Abajo, B.; Gomez de Salazar, I.; Feliu, E. Territorial Vulnerability to Natural Hazards in Europe: A Composite Indicator Analysis and Relation to Economic Impacts. Nat. Hazards 2025, 121, 23429–23453. [Google Scholar] [CrossRef] [Scilit]
- Guerrero, N.; Contreras, M.; Chamorro, A.; Martínez, C.; Echaveguren, T. Social Vulnerability in Chile: Challenges for Multi-Scale Analysis and Disaster Risk Reduction. Nat. Hazards 2023, 117, 3067–3102. [Google Scholar] [CrossRef] [Scilit]
- Birkmann, J.; Jamshed, A.; McMillan, J.M.; Feldmeyer, D.; Totin, E.; Solecki, W.; Ibrahim, Z.Z.; Roberts, D.; Kerr, R.B.; Poertner, H.-O.; et al. Understanding Human Vulnerability to Climate Change: A Global Perspective on Index Validation for Adaptation Planning. Sci. Total Environ. 2022, 803, 150065. [Google Scholar] [CrossRef] [Scilit] [PubMed]
- Moreira, L.L.; de Brito, M.M.; Kobiyama, M. Review Article: A Systematic Review and Future Prospects of Flood Vulnerability Indices. Nat. Hazards Earth Syst. Sci. 2021, 21, 1513–1530. [Google Scholar] [CrossRef] [Scilit]
- Rivière, M.; Lenglet, J.; Noirault, A.; Pimont, F.; Dupuy, J.-L. Mapping Territorial Vulnerability to Wildfires: A Participative Multi-Criteria Analysis. For. Ecol. Manag. 2023, 539, 121014. [Google Scholar] [CrossRef] [Scilit]
- Mahalingam, R.; Olsen, M.J. Evaluation of the Influence of Source and Spatial Resolution of DEMs on Derivative Products Used in Landslide Mapping. Geomat. Nat. Hazards Risk 2016, 7, 1835–1855. [Google Scholar] [CrossRef] [Scilit]
- Li, J.; Wang, W.; Han, Z.; Li, Y.; Chen, G. Exploring the Impact of Multitemporal DEM Data on the Susceptibility Mapping of Landslides. Appl. Sci. 2020, 10, 2518. [Google Scholar] [CrossRef] [Scilit]
- Jari, A.; Khaddari, A.; Hajaj, S.; Bachaoui, E.M.; Mohammedi, S.; Jellouli, A.; Mosaid, H.; El Harti, A.; Barakat, A. Landslide Susceptibility Mapping Using Multi-Criteria Decision-Making (MCDM), Statistical, and Machine Learning Models in the Aube Department, France. Earth 2023, 4, 698–713. [Google Scholar] [CrossRef] [Scilit]
- Azmoon, B.; Biniyaz, A.; Liu, Z. Use of High-Resolution Multi-Temporal DEM Data for Landslide Detection. Geosciences 2022, 12, 378. [Google Scholar] [CrossRef] [Scilit]
- Rivera, C.A.; Valqui-Reina, S.V.; García-Naranjo, L.F.; Ocaña-Zúñiga, C.L.; Auquiñivin-Silva, E.A.; Chapa-Gonza, S.R.; Cieza-Tarrillo, D.; Vergara, C.G.; Vergara, A.J. Geospatial Landslide Risk Mapping Using AHP and GIS: A Case Study of the Utcubamba River Basin, Peru. Appl. Sci. 2025, 15, 9423. [Google Scholar] [CrossRef] [Scilit]
- Khan, Z.; Nawazuzzoha, M.; Abdelrahman, K.; Ali, S.A.; Fnais, M.S.; Kausar Shamim, S.; Ahmad, A.; Andráš, P. Mapping Landslide Susceptibility and Risk Assessment on Fragile Ecosystem of Himalayan River Basins. Earth 2025, 37, 1–22. [Google Scholar] [CrossRef] [Scilit]
- Kim, T.; Villarini, G. Projected Changes in Daily Precipitation, Temperature and Wet-Bulb Temperature across Arizona Using Statistically Downscaled CMIP6 Climate Models. Int. J. Climatol. 2024, 44, 1994–2010. [Google Scholar] [CrossRef] [Scilit]
- Ghazi, B.; Salehi, H.; Przybylak, R.; Pospieszyńska, A. Projection of Climate Change Impact on the Occurrence of Drought Events in Poland. Sci. Rep. 2025, 15, 5609. [Google Scholar] [CrossRef] [Scilit] [PubMed]
- Kamruzzaman, M.; Wahid, S.; Shahid, S.; Alam, E.; Mainuddin, M.; Islam, H.M.T.; Cho, J.; Rahman, M.M.; Biswas, J.C.; Thorp, K.R. Predicted Changes in Future Precipitation and Air Temperature across Bangladesh Using CMIP6 GCMs. Heliyon 2023, 9, e16274. [Google Scholar] [CrossRef] [Scilit] [PubMed]
- Vásquez, N.A.; Mendoza, P.A.; Lagos-Zuñiga, M.; Scaff, L.; Muñoz-Castro, E.; Vargas, X. Robust Spatial Changes in Climate Classes: Insights from Bias-Corrected CMIP6 Models across Chile. Environ. Res. Lett. 2024, 20, 014061. [Google Scholar] [CrossRef] [Scilit]
- Ye, C.; Wu, H.; Oguchi, T.; Tang, Y.; Pei, X.; Wu, Y. Physically Based and Data-Driven Models for Landslide Susceptibility Assessment: Principles, Applications, and Challenges. Remote Sens. 2025, 17, 2280. [Google Scholar] [CrossRef] [Scilit]
- Mafigiri, A.; Khanan, M.F.A.; Abdullah, R.A. A Review of GIS-Based Landslide Susceptibility and Hazard Modeling Considering the Influence of Topographic Parameters on Rainfall Spatial Variability. Model. Earth Syst. Environ. 2025, 11, 427. [Google Scholar] [CrossRef] [Scilit]
- Ghasemian, B.; Shahabi, H.; Shirzadi, A.; Al-Ansari, N.; Jaafari, A.; Geertsema, M.; Melesse, A.M.; Singh, S.K.; Ahmad, A. Application of a Novel Hybrid Machine Learning Algorithm in Shallow Landslide Susceptibility Mapping in a Mountainous Area. Front. Environ. Sci. 2022, 10, 897254. [Google Scholar] [CrossRef] [Scilit]
- Das, R.; Tien, P.V.; Wegmann, K.W.; Chakraborty, M. Machine Learning-Based Assessment of Regional-Scale Variation of Landslide Susceptibility in Central Vietnam. PLoS ONE 2024, 19, e0308494. [Google Scholar] [CrossRef] [Scilit] [PubMed]
- Xu, C.; Zhang, X.; Li, L.; Feng, L.; Yang, W. Geospatial Insights Into Landslide Relics in the Northern Half of the Taihang Mountains: Topography, Geology and Beyond. Geosci. Data J. 2025, 12, e70028. [Google Scholar] [CrossRef] [Scilit]
- da Silva, R.C.; Marengo, J.A.; Ruv Lemes, M. Analysis of Extreme Rainfall and Landslides in the Metropolitan Region of the Paraiba Do Sul River Valley and North Coast of Sao Paulo, Brazil. Theor. Appl. Climatol. 2024, 155, 3927–3949. [Google Scholar] [CrossRef] [Scilit]
- Herrera-Coy, M.C.; Calderón, L.P.; Herrera-Pérez, I.L.; Bravo-López, P.E.; Conoscenti, C.; Delgado, J.; Sánchez-Gómez, M.; Fernández, T. Landslide Susceptibility Analysis on the Vicinity of Bogotá-Villavicencio Road (Eastern Cordillera of the Colombian Andes). Remote Sens. 2023, 15, 3870. [Google Scholar] [CrossRef] [Scilit]
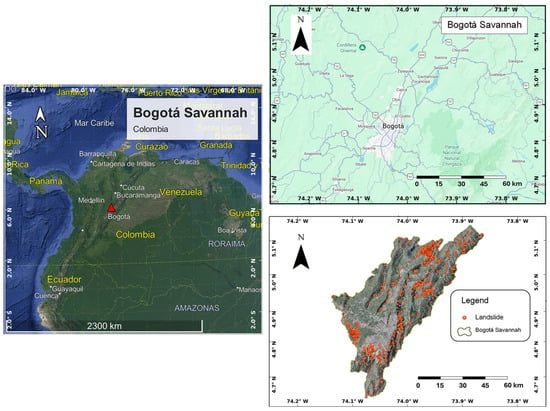
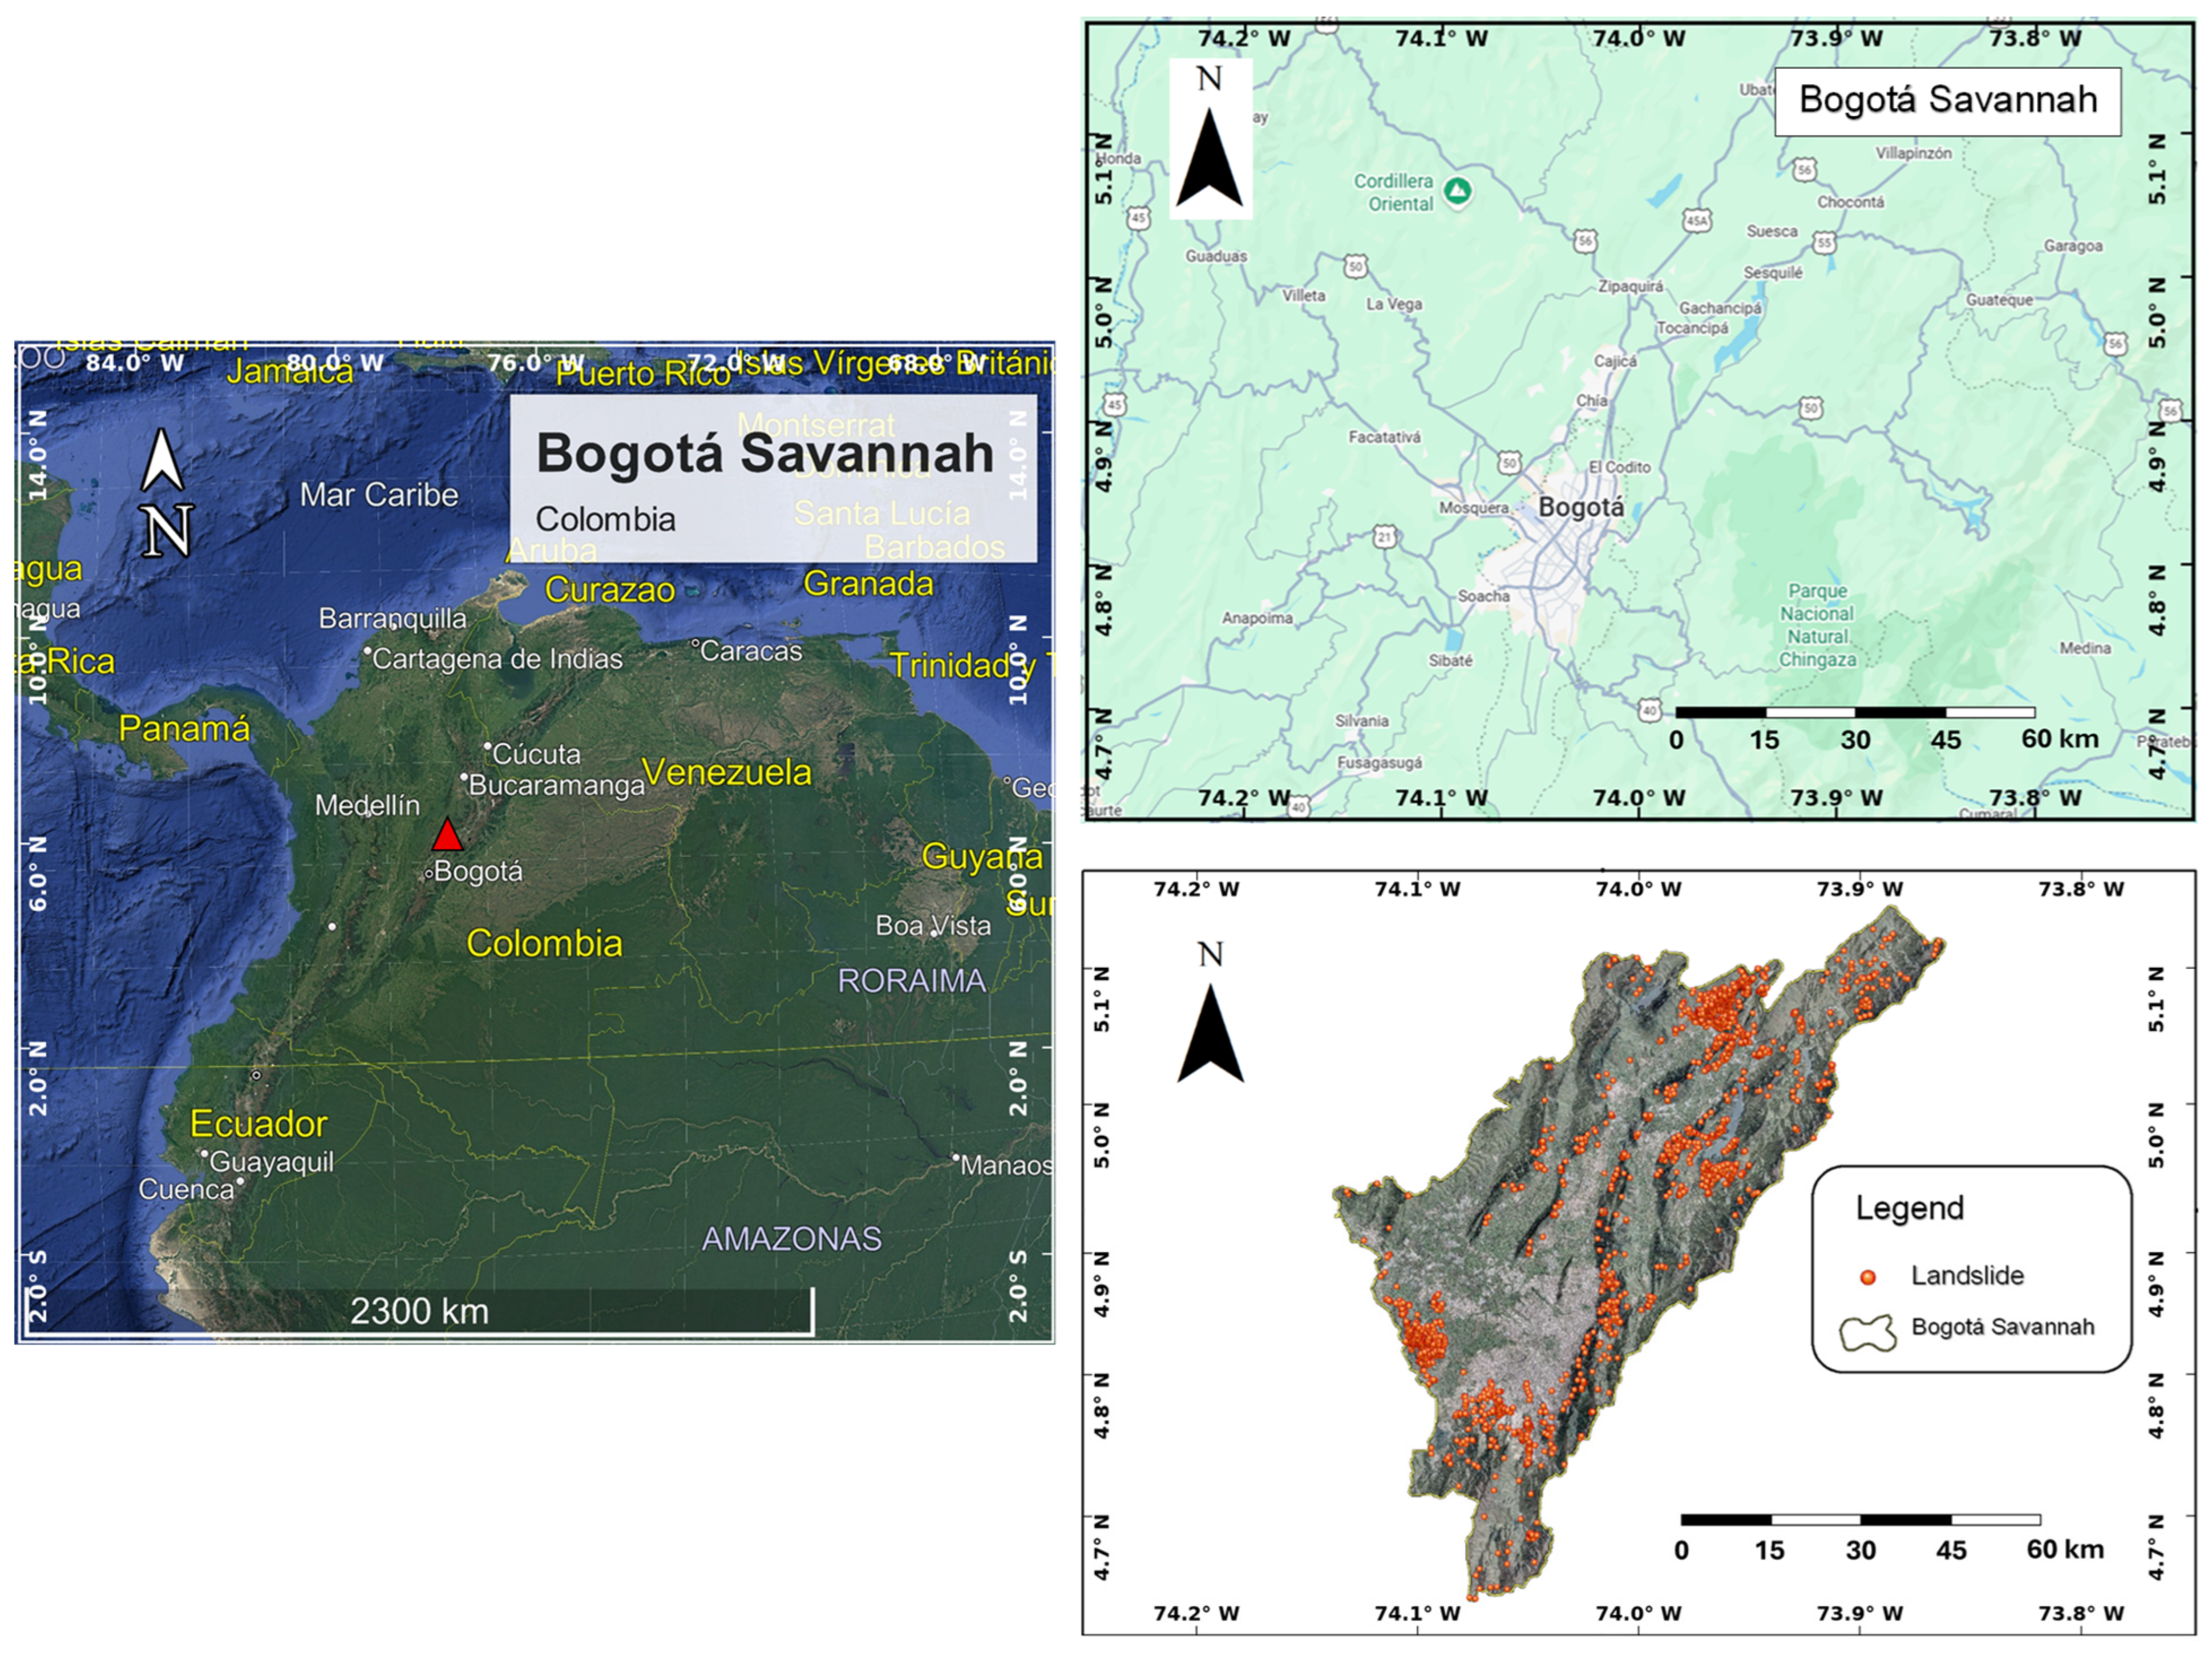
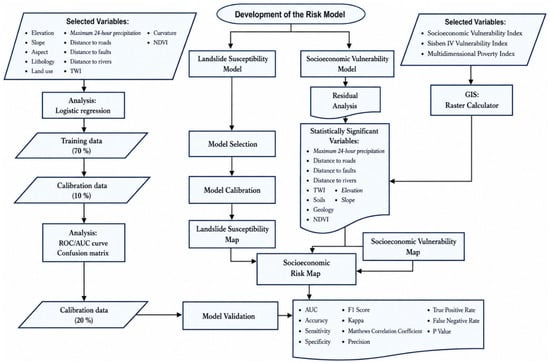
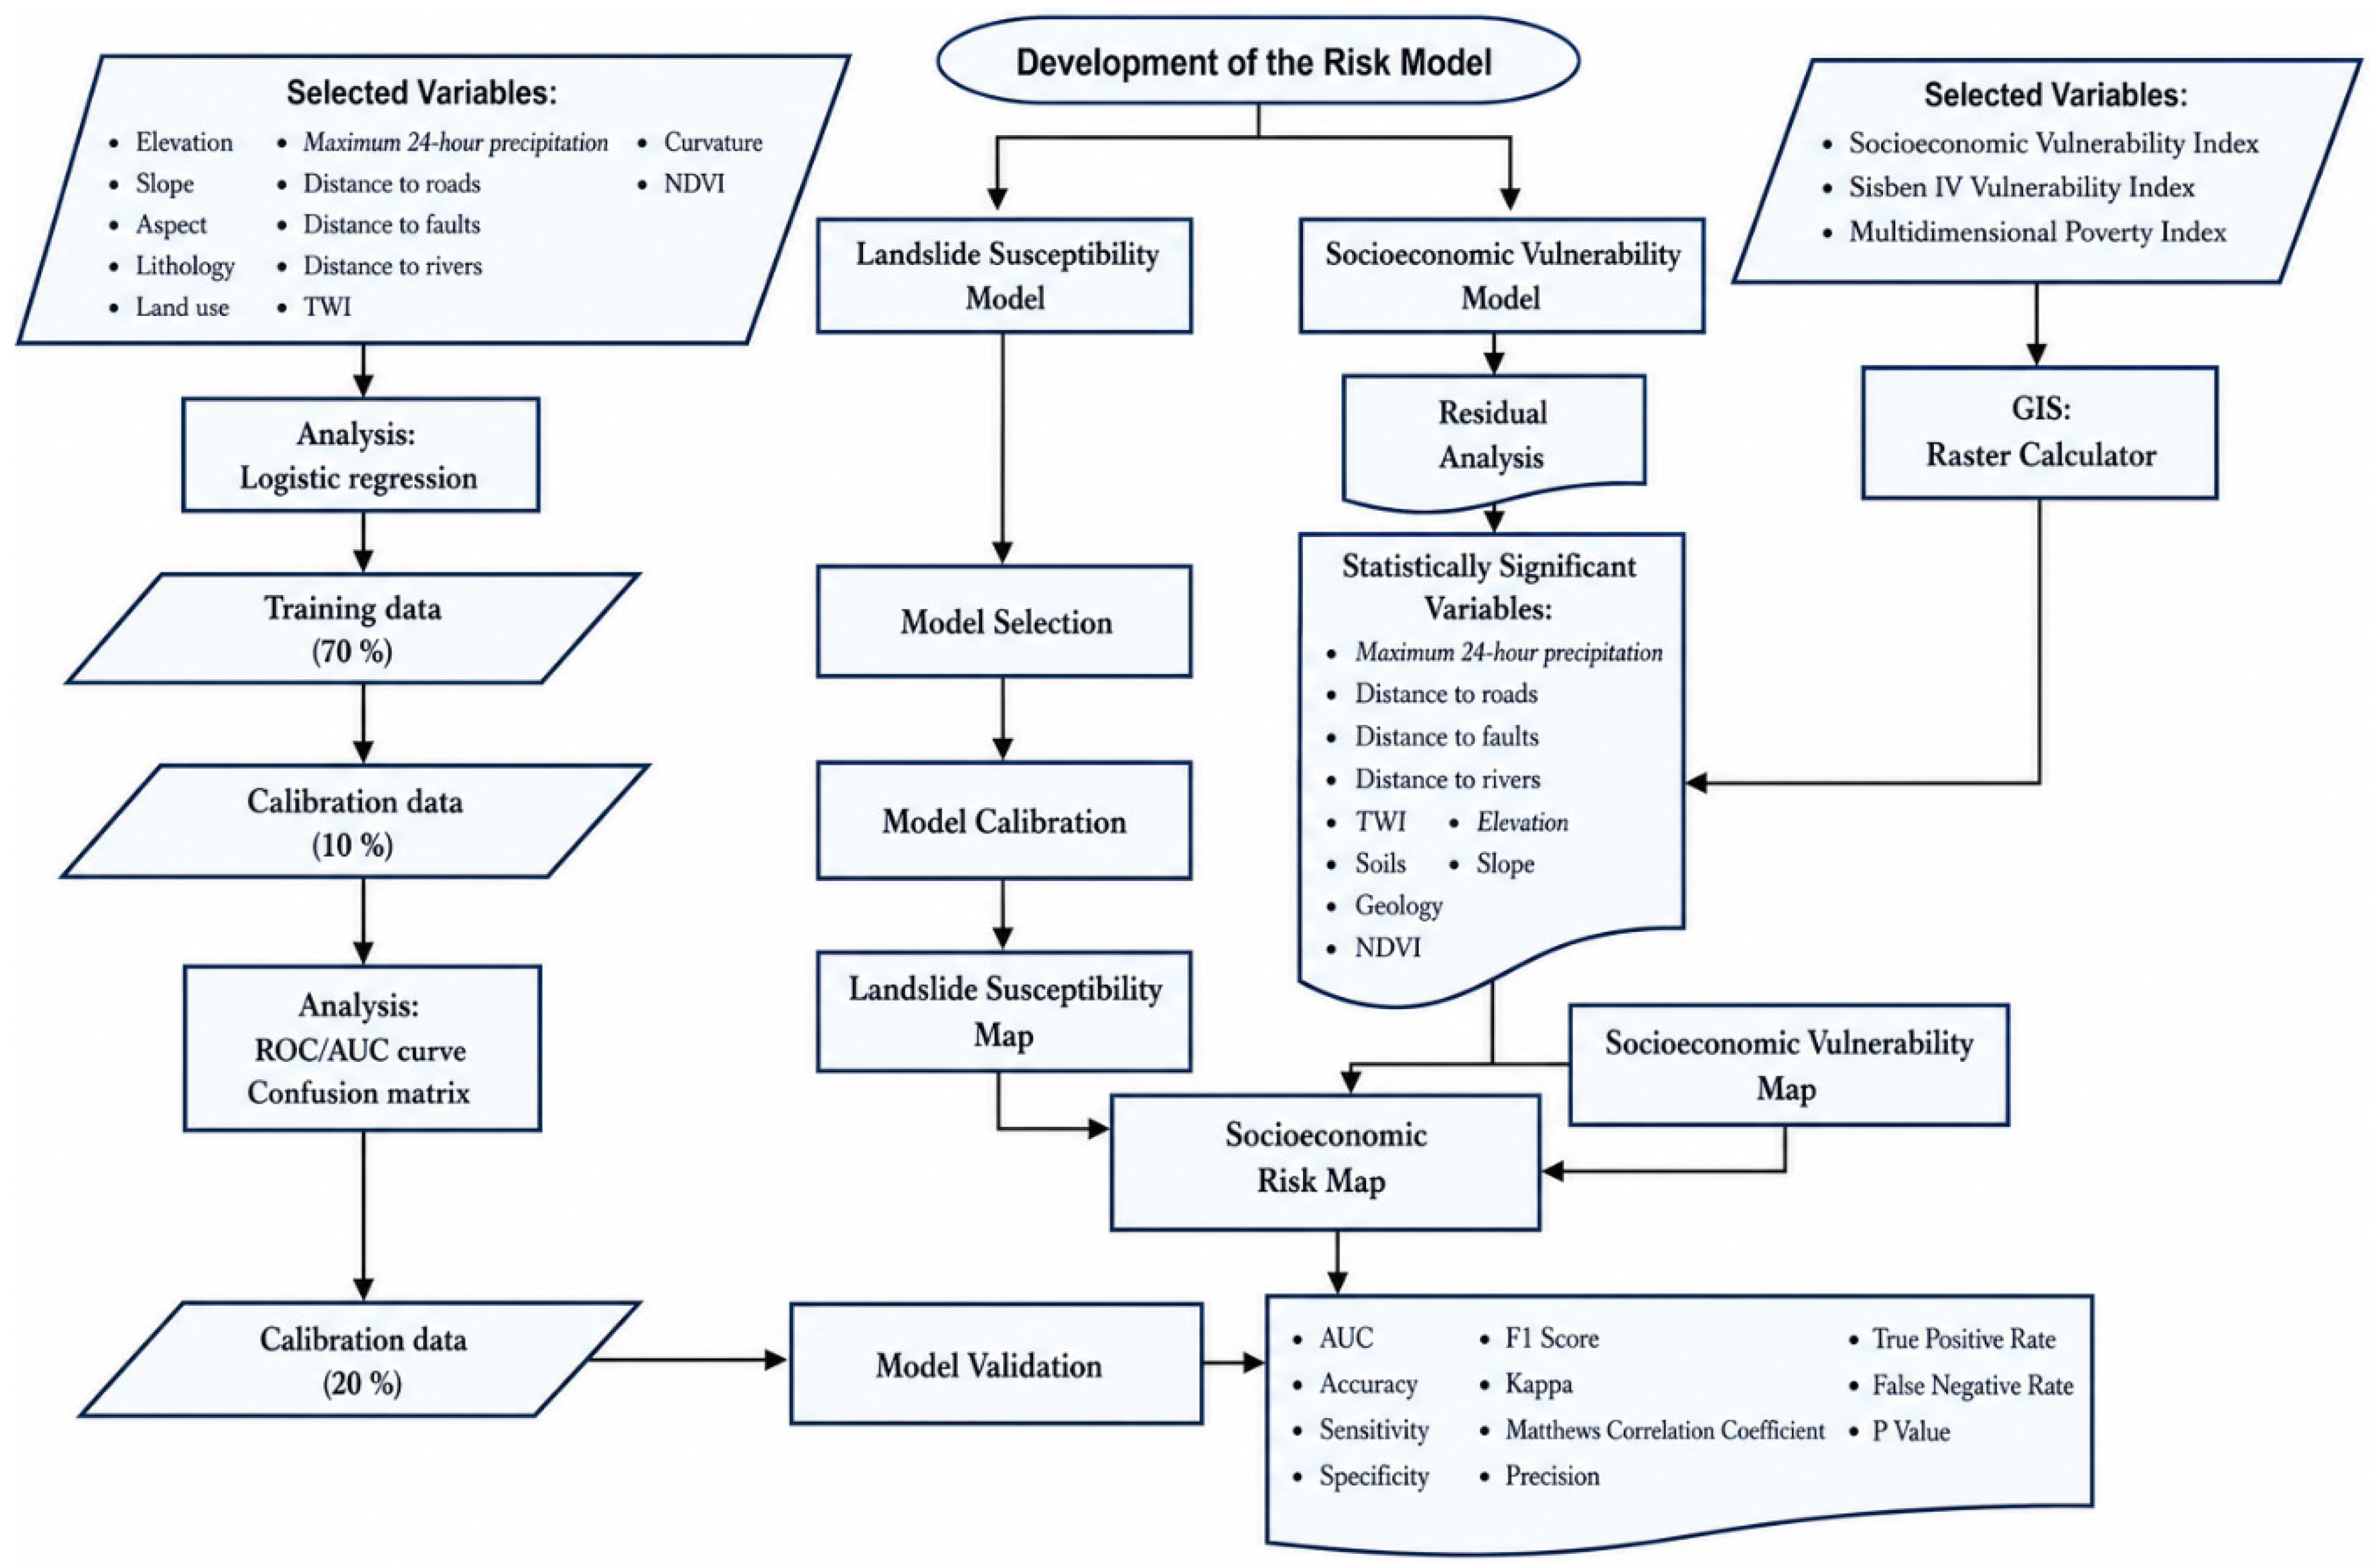
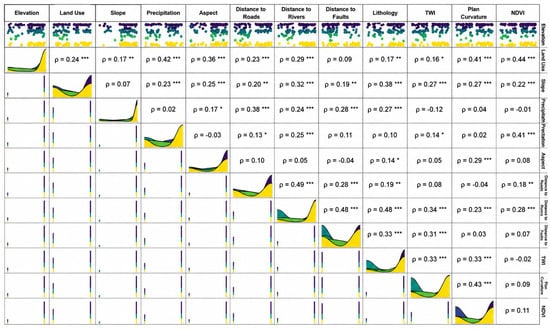
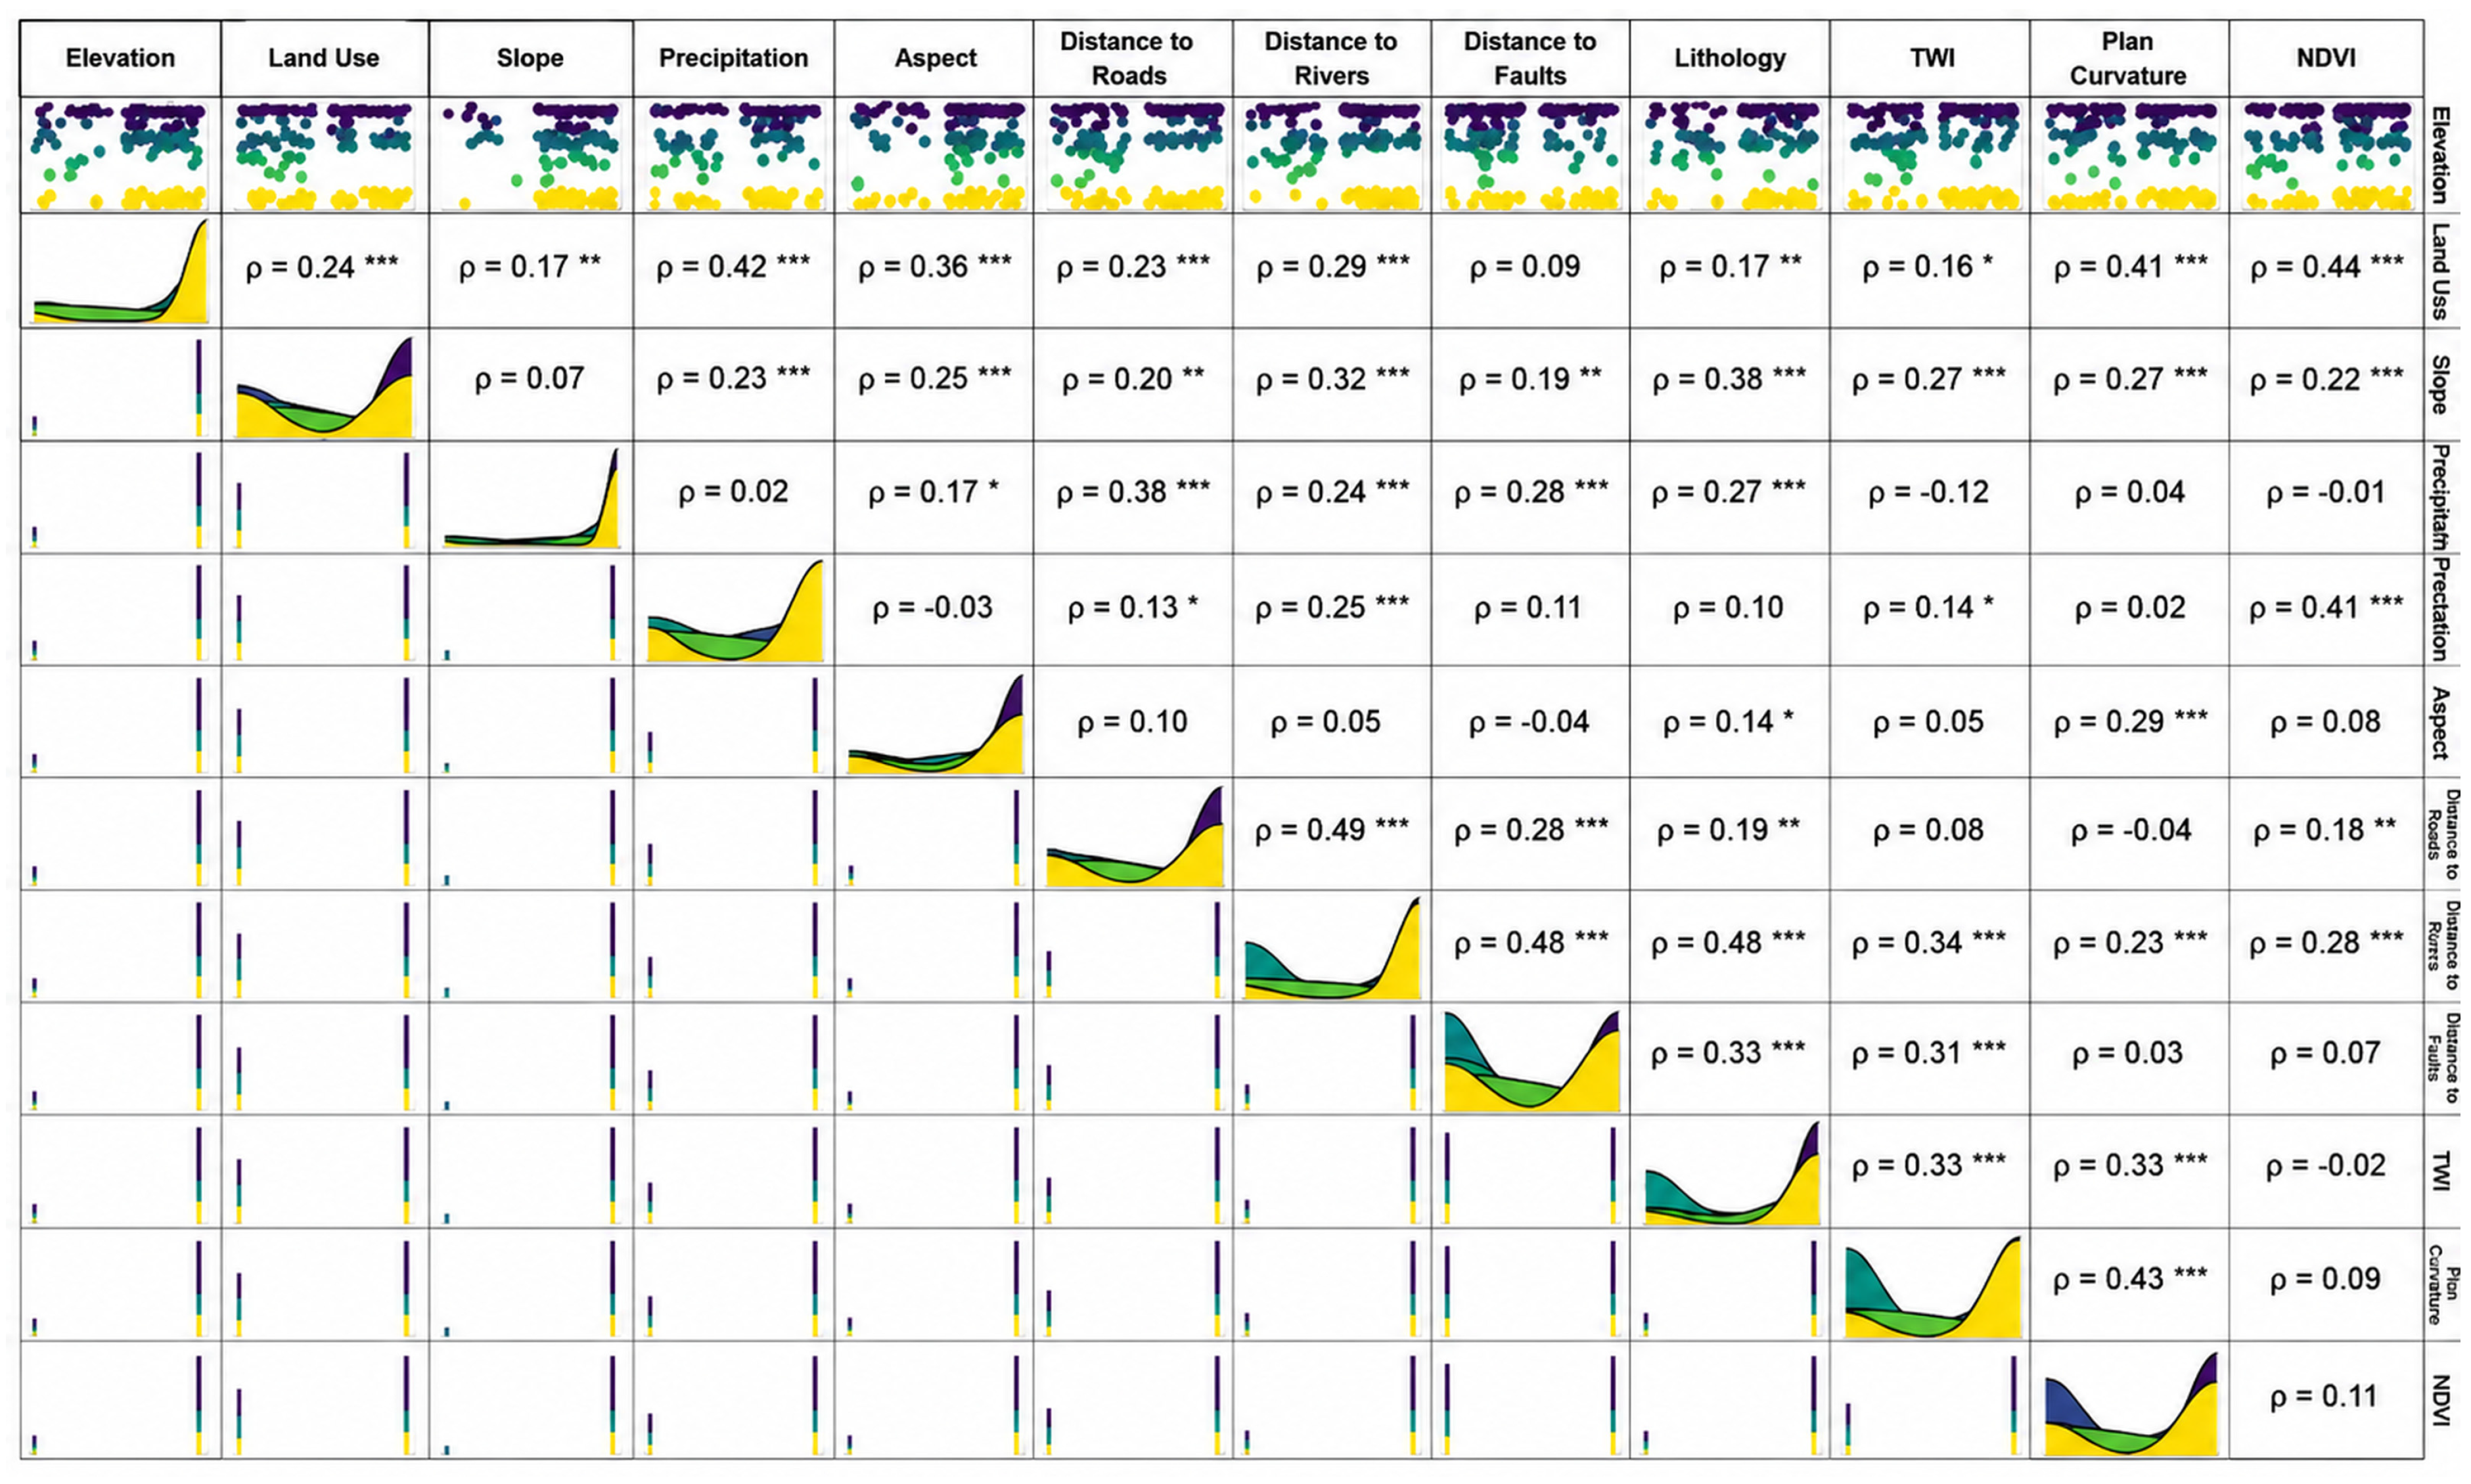
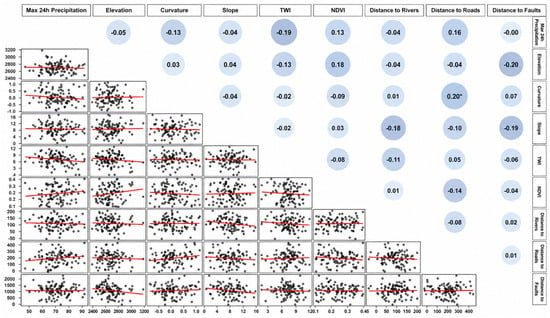
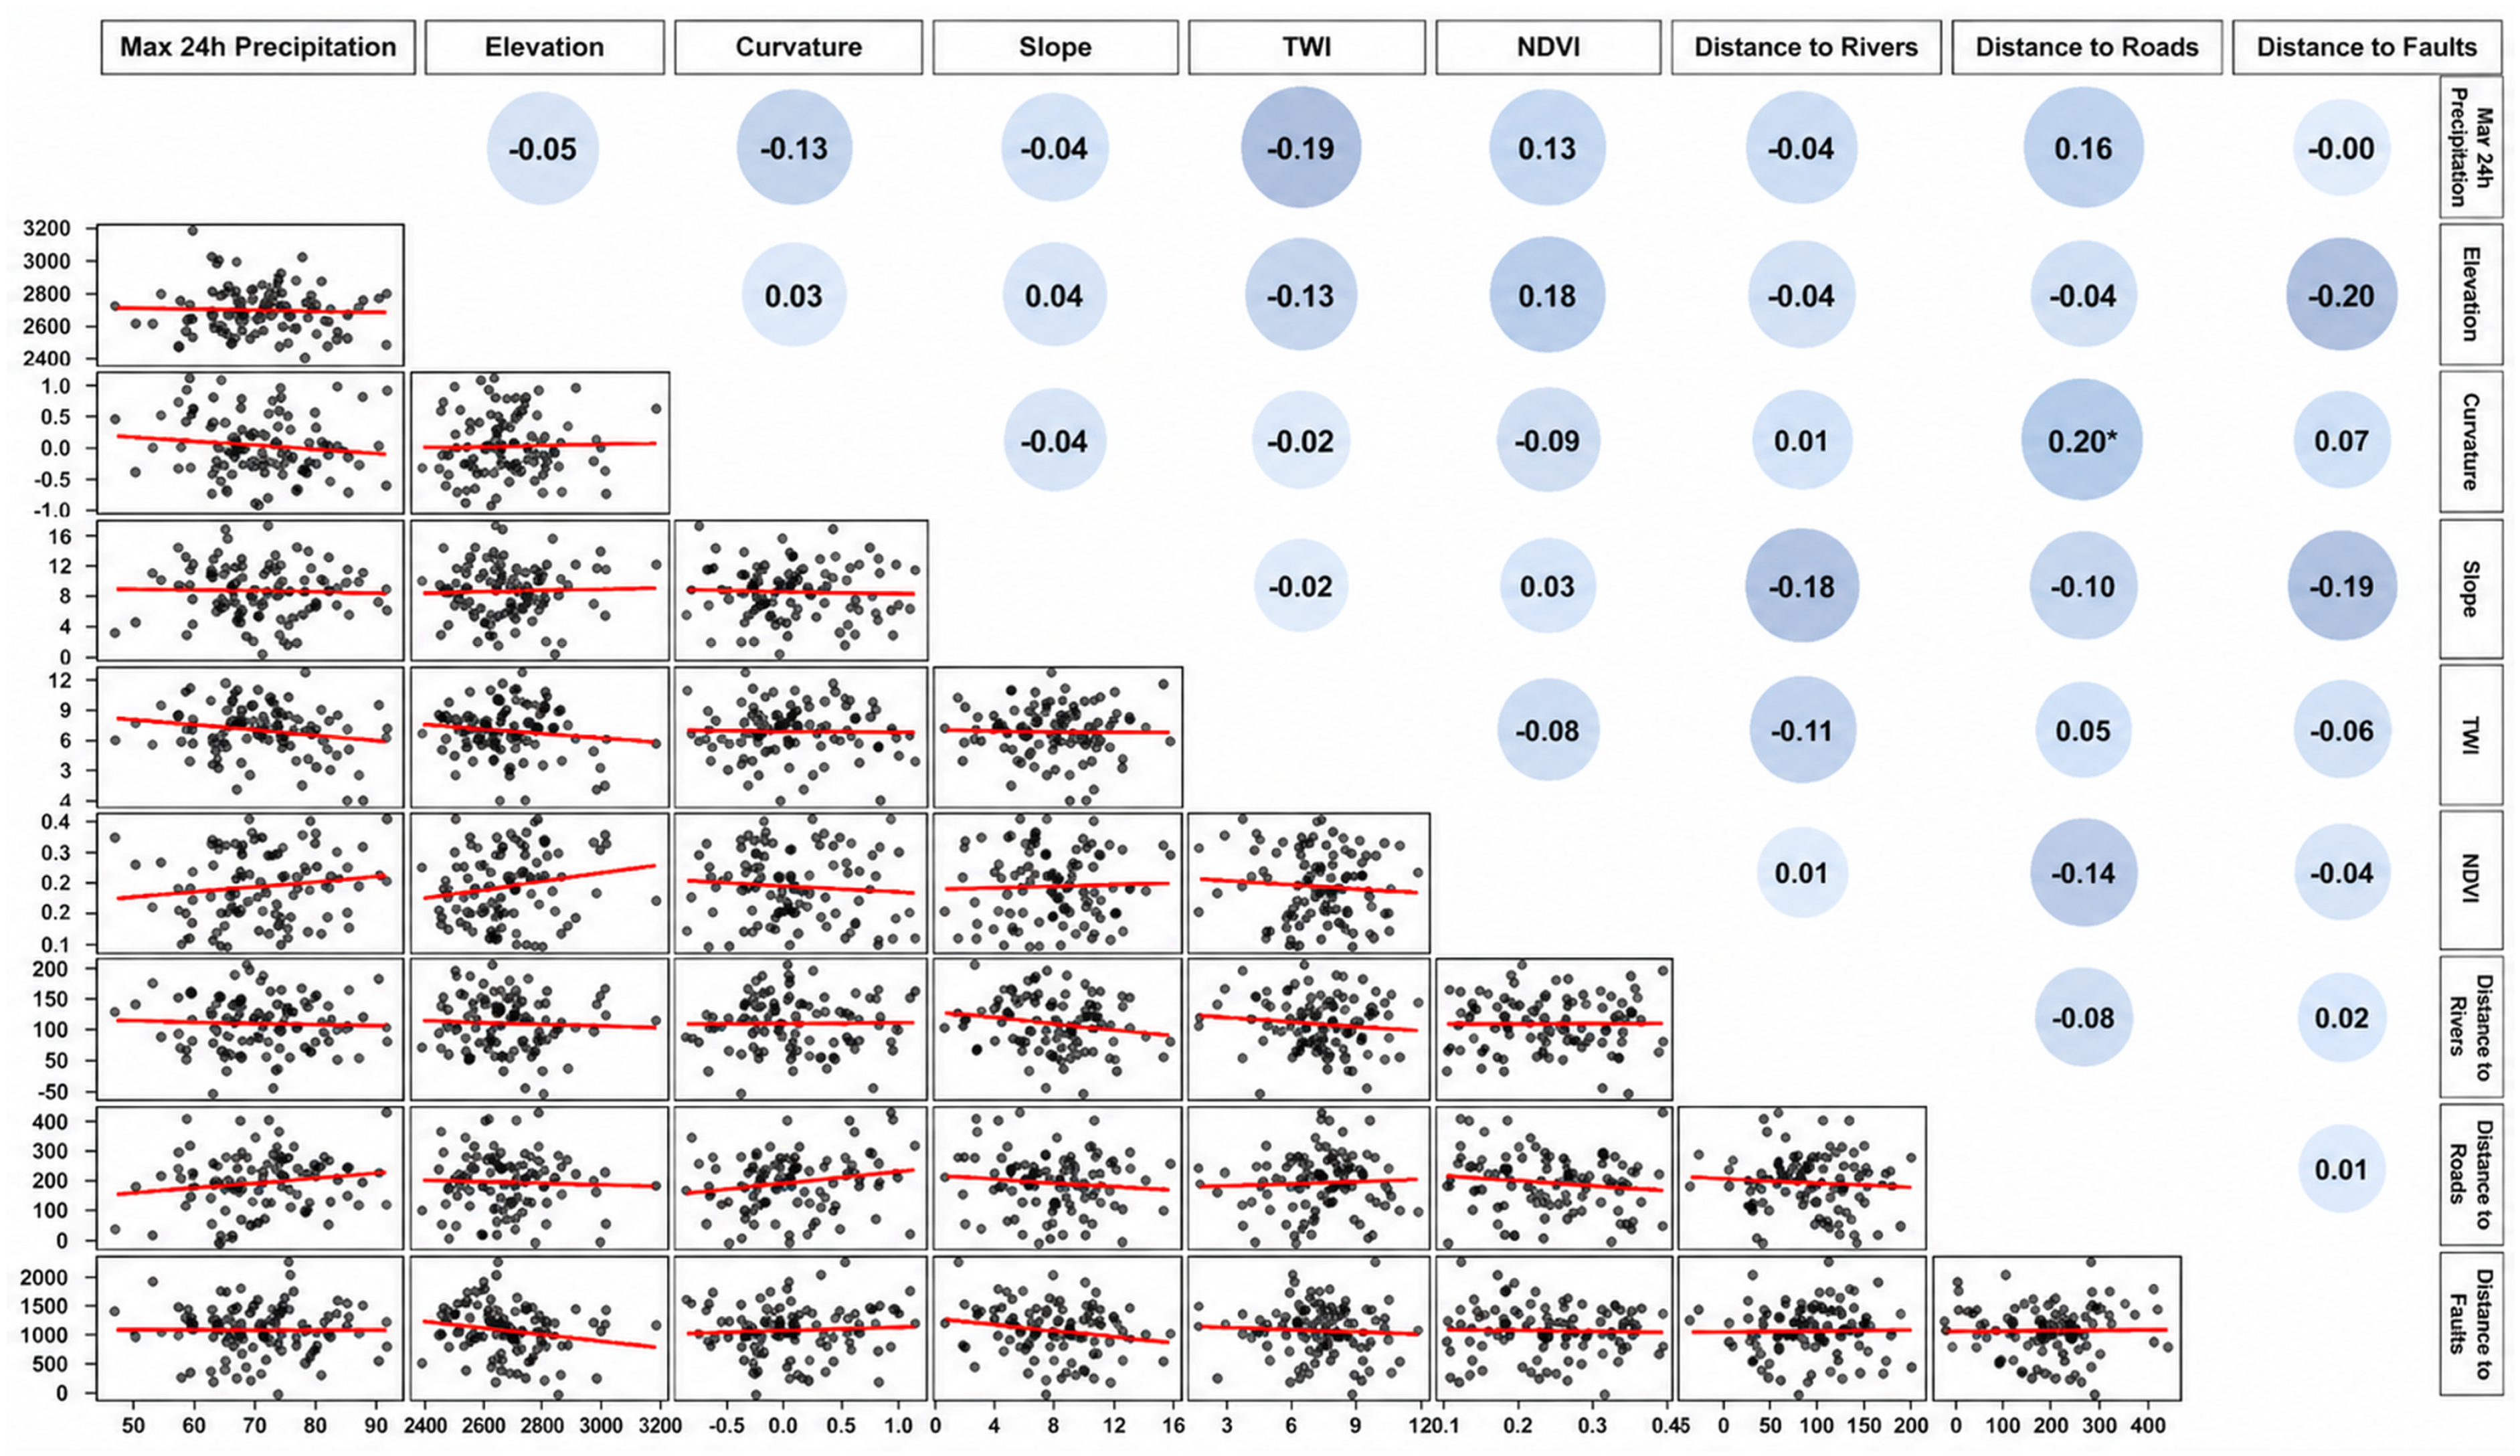
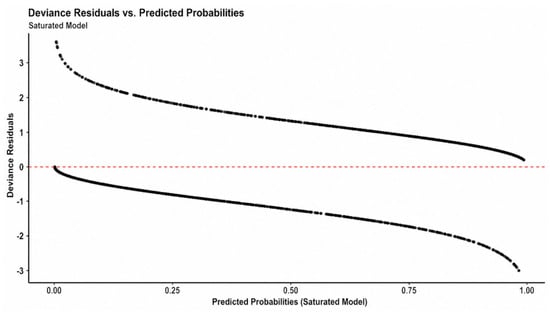
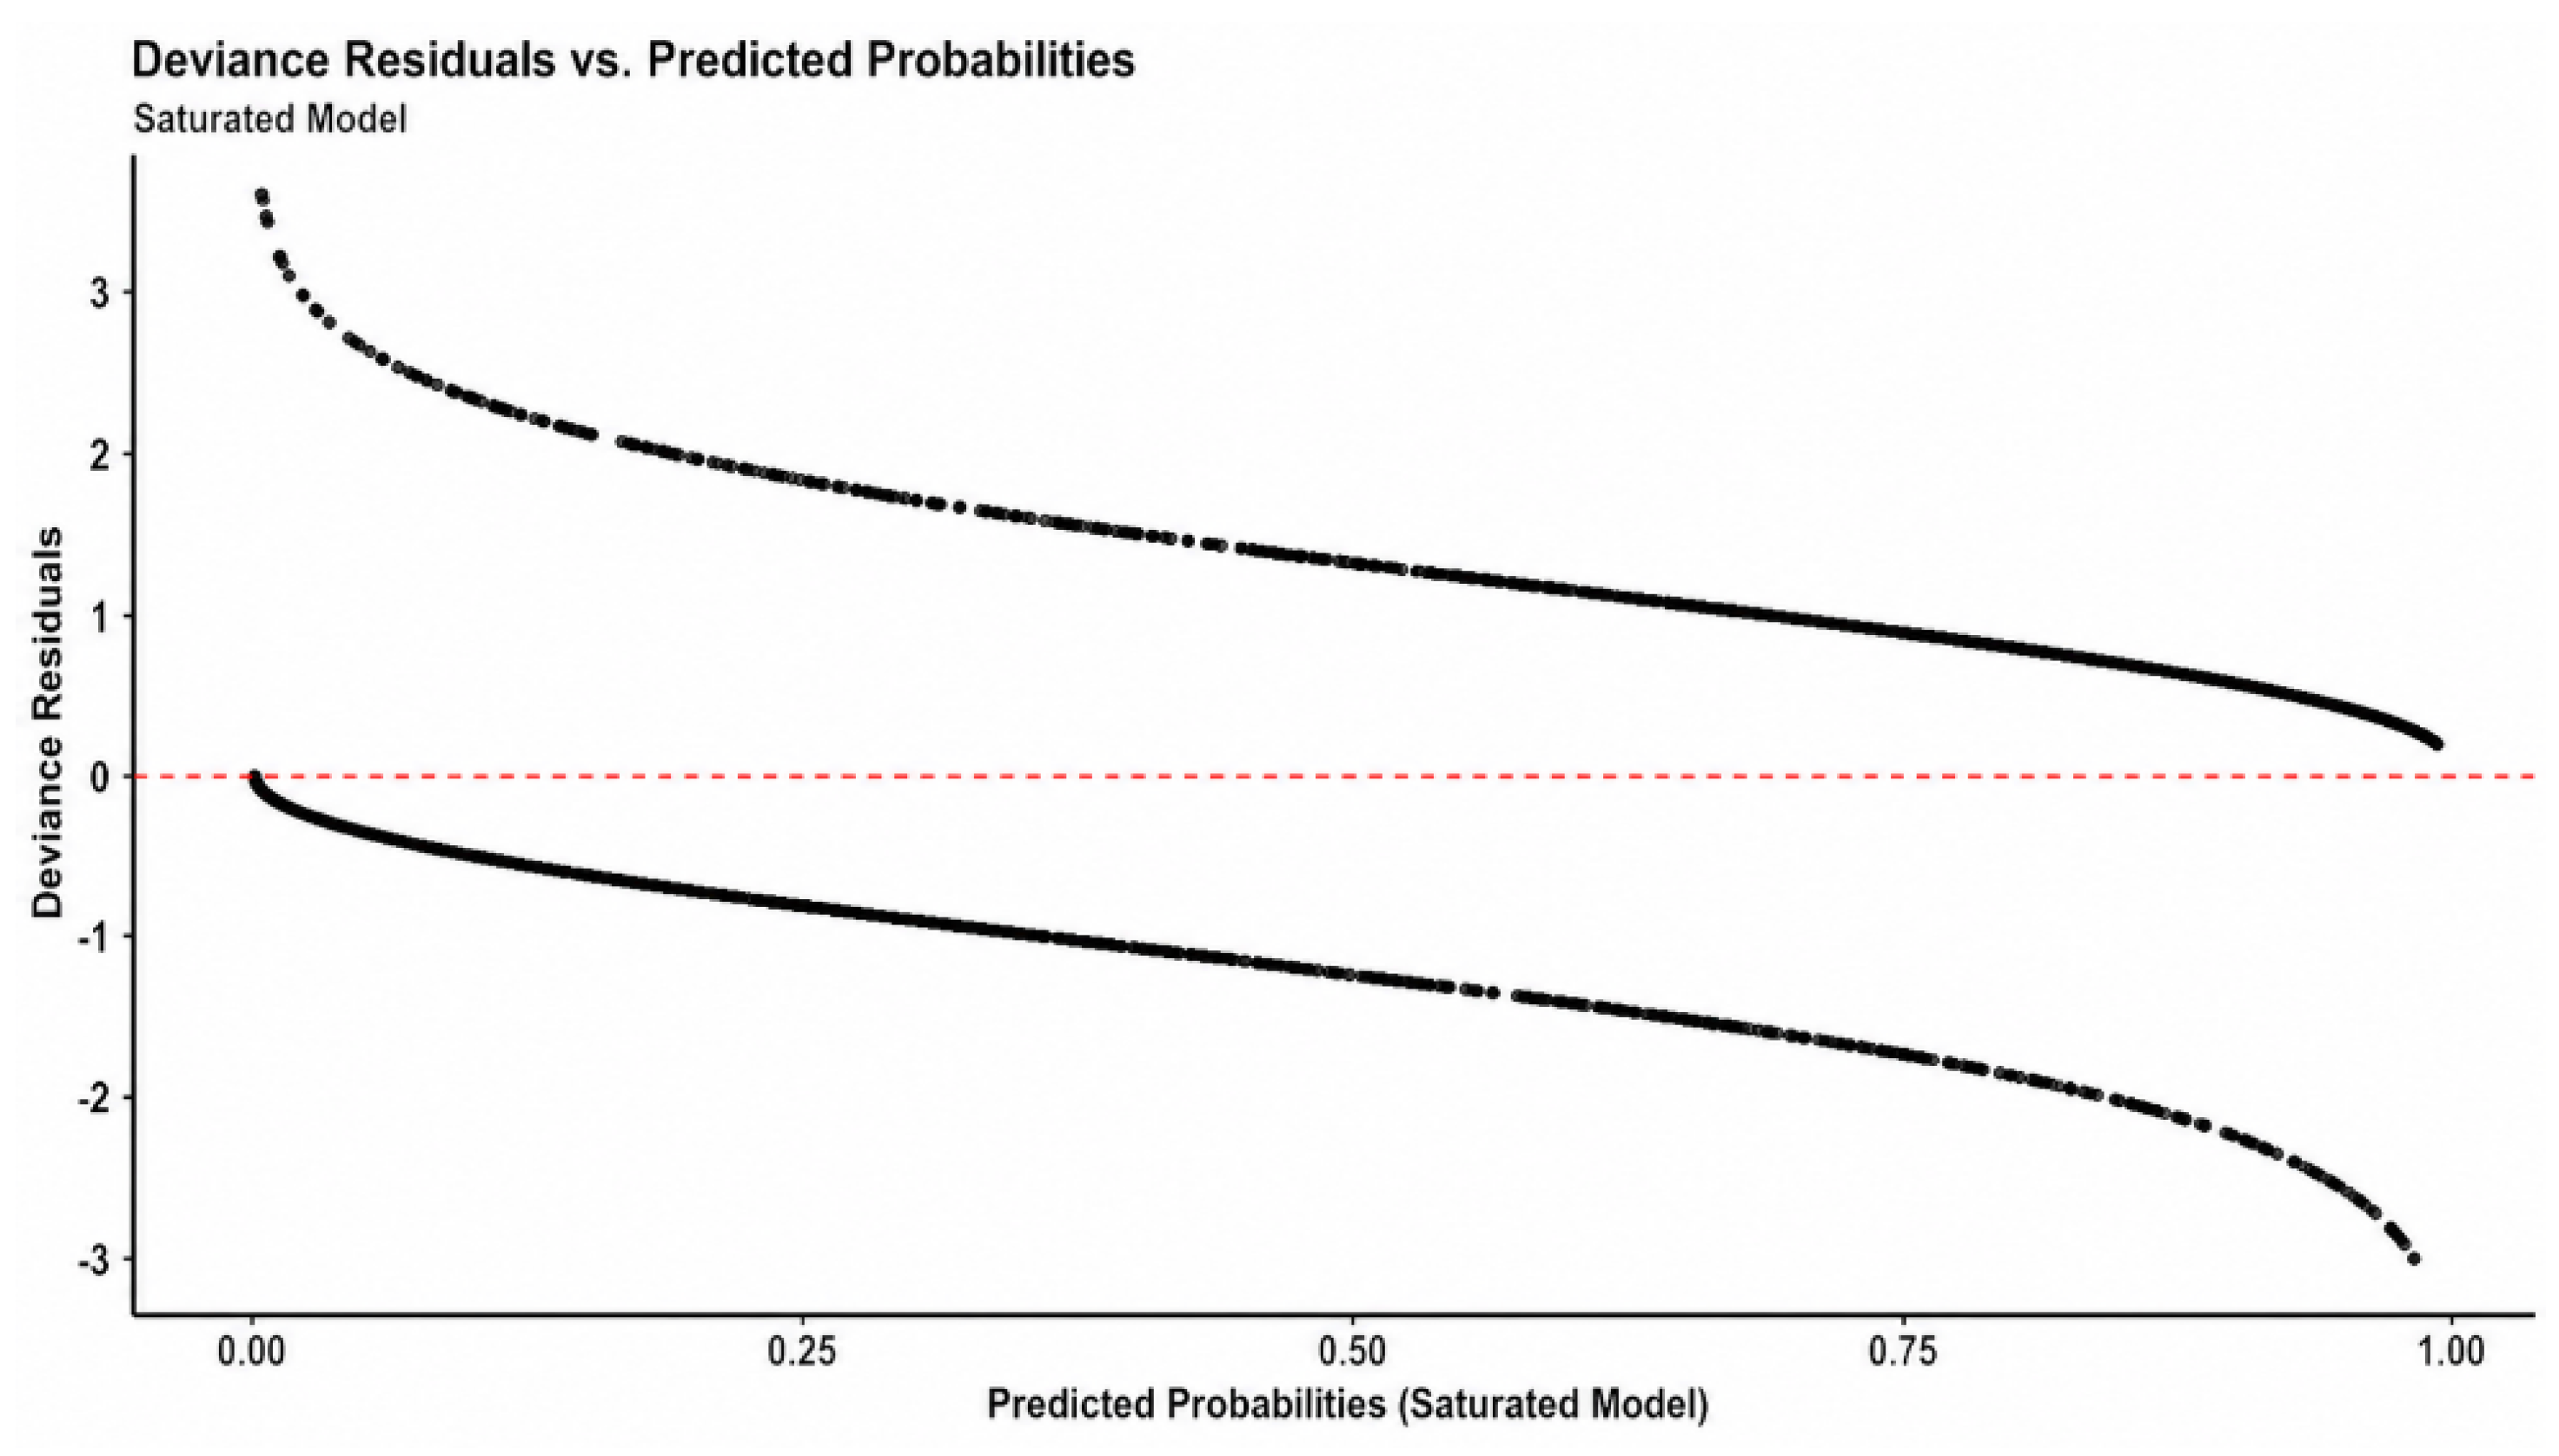
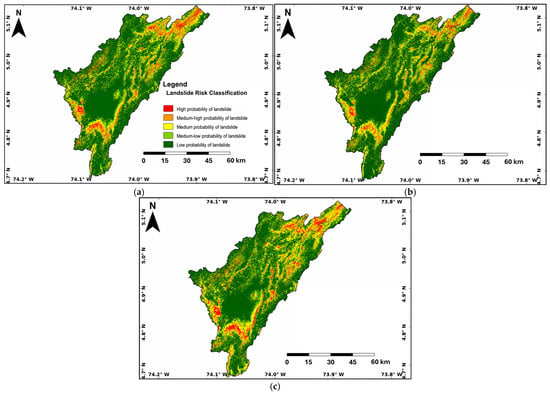
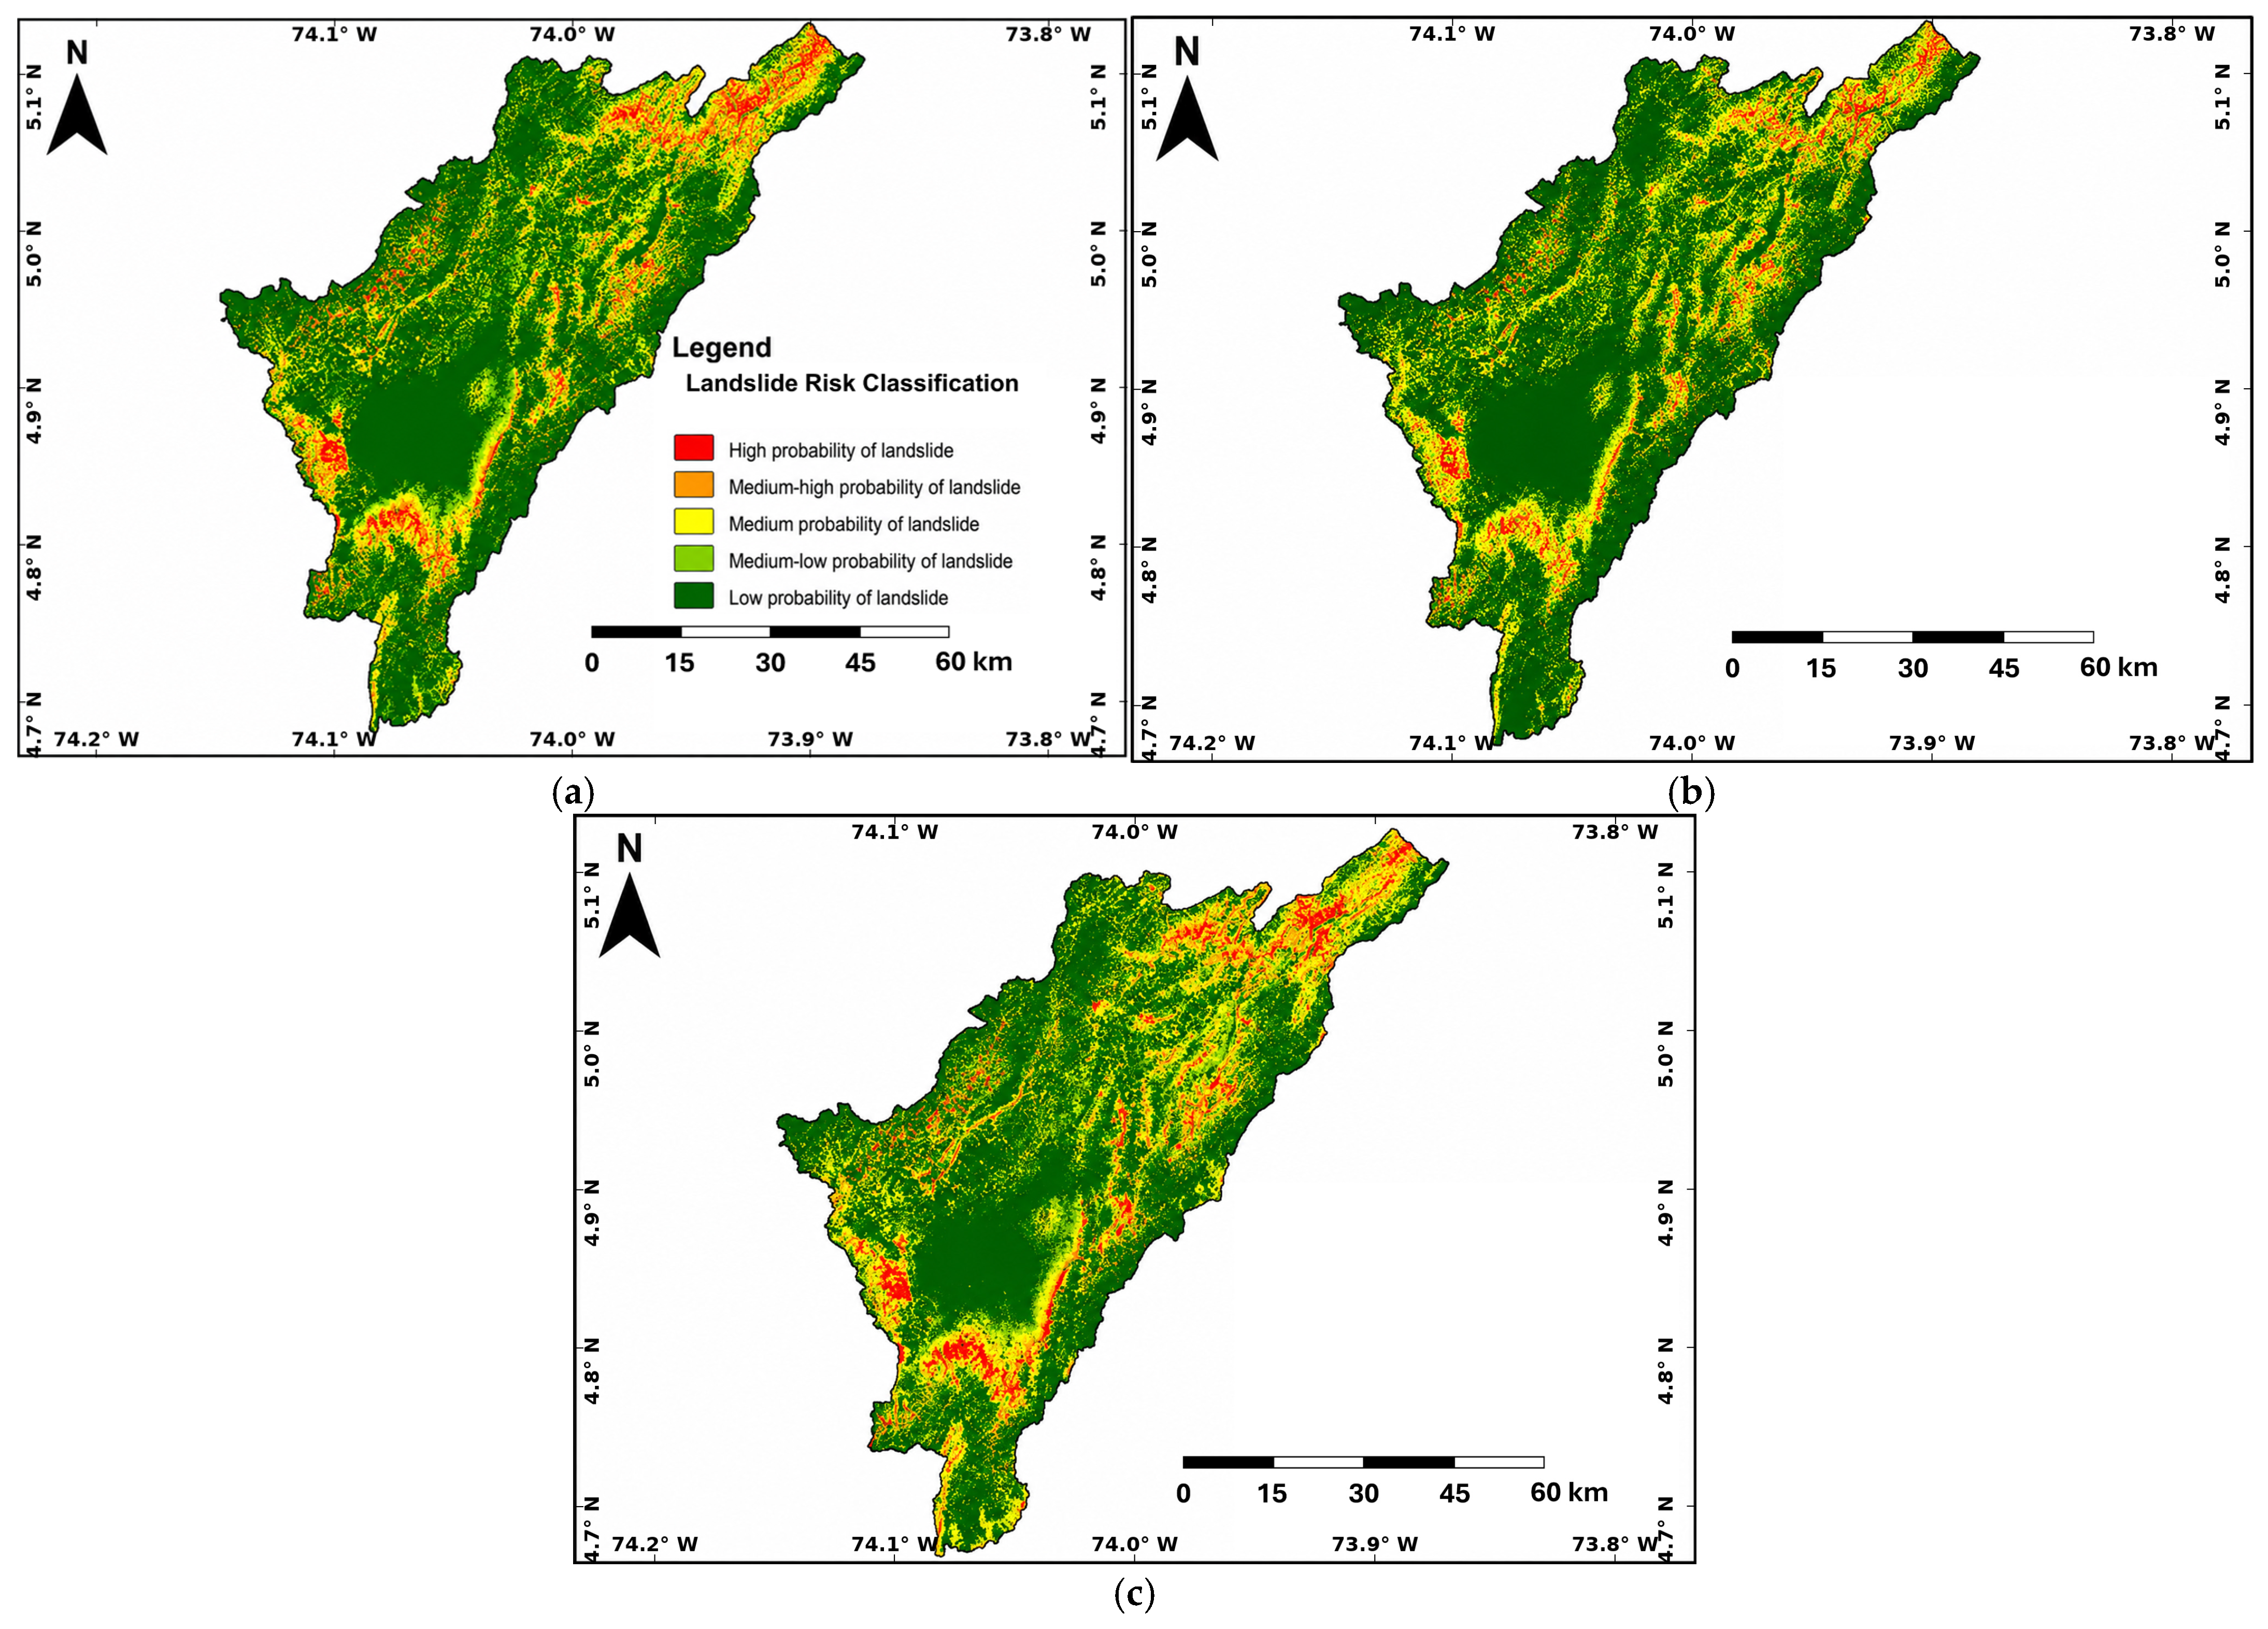
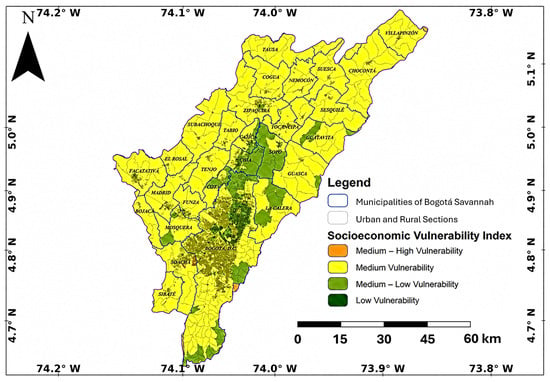
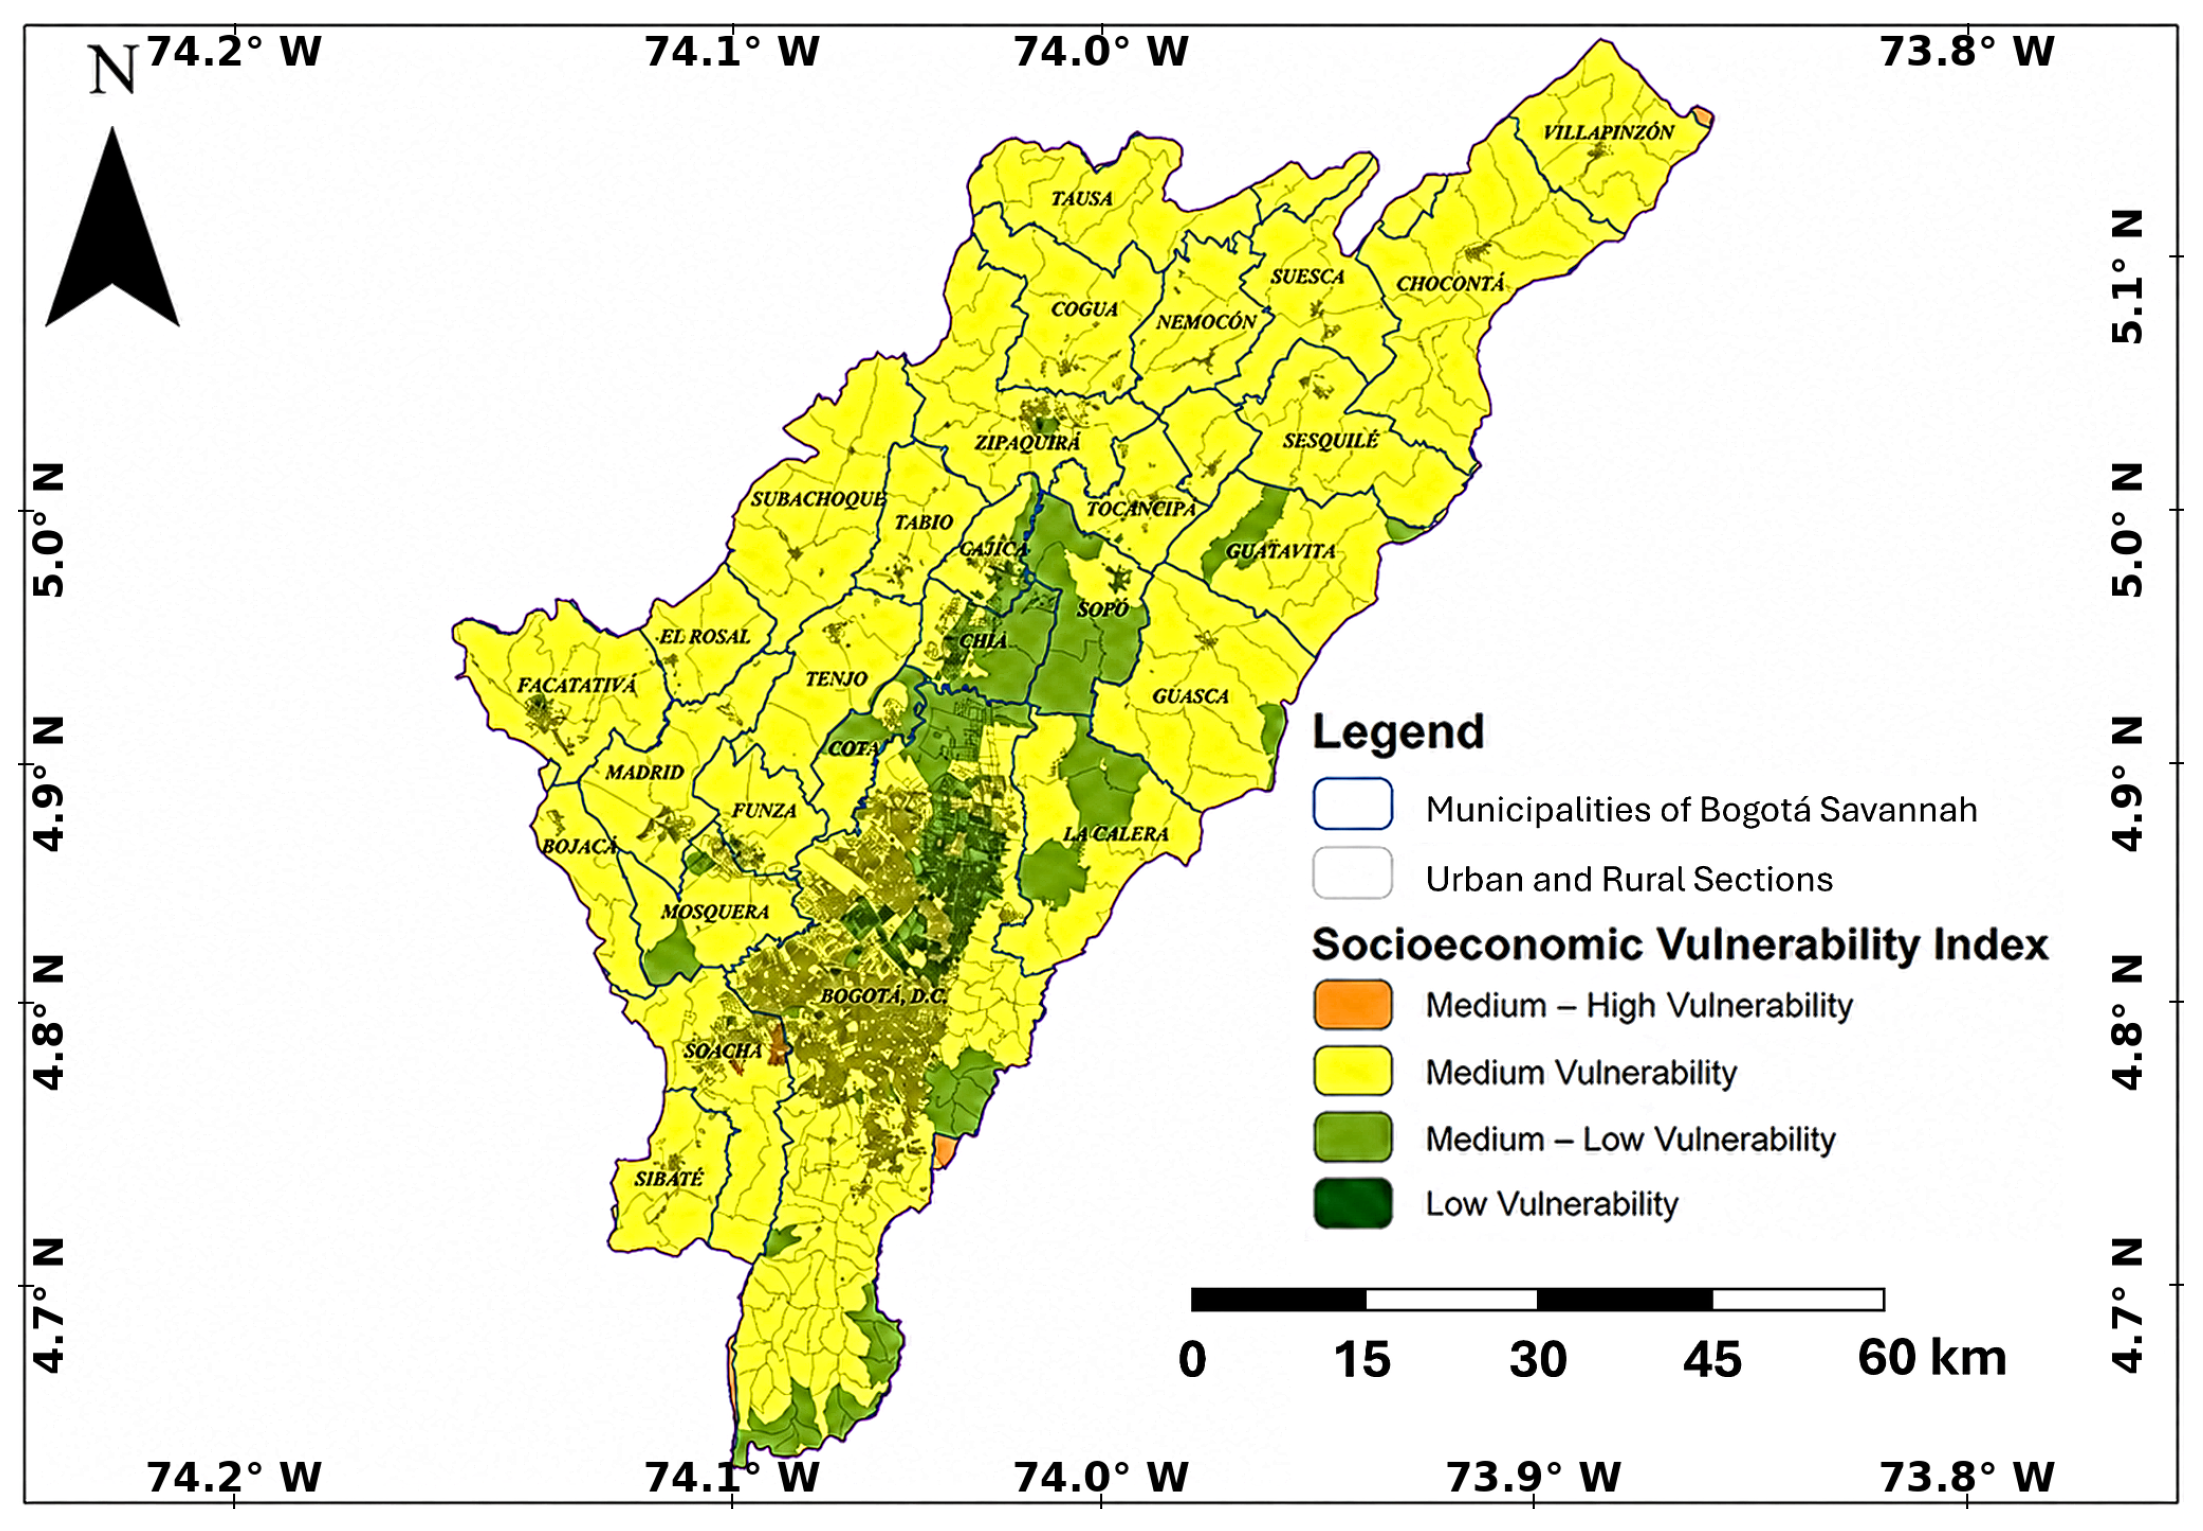
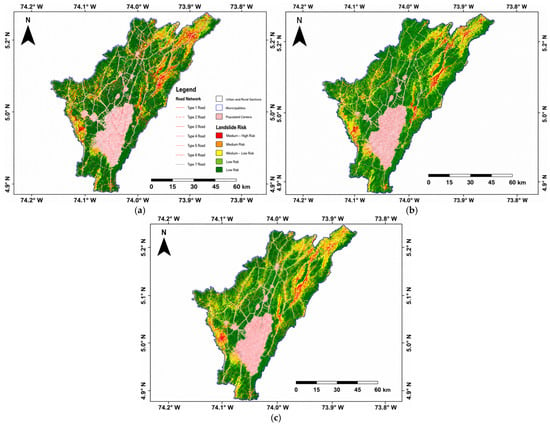
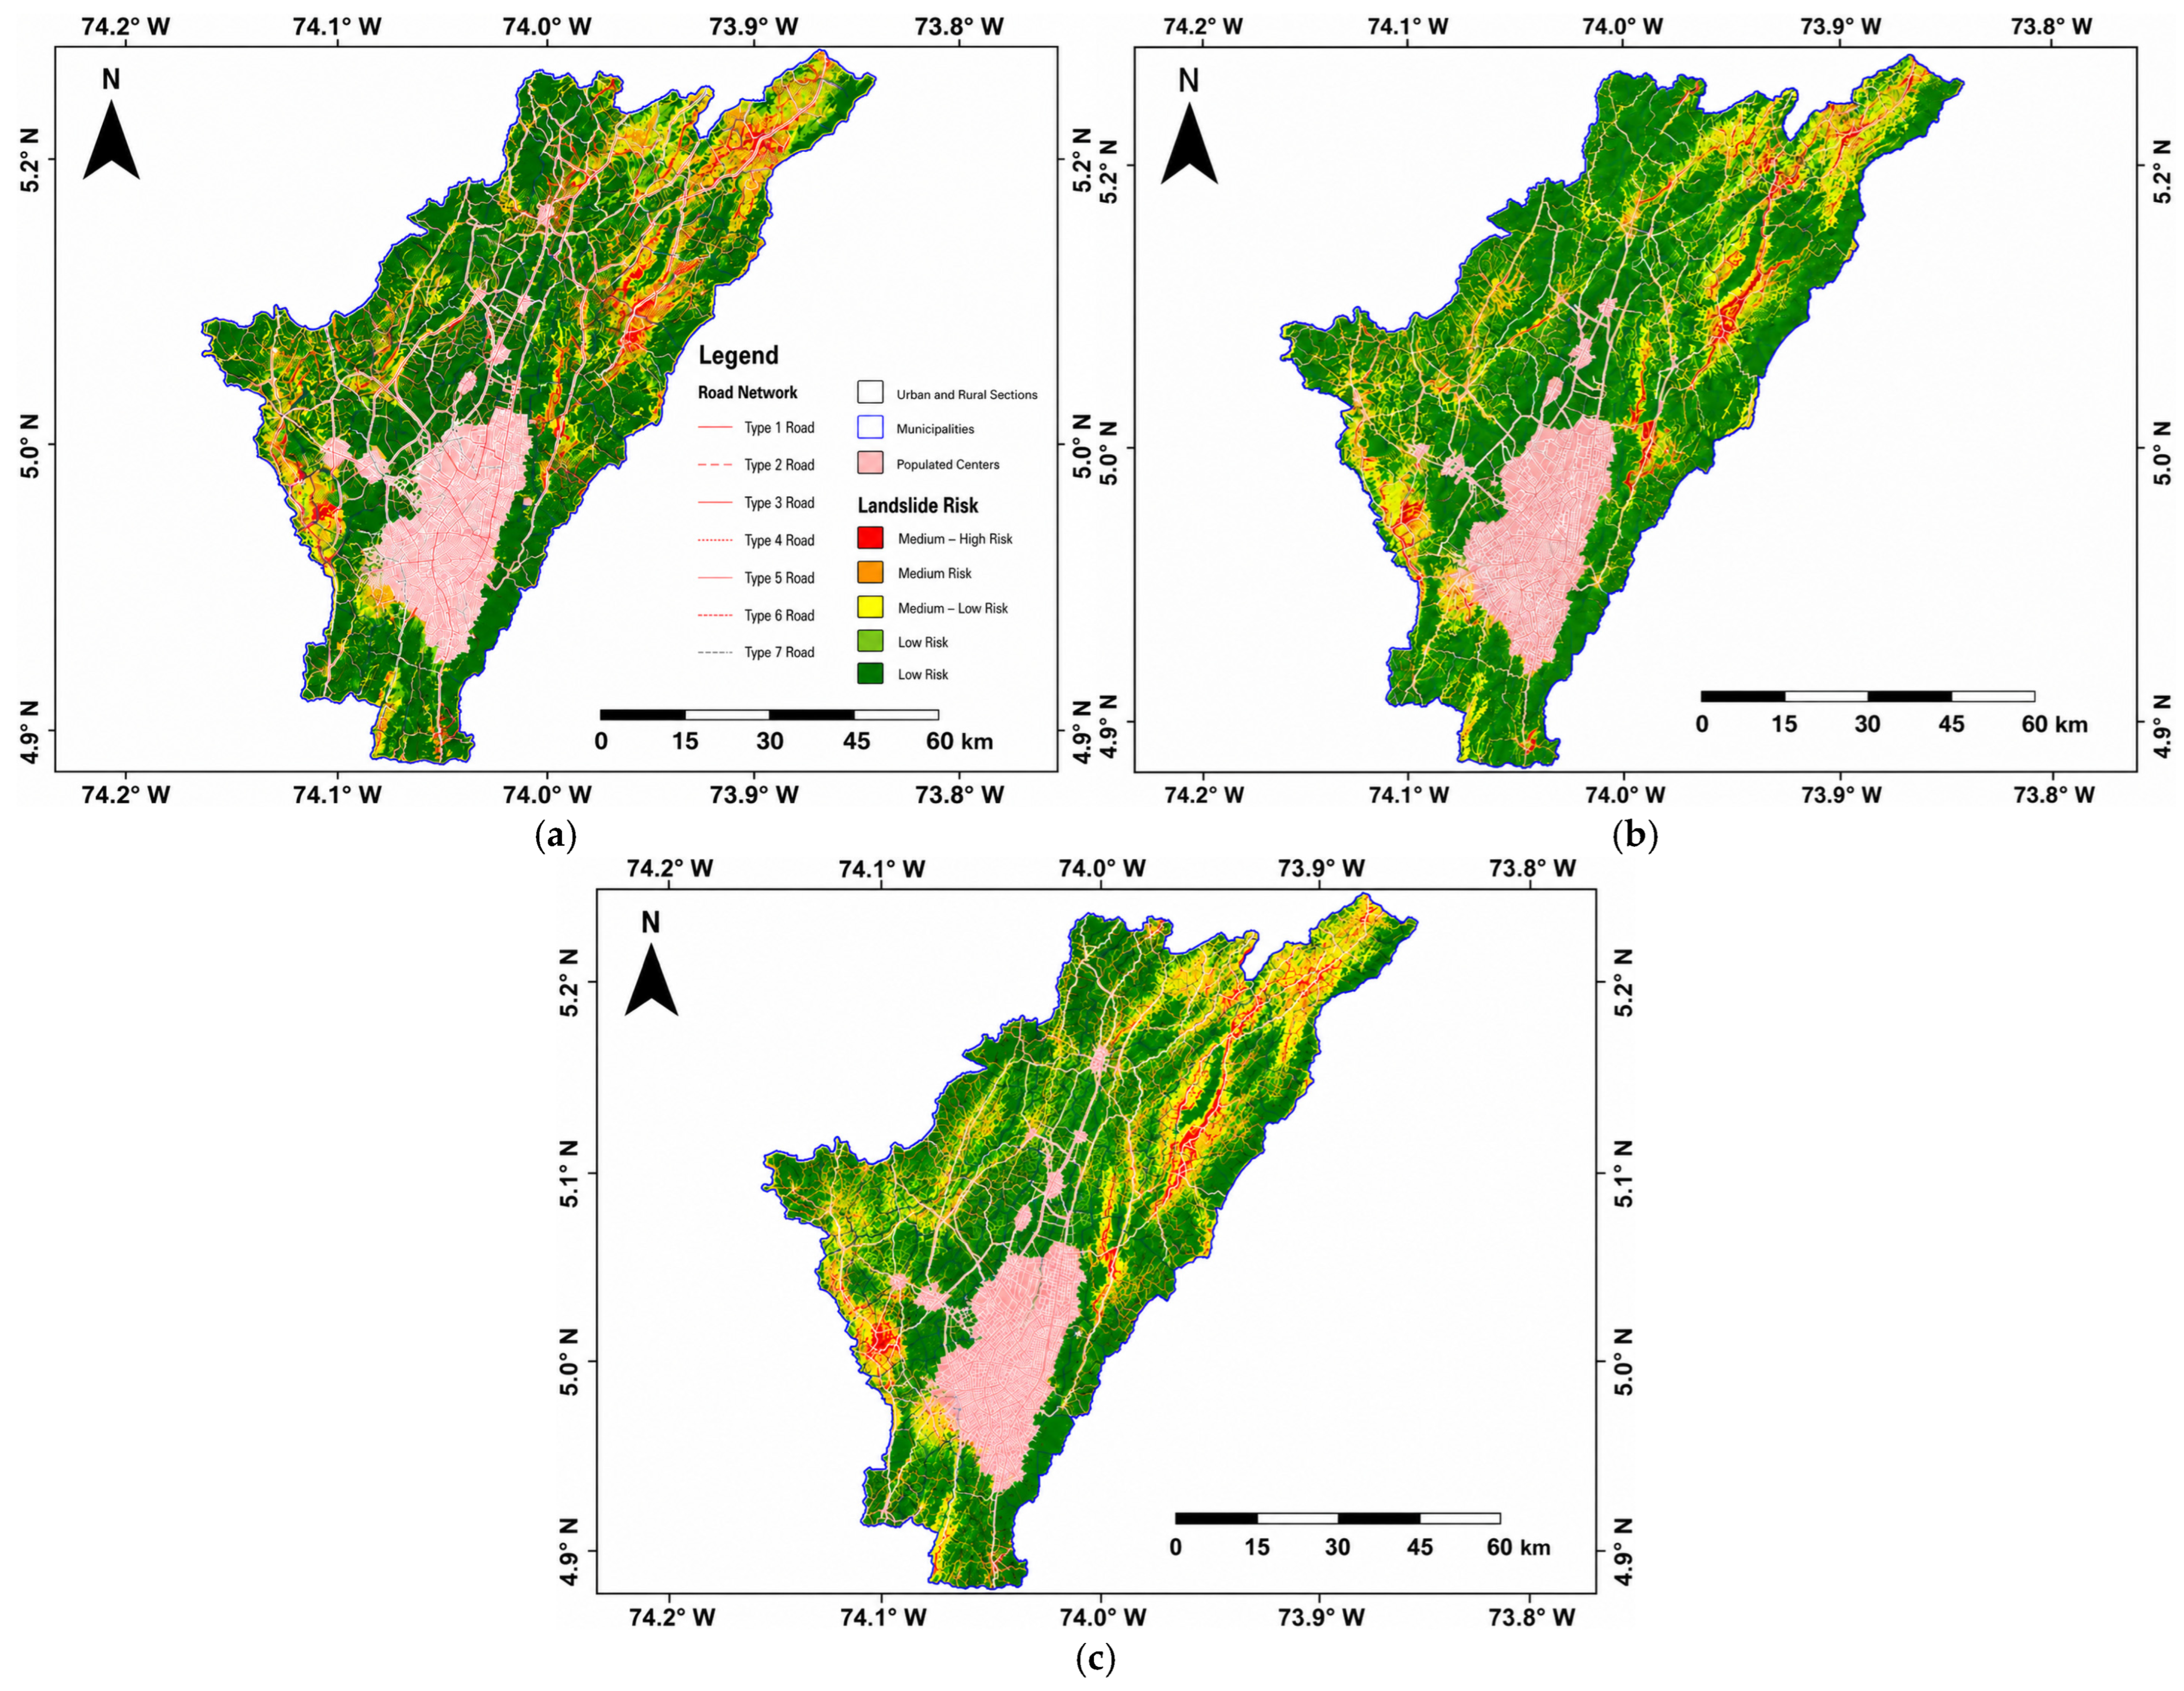
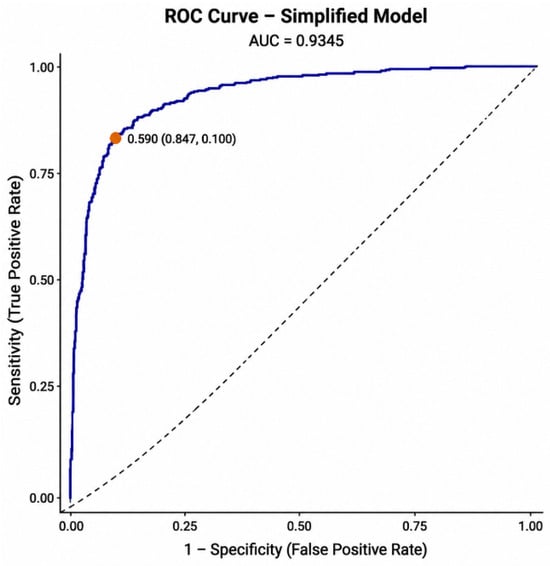
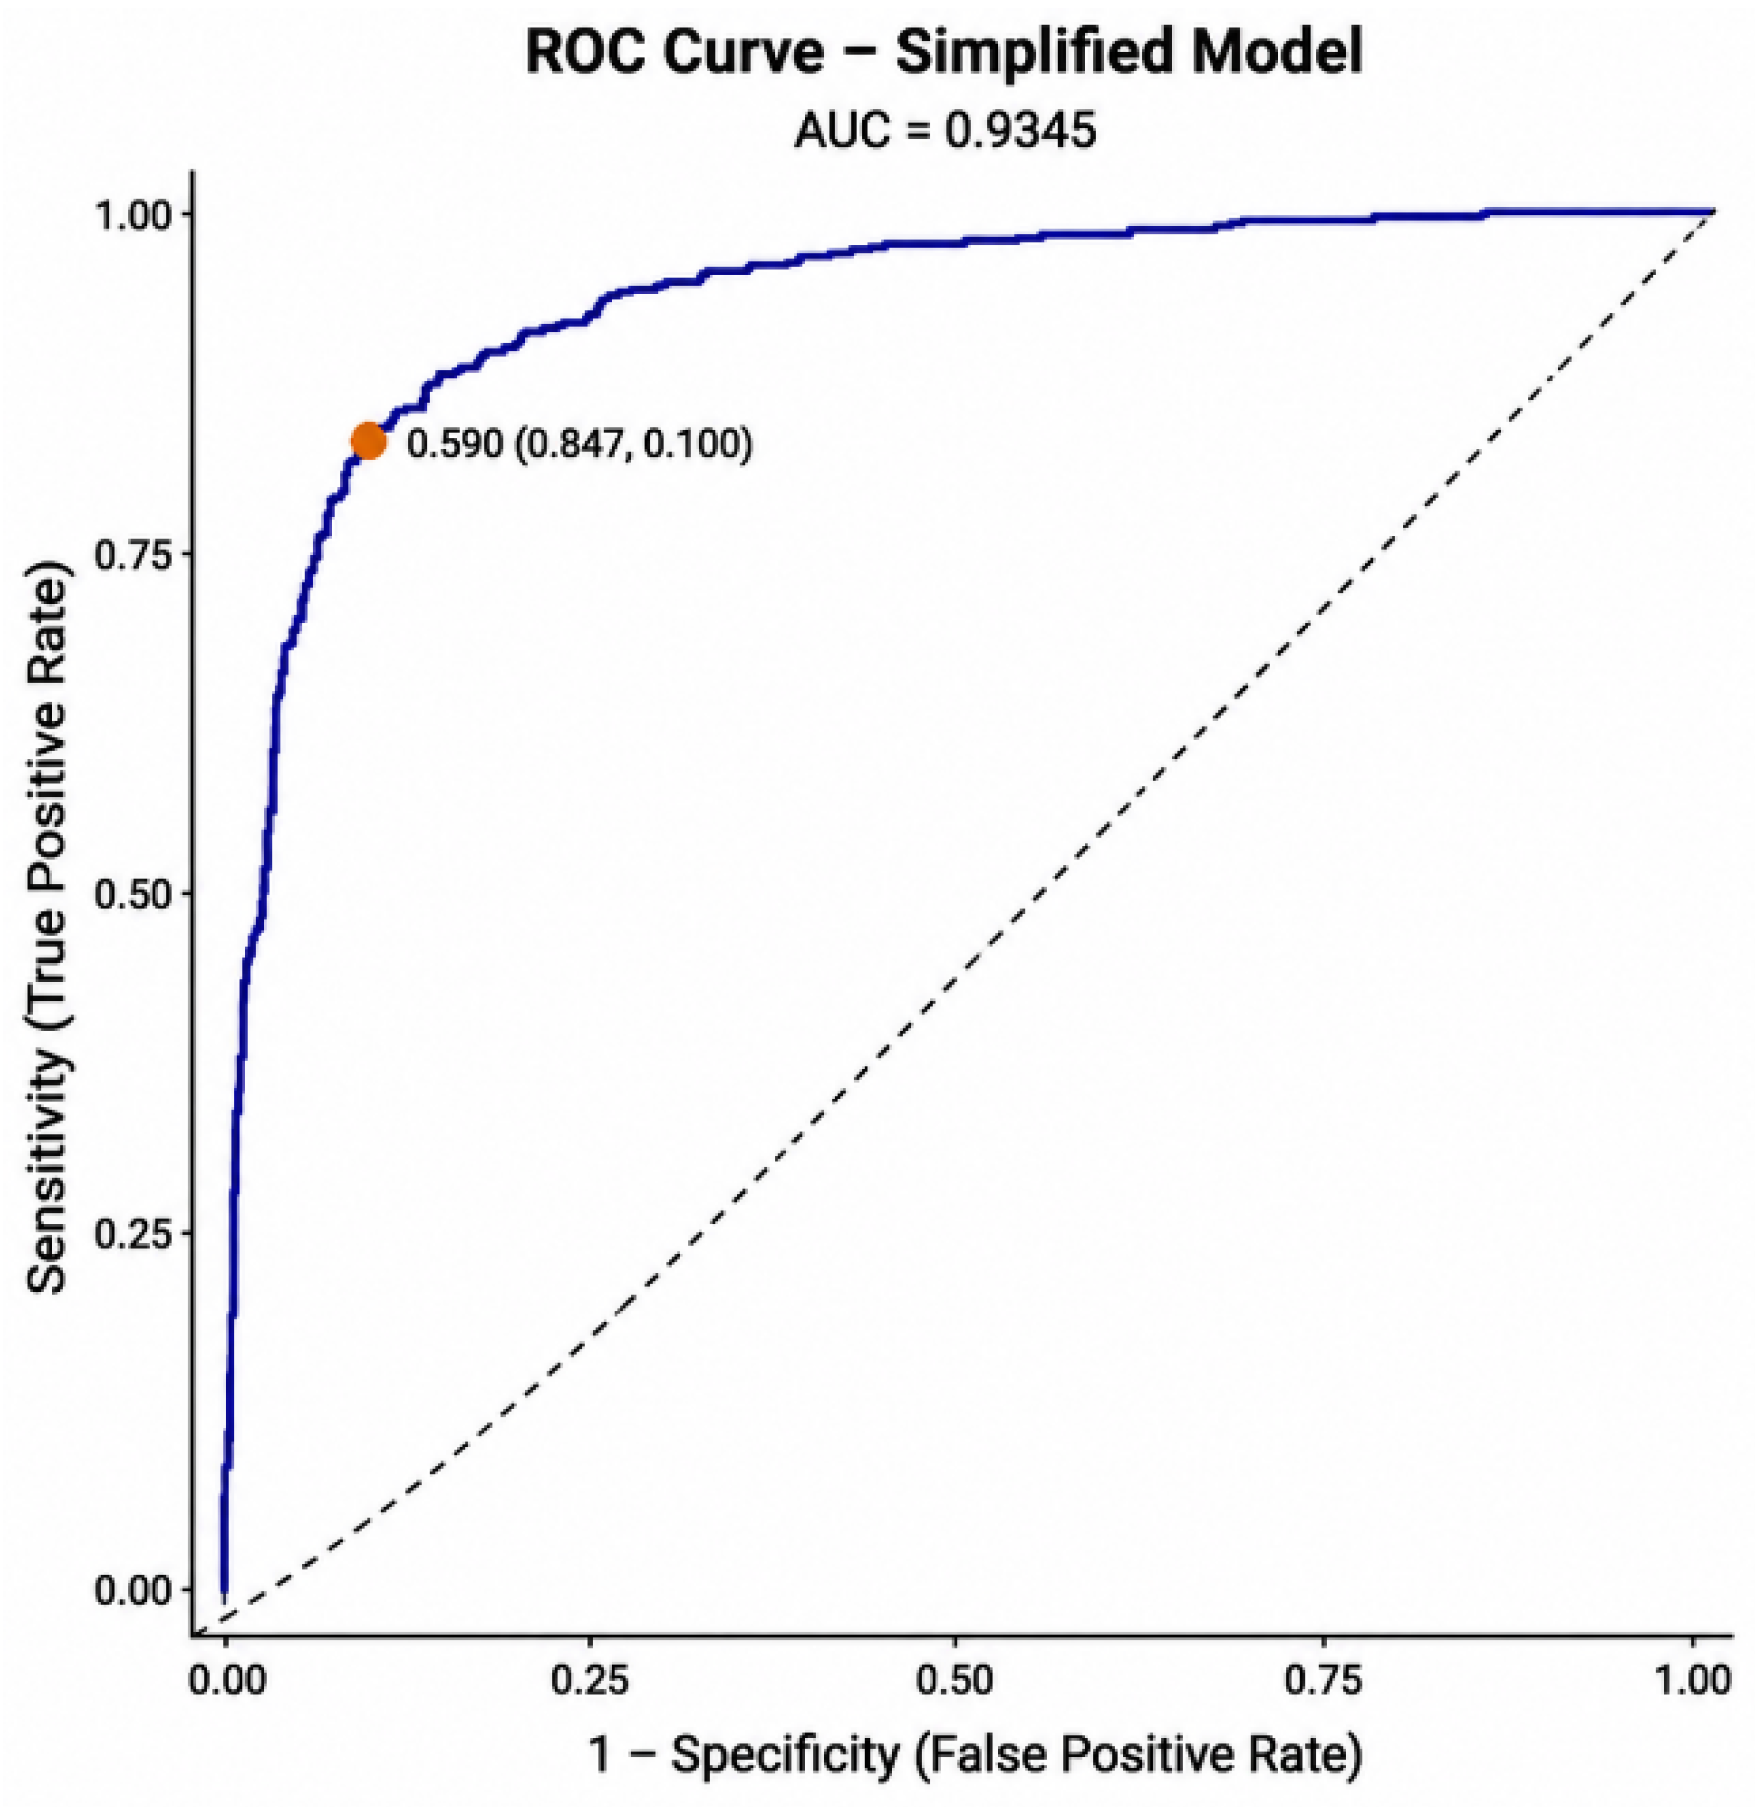
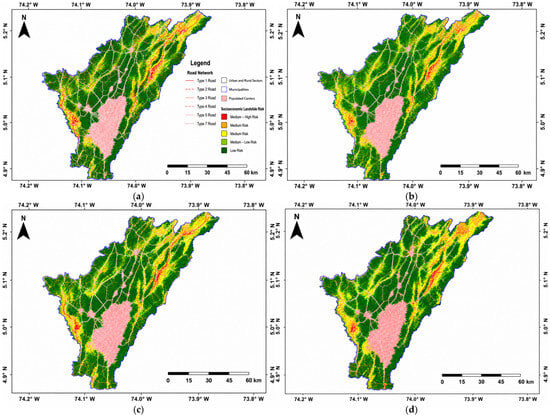
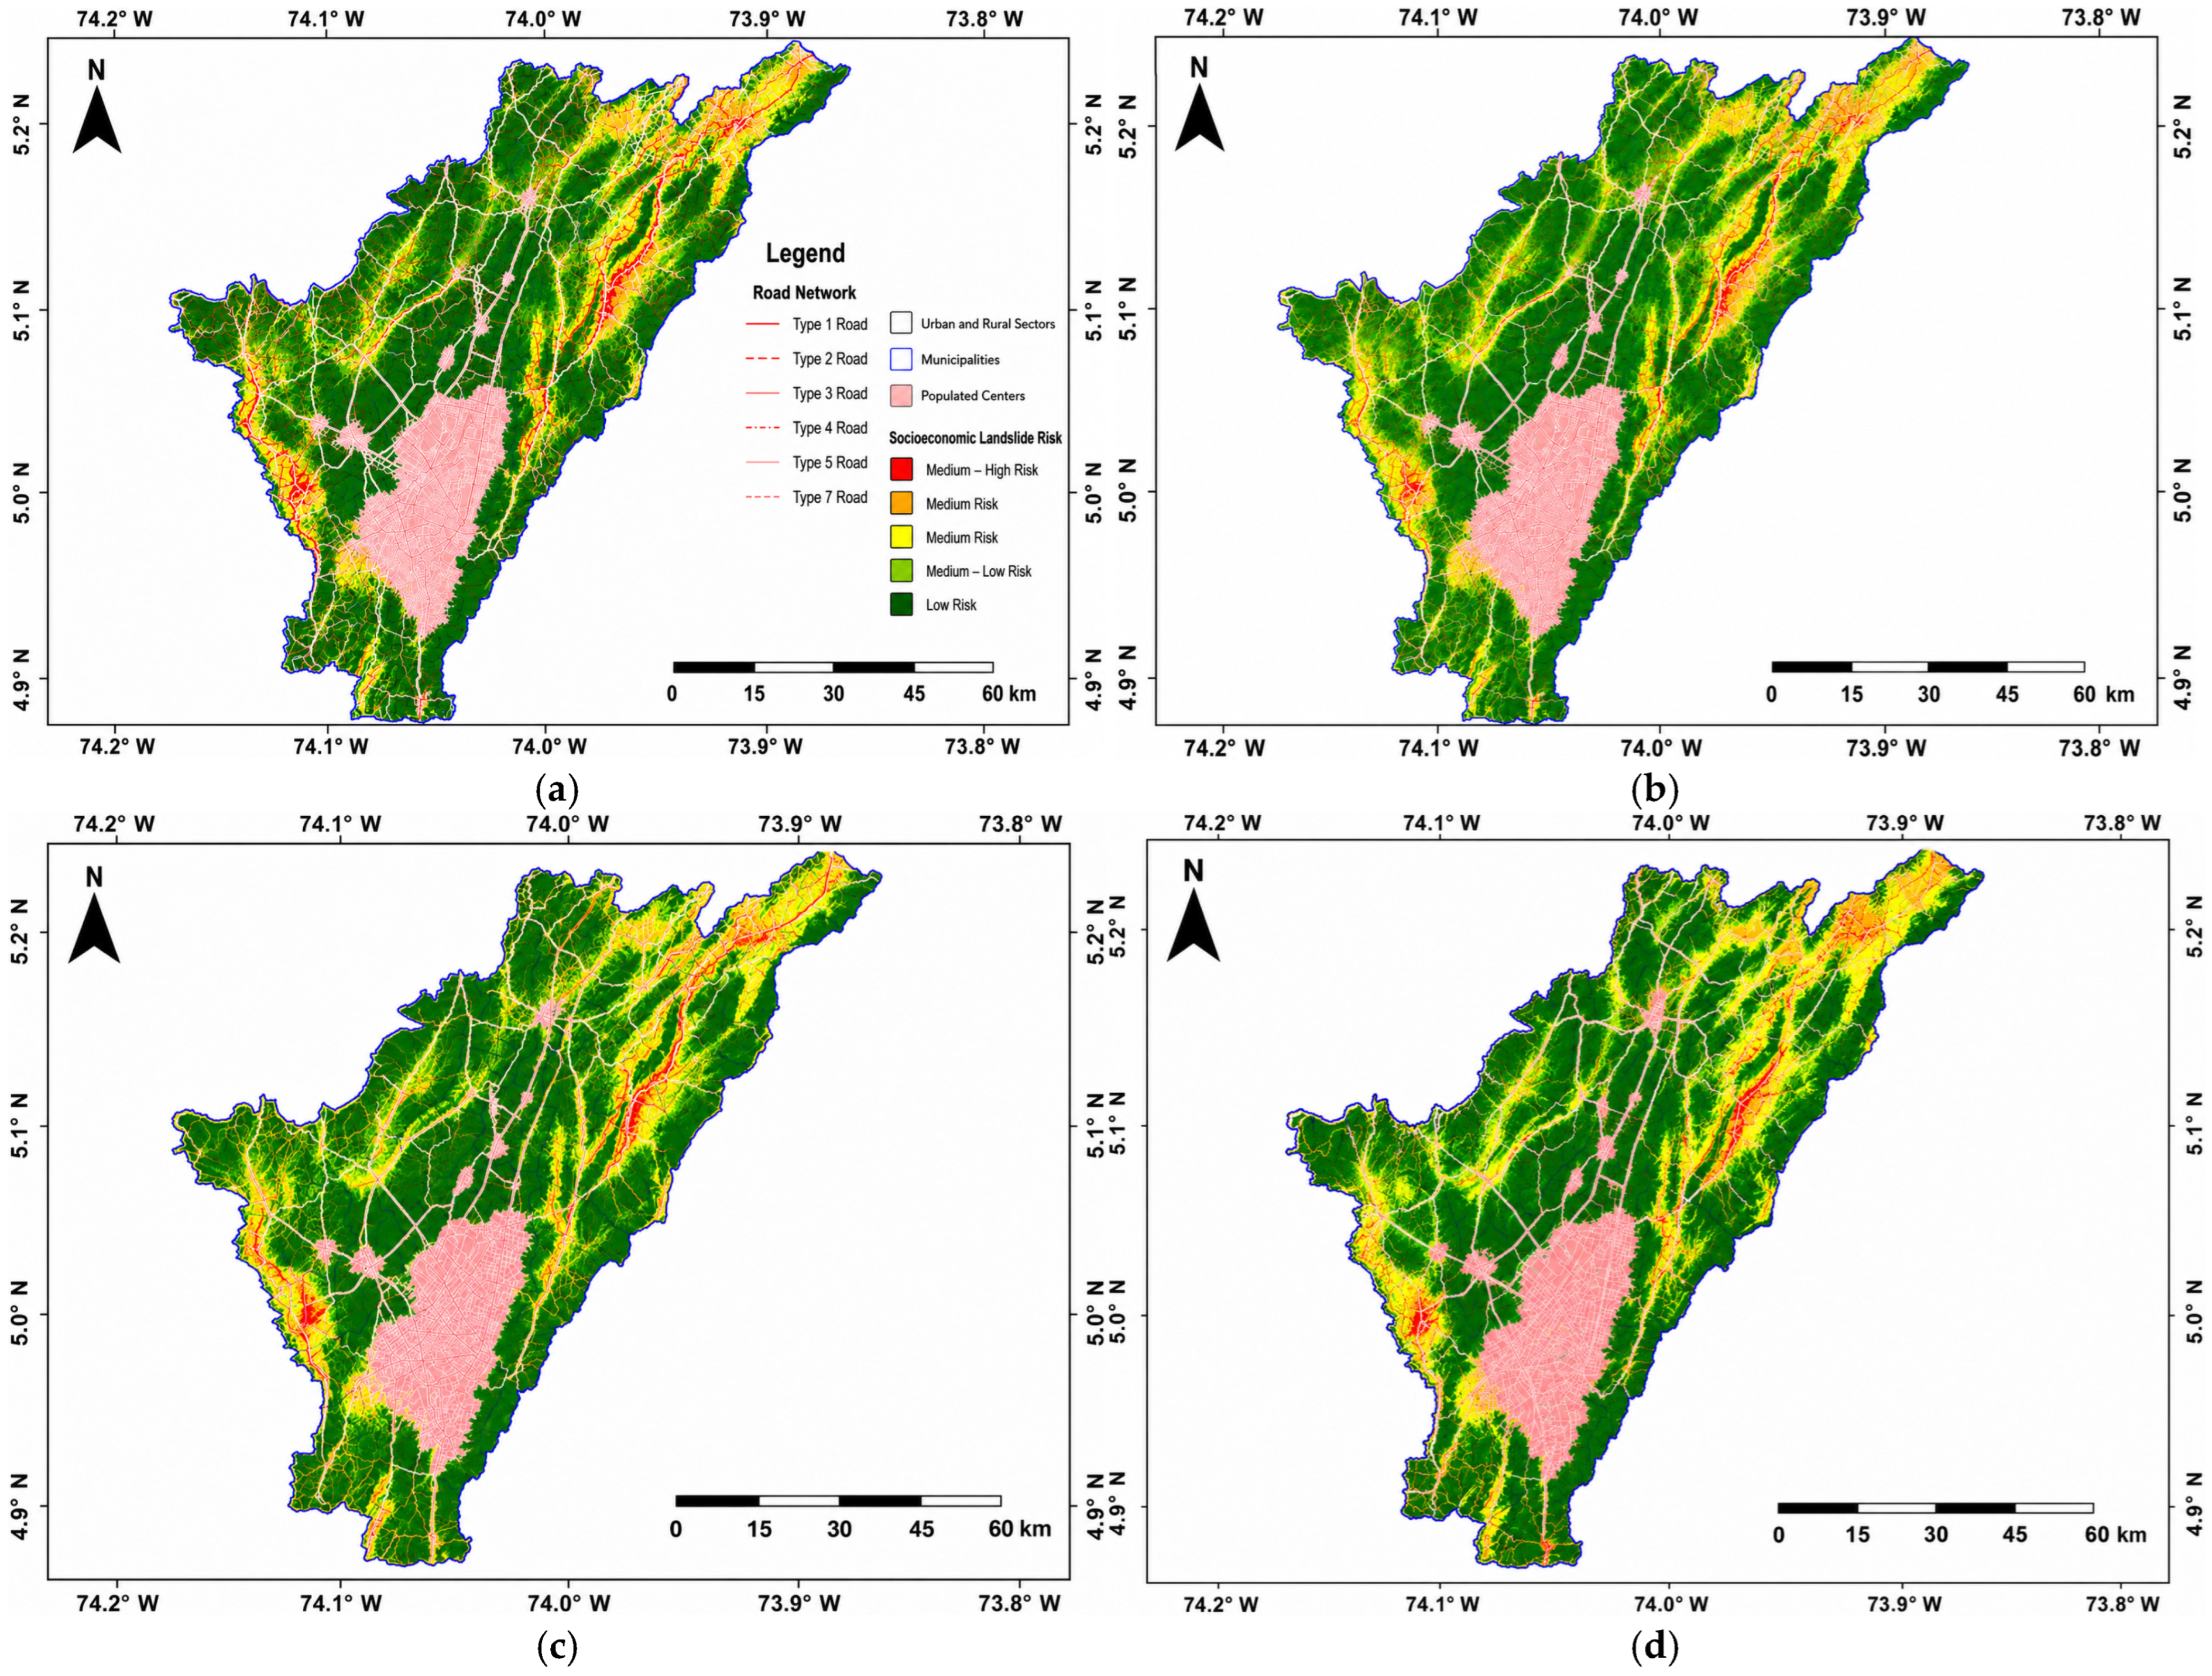

Disclaimer/Publisher’s Note: The statements, opinions and data contained in all publications are solely those of the individual author(s) and contributor(s) and not of MDPI and/or the editor(s). MDPI and/or the editor(s) disclaim responsibility for any injury to people or property resulting from any ideas, methods, instructions or products referred to in the content. |
© 2026 by the authors. Licensee MDPI, Basel, Switzerland. This article is an open access article distributed under the terms and conditions of the Creative Commons Attribution (CC BY) license.