Article

Seasonal Changes in Mire Surface Oscillation as an Indicator of Water Storage Capacity—A Case Study of the Great Vasyugan Mire, Western Siberia


by
Yulia Kharanzhevskaya
1,2
1
Siberian Federal Scientific Centre of Agro-BioTechnologies of the Russian Academy of Sciences, Siberian Research Institute of Agriculture and Peat, Gagarin St., 3, 634050 Tomsk, Russia
2
Department of Geology and Geography, Tomsk State University, Lenin Av., 36, 634050 Tomsk, Russia
Hydrology 2026, 13(6), 162; https://doi.org/10.3390/hydrology13060162
Submission received: 26 March 2026 / Revised: 9 June 2026 / Accepted: 10 June 2026 / Published: 22 June 2026
(This article belongs to the Section Ecohydrology)

Abstract

Surface oscillation is an important mechanism for the hydrological self-regulation of mires: it prevents the attenuation of flooding by storing water during high precipitation events and snowmelt. To investigate the spatial and temporal variability in surface oscillation, we conducted monthly measurements of the surface elevation and water level at three monitoring sites in the Great Vasyugan Mire (GVM), Western Siberia, over a nine-year period (2017–2025). Surface oscillation in the GVM varied from 14 to 25 cm in winter and early spring as a result of frost heaving, and from 2 to 16 cm in the frost-free period. Surface oscillation depends on the water table level variation, which is disturbed when the water level rises above the surface during freezing–thawing periods and due to released biogenic gases. Our data showed that within large mire systems, such as the Great Vasyugan Mire, the spatial variability in surface oscillation is influenced by several key factors: the type of plant community, peat properties, and the location relative to water flow pathways. Surface oscillation increased along a transect extending from the sedge–Sphagnum community to the pine–dwarf shrub–Sphagnum community, which runs parallel to the slope toward the marginal area. Long-term records demonstrate an increasing trend in surface elevation in the central part of the GVM, while showing a decrease at the mire boundary.

1. Introduction

Mires are common in many regions of the Earth and play an important role in water and biogeochemical cycles [1,2,3]. Mires reduce maximum river flood levels and, due to their high water storage capacity, accumulate rainwater and spend it on evaporation [4,5]. Water table depth serves as a key indicator of water storage capacity in mires, with significant implications for streamflow formation [4], vegetation structure dynamics [6], and carbon balance assessments [7,8].
Recent climate changes [9] have affected the functioning of mires, and higher air temperatures and less precipitation have led to a decrease in water table levels and reduced potential for carbon accumulation [10,11]. This accelerates decomposition and reduces the water storage capacity of the peat deposit, and mires become carbon sources. Studies [12] have shown that, as a result of anthropogenic impacts and climate change, a decrease in water table levels and significant changes in vegetation have been observed in many peatlands in Europe and have gradually increased over the past 200–300 years. Climatic reconstructions in Western Siberia have shown the drying up of the peatland’s surface, which reflects the warming trend of recent decades and significant hydrological and plant changes, especially since the 1950s [13]. Long-term studies of the vegetation in Sphagnum bogs and their hydrological dynamics have revealed a critical depth of the water level for vegetation functioning, ranging from 8 to 18 cm [14]. Projections for the Sphagnum peatland near Frasne under IPCC RCP 4.5 and 8.5 indicate stable water table levels (WTLs) until 2050, followed by seasonal declines driven by more frequent summer and autumn droughts after 2050 [15]. A change in the vegetation cover will lead to a change in the amount of evaporation, the characteristics of runoff from bogs and, as a consequence, the water balances in the territories.
One of the important mechanisms by which mires can protect themselves from long periods without moisture is “mire breathing”. This describes a seasonal rise and fall in the mire surface, which usually occurs with an increase and decrease in the amount of atmospheric precipitation, causing fluctuations in the water table levels within the acrotelm [16,17,18]. As the water table level rises, the peat expands to hold more water. When water table levels drop in summer, the peat shrinks and the mire surface sinks, keeping the Sphagnum mosses in close contact with groundwater [17,19]. On the other hand, this mechanism impedes the attenuation of flooding by storing water during high precipitation events [20]. Studies show that 60% of the total water budget is caused by storage changes in the upper 40 cm of the bog and 40% by swelling/shrinking in the layers below [21]. According to the data [18], the variation in water levels in mires is reduced by 26–52% due to surface oscillation. Therefore, the study of fluctuations in the surfaces of the mires is very important for understanding these mire hydrological functions and the mechanisms of their self-regulation in the context of mire–river interaction.
A number of researchers [17,18,22,23,24,25,26,27] have noted that peat is a highly compressible medium, and its surface level changes in response to shifts in water storage, entrapped gas volume, and ice expansion. Studies have shown that mire surface oscillation depends on water level fluctuations and can be determined by the processes of buoyancy, compression, and the shrinkage and swelling of the upper peat layer, which are determined by its physical properties (e.g., the peat’s bulk density, degree of decomposition, and botanic composition), which depend on the types of plant communities, the thickness of the peat deposit, and the position of the study site relative to the peat edge, as well as the degree of anthropogenic disturbance of the mire.
There is information available on mires’ surface oscillation in New Zealand, Canada, and the USA, while data on mires in Western Siberia are not available. It has been noted that disturbed mires are characterized by more significant fluctuations in the bog surface due to a larger amplitude of water level fluctuations, which indicates a decrease in water storage capacity [17]. It is shown in [26] that disturbed areas subjected to peat extraction are characterized by greater surface oscillation than undisturbed sites, which is due to the fact that during peat extraction and drainage, the structure of peat changes, which leads to a decrease in porous space and the ability to swell, which means a decrease in the moisture content of the peat. In undisturbed areas, the surface variation, therefore, has less to do with the peat swelling process.
The annual peat surface oscillation (the difference between the maximum and minimum surface elevation) for a poor fen in New Zealand ranged from 3.2 to 28 cm (mean = 14.9 cm) [18]. The multi-year averages of surface oscillation for different sites (harvested, unharvested, and undisturbed unharvested sites) in the Burns Bog in Canada ranged from 2 to 34 cm and averaged 10.8 cm [17]. Studies conducted at the bog–fen complex within the Red Lake Peatlands in northern Minnesota showed surface changes in the range of 3.8 to 25.3 cm [27]. Studies carried out on the open poor fen in Canada within different peatland microforms (ridges and lawns) showed that the seasonal amplitude in the peat surface oscillation varied from 2 to 9 cm [28]. Thus, mire surface oscillation has been studied in many works; however, there are no unambiguous conclusions about the factors that determine the surface oscillation (SO) at the level of individual mires and what roles the type of plant community and the thickness of the peat deposit play in this. There is also no information on the influence of hydrometeorological conditions.
The purpose of this work is to assess the spatial and temporal patterns of mire surface oscillation at sites located in Western Siberia. Based on these objectives, we have the following aims: (1) to determine the patterns of seasonal changes in mire surface oscillation in periods with different water content; and (2) to investigate the patterns of the spatial variation in the mire surface oscillation at the local level, depending on the type of plant community and peat depth.

2. Materials and Methods

2.1. General Description

The studies were carried out in Western Siberia (WS) within the West Siberian Plain, which is an alluvial plain located within a vast inland lowland formed after the retreat of the sea and as a result of a wide and long wandering of large rivers [29]. The study area is located within the West Siberian plate, in the geological structure in which the basement and the loose Mesozoic–Cenozoic cover are distinguished [30]. The thickness of loose sedimentary rocks in the Mesozoic–Cenozoic cover is on average 1–3 km [31,32]. The relief within the study area is predominantly flat-topped, gently sloping, and turns into a flat plain in water divide areas. The territory is located within the Vasyugan inclined plain, which is a first-order morphostructure, with absolute heights from 40 to 250 m above sea level. By its genesis, the Vasyugan inclined plain is an accumulative inclined subhorizontal plain. In the second half of the Quaternary, the Vasyugan plain underwent waterlogging, peat formation, and partial erosional dissection. The surface of the plain is composed of troughs of ancient runoff, ridged relief, and all kinds of depressions filled with peat [33]. The climate in WS is continental, with long, cold winters and short, hot summers; the average temperature for the period 1970–2025, according to All-Russian Research Institute of Hydrometeorological Information—World Data Center (RIHMI-WDC, http://meteo.ru/), is 0.26 °C. The mean annual precipitation is 492 mm (about 30% falling as snow), and the mean annual runoff in the nearby Bakchar River is 72 mm [34].

2.2. Site Description

The studies in WS were conducted in the northeastern pristine part of the Great Vasyugan Mire (GVM) within the area near Polynyanka Village in the Tomsk region of Russia (200 km northwest of Tomsk City) (Figure 1). The GVM is a huge mire complex with a total area of 55,051 km2 [35], whose formation started 10.000 years ago as a result of the combination of many small mires. This study was conducted in typical Western Siberian pine–dwarf shrub–Sphagnum (P2 and P3 key sites) and sedge–Sphagnum communities (P5 key site) [36]. The points are located parallel to the main slope of the surface in the form of a transect 1500 m long from the border and towards the center of the northeastern part of the GVM, which is located between the Bakchar and Iksa rivers (Middle Ob watershed). The P2 site (56°58′15.3″ N, 82°36′09.7″ E) is located on the outskirts of the mire, which is dominated by Pinus sylvestris, Ledum palustre, Chamaedaphne calyculata and Sphagnum angustifolium; the peat deposit is at about 1 m depth. The height of the tree layer is 8–9 m.
The P2 site deposit up to 15 cm is composed of Sphagnum peat, with a bulk density of 0.09 g/cm3. From 20–35 cm, the peat type changes to oligotrophic grassy peat, then transitions to mesotrophic woody peat, and the bulk density decreases by up to 0.07 g/cm3. From a depth of 35 cm, the eutrophic woody-sedge peat occurs with an average bulk density of 0.19 g/cm3. The largest area in the P3 site (56°58′24.3″ N, 82°36′41.2″ E) is dominated by Pinus sylvestris, Ledum palustre, Chamaedaphne calyculata, Andromeda polifolia, and Sphagnum fuscum, and the peat depth is 2.85 m. The height of the tree layer is 2–3 m. In the upper part and up to a depth of 120 cm, the peat deposit is composed of Sphagnum peat with a bulk density of 0.06 g/cm3, which increases to 0.11 g/cm3 in the lower layers. Down the profile, it changes to oligotrophic grassy–moss peat, and then to transitional woody–grass peat. In the 150–285 cm layer, the deposit is composed of denser (0.24 g/cm3) eutrophic grassy, woody–grass, and grass–moss peat. The P5 site (56°58′17.3″ N, 82°37′04.5″ E) is dominated by Chamaedaphne calyculata, Andromeda polifolia, Oxycoccus microcarpus, Eriophorum vaginatum, and Carex rostrata. The moss cover is represented by Sphagnum balticum and Sphagnum divinum. The thickness of the peat deposit is 2.75 m. The upper layer of the peat deposit, up to 100 cm, is formed by Sphagnum peat, with an average bulk density of 0.05 g/cm3, while in the 30 cm layer, a decrease to 0.04 g/cm3 is noted. The 100–110 cm layer is formed by the transitional grassy–moss peat, and below and up to 275 cm lies the eutrophic woody, woody–grass, grassy, and grass–moss peat, with a bulk density of 0.22 g/cm3. The 120–140 cm layer is noteworthy, as it is characterized by a high water content and a sharp decrease in bulk density to 0.10 g/cm3 (Table 1).
P4 site (56°58′33.72″ N, 82°36′27.77″ E) is dominated by Pinus sylvestris, Ledum palustre, Chamaedaphne calyculata, Andromeda polifolia, and Sphagnum fuscum, and the peat depth is 3 m. The height of the tree layer is 2–3 m. The peat deposit in its upper part, up to a depth of 150 cm, is composed of Sphagnum peat. A thin layer of transitional woody–Sphagnum peat underlies the upper deposit, situated at the interface between the eutrophic and ombrotrophic peat strata.

2.3. Field Study

The groundwater level observations within the GVM were carried out using an autonomous differential pressure sensor (IMCES, Russia) [37] and in manual mode. Measurements of water table levels (WTLs) within the GVM were carried out at intervals of 4 h at the P2, P3, and P5 key sites. At key site P4, the WTL value was measured only in manual mode. We measured groundwater levels with piezometers built out of perforated PVC pipes with a 50 mm diameter. We installed the piezometers in the peat with the use of a Russian peat corer. We covered the perforations (8 mm holes) using a permeable geomembrane to avoid the inflow of peat particles into the piezometers. The peat thickness was assessed during the installation of each piezometer using a Russian peat sampler. Peat surface oscillations (SOs) were provided from manual measurements of the vertical distance between a metal stable mark and the peat surface and the water table level. Every site was equipped with a benchmark consisting of a woody rod set firmly into the substratum (clay). The annual SO (ASO) value was measured as the difference between the maximum and minimum surface elevation data in the year. Surface oscillation measurements started on 04.10.2017. In 2018–2021, they were carried out throughout the year with a frequency of 7–10 days (sometimes 1 month), and in 2022–2025, only during the warm period of the year, with a frequency of 1 time per month. The monitoring of surface oscillations at key site P4 was initiated on 31 July 2019. To assess the spatial variation in SOs, a cluster analysis was performed using the Ward hierarchical method with the calculation of the Euclidean distance.

3. Results

3.1. Meteorological Conditions over Time

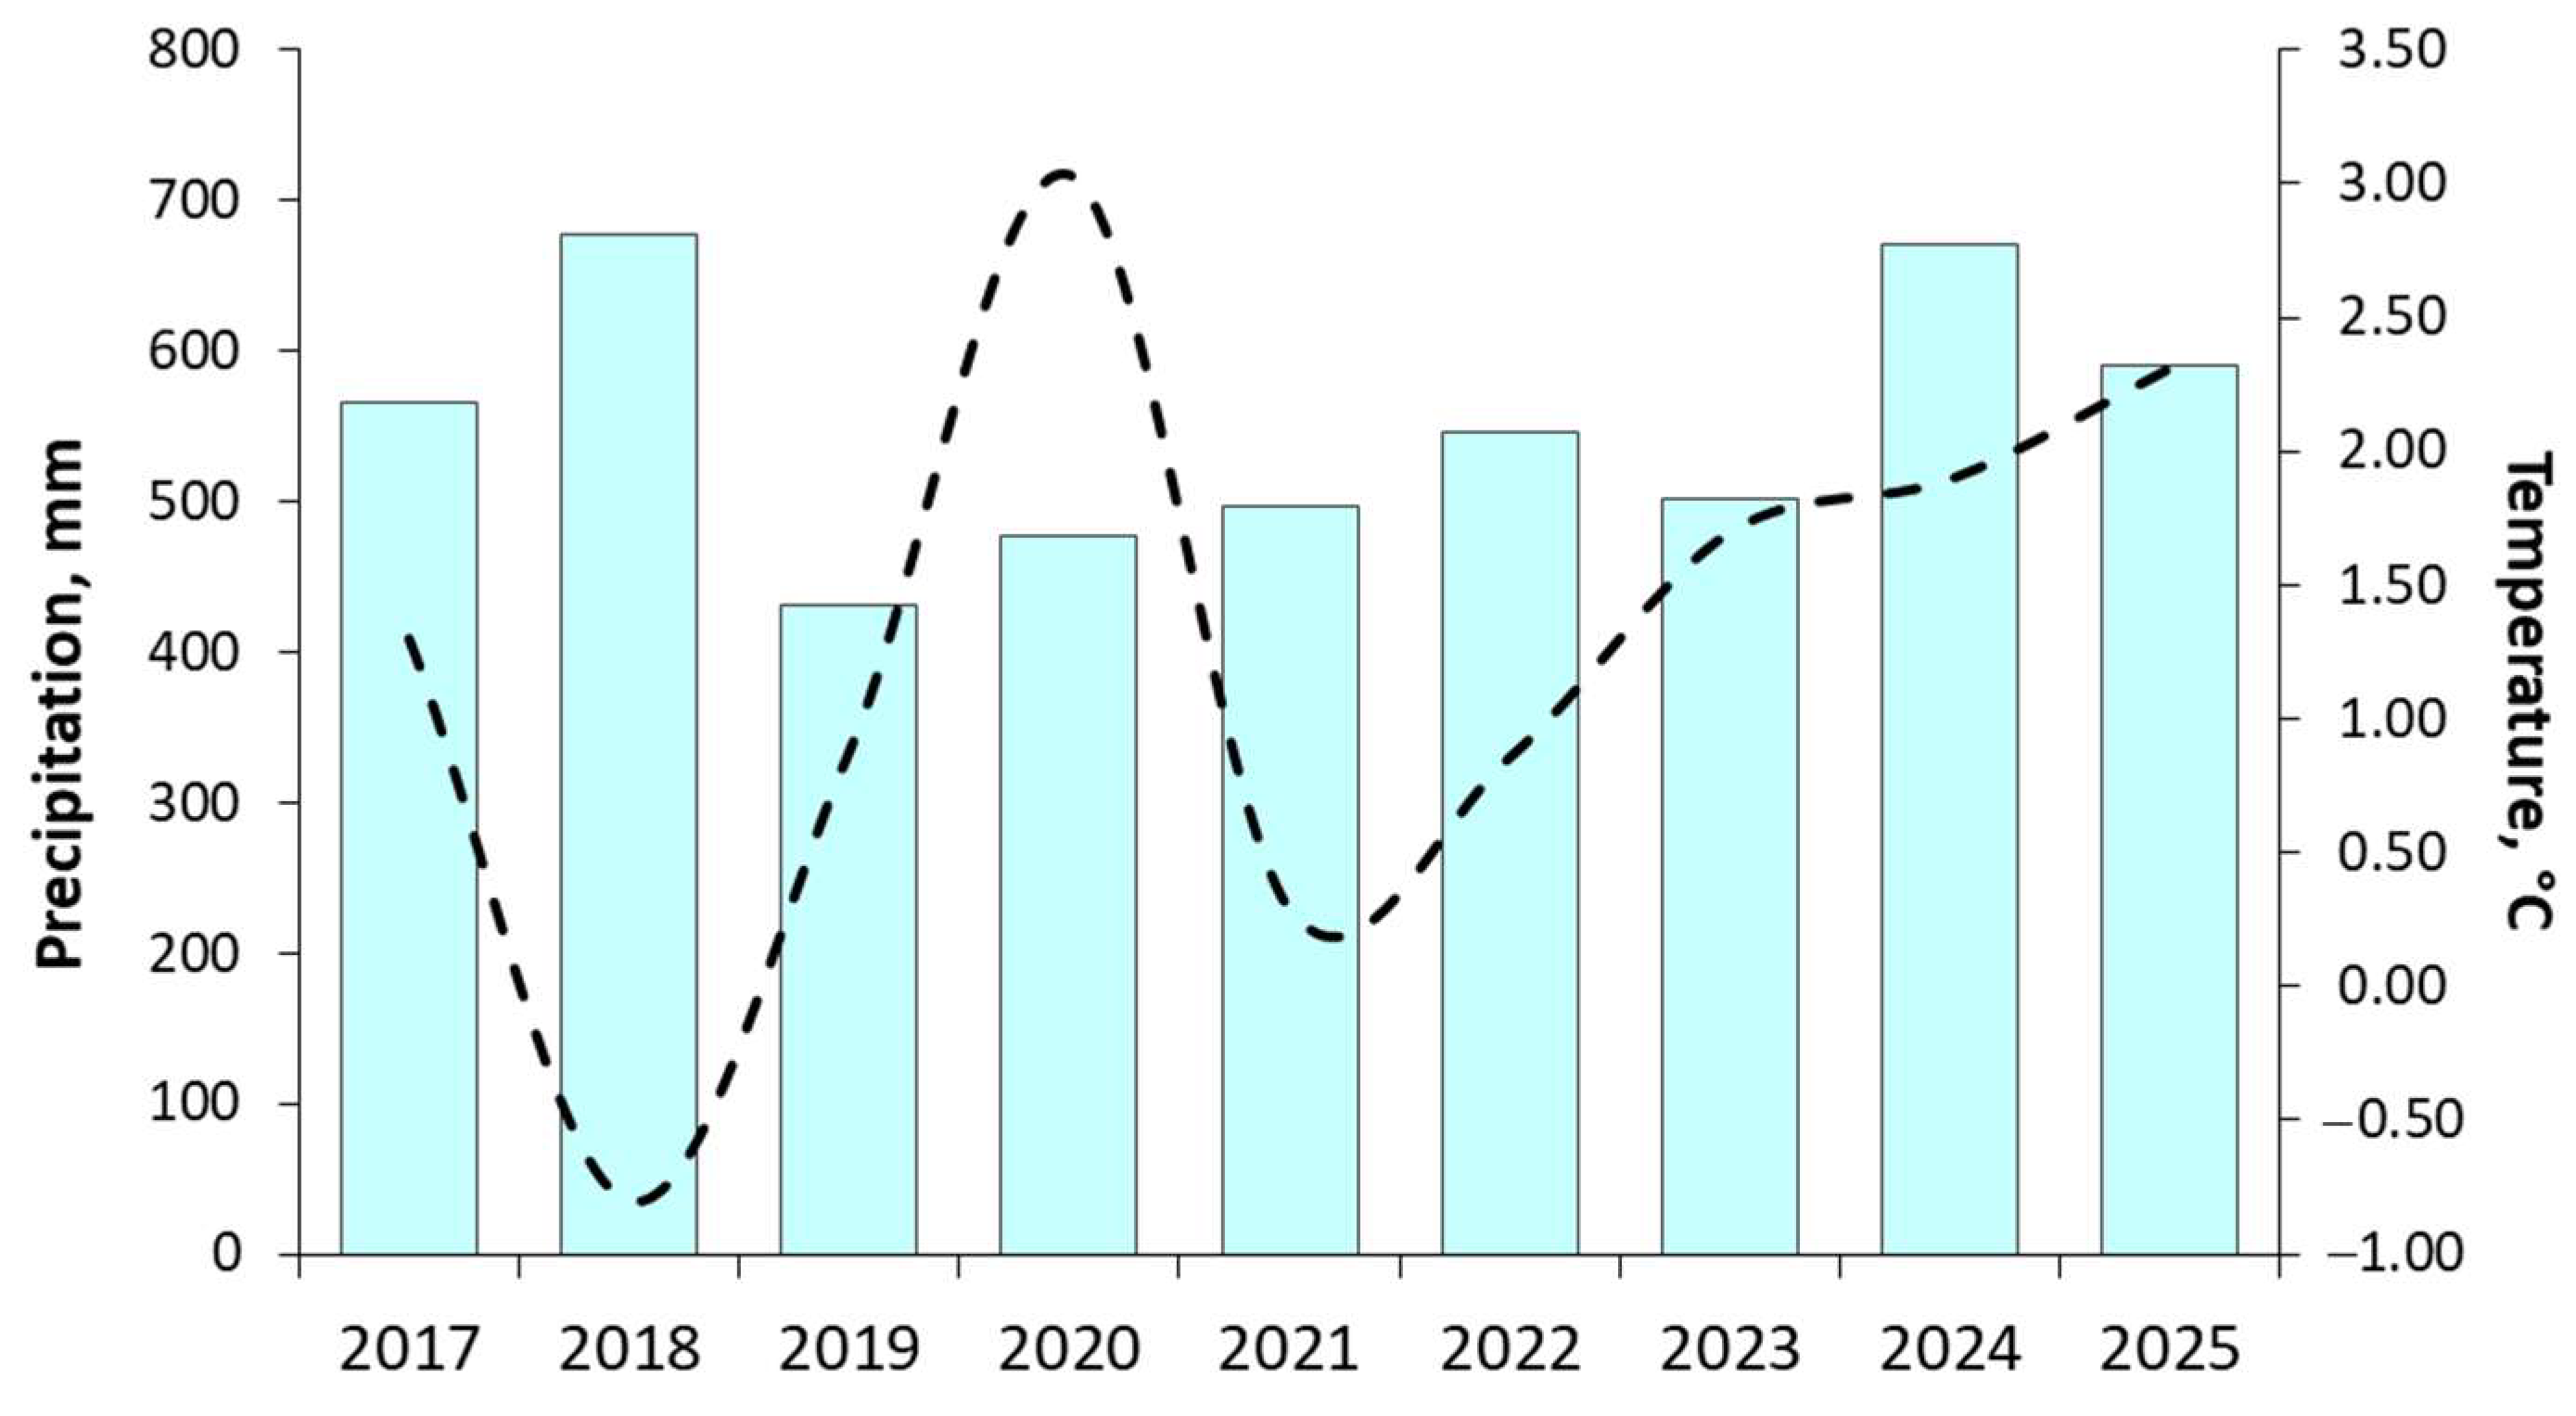
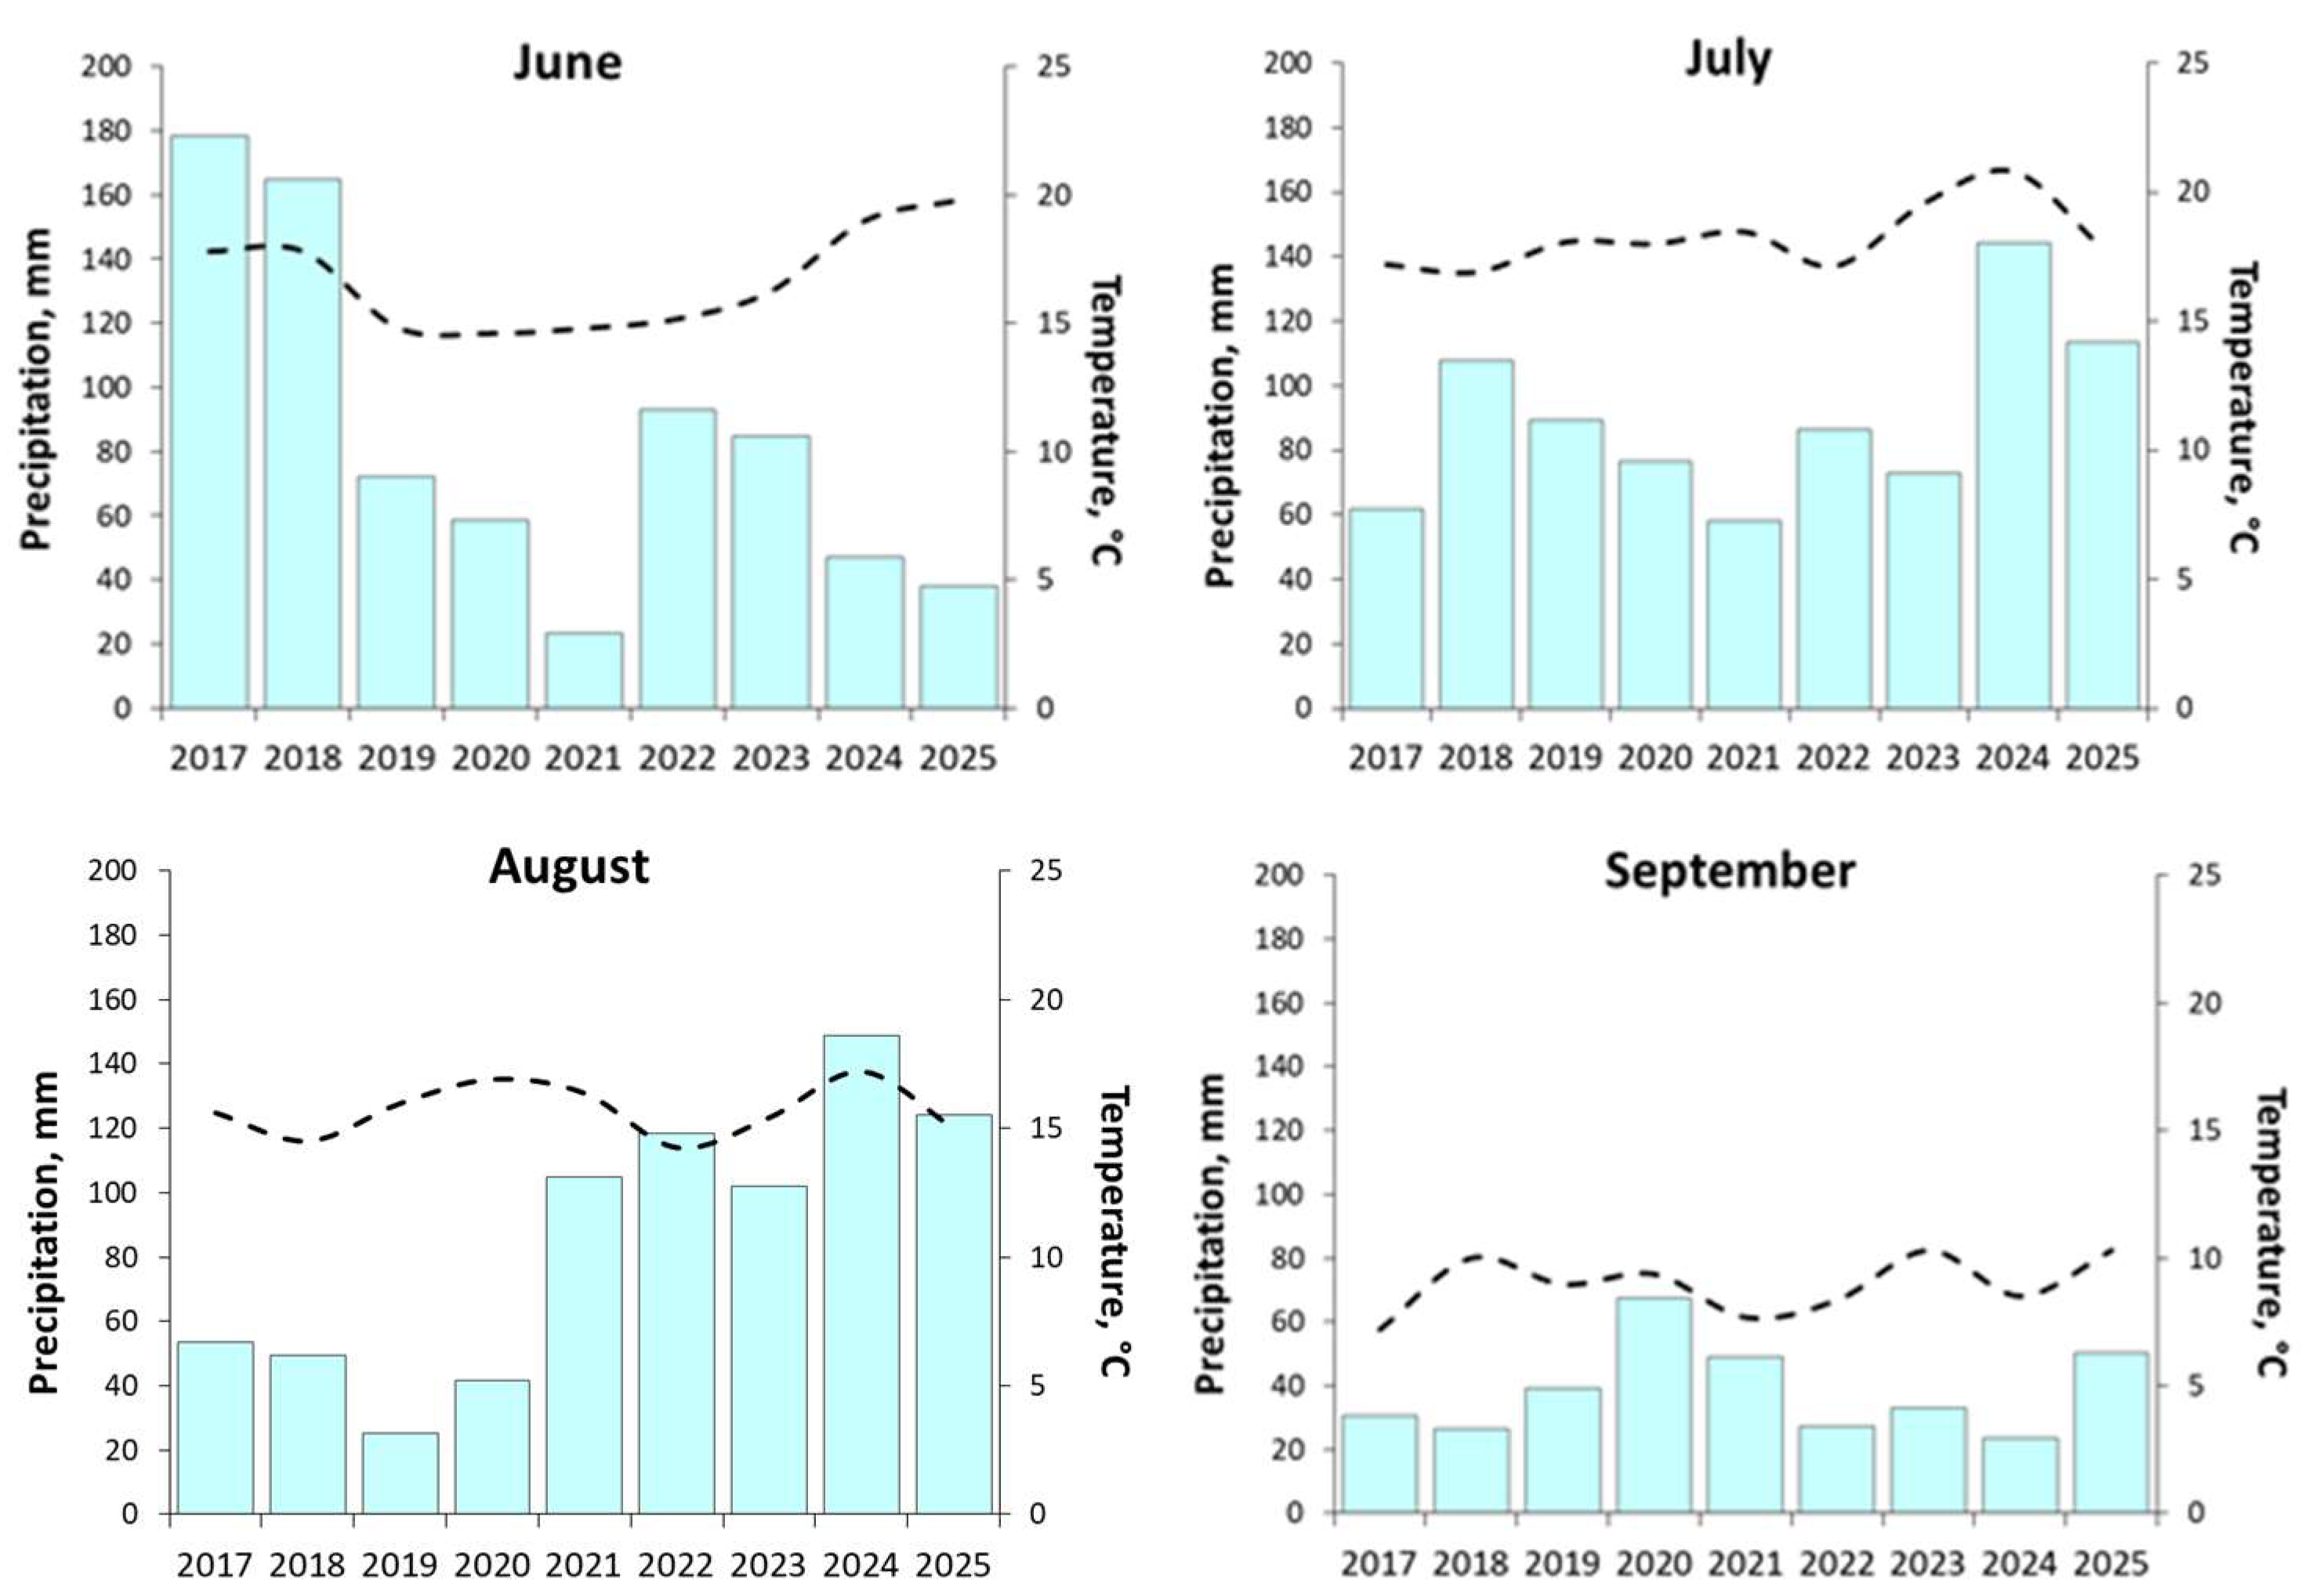
Data from a meteorological station near the village of Bakchar, taken from RIHMI-WDC (http://meteo.ru/), showed that during the study period (2017–2025), the annual amount of precipitation varied from 432 to 677 mm, and the annual average air temperature varied from −0.80 °C to 2.31 °C, and increased up to 3.03 °C in 2020. In 2018, the annual amount of precipitation was 677 mm, which was the absolute maximum over the years 1970 to 2025. In general, 2017, 2018, 2024, and 2025 were characterized by extreme summer precipitation, when 39–87 mm fell per day; they can be classified as high-water years. During the study period, monthly precipitation varied from 6 to 9 mm in February and March, and reached 144–178 mm in June and July. Since 2021, there has been a trend of increasing atmospheric precipitation in July and August (Table 2). The average monthly temperature for 2017–2025 varied from −25.1 °C to −21.3 °C in December and February, and went up to 19.8 °C and 20.8 °C during the summer season (June and July). The winter seasons of 2019–2020 and 2024–2025 were relatively mild, and the average monthly temperature in January was −11 °C (Figure 2).
The snow cover began to form in early November 2017 and lasted until mid-April, while a layer of seasonal freezing of the bog developed and reached its maximum thickness before the beginning of snow melting. In December 2017, the snow depth was 18–24 cm, and the thickness of the frozen layer was 6–8 cm. The maximum snow depth was recorded in March 2018 and was 70 cm at P2, 64 cm at P3, and 53 cm at P5. In 2018–2025, the maximum snow depth was recorded in mid-February or March and amounted to 69 cm at P2, 65 cm at P3, and 49 cm at P5. In 2025, due to early spring transition, the snow depth decreased up to 39 cm at P2, 32 cm at P3, and 12 cm at P5. The average freezing depth for the period 2018–2025 was 32 cm at P2, 25 cm at P3, and 23 cm at P5. In 2019, the freezing depth was the lowest and ranged from 13 cm at P3–P5 to 16 cm at P2. Snow melting usually starts at the beginning of April, and from the middle of April, the thawing process of the peat deposits begins. In 2018 and 2020, the frozen layer persisted until early to mid-May, while in 2019, there was a complete thawing of the peat deposit at the end of April (Table 3).

3.2. Water Table Level Fluctuation

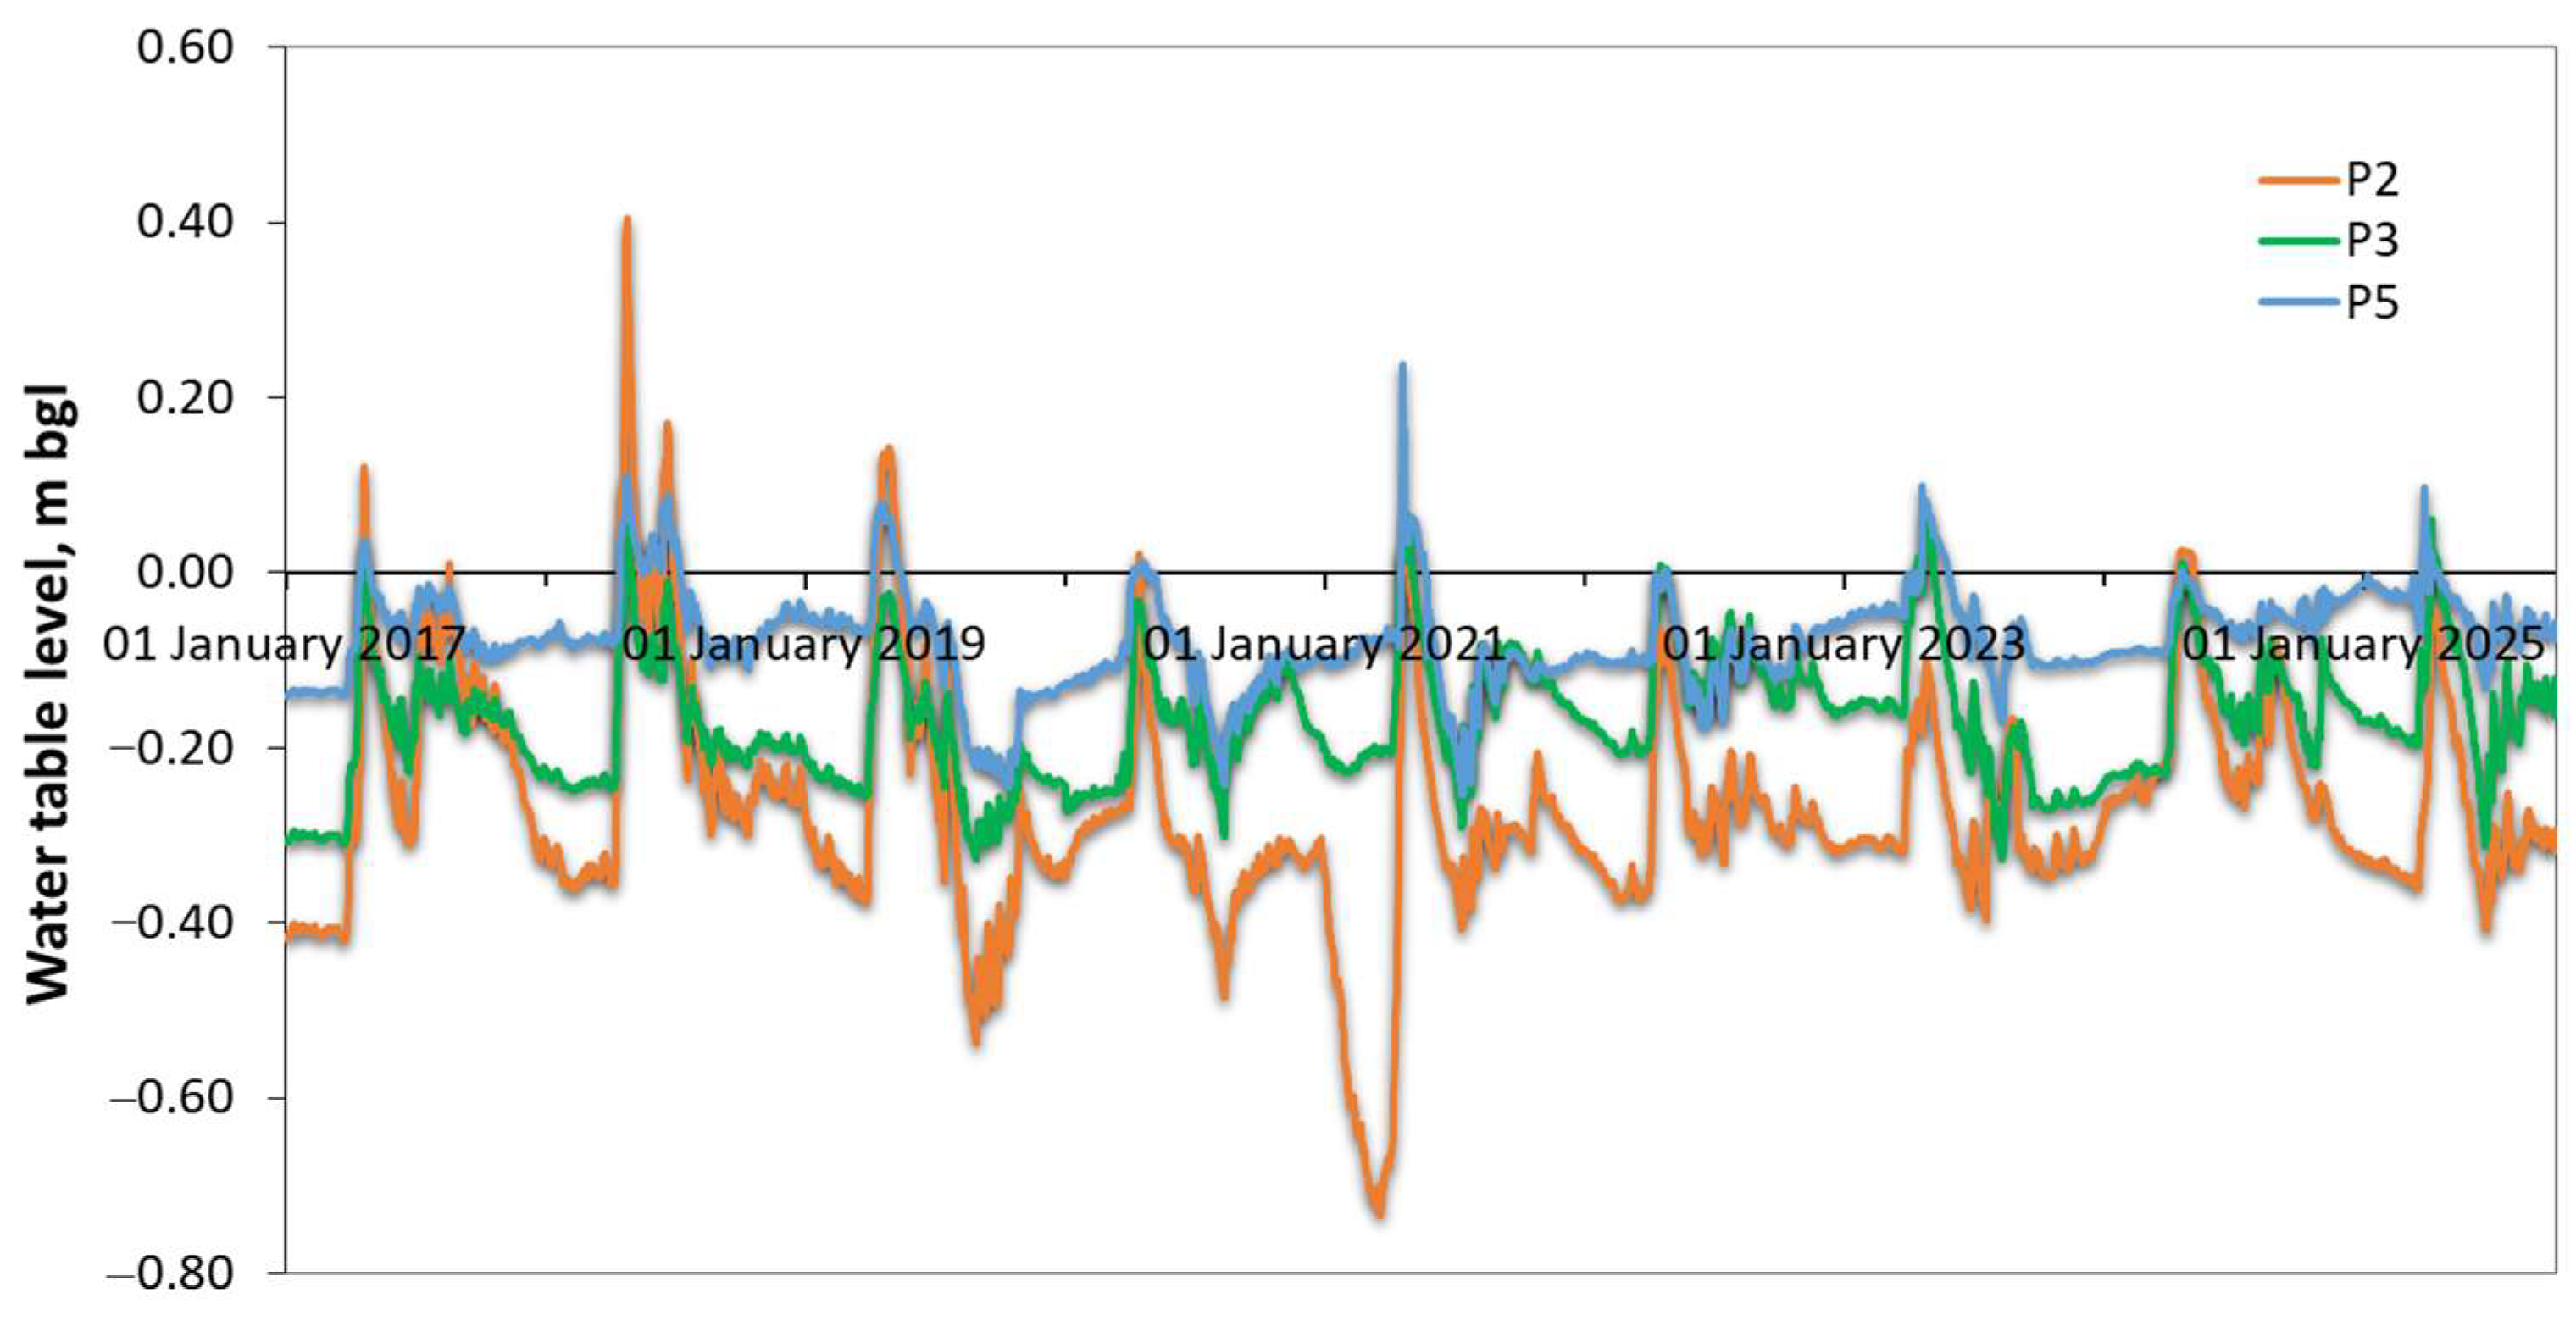
The average WTLs for 2017–2025 were 0.27 m b.g.l. at P2, 0.17 m b.g.l. at P3, and 0.08 m b.g.l. at P5. Analysis of the data for 2017–2025 showed an increase in WTLs during the high-water years of 2018, 2024, and 2025, and a decrease in 2019, 2020, and 2023. In 2019, this was due to low amounts of atmospheric precipitation during the warm season, while in 2020 and 2023, it was attributed to high air temperatures in the summer. In wet years 2018, 2024, and 2025, the average WTLs varied from 0.20 to 0.29 m b.g.l. at P2, 0.15–0.18 m b.g.l. at P3, and up to 0.04–0.06 m b.g.l. at P5. In 2019, 2020, and 2023, the average WTLs varied from 0.28 to 0.36 m b.g.l. at P2, 0.15–0.21 m b.g.l. at P3, and up to 0.10–0.11 m b.g.l. at P5. From 2022 to 2025, extreme summer precipitation led to a high water table position and reduced amplitudes of water level fluctuations.
The highest WTFs (0.30–0.76 m) were noted at the P2 area, which includes birch– and pine–dwarf shrub–Sphagnum habitats and is a marginal lagg zone in the GVM. At P3 and P5, the WTFs were lower: 0.22–0.39 m and 0.10–0.49 m, respectively. The increase in WTFs at the P2 site is associated with bad conditions for lateral runoff from the bog in the border area with the swampy forest.
The seasonal dynamics of the WTLs from 2017 to 2025 are characterized by an increase in mid-April as a result of snow melting. An uneven decrease occurs from May to June, disturbed by the influx of atmospheric precipitation, and the minimum WTL was noted in August. In the autumn period, starting in September, an increase in the WTL is noted, determined by a decrease in evaporation and an increase in the total amount of precipitation. In winter, a decrease in the WTL is observed, which begins in November–December and continues until March due to the lack of atmospheric input. During this period, snow cover formation and peat freezing cause WTL changes, primarily due to water seepage along the active layer and snowmelt. The highest spring water table levels (WTLs) were recorded in April 2018 and 2021. During these periods, the maximum WTLs reached 0.40 m and 0.02 m above the surface at site P2, 0.09 m and 0.07 m at P3, and 0.11 m and 0.24 m at P5, respectively. The minimum WTL was observed at the end of the winter or summer season. In March 2021, the WTLs dropped to 0.73 m b.g.l. at P2. In 2019 and 2023, the WTLs decreased to 0.54 m and 0.40 m b.g.l. at P2, to 0.33 m b.g.l. at P3, and to 0.25–0.27 m b.g.l. at P5, respectively (Figure 3).

3.3. Surface Oscillation

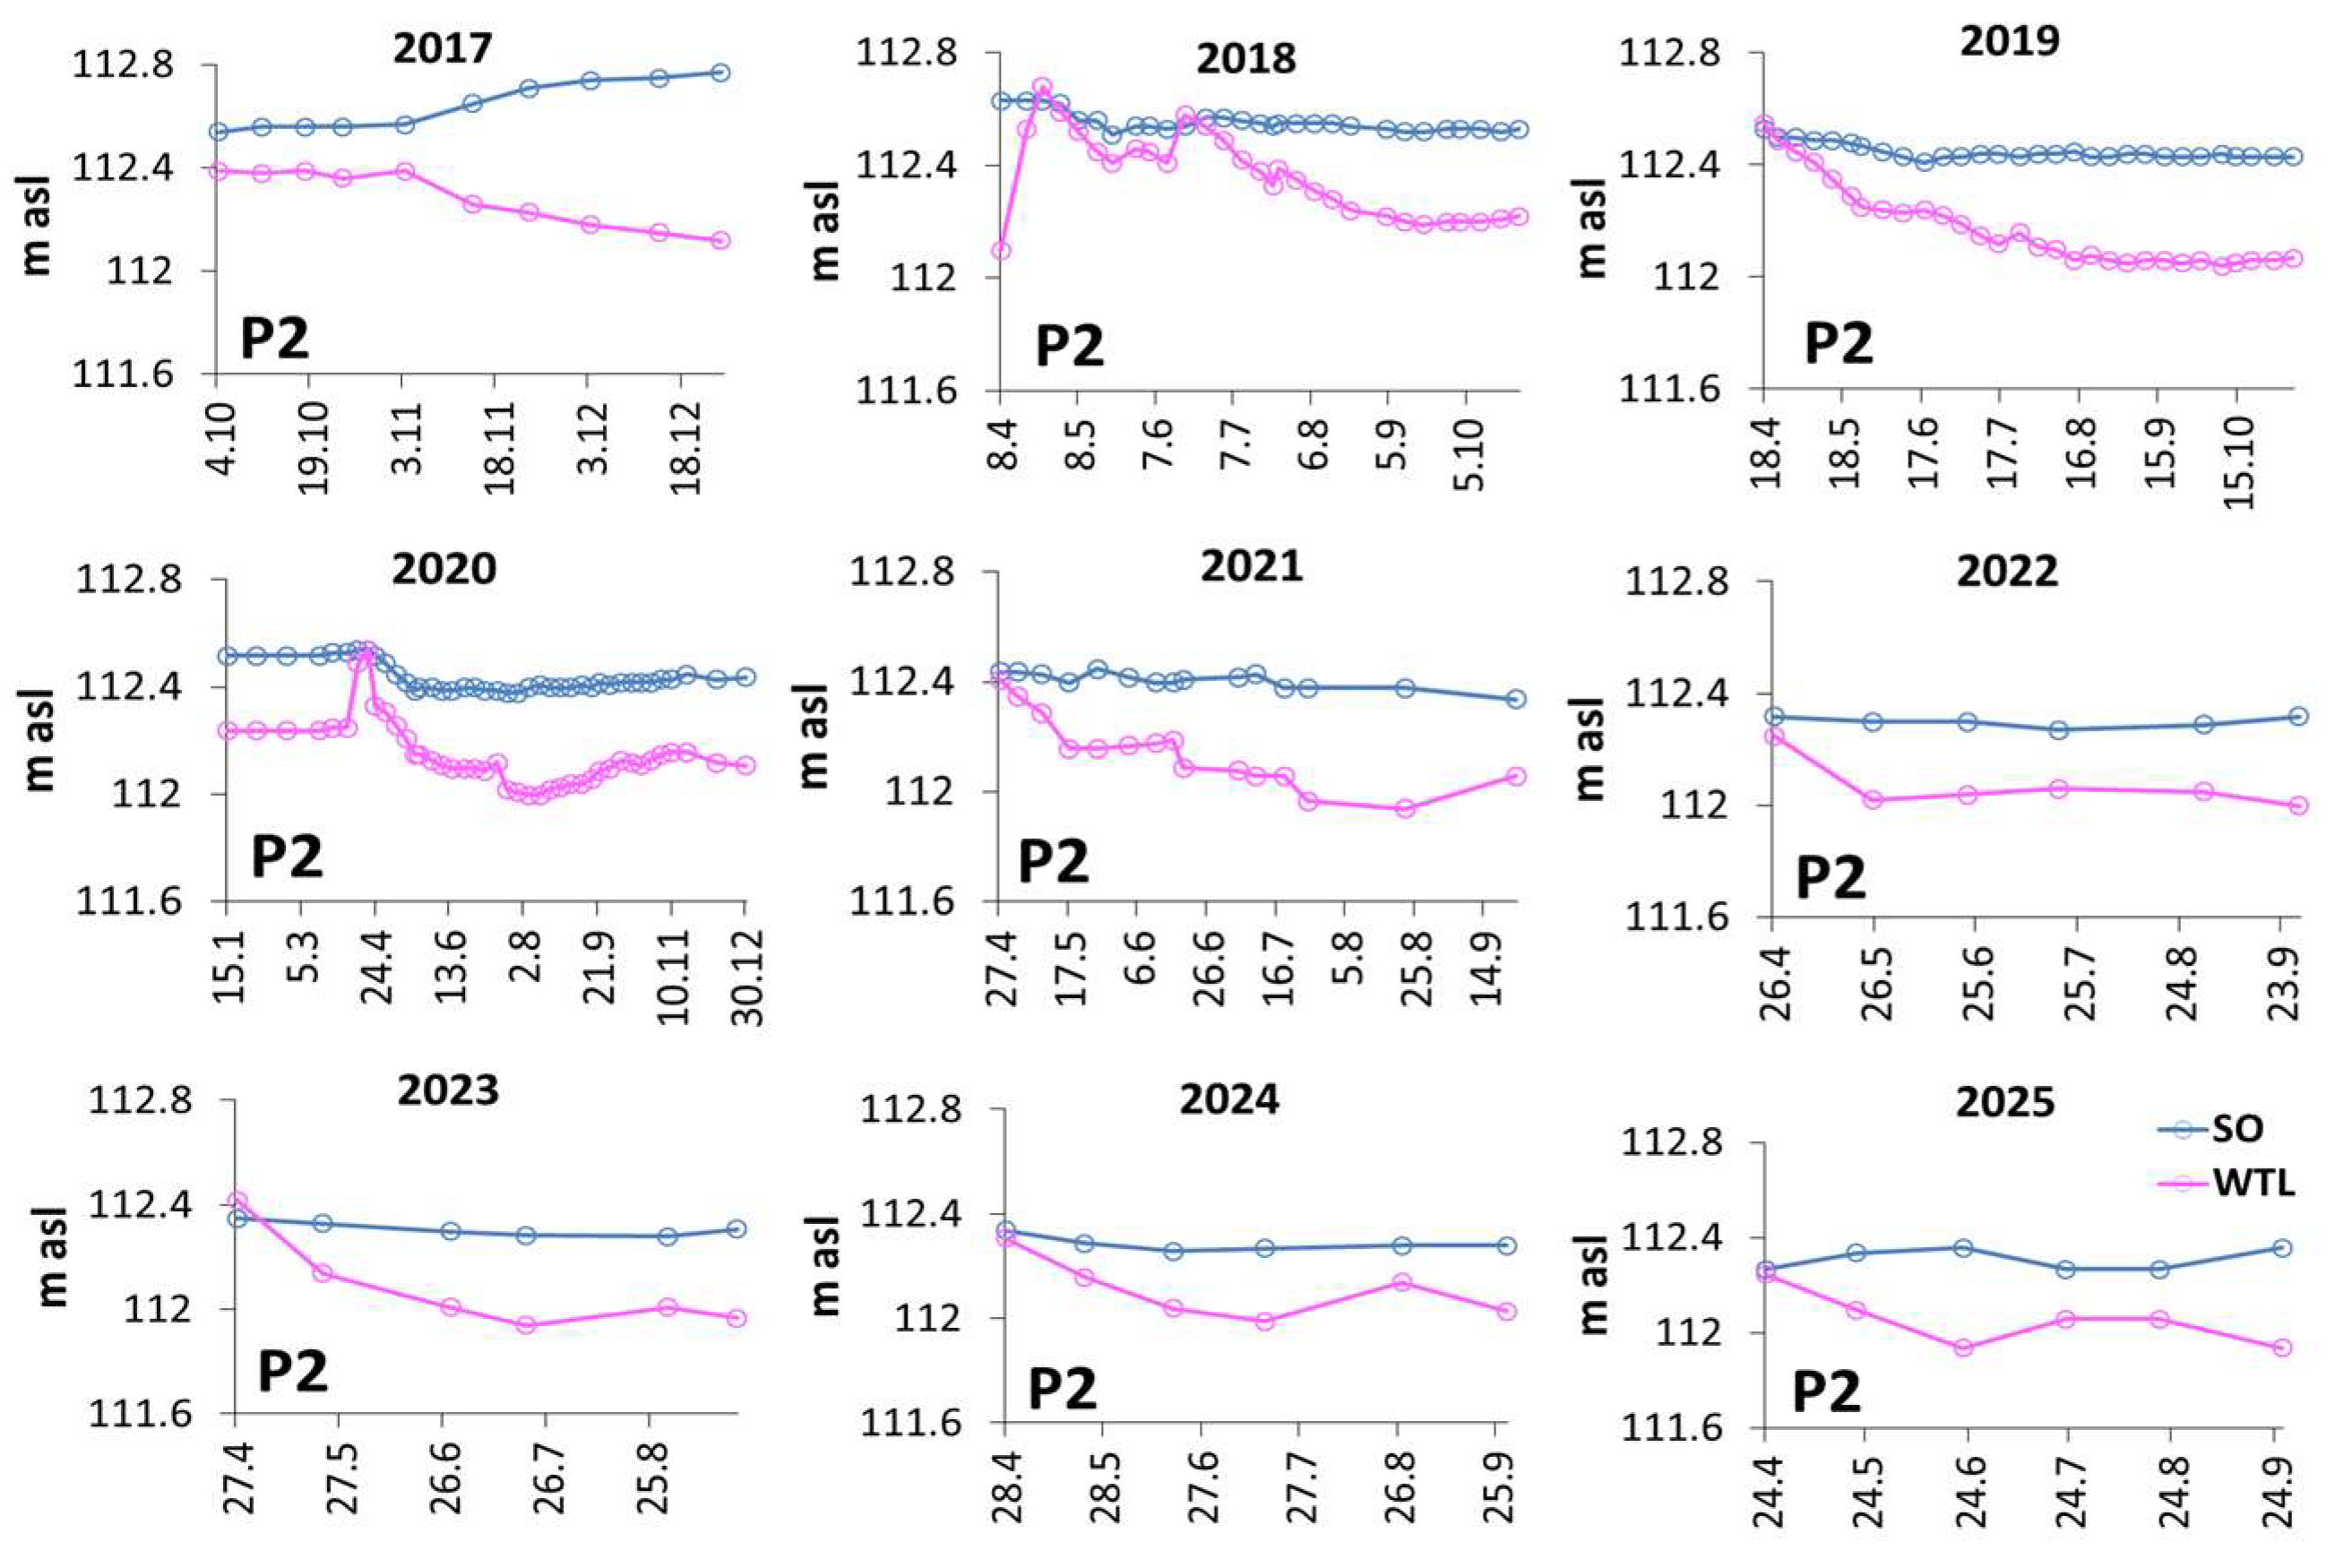
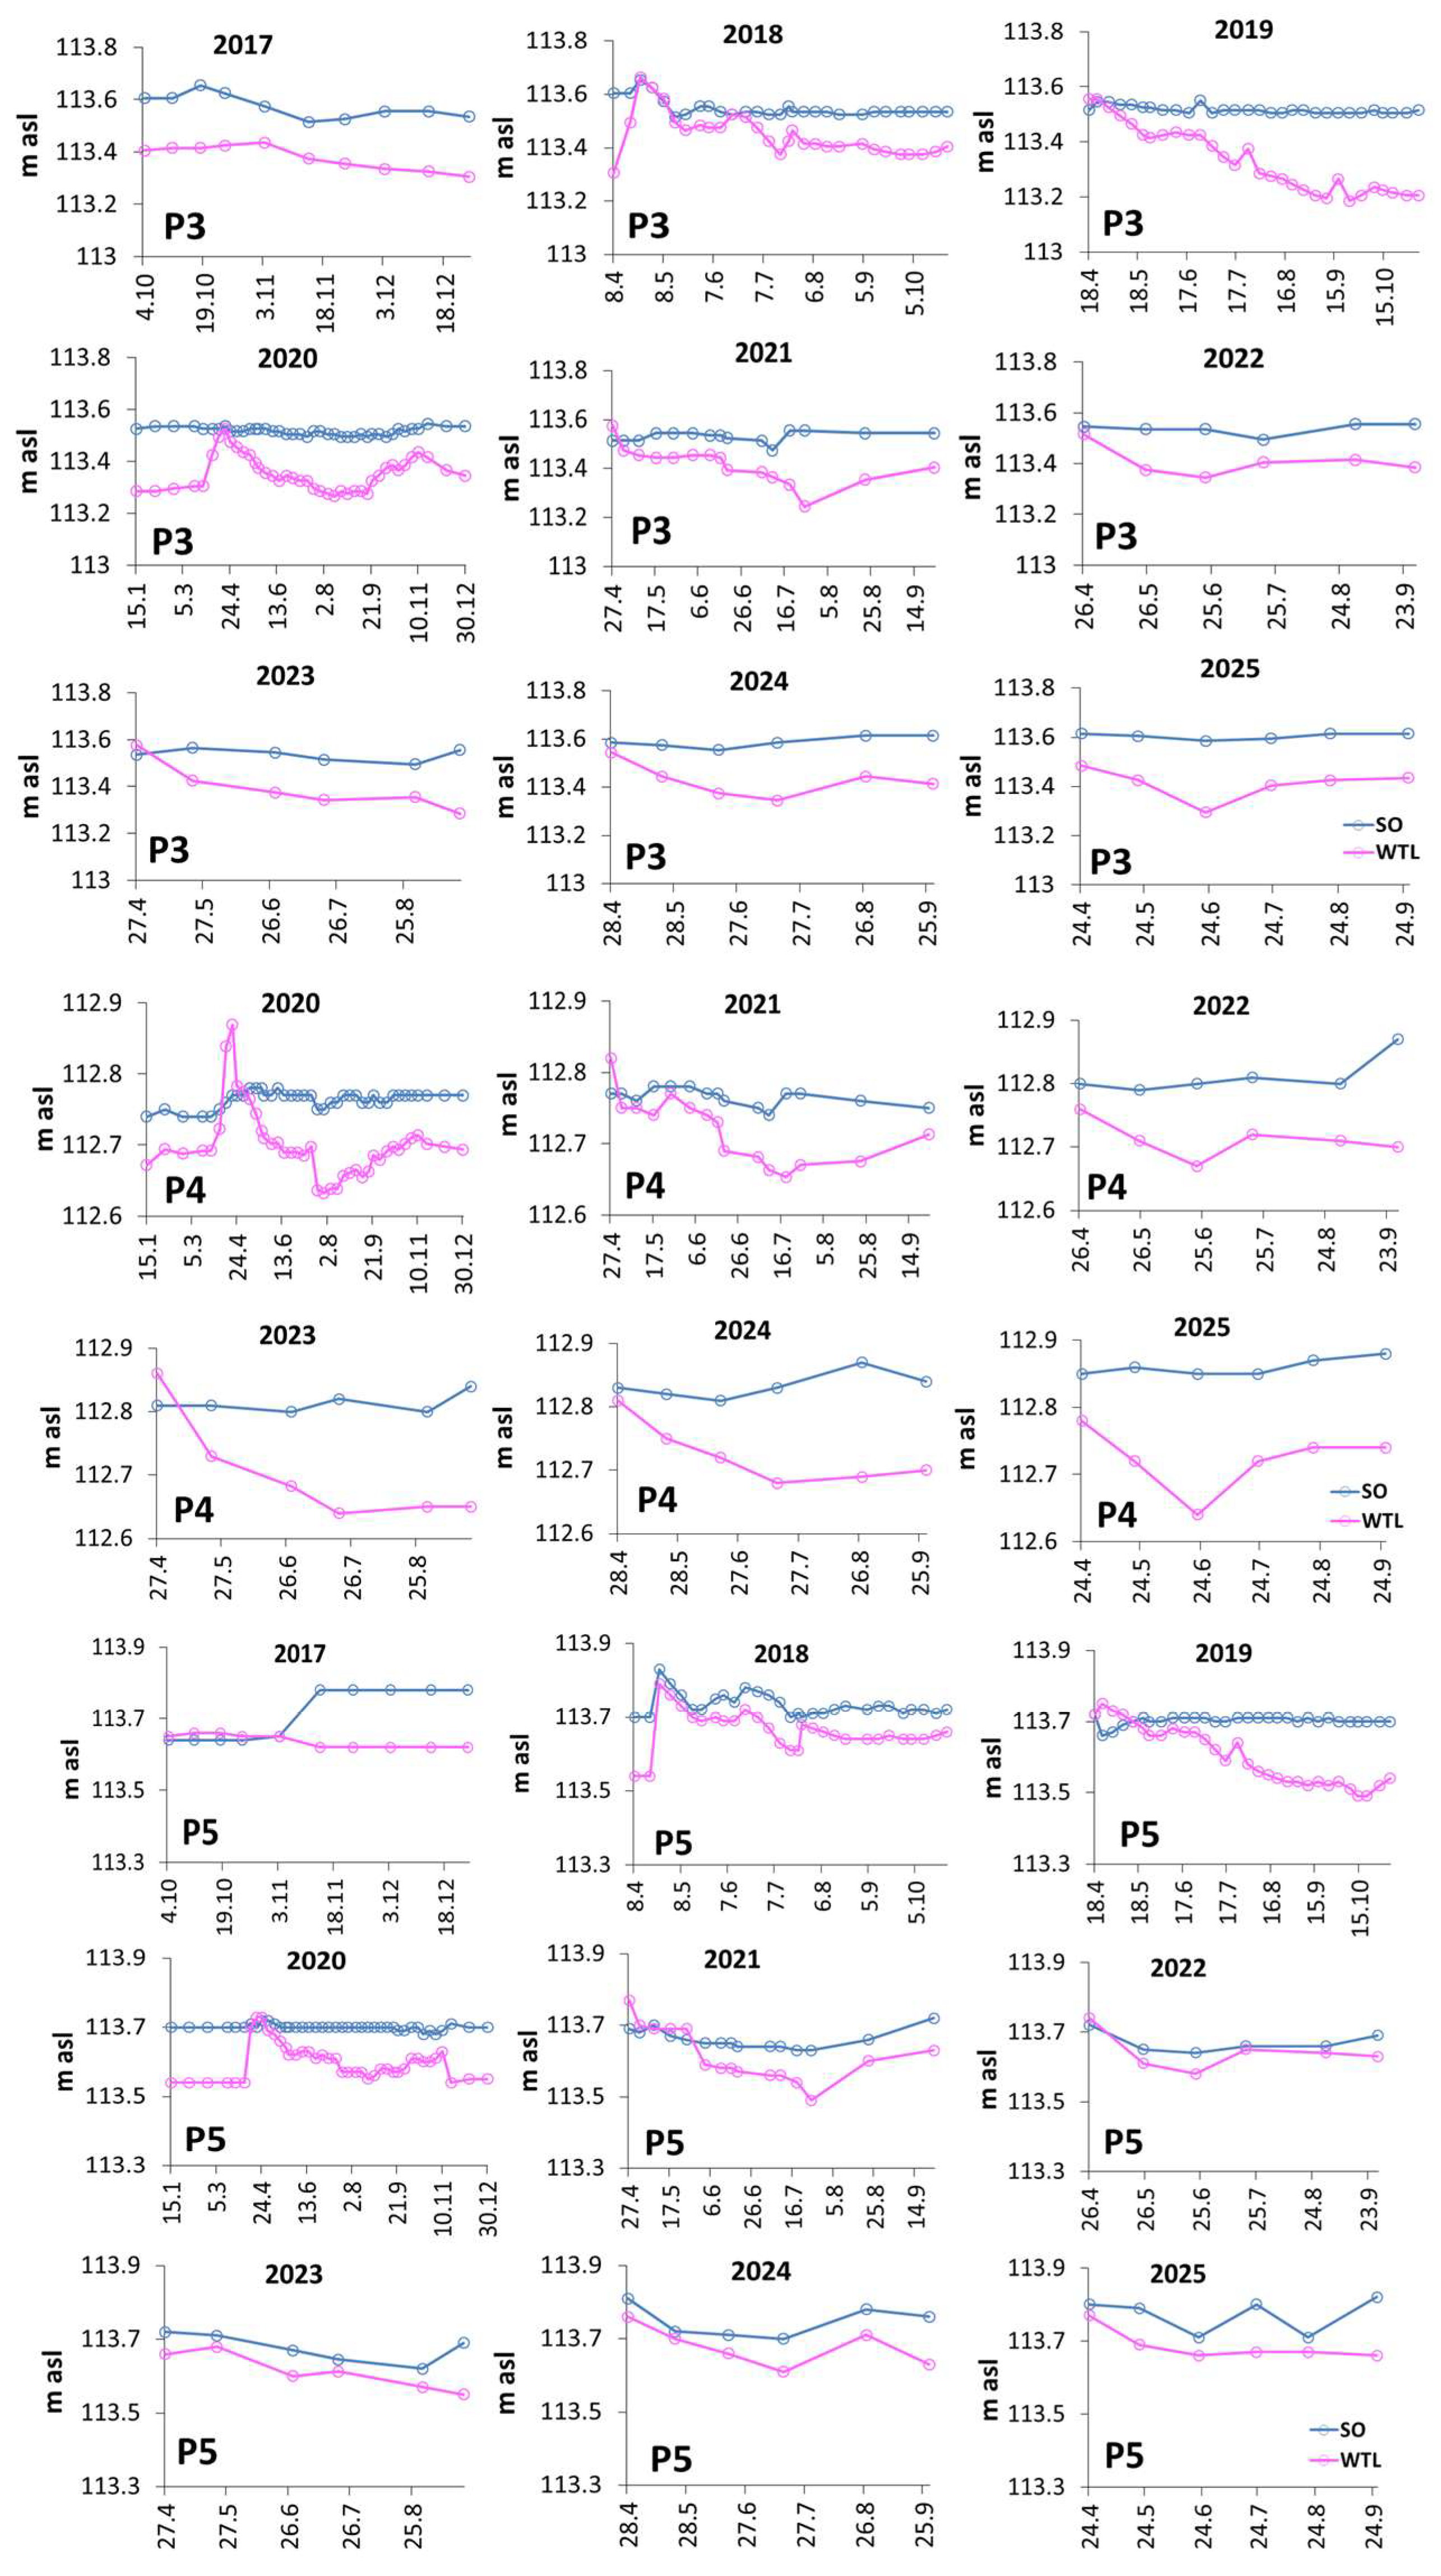
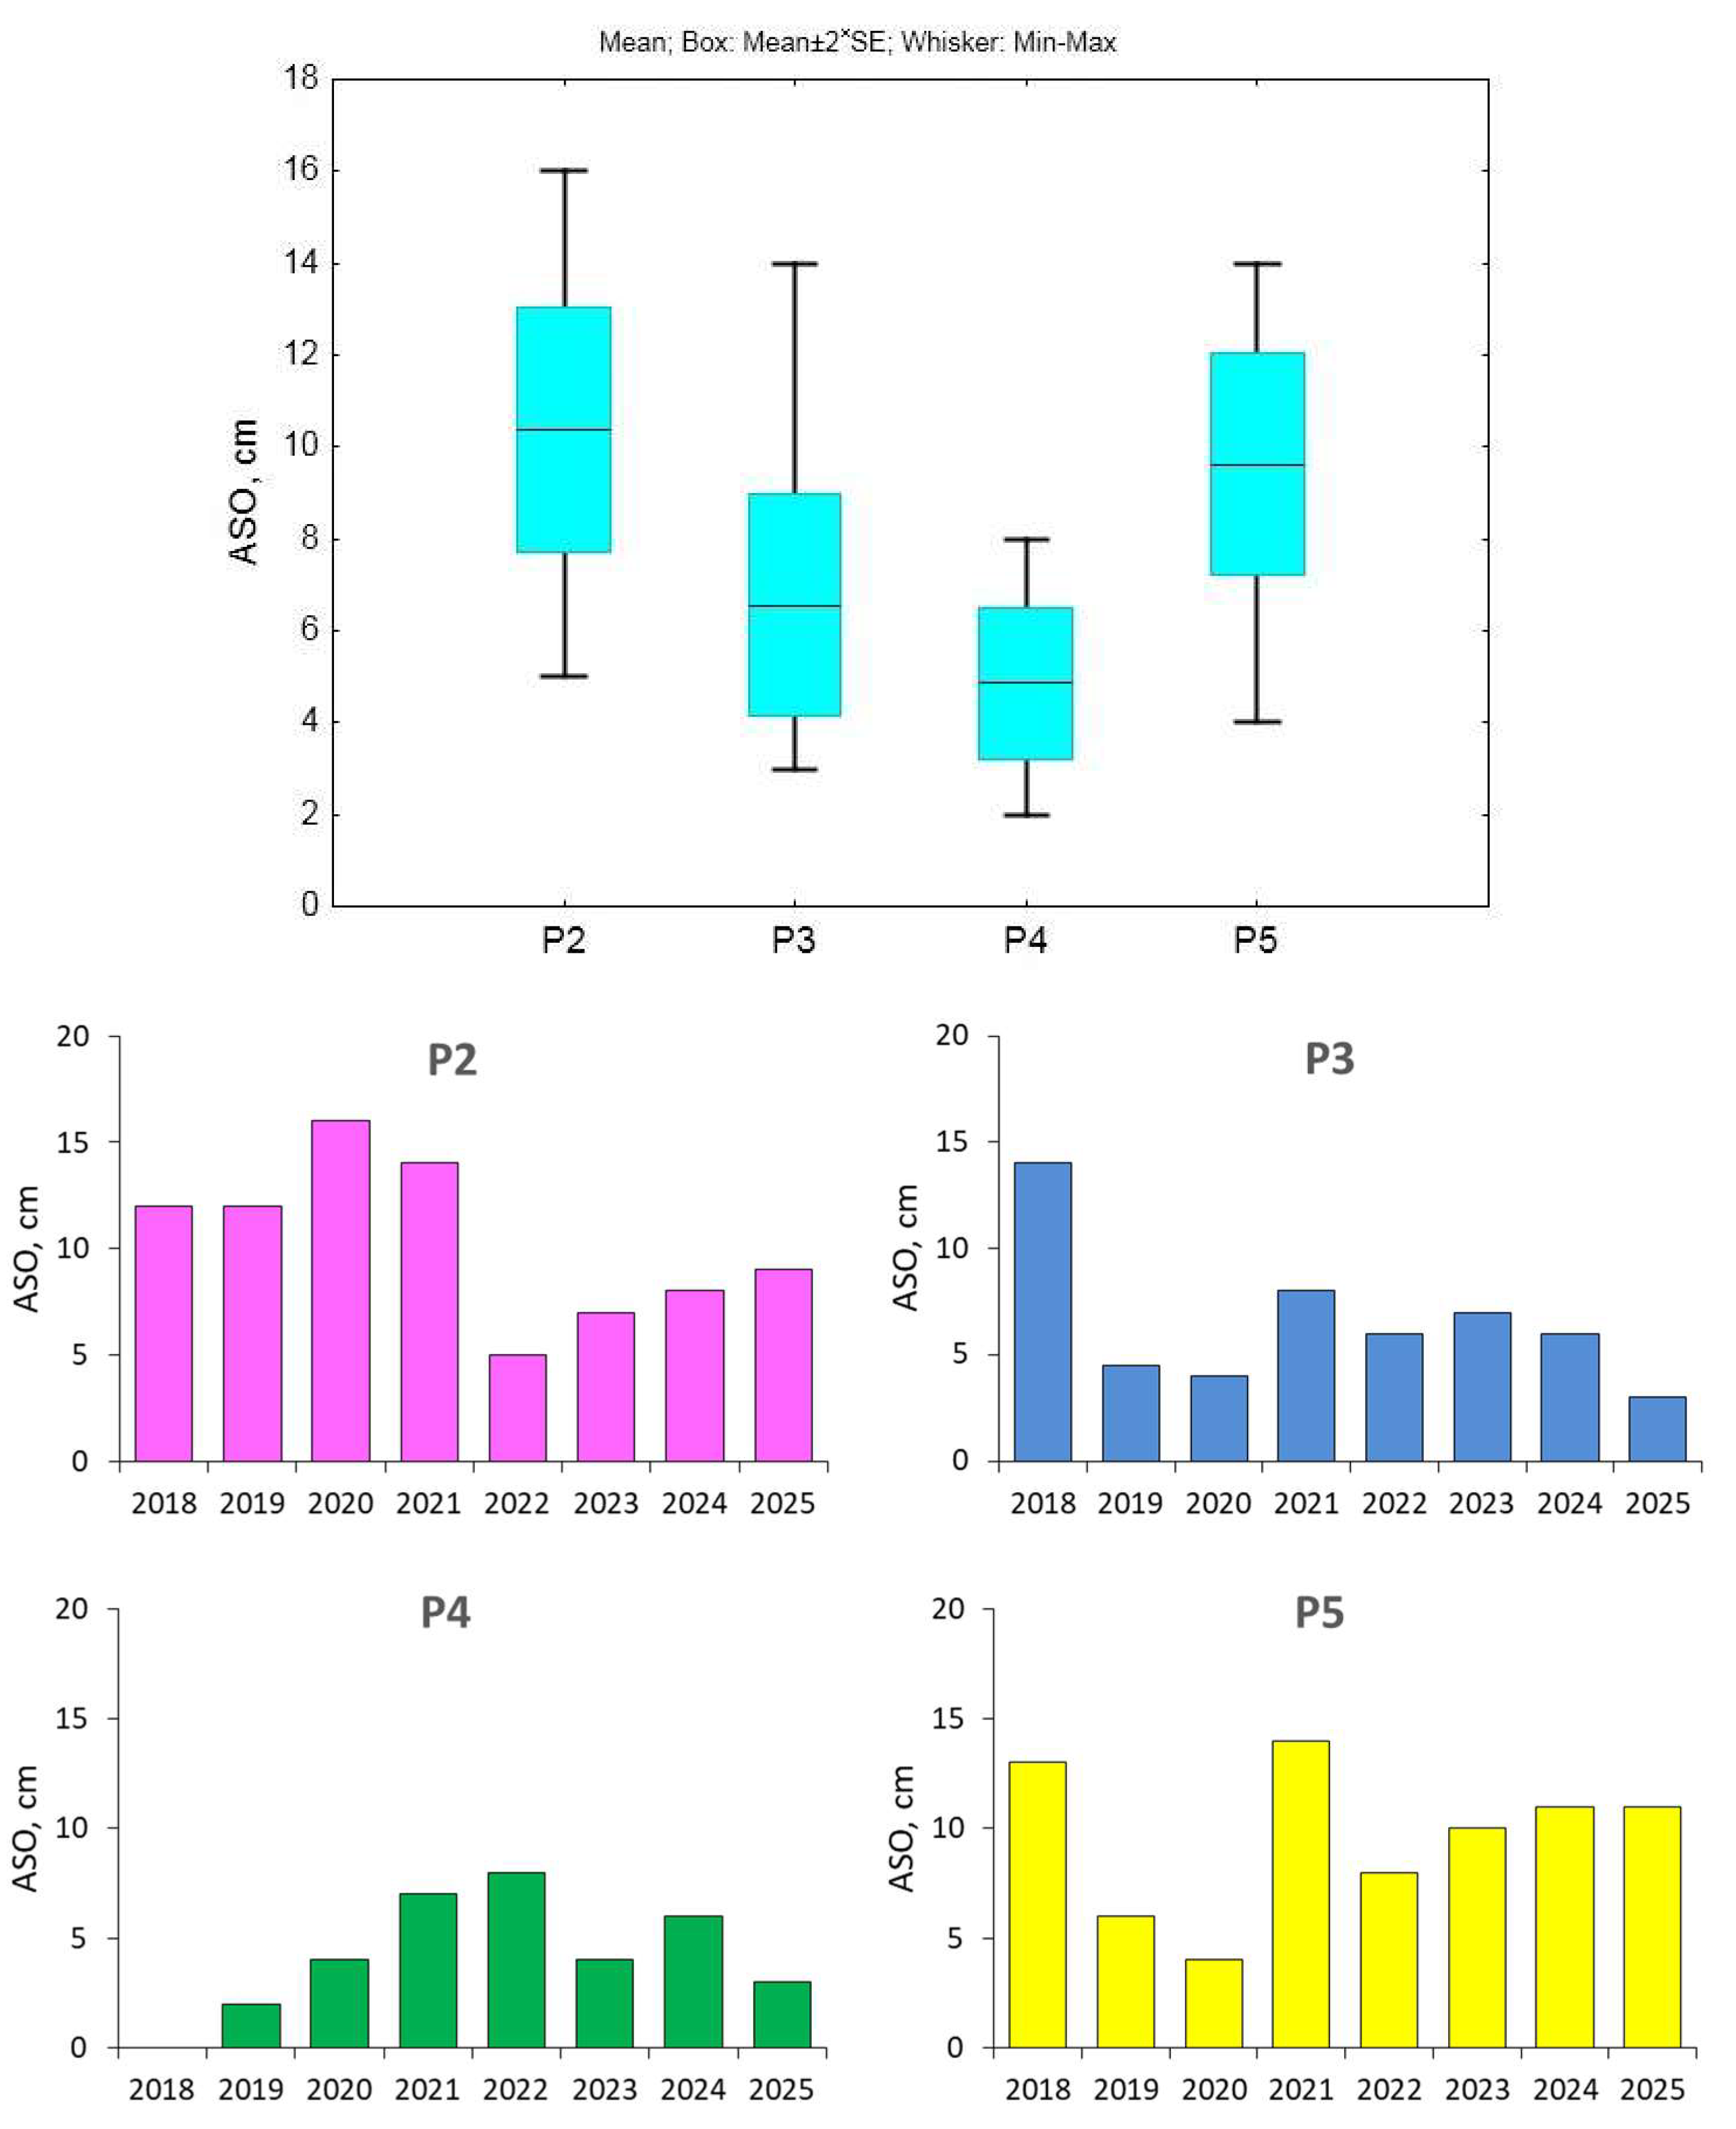
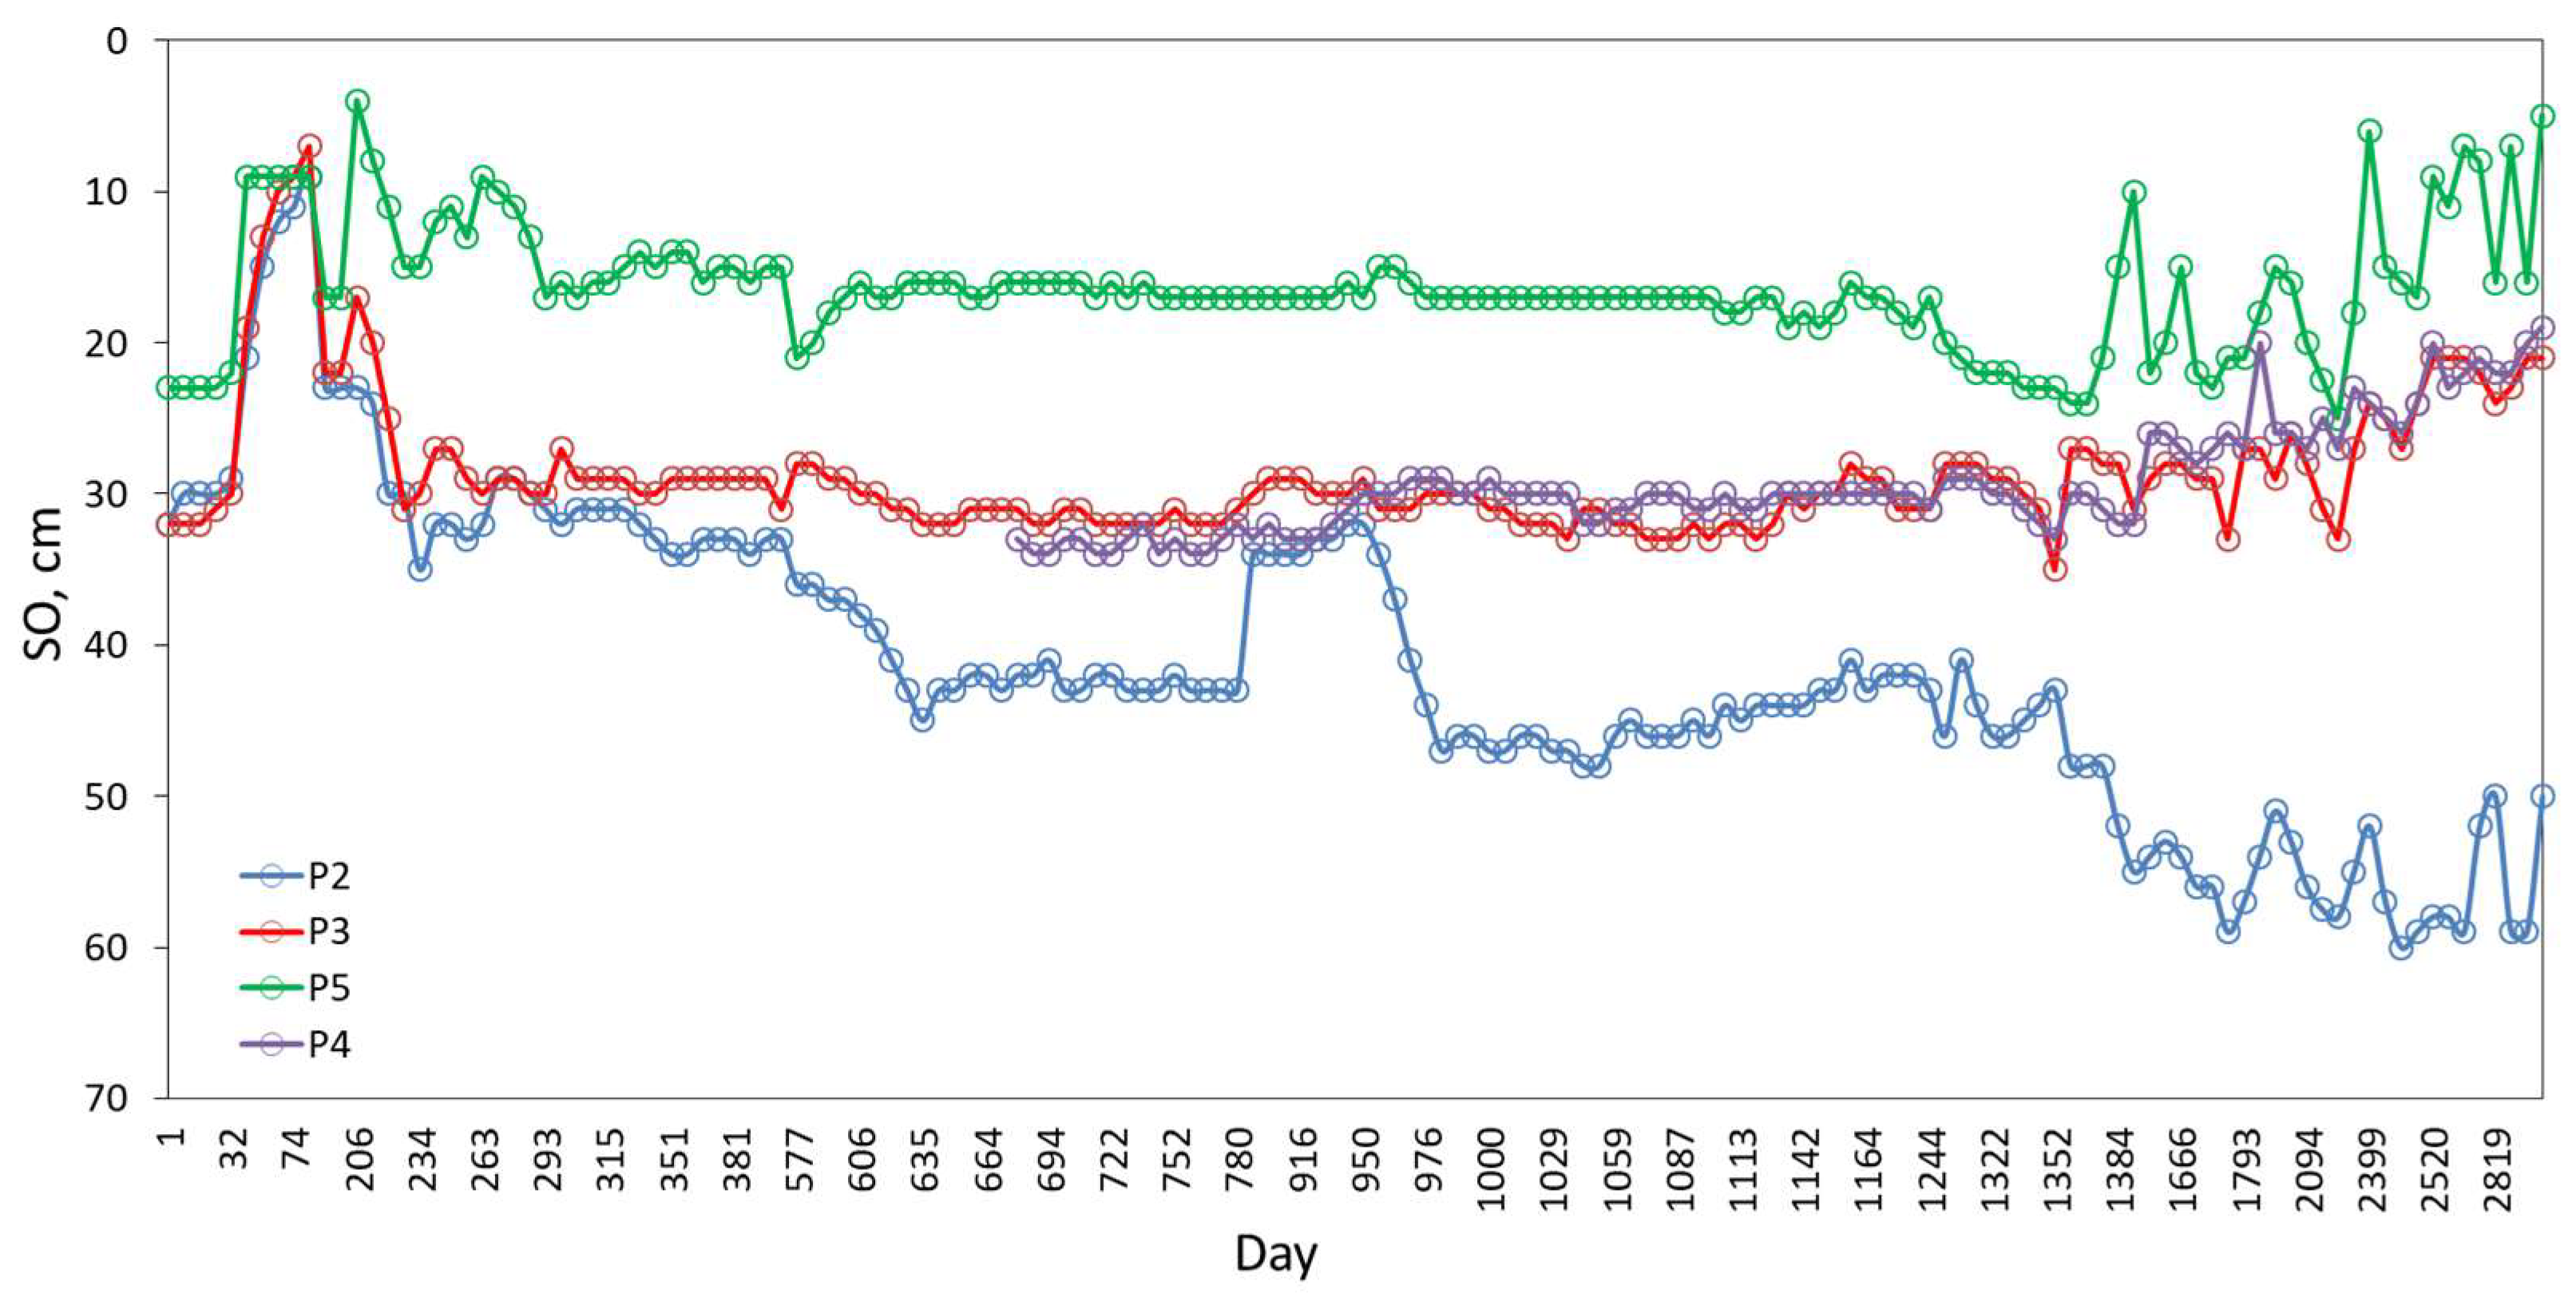
An analysis of the GVM data shows that the surface oscillation is dependent on variations in WTLs and the amount of precipitation. Freezing processes also have a significant impact on the SOs in the GVM. Measurements of the SOs in November–December 2017, during the formation of snow cover and the freezing of peat deposits, showed that the SOs, as a result of frost heaving, were 23 cm at P2, 25 cm at P3, and 14 cm at P5. The significant increase in surface elevation was probably related to the high moisture content in the peat deposit during the fall season of 2017 as a result of summer precipitation. Also, high SO was noted in April 2018 during the springtime when the peat deposits thawed. The ASOs during the warm period of 2018 were 12 cm at P2, 14 cm at P3, and 13 cm at P5. High water supply during 2018 contributed to the maintenance of the high surface elevations (SEs) in the GVM throughout the year, as well as at the beginning of 2019. In general, the SO in 2018 was consistent with the dynamics of the WTL, while from 2019 to 2020, the synchronism of fluctuations in the WTLs and the SOs was slightly disturbed, which is probably associated with the phenomenon of hysteresis. In April 2019, during the thawing, a decrease in the SE was noted, and from June, surface stabilization due to precipitation events was observed. Thus, higher ASOs at all sites in the GVM can be observed in the high-water year 2018, while from 2019 to 2020, the surface remained more stable in the spring high-water period, and an increase in surface oscillation was observed in the rewetting period after the summer drought. In 2019, the ASOs decreased at two key sites in the middle part of the GVM and amounted to 5 cm at P3 and 6 cm at P5, while at the P2 key site, the SO was the same as it was in 2018 (12 cm). In 2020, the ASO at P2 increased to 16 cm, while at P3, P4, and P5, it decreased to 4 cm. This pattern is probably due to the fact that the winter period of 2019–2020 was very warm, with a series of thaws, which led to an increase in the WTLs at P2 and P3. In 2020, a rise in surface elevation was recorded at the end of the warm period, attributable to elevated September precipitation (67 mm). As a result, in 2020, the maximum SO value (16 cm) was found at the peatland marginal area (key site P2), whereas at other key sites, the SO values were equal to 4 cm. In 2021, with increasing summer precipitation, ASOs increased to 14 cm at P2 and P5 and to 7–8 cm at P4 and P3, respectively. Since 2021, increased July–August precipitation has led to rising surface elevations at key sites P3, P4, and P5, while area P2 has shown a decline. In 2022, the ASO value ranged from 5 to 6 cm at P2–P3 to 8 cm at P4–P5. In 2023, the minimum ASO value was observed at the P4 key site and amounted to 4 cm. At P2 and P3, the ASO value was comparable (7 cm), while at P5 it increased to 10 cm. In 2024, the ASO values were very similar for key sites, ranging from 6 cm at P3–P4 to 8–11 cm at P2 and P5, respectively. In 2025, following several years of extreme summer precipitation (mostly in July and August), the ASO values at P3-P4 decreased to 3 cm, which was almost the minimum value for the study period. Meanwhile, at P2 and P5, the ASO values in 2025 were 9 cm and 11 cm, respectively (Figure 4).

4. Discussion

4.1. Water Level Fluctuation vs. Surface Oscillation

Our studies in Western Siberia showed the following patterns in water level fluctuation in the GVM. It was noted that the highest WTL was observed in the spring period as a result of snow melting, which begins in early or mid-April. The WTL decreases in June–July during the summer period, and in August, a WTL increase is observed due to precipitation events. In autumn (September–October), a gradual decrease in water levels begins until the formation of snow cover in November. Further, the WTL gradually stabilizes and begins to decrease, sometimes increasing due to thaws. The minimum WTLs for the year are observed either at the end of summer or early fall or in the winter period before the start of the next snowmelt season (March). On average, over the study period, the WTLs were 0.27 m b.g.l. at P2, 0.17 m b.g.l. at P3, and 0.08 m b.g.l. at P4 and P5 key sites; the amplitudes of the WTFs were 0.51 m, 0.32 m, 0.16 m, and 0.25 m, respectively. The features of these WTFs are comparable with the published data for the European territory of Russia [38,39] and for Western Siberia [36,40,41,42,43].
Our data showed opposite trends in the long-term dynamics of WTLs at different key sites in the GVM, which are only partially consistent with the results of the forecasts in [15]. At key sites P3 (pine–dwarf shrub–Sphagnum communities) and P5 (sedge–Sphagnum communities), located closer to the interfluve center, a rising trend in water table position was observed from 2017 to 2025, attributed to increased summer precipitation (Figure 5). In contrast, key site P2, situated at the bog’s edge, exhibited a downward trend in WTLs over the study period. An assessment of the peatland water table sensitivity to climate change, carried out using the IPCC RCP 4.5 and 8.5 scenarios at the Sphagnum peatland located near Frasne in the French Jura Mountains, showed that the water table level (WTL) remained stable during the first half of the 21st century; seasonal trends after the year 2050 show lower WTLs in winter and markedly greater declines in summer. In particular, it was noted that more frequent droughts in summer and autumn could occur after 2050, which will lead to a decrease in WTLs [15].
Our GVM studies also showed a decreasing trend in the amplitude of level fluctuations during the summer period of 2022–2025 at key sites P2, P3, and P5, indicating water accumulation in the peatlands. According to [3], peatlands have significant water storage capacity and may transform heavy rainfall events into a smooth discharge curve [4]. Previous GVM studies have shown that the specific yield value at P3 and P5 averaged 0.60 and 0.52, increasing in certain periods to 0.92 and 0.82, respectively, indicating significant water storage capacity [44].
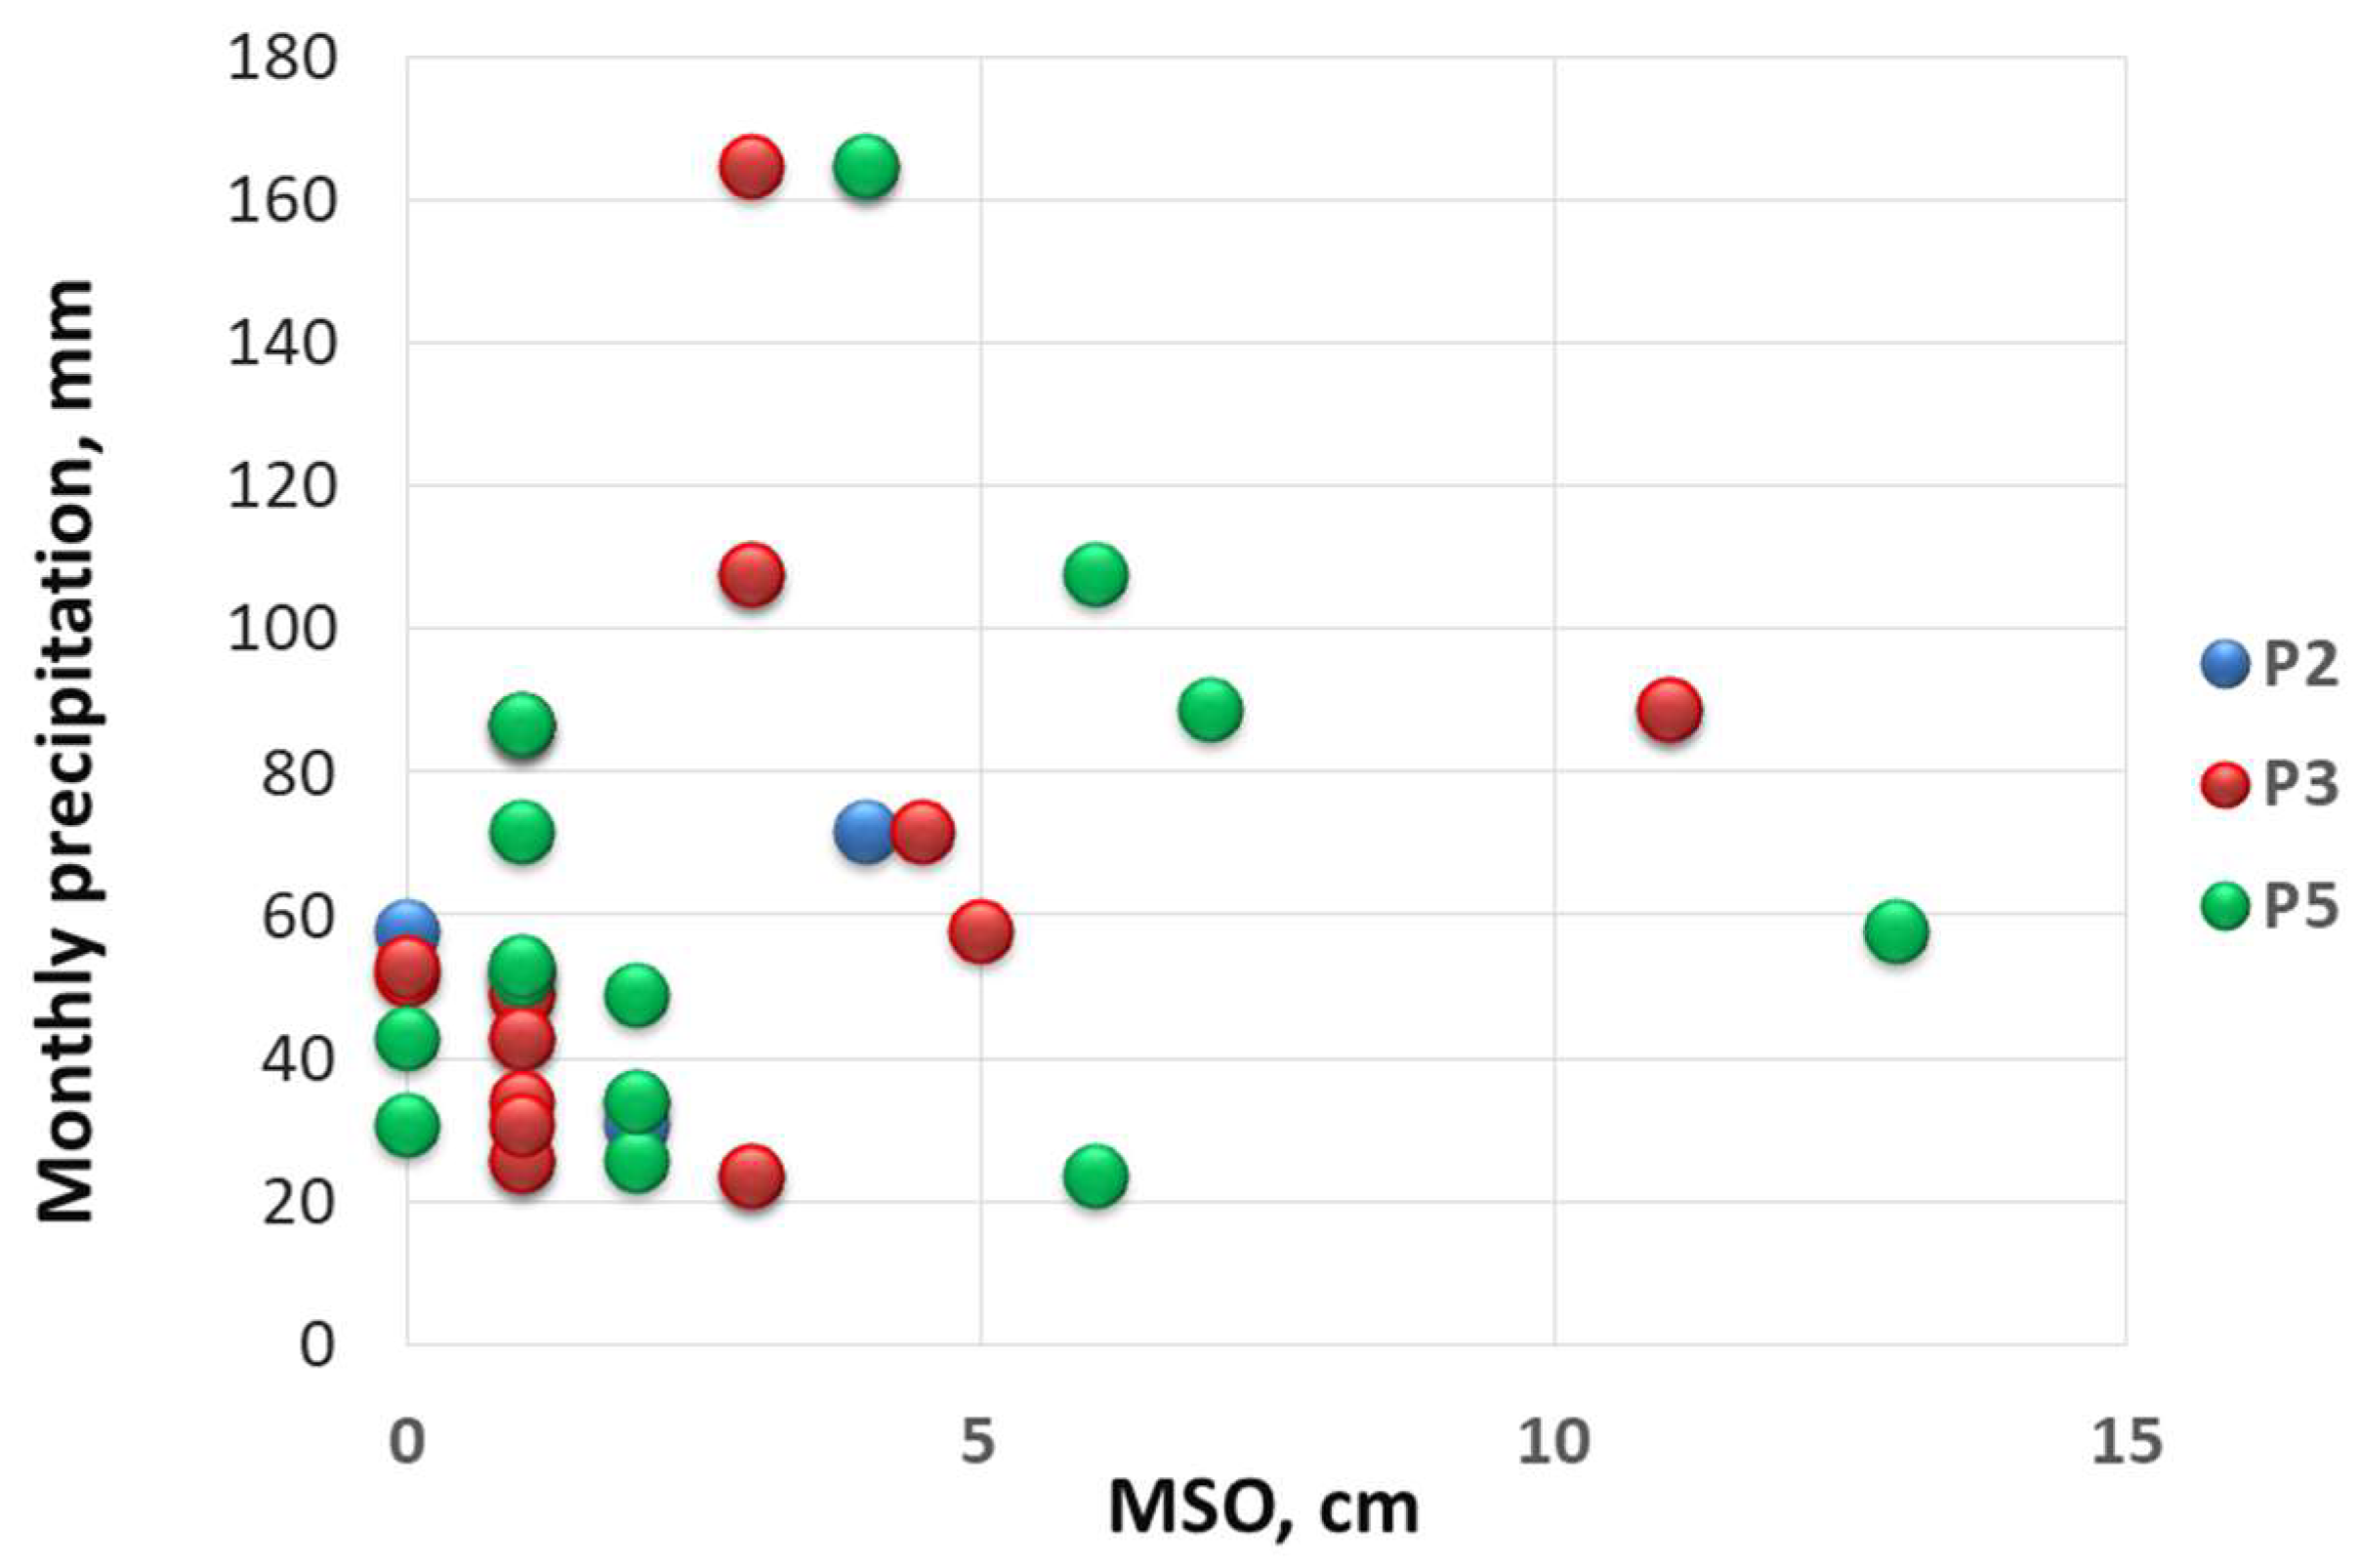
Surface oscillations in the GVM varied from 14 to 25 cm in the transitional autumn–winter period and early spring as a result of frost heaving and from 2 to 16 cm in a frost-free period (Figure 6). Multi-year averages for the different sites of the Burns Bog ranged from 2 cm to 34 cm (mean = 10.8 cm), and the average SO for undisturbed unharvested sites was 11.7 [17]. In general, our data are comparable with the results obtained for the Burns Bog in Canada [17]. Similarly to published data [17], the SO in the GVM was higher during the period of high-water content, mainly in spring rather than in autumn. Studies carried out on a large mire system in Lithuania [22] have shown that climate change significantly affects the fluctuations in the mire surface, thereby affecting the hydrological regime of water intake; when the annual precipitation falls below normal levels, the surface of the raised bog sinks a few centimeters. Annual surface oscillation in the GVM was significantly greater than the data for the bog in northern Minnesota, USA [27], where the SO for the bog area was only 6 cm (Table 4). The surface oscillation in the GVM, in response to the influx of atmospheric precipitation, was not very significant (Figure 7). This may be due to the high porosity and the presence of layers with low bulk density in the peat deposit, which determines peat swelling [18].
Seasonal trends in surface elevation were less dynamic in undisturbed areas, with the SO of the peat surface gradually expanding by a maximum of 2.8 cm over the study period [26]. Long-term data show that as a result of changes in the structure of peat, its compressibility decreases towards the end of the season as a result of a decrease in the water level. According to [45], prolonged drought can contribute to a decrease in the active porosity and degradation of peat deposits. Approximately 55 to 59% of seasonal changes in structure are associated with shrinkage, whereas compression accounts for 41 and 38%, and oxidation represents 4 and 3% of soil volume changes [26].
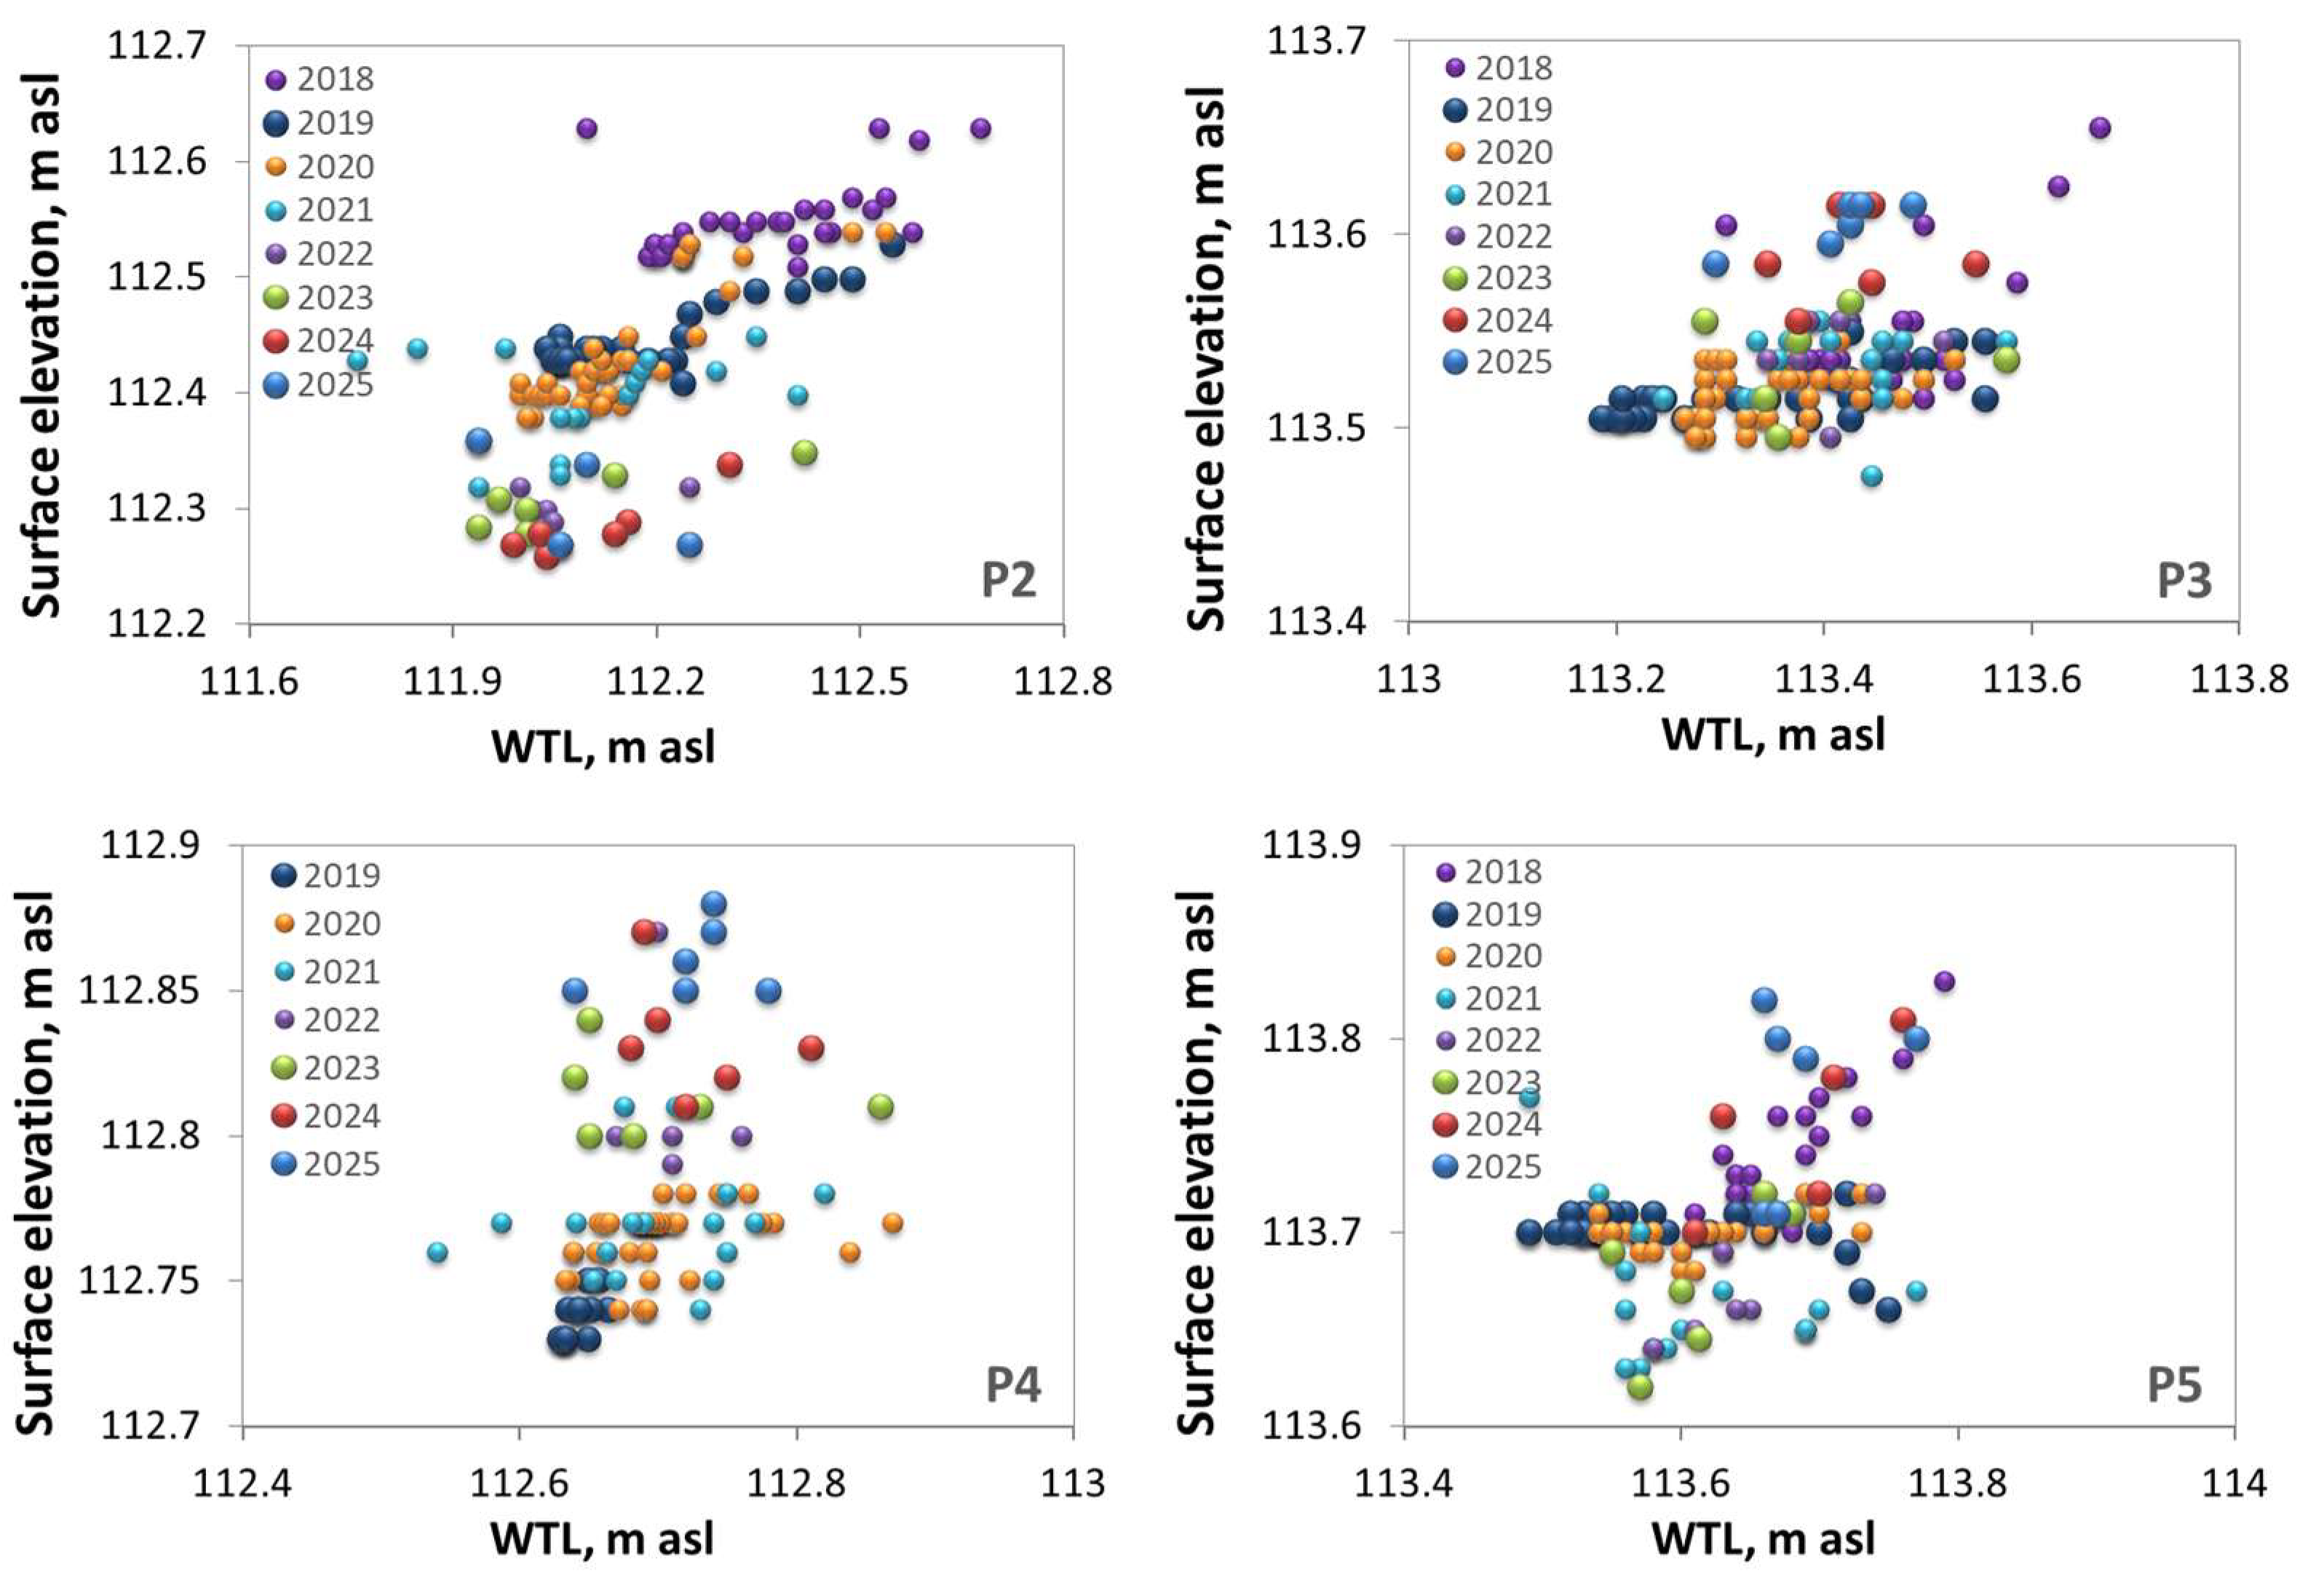
Surface oscillation mainly follows changes in water table levels: it occurs as a result of swelling with increasing levels and compression, and shrinkage is the result of falling levels. However, in some areas in the GVM, a close correlation between the WTL and SE was not noted, which is consistent with the data [17]. Within the GVM, a closer relationship is noted in the P2 key site; in other sites, the correlation weakens and remains only during the dry periods. The absence of a correlation can be associated with the phenomenon of hysteresis [18]. Our studies in the GVM also showed the phenomenon of hysteresis, which manifests itself mainly in the decline and is expressed in the stabilization of the surface when the water table levels drop. In essence, the phenomenon of hysteresis is typical for areas with wetter plant communities with Sphagnum mosses [17]. Peat is highly complex porous media with distinct, characteristic physical and hydraulic properties. The hydraulic properties of peat strongly depend on the peatland vegetation and the degree of decomposition of the plant debris. Sphagnum peat is characterized by the highest water storage capacity due to the presence of specialized cells in Sphagnum mosses, which are capable of absorbing water in volumes many times greater than their own mass (up to 20–25 times their dry weight) [2,46]. This property contributes to the maintenance of the moisture content of the peat deposit and stabilization of the bog surface.
The correlation between the WTL and surface elevation in the GVM is violated during seasonal freezing and thawing processes, as well as when water table levels rise above the ground surface. On the other hand, the influence of other processes, such as ebullition, is likely [23,25]. Abrupt emissions of biogenic gases are sometimes observed in mires, which can lead to significant SOs. Studies [23] have shown significant surface oscillation up to 10–20 cm within 12 h, which occurred with a sharp decrease in pressure in the peat profile (Figure 8).
Studies conducted in New Zealand [18] provided detailed descriptions of the SO hysteresis phenomenon, which arises from a delayed surface response during high-water periods. In general, it is noted that three general types of relationships are observed between the surface elevation and the WTL at different times; a linear relationship is common for the wet season. During the drought period, there is a continuous drawdown in the WTL and the subsidence of the surface. In rewetting periods, a hysteresis phenomenon is present, where there is a lag in time between the mire surface and the water level rising; this is observed in different periods of a rain event and at the beginning of the wet season. It is noted that hysteresis is more pronounced in dry than in wet months.

4.2. Spatial and Temporal Variation in Surface Oscillation

Our GVM studies revealed elevated surface oscillation in the sedge–Sphagnum community (key site P5) and pine–dwarf shrub–Sphagnum community with tall pines (key site P2). In contrast, low SOs were observed in the widespread pine–dwarf shrub–Sphagnum community with low pines (key sites P2 and P4), located close to the central part of the GVM. These findings contrast with observations from Canada and New Zealand [18], where minimal surface oscillations were reported at the peatland margin and the highest oscillations in areas densely covered by Empodisma minus. Studies conducted on a warm-temperate peatland in New Zealand [18] revealed only minor spatial variation in surface fluctuations across the mire, with values ranging from 37 to 43 cm. In contrast to water table levels, the SE exhibited pronounced heterogeneity across the study area, showing no discernible spatial trend.
The GVM research identified elevated surface oscillations at the peatland’s margin. This observation is consistent with an increasing trend in water level fluctuation along the radial gradient from the bog’s center to its periphery. The highest WTF amplitudes (0.30–0.76 m) were recorded at the P2 area, which comprises birch– and pine–dwarf shrub–Sphagnum habitats and represents a marginal lagg zone in the GVM and Klyuch River headwater area. Similar conclusions were made in [27], where it was indicated that low-lying areas, with the largest area contributing runoff, have the largest surface fluctuations. Studies conducted at the Burns Bog in Canada [17] revealed contrasting tendencies. Drier sites, characterized by plant communities such as Pinus contorta–Gaultheria shallon, Pteridium aquilinum–Rhododendron groenlandicum, and Spiraea douglasii, experienced the least surface oscillations (SOs), with mean values below 7 cm. Conversely, the highest SOs were observed in areas with the most stable (i.e., least fluctuating) groundwater table. Furthermore, sites located at the bog’s edge, which have shallower peat deposits, exhibited smaller SO amplitudes. Additionally, more heavily drained plant communities displayed minimal hysteresis.
According to [18], surface oscillation occurs mainly in the upper layer and leads to a decrease in WTL fluctuations by up to 80% compared with the dry season. It is also concluded that the main reason for highly fluctuating surface elevation is the flotation of the upper layers of peat, and vice versa: small fluctuations in surface elevation are associated with reversible compression and shrinkage. In the GVM, key site P5 functions as a water track area where the liquefaction of the peat deposit promotes flotation of the overlying peat layers, as confirmed by our field studies. Analysis of Landsat satellite imagery indicates that the study area lies at the junction of two small bogs, which now represent a connected mire system. Notably, the area experiences elevated water outflow, a key factor promoting the development of a floating peatland. The phenomenon of flotation, when the upper layers of peat seem to float, is noted for peatlands that have large water bodies in the peat profile, which is associated with peat carpet formation [18].
Studies [18,25,26,47] have shown that the type of peat largely determines its hydrophysical properties, and an increase in peat bulk density is likely to lead to a decrease in surface oscillation. Peat with a low degree of decomposition and bulk density is characterized by high porosity, moisture capacity, peat compressibility, and swelling, which leads to an increase in hydraulic conductivity; this is an important effect for reducing mire surface oscillations and WTFs [26,40]. Our studies at GVM sites revealed no significant differences in the bulk density of the upper peat layer at key sites P3 and P5. In contrast, site P2 exhibited an increase in bulk density below a 20 cm depth, resulting in an increase in SO. In some studies [17], it has been suggested that SO is a function of the peat thickness and that areas with thicker peat are subject to greater surface fluctuation. Our GVM data showed the opposite trend: the amplitude of the fluctuations increased with a decrease in the thickness of the peat deposit and bulk density of the upper peat layer, which indicates that surface oscillations are largely determined by the local conditions of the studied section of the bog. Similar findings suggest greater surface variation in shallow bogs due to the fact that they are undergoing shrinkage [26].
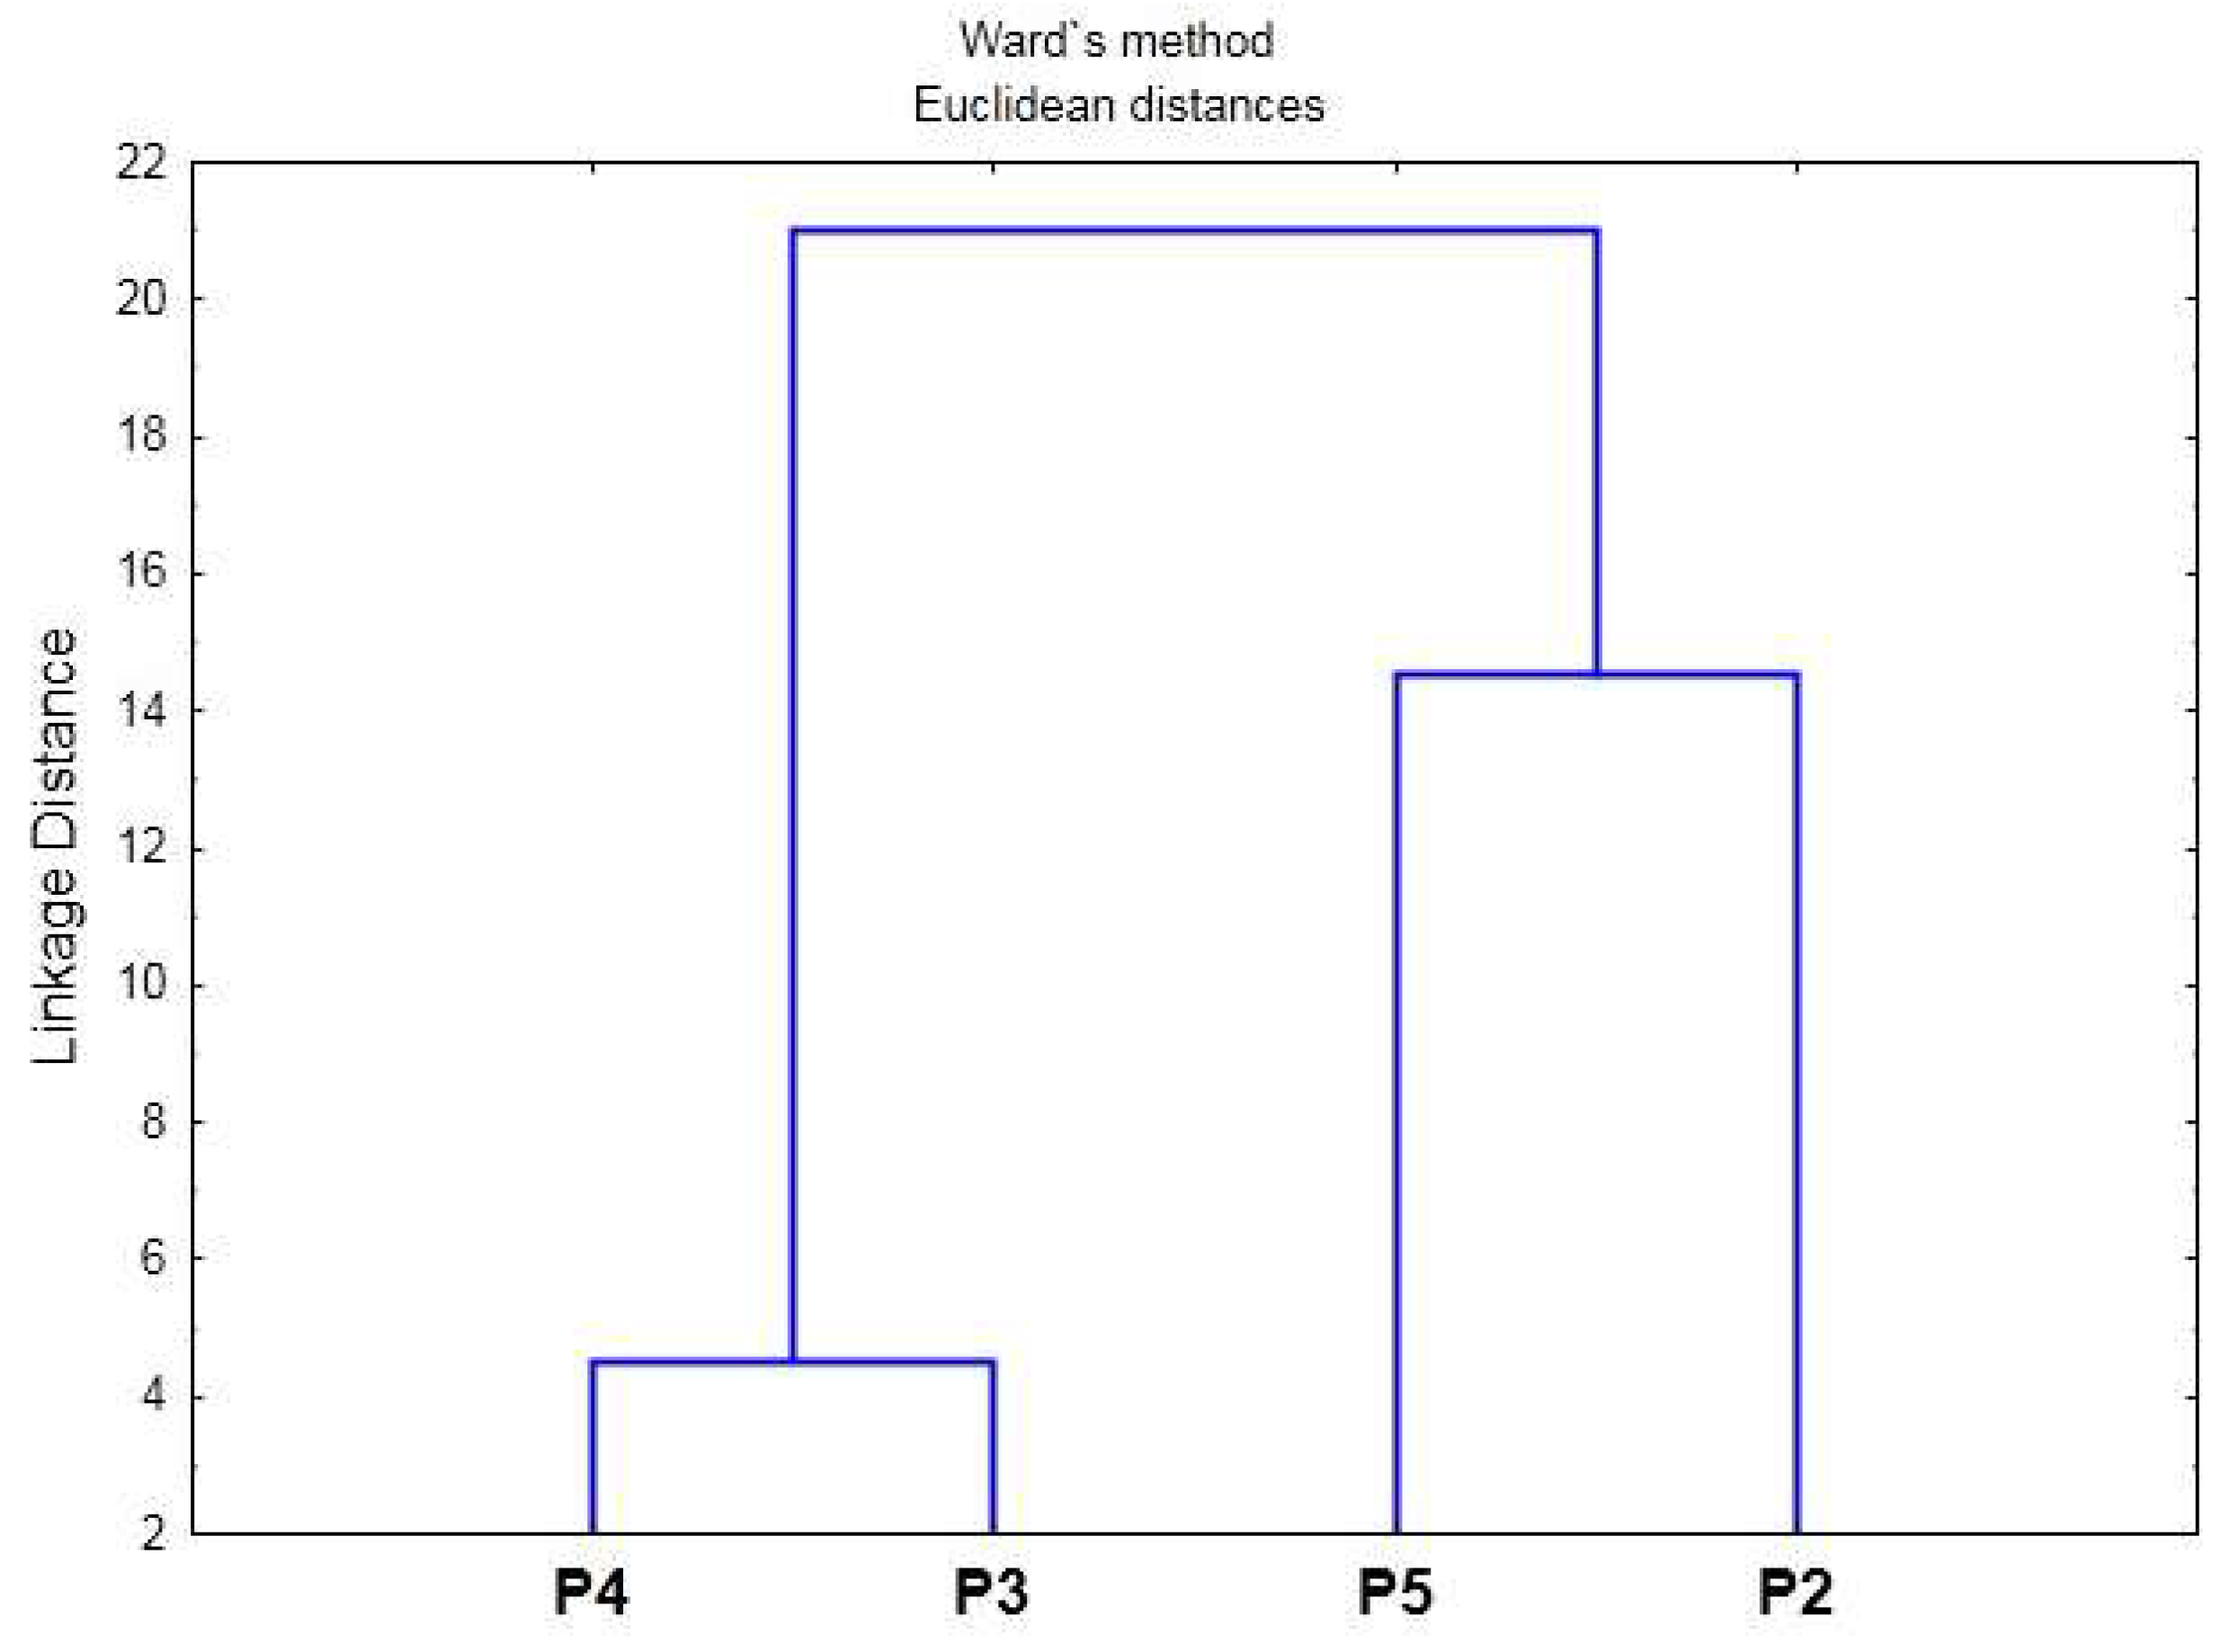
Spatial variation in SOs in the GVM depends not only on the type of plant community, but also on the location of the key sites relative to the water flow path. Cluster analysis of ASOs for the study period 2018–2025 distinguished two main groups (Figure 9). The first cluster grouped key sites within a similar pine–dwarf shrub–Sphagnum community with low pines (P3–P4). The second cluster included key sites with elevated surface oscillations (key sites P2 and P5). Two similar pine–dwarf shrub–Sphagnum communities with low pines exhibited comparable average ASO values, yet displayed distinct temporal variations in SOs throughout the study period (Figure 10).
Under conditions of increased precipitation, the long-term GVM data indicate a shift in SO values between 2021 and 2025 and the earlier period. Specifically, SO values declined at key sites P2 and P3, and rose at P4 and P5. This divergence correlates with reduced amplitude of SOs and an upward trend in the water table position. The observed water accumulation in the peat deposit directly influenced surface elevation dynamics: SE increased in the central part of the GVM, but decreased at the mire boundary.
This spatial pattern strongly suggests a reduction in lateral runoff during spring (April–May). Supporting evidence comes from studies of mires in the European part of Russia, where a decreasing trend in peat deposit freezing depth has been linked to lower spring runoff volumes [48].

5. Conclusions

Surface oscillation is an important mechanism for the hydrological self-regulation of mires: it prevents the attenuation of flooding by storing water during high precipitation events and snowmelt. Surface oscillation in the GVM varied from 14 to 25 cm in winter and early spring as a result of frost heaving, and from 2 to 16 cm in the frost-free period. Within large mire systems, such as the Great Vasyugan Mire, surface oscillation is influenced by several key factors: the developmental stage of the study site, the type of plant community present, and the location relative to water flow pathways. Our GVM studies revealed an increase in surface oscillation along a transect extending from the sedge–Sphagnum community to the pine–dwarf shrub–Sphagnum community, which runs parallel to the slope to the margin area.
Surface oscillation depends on the water table level variation, which is disturbed when the water level rises above the surface during freezing–thawing periods, and due to the release of biogenic gases. An analysis of the SE-WTL curves showed that the closest relationship was observed for the key site with a pine–dwarf shrub–Sphagnum community with tall pines, which is located close to the marginal part of the GVM. For all the key sites in the GVM, the phenomenon of hysteresis was observed when the linear relationship between the water table level and surface elevations was violated, which is associated with the processes of peat swelling and flotation. Flotation and frost heaving of the upper layers are the main reasons for highly fluctuating surface elevation of the peat, and vice versa: small fluctuations in surface elevation are associated with reversible compression and shrinkage. Our studies in the GVM confirm the occurrence of peat layer flotation during high-water periods in areas characterized by a sedge–Sphagnum community, which serve as active water track corridors. Within these zones, the liquefaction of the peat deposit was observed, indicating elevated hydrological activity and potential instability of the upper peat strata.
Mire surface oscillation is primarily influenced by antecedent moisture conditions and water table levels. Following increased precipitation, long-term records demonstrate a distinct spatial pattern in SO values shifts between 2021 and 2025 and previous periods. Specifically, SO values decreased at key sites dominated by pine–dwarf shrub–Sphagnum communities located closer to the marginal zone, whereas they slightly increased at sites proximal to the interfluve. As a result of water accumulation, surface elevation increased in the central part of the GVM but decreased at the mire boundary.
Our research holds significant value for mire restoration efforts, and it is crucial to consider the processes linked to climate change. Rising air temperatures associated with climate change will accelerate the biochemical oxidation of upper peat layers, triggering their subsequent decomposition. This process will cause irreversible alterations in the peat’s pore structure and a consequent reduction in the water storage capacity of mires.

Funding

This study was supported by the Russian Science Foundation, project no. 25-27-00584.

Data Availability Statement

https://disk.yandex.ru/d/9yjSmR_97rBC4Q (accessed on 9 June 2026).

Conflicts of Interest

The author declares no conflicts of interest.

References

  1. Waddington, J.M.; Morris, P.J.; Kettridge, N.; Granath, G.; Thompson, D.K.; Moore, P.A. Hydrological feedbacks in northern peatlands. Ecohydrology 2015, 8, 113–127. [Google Scholar] [CrossRef]
  2. Rezanezhad, F.; Price, J.S.; Quinton, W.L.; Lennartz, B.; Milojevic, T.; Van Cappellen, P. Structure of peat soils and implications for water storage, flow and solute transport: A review update for geochemists. Chem. Geol. 2016, 429, 75–84. [Google Scholar] [CrossRef]
  3. Bourgault, M.-A.; Larocque, M.; Garneau, M. Quantification of peatland water storage capacity using the water table fluctuation method. Hydrol. Process. 2017, 31, 1184–1195. [Google Scholar] [CrossRef]
  4. Holden, J.; Wallage, Z.E.; Lane, S.N.; McDonald, A.T. Water table dynamics in undisturbed, drained and restored blanket peat. J. Hydrol. 2011, 402, 103–114. [Google Scholar] [CrossRef]
  5. Luscombe, D.J.; Anderson, K.; Grand-Clement, E.; Gatis, N.; Ashe, J.; Benaud, P.; Smith, D.; Brazier, R.E. How does drainage alter the hydrology of shallow degraded peatlands across multiple spatial scales. J. Hydrol. 2016, 54, 1329–1339. [Google Scholar] [CrossRef]
  6. Potvin, L.R.; Kane, E.S.; Chimner, R.A.; Kolka, R.K.; Lilleskov, E.A. Effects of water table position and plant functional group on plant community, aboveground production, and peat properties in a peatland mesocosm experiment (PEATcosm). Plant Soil 2015, 387, 277–294. [Google Scholar] [CrossRef]
  7. Bispo, D.F.A.; Silva, A.C.; Christofaro, C.; Silva, M.L.N.; Barbosa, M.S.; Silva, B.P.C.; Barral, U.M.; Fabris, J.D. Hydrology and carbon dynamics of tropical peatlands from Southeast Brazil. Catena 2016, 143, 18–25. [Google Scholar] [CrossRef]
  8. Guo, Y.; Wan, Z.; Liu, D. Dynamics of dissolved organic carbon in the mires in the Sanjiang Plain, Northeast China. J. Environ. Sci. 2010, 22, 84–90. [Google Scholar] [CrossRef] [PubMed]
  9. Intergovernmental Panel on Climate Change (IPCC). Climate Change 2023: Synthesis Report; IPCC: Geneva, Switzerland, 2023. [Google Scholar] [CrossRef]
  10. Bragazza, L.; Buttler, A.; Robroek, B.J.M.; Albrecht, R.; Zaccone, C.; Jassey, V.E.J.; Signarbieux, C. Persistent high temperature and low precipitation reduce peat carbon accumulation. Glob. Change Biol. 2016, 22, 4114–4123. [Google Scholar] [CrossRef] [PubMed]
  11. Walker, T.N.; Garnett, M.H.; Ward, S.E.; Oakley, S.; Bardgett, R.D.; Ostle, N.J. Vascular plants promote ancient peatland carbon loss with climate warming. Glob. Change Biol. 2016, 22, 1880–1889. [Google Scholar] [CrossRef] [PubMed]
  12. Swindles, G.T.; Morris, P.J.; Mullan, D.J.; Payne, R.J.; Roland, T.P.; Amesbury, M.J.; Lamentowicz, M.; Turner, T.E.; Gallego-Sala, A.; Sim, T.; et al. Widespread drying of European peatlands in recent centuries. Nat. Geosci. 2019, 12, 922–928. [Google Scholar] [CrossRef]
  13. Feurdean, A.; Gałka, M.; Florescu, G.; Diaconu, A.-C.; Tănţău, I.; Kirpotin, S.; Hutchinson, S.M. 2000 years of variability in hydroclimate and carbon accumulation in western Siberia and the relationship with large-scale atmospheric circulation: A multi-proxy peat record. Quat. Sci. Rev. 2019, 226, 105948. [Google Scholar] [CrossRef]
  14. Lamentowicz, M.; Gałka, M.; Marcisz, K.; Słowiński, M.; Kajukało-Drygalska, K.; Dayras, M.D.; Jassey, V.E.J. Unveiling tipping points in long-term ecological records from Sphagnum-dominated peatlands. Biol. Lett. 2019, 15, 20190043. [Google Scholar] [CrossRef] [PubMed]
  15. Bertrand, G.; Ponçot, A.; Pohl, B.; Lhosmot, A.; Steinmann, M.; Johannet, A.; Pinel, S.; Caldirak, H.; Artigue, G.; Binet, P. Statistical hydrology for evaluating peatland water table sensitivity to simple environmental variables and climate changes application to the mid-latitude/altitude Frasne peatland (Jura Mountains, France). Sci. Total Environ. 2020, 754, 141931. [Google Scholar] [CrossRef] [PubMed]
  16. Ingram, H.A.P. Hydrology. In Moors: Swamp, Bog, Fen and Moor; Gore, A.J.P., Ed.; 511 Ecosystems of the World; Elsevier Science: New York, NY, USA, 1983; pp. 67–159. [Google Scholar]
  17. Howie, S.A.; Hebda, R.J. Bog surface oscillation (mire breathing): A useful measure in raised bog restoration. Hydrol. Process. 2018, 32, 1518–1530. [Google Scholar] [CrossRef]
  18. Fritz, C.; Campbell, D.I.; Schipper, L.A. Oscillating peat surface levels in a restiadpeatland, New Zealand-magnitude and spatiotemporal variability. Hydrol. Process. 2008, 22, 3264–3274. [Google Scholar] [CrossRef]
  19. Golubev, V.; Whittington, P. Effects of volume change on the unsaturated hydraulic conductivity of Sphagnum moss. J. Hydrol. 2018, 559, 884–894. [Google Scholar] [CrossRef]
  20. Acreman, M.; Holden, J. How wetlands affect floods. Wetlands 2013, 33, 773–786. [Google Scholar] [CrossRef]
  21. Kellner, E.; Halldin, S. Water budget and surface-layer water storage in a Sphagnum bog in central Sweden. Hydrol. Process. 2002, 16, 87–103. [Google Scholar] [CrossRef]
  22. Taminskas, J.; Linkevičienė, R.; Šimanauskienė, R.; Jukna, L.; Kibirkštis, G.; Tamkevičiūtė, M. Climate change and water table fluctuation: Implications for raised bog surface variability. Geomorphology 2018, 304, 40–49. [Google Scholar] [CrossRef]
  23. Glaser, P.H.; Chanton, J.P.; Morin, P.; Rosenberry, D.O.; Siegel, D.I.; Ruud, O.; Chasar, L.I.; Reeve, A.S. Surface deformations as indicators of deep ebullition fluxes in a large northern peatland. Glob. Biogeochem. Cycles 2004, 18, GB1003. [Google Scholar] [CrossRef]
  24. Kellner, E.; Waddington, J.M.; Price, J.S. Dynamics of biogenic gas bubbles in peat: Potential effects on water storage and peat deformation. Water Resour. Res. 2005, 41, W08417. [Google Scholar] [CrossRef]
  25. Strack, M.; Kellner, E.; Waddington, J.M. Effect of entrapped gas on peatland surface level fluctuations. Hydrol. Process. 2006, 20, 3611–3622. [Google Scholar] [CrossRef]
  26. Kennedy, G.W.; Price, J.S. A conceptual model of volume-change controls on the hydrology of cutover peats. J. Hydrol. 2005, 302, 13–27. [Google Scholar] [CrossRef]
  27. Reeve, A.S.; Glaser, P.H.; Rosenberry, D.O. Seasonal changes in peatland surface elevation recorded at GPS stations in the Red Lake Peatlands, northern Minnesota, USA. J. Geophys. Res. Biogeosci. 2013, 118, 1616–1626. [Google Scholar] [CrossRef]
  28. Waddington, J.M.; Kellner, E.; Strack, M.; Price, J.S. Differential peat deformation, compressibility, and water storage between peatland microforms: Implications for ecosystem function and development. Water Resour. Res. 2010, 46, W07538. [Google Scholar] [CrossRef]
  29. Olyunin, V.N. Geomorphologic Conditions for the Formation of Mires Scientific Prerequisites for the Development of Mires in Western Siberia; Nauka: Moscow, Russia, 1977; pp. 30–39. (In Russian)
  30. Sidorenko, A.V.; Rostovtsev, N.N.; Gurari, F.G.; Egorov, S.V. Geology of USSR, XLIV, part 1. In West Siberian Lowland; Sidorenko, A.V., Ed.; Nedra: Moscow, Russia, 1964; 661p. (In Russian) [Google Scholar]
  31. Vsevolozhsky, V.A. Resources of Groundwater in the Southern Part of the West Siberian Lowland; Nauka: Moscow, Russia, 1973; 88p. (In Russian)
  32. Kontorovich, A.E.; Nesterov, I.I.; Salmanov, F.K.; Surkov, V.S.; Trofimuk, A.A.; Ervieu, Y.G. Geology of Oil and Gas in Western Siberia; Nedra: Moscow, Russia, 1975; 679p. (In Russian) [Google Scholar]
  33. Rikhter, G.D. Western Siberia. In Relief and Geological Structure; Science Academy of USSR: Moscow, Russia, 1963; pp. 22–68. [Google Scholar]
  34. Kharanzhevskaya, Y.A.; Sinyutkina, A.A. Investigating the Role of bogs in the Streamflow Formation Within the Middle Ob Basin. Geogr. Nat. Resour. 2017, 38, 256–266. [Google Scholar] [CrossRef]
  35. Berezin, A.E.; Bazanov, V.A.; Skugarev, A.A.; Rybina, T.A.; Parshina, N.V. Great Vasyugan Mire: Landscape structure and peat deposit structure features. Int. J. Environ. Stud. 2014, 71, 618–623. [Google Scholar] [CrossRef]
  36. Kharanzhevskaya, Y.; Maloletko, A.; Sinyutkina, A.; Giełczewski, M.; Kirschey, T.; Michałowski, R.; Mirosław-Świątek, D.; Okruszko, T.; Osuch, P.; Trandziuk, P.; et al. Assessing mire-river interaction in a pristine Siberian bog-dominated watershed—Case study of a part of the Great Vasyugan Mire, Russia. J. Hydrol. 2020, 590, 125315. [Google Scholar] [CrossRef]
  37. Bazarov, A.V.; Badmaev, N.B.; Kurakov, S.A.; Gonchikov, B.M. Erratum to: A Mobile Measurement System for the Coupled Monitoring of Atmospheric and Soil Parameters. Russ. Meteorol. Hydrol. 2018, 43, 795–796. [Google Scholar] [CrossRef]
  38. Kalyuzhnyi, I.L.; Romanyuk, K.D. Variations of the water regime of bogs of northern and northwestern Russia under influence of climatic factors. Russ. Meteorol. Hydrol. 2010, 35, 490–499. [Google Scholar] [CrossRef]
  39. Kalyuzhnyi, I.L.; Lavrov, S.A.; Romanyuk, K.D. Variations in water regime of bogs in northern and northwestern Russia under the effect of climatic factors. Water Resour. 2012, 39, 44–55. [Google Scholar] [CrossRef]
  40. Ivanov, K.E.; Novikov, S.M. Peatlands of Western Siberia, Their Structure and Hydrological Regime; Ivanov, K.E., Novikov, S.M.L., Eds.; Gidrometeoizdat: St. Petersburg, Russia, 1976; 447p. (In Russian) [Google Scholar]
  41. Inisheva, L.I.; Zemtsov, A.A.; Novikov, S.M. Vasyugan Mire: Natural Conditions, Structure and Functioning; Tomsk State Pedagogical University Press: Tomsk City, Russia, 2011; p. 162. [Google Scholar]
  42. Bleuten, W.; Zarov, E.; Schmitz, O. A high-resolution transient 3-dimensional hydrological model of an extensive undisturbed bog complex in West Siberia. Mires Peat 2020, 26, 25. [Google Scholar] [CrossRef]
  43. Dyukarev, E.; Filippova, N.; Karpov, D.; Shnyrev, N.; Zarov, E.; Filippov, I.; Voropay, N.; Avilov, V.; Artamonov, A.; Lapshina, E. Hydrometeorological dataset of West Siberian boreal peatland: A 10-year records from the Mukhrino field station. Earth Syst. Sci. Data 2020, 13, 2595–2605. [Google Scholar] [CrossRef]
  44. Kharanzhevskaya, Y.A. Water table level dynamics in the drained part of the great Vasyugan mire. Bull. Tomsk Polytech. Univ. Geo Assets Eng. 2023, 334, 97–108. (In Russian) [Google Scholar] [CrossRef]
  45. Ise, T.; Dunn, A.; Wofsy, S.; Moorcroft, P.R. High sensitivity of peat decomposition to climate change through water-table feedback. Nat. Geosci. 2008, 1, 763–766. [Google Scholar] [CrossRef]
  46. Volkova, I.I.; Volkov, I.V.; Morozova, Y.A.; Nikitkin, V.A.; Vishnyakova, E.K.; Mironycheva-Tokareva, N.P. Water Holding Capacity of Some Bryophyta Species from Tundra and North Taiga of the West Siberia. Water 2023, 15, 2626. [Google Scholar] [CrossRef]
  47. McCarter, C.P.R.; Rezanezhad, F.; Quinton, W.L.; Gharedaghloo, B.; Lennartz, B.; Price, J.; Connon, R.; Van Cappellen, P. Pore-scale controls on hydrological and geochemical processes in peat: Implications on interacting processes. Earth-Sci. Rev. 2020, 207, 103227. [Google Scholar] [CrossRef]
  48. Batuyev, V.I.; Kalyuzhniy, I.L. Analysis of the Factors Determining Many-year Changes of Runoff from Oligotrophic Bogs. Water Sect. Russ. 2020, 6, 28–46. (In Russian) [Google Scholar] [CrossRef]
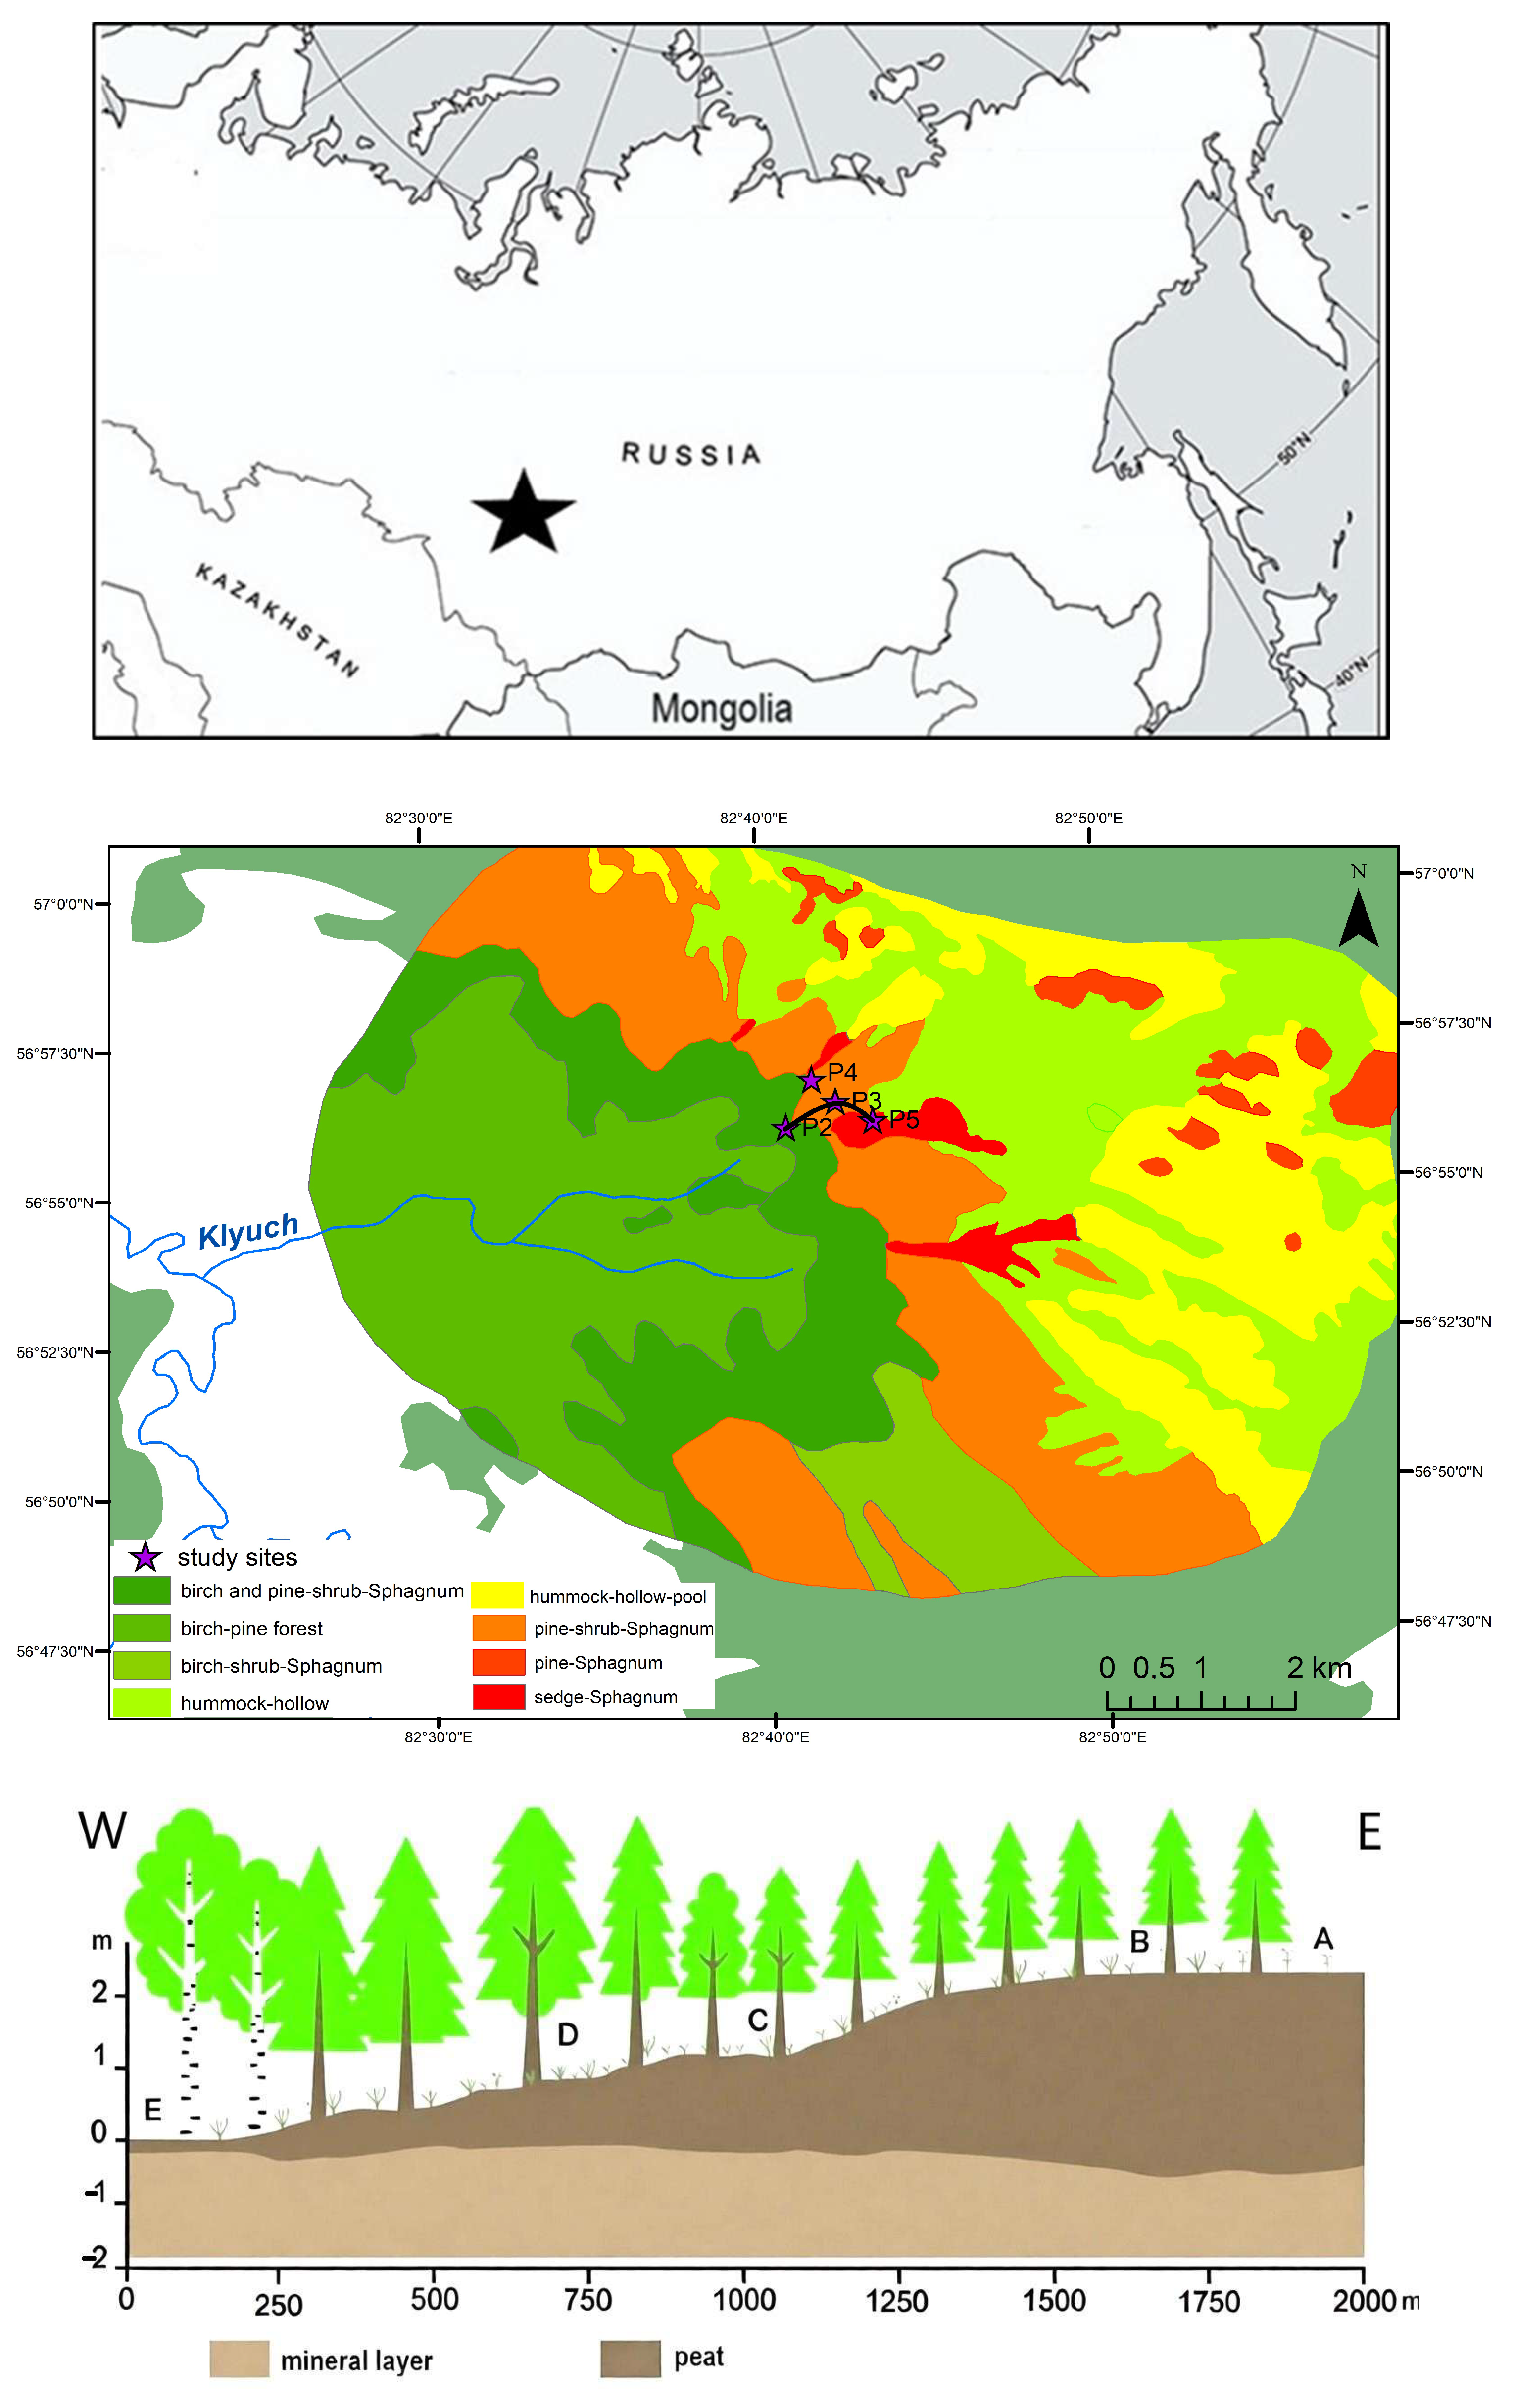
Figure 1. A map of the study area with surface oscillation and WTL monitoring sites (A—key site P5, B—key site P3, C—key site P2, D—swamp forest marginal zone, and E—Klyuch River headwater).
Hydrology 13 00162 g001
Figure 2. Annual sums of precipitation and air temperature at the Bakchar station from 2017 to 2025 (data source: http://meteo.ru/); line—air temperature, columns—precipitation.
Hydrology 13 00162 g002
Figure 3. Time series of the daily WTLs in the northeastern part of the GVM for 2017–2025.
Hydrology 13 00162 g003
Figure 4. Surface elevation and WTL dynamics in Great Vasyugan Mire, 2017–2025.
Hydrology 13 00162 g004aHydrology 13 00162 g004b
Figure 5. Monthly precipitation and temperature dynamics in 2017–2025, according to Bakchar meteostation (data source: http://meteo.ru/).
Hydrology 13 00162 g005
Figure 6. Annual surface oscillation (ASO) in the Great Vasyugan Mire, 2017–2025 (Note: the data for P4 cover only the period 2019–2025).
Hydrology 13 00162 g006
Figure 7. The relation between the monthly surface oscillation (MSOs) and total monthly precipitation in 2018–2019.
Hydrology 13 00162 g007
Figure 8. Relations between the bog surface elevation (SE) and the WTL in meters above sea level (m asl) in the GVM.
Hydrology 13 00162 g008
Figure 9. Cluster analysis dendrogram for ASOs of studied key sites in GVM.
Hydrology 13 00162 g009
Figure 10. Long-term surface oscillation dynamics at the key sites in the Great Vasyugan Mire, 2017–2025 (SO—surface oscillation, cm from the stable mark, and days from the first estimation of surface oscillation 4 October 2017).
Hydrology 13 00162 g010
Table 1. Hydrological conditions and selected plant species.
SiteKey SitesAverage WTL, m bglEC, µS/cmSelected Plant Species
Great Vasyugan MireP2−0.2739Pinus sylvestris, Ledum palustre, Chamaedaphne calyculata, S. angustifolium, Carex globularis, and Carex rostrata
P3−0.1746Pinus sylvestris, Ledum palustre, Chamaedaphne calyculata, Andromeda polifolia, and S. fuscum
P4−0.1133Pinus sylvestris, Ledum palustre, Chamaedaphne calyculata, S. fuscum, and S. divinum
P5−0.0827Chamaedaphne calyculata, Andromeda polifolia, Oxycoccus microcarpus, Eriophorum vaginatum, Carex rostrata, S. balticum, and S. divinum
Table 2. Meteorological conditions of studied years according to Bakchar meteorological station in comparison with multi-year data (Pn).
DescriptionYearPrecipitation (P), mmP/Pn
Wet20175661.18
Wet20186771.38
Normal20194320.90
Normal20204670.97
Normal20214971.03
Normal20225451.13
Normal20235021.04
Wet20246711.39
Wet20255901.23
Table 3. Snow cover peculiarities in the northeastern part of the GVM in 2018–2025.
YearP2P3P5
Max Snow Depth, cmMax
Freezing
Depth, cm
Max Snow Depth, cmMax
Freezing
Depth, cm
Max Snow Depth, cmMax
Freezing
Depth, cm
2018701964195317
2019811678137813
2020711769154817
2021765072325631
2022544054373733
2023773272305220
2024754076375332
2025394032151222
Table 4. Surface oscillation data from different regions.
SourceRegionTrophic TypeAnnual Surface
Oscillation, cm
1[27]USA,
northern Minnesota
Fen
Bog
7
6
2[28]Quebec, CanadaPoor, open fen2–9
3[17]Burns Bog, southwest coast of British Columbia, CanadaBog2–34
4[18]North Island
New Zealand
Poor fen10–28
5This studyGreat Vasyugan Mire, Western Siberia, RussiaBog2–25
Disclaimer/Publisher’s Note: The statements, opinions and data contained in all publications are solely those of the individual author(s) and contributor(s) and not of MDPI and/or the editor(s). MDPI and/or the editor(s) disclaim responsibility for any injury to people or property resulting from any ideas, methods, instructions or products referred to in the content.