Article

The Spectral Illusion of Crop Health: Evaluating the Groundwater Cost of Agricultural Maladaptation in the Souss-Massa Basin (Morocco)

by
Maryame El-Yazidi
1,*,
Mohammed Benabdelhadi
1,
Brahim Benzougagh
2,3,*,
Yasmine Boukhlouf
1,
Malika El-Hamdouny
4,
Manal El Garouani
4,
Mohammed Mouad Mliyeh
4,
Hassan Tabyaoui
4,
Zineb El Attar Soufi
1,
Soukaina El Aissaoui
5,
Khaled Mohamed Khedher
6 and
Abderrahim Lahrach
4
1
Laboratory of Applied Organic Chemistry, Faculty of Science and Technology (FST), Sidi Mohamed Ben Abdellah University, P.O. Box 2202, Fez 30000, Morocco
2
Geophysics and Natural Hazards Laboratory, Department of Geomorphology and Geomatics, Scientific Institute, Mohammed V University in Rabat, Avenue Ibn Battouta, Agdal, Rabat 10106, Morocco
3
Laboratory of Geoengineering and Environment, Cartography and Tectonophysics Team (CaTec), Department of Geology, Faculty of Sciences, Moulay Ismail University, Meknes 50000, Morocco
4
Laboratory of Geo-Resources and Environment, Faculty of Science and Technology (FST), Sidi Mohamed Ben Abdellah University, Fez 30000, Morocco
5
Laboratory of Natural Environments: Planning and Socio-Spatial Dynamics, Faculty of Letters and Human Sciences (FLSH), Sidi Mohamed Ben Abdellah University, Fez 30000, Morocco
6
Department of Civil Engineering, College of Engineering, King Khalid University, Abha 61421, Saudi Arabia
*
Authors to whom correspondence should be addressed.
Hydrology 2026, 13(5), 132; https://doi.org/10.3390/hydrology13050132
Submission received: 19 April 2026 / Revised: 9 May 2026 / Accepted: 11 May 2026 / Published: 13 May 2026

Abstract

The Souss-Massa basin, one of Morocco’s major agricultural regions, is increasingly affected by water scarcity and climatic stress. However, the long-term interactions between hydro-climatic change and farmers’ cropping system adjustments remain insufficiently documented. This study analyzes hydro-climatic trends and agricultural transformations over the period 1995–2021. The methodology combines statistical trend analysis of meteorological data (Mann–Kendall test and Sen’s slope estimator), diachronic land use/land cover mapping using Google Earth Engine, Crop Water Stress Index (CWSI) assessment, and groundwater piezometric analysis. Results reveal declining and highly variable precipitation, together with a significant warming trend reaching +0.116 °C/year. In parallel, cultivated cereal areas (rainfed and irrigated) declined, while irrigated forage crops expanded, particularly Berseem/Maize. Despite increasing aridity, CWSI results indicate maintained crop vigor in irrigated areas, suggesting growing dependence on groundwater extraction. These findings highlight an ongoing agricultural transition that increases pressure on already vulnerable water resources and underscores the need for integrated climate adaptation and groundwater management strategies in the basin.

1. Introduction

Climate change is one of the major challenges of the 21st century, characterized by rising global temperatures and significant alterations in the hydrological cycle [1,2].
Driven largely by anthropogenic greenhouse gas emissions, these changes have increased the frequency and intensity of extreme events such as droughts, floods, and wildfires [3,4,5,6]. Among the most vulnerable regions, North and West Africa have experienced recurrent droughts since the 1970s, resulting in land degradation, crop failures, food insecurity, and migration pressures [7,8,9,10,11].
In Morocco, climate change is reflected by a significant increase in mean annual temperature and a sustained decline in annual precipitation [12,13]. Records from 1971 to 2000 indicate a rainfall deficit of nearly 15%, punctuated by severe drought episodes during 1982–1984 and 1994–1995 [14]. Reduced precipitation combined with increasing evapotranspiration has significantly affected the availability of water resources at both local and regional scales [15]. As a result, the Moroccan agricultural sector remains highly vulnerable because production strongly depends on irregular rainfall patterns and declining reservoir and groundwater reserves [16].
The Souss-Massa basin represents one of the most strategic agricultural regions in Morocco, internationally recognized for the production and export of off-season fruits and vegetables. However, it is also one of the country’s most water-stressed basins. The combined effects of climatic drying, demographic growth, and agricultural expansion have generated severe pressure on available water resources, leading to chronic groundwater overexploitation estimated at nearly 300 Mm3 annually [17]. These conditions make the basin a particularly relevant case study for analyzing climate–agriculture interactions under semi-arid conditions.
Despite extensive evidence of hydrological deficit and climatic stress in Morocco, an important research gap remains regarding the long-term spatiotemporal dynamics of farmers’ adaptation strategies in the Souss-Massa basin. In particular, few studies have quantitatively linked deteriorating climatic conditions with the progressive shift from traditional rainfed cereal systems toward more profitable but water-intensive forage crops.
To address this gap, the present study provides a comprehensive analysis of climatic trends and cropping system transformations in the Souss-Massa basin over the period 1995–2021. Three central hypotheses are examined: (1) declining precipitation and rising temperatures have significantly altered the agro-climatic suitability of the basin; (2) farmers have progressively shifted from traditional cereal systems toward more profitable irrigated forage crops; and (3) this agricultural transition has contributed to increasing groundwater pressure. Accordingly, the objectives are to quantify long-term climatic trends using historical meteorological data, analyze the decline of cereal systems and expansion of forage crops, and discuss the sustainability and policy implications of these transformations.

2. Materials and Methodology

2.1. Study Area

The Souss-Massa Basin, situated in the middle West portion of Morocco, is 27,000 square kilometres in total area. Approximately 21% of this area is plain (5700 km2), and 79% is hilly terrain (21,300 km2) with the terrain being surrounded by the Anti-Atlas Mountains to the South, the High Atlas Massif to the North, the Siroua Massif to the East, and the Atlantic Ocean to the West. Elevations within this basin range from sea level on the Atlantic Coast to 4168 m at the summit of Mount Toubkal in the High Atlas. The Souss-Massa basin includes two significant plains: the Souss Plain and the Chtouka-Massa Plain, which have distinct elevations between 0 and 700 m above sea level. In terms of governance, the Souss-Massa basin has many territories, including the Prefectures of Agadir Ida-Outanane and Inezgane-Aït Melloul, as well as the Provinces of Taroudant and Tiznit.
The climate of this area is characterized as semi-arid to semi-desertic, with a moderate maritime effect on the West side of the region and a warmer, semi-continental climate in the East. The cold oceanic winds that blow from the Atlantic (including the Canary Current) and the warm Saharan winds have a major impact on the local climatic conditions [18]. In terms of annual precipitation, the variability in this area is extreme, ranging from an average amount of precipitation during a wet year to ten times less than the annual average during a dry year [19]. The extreme temporal and spatial differences in precipitation within this area have been demonstrated by the dramatic decrease in precipitation from the mountainous areas down to the lower areas. The average amount of precipitation across these lower areas is between 250 and 300 mm per year, while at higher altitudes it averages between 500 and 600 mm per year [20]. Most of the precipitation occurs between November and March, and the dry season lasts from May through October [21]. In Morocco, annual temperatures vary from an average of 14 degrees Celsius in the High Atlas region to an average of 20 degrees Celsius in the Anti-Atlas region.
Annual evaporation also varies between different regions; evaporation in mountainous areas adjacent to the Atlantic coast averages 1400 (mm) annually, while evaporation in the plains of Souss, Massa, and Tiznit averages 2000 mm annually. The minimum (maximum) evaporation amounts were recorded in January (July) for both mountainous and plain areas; in mountainous regions, monthly evaporation averaged 35 mm and 240 mm; in plain areas, monthly evaporation averaged 100 mm and 270 mm [22].
In Morocco, the Souss-Massa region has become a significant agricultural centre for socio-economic development at both a local and national level. However, as agriculture continues to grow and climate change impacts the region, the increasing use of groundwater resources for irrigation will lead to further pressure on the aquifer system. As a result, the levels of the water table in the Souss-Massa region will continue to decline and the quality of water will become degraded [23].
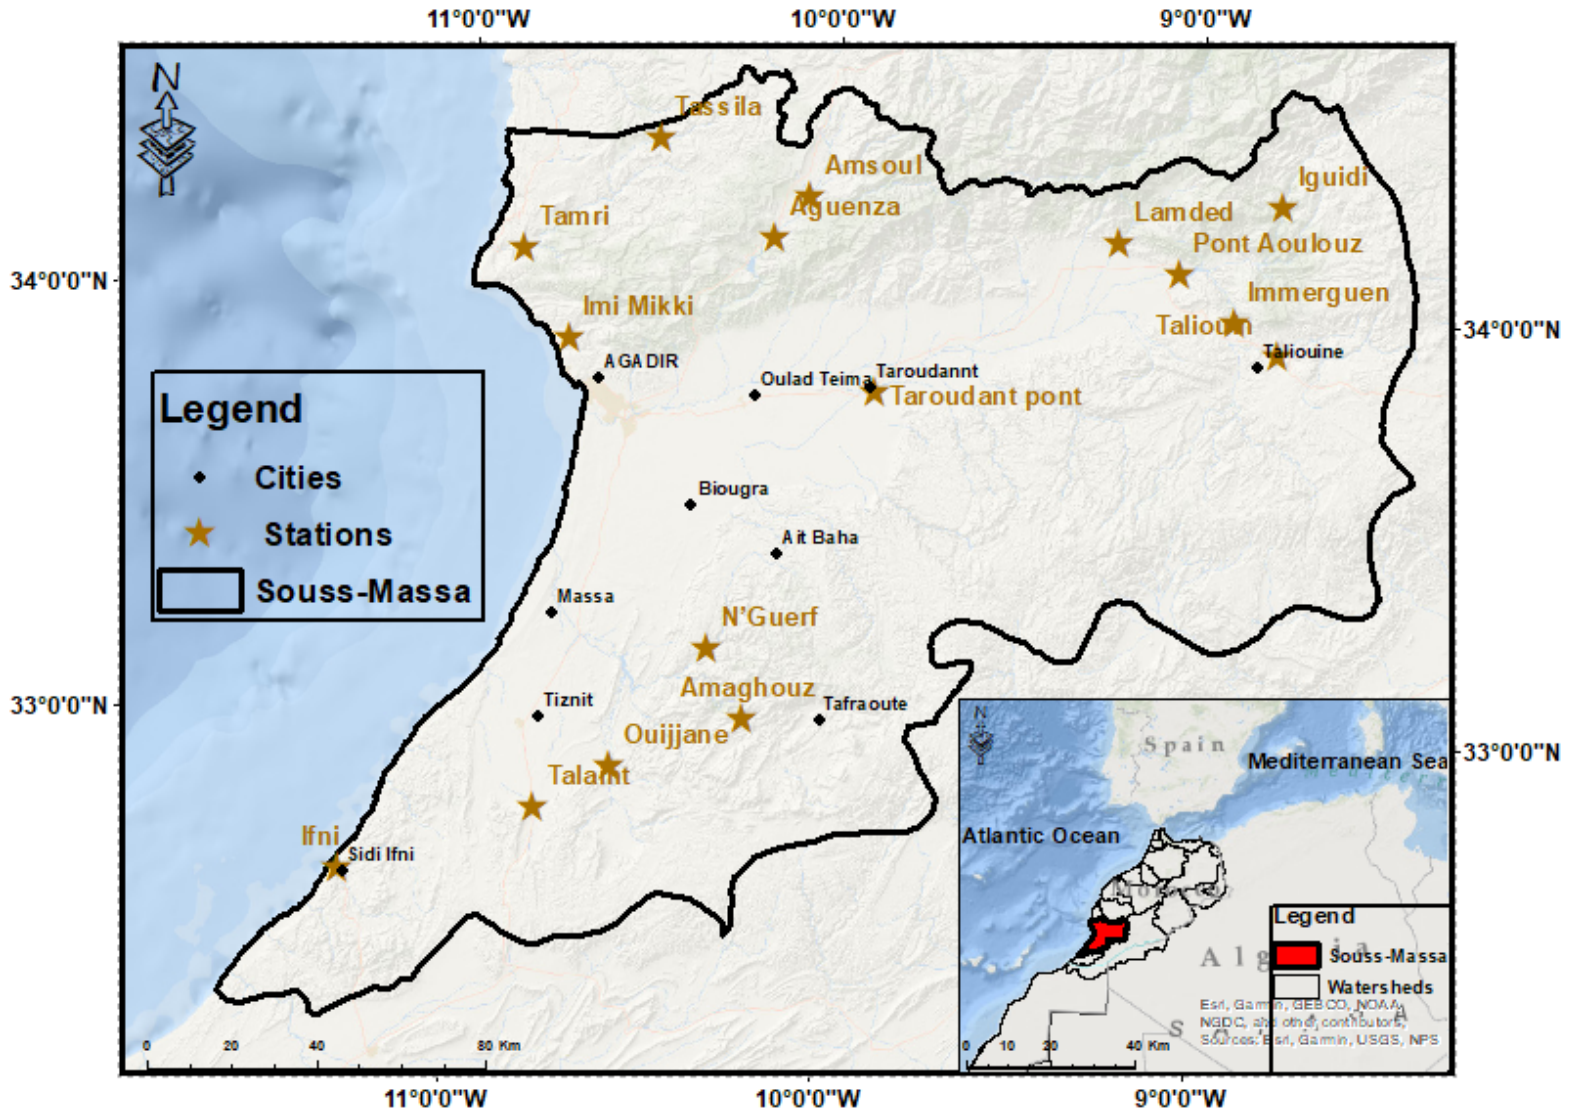
To contextualize the quantitative data, fieldwork was conducted to survey the major agricultural and socio-economic dynamics within the region. These surveys gathered empirical data on farmers’ adaptation strategies, crop choices, and water management practices in response to recurring drought conditions. To geographically contextualize the research, a detailed location map (Figure 1) of the study area, including the distribution of meteorological stations and the hydrological network, was generated using ArcGIS software (version 10.8).
Table 1 presents the geographical characteristics of the meteorological stations used in this study. The five selected stations are spatially distributed across the Souss-Massa watershed and were chosen to capture the main climatic gradients of the basin. Coastal stations, such as Agadir and Tamri, are influenced by the Atlantic Ocean and therefore experience relatively moderate temperatures and more stable climatic conditions. In contrast, inland stations such as Taroudant and Ouijjane are located in semi-arid environments characterized by higher thermal amplitudes and greater rainfall variability. The Aoulouz station, situated in the upstream mountainous zone, reflects more continental conditions associated with higher elevation. This spatial configuration provides a representative and reliable observation network for analyzing the temporal evolution of hydro-climatic variability across the watershed.

2.2. Data Collection (Climatic, Piezometric, and Agricultural Datasets)

To assess the spatiotemporal hydro-climatic variations and their agricultural impacts, extensive historical time-series data covering the period from 1995 to 2021 were compiled. The comprehensive database comprises three main components: (1) Climatic data: Daily precipitation data were acquired from the Souss-Massa Hydraulic Basin Agency (ABSHM), while minimum and maximum temperature records were provided by the Moroccan General Directorate for Meteorology (DGM), collected from five meteorological stations distributed across the basin (Agadir, Ouijjane, Tamri, Aoulouz, and Taroudant); (2) Piezometric data: Groundwater level records for the three main aquifers in the region (Souss, Tiznit, and Chtouka) were sourced from the ABSHM; (3) Agricultural statistics: Detailed data on cultivated areas and crop productions specifically focusing on irrigated cereals, rain-fed cereals (bour), and fodder crops were obtained from the Souss-Massa Regional Directorate of Agriculture (DRAS).

2.3. Climatic Data Processing and Trend Analysis

All climatic data processing and the extraction of graphical profiles for precipitation and temperature were executed using the Python programming language (employing libraries such as Pandas (version 2.0.3), SciPy (version 1.11.1), and Matplotlib (version 3.7.2)/Seaborn (version 0.12.2)). To objectively evaluate the long-term climatic dynamics over the 1995–2021 period, two robust non-parametric statistical tests were employed. These methods are highly recommended by the World Meteorological Organization (WMO) as they do not require the data to follow a normal distribution and are resilient to outliers.
  • Mann–Kendall Trend Test
The Mann–Kendall (MK) test [24,25] was applied to the hydro-meteorological time series using the pymannkendall library [26] to identify whether a significant monotonic trend exists. The M-K test is given below:
S = i = 1 n 1 j = i + 1 n sgn ( x j x i   ) ,
sgn ( x j x i   ) =   + 1 ,   i f x j x i   > 0 0 ,   i f x j x i   = 0 1 ,   i f x j x i   < 0  
where n is the length of the time series data, xi and xj are the values of the time series at timestamps i and j, respectively. If n > 10, the statistic S is an approximate value of the standard normal test statistic (Z), which can be utilized for testing the trend as follows:
Z =     S 1 V a r ( S ) ,   i f   S > 0 0 ,   i f   S = 0 S + 1 V a r ( S ) ,   i f   S < 0  
V a r ( S ) = n ( n 1 ) ( 2 n + 5 ) i = 1 m t i ( t i 1 ) ( 2 t i + 5 ) 18
where n is the length of the time series data, m is the number of times datasets are repeated in the time series data, and t represents the repeated data values in the ith group. The null hypothesis can be rejected if |Z| > Z1 − α/2, i.e.,
  • Sen’s Slope Estimator
While the MK test determines the existence of a trend, Sen’s slope estimator [27] was applied to quantify the true magnitude and rate of change of the observed climatic trends. Sen’s slope is computed as follows:
S l o p e   = M e d i a n x j x i   j     i   , 1 i j n ,
where xi and xj are the values at times i and j, respectively, and 1 ≤ i < jn, refers to the time series data length (i.e., 27 years from 1995 to 2021) in the current study. The slope sign reflects the data trend, indicating the rate of variation of the time series data. Slope > 0 means the upward trend, and Slope < 0 indicates a downward trend.

2.4. Agricultural Dynamics and Land Use/Land Cover (LULC) Mapping

The temporal evolution of agricultural parameters (cultivated areas and crop production) was analyzed and graphed using Python (version 3.10). To assess the strength of the linear relationships between these agricultural indicators and climatic parameters, Pearson’s correlation coefficient (r) was calculated.
Spatially, Land Use and Land Cover (LULC) maps were generated for five key historical periods (1995, 2005, 2010, 2015, and 2020) using Google Earth Engine (GEE), leveraging its cloud-computing capabilities to process large satellite image archives [28]. This analysis utilized surface reflectance data from Landsat 5 TM, Landsat 7 ETM+, and Landsat 8 OLI/TIRS (United States Geological Survey (USGS)/National Aeronautics and Space Administration (NASA), Reston, VA, USA).
A supervised machine-learning classification approach based on the Random Forest algorithm was applied within Google Earth Engine to accurately map land use/land cover categories. Random Forest was selected because of its robustness, high classification accuracy, and wide applicability in remote sensing studies. The workflow included image preprocessing, feature extraction, model training using reference samples, and final map generation.
For the most recent classification year (2020), an independent accuracy assessment was conducted using a random split of the reference dataset into 70% training samples and 30% validation samples. Classification performance was evaluated using a confusion matrix, overall accuracy, producer accuracy, user accuracy, and Cohen’s Kappa coefficient. The 2020 classification achieved an overall accuracy of 97.1% and a Kappa coefficient of 0.963, indicating excellent classification reliability.
For earlier historical years, direct pixel-level validation was limited by the absence of consistent historical ground-reference data and the restricted availability of high-resolution imagery. Therefore, a full independent validation was only feasible for the most recent year (2020), for which reliable reference information was available. Nevertheless, all historical classifications were produced using the same methodological workflow to ensure temporal consistency and comparability.
The five resulting spatial outputs were subsequently extracted and processed in ArcGIS (version 10.8) to perform a diachronic analysis and produce a comprehensive LULC change map, directly quantifying land-cover transformations between the baseline year of 1995 and 2020.

2.5. Water Balance Assessment

The water balance assessment was conducted to evaluate the evolution of hydrological deficits within the Souss-Massa basin during the period 1995–2021. The analysis was based on annual precipitation records, evapotranspiration estimates, irrigation water demand, and groundwater abstraction data obtained from the Souss-Massa Hydraulic Basin Agency (ABSHM) and the Moroccan General Directorate of Meteorology (DGM). The hydrological balance was estimated by comparing renewable water inputs with agricultural water consumption and groundwater withdrawals. This approach allowed for the identification of periods of increasing water deficit and hydrological stress associated with climatic aridification and agricultural intensification.

2.6. Groundwater Piezometric Evolution

To understand the hydrological response to the identified climatic trends and the shifting agricultural water demand, the secular phylogeny of the region’s groundwater resources was analyzed. Graphical representations of the piezometric data (1995–2021) were generated to monitor the drawdown and quantitative status of the Souss, Tiznit, and Chtouka aquifers, providing a clear visualization of groundwater depletion over the study period.

2.7. Crop Water Stress Index (CWSI) Modeling

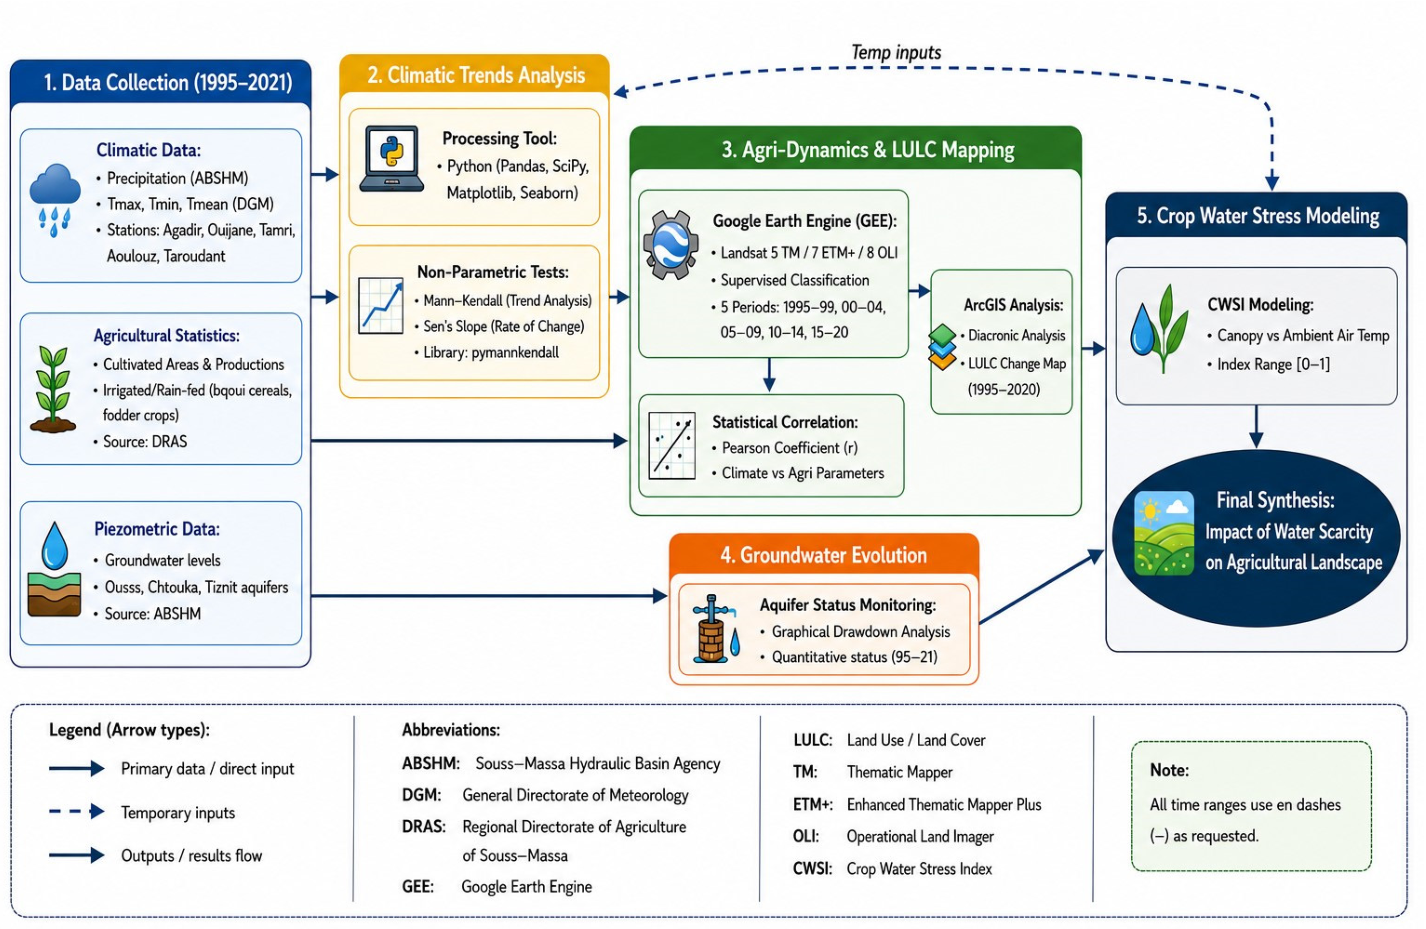
Finally, the quantitative approach incorporates the Crop Water Stress Index (CWSI) to accurately value the degree to which crop development is constrained by limited soil moisture under the region’s climatic conditions. The CWSI is computed based on the differential gear between the canopy temperature and the ambient air temperature, yielding a standardized index ranging from 0 (optimal irrigation conditions with no stress) to 1 (maximum water stress and stomatal closure) [29,30]. By mapping the CWSI longitudinally, this research dynamically quantifies the interaction between intensifying water scarcity, crop yield decline, and the shifting agricultural landscape in the basin (Figure 2).
The methodological framework adopted in this study integrates climatic, agricultural, hydrological, and remote sensing analyses within a sequential and interconnected workflow. First, long-term climatic variability was assessed using precipitation and temperature datasets through the Mann–Kendall trend test and Sen’s slope estimator. Subsequently, agricultural statistics related to cereal and fodder crop dynamics were analyzed and correlated with climatic variability using Pearson correlation analysis. To spatially evaluate agricultural transformations, Land Use/Land Cover (LULC) mapping was conducted using Google Earth Engine and ArcGIS (version 10.8). The resulting agricultural changes were then compared with groundwater piezometric evolution in the Souss, Chtouka, and Tiznit aquifers in order to assess the hydrological consequences of agricultural adaptation strategies. Finally, Crop Water Stress Index (CWSI) modeling was performed to quantify the spatial distribution of crop water stress and evaluate the interaction between climatic aridification, irrigation practices, and groundwater exploitation across the basin.

3. Results

The results represent a comprehensive assessment of the spatiotemporal hydro-climatic dynamics within the Souss-Massa watershed and their cascading impacts on regional water resources and agricultural systems in the 1995–2021 period. According to the analytical framework established in the methodology, these results are presented in a sequential approach to decipher the region’s environmental vulnerability. First, the temporal evolution of precipitation and temperature is presented at five key meteorological stations (Agadir, Ouijjane, Aoulouz, Tamri, and Taroudant). These observed climate trends are statistically validated using the non-parametric Mann–Kendall test and Sen’s slope estimator to determine the baseline of regional climate change. The agricultural consequences of these rising water shortages are revealed through statistical correlations (Pearson’s r) between climatic changes and crop yield. This quantitative analysis is complemented by a diachronic land use and land cover (LULC) mapping between 1995 and 2020, that spatially follows the expansion of water-demanding irrigated fodder crops and the reduction in traditional rainfed crops. After this climatic and agricultural background, the paper examines the hydrological changes of the area by measuring the piezometric decline and the exploitation of groundwater in the Souss, Chtouka, and Tiznit aquifers.
Finally, these climatic, hydrological, and agronomic variables are synthesized through Crop Water Stress Index (CWSI) spatial mapping, providing a dynamic understanding of how escalating water stress directly limits overall crop development across the catchment.

3.1. Interannual Variations and Trends in Precipitation

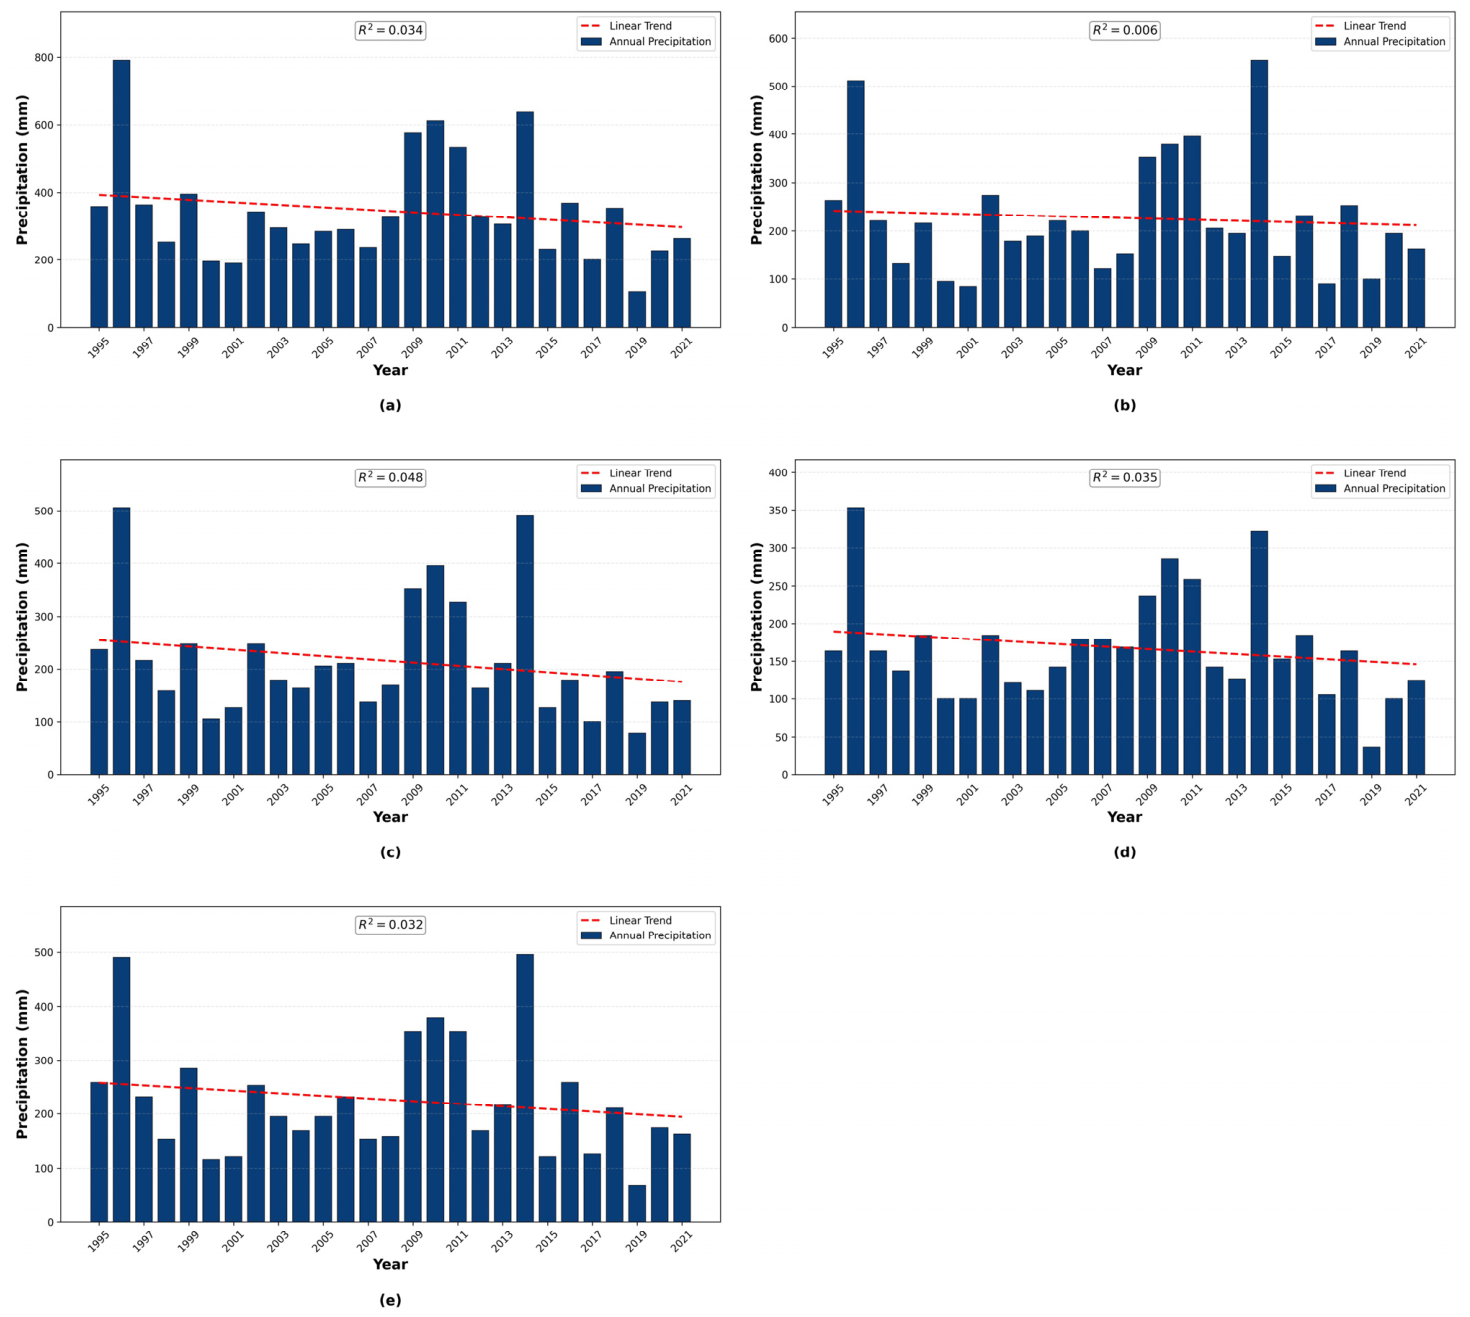
The spatial analysis of the annual precipitation shows strong interannual variability throughout the Souss-Massa watershed with strong changes between wet and dry years (Figure 3). Three main periods can be distinguished in time: a relatively wet baseline (1995–1997), a very irregular phase (1998–2016), and a current period of severe aridification (2017–2021). At coastal stations such as Agadir and Tamri, the oceanic influence historically remained at an average precipitation of around 200–500 mm before 2016, despite strong fluctuations (e.g., the exceptionally wet year 1996). However, since 2018, precipitation amounts have declined sharply, remaining consistently below 200 mm in Agadir and below 100 mm in Tamri. A similar downward trend can be seen in Ouijjane, where annual totals are now frequently falling below the 100 mm mark, indicating increasingly dry conditions.
Inland stations reflecting a more continental climate show even greater heterogeneity. Aoulouz and Taroudant recorded significant historical peaks (490.4 mm at Taroudant in 1996 and notable events in 2009 and 2014). Nevertheless, during the 2017–2021 period, the precipitation collapsed, with most annual totals falling well below 200 mm. The years 2000, 2008, 2016, and 2020 are the driest of the study period in the entire basin. To statistically verify this observed decline, the non-parametric Mann–Kendall (MK) test and Sen’s slope estimator were applied (Table 2). The findings show a general decreasing trend at all stations, with Sen’s slope values ranging from −1.11 mm/year (Tamri) to −2.64 mm/year (Agadir). Even though these downward trends are quite visible and hydrologically impactful, the calculated p-values remain above 0.05. This absence of a high level of statistical significance points out that the drying up of rainfall in the region is marked by extreme irregularity and fluctuations rather than a totally linear monotonic decrease.

3.2. Accelerated Warming Trends and Thermal Dynamics

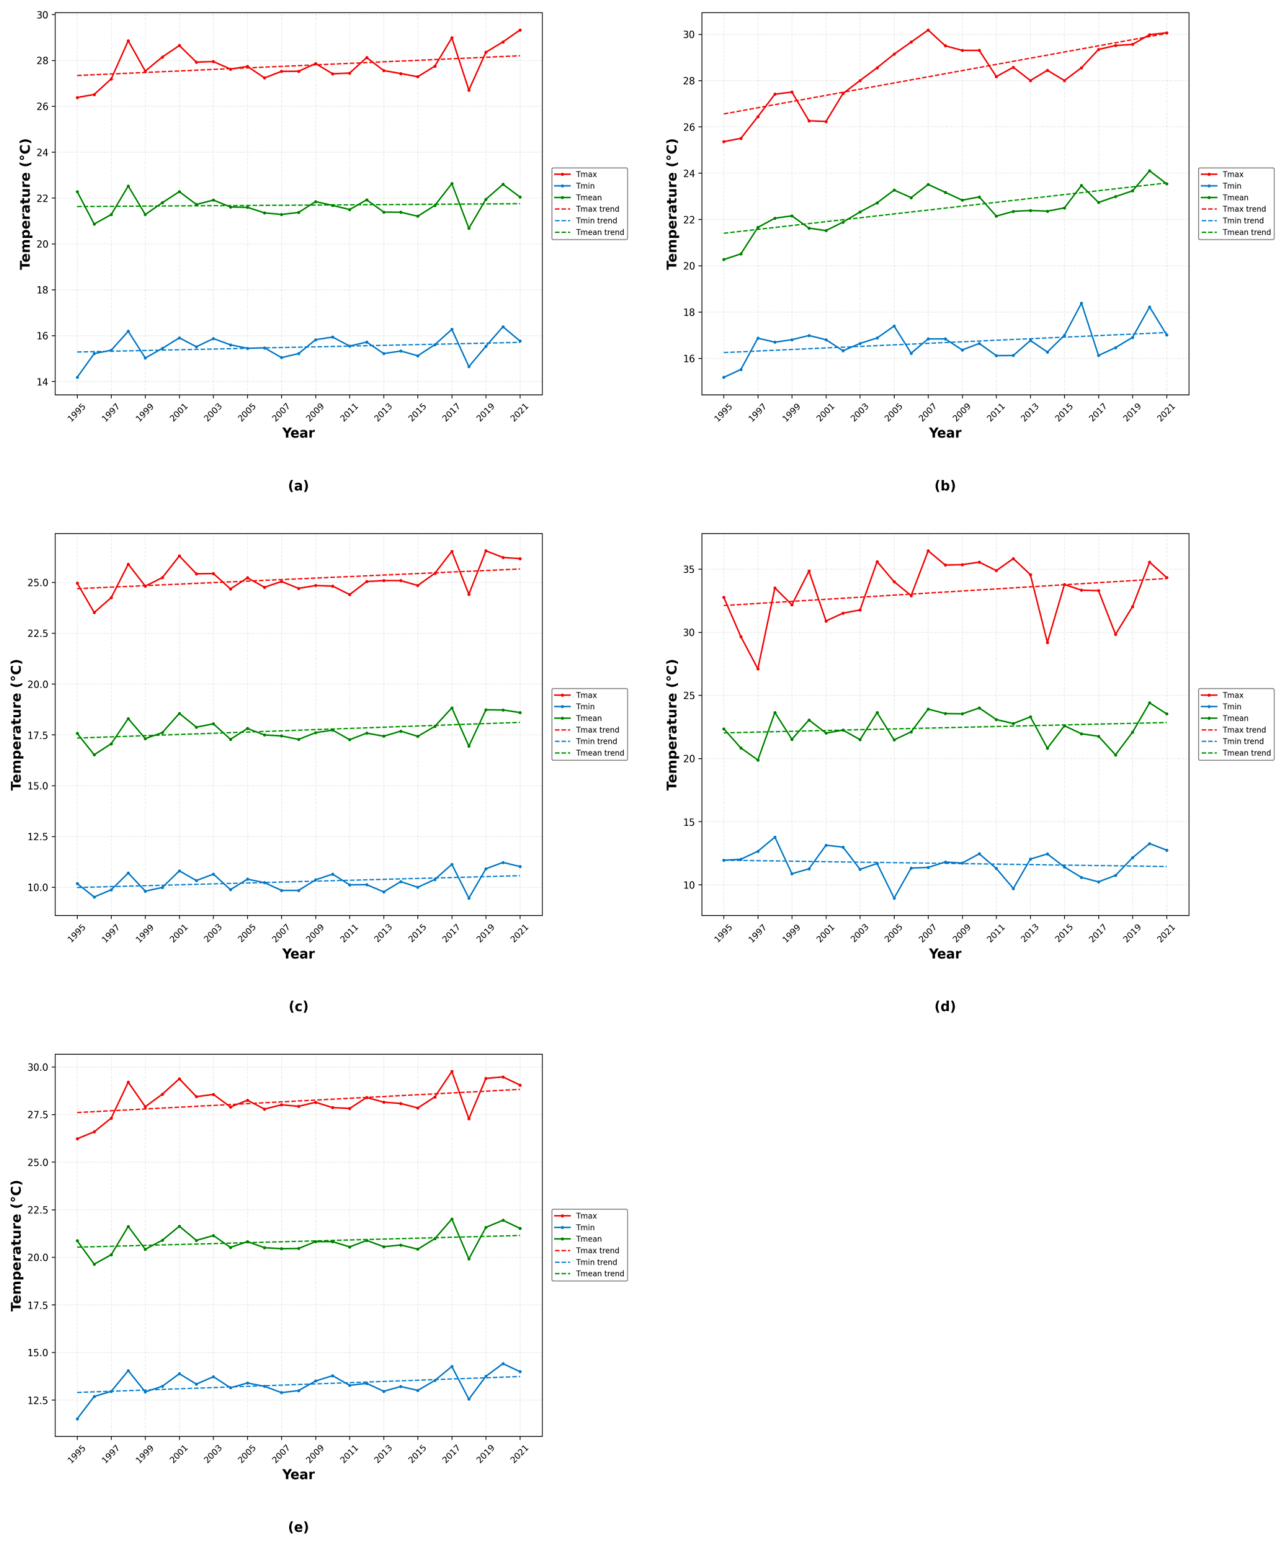
Unlike the irregular fall in rainfall, the temperature data show a strong, steady increase all over the watershed (Figure 4). If we break the time series into three periods for analysis (1995–1998, 1999–2017, and 2018–2021), one can see the heat intensification very clearly. In the first 1995–1998 span, the average temperature over the whole basin was between 20 and 22 °C. Very little temperature change was seen until 2017, apart from short-term thermal peaks that were associated with severe droughts in 2003, 2009, and 2015. The last period (2018–2021) represents a very important change. In coastal locations (Agadir, Tamri), maximum temperatures (Tmax) were regularly above 28–29 °C, while minimum temperatures (Tmin) were also quite high, remaining above 14 °C. This is a clear sign of warming nights. Inland, the continental effect severely amplifies this warming. At the Taroudant station, Tmax has occasionally approached the extreme 40 °C mark, alongside a rising Tmin of around 15 °C. Similar intense warming is noted in Ouijjane and Aoulouz, making 2019 and 2020 some of the hottest years on record for the basin.
The statistical analysis (Table 2) firmly corroborates this warming tendency. Unlike precipitation, the increasing trend in mean temperature is statistically significant at almost all stations (p < 0.05). Sen’s slope estimates reveal warming rates from +0.024 °C/year to a highly significant +0.116 °C/year at Ouijjane (p < 0.001). This consistent warming indicates an intensification of heatwaves and a severe elevation of the region’s baseline temperature.

3.3. Evolution of the Area and Production of Cereals

3.3.1. Irrigated Cereals: Trends in Cultivated Area and Production

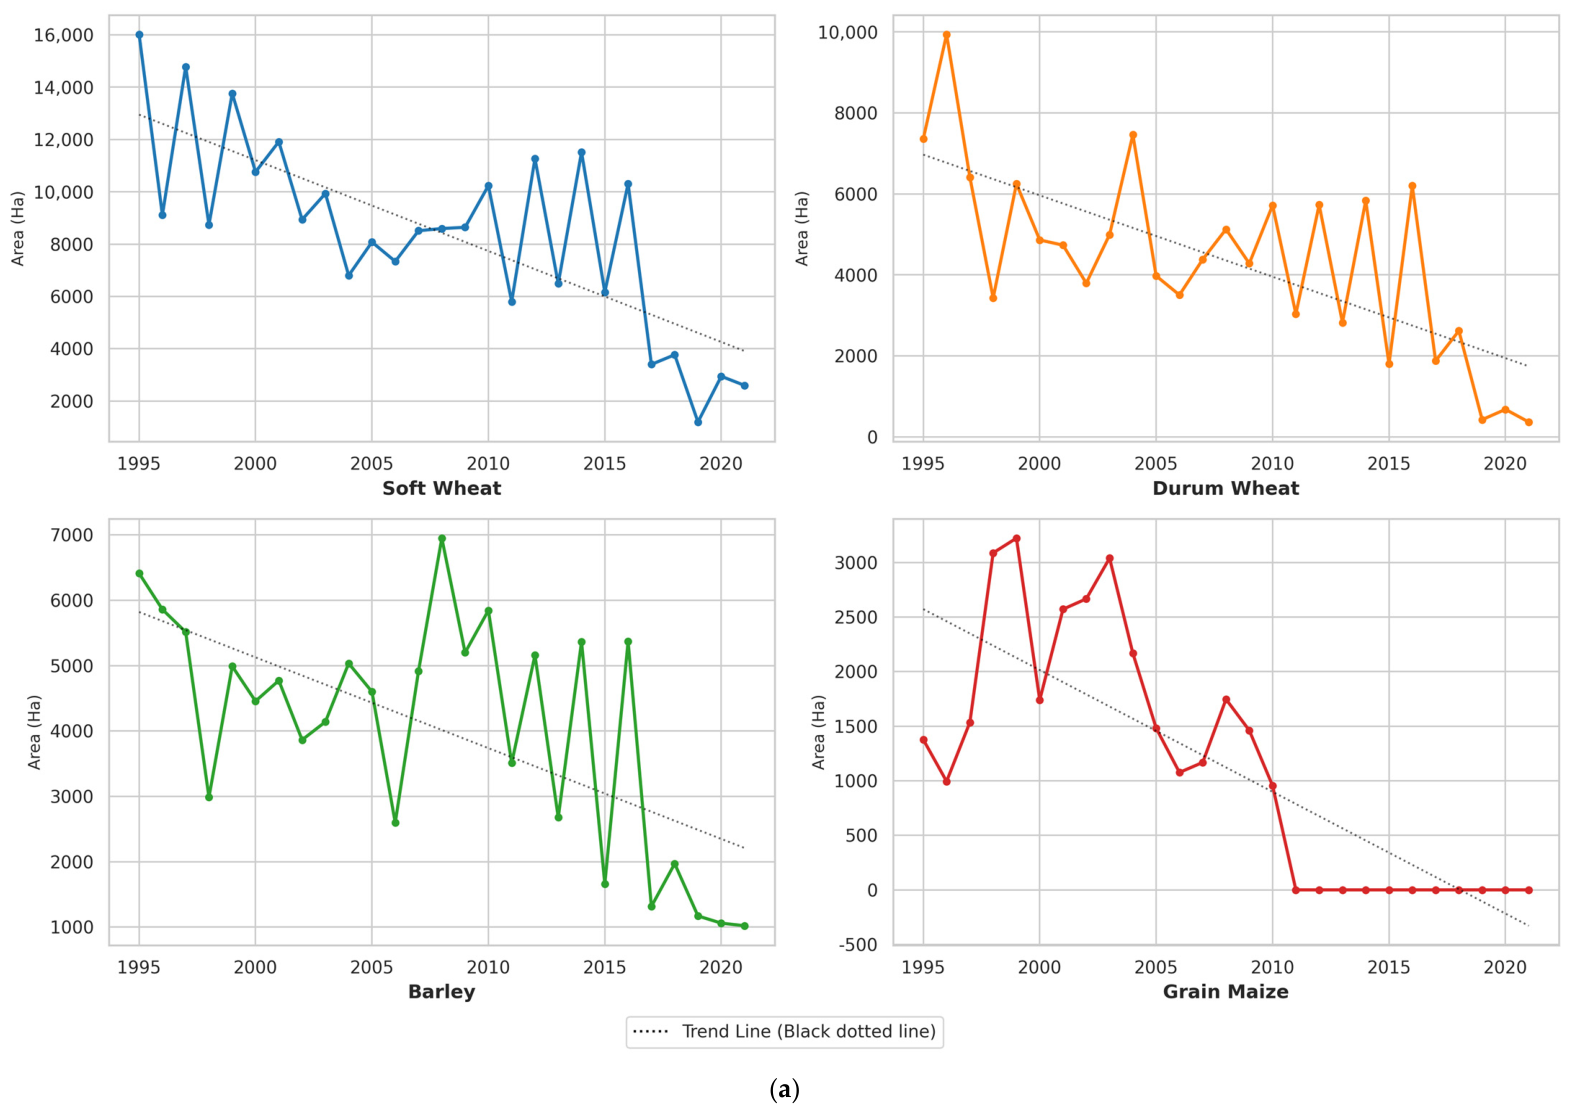
Examination of cereal growing areas (Figure 5a) shows a clear long-term contraction in irrigated cereal cultivation during the study period. Among the main cereal crops, soft wheat recorded the largest decline. Two major phases can be distinguished. The first phase (1995–1996 to 2006–2007) was characterized by recurrent droughts and unfavorable soil conditions, leading to marked interannual fluctuations. The second phase (2009–2010 to 2020–2021) corresponds to relative stabilization, but at levels substantially lower than historical averages.
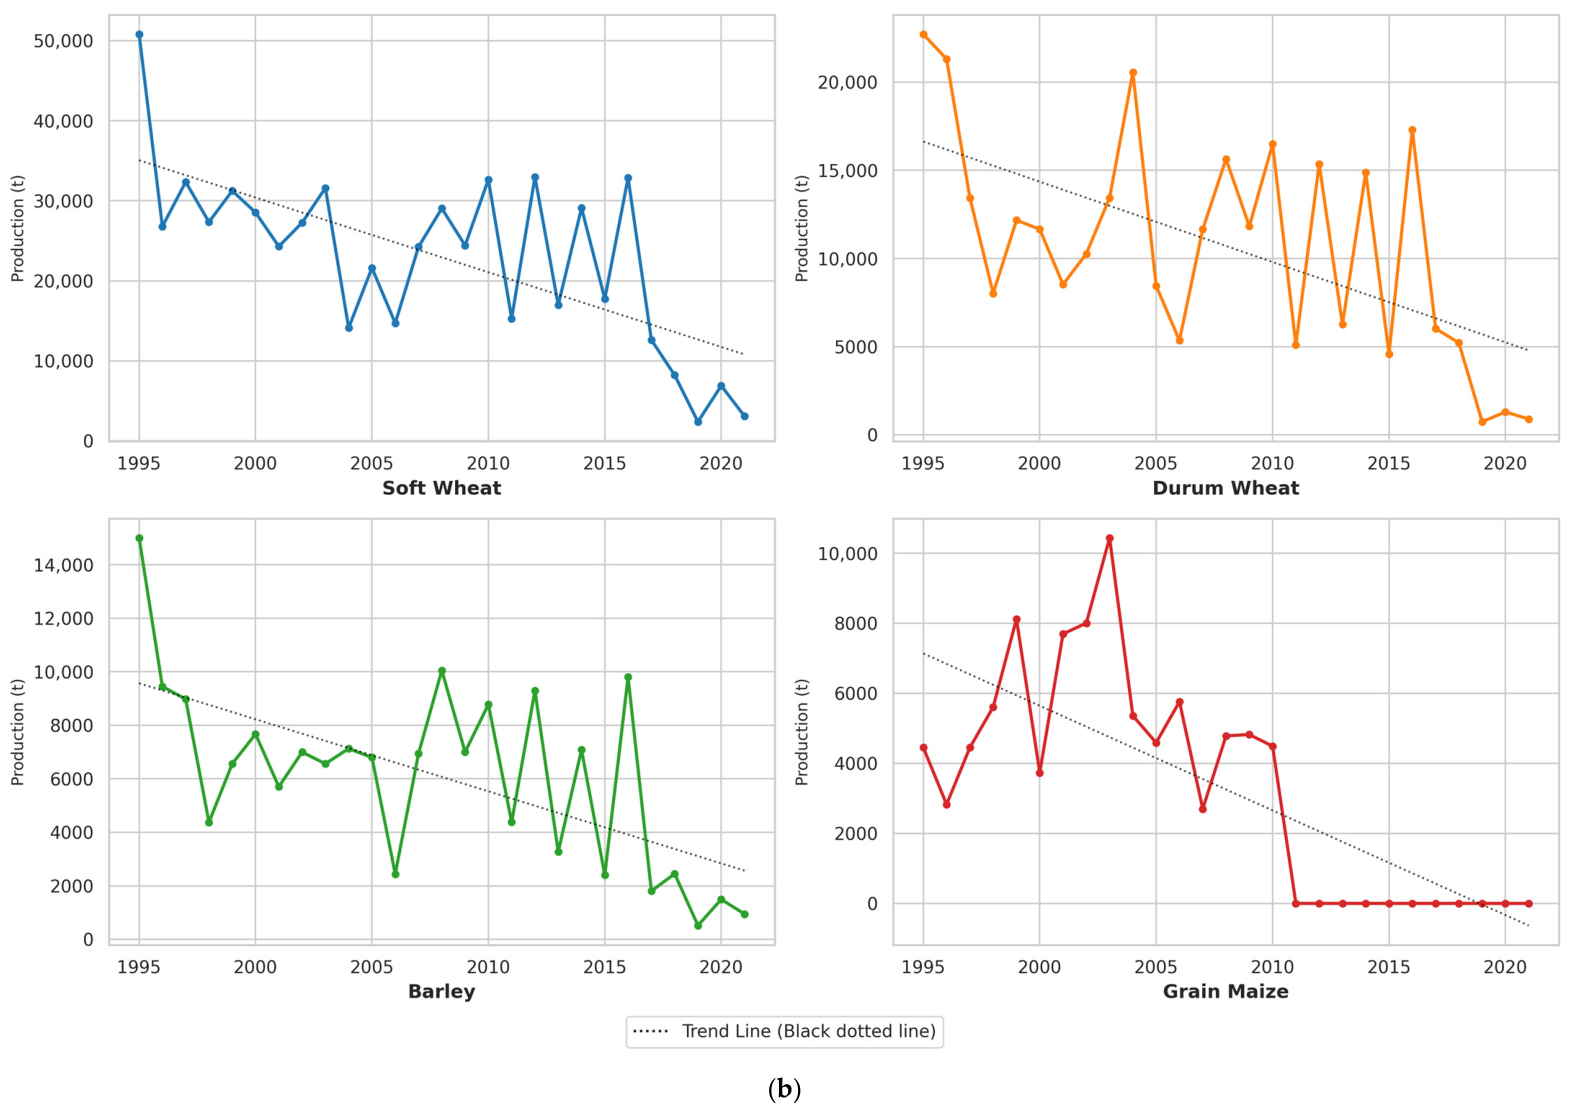
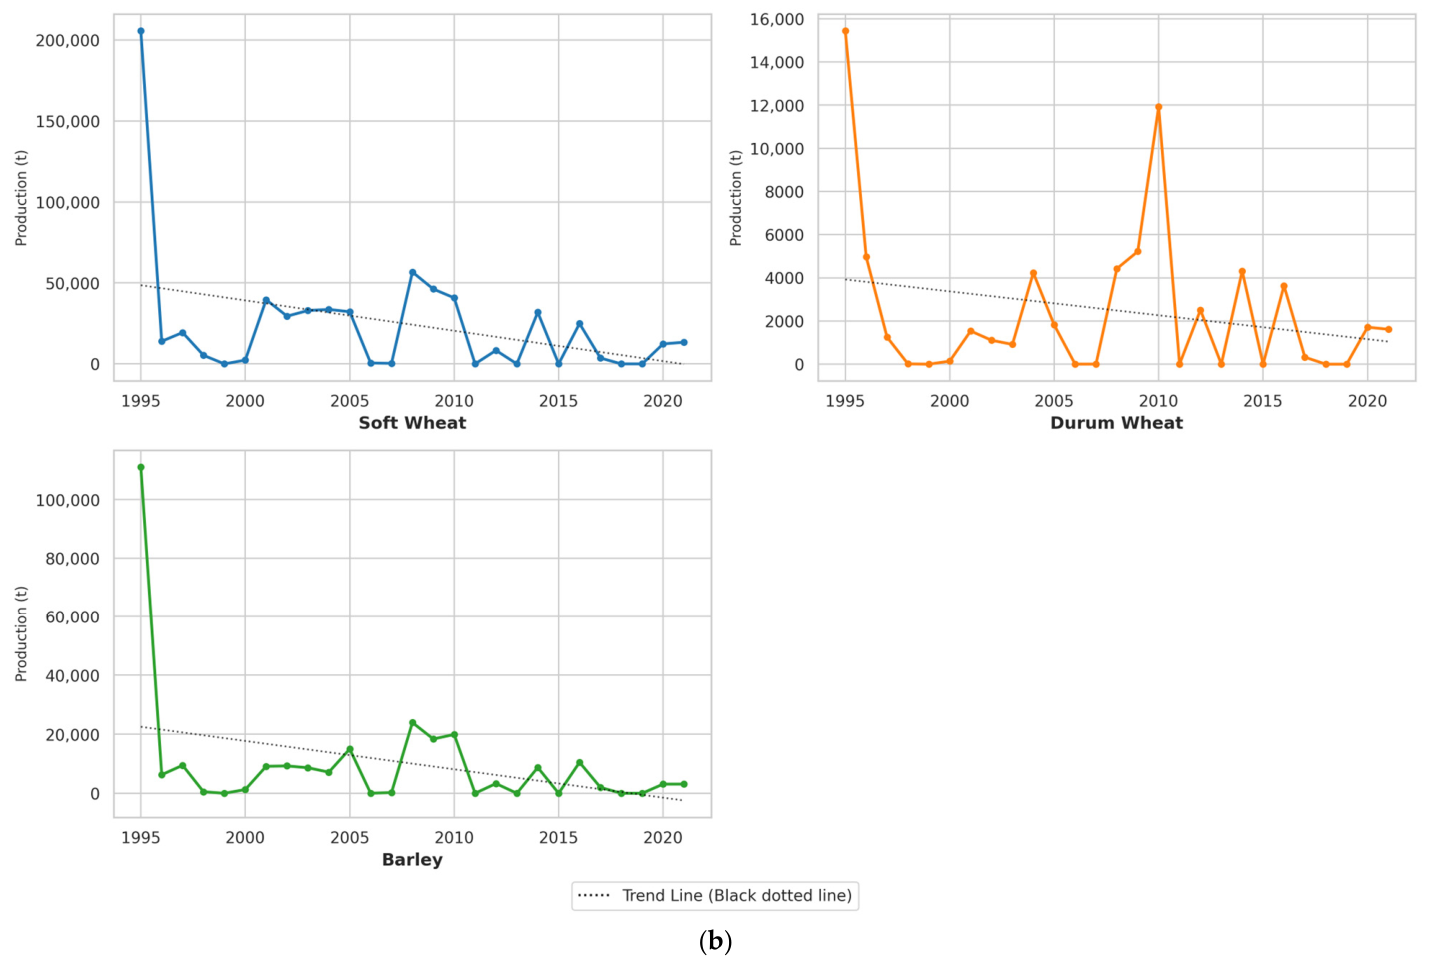
Cereal production trends (Figure 5b) closely followed changes in cultivated areas, indicating the strong influence of climatic variability and irrigation water availability on crop performance. The decline in production was therefore not only associated with the reduction in cultivated land, but also with decreasing productivity per unit area. This decline in yield is likely linked to increasing climatic stress, including rising temperatures, reduced precipitation, and recurrent drought events, which negatively affected crop growth conditions.
Linear trend models confirmed the declining trajectories of all irrigated cereal crops (Table 3). All slope coefficients were negative for both cultivated area and production, indicating a sustained reduction over time. The coefficients of determination (R2) for cultivated area models ranged from 0.33 to 0.67, while production models generally showed lower values, reflecting stronger year-to-year climatic variability.
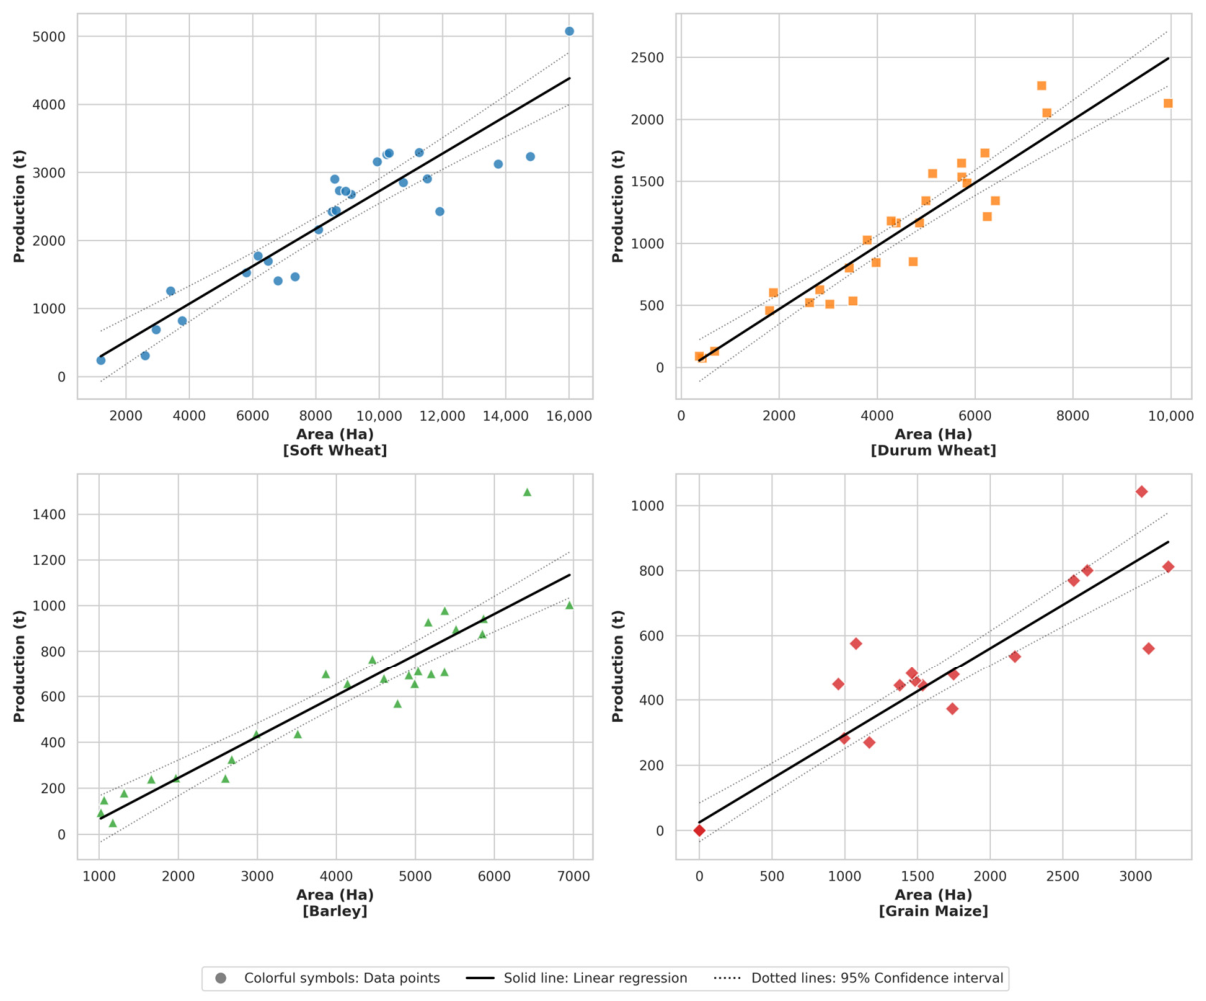
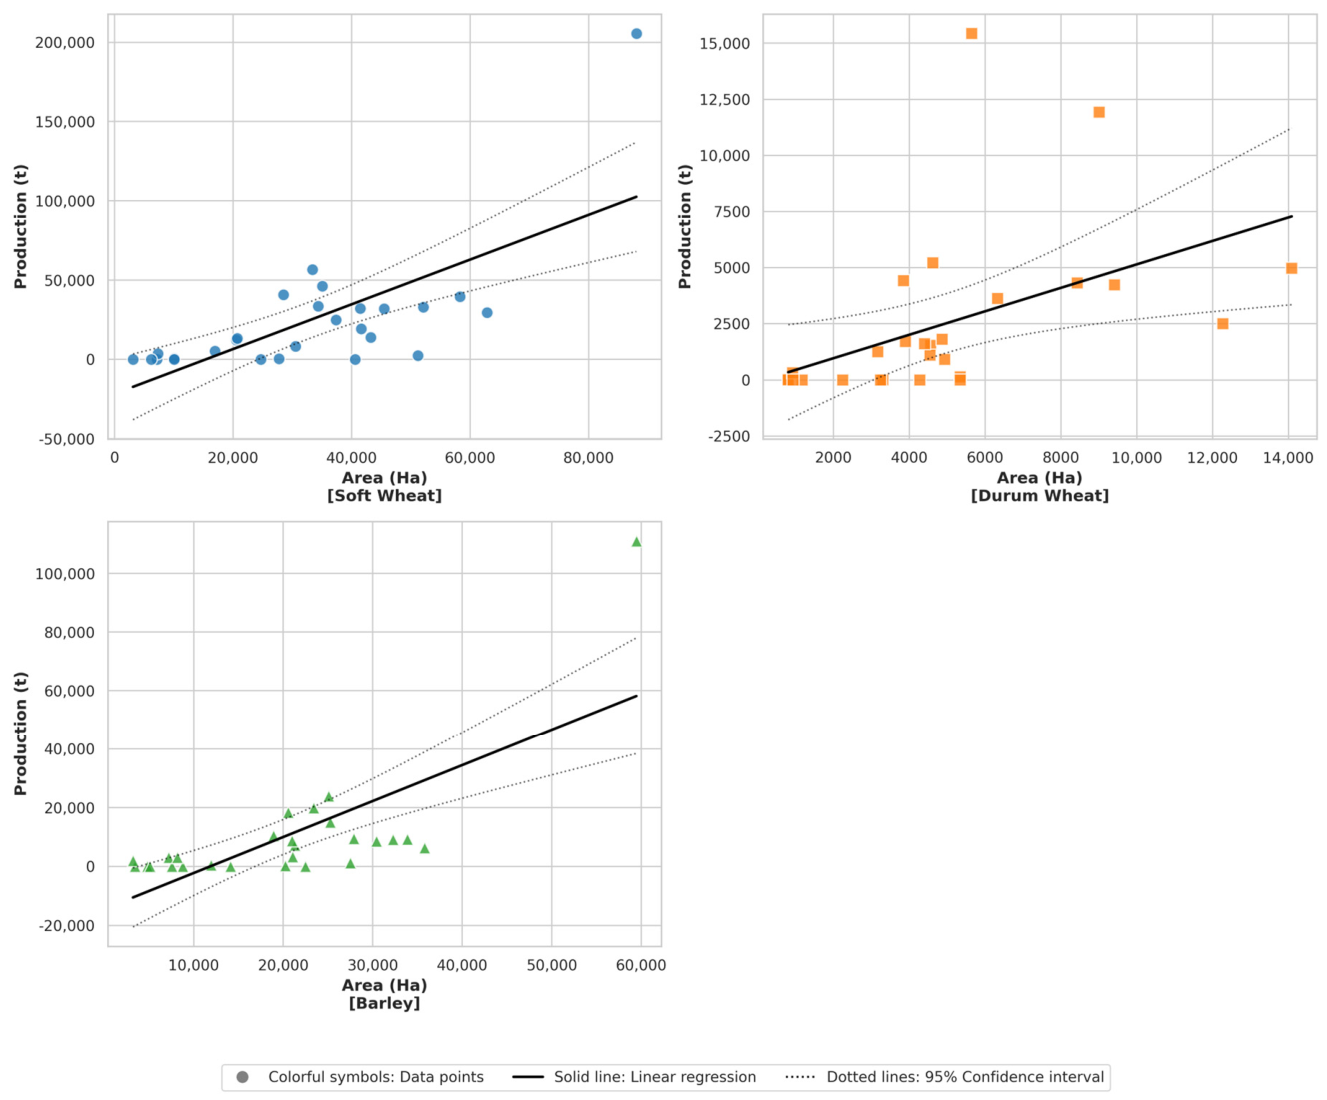
Pearson’s correlation analysis revealed strong positive relationships between cultivated area and production for all cereal types, with correlation coefficients ranging from 0.91 to 0.94 (Figure 6). This confirms that variations in cereal output were strongly associated with changes in cultivated area.
Overall, irrigated cereal systems exhibited a marked decline, particularly after 2010. Although irrigated cereals maintained higher yields than bour (rain-fed) cereals, cultivated areas progressively decreased due to increasing water scarcity and competition from high-value crops such as citrus and horticultural production. Soft wheat showed a progressive decline with marked interannual variability, while durum wheat was characterized by fluctuating production and decreasing cultivated area. Grain corn recorded an overall decline associated with water scarcity and almost disappeared after 2010. Barley exhibited a strong decline and near disappearance after 2010, reflecting major shifts in agricultural priorities and irrigation water allocation within the Souss-Massa basin (Table 4).

3.3.2. Cereals Under Rain-Fed Conditions: Evolution of Area and Production

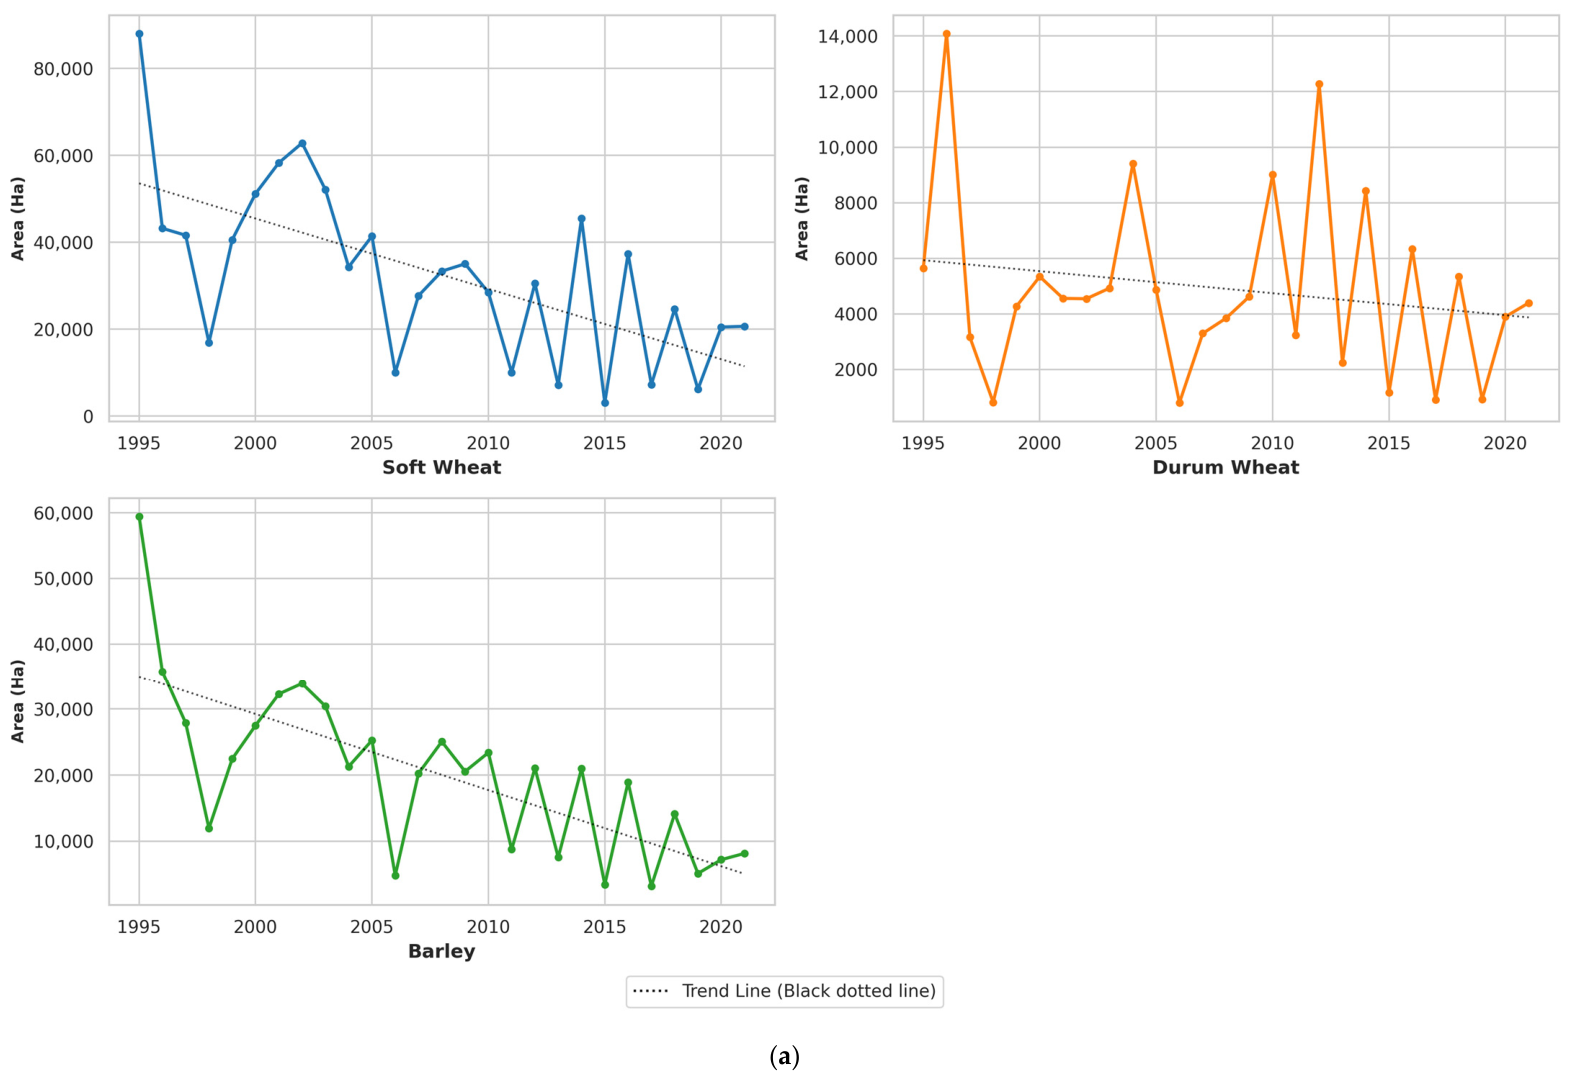
Rainfed cereal cultivation showed a marked long-term decline, accompanied by strong interannual variability throughout the study period (Figure 7a). Two main phases can be distinguished. The first phase (1995–1996 to 2006–2007) was characterized by relatively larger cultivated areas, although recurrent drought episodes generated substantial fluctuations. The second phase (2008–2009 to 2020–2021) corresponds to a period of sustained contraction, during which cultivated areas stabilized at levels considerably lower than historical averages.
Among the principal cereal crops, soft wheat remained the dominant rainfed cereal but exhibited a continuous downward trend. Barley also declined, with pronounced year-to-year variability. Durum wheat maintained lower cultivated areas overall and showed greater instability compared with the other cereal types.
Rainfed cereal production closely reflected rainfall variability (Figure 7b). Production volumes declined sharply after the 1996–1997 season and remained generally low thereafter, with only occasional recovery years. Several seasons recorded very low outputs despite maintained cultivated areas, highlighting the strong dependence of bour systems on precipitation and their high sensitivity to climatic stress.
Linear trend models confirmed declining trajectories for both cultivated area and production across all rainfed cereal crops (Table 5). Negative slope coefficients were observed for all categories. The coefficients of determination (R2) were higher for cultivated area than for production, indicating that production was more strongly affected by annual climatic variability.
Pearson correlation analysis revealed positive relationships between cultivated area and production for all cereal types (Figure 8). The strongest relationship was observed for soft wheat, whereas weaker correlations for durum wheat suggest a greater sensitivity to rainfall fluctuations and agronomic constraints.
Average yields remained low and unstable throughout the study period, confirming the structural vulnerability of bour agriculture systems in the Souss-Massa basin (Table 6). Soft wheat showed the highest average yield (0.76 t/ha), followed by durum wheat (0.49 t/ha) and barley (0.38 t/ha). These results underline the limited productivity of rainfed cereal systems under increasingly variable climatic conditions.
While about 50% of the variation in the production of soft wheat and barley is explainable by the area cultivated, only 21% of the changes in durum wheat can be explained by this factor. This difference in the degree of explanation raises questions about the distinct agronomic characteristics of soft wheat, durum wheat, and barley, as well as their adaptation to rainfed cultivation systems. A thorough study of isolated data points offers a useful understanding of the connections mentioned above. Outliers should not just be seen as statistical anomalies; they indicate specific conditions in which other factors largely determine the level of production. These outliers fall into two categories:
  • High production linked to small cultivated areas may indicate the use of modern agricultural techniques, irrigation methods, or very favorable soil conditions.
  • Low production from large cultivated areas suggests that environmental factors, technical limitations, or a lack of socio-economic opportunities are the primary reasons.
Durum wheat distinctly stands out with its unique pattern: it has the largest geographical area and the lowest correlation coefficient among all the cereal types. This implies that durum wheat might be more susceptible to the influence of external factors. It is widely known that durum wheat is heavily reliant on very specific agro-ecological conditions, is highly vulnerable to different environmental stresses, and even responds differently to policies and farm practices.

3.3.3. Evolution of the Area and Production of Forage Crops

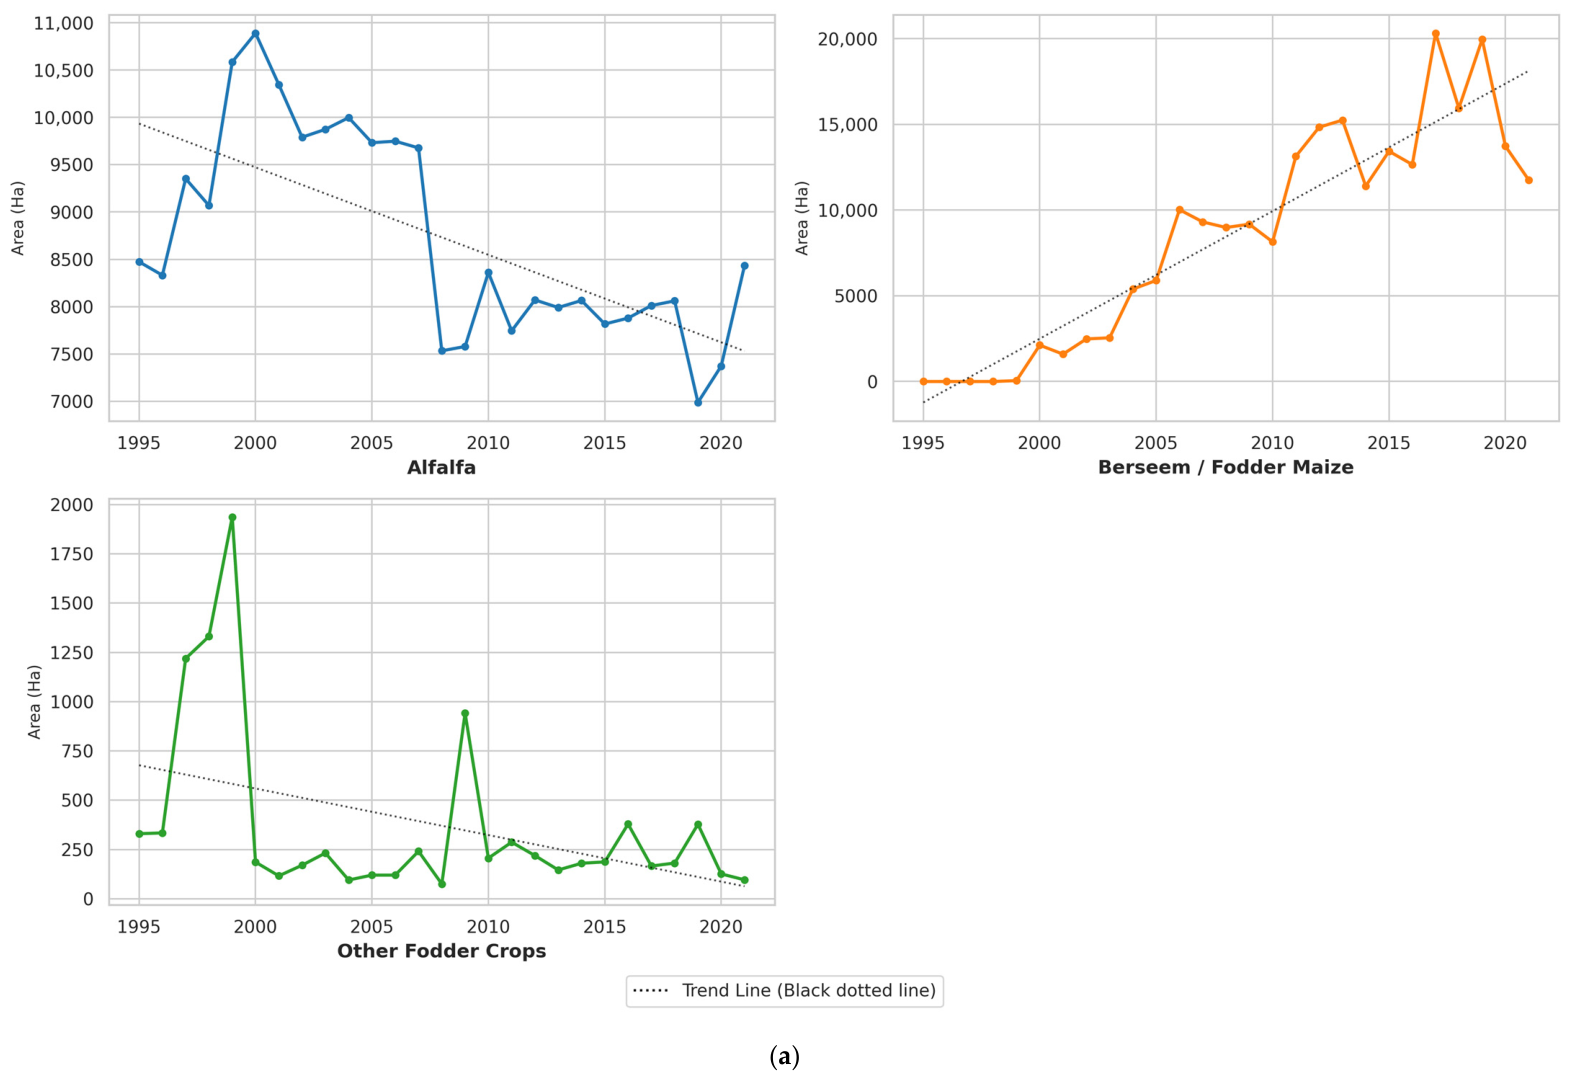
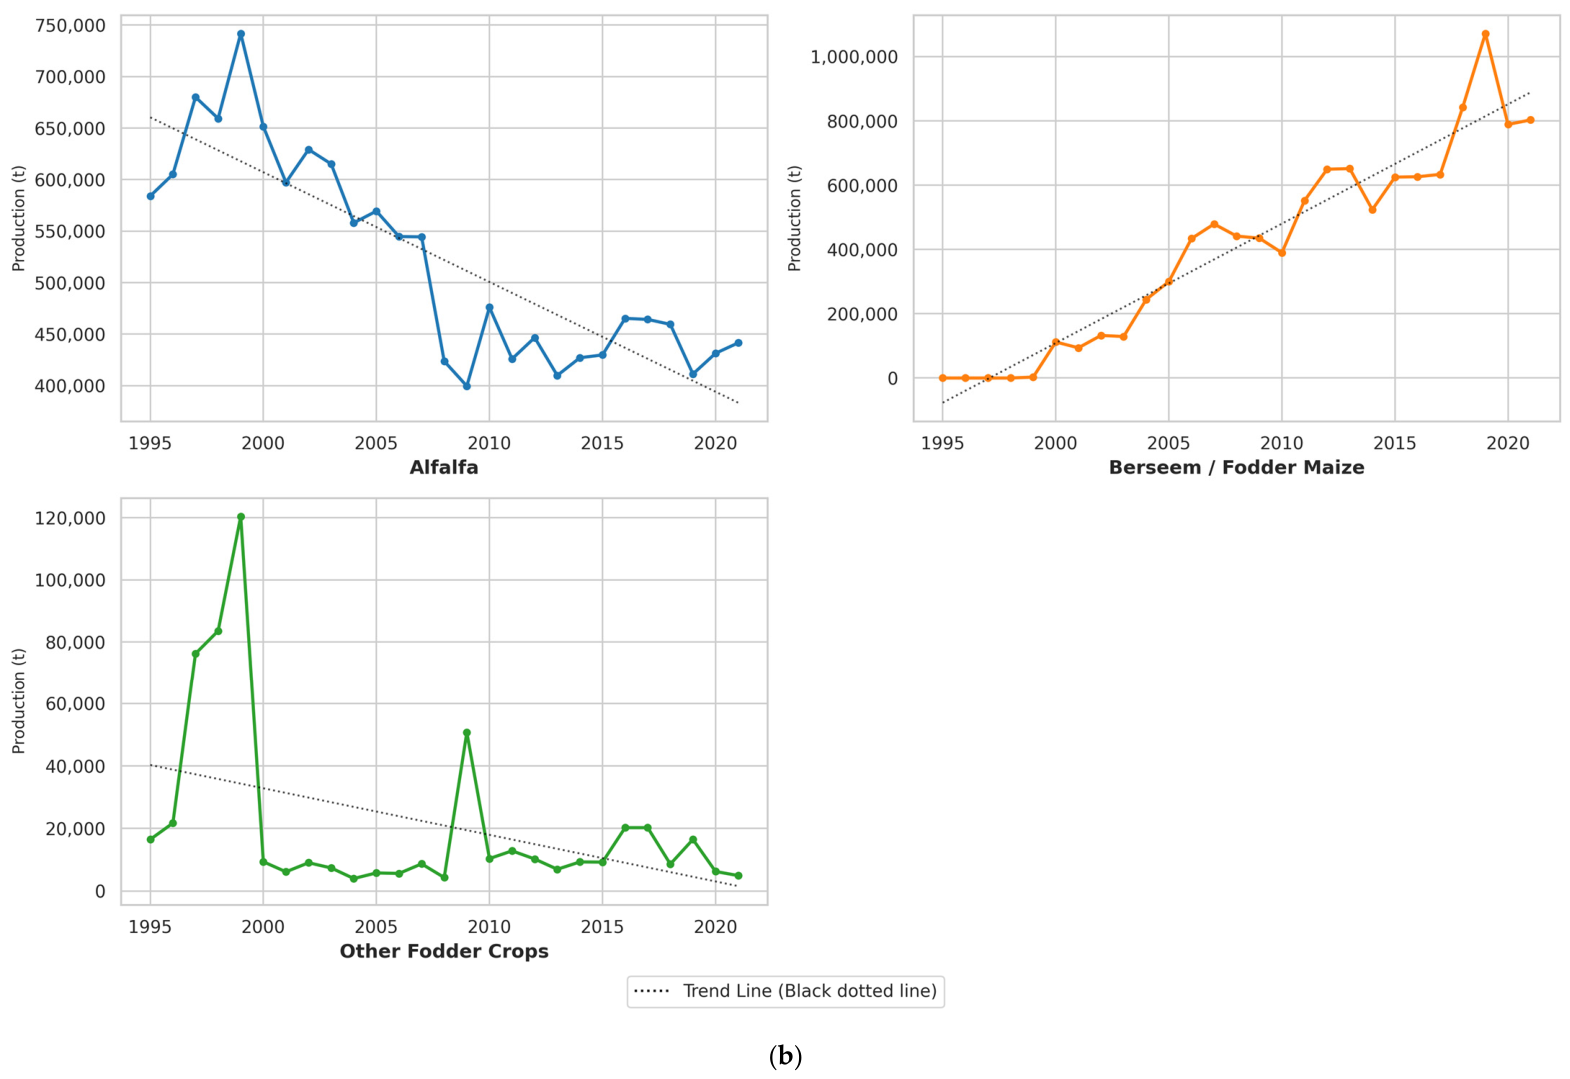
An examination of the evolution of cultivated area (Figure 9a) reveals that the total area under forage crops increased during the study period, mainly driven by the rapid expansion of Berseem/Maize crops, while alfalfa remained an important component of the forage system and represented a substantial share of the total cultivated area. However, alfalfa exhibited a declining trend after the drought events of 2007–2008, indicating its sensitivity to climatic variability and water stress. Production analysis (Figure 9b) shows trends broadly similar to those of cultivated area, but with greater magnitude. Total forage crop production rose from about 200,000 tons to more than 1,000,000 tons, suggesting a strong intensification of forage production systems in the basin.
These adjustments reflect an ongoing agrarian transition, with forage crops gradually replacing cereals in response to the growing demand of livestock cooperatives. Forage systems became increasingly important for both milk and meat supply chains, while alfalfa remained a valuable traditional crop because of its high yield and protein content. However, this production model remains structurally vulnerable to climatic stress. The drought event of 2008–2009, during which only 131.29 mm of precipitation was recorded, resulted in a simultaneous decline in both cultivated area and forage production.
Linear mathematical models were applied to assess long-term trends in forage crop cultivated area and production (Table 7). The slope coefficients reveal contrasting trajectories among crop categories. Berseem/Maize showed a strong positive trend in cultivated area (+744.13 ha/year) and production (+37,139.27 t/year), confirming its rapid expansion during the study period. In contrast, alfalfa exhibited a declining trend in both cultivated area (−92.40 ha/year) and production (−10,652.31 t/year). Other forage crops showed weak negative trends with limited overall contribution.
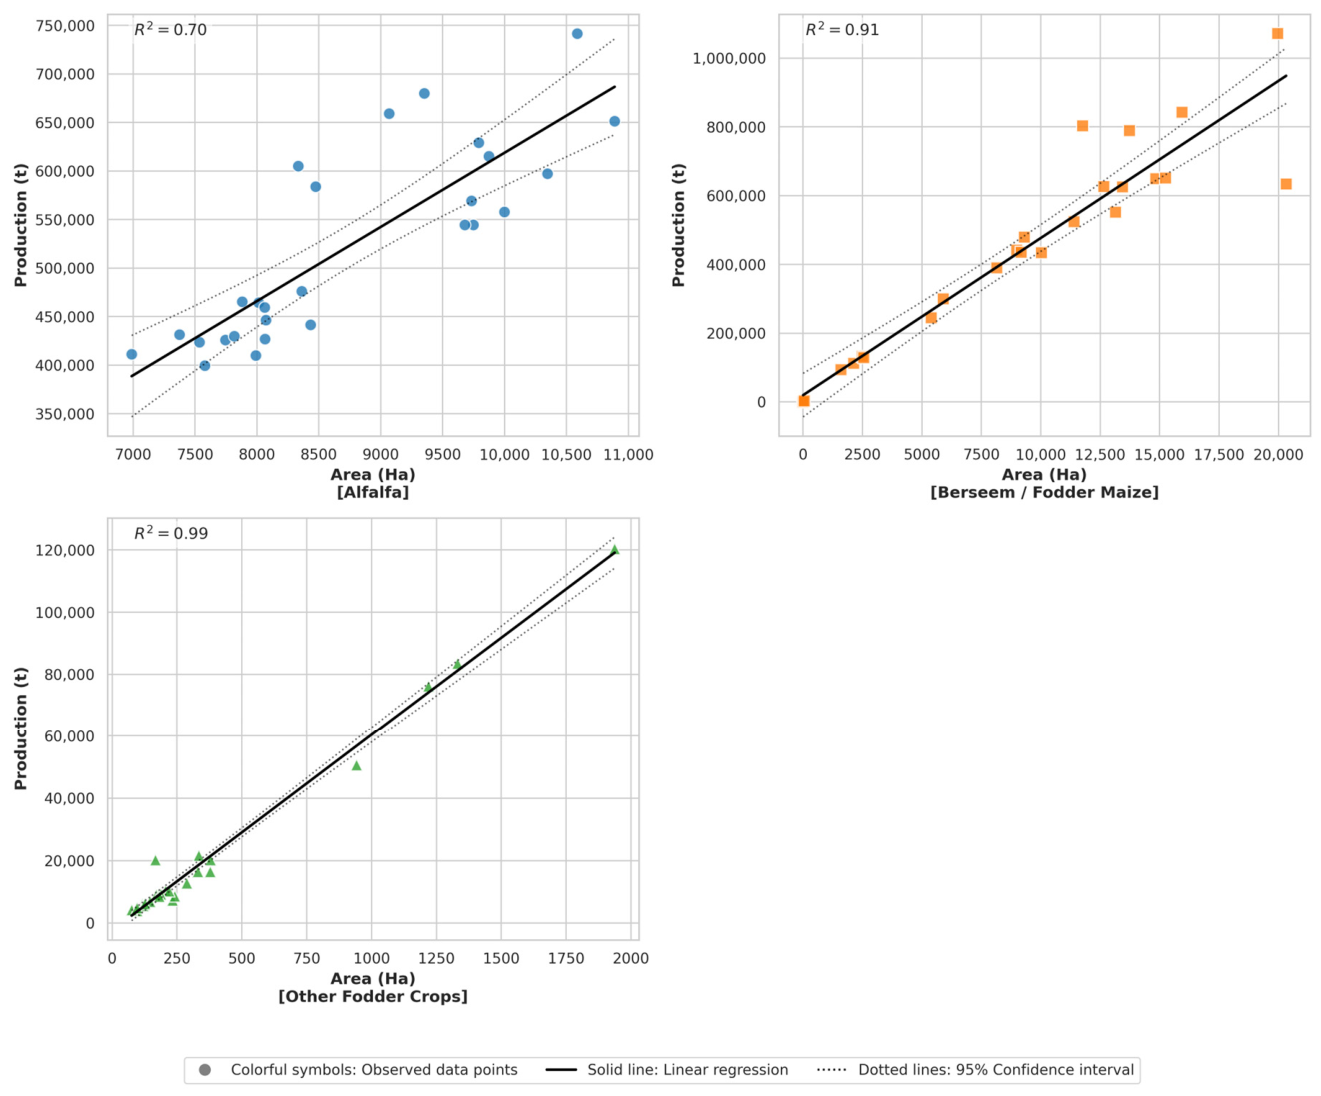
A strong linear relationship exists between cultivated area and production, according to the correlation analysis shown in Figure 10. The results produce very high correlation coefficients (R2) (i.e., alfalfa = 0.83; berseem/forage maize = 0.95; and other forages = 0.96), which indicates a strong relationship between both variables growing together.
The analysis of average yields per hectare shows that changes in forage production were associated not only with variations in cultivated areas, but also with fluctuations in productivity linked to climatic conditions, irrigation water availability, and evolving agricultural practices. Although alfalfa cultivation exhibited a decreasing trend during the study period, the expansion of berseem/maize contributed to maintaining the overall importance of irrigated fodder systems in the Souss-Massa basin. The production trends of these crops generally followed the evolution of cultivated areas, highlighting an ongoing spatial restructuring of irrigated forage systems (Table 8).

4. Spatial Dynamics and Land Use/Land Cover Transition Matrix (1995–2020)

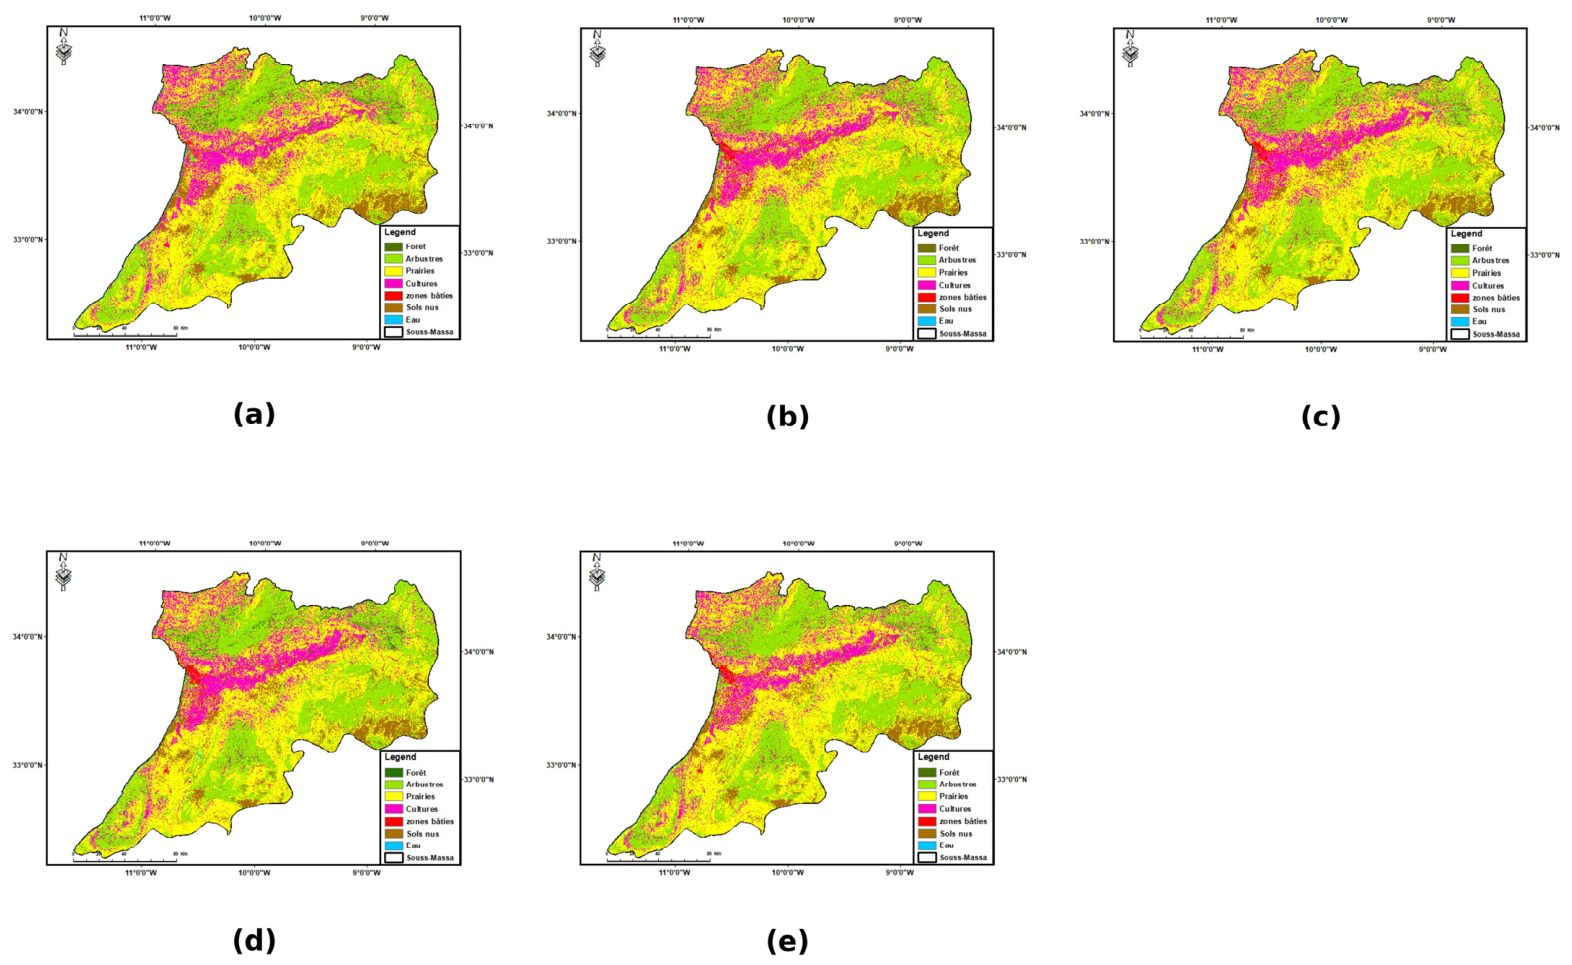
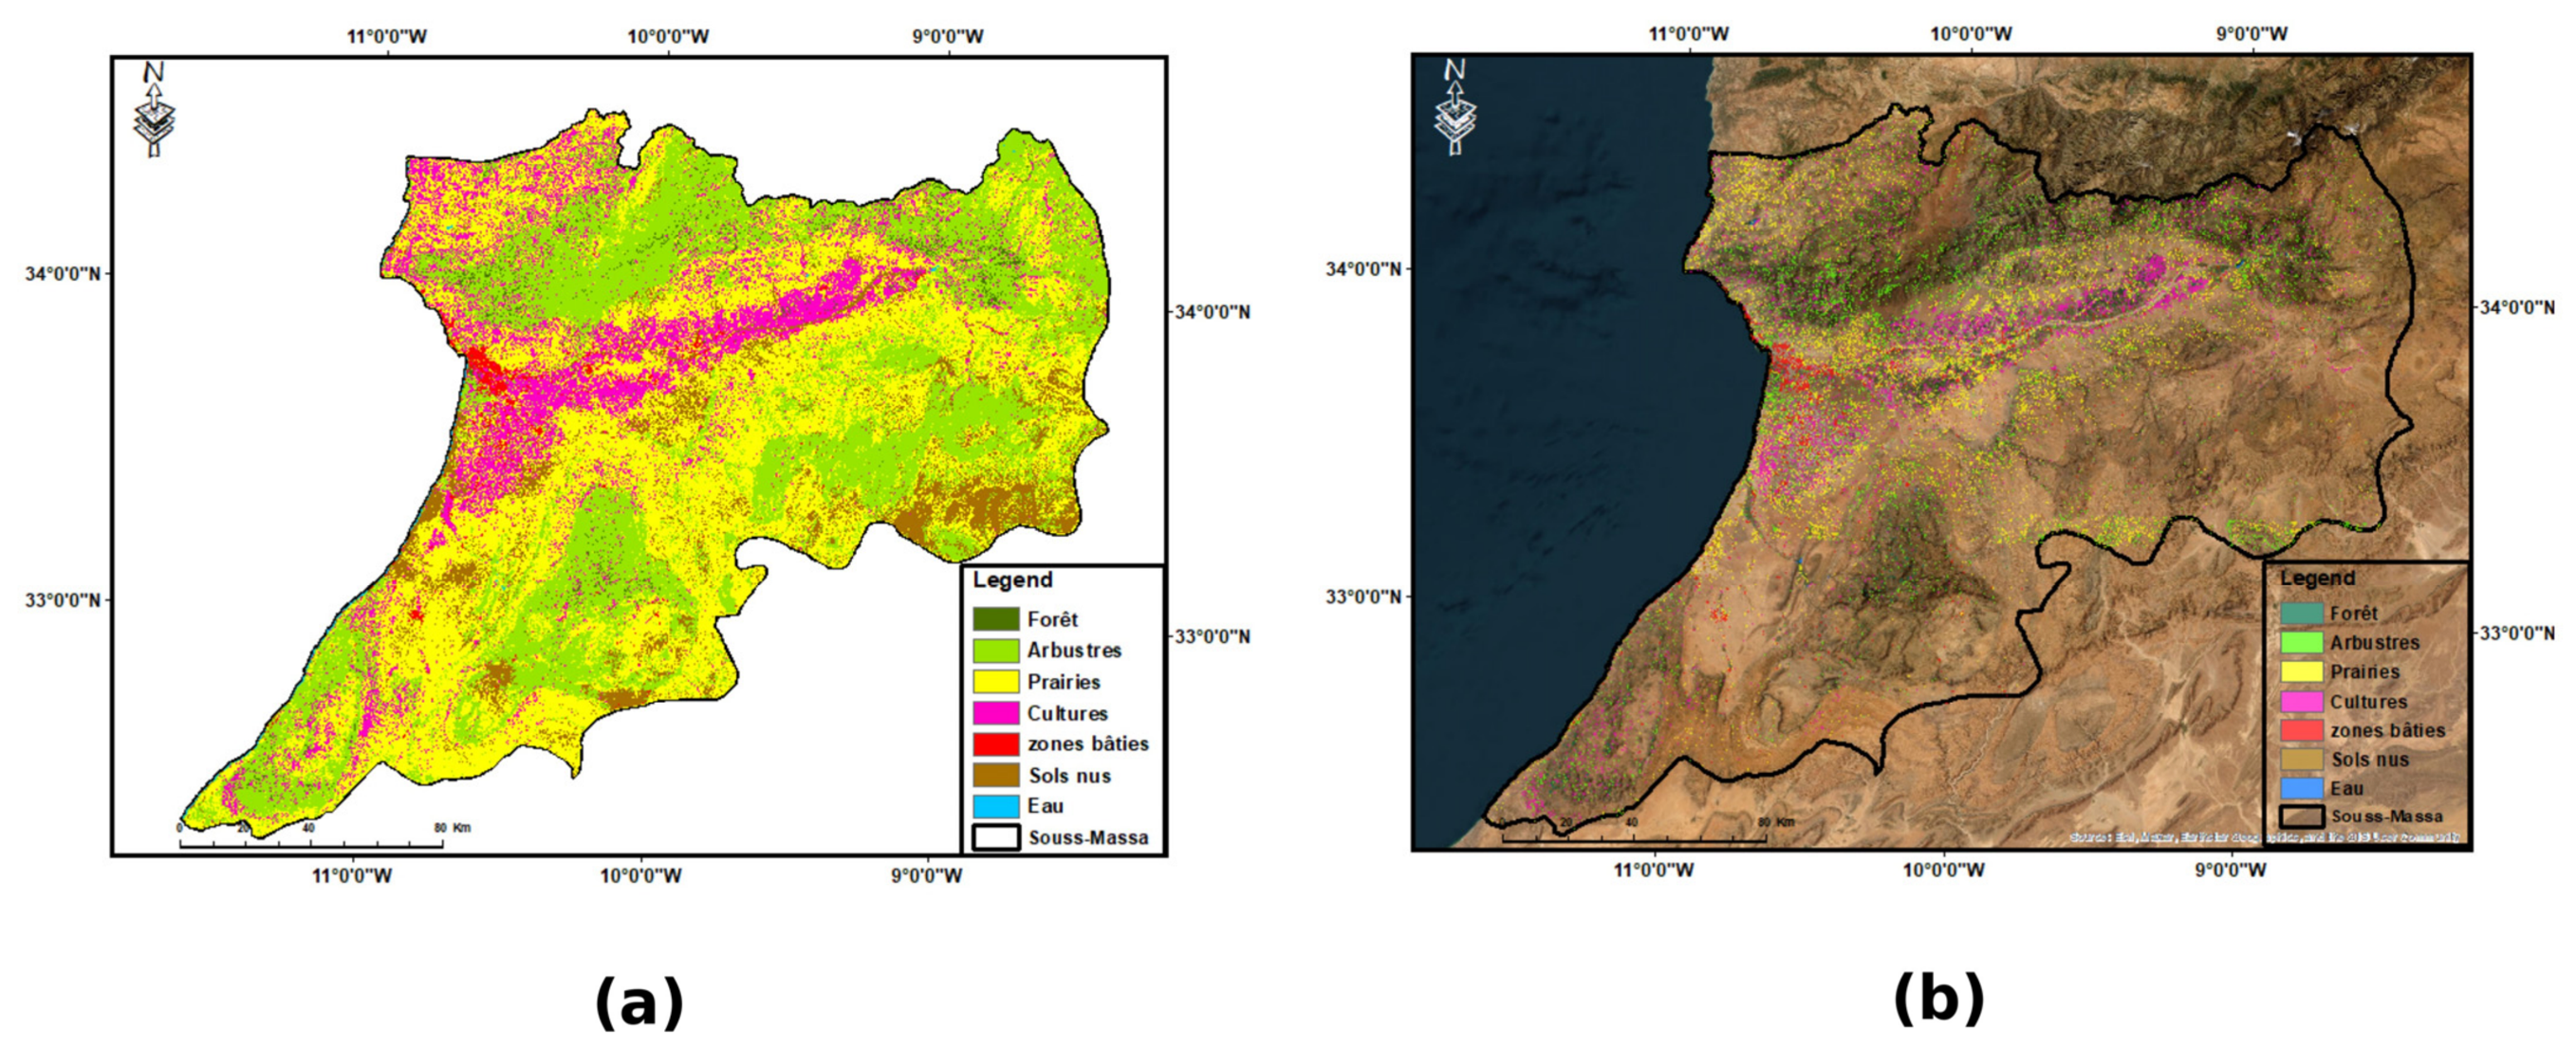
The diachronic study of land use and land cover (LULC) in the Souss-Massa watershed during the 1995–2020 period clearly reveals rapid and structural modifications of the landscape, driven by climatic factors and human pressure. The spatiotemporal analysis, illustrated by the LULC and satellite cartographic sequences (Figure 11 and Figure 12), visually reveals a marked fragmentation of traditional agricultural lands and a visible expansion of urbanized areas over the decades.
Prior to interpreting the observed land-cover transitions, the thematic reliability of the most recent LULC map (2020) was assessed through an independent validation procedure. The classification achieved an overall accuracy of 97.1% and a Cohen’s Kappa coefficient of 0.963, indicating excellent agreement between predicted and reference classes. These results provide strong confidence in the subsequent diachronic analysis of landscape changes in the Souss-Massa watershed (Table 9).
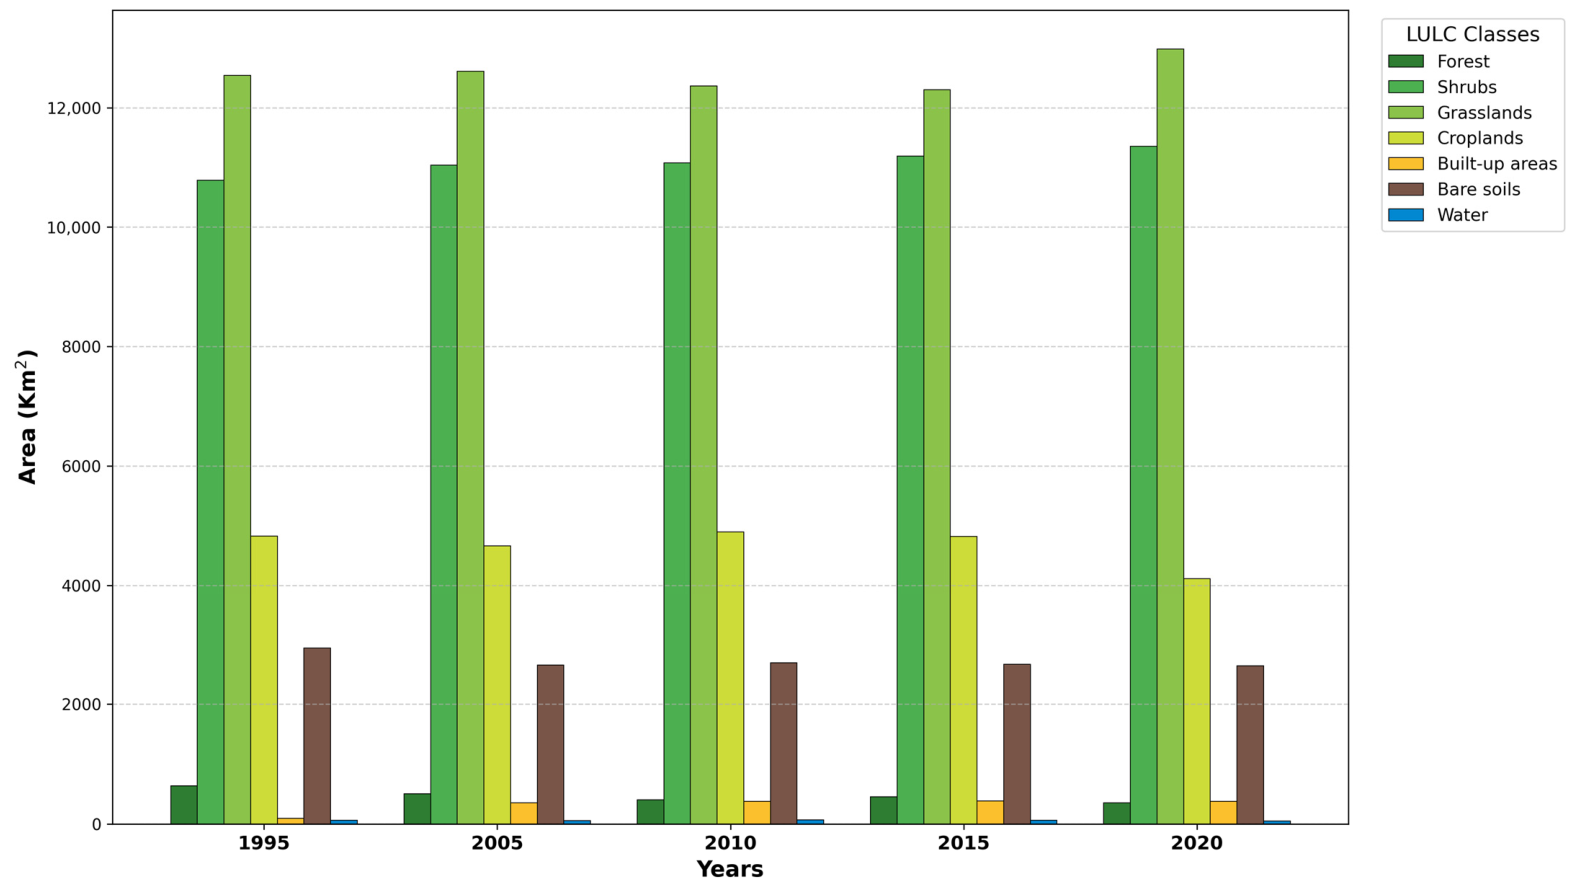
The observed spatial dynamics are further quantified through the surface evolution of different land-cover classes (Figure 13 and Table 10). During this period, cultivated areas (Cropland) exhibited a steady downward trend, decreasing from 4825.65 km2 in 1995 to 4109.84 km2 in 2020. At the same time, the forest ecosystem was heavily degraded, reducing its surface area from 635.66 km2 to only 357.48 km2. On the other hand, urban expansion experienced substantial growth, as built-up areas rose from 92.96 km2 to 380.77 km2.
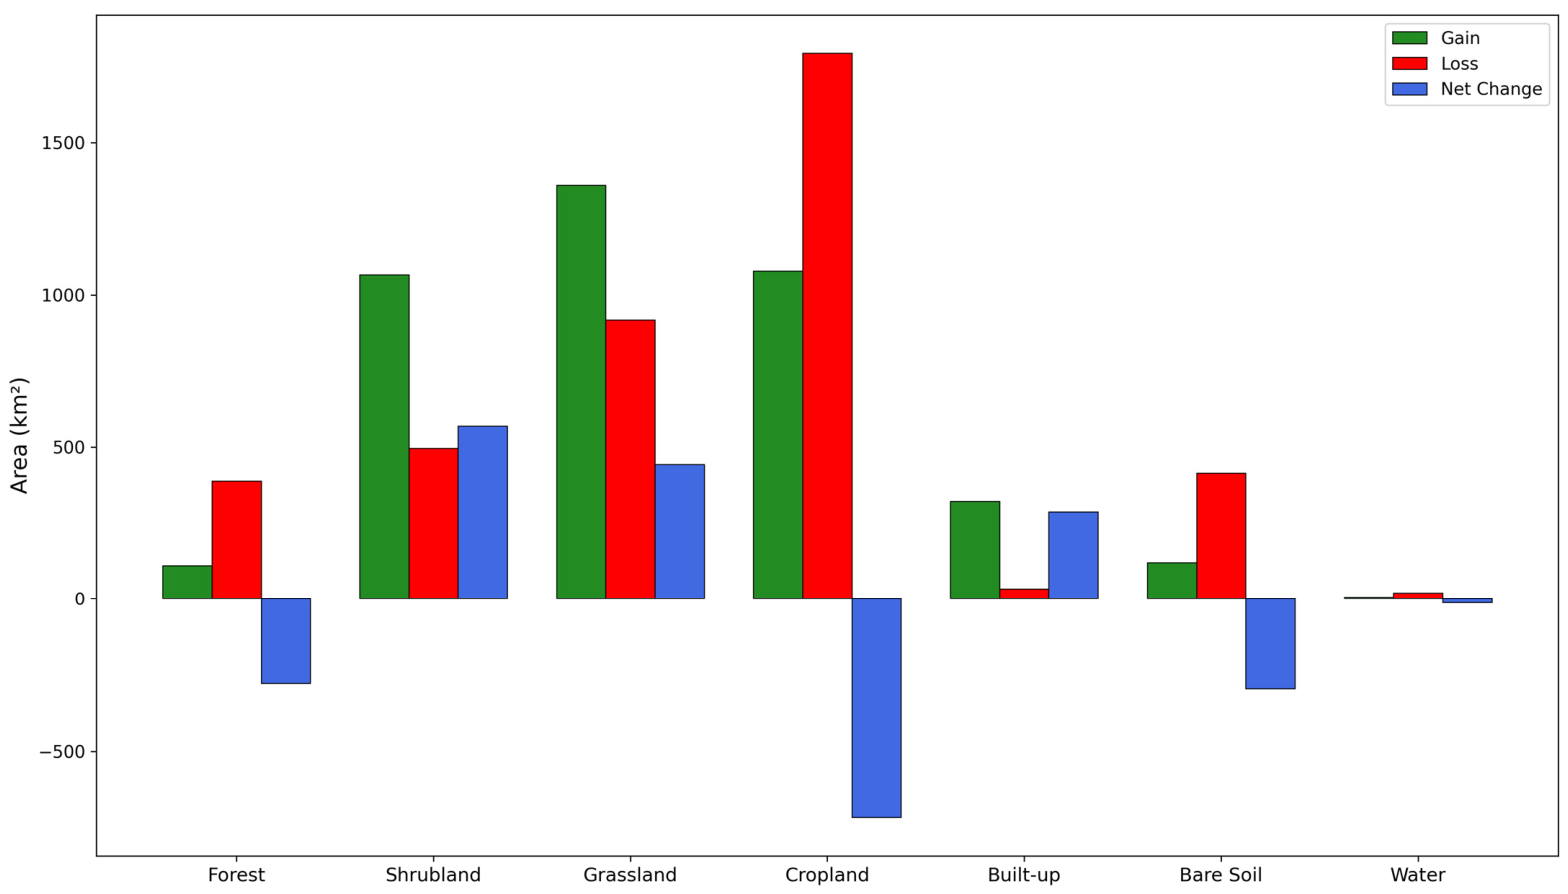
According to the quantitative evaluation of land transfers, summarized in the analysis of gains and losses (Figure 14 and Table 11), the severity of this agro-ecological transition is clearly highlighted. Agriculture is the sector that suffered the most in terms of absolute area, as its net loss amounted to 715.81 km2, which is equivalent to a 14.83% reduction in its original footprint. Meanwhile, forest cover experienced a loss of nearly half of its original area (−43.76%). Conversely, urban expansion produced a remarkable net change of +309.60%. Additionally, water surfaces show a net shrinkage of 19.62% (−12.94 km2). This clearly indicates that the basin is becoming increasingly water-stressed and surface water resources are depleting.
The drastic decline in forest cover (a decrease of 278.18 km2) is largely the result of a severe combination of climate-induced degradation and human pressures. The transition matrix shows that droughts and aridification have been so intense that they have caused forest dieback, leading to natural degradation and a gradual transition into shrublands and grasslands. Furthermore, even though the total agricultural area diminished, there were localized clearings of remnant forests and marginal lands to establish highly profitable, heavily irrigated forage crops. This clearly demonstrates how ongoing climatic stress exacerbates the vulnerability of natural ecosystems, which are increasingly sacrificed to make room for water-intensive agricultural adaptation strategies.
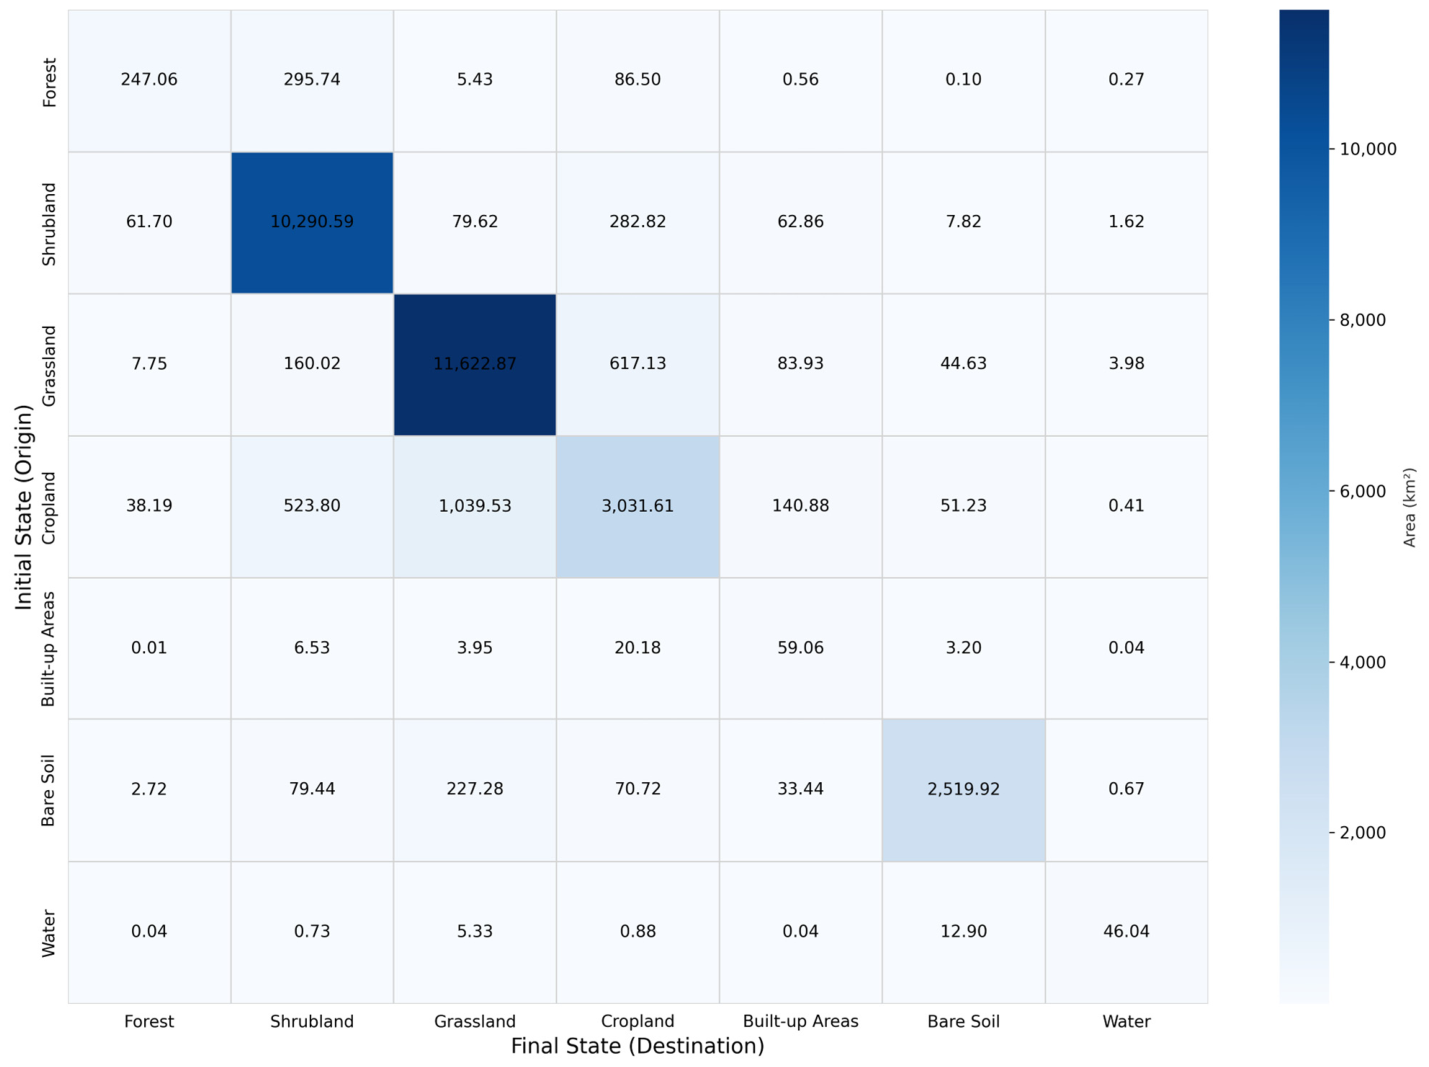
Analyzing the LULC transition matrix (Figure 15) is a crucial step in revealing the main ecological conversion flows. This cross-tabulation matrix demonstrates that the loss of agricultural land is not random but follows a dynamic of abandonment and substitution. Out of the total cultivated area in 1995, massive portions regressed towards natural formations with lower water requirements: 1039.53 km2 were converted into grassland and 523.80 km2 into shrubland. This flow validates the hypothesis of a widespread abandonment of marginal agricultural lands (particularly rainfed cereals) in the face of recurrent droughts.
Moreover, the transition matrix confirms the land-use conflict: 140.88 km2 of arable land were irreversibly engulfed by the expansion of built-up areas. Finally, regarding environmental vulnerability, the degradation of forest cover occurs almost exclusively through a transition to the shrub stage (295.74 km2), revealing an active process of biomass loss and desertification in the basin’s highlands.

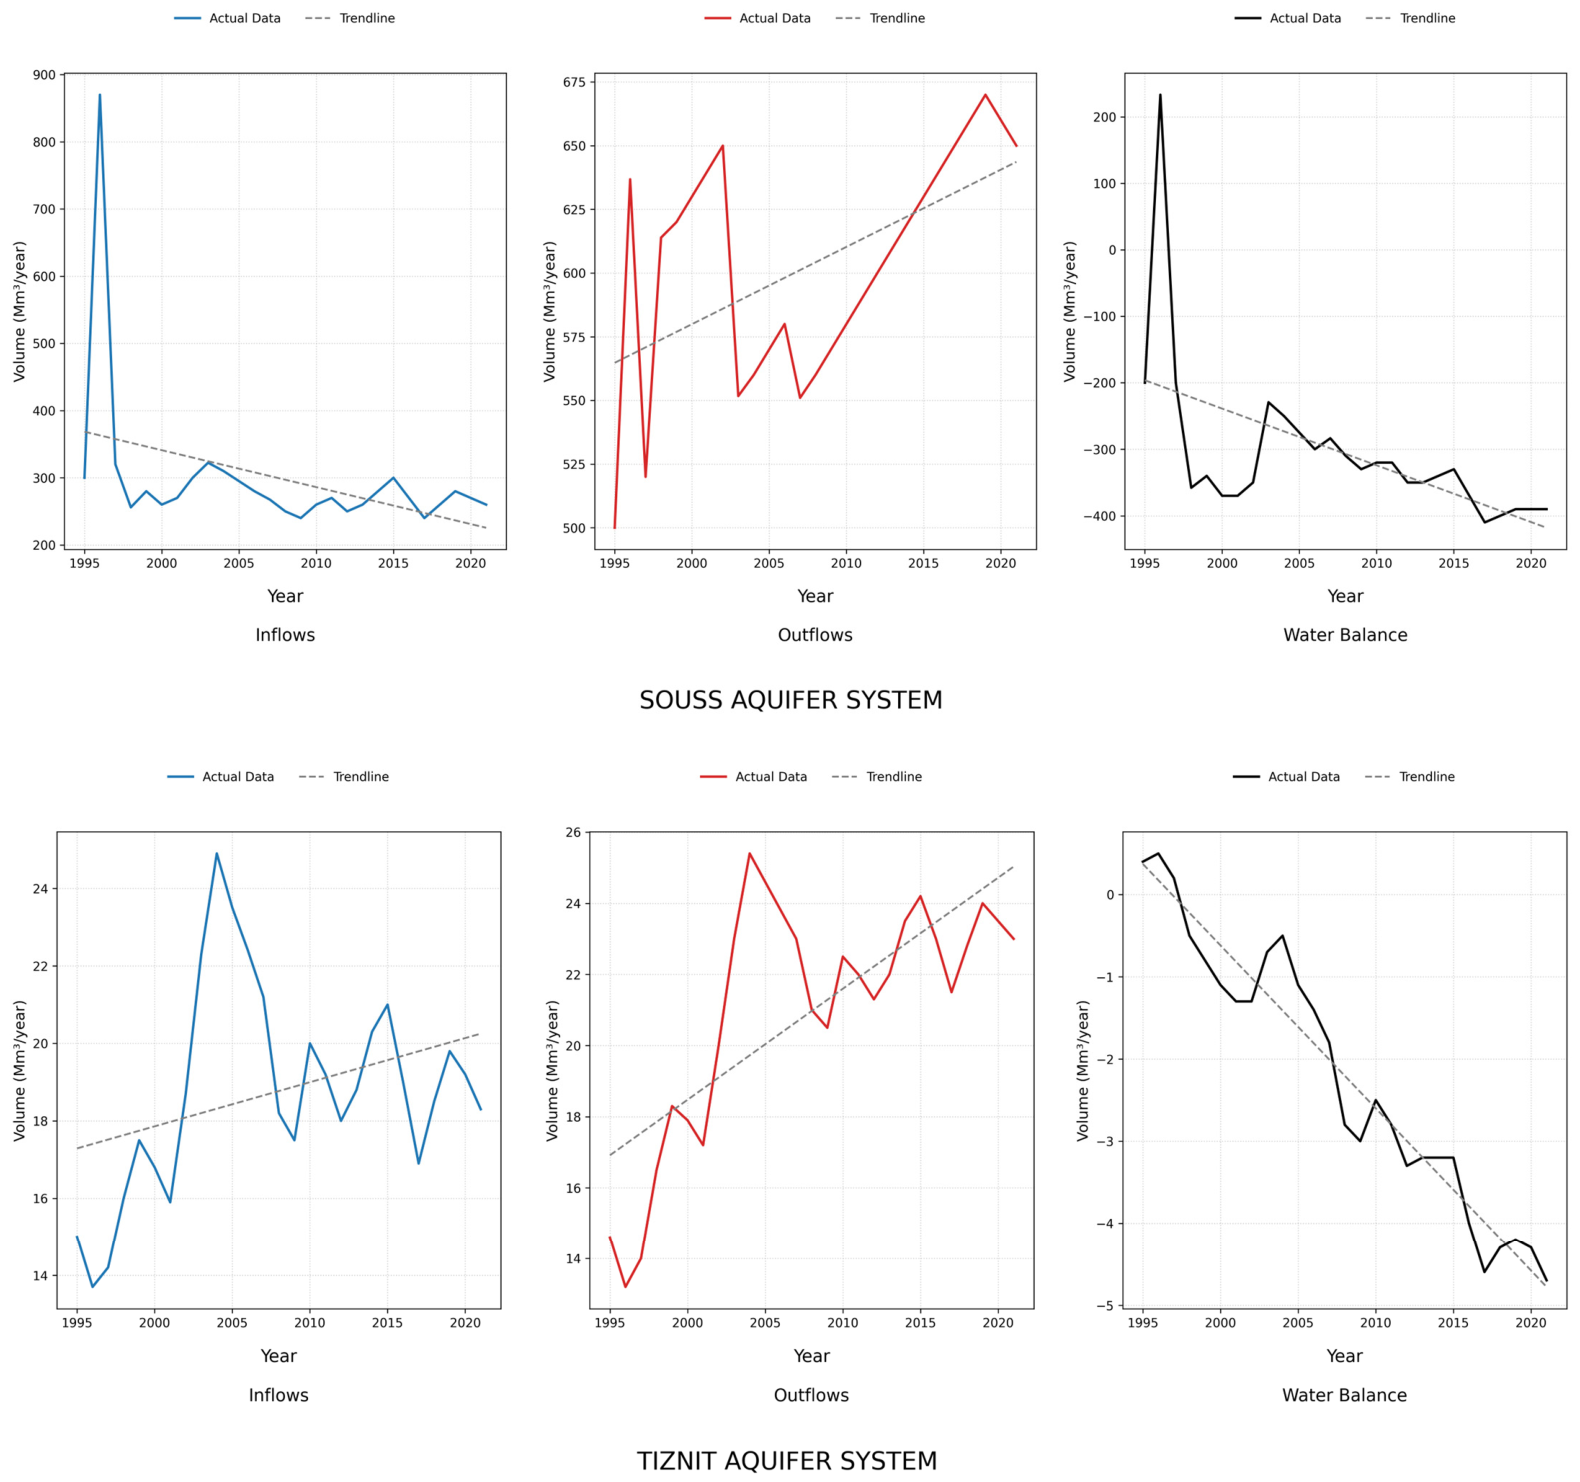
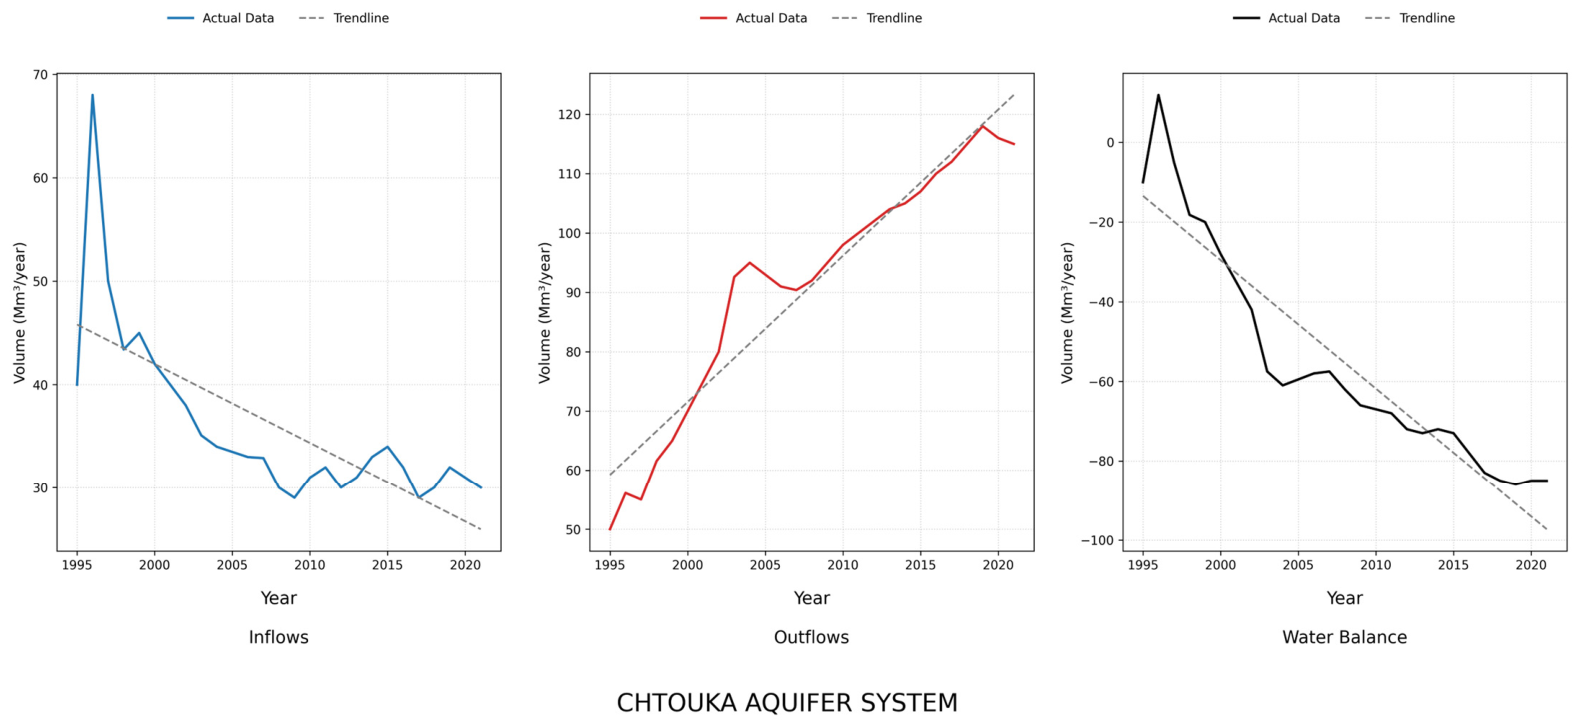
5. Hydrogeological Dynamics and Groundwater Mass Balance Evolution (1995–2021)

Comparing the changes in the decadal hydrogeological mass balance (Figure 16) clearly shows that a generalized water crisis is impacting the entire basin. The Souss, Tiznit, and Chtouka aquifer systems exhibited marked degradation patterns from 1995 to 2021.
As the system managing the largest water volumes in the region, the Souss aquifer presents a severe volumetric imbalance. It first showed a deficit of −200 Mm3/year in 1995, but recharge then peaked at an unprecedented level in 1996 (870 Mm3/year), creating a temporary surplus of +233.2 Mm3. However, inflows dropped sharply and fluctuated mostly at a much lower level, typically between 240 and 320 Mm3/year. At the same time, outflows (mainly due to pumping) showed a very strong upward trend and persisted at very high levels, regularly exceeding 600 to 630 Mm3/year over the last decade. As a direct consequence of this mismatch, the net water balance has continued to decline. The aquifer deficit has steadily worsened, ranging between −300 and −370 Mm3/year during the final years of the study.
While the Tiznit system operates on a much smaller volumetric scale, it still clearly shows signs of degradation. At the very start of the period under review (1995–1996), the aquifer was slightly in surplus (a positive balance of +0.4 to +0.5 Mm3/year), with inflows and outflows approximately equal at 13 to 15 Mm3/year. However, water withdrawals (outflows) steadily increased until they reached and even exceeded 23 to 24 Mm3/year (particularly around 2014–2015), at a much faster rate than recharge, which stayed within the range of 18 to 21 Mm3/year for the same period. The consequence of this increased water withdrawal is clear: from that point on, the aquifer has been in a consistent structural deficit, with the net loss reaching −3.2 Mm3/year by the end of the analyzed timeframe.
The Chtouka system illustrates the most alarming scenario of hydrogeological degradation, characterized by a particularly pronounced “scissors effect”. Except for a slight temporary surplus in 1996 (+11.9 Mm3 linked to an exceptional recharge of 68 Mm3), inflows show a drastic and uninterrupted decline, dropping to just 30 Mm3/year in 2018. Concurrently, outflows follow an aggressive and constant growth curve, climbing from 50 Mm3/year at the beginning of the study to reach the colossal volume of 115 Mm3/year in 2018. The evolution of the water balance logically reflects a collapse of the system: the net deficit has widened exponentially, going from −10 Mm3/year in 1995 to a staggering net loss of −85 Mm3/year in 2018, without any sign of stabilization. This dynamic is the undeniable marker of an anthropogenic pressure that vastly exceeds the natural renewal capacity of the aquifer.

6. Spatiotemporal Dynamics and Trend Analysis of the Crop Water Stress Index (CWSI) in the Souss Basin (1995–2020)

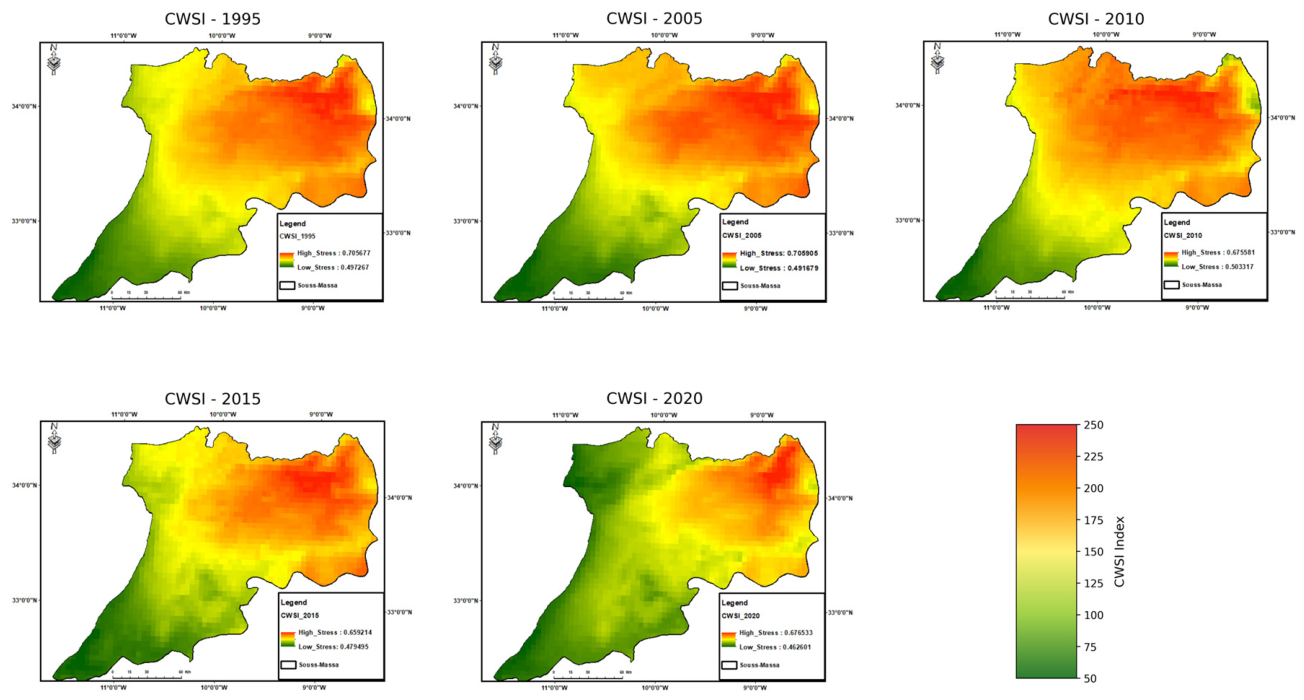
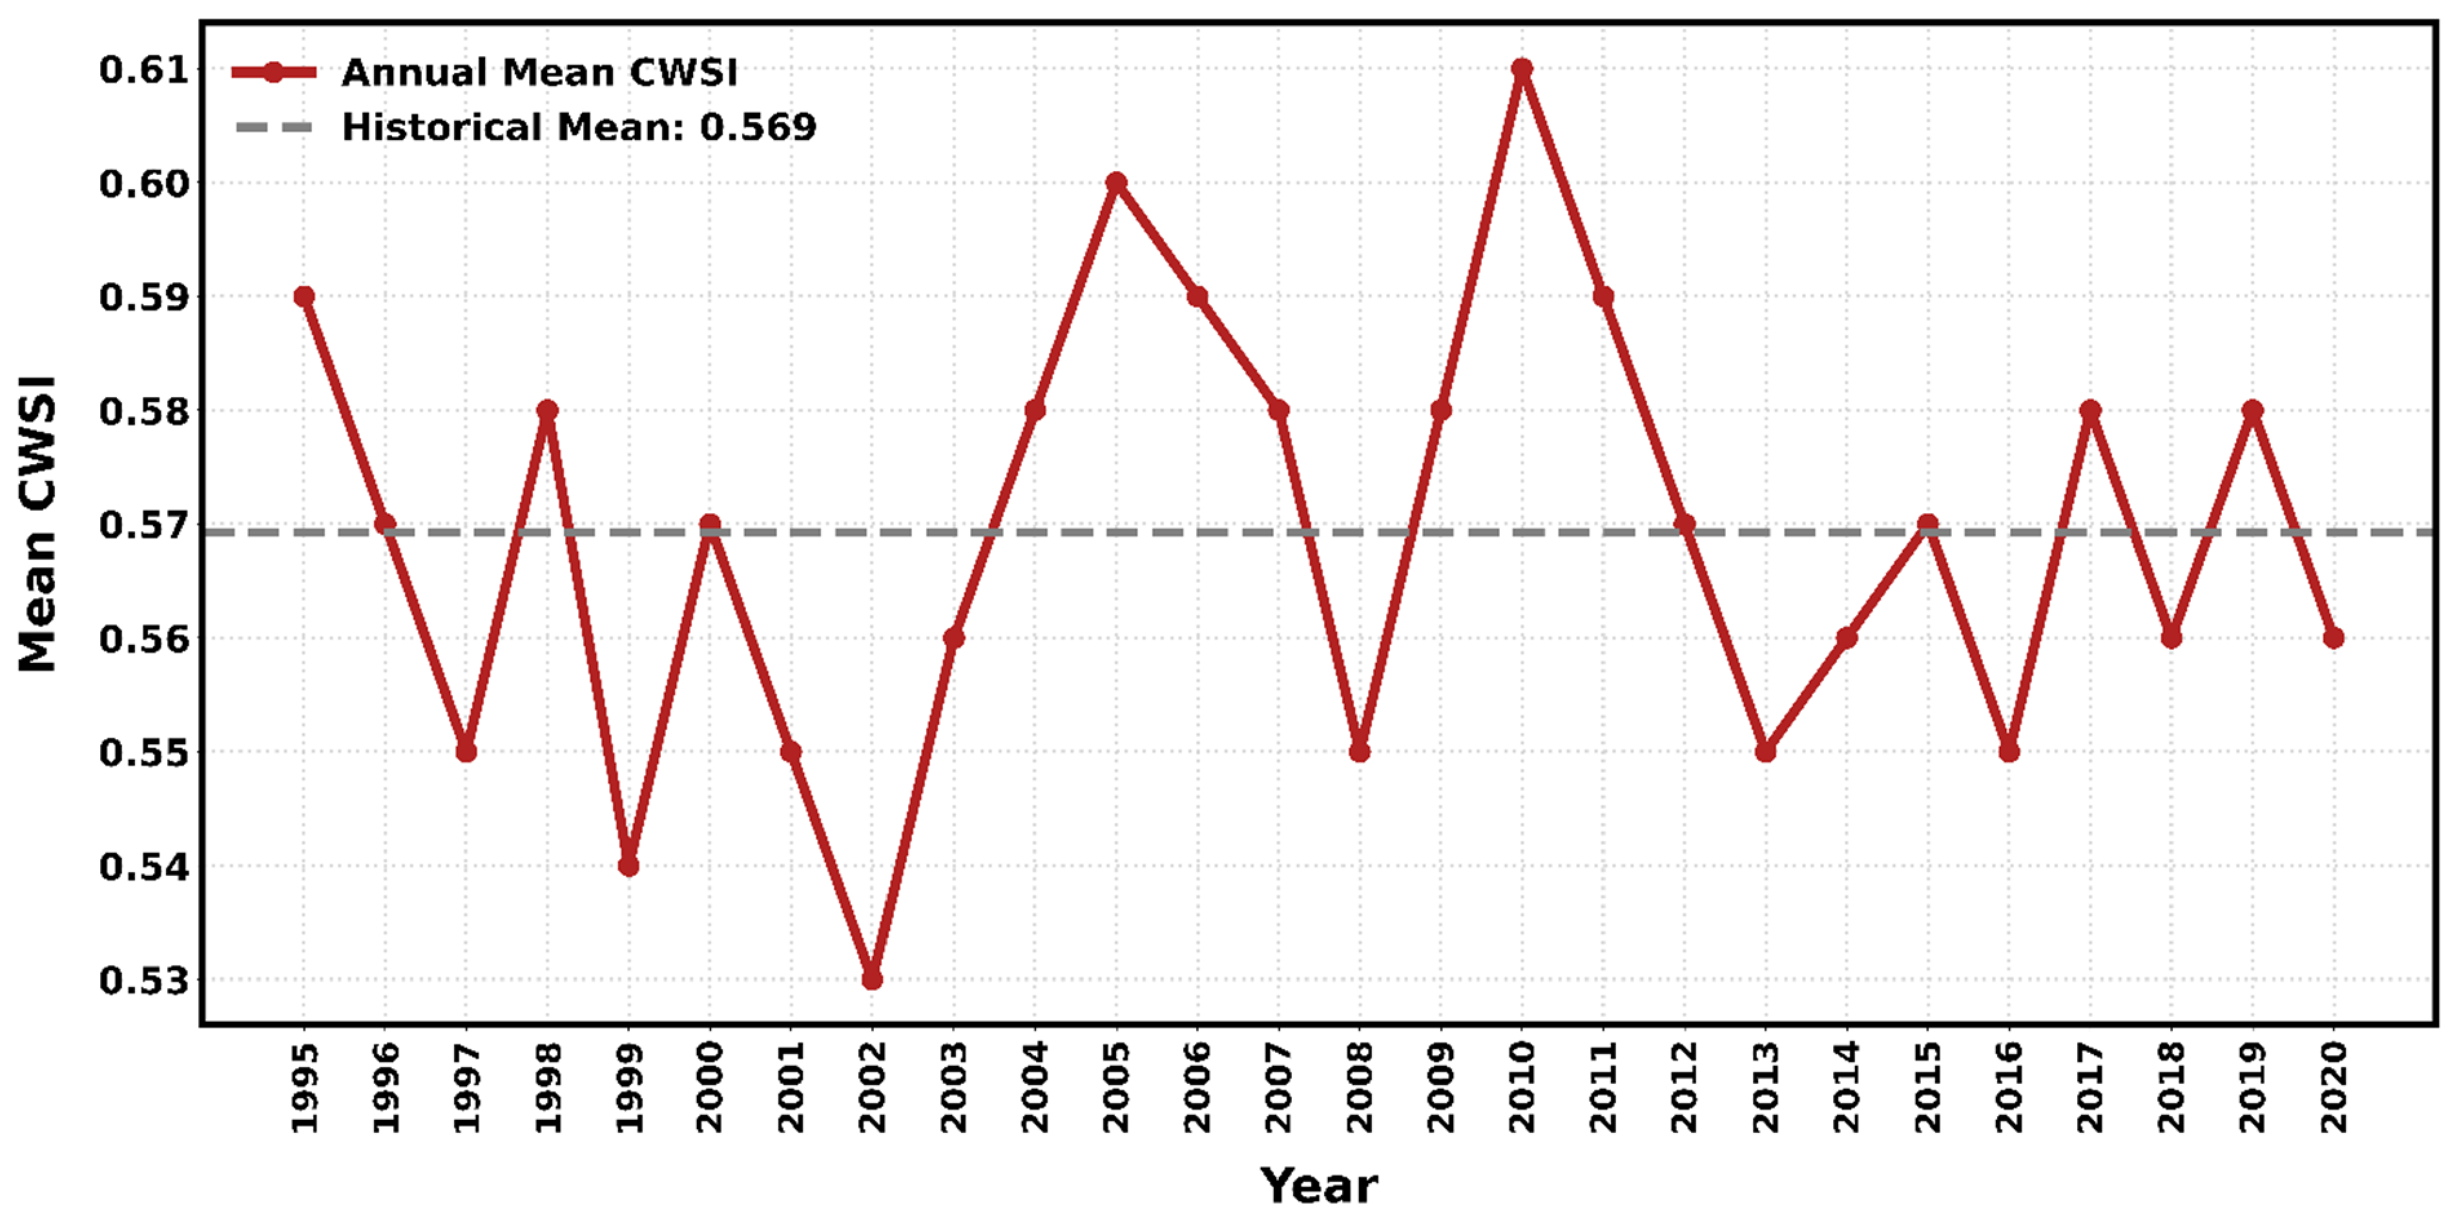
The spatial distribution analysis of the Crop Water Stress Index (CWSI) across the Souss basin (Figure 17) shows a striking heterogeneity, marked by high-stress hotspots that tend to be located in the central and northeastern areas of the basin. This spatial pattern is coupled with a complex interannual temporal evolution (Figure 18), showing wide fluctuations around a historical average of 0.569. Following a significant decline in 2002, when water stress reached its lowest recorded point (0.53), the trend reversed, and water stress began to increase rapidly and persistently. This situation steadily deteriorated until 2010, when the highest stress level of 0.61 was reached. The year 2010 stands out as a critical period, which is also clearly evident on the maps due to the severe intensification and unprecedented geographic expansion of high-water deficit areas.
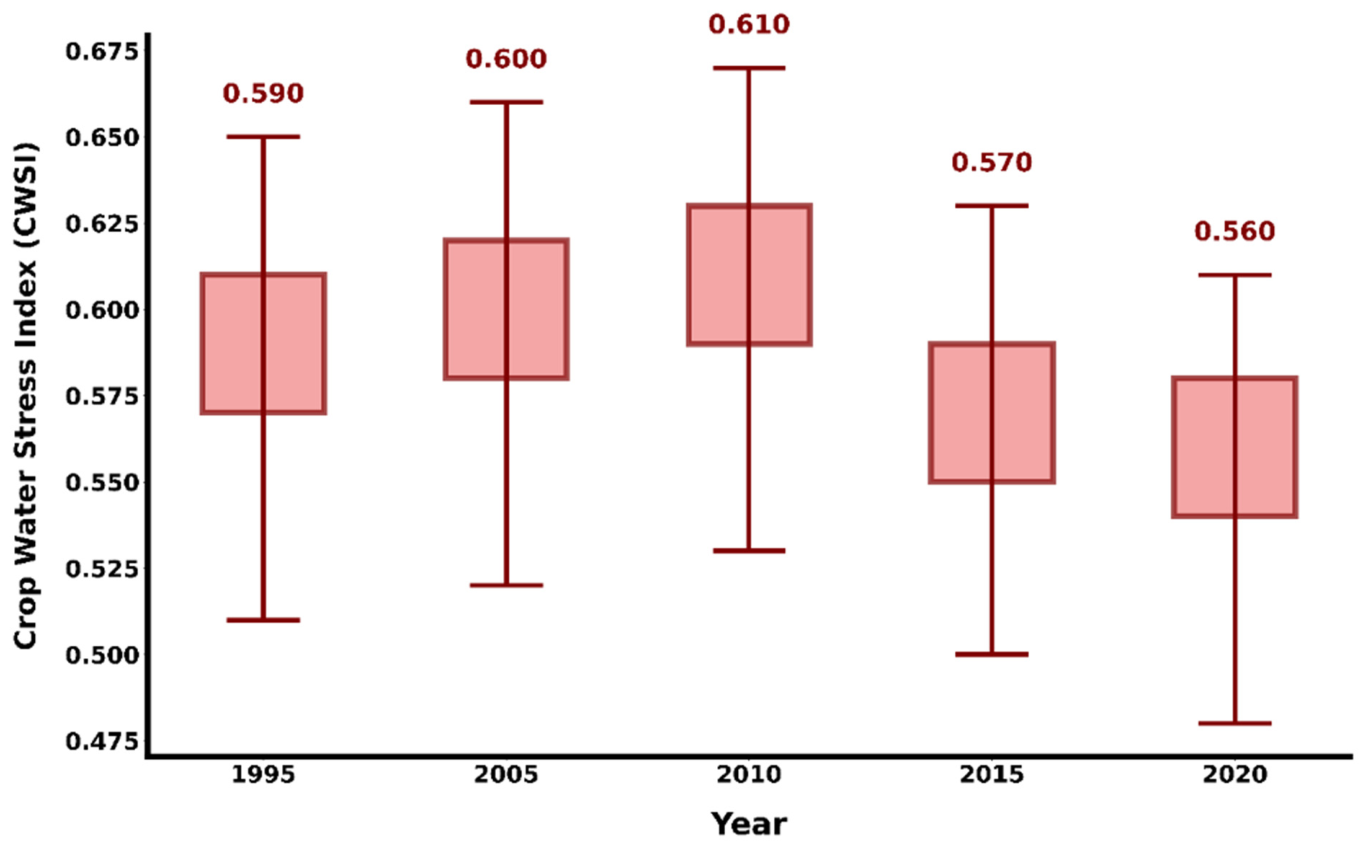
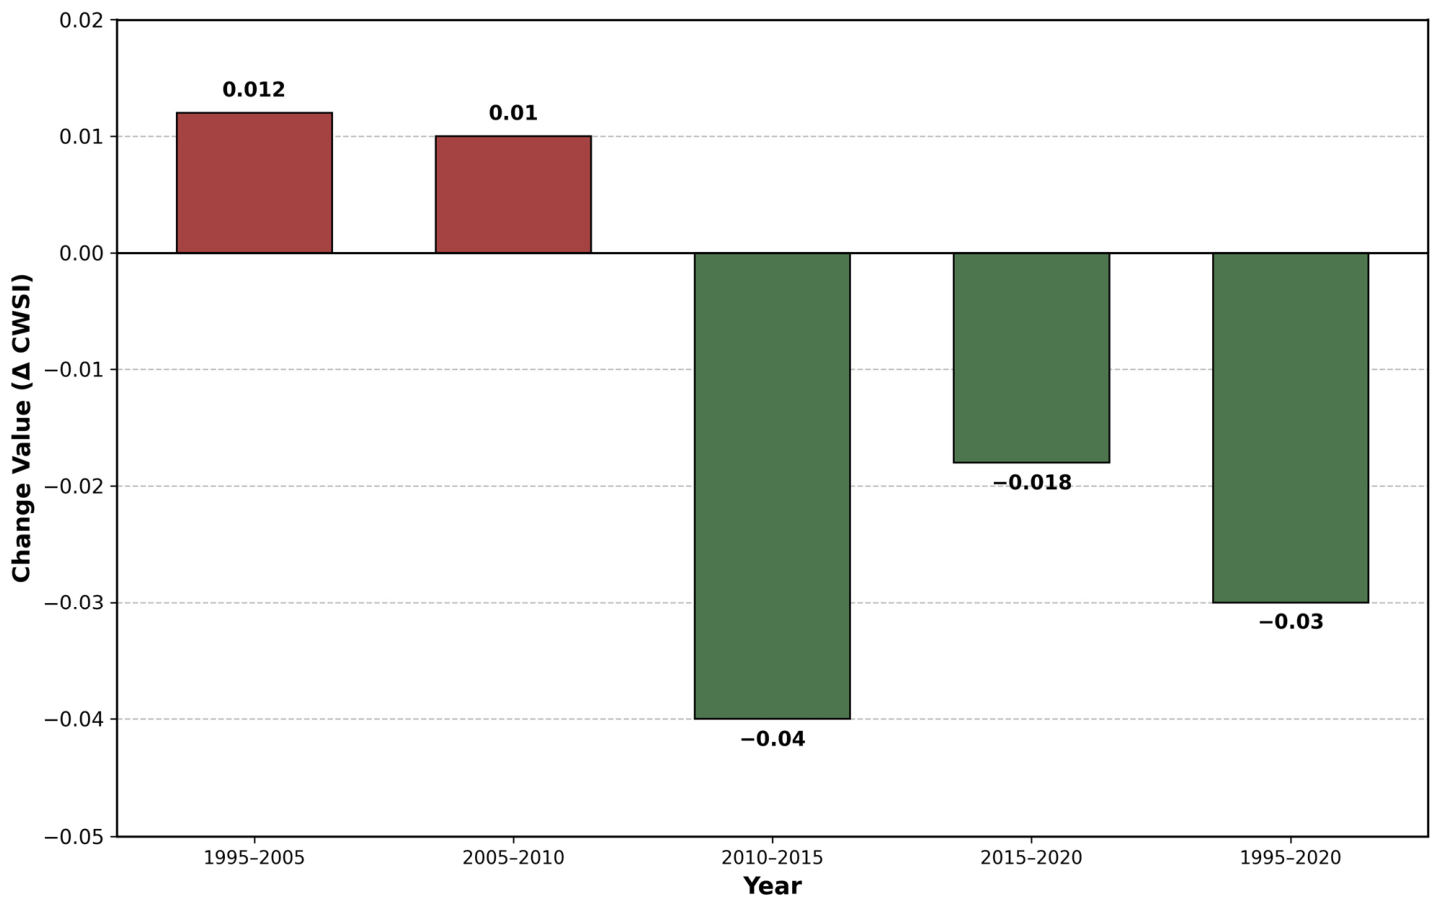
The observation of the statistical distribution (Figure 19) confirms this bell-shaped dynamic: the median CWSI value, which stood at 0.590 in 1995, reached its peak at 0.61 in 2010 before initiating a sharp drop to fall back to 0.57 in 2015, and then to 0.56 in 2020. Quantifying these trends through periodic variation rates (Figure 20) allows the studied quarter-century to be clearly split into two opposed phases. The first phase (1995–2010) exhibits a continuous degradation, with successive CWSI increases of +0.012 (1995–2005) and +0.01 (2005–2010). The second phase (2010–2020), on the other hand, corresponds to an abrupt remission period marked by very strong consecutive decreases of −0.04 (2010–2015) and −0.018 (2015–2020), leading to a net negative variation of −0.030 over the entire 1995–2020 period. This paradoxical long-term reduction in water stress, particularly pronounced after 2010, does not, however, result from an improvement in climatic conditions or natural inflows. Rather, this apparent decrease in crop water stress serves as a direct marker of the massive intensification of artificial irrigation. To survive severe climate deficits and maintain yields, crops have been heavily irrigated. This massive artificial water supply explains the recent drop in CWSI.

7. Discussion

Accounting for 15–20% of the national Gross Domestic Product (GDP), agriculture is a critical sector of the Moroccan economy. Furthermore, it drives rural employment and firmly underpins the country’s food security [31]. Structurally, Morocco’s agriculture consists of three main components: first, modern, irrigated, and intensive agriculture that is highly capitalized and geared toward producing high-value crops for export; second, transitional agriculture primarily for the domestic market; and third, rainfed (Bour) and dryland farming systems, which cover the majority of Morocco’s agricultural lands located in non-irrigated areas [32].
The Souss-Massa region is a representative case where the strong agronomic complexity and the heavy dependence on agriculture are socio-economically reflected. Even though the regional economy is partially diversified by other sectors such as fisheries and tourism, agriculture holds a dominant position in the region: not only does it provide 13% of the regional GDP, but it also employs more than 50% of the local population [21,33].
However, the integrated approach mobilized in our study to analyze 27 years of time series (1995–2021) highlights a critical vulnerability in this model. Our results reveal a profound systemic reorganization of the basin’s climatic, hydrological, and socio-economic balances. This metabolic rupture results from the convergence of two major dynamics: on the one hand, the shocks induced by extreme climate events over the past quarter-century, and on the other hand, the continuous anthropogenic pressure linked to the exponential demand for water resources from the modern agricultural sector.
Thus, the Souss-Massa basin, despite its vital contribution to the national agricultural GDP and regional employment [21,31], stands as a true textbook case of agro-economic transition under extreme constraint. The systemic analysis of our databases decrypts a complex and relentless chain of causality: initial climate shocks forced a radical mutation of cropping systems (collapse of the Bour and restructuring of irrigated perimeters), precipitating a trajectory of chronic hydrogeological overexploitation, paradoxically masked from space by an artificial attenuation of water stress (CWSI).
To forecast climate change impacts on water scarcity in the Souss-Massa region, the local rainfall regime must be understood at a suitable scale. Using the 1995–2021 period as a baseline, precipitation data show a clear break in the stationarity of the basin’s rainfall (Figure 2). Records from the five strategic stations indicate a sharp drop in precipitation, especially after 2017. Since then, annual rainfall at most stations has fallen below 200 mm, with locations like Tamri and Ouijjane dropping under 100 mm. The data also show strong interannual variability, alternating between extremely wet years (1996, 2014) and extended droughts. Spatially, this rainfall decrease is uneven: it is most severe at inland stations (Taroudant and Aoulouz) and slightly weaker along the coast (Agadir and Tamri) due to oceanic influences.
These empirical results confirm and alarmingly accentuate the long-term climate trends documented in the literature. Indeed, previous studies [33,34] had already observed a continuous aridification trajectory in the region since the 1970s. Our data demonstrate that this degradation is currently accelerating, profoundly altering the basin’s historical rainfall gradient, which traditionally ranged from 180 mm/year in the plains to 600 mm/year in the High Atlas [18,35].
In parallel with this rainfall deficit, our thermal analyses highlight an intense asymmetrical warming. Sen’s slope estimator applied to our time series (Table 2) reveals highly significant temperature increases, peaking at +0.116 °C/year in Ouijjane (p < 0.001). This warming is characterized by an aggressive rise in minimum nighttime temperatures (by 1.5 °C to 2.0 °C), which clearly outpaces that of maximum daytime temperatures (1.0 °C to 1.5 °C). Consequently, our data designate the 2017–2021 period as the hottest ever recorded in the basin, with maximum temperatures frequently exceeding 29 °C and minimums exceeding 14 °C on a regional scale.
This asymmetrical thermal dynamic, identified in our study area, constitutes a major aggravating factor widely corroborated by international agronomic literature. It has been demonstrated that such an elevation in nighttime temperatures disproportionately accelerates plant metabolism and maintenance respiration [36,37]. The region’s atmosphere thus transforms into a vast evaporative sink: the increase in evapotranspiration (ET0) exacerbates crop water requirements and renders the natural environment entirely unsuitable for traditional rainfed agriculture, thereby tightening the climatic vice independently of the drop in precipitation alone.
Within the context of the growing climatic and water constraints detailed above, the regional agricultural sector is facing major resilience challenges. Historically dominated by cereal crops, seasonal fruits, and citrus, this sector is also structurally vulnerable due to high land fragmentation (80% of farms are under 5 hectares) [38]. Yet, despite these intrinsic vulnerabilities and a hostile physical environment, the basin displays paradoxical sectoral dynamism. Our projections corroborate this trend, highlighting a spectacular increase in the value of agricultural production (rising from 11,838 million dirhams in 2010 to 17,669 million in 2020), accompanied by a rise in working days (from 30,804 to 36,845 over the same period) [34]. This socio-economic dynamism does not stem from the resilience of the traditional system, but from a profound and radical transformation of production modes (LULC) between 1995 and 2021, marked by an absolute dichotomy between the cereal and fodder sectors.
The first victim of this hostile climate is the rainfed cropping system (Bour), historically the guarantor of local food security. Our results reveal a total disconnect between agricultural effort and yields. Bour cereals (soft wheat, durum wheat, barley) display absolute vulnerability to drought. Soft wheat production fell by 93%, dropping from 205,623 tons in the 1995–1996 season to 13,960 tons in 2020–2021, alongside an average area reduction of 335.38 ha/year. Barley recorded yield losses of 1011.3 tons/year and an area decline of 188.31 ha/year. Durum wheat suffered a similar decline, losing 115.86 tons/year in yield and 127.9 ha/year in area.
The statistical analysis of these declines is revealing: the correlation between cultivated area and production is very weak to moderate (R = 0.46 to 0.72). More significantly, the temporal predictive models for production show negligible coefficients of determination (R2 between 0.05 and 0.14), while the models estimating cultivated area are slightly more robust (R2 between 0.33 and 0.67). These statistics validate a severe agronomic reality: for the Bour system, production is no longer correlated with sown areas, but has become exclusively subservient to situational climate hazards [39]. The land is sown, but the thermal shock and water deficit destroy the harvest, forcing massive abandonment.
The response to this climate crisis was not limited to abandoning the Bour, but also translated into a voluntary and continuous decline in irrigated cereals. Although theoretically protected from drought, the Cereal Area and Production (SPC) in irrigated zones steadily declined until 2021, with stable year-over-year decrease rates (e.g., grain corn at −114.63 ha/year). Unlike the Bour, the correlation between area and production of irrigated cereals is extremely strong (R = 0.91 to 0.94). This means that the decline in their production volume is not caused by climate-induced yield failures, but results from a deliberate reduction in the Cultivated Cereal Area. Faced with the growing competitiveness of high-value-added crops, the progressive increase in pumping costs, and water scarcity, farmers are making a strict agro-economic choice [40]: irrigation water, a resource that has become too scarce and expensive, is intentionally diverted from cereals to be reallocated toward smaller but highly profitable plots.
The water saved by abandoning cereals has been massively redirected toward fodder crops, which have strongly responded to climate change through spectacular expansion. The LULC matrix confirms that fodder has become the basin’s new agricultural paradigm, acting as the driver of the regional production value increase mentioned earlier. Alfalfa represents the transitional crop par excellence, constituting 60% to 80% of the total fodder area. Its progression follows an impressive projected growth model defined by the equation y = 802.92x − 2516.2, reflecting an average expansion of +802.92 hectares per year. This model displays an exceptional coefficient of determination (R2 = 0.90), supported by a robust correlation between area and production (R = 0.83). For its part, the dynamics of berseem/fodder corn, while presenting a more nuanced area model (y = −100.73x + 10104, R2 = 0.48), display a very strong production model (y = −37932x − 121342, R2 = 0.92) with an almost perfect area–production correlation (R = 0.95). Similarly, other fodder crops maintain an extremely high correlation (R = 0.96).
As a direct consequence of this agronomic intensification (driven by the addition of 150 to 450 hectares per year on average), total fodder production surged from approximately 200,000 tons in 1995 to over a million tons in 2021, representing a more than fivefold increase [41]. This dynamic is part of an adaptation strategy aiming to reconcile economic imperatives and environmental constraints. It is supported by the explosion of the livestock industry, which today captures 28% of the regional agricultural production (with dairy production rising from 150 to 320 million liters) [42,43]. However, while these crops allow for excellent economic valorization of water in the short term and offer financial viability to farms [44], this transition from subsistence agriculture to cash-crop agriculture (livestock/fodder) ratifies total dependence on irrigation, paving the way for unprecedented hydrogeological overexploitation [22,45].
Maintaining the fodder hegemony, described in the previous section, in an environment that has become structurally more arid and hot exacts an unsustainable environmental toll. The combination of double climate forcing (thermal and rainfall) and this agro-economic restructuring exerts unprecedented pressure on the basin’s hydrological balance. Our quantitative data and literature analysis highlight a collapse in the availability of surface resources. While the historical flow of the Souss-Massa wadi averaged 652 million m3 (with extreme interannual variability ranging from 35 to 2160 million m3), the supply of renewable surface water currently peaks at only 379 million m3/year (i.e., 364 million for main dams and 15 million for hill dams) [22,44]. Faced with this drastically restricted supply, regional anthropogenic demand has soared to 1076 million m3/year [46]. With agriculture hoarding 93% of this overall demand [23,47,48], this glaring imbalance generates a direct and critical structural water deficit estimated at 290 million m3 per year [49].
The inability of surface resources to fill this hydrological chasm has transferred the entirety of the pressure onto the Souss, Tiznit, and Chtouka aquifers. The evolution of the groundwater mass balance thus highlights a perfect “scissors effect,” revealing an agronomic maladaptation trajectory. On the one hand, there is a drop in “Inputs”: the degradation of rainfall and the increasing severity of droughts drastically reduce, or even cancel out, natural recharge and groundwater renewal. On the other hand, this situation is exacerbated by the explosion of “Outputs”: the uncontrolled expansion of alfalfa and fodder corn (highly demanding crops requiring up to 800 mm of water per cycle) forces farmers to multiply groundwater pumping. These withdrawals are all the more massive as they must compensate for the galloping evapotranspiration induced by the asymmetrical rise in nighttime and daytime temperatures.
In the absence of strict regulation, this deficit can only be offset by excessive and chronic groundwater extraction. This dynamic has profoundly altered the status of the resource: groundwater tables, which historically constituted strategic emergency reserves mobilized only during extreme drought years, have been transformed into daily operational resources. Our findings thus align perfectly with recent hydrogeological studies [22,45,49], which warn of the continuous, generalized, and potentially irreversible decline of piezometric levels in the Souss-Massa, sacrificed on the altar of short-term agricultural productivity.
It is at the intersection of this hydrogeological overexploitation and remote sensing that the “irrigation paradox” is revealed, validated by our data on the Crop Water Stress Index (CWSI). Theoretically, climate severity should have led to extreme water stress in the vegetation. The first phase of our study (1995–2010) confirms this logic: the average CWSI worsened to reach a critical peak of 0.610 in 2010. However, the 2010–2020 decade marks a spectacular reversal, with an overall decrease in CWSI (the average falling to 0.560 in 2020), suggesting an apparent “improvement” in crop health at the basin scale, despite the continuation of meteorological drought. It is crucial to highlight that the apparent stabilization and improvement of the CWSI over the last decade constitutes a “spectral illusion” of crop health. While lower CWSI values indicate cooler canopy temperatures and reduced water stress, this trend does not reflect natural climate resilience or an improvement in precipitation. Instead, this flourishing green vegetation captured by satellite imagery is artificially maintained through the massive, unsustainable extraction of groundwater to irrigate water-intensive crops like alfalfa. The satellite sensors essentially “see” a healthy, well-watered canopy on the surface, which completely masks the reality of an agricultural system on life support that is dramatically depleting the underlying aquifers. This profound disconnect between the apparent canopy health and the hidden groundwater crisis perfectly characterizes the environmental maladaptation of these autonomous cropping shifts.
The environmental degradation route in the Souss-Massa basin is not an isolated case, but it is consistent with a pattern at a global level of agro-hydrological vulnerability that is common to other major arid and semi-arid regions of the world [50]. Farm production and drought management practices that led to the heavy use of groundwater in California’s Central Valley, where the growers managed to produce water-intensive and highly profitable crops even during the drought, are quite similar to those reported in the Souss-Massa basin [51]. Likewise, the Mediterranean river basins of Spain (e.g., Segura and Guadalquivir) have experienced a dramatic increase in intensive irrigated agriculture, resulting in the over-exploitation of groundwater and the prioritization of short-term economic benefits at the expense of long-term hydrological sustainability [52]. In fact, the autonomous adaptations to climate change in Australia’s Murray–Darling Basin have, in some cases, been maladaptive, leading to the reallocation of water resources to the most profitable crops and also to a paradox where the increased efficiency of irrigation techniques leads to increased consumption of water [53]. This “spectral illusion” of crop health that features in our investigation can be viewed as a global instance of a dilemma in agricultural adaptation: autonomous farmer strategies, when driven primarily by market profitability and without strict ecological limits, inevitably lead to the depletion of common-pool resources.
Correlating all these parameters allows us to assess the adaptation trajectory of the Souss-Massa basin. The systemic loop can be summarized as follows: (i) Climate degradation destroys the viability of rainfed crops (Bour system); (ii) faced with the scarcity and rising cost of water, farmers deliberately and continuously abandon irrigated cereal crops; (iii) to survive economically, land use (LULC) mutates towards the irrigated livestock/fodder complex, which offers yield security and high profitability; (iv) to support this new, hyper-water-intensive agricultural geography in the face of a hostile climate, groundwater pumping skyrockets; (v) this water infusion artificially keeps the crops alive (paradoxical drop in CWSI), but (vi) irreparably empties the aquifers.
This strategic orientation creates a major sustainability dilemma. In the short term, it has generated undeniable socio-economic profitability, driven by the demand of an intensive livestock sector that now accounts for 28% of the region’s agricultural production [42]. Intensive fodder production directly propelled animal production, with red meat tonnage rising from 16,203 tons in 2008 to 26,661 tons in 2019, and dairy production leaping from 150 to 320 million liters [43]. This system also relies on the sylvo-pastoral zones of Souss-Massa, which provide between 1.5 and 2 billion annual forage units, representing nearly 17% of the livestock’s feed [6].
However, while this autonomous transition proves economically profitable in the short term, it constitutes a textbook case of environmental maladaptation. Replacing resilient rainfed cereals (which had become unprofitable) with hyper-water-intensive alfalfa in a region struck by endemic aridification is an ecological dead end. Without an urgent revision of land-use planning policies and strict regulation of land-use mutations (aligning crop choices with the actual recharge capacity of the aquifers), the artificial maintenance of this agricultural system will lead to the definitive collapse of regional water resources.
Although this study proposes robust systemic modeling of the Water–Climate–Agriculture nexus, certain limitations inherent to the methods employed must be emphasized. The analysis of water stress dynamics (CWSI) and land use relies on remote sensing data whose spatial and temporal resolution may smooth out the great heterogeneity of the agricultural micro-plots typical of the region (where many farms are under 5 ha). Furthermore, accurately estimating the groundwater deficit would require a denser network of continuous in situ piezometric data to perfectly calibrate the actual pumping volumes that sometimes escape official statistics. Finally, future works should integrate finer behavioral and socio-economic models to assess farmers’ actual capacity to adopt precision irrigation practices in the face of the programmed depletion of the water tables.
Halting the ongoing maladaptation and the eventual depletion of regional water resources represents a major challenge. It will require public policymakers and water managers to implement fundamental structural changes without delay [54]. Based on the findings of this study, the following policy interventions are proposed: (i) Strict Groundwater Regulation and Monitoring: A critical measure to reduce the artificial continuation of water-intensive crops is the strict enforcement of groundwater pumping quotas. The basin currently faces a structural water deficit estimated at approximately 290 million m3/year, while piezometric records indicate continuous declines in the Souss, Chtouka, and Tiznit aquifers. These limits should therefore be directly linked to the actual natural recharge rates of the aquifers. Requiring farmers to install smart water meters on agricultural wells would represent a crucial step toward ensuring compliance and real-time monitoring of withdrawals [55]. (ii) Revising Agricultural Subsidies: As a matter of urgency, agricultural policies and financial incentives should be dissociated from highly water-intensive crops such as alfalfa. During the study period, fodder production increased from nearly 200,000 tons to more than 1,000,000 tons, reflecting the rapid expansion of water-demanding production systems. Subsidies should instead be redirected toward drought-resilient fodder alternatives, agroecological farming practices, and localized precision irrigation technologies that genuinely contribute to water savings rather than merely expanding irrigated areas [56]. (iii) Agro-Climatic Land-Use Planning: Crop selection should be guided by hydrological conditions within regional land-use planning. Rainfed cereals, particularly soft wheat, recorded a 93% decline in production over the study period, demonstrating that several areas have become increasingly unsuitable for conventional cereal cultivation. Strict zoning regulations are therefore required to prevent the expansion of highly water-demanding crops in zones where aquifer levels have reached critical thresholds. (iv) Integration of Unconventional Water Resources: To reduce groundwater demand, rapid expansion of unconventional water resources is required, particularly through treated wastewater reuse and seawater desalination, where economically and environmentally feasible. Since agriculture accounts for nearly 93% of total regional water demand, diversifying supply sources is essential to supplement agricultural water use [57,58]. (v) Long-Term Resilience Strategy: Ultimately, preventing this ongoing maladaptation from becoming the blueprint for future development requires a fundamental reversal. The observed “scissors effect” between declining natural recharge and increasing groundwater withdrawals confirms that agro-industrial development in the Souss-Massa basin can no longer be based solely on economic performance or crop expansion, but must be intrinsically tied to the preservation of the regional hydrological legacy.


8. Conclusions

This study provides a multi-dimensional systemic evaluation of the Water–Climate–Agriculture nexus in the Souss-Massa basin over a 27-year trajectory (1995–2021). Our multi-criteria analysis reveals that the region is currently undergoing a radical metabolic rupture, stemming from the convergence of accelerating climate forcing and a structural shift in its agro-economic model. The empirical evidence highlights a profound transformation of the agricultural landscape, where the traditional balance between resources and production has been fundamentally upended by contemporary environmental pressures.
Agricultural data and LULC maps show that rainfed and irrigated cereals are declining for entirely different reasons. Rainfed soft wheat (Bour) production dropped by 93% because yields rely directly on erratic rainfall and warming temperatures. The reduction in irrigated cereals, however, is a deliberate economic choice. Area and production for these crops are highly correlated: to manage water scarcity and high pumping costs, farmers are simply reducing irrigated cereal acreage and moving water to more profitable crops.
LULC matrices confirm that alfalfa and fodder maize have expanded across former cereal areas. This high-value fodder–livestock system currently drives regional agricultural GDP and supports the dairy and red meat sectors. This economic transition dictates a water-intensive agronomic model.
Forage cultivation in the basin depends entirely on pumped groundwater. Local pumping rates now exceed natural aquifer recharge.
The integration of piezometric data highlights a critical “scissors effect” within the region’s groundwater tables. On one side, the degradation of the rainfall regime has led to an atrophy of natural recharge, significantly limiting the renewal of aquifers. On the other side, the uncontrolled expansion of forage crops has triggered an explosion in pumping rates to offset high evapotranspiration. Groundwater, formerly a strategic crisis reserve for drought periods, has been transformed into a daily operational resource. This dynamic is pushing the Souss and Chtouka aquifers toward a trajectory of irreversible depletion, sacrificing long-term hydrogeological heritage for short-term agronomical output.
Furthermore, the deconstruction of the regional “irrigation paradox” through the Crop Water Stress Index (CWSI) constitutes a major finding of this work. While climatic severity has increased, CWSI data over the last decade shows an unexpected stabilization or “artificial improvement” in crop health. Our study proves that this is a spectral illusion; the attenuation of surface water stress observed via satellite is only maintained through massive groundwater withdrawal. This spectral signature masks a total transfer of climate vulnerability from the atmosphere to the subsurface, characterizing a clear state of environmental maladaptation.
Agricultural viability in the Souss-Massa basin requires halting continuous groundwater depletion. Regional land-use planning must align crop selection with natural aquifer recharge rates. This macroscopic analysis establishes regional land-cover trends. Future research should integrate high-resolution in situ data and socio-economic modeling to evaluate precision irrigation strategies. Stabilizing the hydrological balance is the primary condition for long-term agricultural resilience.

Author Contributions

Conceptualization, M.E.-Y. and M.B., methodology, Y.B. and M.E.G., software, S.E.A., validation, M.B., B.B., H.T. and A.L., formal analysis, M.E.-Y., investigation, M.E.-Y., resources, M.E.-H. and Z.E.A.S., data curation, M.E.-Y. and M.M.M., writing—original draft preparation, M.E.-Y., writing—review and editing, M.B., visualization, M.B., supervision, M.B., funding acquisition, B.B. and K.M.K. All authors have read and agreed to the published version of the manuscript.

Funding

This research work was supported by the Deanship of Scientific Research at King Khalid University under Grant No. RGP2/649/46.

Data Availability Statement

The data presented in this study are available on request from the corresponding authors. The data are not publicly available due to privacy restrictions.

Acknowledgments

The authors extend their appreciation to the Deanship of Scientific Research at King Khalid University for funding this work through the Large Group Research Project under Grant No. RGP2/649/46.

Conflicts of Interest

The authors declare no conflicts of interest.

References

  1. Lee, H.; Calvin, K.; Dasgupta, D.; Krinner, G.; Mukherji, A.; Thorne, P.; Trisos, C.; Romero, J.; Aldunce, P.; Barrett, K. IPCC, 2023: Climate Change 2023: Synthesis Report: A Report of the Intergovernmental Panel on Climate Change; IPCC: Geneva, Switzerland, 2023. [Google Scholar] [CrossRef]
  2. IPCC. Intergovernmental Panel on Climate Change, 2014: Working Group I Contribution to the IPCC Fifth Assessment Report; IPCC: Geneva, Switzerland, 2013; Volume 8. [Google Scholar]
  3. Stocker, T. Climate Change 2013: The Physical Science Basis: Working Group I Contribution to the Fifth Assessment Report of the Intergovernmental Panel on Climate Change; Cambridge University Press: Cambridge, UK, 2014. [Google Scholar] [CrossRef]
  4. Pachauri, R.K.; Allen, M.R.; Barros, V.R.; Broome, J.; Cramer, W.; Christ, R.; Church, J.A.; Clarke, L.; Dahe, Q.; Dasgupta, P. Climate change 2014: Synthesis report. In Contribution of Working Groups I, II and III to the Fifth Assessment Report of the Intergovernmental Panel on Climate Change; IPCC: Geneva, Switzerland, 2014; ISBN 9291691437. [Google Scholar]
  5. Trenberth, K.E.; Fasullo, J.T.; Shepherd, T.G. Attribution of climate extreme events. Nat. Clim. Change 2015, 5, 725–730. [Google Scholar] [CrossRef]
  6. Chebli, Y.; El Otmani, S.; Elame, F.; Moula, N.; Chentouf, M.; Hornick, J.L.; Cabaraux, J.F. Silvopastoral system in Morocco: Focus on their importance, strategic functions, and recent changes in the mediterranean side. Sustainability 2021, 13, 10744. [Google Scholar] [CrossRef]
  7. World Bank. World Development Report 2010: Development and Climate Change; The World Bank: Washington, DC, USA, 2009. [Google Scholar] [CrossRef]
  8. Kay, M.; Bunning, S.; Burke, J.; Boerger, V.; Bojic, D.; Bosc, P.-M.; Clark, M.; Dale, D.; England, M.; Hoogeveen, J. The State of the World’s Land and Water Resources for Food and Agriculture 2021—Systems at Breaking Point; FAO: Rome, Italy, 2022. [Google Scholar] [CrossRef]
  9. Klose, S.; Reichert, B.; Lahmouri, A. Management options for a sustainable groundwater use in the Middle Drâa Oases under the pressure of climatic changes. In Climatic Changes and Water Resources in the Middle East and North Africa; Springer: Berlin/Heidelberg, Germany, 2008; pp. 179–195. [Google Scholar] [CrossRef]
  10. Oweis, T.Y. Improving agricultural water productivity: A viable response to water scarcity in the dry areas. In Integrated Water Resources Management in the Mediterranean Region; Springer: Berlin/Heidelberg, Germany, 2012; pp. 39–55. [Google Scholar] [CrossRef]
  11. Rochdane, S.; Bounoua, L.; Zhang, P.; Imhoff, M.L.; Messouli, M.; Yacoubi-khebiza, M. Combining Satellite Data and Models to Assess Vulnerability to Climate Change and Its Impact on Food Security in Morocco. Sustainability 2014, 6, 1729–1746. [Google Scholar] [CrossRef]
  12. Driouech, F.; Déqué, M.; Sánchez-Gómez, E. Weather regimes-Moroccan precipitation link in a regional climate change simulation. Glob. Planet. Change 2010, 72, 1–10. [Google Scholar] [CrossRef]
  13. Schilling, J.; Freier, K.P.; Hertig, E.; Scheffran, J. Climate change, vulnerability and adaptation in North Africa with focus on Morocco. Agric. Ecosyst. Environ. 2012, 156, 12–26. [Google Scholar] [CrossRef]
  14. Benassi, M. Drought and climate change in Morocco. Analysis of precipitation field and water supply. Options Méditerranéennes 2008, 80, 83–87. [Google Scholar]
  15. Rochdane, S.; Reichert, B.; Messouli, M.; Babqiqi, A.; Khebiza, M.Y. Climate change impacts on water supply and demand in Rheraya watershed (Morocco), with potential adaptation strategies. Water 2012, 4, 28–44. [Google Scholar] [CrossRef]
  16. Benabdelouahab, T.; Balaghi, R.; Hadria, R.; Lionboui, H.; Djaby, B.; Tychon, B. Testing Aquacrop to Simulate Durum Wheat Yield and Schedule Irrigation in a Semi-Arid Irrigated Perimeter in Morocco. Irrig. Drain. 2016, 65, 631–643. [Google Scholar] [CrossRef]
  17. Elame, F.; Doukkali, R.; Lionboui, H. Dynamic modeling of climate change impact on agricultural lands and water resources. In Handbook of Climate Change Management; Springer: Cham, Switzerland, 2020; pp. 1–21. [Google Scholar] [CrossRef]
  18. Talbi, A.; El Madidi, S. Effects of environmental factors on milk production of Holstein cows in Souss-Massa region of Morocco. Livest. Res. Rural Dev. 2015, 27, 116. Available online: http://www.lrrd.org/lrrd27/6/talb27116.html (accessed on 10 May 2026).
  19. Choukr-Allah, R.; Hirich, A.; Bouchaou, L.; Choukr-Allah, R.; Hirich, A.; Ennasr, M.; Malki, M.; Abahous, H.; Bouaakaz, B.; Nghira, A. Climate change and water valuation in Souss-Massa region: Managementand adaptive measures. Climate change and water valuation in Souss-Massa region: Management and adaptive measures. Eur. Water 2017, 60, 203–209. [Google Scholar]
  20. Hssaisoune, M.; Boutaleb, S.; Benssaou, M.; Bouaakkaz, B.; Bouchaou, L. Physical geography, geology, and water resource availability of the Souss-Massa River Basin. In Handbook of Environmental Chemistry; Springer: Berlin/Heidelberg, Germany, 2017; Volume 53, pp. 27–56. [Google Scholar] [CrossRef]
  21. Mansir, I.; Bouchaou, L.; Chebli, B.; Ait Brahim, Y.; Choukr-Allah, R. A specific indicator approach for the assessment of water resource vulnerability in arid areas: The case of the Souss-Massa Region (Morocco). Hydrol. Sci. J. 2021, 66, 1151–1168. [Google Scholar] [CrossRef]
  22. Ait Brahim, Y.; Seif-Ennasr, M.; Malki, M.; N’da, B.; Choukrallah, R.; El Morjani, Z.E.A.; Sifeddine, A.; Abahous, H.; Bouchaou, L. Assessment of climate and land use changes: Impacts on groundwater resources in the Souss-Massa river basin. Handb. Environ. Chem. 2017, 53, 121–142. [Google Scholar] [CrossRef]
  23. Hssaisoune, M.; Bouchaou, L.; Sifeddine, A.; Bouimetarhan, I.; Chehbouni, A. Moroccan groundwater resources and evolution with global climate changes. Geosciences 2020, 10, 81. [Google Scholar] [CrossRef]
  24. Mann, H.B. Nonparametric tests against trend. Econom. J. Econom. Soc. 1945, 13, 245–259. [Google Scholar] [CrossRef]
  25. Kendall, M.G. Rank Correlation Methods, 5th ed.; Charles Griffin and Company Ltd.: London, UK, 1975; 202p. [Google Scholar] [CrossRef]
  26. Hussain, M.; Mahmud, I. pyMannKendall: A python package for non parametric Mann Kendall family of trend tests. J. Open Source Softw. 2019, 4, 1556. [Google Scholar] [CrossRef]
  27. Sen, P.K. Estimates of the Regression Coefficient Based on Kendall’s Tau. J. Am. Stat. Assoc. 1968, 63, 1379. [Google Scholar] [CrossRef]
  28. Gorelick, N.; Hancher, M.; Dixon, M.; Ilyushchenko, S.; Thau, D.; Moore, R. Google Earth Engine: Planetary-scale geospatial analysis for everyone. Remote Sens. Environ. 2017, 202, 18–27. [Google Scholar] [CrossRef]
  29. Idso, S.B.; Jackson, R.D.; Pinter, P.J., Jr.; Reginato, R.J.; Hatfield, J.L. Normalizing the stress-degree-day parameter for environmental variability. Agric. Meteorol. 1981, 24, 45–55. [Google Scholar] [CrossRef]
  30. Jackson, R.D.; Idso, S.B.; Reginato, R.J.; Pinter, P.J., Jr. Canopy temperature as a crop water stress indicator. Water Resour. Res. 1981, 17, 1133–1138. [Google Scholar] [CrossRef]
  31. Marieme, S.-E.; Bouchaou, L.; Brouziyne, Y.; Chikhaoui, M.; Choukr-Allah, R. Towards more sustainable and climate-smart water and agricultural systems: Study case of the Souss Massa Basin in Morocco. Front. Sci. Eng. 2021, 11. [Google Scholar] [CrossRef]
  32. Netherlands Agricultural Office in Morocco. Investment Opportunities in the Moroccan Dairy Sector; Embassy of the Kingdom of the Netherlands: Rabat, Morocco, 2021.
  33. Marieme, S.E.; Abdelaziz, H.; El Morjani, Z.E.A.; Redouane, C.A.; Rashyd, Z.; Abdessadek, N.; Mouna, M.; Lhoussaine, B.; Elhassane, B. Assessment of Global Change Impacts on Groundwater Resources in Souss-Massa Basin. In Springer Water; Springer Nature: Berlin/Heidelberg, Germany, 2017; pp. 115–140. [Google Scholar] [CrossRef]
  34. Hirich, A.; Choukr-Allah, R.; Nrhira, A.; Malki, M.; Bouchaou, L. Contribution of seawater desalination to cope with water scarcity in Souss-Massa region in southern Morocco. In The Handbook of Environmental Chemistry; Springer: Cham, Switzerland, 2017; Volume 53, pp. 213–226. [Google Scholar] [CrossRef]
  35. Bouchaou, L.; Tagma, T.; Boutaleb, S.; Hssaisoune, M.; El Morjani, Z.E.A. Climate change and its impacts on groundwater resources in Morocco: The case of the Souss-Massa basin. In Climate Change Effects on Groundwater Resources: A Global Synthesis of Findings and Recommendations; CRC Press: Boca Raton, FL, USA, 2011; pp. 129–144. [Google Scholar] [CrossRef]
  36. Sadok, W.; Jagadish, S.V.K. The hidden costs of nighttime warming on yields. Trends Plant Sci. 2020, 25, 644–651. [Google Scholar] [CrossRef]
  37. Hatfield, J.L.; Prueger, J.H. Temperature extremes: Effect on plant growth and development. Weather Clim. Extrem. 2015, 10, 4–10. [Google Scholar] [CrossRef]
  38. Choukr-Allah, R.; Ragab, R.; Bouchaou, L. The Souss-Massa River Basin, Morocco; Springer: Berlin/Heidelberg, Germany, 2017. [Google Scholar] [CrossRef]
  39. Balaghi, R.; Jlibene, M.; Tychon, B.; Eerens, H. Agrometeorological Cereal Yield Forecasting in Morocco; Institut National de la Recherche: Rabat, Morocco, 2013.
  40. Houdret, A. The water connection: Irrigation, water grabbing and politics in southern Morocco. Water Altern. 2012, 5, 284–303. [Google Scholar]
  41. Loulitit, M. COPAG development action. Homme Terre Eau Rev. 2008, 139, 5. [Google Scholar]
  42. MEMEE. Water Resources in Souss-Massa; Ministry of Energy, Mines, Water and Environment: Rabat, Morocco, 2015.
  43. Ministry of Agriculture, Maritime Fisheries, Rural Development, and Water and Forests. Red Meat Sector. Available online: https://www.agriculture.gov.ma/en/program/viande-rouge (accessed on 10 May 2026).
  44. Elmouden, A.; Alahiane, N.; El Faskaoui, M.; El Morjani, Z.E.A. Dams siltation and soil erosion in the Souss–Massa river basin. In The Souss-Massa River Basin, Morocco; Springer: Berlin/Heidelberg, Germany, 2017; pp. 95–120. [Google Scholar] [CrossRef]
  45. Raji, A.E.; El Hadani, D.; Sefiani, S.; El Faskaoui, M.; Bouguenouch, B. Geospatial Data for Assessing the Impact of Groundwater use on Territorial Dynamics in the Souss-Massa Hydraulic Basin. 2010. Available online: https://crts.gov.ma/files/geoobs16.pdf (accessed on 10 May 2026).
  46. Malki, M.; Bouchaou, L.; Mansir, I.; Benlouali, H.; Nghira, A.; Choukr-Allah, R. Wastewater treatment and reuse for irrigation as alternative resource for water safeguarding in Souss-Massa region, Morocco. Eur. Water 2017, 59, 365–371. [Google Scholar]
  47. Elame, F.; Doukkali, R. Water valuation in agriculture in the Souss-Massa Basin (Morocco). In Integrated Water Resources Management in the Mediterranean Region: Dialogue Towards New Strategy; Springer: Berlin/Heidelberg, Germany, 2012; pp. 109–122. [Google Scholar] [CrossRef]
  48. Seif-Ennasr, M.; Zaaboul, R.; Hirich, A.; Caroletti, G.N.; Bouchaou, L.; El Morjani, Z.E.A.; Beraaouz, E.H.; McDonnell, R.A.; Choukr-Allah, R. Climate change and adaptive water management measures in Chtouka Aït Baha region (Morocco). Sci. Total Environ. 2016, 573, 862–875. [Google Scholar] [CrossRef]
  49. El Mahdad, E.; Ouhajou, L.; El Fasskaoui, M.; Aslikh, A.; Nghira, A.; Fdil, F.; Baroud, A.; Barceló, D. Experiences, success stories, and lessons learnt from the implementation of the water law framework directive in the Souss-Massa River Basin. In The Souss-Massa River Basin, Morocco; Springer: Berlin/Heidelberg, Germany, 2017; pp. 303–333. [Google Scholar] [CrossRef]
  50. Famiglietti, J.S. The global groundwater crisis. Nat. Clim. Chang. 2014, 4, 945–948. [Google Scholar] [CrossRef]
  51. Scanlon, B.R.; Faunt, C.C.; Longuevergne, L.; Reedy, R.C.; Alley, W.M.; McGuire, V.L.; McMahon, P.B. Groundwater depletion and sustainability of irrigation in the US High Plains and Central Valley. Proc. Natl. Acad. Sci. USA 2012, 109, 9320–9325. [Google Scholar] [CrossRef]
  52. Custodio Gimena, E.; Andreu Rodes, J.M.; Aragón Rueda, R.; Estrela, T.; Ferrer, J.; García Aróstegui, J.L.; Manzano Arellano, M.; Rodríguez Hernández, L.; Sahuquillo, A.; Villar, A.d. Groundwater intensive use and mining in south-eastern peninsular Spain: Hydrogeological, economic and social aspects. Sci. Total Environ. 2016, 559, 302–316. [Google Scholar] [CrossRef]
  53. Grafton, R.Q.; Williams, J.; Perry, C.J.; Molle, F.; Ringler, C.; Steduto, P.; Udall, B.; Wheeler, S.A.; Wang, Y.; Garrick, D. The paradox of irrigation efficiency. Science 2018, 361, 748–750. [Google Scholar] [CrossRef]
  54. Aeschbach-Hertig, W.; Gleeson, T. Regional strategies for the accelerating global problem of groundwater depletion. Nat. Geosci. 2012, 5, 853–861. [Google Scholar] [CrossRef]
  55. Molle, F.; Closas, A. Comanagement of groundwater: A review. Wiley Interdiscip. Rev. Water 2020, 7, e1394. [Google Scholar] [CrossRef]
  56. Payero, J.O.; Tarkalson, D.D.; Irmak, S.; Davison, D.; Petersen, J.L. Effect of timing of a deficit-irrigation allocation on corn evapotranspiration, yield, water use efficiency and dry mass. Agric. Water Manag. 2009, 96, 1387–1397. [Google Scholar] [CrossRef]
  57. Jones, E.; Qadir, M.; Van Vliet, M.T.H.; Smakhtin, V.; Kang, S. The state of desalination and brine production: A global outlook. Sci. Total Environ. 2019, 657, 1343–1356. [Google Scholar] [CrossRef]
  58. Qadir, M.; Wichelns, D.; Raschid-Sally, L.; McCornick, P.G.; Drechsel, P.; Bahri, A.; Minhas, P.S. The challenges of wastewater irrigation in developing countries. Agric. Water Manag. 2010, 97, 561–568. [Google Scholar] [CrossRef]
Figure 1. Geographical Location of the Souss-Massa Watershed.
Hydrology 13 00132 g001
Figure 2. Methodological framework for assessing the spatio-temporal responses of agricultural systems to climatic and hydrological variability in the Souss-Massa Basin.
Hydrology 13 00132 g002
Figure 3. Temporal evolution of annual precipitation at five hydrological stations in the Souss-Massa watershed: Agadir (a), Ouijjane (b), Aoulouz (c), Tamri (d), and Taroudant (e).
Hydrology 13 00132 g003
Figure 4. Temporal evolution of maximum, minimum, and mean temperatures at five stations in the Souss-Massa watershed: Agadir (a), Ouijjane (b), Aoulouz (c), Tamri (d), and Taroudant (e).
Hydrology 13 00132 g004
Figure 5. Evolution of the area (a) and production (b) of irrigated cereals (soft wheat, durum wheat, barley, and maize) during the period from 1995 to 2021.
Hydrology 13 00132 g005aHydrology 13 00132 g005b
Figure 6. Correlation analysis of irrigated cereal areas (soft wheat, durum wheat, barley, and grain maize).
Hydrology 13 00132 g006
Figure 7. Evolution of the area (a) and production (b) of rainfed cereals (barley, durum wheat, and soft wheat) during the period 1995/2021.
Hydrology 13 00132 g007aHydrology 13 00132 g007b
Figure 8. Correlational Analysis between Rainfed Areas and Cereal Productions (Soft Wheat, Durum Wheat, and Barley).
Hydrology 13 00132 g008
Figure 9. Evolution of the Area (a) and Production (b) of Forage Crops (alfalfa, berseem/Maize, and others) during the 1995–2021 Period.
Hydrology 13 00132 g009aHydrology 13 00132 g009b
Figure 10. Correlational Analysis between Area and Production (Alfalfa, Berseem/Maize, and Other Forage Crops).
Hydrology 13 00132 g010
Figure 11. Spatiotemporal evolution of Land Use and Land Cover (LULC) in the Souss-Massa watershed for the years 1995 (a), 2005 (b), 2010 (c), 2015 (d), and 2020 (e).
Hydrology 13 00132 g011
Figure 12. Overlay of LULC change dynamics onto satellite imagery illustrating spatial transitions between land cover classes.
Hydrology 13 00132 g012
Figure 13. Synthetic representation of major landscape transformations observed between reference years (1995–2020).
Hydrology 13 00132 g013
Figure 14. Visualization of net transitions between Land Use and Land Cover (LULC) classes from 1995 to 2020.
Hydrology 13 00132 g014
Figure 15. Land Use and Land Cover (LULC) transition matrix in the Souss-Massa basin (1995–2020).
Hydrology 13 00132 g015
Figure 16. Interannual evolution of the hydrogeological mass balance (inflows, outflows, and net balance) of the Souss, Tiznit, and Chtouka aquifer systems over the 1995–2021 period.
Hydrology 13 00132 g016aHydrology 13 00132 g016b
Figure 17. Spatial distribution of the Crop Water Stress Index (CWSI) in the Souss basin for the years 1995, 2005, 2010, 2015, and 2020.
Hydrology 13 00132 g017
Figure 18. Interannual temporal evolution of the mean Crop Water Stress Index (CWSI) in the Souss basin from 1995 to 2020.
Hydrology 13 00132 g018
Figure 19. Statistical distribution and interannual variations in the CWSI across the Souss basin (1995–2020).
Hydrology 13 00132 g019
Figure 20. Periodic variation rates and long-term trend of the Crop Water Stress Index over the 1995–2020 period.
Hydrology 13 00132 g020
Table 1. Geographic characteristics of the meteorological stations.
StationLatitude (°N)Longitude (°W)Altitude (m)Climate Influence
Agadir30.42−9.6018Coastal/Atlantic influence
Ouijjane29.73−9.36520Semi-arid inland
Aoulouz30.68−8.18800Mountain/continental
Tamri30.7−9.8215Coastal Atlantic
Taroudant30.47−8.88230Inland semi-arid
Table 2. Mann–Kendall (MK) trend analysis and Sen’s slope estimator for annual precipitation and mean temperature (1995–2021).
StationVariableSen’s SlopeZ-Valuep-ValueSignificance
AgadirPrecipitation (mm)−2.64 mm/year−0.940.35Not significant
Temperature (°C)+0.024 °C/year1.710.087Not significant at α = 0.05
OuijjanePrecipitation (mm)−1.15 mm/year−0.420.68Not significant
Temperature (°C)+0.116 °C/year4.82<0.001Highly significant
AoulouzPrecipitation (mm)−2.43 mm/year−1.360.17Not significant
Temperature (°C)+0.032 °C/year2.210.027Significant
TamriPrecipitation (mm)−1.11 mm/year−0.730.47Not significant
Temperature (°C)+0.041 °C/year2.480.013Significant
TaroudantPrecipitation (mm)−2.40 mm/year−0.850.39Not significant
Temperature (°C)+0.030 °C/year2.020.043Significant
Table 3. Trends in mathematical models and weighting coefficients for irrigated cereals (soft wheat, durum wheat, barley, and grain maize) for area and production. R2: Weighting coefficient.
AreasProduction
TypeModelR2ModelR2
Soft wheaty = −335.38x + 131810.67y = −861.52x + 353260.4
Durum wheaty = −188.31x + 7052.60.61y = −254.2x + 9699.30.34
Grain corny = −114.63x + 2712.60.61y = −304.64x + 7490.40.54
Barleyy = −127.9x + 5857.10.33y = −254.2x + 5857.10.34
Table 4. Average cultivated area, production, and yield of major irrigated cereal crops in the Souss-Massa basin during the study period (1995–2021).
TypeAverage ProductionAverage Cultivated AreaAverage YieldGeneral Trend
Soft wheat22,858 t8577 ha2.67 t/haProgressive decline with marked interannual variability
Durum wheat10,436 t4762 ha2.19 t/haFluctuating production and decreasing cultivated area
Grain corn6200 t4051 ha1.53 t/haOverall decline associated with water scarcity
Barley3326 t949 ha3.50 t/haStrong decline and near disappearance after 2010
Table 5. Trends in mathematical models and coefficients of determination (R2) for rainfed cereals (soft wheat, barley, and durum wheat) in terms of cultivated area and production.
AreasProduction
TypeModelR2ModelR2
Soft wheaty = −335.38x + 13,1810.67y = −1999.4x + 51,6080.14
Barleyy = −188.31x + 7052.60.61y = −1011.3x + 23,9580.13
Durum wheaty = −127.9x + 5857.10.33y = −115.86x + 4082.90.05
Table 6. Average cultivated area, production, and yield of major rain-fed cereal crops (“bour” agriculture) in the Souss-Massa basin during the study period (1995–2021).
TypeAverage ProductionAverage Cultivated AreaAverage YieldGeneral Trend
Soft wheat25,239 t33,009 ha0.76 t/haStrong interannual variability and overall decline
Barley2089 t5521 ha0.38 t/haDeclining production with unstable yields
Durum wheat10,747 t21,730 ha0.49 t/haMarked fluctuations linked to rainfall variability
Table 7. Trends of Mathematical Models and Weighting Coefficients for Forage Crops (alfalfa, berseem/maize, and others) in Terms of Area and Production. R2: Weitling Coefficient.
AreasProduction
TypeModelR2ModelR2
Alfalfay = −92.40x + 10,224.520.67y = −10,652.31x + 680,989.740.71
Berseem/Maizey = +744.13x − 2413.860.89y = +37,139.27x − 138,745.630.91
Othersy = −23.92x + 703.810.16y = −1519.8x + 42,0650.16
Table 8. Average cultivated area, production, and yield of major forage crops in the Souss-Massa basin during the study period (1995–2021).
Crop CategoryAverage ProductionAverage Cultivated AreaAverage YieldGeneral Trend
Alfalfa531,358 t8929 ha59.5 t/haDecreasing cultivated area and fluctuating productivity
Berseem/Maize438,267 t8819 ha49.7 t/haStrong increase in cultivated area and production
Others21,110 t409 ha53.1 t/haVariable evolution
Table 9. Accuracy assessment metrics for the 2020 LULC classification.
Accuracy MetricValue
Overall Accuracy97.10%
Kappa Coefficient0.963
Producer Accuracy81.8–100%
User Accuracy91.7–100%
Table 10. Diachronic changes in Land Use/Land Cover (LULC) dynamics within the Souss-Massa region between 1995 and 2020.
Classes19952005201020152020
Forest635.66507.70405.77457.59357.48
Shrubland10,787.0411,037.9411,077.1711,191.3811,356.84
Grassland12,540.3112,607.3012,366.2212,301.7812,984.00
Cropland4825.654662.484895.574817.374109.84
Built-up92.96354.17379.20388.93380.77
Bare Soil2934.182651.952690.362662.762639.80
Water65.9760.2267.4661.9653.03
Table 11. Stability, losses, gains, net change, and percentage change for each Land Use and Land Cover (LULC) class in the Souss-Massa watershed between 1995 and 2020.
ForestShrublandGrasslandCroplandBuilt-UpBare SoilWater
Stable (km2)247.0610,290.5911,622.873031.6159.062519.9246.04
Loss (km2)388.60496.45917.441794.0433.90414.2619.92
Gain (km2)110.421066.251361.131078.24321.72119.886.99
Net Change 1995–2020 (km2)−278.18569.80443.69−715.81287.81−294.38−12.94
Percentage Change (%)−43.765.283.54−14.83309.60−10.03−19.62
Disclaimer/Publisher’s Note: The statements, opinions and data contained in all publications are solely those of the individual author(s) and contributor(s) and not of MDPI and/or the editor(s). MDPI and/or the editor(s) disclaim responsibility for any injury to people or property resulting from any ideas, methods, instructions or products referred to in the content.