


Abstract
The middle and lower reaches of the Yangtze River Basin occupy a strategically pivotal position in regional development; yet extreme drought-runoff events pose severe threats to water supply and ecological security. Despite this, systematic research gaps persist, including the lack of a unified definition, standardized identification criteria, and clear understanding of formation mechanisms for extreme drought-runoff. To address these limitations, this study focused on extreme drought-runoff in the basin, utilizing 1956–2024 discharge data from four mainstream hydrological stations and meteorological data from 171 stations. Quantitative discrimination criteria were established via Pearson-III frequency analysis; meteorological characteristics were analyzed using the Meteorological Drought Comprehensive Index; and formation mechanisms were explored through partial correlation analysis and multiple linear regression. This study innovatively proposed a basin-wide three-level quantitative discrimination criterion for drought-runoff based on the June–November flow frequency of key mainstream stations, which is distinguished from single-indicator drought identification methods (SPI/SPEI/SSI) by integrating basin-scale hydrological coherence and seasonal drought characteristics. The results revealed basin-wide extreme drought-runoff in 2006 and 2022, severe drought-runoff in 1972 and 2011, and relatively severe drought-runoff in 1959, 1992, and 2024. Typical extreme drought-runoff events were characterized by sustained low precipitation and high temperatures. Meteorological factors emerged as the primary driver during June–September, while reservoir operation and riverine water intake played secondary roles. Notably, the large-scale reservoir group in the Yangtze River Basin (53 key control reservoirs) helped alleviate drought-runoff impacts from December to May (non-flood season) via water supplementation. These findings provide a robust scientific basis for precise drought-runoff prediction and the development of targeted adaptation strategies in the Yangtze River Basin.
1. Introduction
The middle and lower reaches of the Yangtze River Basin serve as a core area for advancing the development of the Yangtze River Economic Belt, boosting the rise of central China, and consolidating the “two horizontal and three vertical” urbanization strategic pattern, thus holding a pivotal strategic position. In 2022, the Yangtze River Basin suffered a basin-wide severe drought-runoff disaster, with the July–October precipitation being the lowest in the 1961–2024 period (30–90% below the multi-year normal) and the average flow of key stations (Yichang/Hankou/Datong) from June to November exceeding the 98% frequency threshold of the 1956–2024 long-term series. This posed a serious threat to the water supply security and ecological security of the mainstream in the middle and lower reaches of the Yangtze River Basin, especially in the Dongting Lake, Poyang Lake and Yangtze River Estuary, resulting in a 40% reduction in the water area of the Dongting and Poyang Lakes, a 20% decline in agricultural irrigation water supply in the middle reaches, and a disruption of migratory routes for aquatic organisms in the estuary [1,2]. However, due to the low frequency of similar extreme drought-runoff events in history, there are obvious deficiencies in relevant systematic research [3,4]. Currently, there is still no clear and unified definition of extreme drought-runoff, and the accuracy of drought-runoff event identification needs to be improved—for example, previous studies using the Standardized Streamflow Index (SSI) alone misclassified the 2011 mild drought-runoff as extreme drought due to the neglect of basin-wide hydrological coherence and seasonal runoff characteristics [5,6]. This situation makes it difficult to accurately grasp the evolution law and formation mechanism of extreme drought-runoff, bringing great challenges to the scientific response to such events [7,8].
In previous research, many scholars have proposed various meteorological and hydrological indicators from different perspectives for the identification of drought events [9,10,11]. Among the existing drought identification methods, most studies focus on selecting single or multiple meteorological and hydrological indicators to describe the meteorological or hydrological process of drought events [12,13,14]. However, drought does not necessarily lead to drought-runoff. Drought focuses more on the meteorological aspect, while drought-runoff pays more attention to the hydrological aspect. Thus, drought identification indicators are not necessarily applicable to drought-runoff identification [15,16]. The conceptual distinction between drought and drought-runoff is operationalized in Section 3.1 through the explicit definition of drought-runoff and the establishment of hydrological frequency-based discrimination criteria for basin-wide events. Moreover, relying solely on a single indicator or a simple superposition of multiple indicators cannot fully and accurately depict the overall picture of drought-runoff events, making it difficult to clearly define the occurrence period of drought-runoff, deeply analyze its formation mechanism, and fully evaluate its multi-faceted impacts [17,18]. Therefore, it is urgent to further explore comprehensive identification methods for the drought-runoff events [19].
At present, the comprehensive identification methods for drought-runoff events mainly rely on statistical methods, considering different types of indicators and realizing the coupling construction by exploring the internal connections between these indicators [20,21]. A multi-indicator coupling approach is necessary for drought-runoff identification because drought-runoff is a complex hydrological response to meteorological drought, which is jointly regulated by catchment hydrological storage, runoff routing, and human activities—single indicators can only capture one aspect of this process (e.g., SPI for precipitation anomalies alone and SSI for runoff deficits alone). For example, the Meteorological Drought Comprehensive Index (MCI) proposed in China National Standard “Meteorological Drought Grade” (GB/T 20481-2017) is a comprehensive index constructed by integrating multi-dimensional indicators such as 60-day precipitation, seasonal precipitation, semi-annual precipitation, and 30-day evapotranspiration [22,23].
Currently, the academic community has carried out extensive research on the construction, optimization, verification, and application of drought identification indicators. Researchers have focused on different hydrological elements and application scenarios, promoting the evolution of indicators from a single type to generalization and precision [24,25]. Runoff-related indicators are the classic core of drought identification, among which the Standardized Streamflow Index (SSI) has been widely applied due to its easy accessibility of data [10,26,27]. Tijdeman (2020) clarified the impact of different calculation methods on the identification of drought characteristics by SSI through the comparison of seven probability distributions and two fitting methods, providing a key basis for the rational application of the index [10]. To address the adaptability issue across different river types, Cammalleri (2024) proposed a unified streamflow drought index, which breaks through the limitation that traditional indicators are only applicable to specific river types through a threshold method, realizing the unified identification of drought at a global scale for both perennial and intermittent rivers [13]. In addition to runoff indicators, the application of indicators related to precipitation, soil moisture, and other elements has been continuously deepened [28,29]. In a study conducted in the Tensift River Basin, Naim et al. (2025) compared and analyzed the performance of the Standardized Precipitation Index (SPI) and the Standardized Precipitation Evapotranspiration Index (SPEI), clarifying the adaptability of different indicators in regional drought identification and the optimal probability distribution model [25]. Mohammadia et al. (2025) constructed a flash drought identification framework based on the Soil Water Deficit Index (SWDI), achieving early warning of drought events with significant agricultural impacts by capturing the rapid reduction process of plant-available water [29]. Furthermore, the general framework for non-parametric standardized drought identification indicators constructed by Farahmand et al. (2015) has further enhanced the generality and reliability of indicator application under different regional and data conditions [9].
In terms of research on the causes of extreme drought-runoff events, existing studies have shown that the climatic factors leading to the increased frequency of extreme drought-runoff events are mainly related to the increase in high-temperature and low-precipitation events, while human activity factors include reservoir regulation and storage, water intake and use along the river, and other aspects [3,30]. The climate of the Yangtze River Basin is significantly affected by monsoons [8,16,31]. The basin exhibits distinct finer-scale climatic gradients: the upper reaches are dominated by alpine and subalpine climates with low annual precipitation and large diurnal temperature differences, while the middle and lower reaches are typical humid subtropical monsoon climates with concentrated summer precipitation and high annual average temperatures—this spatial climatic difference leads to heterogeneous regional hydrological responses to basin-wide drought-runoff. In summer, when the main rain belt in eastern China moves northward to North China, the basin is controlled by the Western Pacific Subtropical High, making high-temperature and low-precipitation weather prone to occur [17,32]. Against the background of global warming, the temporal and spatial distribution characteristics of extreme high-temperature and low-precipitation events in the Yangtze River Basin have undergone significant changes [33,34]. From 1961 to 2010, the number, duration, and intensity of heatwave events in the Yangtze River Basin generally showed a trend of first decreasing and then increasing [35]. Since the 21st century, the number, intensity, and duration of heatwave events in regions such as the middle and the southeast of the Yangtze River have shown an upward trend [36]. The increase in high-temperature and low-precipitation events is the main cause of frequent drought-runoff events in the Yangtze River Basin [33,37]. The 2022 extreme drought-runoff event is a typical compound climate extreme event characterized by the co-occurrence of extreme high temperature, extreme low precipitation, and their prolonged duration, which amplifies the hydrological response of the basin compared with single meteorological extreme events and is consistent with the compound extremes literature.
Based on the above research background, this study takes the extreme drought-runoff event in the Yangtze River Basin as the research object and focuses on exploring the identification method, analyzing the meteorological and hydrological characteristics and revealing the formation mechanism of the extreme drought-runoff event. The research methodology is explicitly mapped to the research aims: (1) Pearson-III frequency analysis (Section 3.1) for establishing basin-wide quantitative discrimination criteria to realize accurate identification of drought-runoff events; (2) MCI analysis (Section 3.2) for characterizing the meteorological drivers and spatiotemporal evolution of typical extreme drought-runoff events; (3) partial correlation analysis and multiple linear regression (Section 3.3) for quantifying the contribution of different factors to drought-runoff and revealing its formation mechanism. The “basic law” in this study refers to the inherent evolution rules of drought-runoff in the Yangtze River Basin (e.g., the seasonal variation of driving factors or the hydrological response to compound meteorological extremes), which provides a theoretical basis for improving the precision of drought-runoff prediction models. Throughout this study, the aim is to provide basic law support for the development of high precision drought-runoff prediction.
2. Study Area and Data
2.1. Study Area
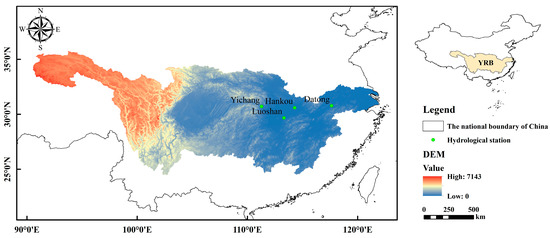
The Yangtze River Basin spans a wide geographical area, starting from the southwest side of Geladandong Peak in the Tanggula Mountains of the Qinghai-Tibet Plateau in the west, extending to the East China Sea in the east, with a total area of approximately 1.8 million square kilometers (Figure 1) [38]. In terms of geographical characteristics, the terrain of the Yangtze River Basin is complex and diverse, generally showing a topographic feature of high in the west and low in the east [31]. The upper reaches are dominated by plateaus and mountains, with large terrain drops and dense canyons, and abundant hydropower resources. The middle reaches are dominated by plain and hilly landforms, featuring winding rivers and scattered lakes. The lower reaches are the vast Yangtze River Delta Plain, with low and flat terrain and crisscross river networks [39,40]. In terms of climatic characteristics, most areas of the Yangtze River Basin belong to the subtropical monsoon climate, with a warm and humid climate. The annual precipitation is relatively abundant, and the precipitation is mainly concentrated in summer, showing a gradual decrease from southeast to northwest. The annual average temperature is relatively high, with four distinct seasons and a long frost-free period [24].
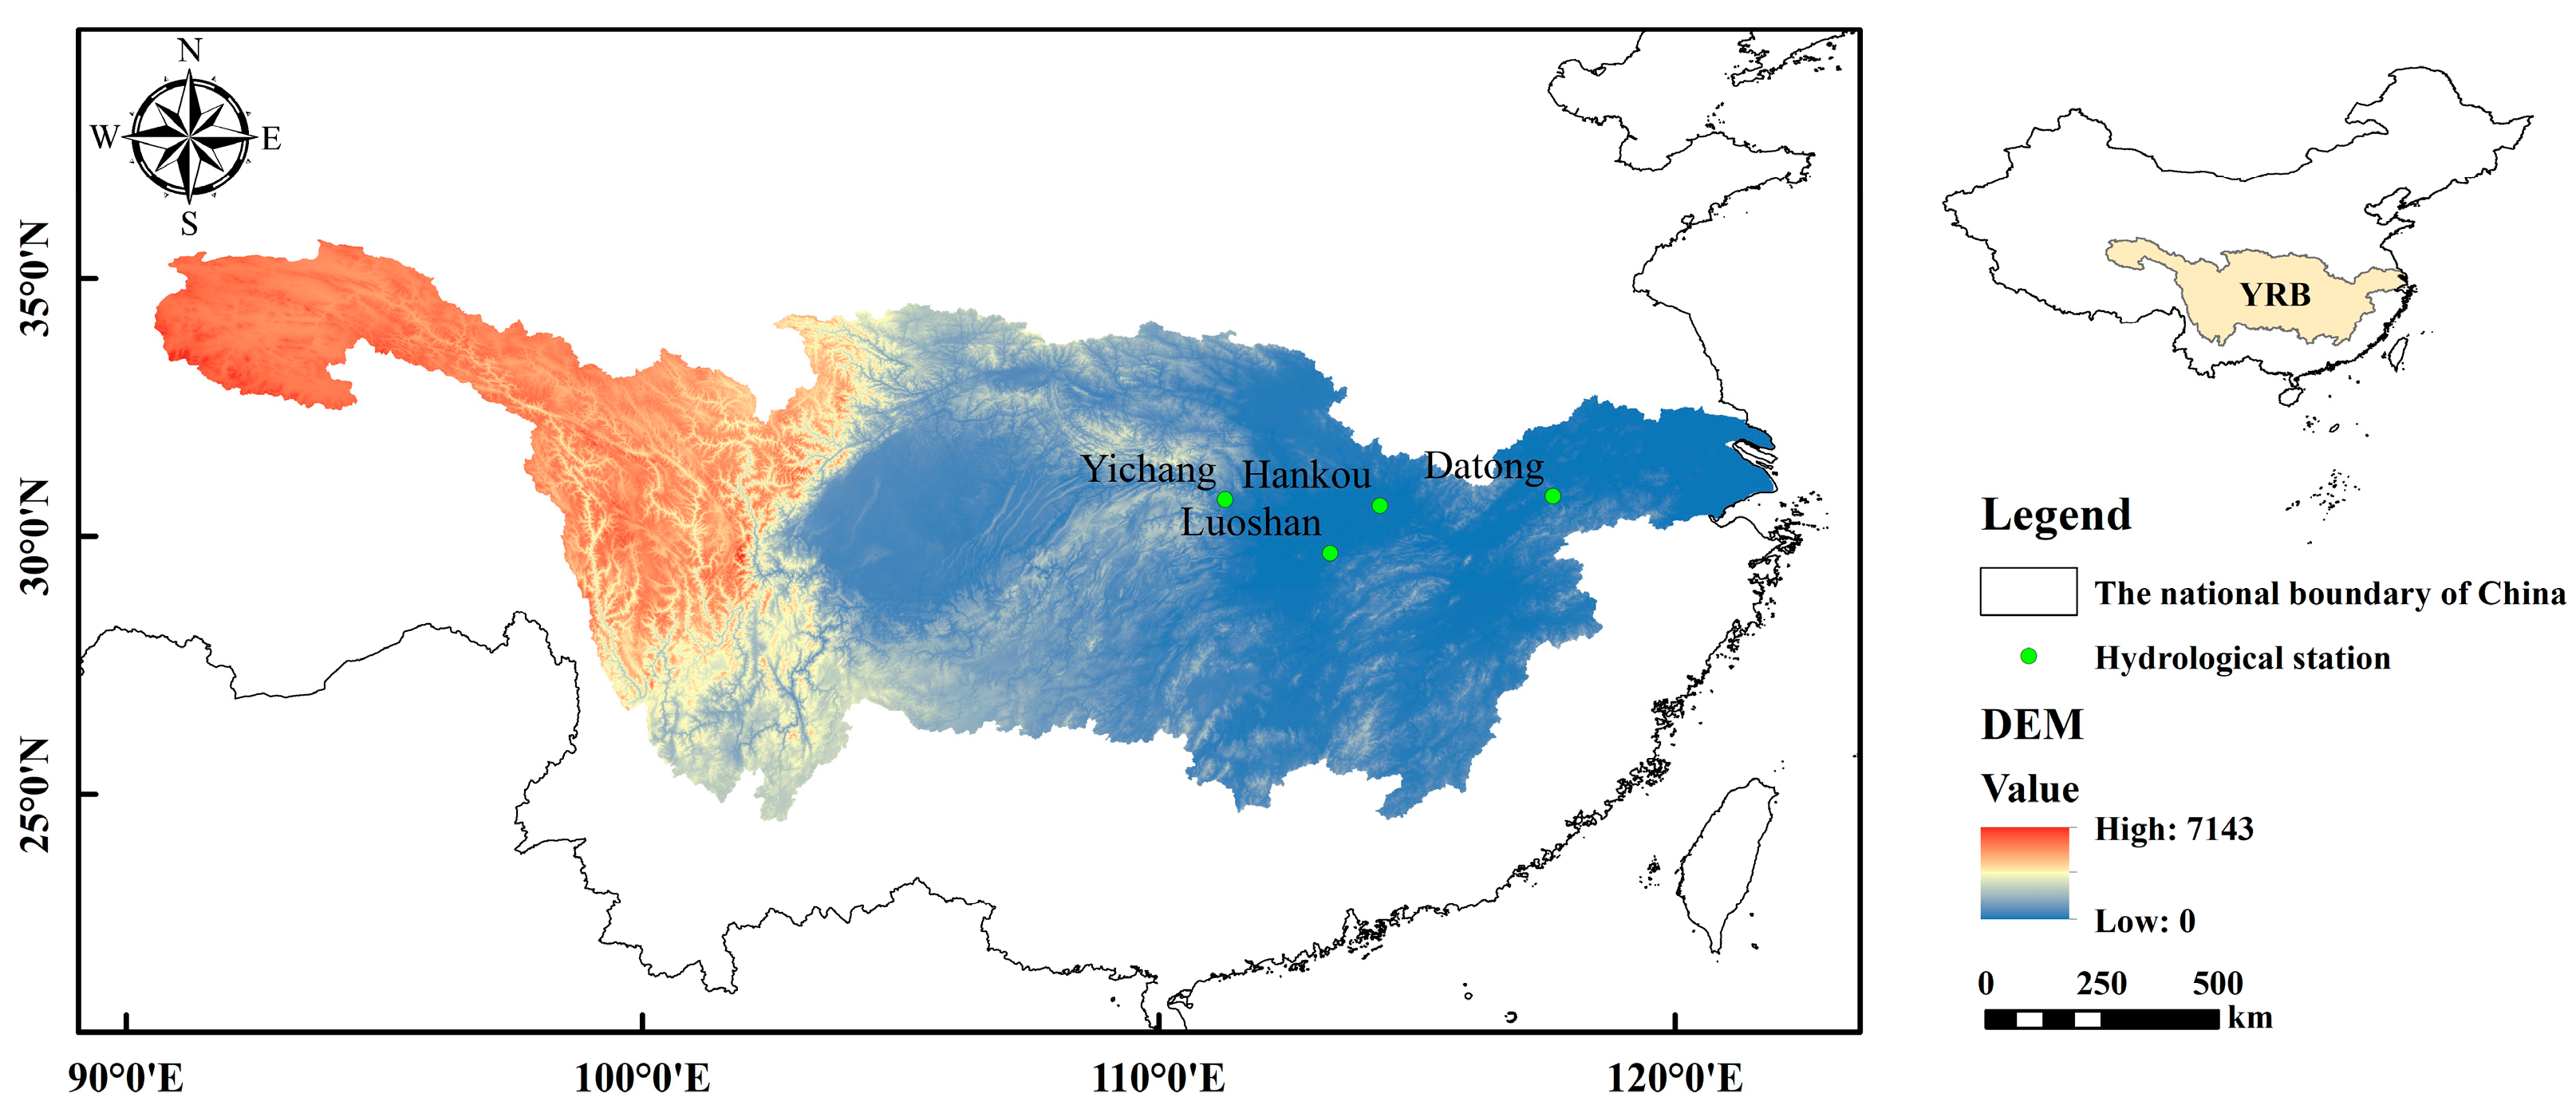
Figure 1.
The location and the topography of the Yangtze River basin (YRB) and the location of representative hydrological stations.
2.2. Study Data
The data used in this study mainly include the discharge data of hydrological stations and the precipitation and temperature data of meteorological stations within the Yangtze River Basin. All the hydrological data were obtained from the China Hydrological Yearbook and the Changjiang Water Resources Commission (CWRC) Hydrological Database; meteorological data were collected from the Meteorological Data Sharing Service Network of the China Meteorological Administration (https://data.cma.cn/ (accessed on 25 March 2026)). Among them, the discharge data are applied to the establishment of quantitative discrimination criteria for drought-runoff events and the analysis of the formation mechanism of typical drought-runoff events. In this study, four representative hydrological stations on the mainstream of the Yangtze River were selected, which were Yichang Station, Luoshan Station, Hankou Station and Datong Station from upstream to downstream in sequence. Only mainstream stations were selected because the mainstream runoff is the comprehensive hydrological reflection of the entire basin, and the study focuses on basin-wide drought-runoff events; tributary droughts (e.g., Han River) are local hydrological processes that do not affect the overall judgment of basin-wide drought-runoff, and their hydrological impacts are already integrated into the mainstream runoff of key control stations. Specifically, Yichang Station serves as the outlet control station of the upper Yangtze River; Luoshan Station and Hankou Station are representative hydrological stations in the middle reaches of the Yangtze River; and Datong Station is the last runoff control station on the mainstream of the lower Yangtze River. The discharge data series adopted cover the period from 1956 to 2024.
A strict quality control process was applied to all the data: (1) Outlier detection using the 3σ method, with abnormal values verified and corrected via historical station records; (2) Gap-filling: linear interpolation for short data gaps (<3 months), and multiple linear regression fitting with adjacent homogeneous stations for long gaps (>3 months); (3) Homogeneity test: the Pettitt test and Buishand U-test were used to test the homogeneity of the 68-year discharge records; a significant breakpoint was detected at Yichang Station in 2003 (commissioning of the Three Gorges Dam), and the discharge data after 2003 were adjusted using a hydrological calibration model to maintain consistency with the pre-2003 series. Precipitation and temperature data from 171 meteorological stations in the Yangtze River Basin were collected to analyze the meteorological characteristics of typical drought-runoff years, with the data series corresponding to the respective typical years. The meteorological data underwent the same quality control procedures (outlier detection, gap-filling, homogeneity test) as the hydrological data, and all the data passed consistency and reliability tests. All the above-mentioned data have undergone quality inspection and have been widely applied in relevant studies [16,21,41].
3. Research Methods
3.1. Extreme Drought-Runoff Discrimination Method
Drought-runoff is a hydrological event characterized by a sustained deficit of mainstream runoff (duration ≥4 consecutive months) in the Yangtze River Basin, with the flow frequency exceeding the threshold of the 1956–2024 long-term series, caused by meteorological drought and/or human hydrological activities (reservoir operation, water intake). In this study, based on the content related to drought-runoff discrimination in the current standards and specifications (GB/T 20481-2017, GB 50201-2014), combined with the unique hydrological characteristics of the Yangtze River Basin, the drought-runoff discrimination criteria applicable to the basin were determined [3,4,36]. The June–November focus is based on the summer–autumn concentrated precipitation and the highest frequency of drought-runoff events in the basin, which limits the applicability of the established criteria to spring drought-runoff (January–May); spring drought-runoff identification will be the focus of subsequent research.
On this basis, by selecting representative hydrological stations and using long-series hydrological observation data to conduct frequency analysis, the quantitative indicators for drought-runoff discrimination in the Yangtze River Basin were clarified. Then, the historical extreme drought-runoff events in the Yangtze River Basin were identified according to these quantitative indicators. The theoretical frequency curve adopted the Pearson-III type, which is widely used in hydrological frequency analysis due to it easily adapting to the hydrological data characteristics of the Yangtze River Basin—other probability distributions (e.g., Gumbel, log-normal, Weibull) were tested, but the Pearson-III type showed the best fitting effect with the highest Kolmogorov-Smirnov (K-S) test statistic and the lowest root mean square error (RMSE) for all the stations and periods [12,34]. The mean value and Cv of the flow series were calculated by the moment method as initial estimates, and determined by adjusting with the curve-fitting method. The Kolmogorov-Smirnov (K-S) test was used as the goodness-of-fit metric to validate the Pearson-III fit, and the fit passed the significance test (p < 0.05) for all the stations and time periods, which is a mature technical approach in hydrological statistical analysis [12,20].
3.2. Meteorological Drought Composite Index
The Meteorological Drought Comprehensive Index (MCI) was employed to identify the characteristics of meteorological drought in typical drought-runoff years. MCI addresses the limitations of the traditional Meteorological Drought Index (CI), which tends to underestimate drought severity and exhibits temporal discontinuity when describing meteorological drought [18,22]. It can more accurately reflect the characteristic and variation trend of meteorological drought, thus demonstrating better adaptability in drought assessment within the Yangtze River Basin [23]. Furthermore, since 2016, the MCI has been widely applied in the drought-monitoring operations of China’s national and provincial meteorological departments [22,28]. Results indicate that it can effectively capture the evolutionary process of drought and has played a crucial role in national drought-monitoring operations, particularly showing excellent performance in identifying the drought events that occurred in the Yangtze River Basin in 2022 [1,21]. In this study, the Meteorological Drought Comprehensive Index (MCI) was calculated using daily meteorological data consistent with the drought-runoff period of typical years (2006: 8 June–24 November; 2022: 6 July–29 December).
3.3. Drought-Runoff Cause Analysis Method
Analysis time frame: (1) Partial correlation analysis: monthly scale from January 1956 to December 2024 for all large-scale meteorological factors; (2) Multi-factor attribution analysis: seasonal scale (June–September, October–November, December–May) for the typical extreme drought-runoff years (2006, 2022).
Firstly, monthly scale, potential large-scale meteorological factors affecting the evolution characteristics of drought-runoff in the Yangtze River Basin were collected, specifically including the North Pacific Teleconnection Pattern Index (NP), Sunspot Number Index (TSNI), Western Pacific Warm Pool Intensity Index (WPWPSI), El Niño-Southern Oscillation Index (ENSO), North Atlantic Oscillation Index (NAO), Southern Oscillation Index (SOI), Western Pacific Subtropical High Intensity Index (WPSHII), and South China Sea Subtropical High Intensity Index (SCSSHII). These eight climate indices were selected because they are the key drivers of the Western Pacific Subtropical High and the East Asian Summer Monsoon, which directly control the spatial and temporal distribution of precipitation and temperature in the Yangtze River Basin; previous studies have verified their significant correlation with the basin’s hydrometeorological and runoff processes. These factors are widely recognized as key drivers affecting the hydrometeorological processes in the Yangtze River Basin, and their correlations with runoff variations have been verified in multiple studies [8,32,35].
Secondly, the partial correlations between large-scale meteorological factors, reservoir indexes, water consumption, and drought-runoff were calculated. Considering the lag effect of air–sea interaction and atmospheric circulation on local hydrometeorology, the partial correlations between drought-runoff and a certain large-scale meteorological factor in the previous 2 years were calculated at a seasonal scale, respectively, and the maximum partial correlation coefficient was selected to characterize the correlation between drought-runoff and the meteorological factor. This approach can effectively capture the time-lag response of hydrological processes to large-scale climate forcing, which is a common technical method in hydrological attribution analysis [37,40]. The six influencing factors with the highest partial correlations (sorted by the absolute value of correlation coefficient, p < 0.01) are: WPSHII, SCSSHII, ENSO, WPWPSI, NP, SOI. The six influencing factors with the highest partial correlations were screened out as the main influencing factors for the evolution of drought-runoff, and the contribution of each factor was further calculated.
A multiple linear regression model was used to estimate the contribution of the main influencing factors to the evolution of drought-runoff:
- Dependent variable: Monthly runoff anomaly percentage (%) of the four key hydrological stations (relative to the 1956–2024 multi-year average).
- Independent variables: The six screened large-scale meteorological factors (standardized by z-score to eliminate dimensional differences).
- Multicollinearity assessment: Variance Inflation Factor (VIF) was used; all VIF values < 5, indicating no significant multicollinearity among variables.
- Model validation: Ten-fold cross-validation was adopted, with the average R2 of the validation set reaching 0.78 (p < 0.001).
- Residual diagnostics: Residual normality was verified via the Shapiro–Wilk test (p > 0.05), and residual homoscedasticity was confirmed using the Levene test (p > 0.05).
- Interaction effect test: Interaction terms between all pairs of variables were added to the model; the results showed no significant interaction effects (p > 0.05), indicating the R2 change approach assumption is valid for this dataset.
The influencing factors were included in the regression model in sequence, and the change in the determination coefficient (R2) of the model after adding the factor was taken as the contribution of the influencing factor to the evolution of drought-runoff. This method is widely used in quantitative attribution of hydrological changes due to its simplicity and interpretability [42].
The runoff Qi in the i-th month of a typical year was expressed by Equation (1):
In the equation, was the multi-year average natural runoff in the i-th month; was the runoff change caused by meteorological factors in the i-th month; was the runoff change caused by reservoir operation and regulation in the i-th month; was the runoff change caused by water intake and use in the i-th month.
The contributions of meteorological factors, reservoir operation and regulation, and water intake and use to the runoff in the i-th month of a typical year can be expressed as:
In the equation, , , and respectively represented the contributions of meteorological factors, reservoir operation and regulation, and water intake and use to the runoff in the i-th month.
To obtain , the long-series monthly-scale runoff Qt was restored. According to the water balance, considering the impact of reservoir operation and regulation and water intake and use on runoff, the long-series natural monthly runoff was obtained, as shown in Equation (3):
In the equation, ΔRVt was the storage change of the reservoir group upstream of the hydrological station in the t period; and WCt was the water consumption in the catchment area of the hydrological station in the t period [43,44]. The water balance method is a fundamental approach in hydrological simulation and natural runoff restoration, which has been widely applied in the Yangtze River Basin [45].
Monthly storage data of 53 key control reservoirs included in the 2024 joint dispatch of the Yangtze River Basin were collected to determine ΔRVt. Among them, there were 29 key control reservoirs in the upper reaches of the Yangtze River, with a total regulation storage capacity of 67.1 billion m3 and a reserved flood control storage capacity of 48.3 billion m3, and there were 24 key control reservoirs in the middle and lower reaches of the Yangtze River, with a total regulation storage capacity of 49.8 billion m3 and a reserved flood control storage capacity of 22.3 billion m3 [2,36]. Divided by the representative stations used in this study, 29 reservoirs were located in the basin upstream of Yichang Station, 41 reservoirs in the basin upstream of Luoshan Station, 49 reservoirs in the basin upstream of Hankou Station, and 53 reservoirs in the basin upstream of Datong Station. The 53 key control reservoirs accounted for 89% of the total regulation storage capacity of the Yangtze River Basin; ungauged smaller reservoirs (11% of total storage) had a negligible impact on basin-wide mainstream runoff due to their small single storage capacity and scattered spatial distribution. According to Equation (2), the contributions of meteorological factors, reservoir operation and regulation, and water intake and use to the monthly-scale runoff in a typical year can be obtained.
3.4. Novel Method Framework for Drought-Runoff Analysis
This study does not simply apply existing statistical and hydrological methods to the Yangtze River Basin case, but innovatively constructs a basin-wide drought-runoff analysis framework integrating three-level quantitative discrimination criteria and multi-factor attribution modeling, which has two core innovative features distinct from existing methodologies: (1) Based on the seasonal characteristics of drought-runoff in the Yangtze River Basin (June–November as the main drought-runoff period), the discrimination criteria are established by combining the flow frequency of key mainstream stations and basin-wide hydrological coherence, making up for the deficiency of single-indicator methods in identifying basin-wide drought-runoff events; (2) The attribution model couples large-scale meteorological factors, reservoir operation, and riverine water intake, and quantifies the seasonal variation of each factor’s contribution by combining partial correlation analysis, multiple linear regression, and the water balance method, realizing the accurate identification of the formation mechanism of drought-runoff under the influence of intense human activities.
4. Results
4.1. Basin-Wide Drought-Runoff Discrimination Criteria
Yichang station, Hankou station, and Datong station in the Yangtze River Basin were selected as representative hydrological stations in this study. Basin-wide drought-runoff is defined as the simultaneous occurrence of drought-runoff at all three representative stations (Yichang/Hankou/Datong), corresponding to the upper, middle, and lower reaches of the basin; “multiple regions” refers to the three hydrological divisions (upper/middle/lower reaches) of the Yangtze River Basin. When continuous drought-runoff occurs in multiple regions in the upper, middle, and lower reaches of the Yangtze River Basin, specifically manifested as drought-runoff occurring at representative stations in the middle and lower reaches while drought-runoff occurring at representative stations in the upper reaches during the same period, it can be determined as basin-wide drought-runoff. The temporal correlation coefficient of drought-runoff between the three stations is 0.89 (p < 0.01), and the simultaneous occurrence rate of drought-runoff events is 92% for the 1956–2024 period, indicating a high level of hydrological coherence across the basin. Drought conditions occurred simultaneously across all three stations for all identified basin-wide drought-runoff events (2006, 2022, 1972, 2011, 1959, 1992, 2024).
Based on the frequency analysis results of long-series hydrological data at the representative hydrological stations and combined with the study on drought-runoff characteristics of the Yangtze River Basin, it was found that the most common drought-runoff situation in the Yangtze River Basin was the consecutive drought-runoff in summer and autumn. Taking the precipitation and runoff during summer and autumn as the characterization indicators, the basin-wide drought-runoff usually manifested due to insufficient precipitation, drought-runoff occurring in multiple main tributaries in the upper, middle, and lower reaches of the basin, and with drought-runoff in the upper reaches of the Yangtze River. This occurred simultaneously or successively with drought-runoff in the middle and lower reaches, resulting in continuously low water levels at major stations in the mainstream of the Yangtze River and significantly lower reservoir storage than the multi-year average level.
Combined with the drought characteristics of the Yangtze River Basin, June to November was selected as the drought analysis period, and the following quantitative indicators were used to discriminate drought-runoff in the Yangtze River Basin. The three-level hazard standards (extreme/severe/relatively severe) of drought-runoff are defined based on Chinese hydrological frequency division practice (GB 50201-2014) and the historical drought-runoff impact of the Yangtze River Basin: 98% frequency corresponds to extreme drought-runoff (once-in-50-year hydrological event with severe socio-ecological impacts); 95% frequency corresponds to severe drought-runoff (once-in-20-year event with obvious socio-ecological impacts); 90% frequency corresponds to relatively severe drought-runoff (once-in-10-year event with minor socio-ecological impacts). The basin-wide drought-runoff discrimination indicators for the Yangtze River Basin were proposed as follows:
- A.
- Basin-wide extreme drought-runoff: The frequency of the average flow from June to November at the Yichang station, Hankou station, and Datong station was greater than 98%.
- B.
- Basin-wide severe drought-runoff: The frequency of the average flow for 5 consecutive months from June to November at the Yichang station, Hankou station, and Datong station was greater than 95%.
- C.
- Basin-wide relatively severe drought-runoff: The frequency of the average flow for 4 consecutive months from June to November at the Yichang station, Hankou station, and Datong station was greater than 90%.
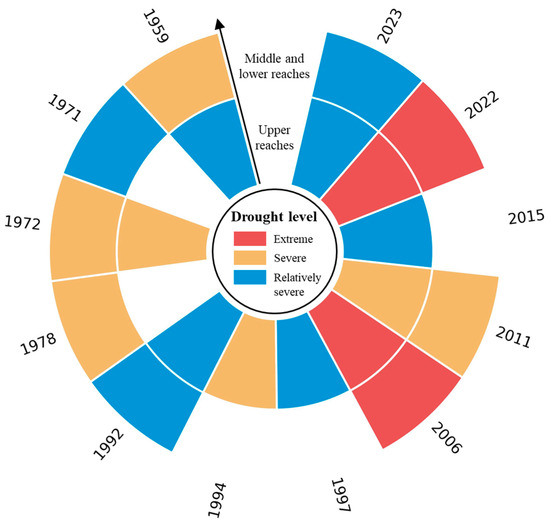
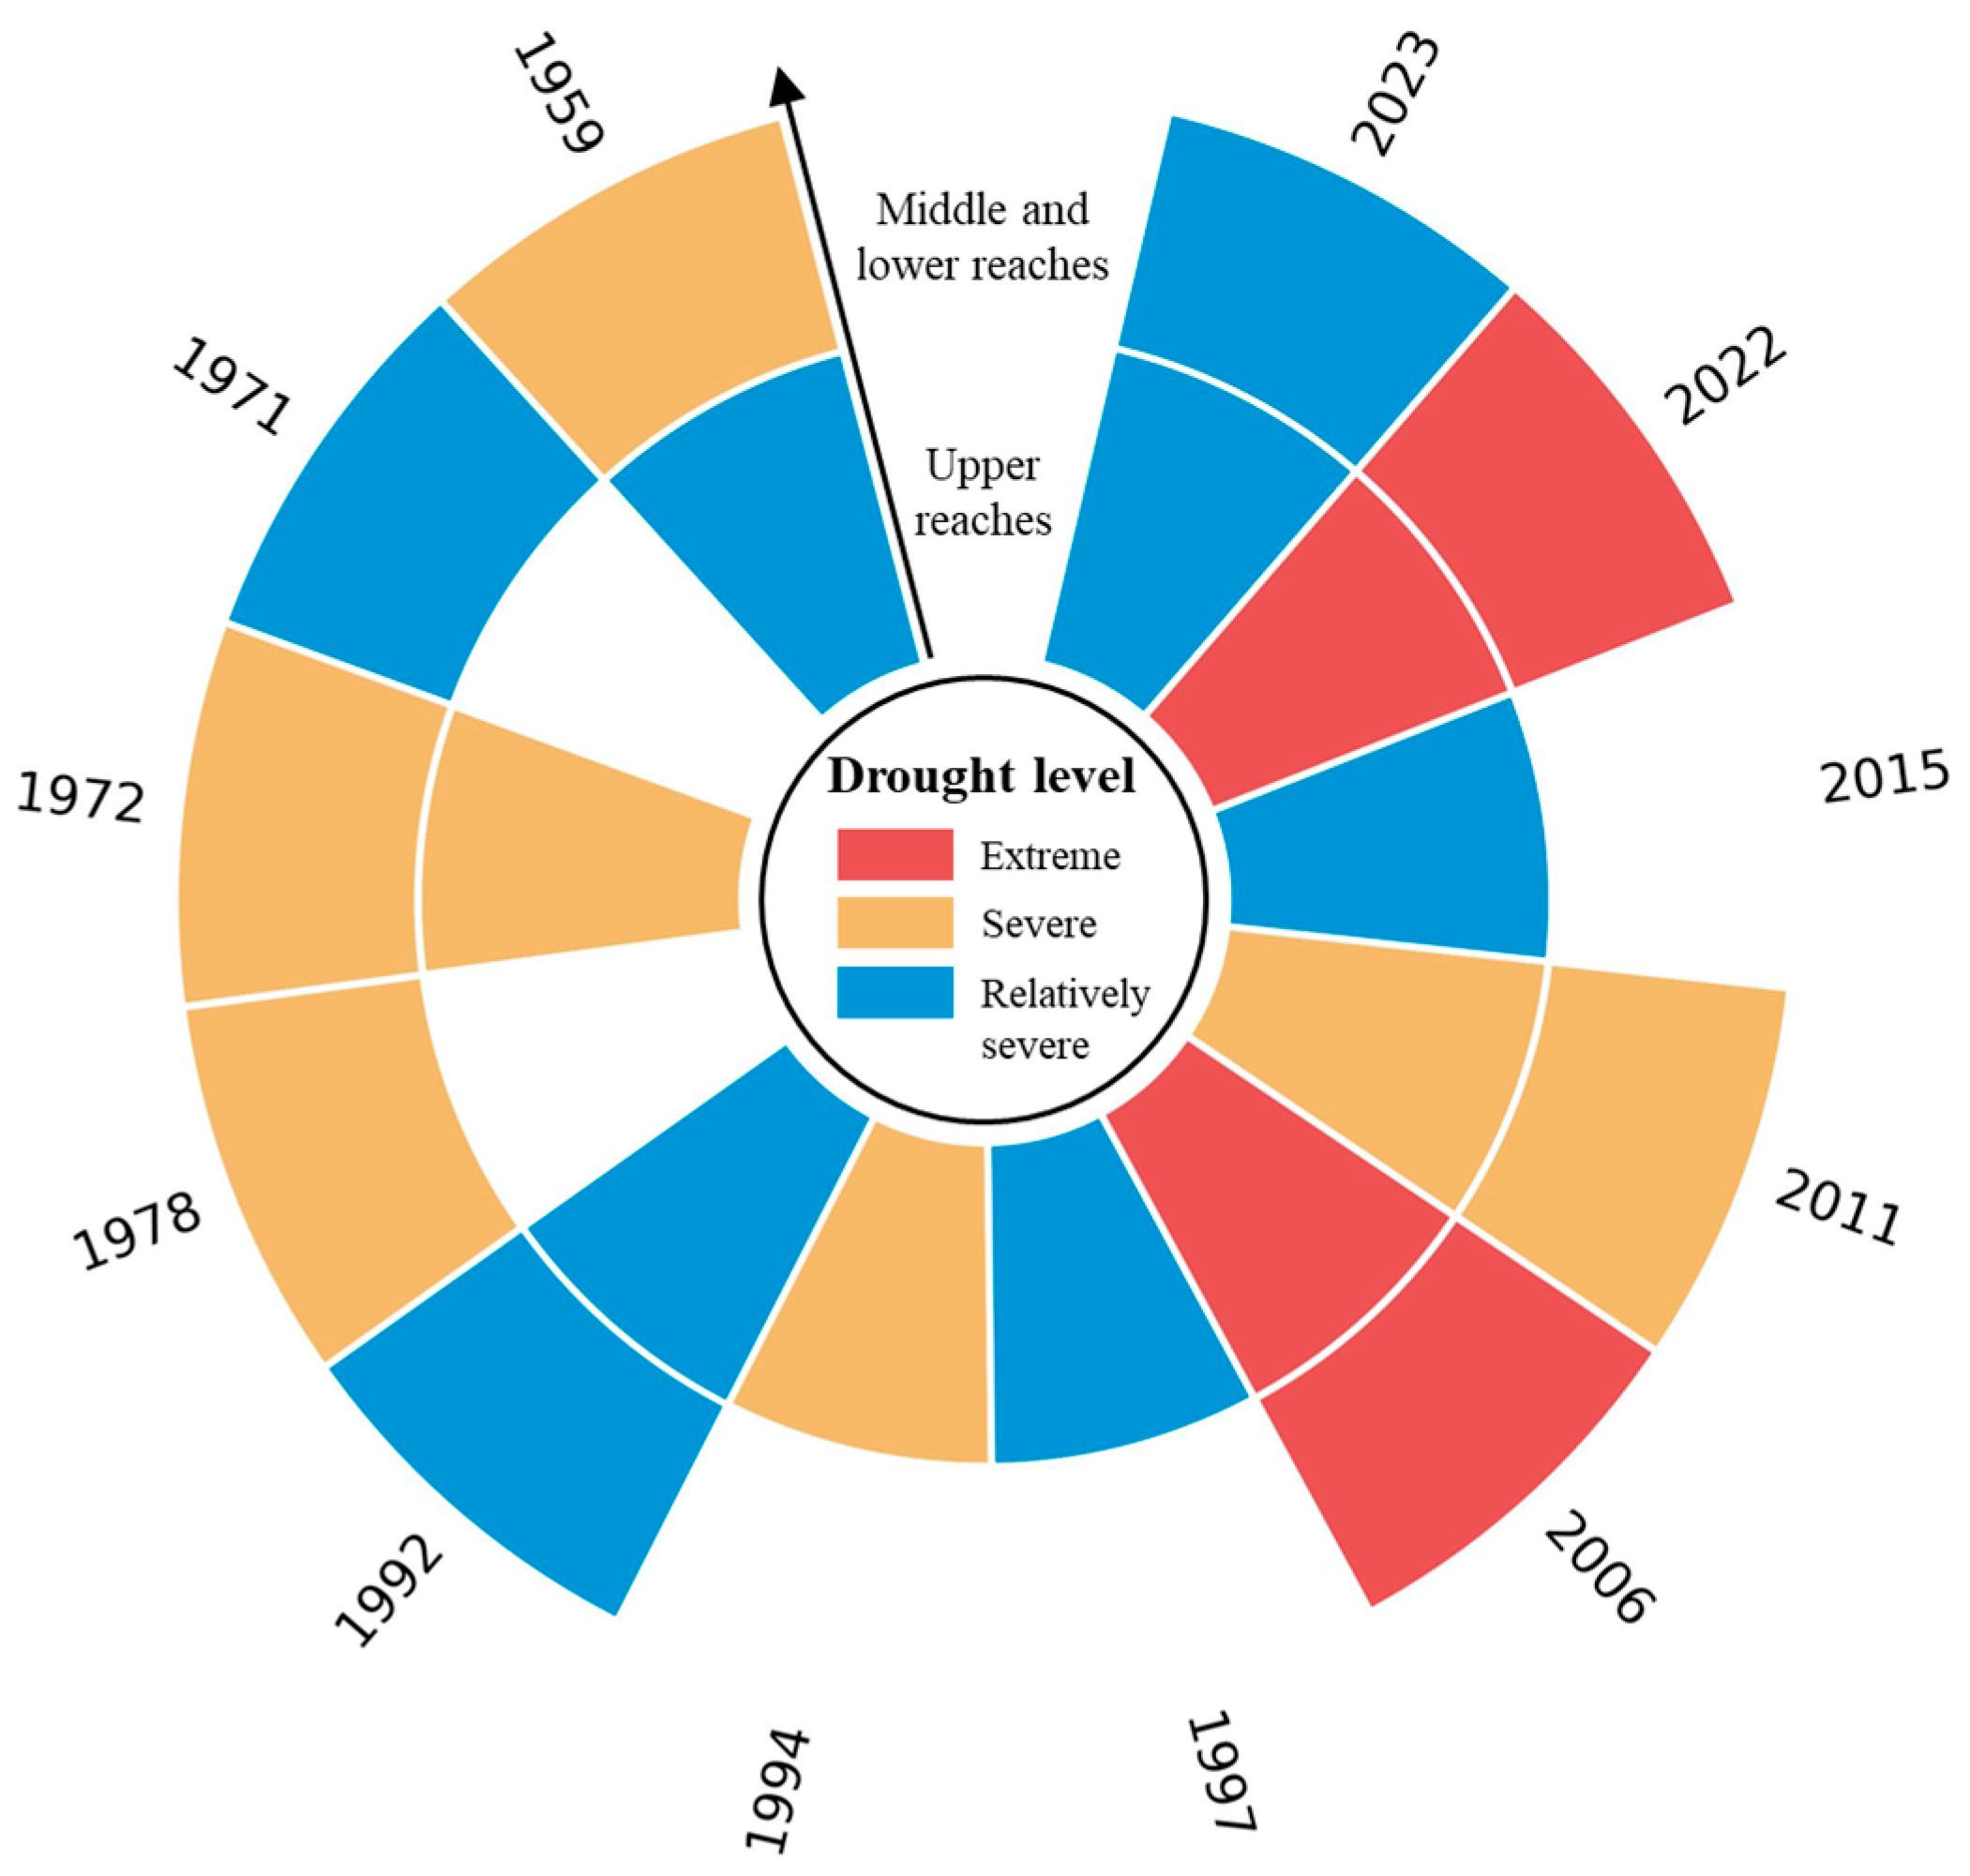
According to the above basin-wide drought-runoff discrimination criteria, the basin-wide drought-runoff events in the Yangtze River Basin from 1956 to 2024 were discriminated, and the results were shown in Figure 2. The discrimination results showed that basin-wide extreme drought-runoff occurred in the Yangtze River Basin in 2006 and 2022; basin-wide severe drought-runoff occurred in 1972 and 2011; and basin-wide relatively severe drought-runoff occurred in 1959, 1992, and 2024. A sensitivity analysis of the frequency threshold was conducted (97% vs. 98% for extreme drought-runoff, 94% vs. 95% for severe drought-runoff, 89% vs. 90% for relatively severe drought-runoff), and the event classification results were completely consistent with the original threshold, demonstrating the strong robustness of the established criteria.
Figure 2.
The discrimination results of historical basin-wide drought-runoff events in the Yangtze River Basin from 1956 to 2024. (Note: White areas = non-drought-runoff years (no drought-runoff at any station); Colored areas = drought-runoff years with different severity levels).
4.1.1. Drought-Runoff Thresholds at Representative Stations
Firstly, frequency analysis was conducted based on the average flow of the representative stations (Yichang station, Hankou station, and Datong station) in different periods. The statistical period lengths were 6 months (June–November), 5 months (June–October, July–November), and 4 months (June–September, July–October, August–November). The theoretical frequency curve adopted the Pearson-III type. The mean value and Cv of the flow series were calculated by the moment method as initial estimates, and determined by adjusting with the curve-fitting method. For the 6-, 5- and 4-month periods, the drought-runoff threshold corresponding to the 98%, 95% and 90% frequency were focused on, respectively. The Cs/Cv = 2.0 constant ratio assumption was validated across all the stations and time periods; the results showed no significant difference (p > 0.05) in the fitting effect between the constant Cs/Cv ratio and the variable Cs/Cv ratios, confirming the rationality of the assumption. The analysis results of the drought-runoff thresholds at each representative station in different periods were shown in Table 1, Table 2 and Table 3.
Table 1.
Drought-runoff thresholds at 98% frequency for 6-month periods at each representative station.
Table 2.
Drought-runoff thresholds at 95% frequency for 5-month periods at each representative station.
Table 3.
Drought-runoff thresholds at 90% frequency for 4-month periods at each representative station.
4.1.2. Discrimination of Basin-Wide Extreme Drought-Runoff Events
The average flow and corresponding frequency of each representative station in different periods in 2006 and 2022 are shown in Table A1 and Table A2, respectively. It can be seen that Yichang station, Hankou station, and Datong station all met the condition that the frequency of the average flow from June to November was >98%. Combined with the basin-wide drought-runoff discrimination criteria, it can be considered that basin-wide extreme drought-runoff occurred in the Yangtze River Basin in 2006 and 2022.
4.2. Meteorological Characteristics of Typical Extreme Drought-Runoff Years
4.2.1. Summer and Autumn Extreme Meteorological Drought in 2006
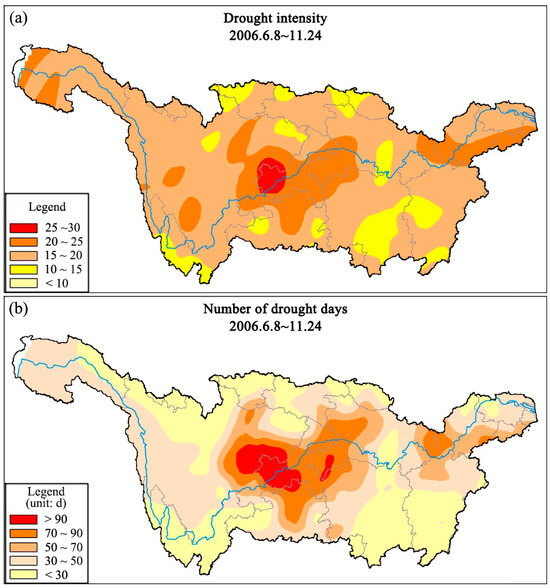
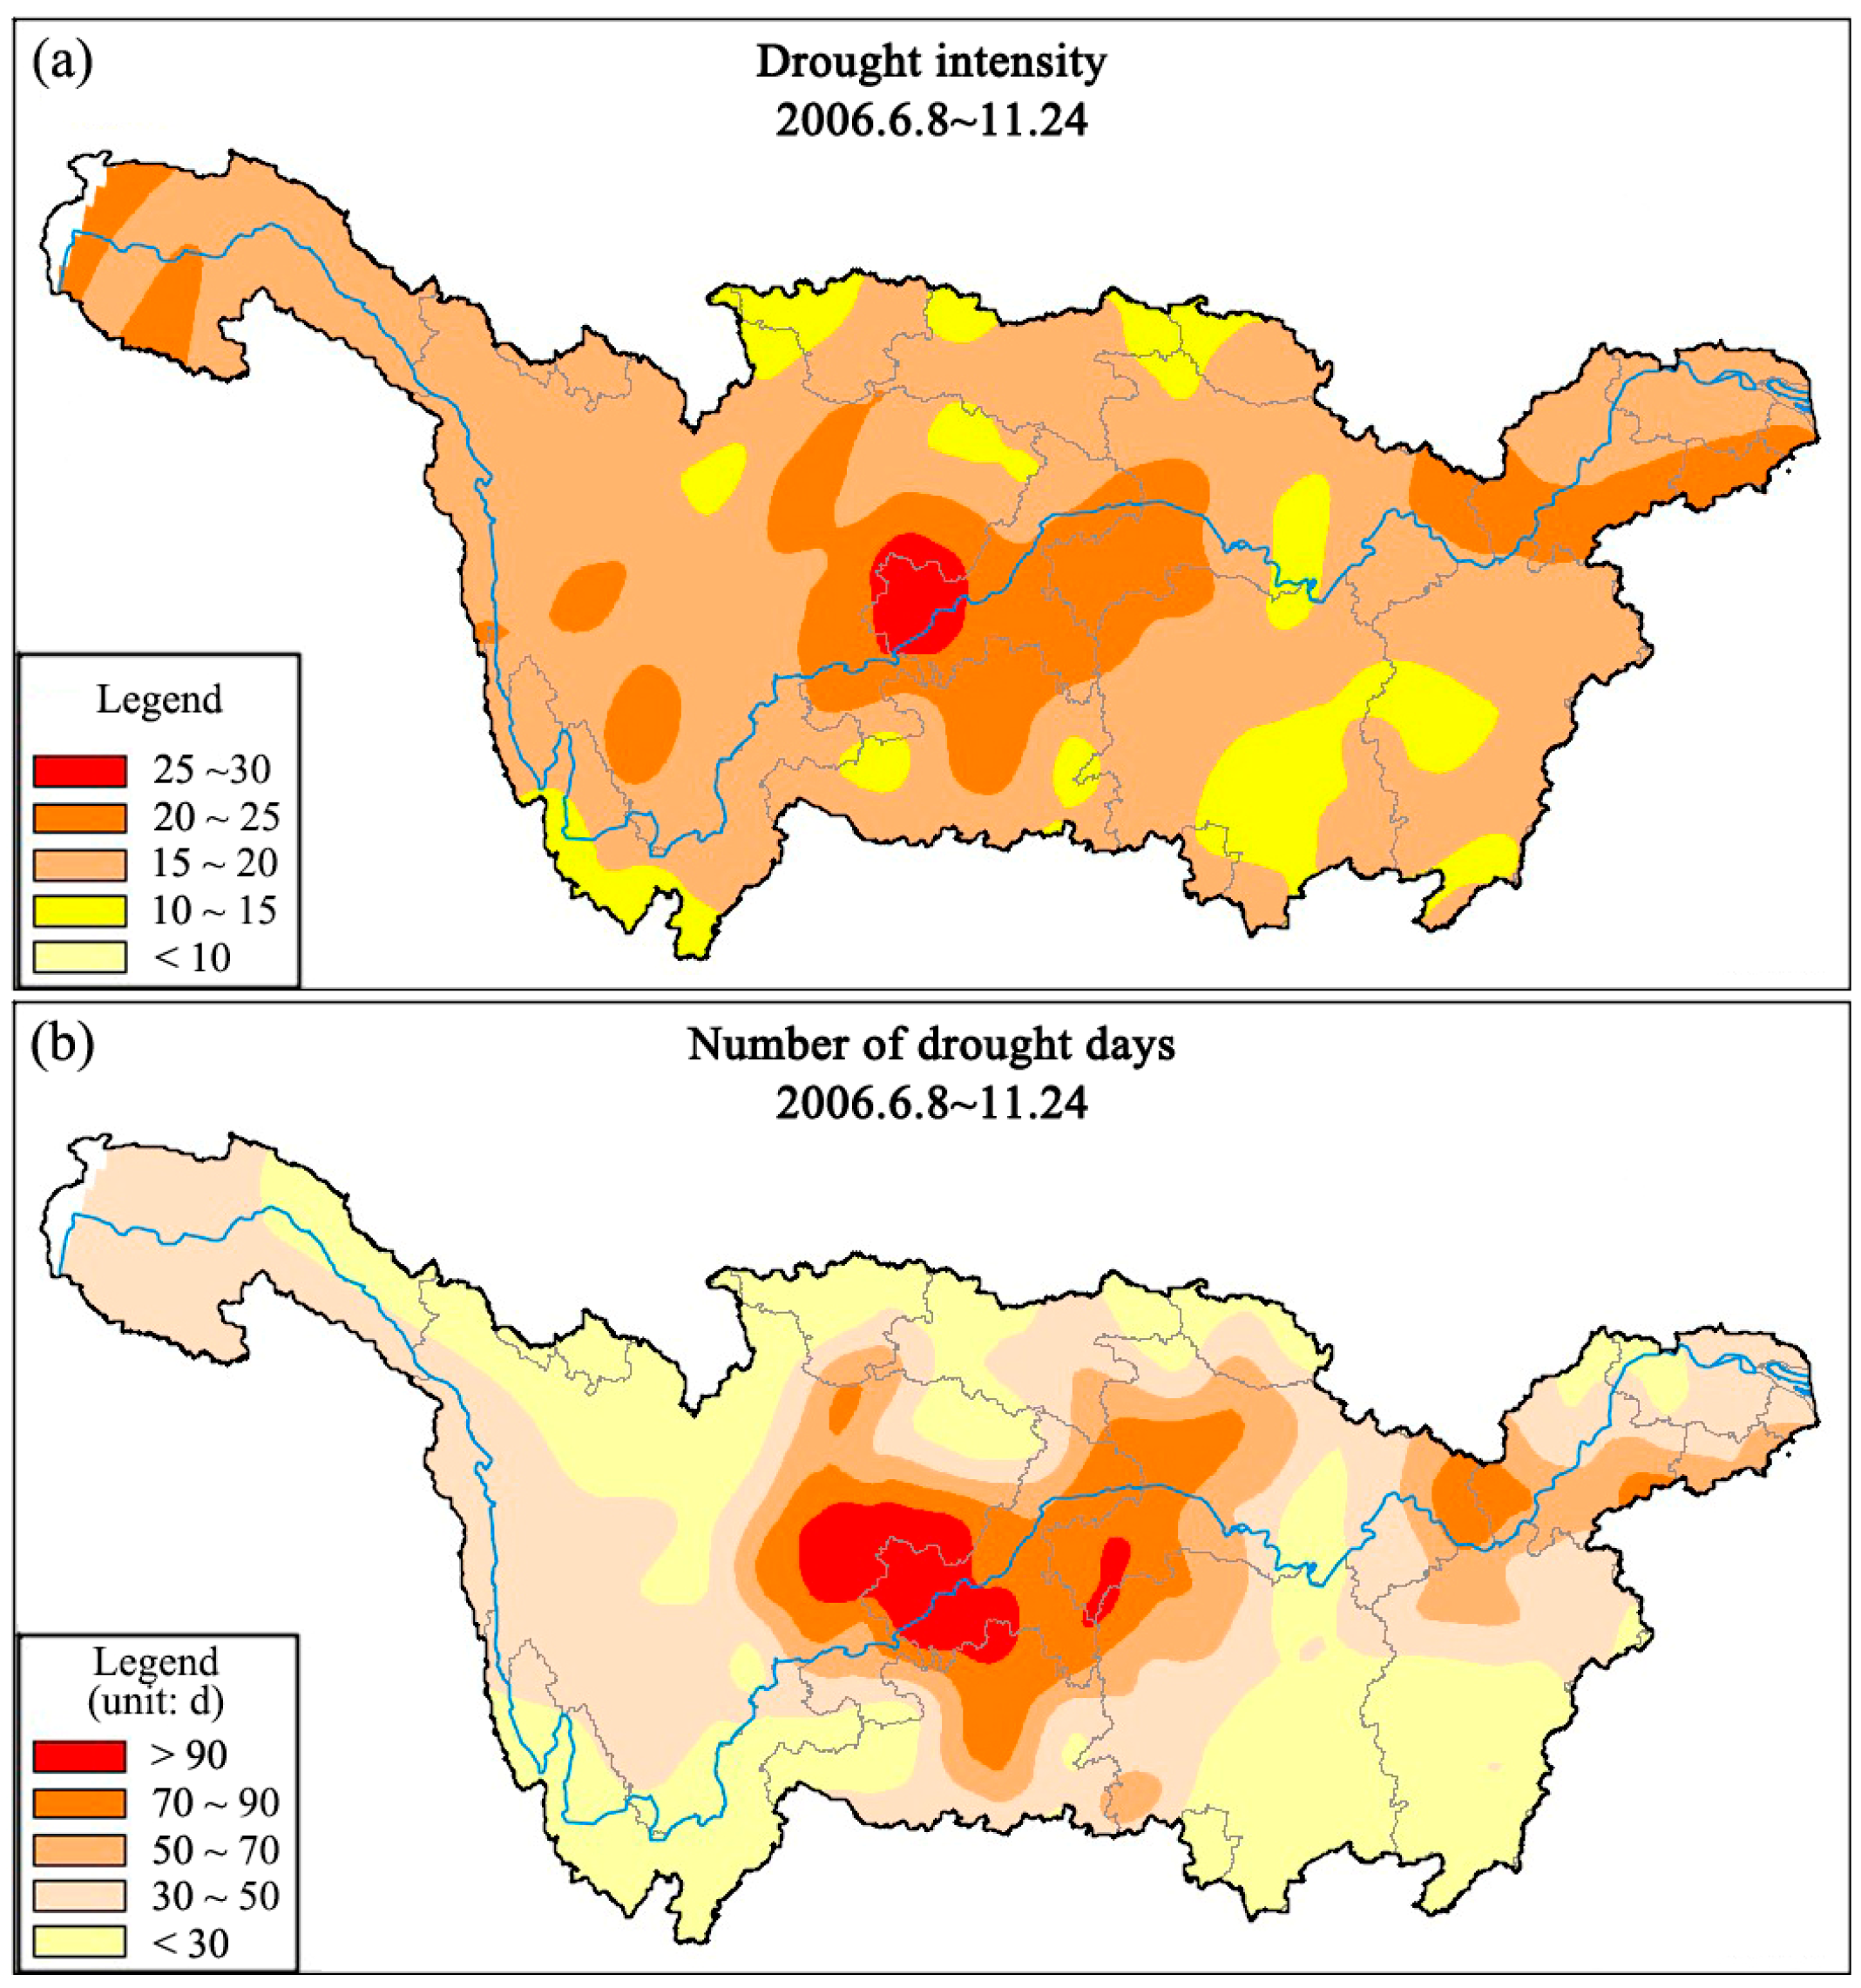
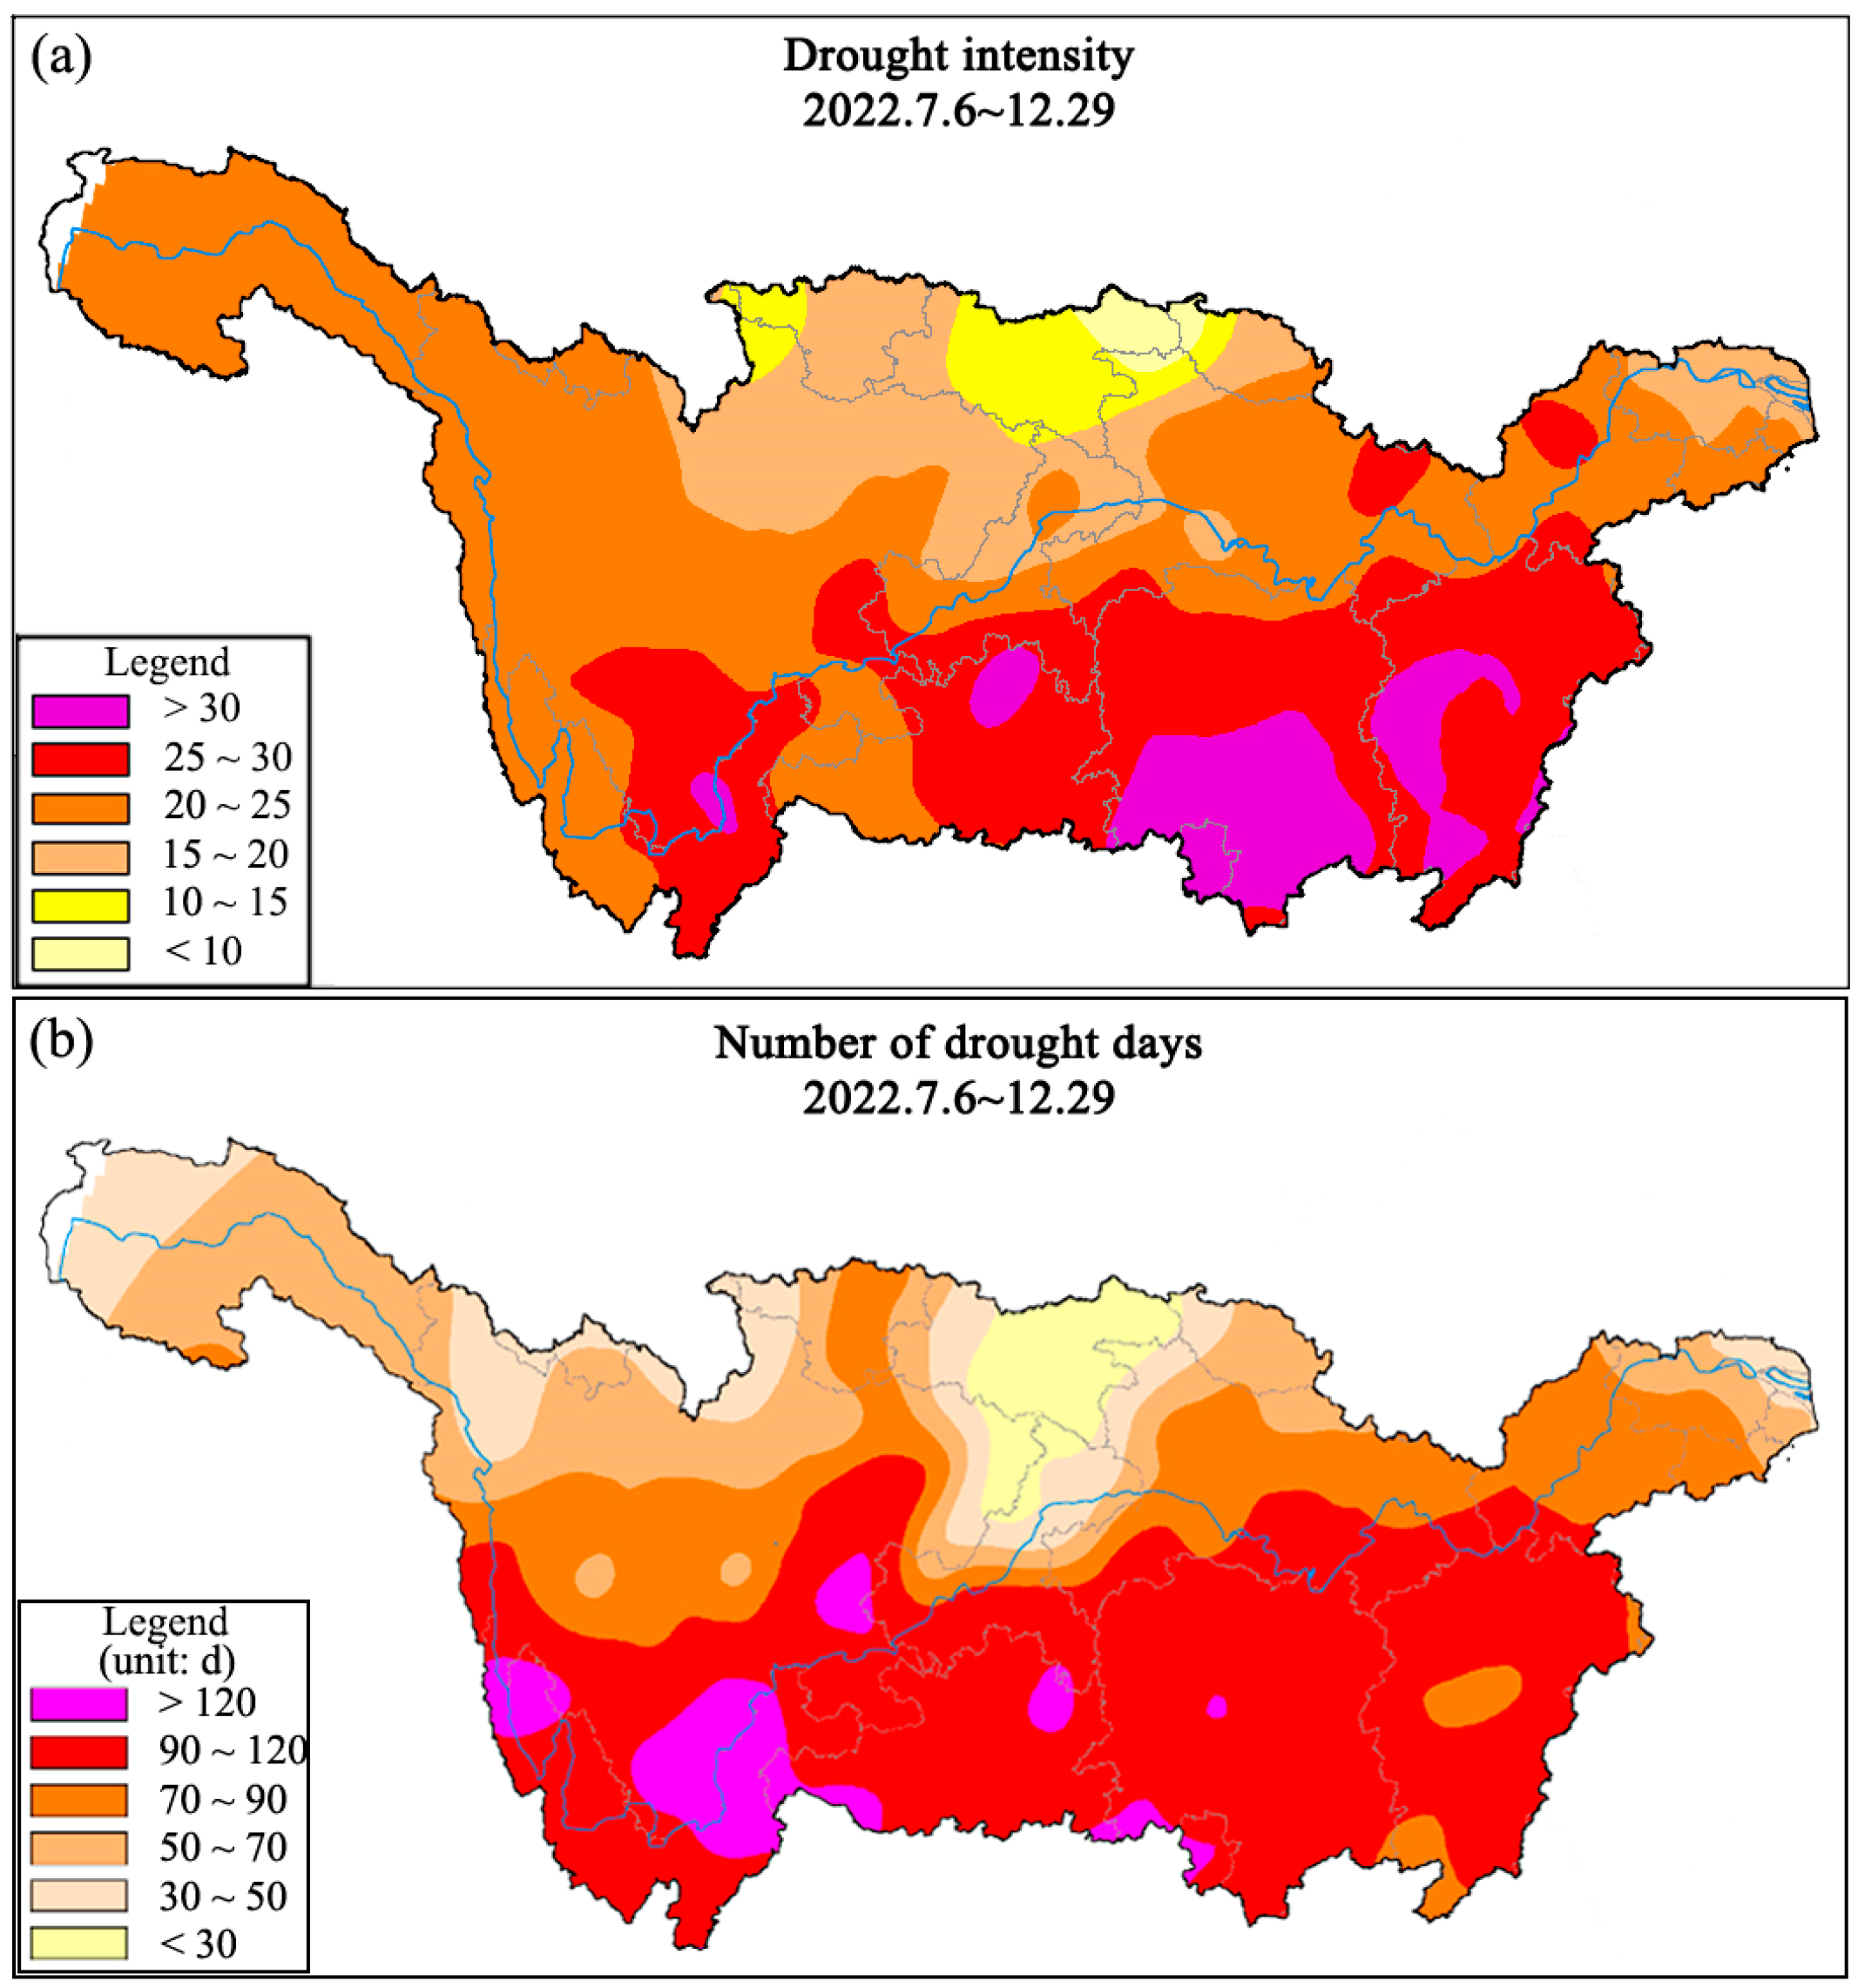
In the summer of 2006 (June–August), the average precipitation in the middle reach of the Yangtze River Basin was the lowest in the same period since 1951; at the same time, the average temperature (26.5 °C) in midsummer was the second highest in the same period since 1951 (only lower than the 27.4 °C in the same period of 2022). Especially after mid-July, the middle reach of the Yangtze River Basin was hit by a rare continuous high-temperature heatwave, with the extreme maximum temperature generally ranging from 38 °C to 40 °C. The duration and intensity of high-temperature days in parts of the middle reach of the Yangtze River Basin reached the historical extreme values in the same period since local meteorological records began. Continuous high temperature and low precipitation led to rapid soil moisture loss, and the summer drought developed and intensified rapidly. The middle reach of the Yangtze River Basin suffered a once-in-a-century severe summer drought, and parts of the area experienced the most severe summer drought since 1951. Some areas in the lower reach of the Yangtze River also experienced less precipitation periodically in summer and autumn, and coupled with generally high temperatures from October to November, a large-scale drought occurred. Overall, the drought intensity was the most severe in the middle reach of the Yangtze River Basin, with the most drought days (Figure 3).
Figure 3.
The spatial distribution of (a) drought intensity (MCI) and (b) drought days in the Yangtze River Basin during the 2006 extreme drought-runoff period (8 June–24 November). Blue line means Yangtze River.
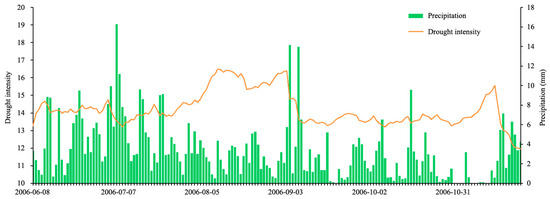
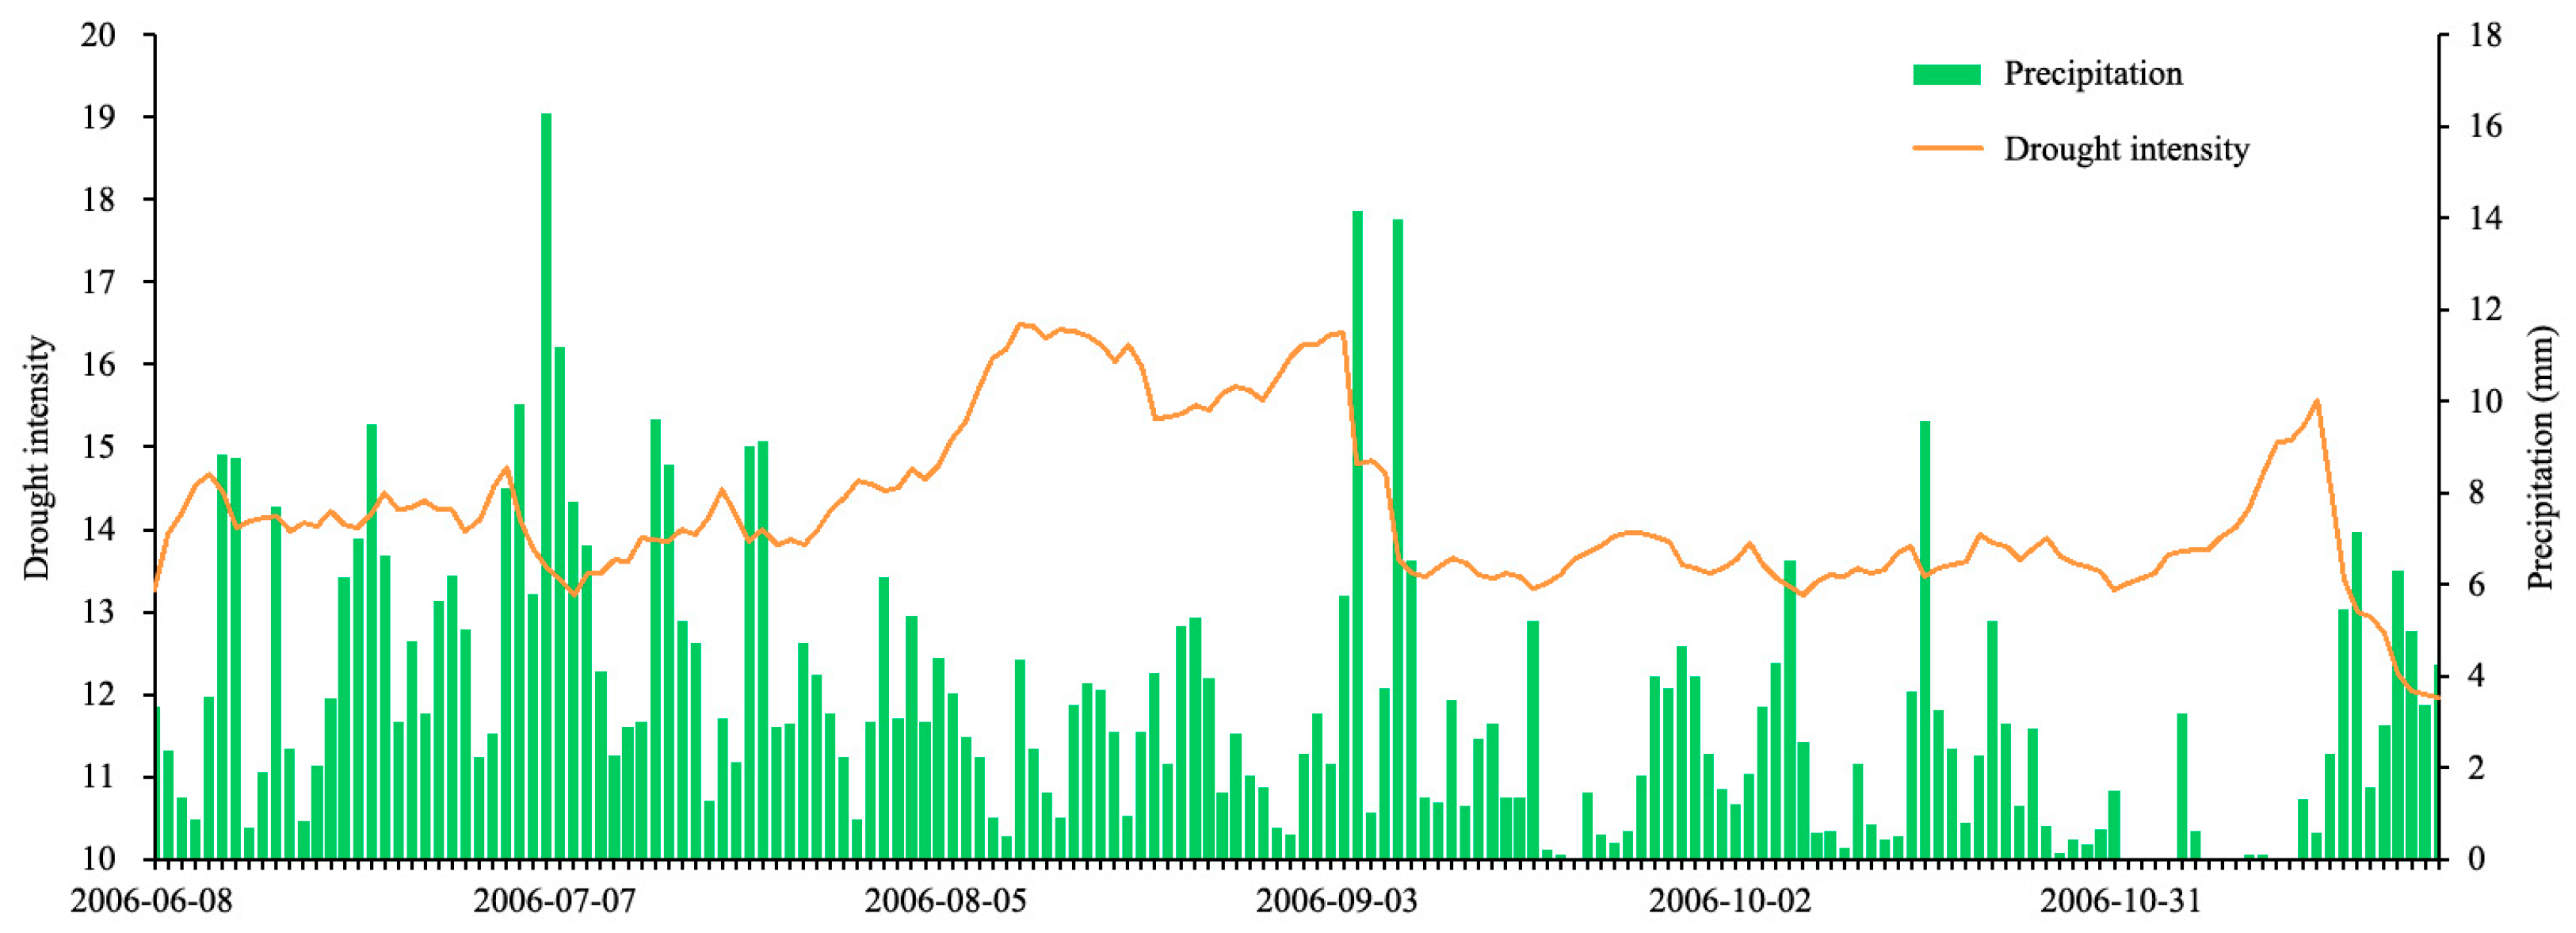
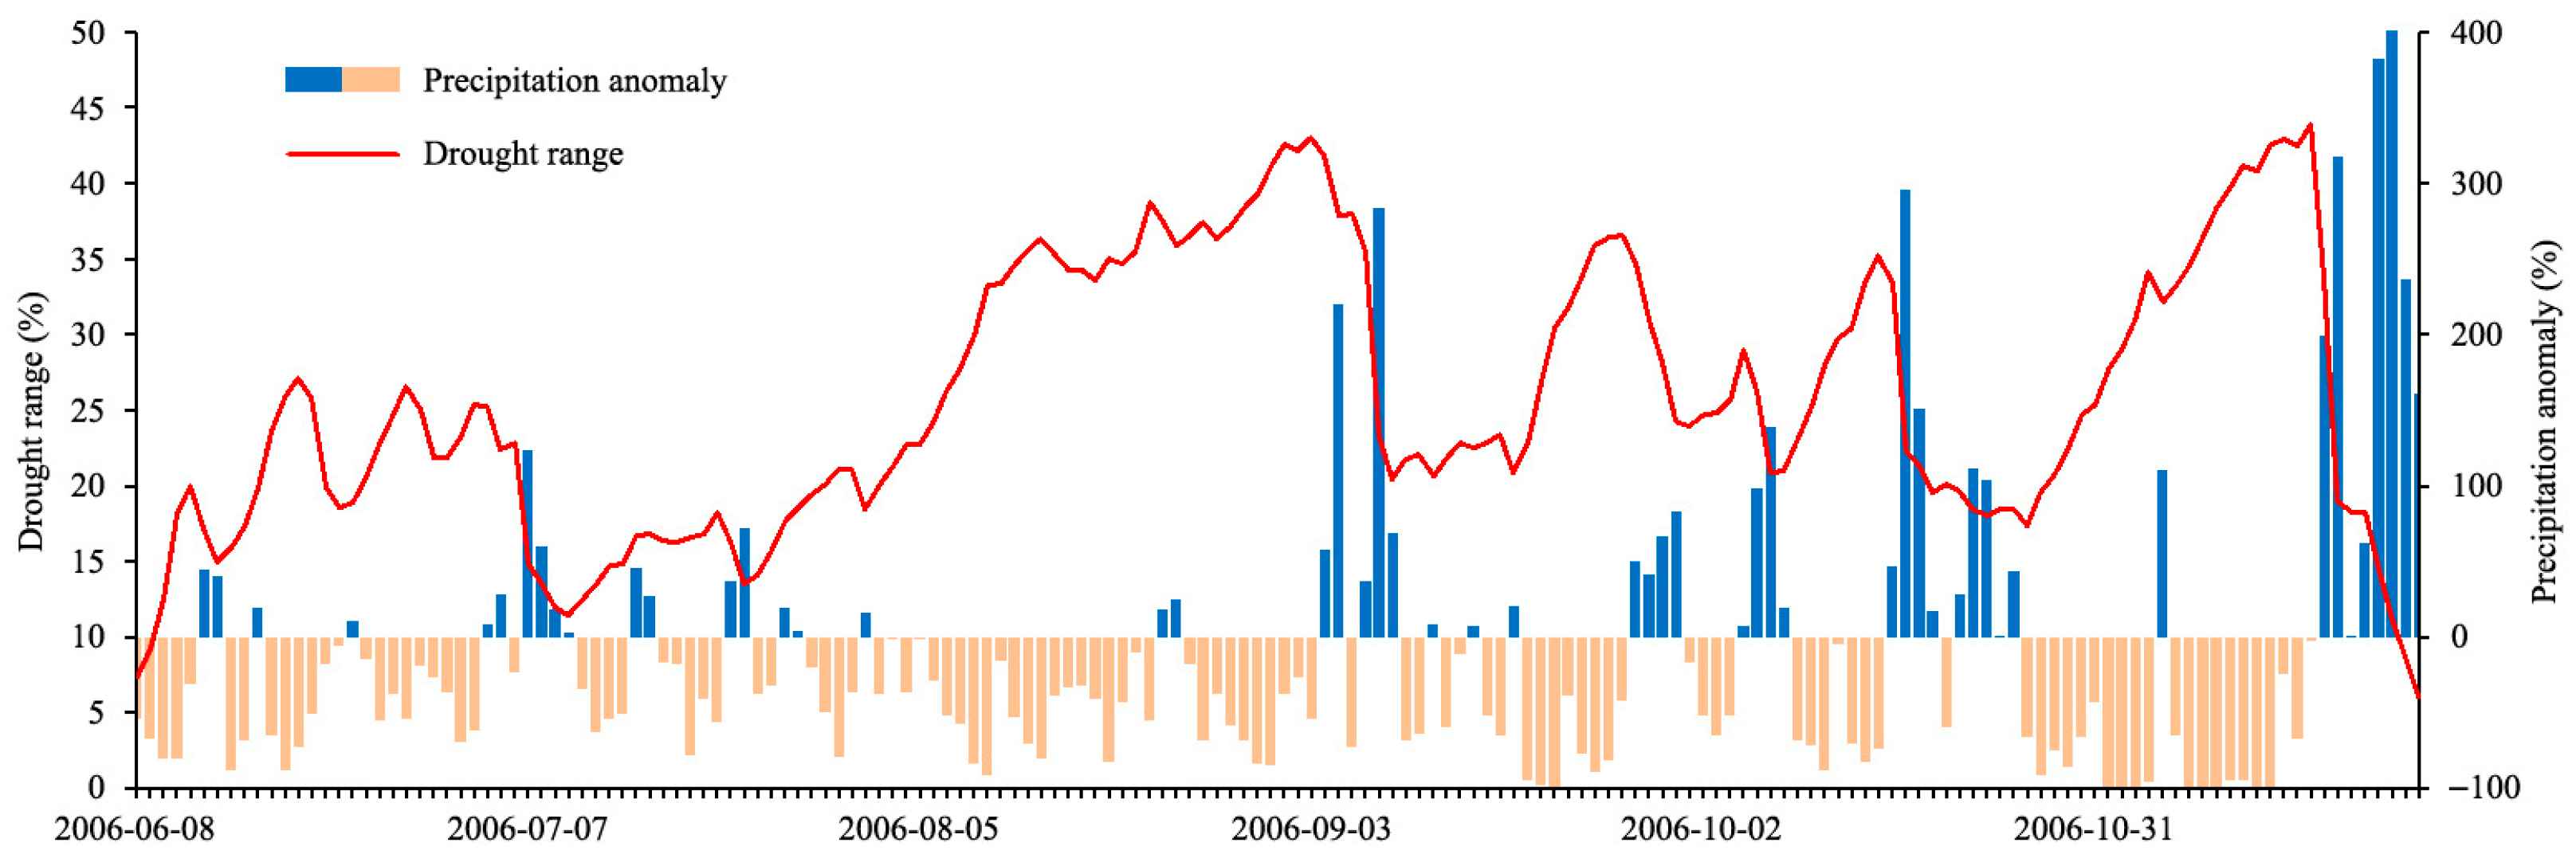
This regional drought event began on 8 June 2006, and ended on 24 November 2006, lasting 170 days. The drought continued from June, and by August, the drought intensity continued to increase and the affected area expanded rapidly. The drought intensity was the strongest in the early half of mid-August and early September (Figure 4), and the drought-affected area was the largest on 3 September (Figure 5). After mid-September, the drought intensity weakened and the area decreased, but the drought intensified again in early November. After late November, the precipitation increased and the drought eased.
Figure 4.
Daily changes of drought intensity (MCI) and precipitation in the Yangtze River Basin during the 2006 extreme drought-runoff period (8 June–24 November).
Figure 5.
Daily changes of drought-runoff range and precipitation anomaly in the Yangtze River Basin during the 2006 extreme drought-runoff period (8 June–24 November).
4.2.2. Severe Consecutive Extreme Meteorological Drought in Summer and Autumn in 2022
From July to December 2022, most parts of the Yangtze River basin experienced continuous low precipitation and suffered from a severe consecutive drought in summer and autumn. The precipitation in the Yangtze River basin from July to October was the lowest in the same period from 1961 to 2024. The precipitation in most areas of the basin was 30% less than the same period of the normal year, among which the precipitation in the Dongting Lake and the Poyang Lake was 50% to 90% less. During the same period, continuous high-temperature weather occurred, and the number of high-temperature days (with an average daily maximum temperature ≥ 35 °C) in the Yangtze River basin was the most in the same period of history (37.5 days, 22.5 days more than the same period of a normal year). The extreme maximum temperature in the central and eastern parts of the Yangtze River basin generally reached 38 °C to 42 °C. Long-term low precipitation and high temperature led to a large-scale continuous drought in the entire Yangtze River Basin, among which the drought degree was the most severe in the Dongting Lake and the Poyang Lake, and the drought days in most areas south of the Yangtze River basin exceeded 3 months (Figure 6).
Figure 6.
The spatial distribution of (a) drought intensity (MCI) and (b) drought days in the Yangtze River Basin during the 2022 extreme drought-runoff period (6 July–29 December). Blue line means Yangtze River.
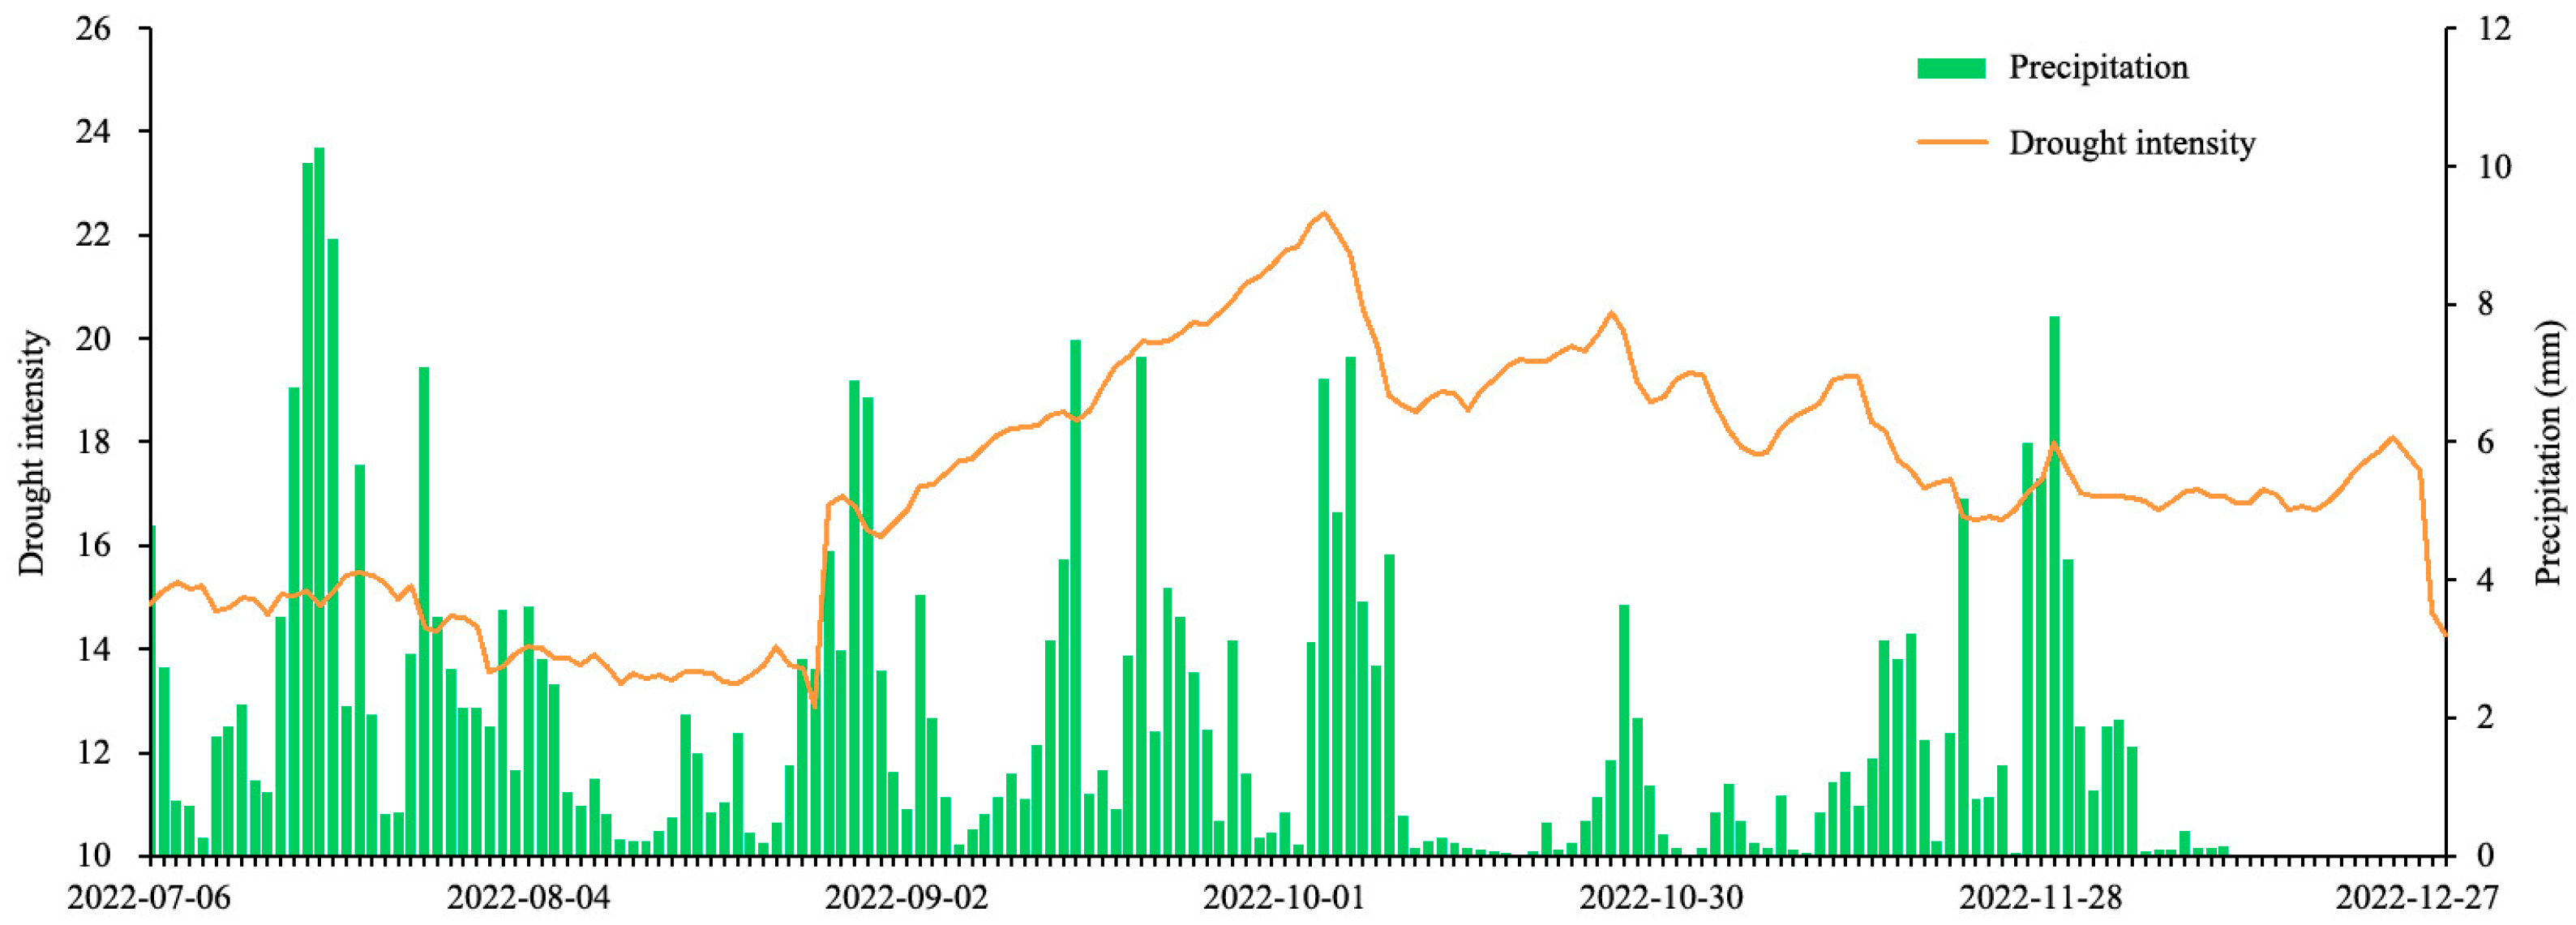
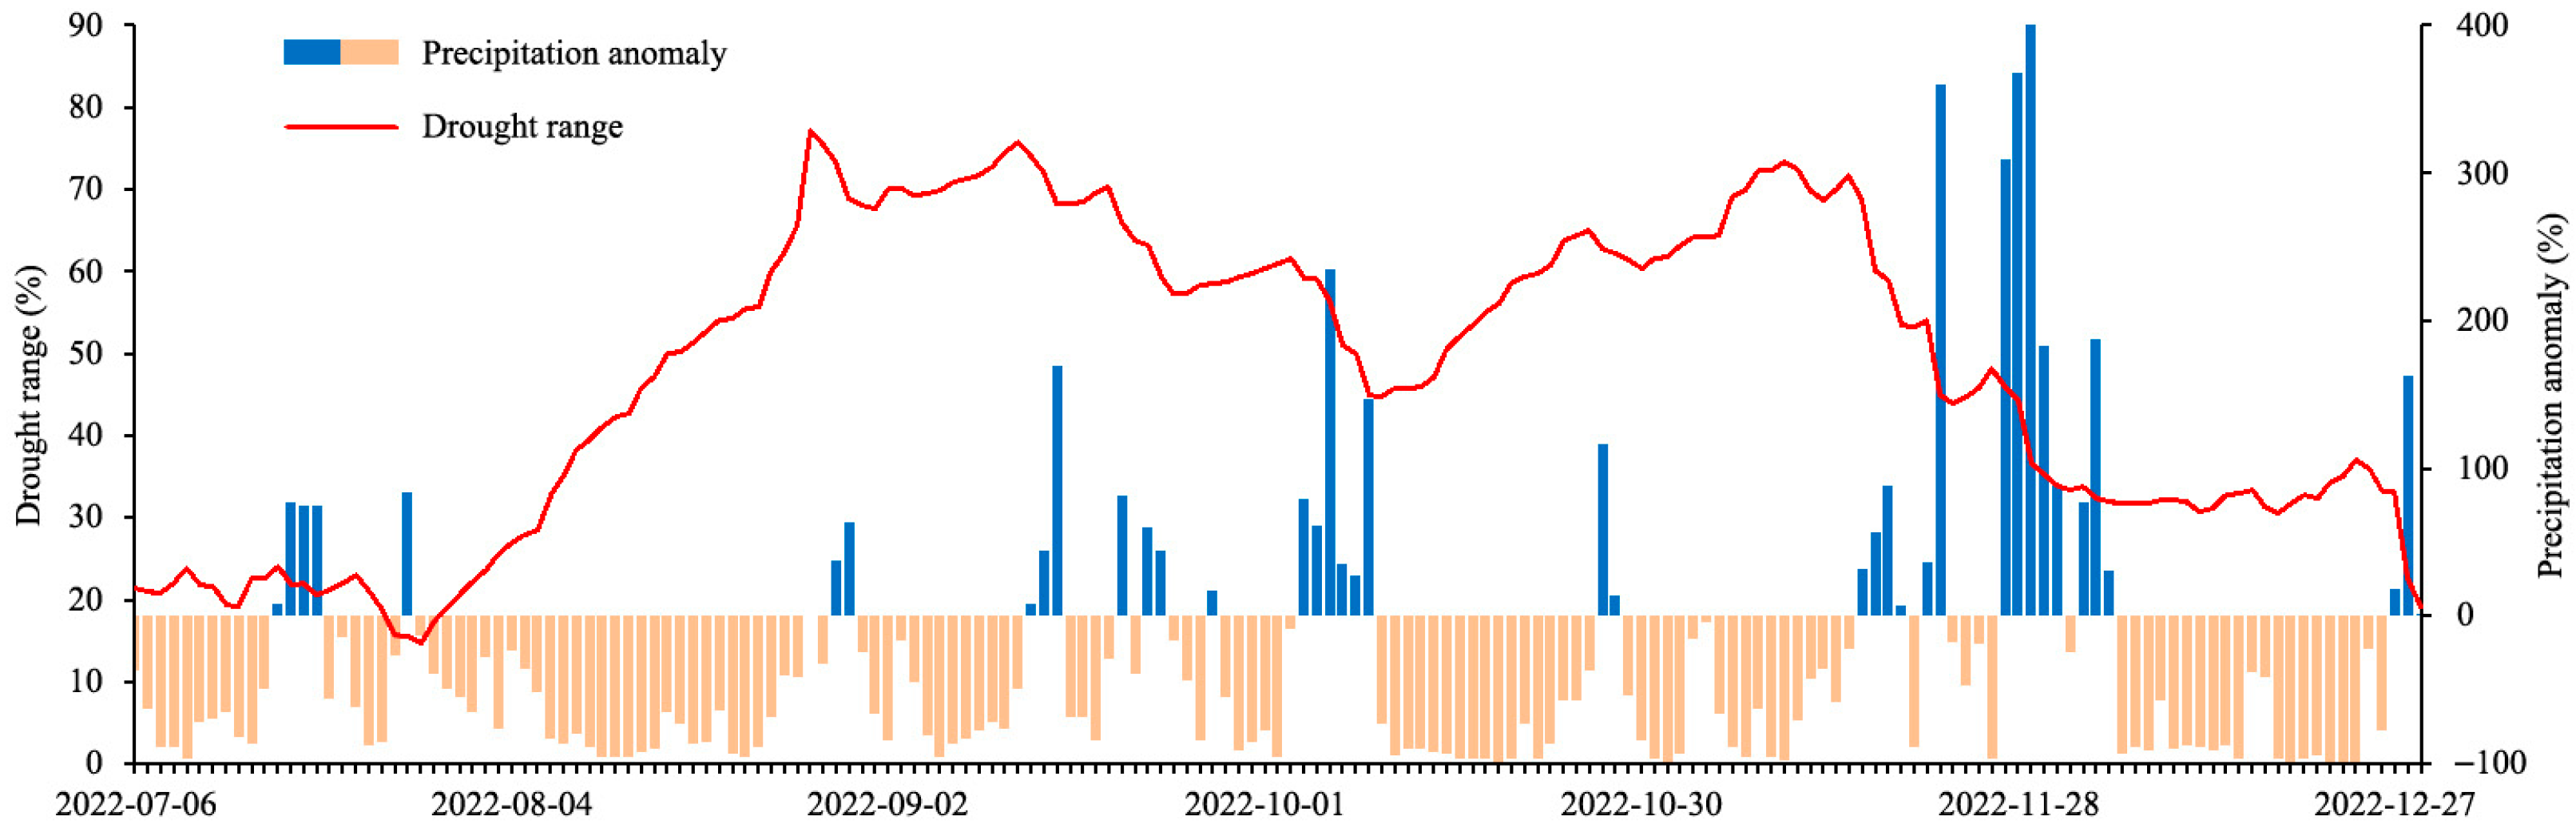
This regional drought event began on 6 July 2022 and ended on 29 December 2022, lasting 177 days—1 week longer than the 2006 event, with a wider spatial coverage (95% of the basin vs. 92% in 2006) and a higher average drought intensity. The drought process was the most severe from August to the early November. The drought intensity reached its strongest on 4 October (Figure 7), and the drought-affected area was largest on 27 August (Figure 8). In early October, the meteorological drought in the northern area of the Yangtze River basin eased due to precipitation, but the meteorological drought in the southern area of the Yangtze River continued to develop. In late November, significant precipitation occurred in the southern area of the Yangtze River basin, and the drought in most areas of the central and eastern parts of the Yangtze River basin eased, but the drought in the upper reach of the Yangtze River basin continued until the end of December before easing.
Figure 7.
Daily changes of drought intensity (MCI) and precipitation in the Yangtze River Basin during the 2022 extreme drought-runoff period (6 July–29 December).
Figure 8.
Daily changes of drought-runoff range and precipitation anomaly in the Yangtze River Basin during the 2022 extreme drought-runoff period (6 July–29 December).
4.3. Analysis of Formation Mechanism of Typical Extreme Drought-Runoff Events
4.3.1. The Extreme Drought-Runoff Event in 2006
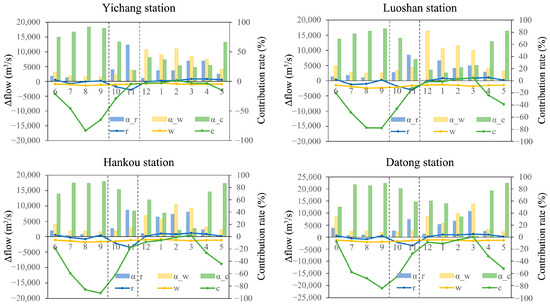
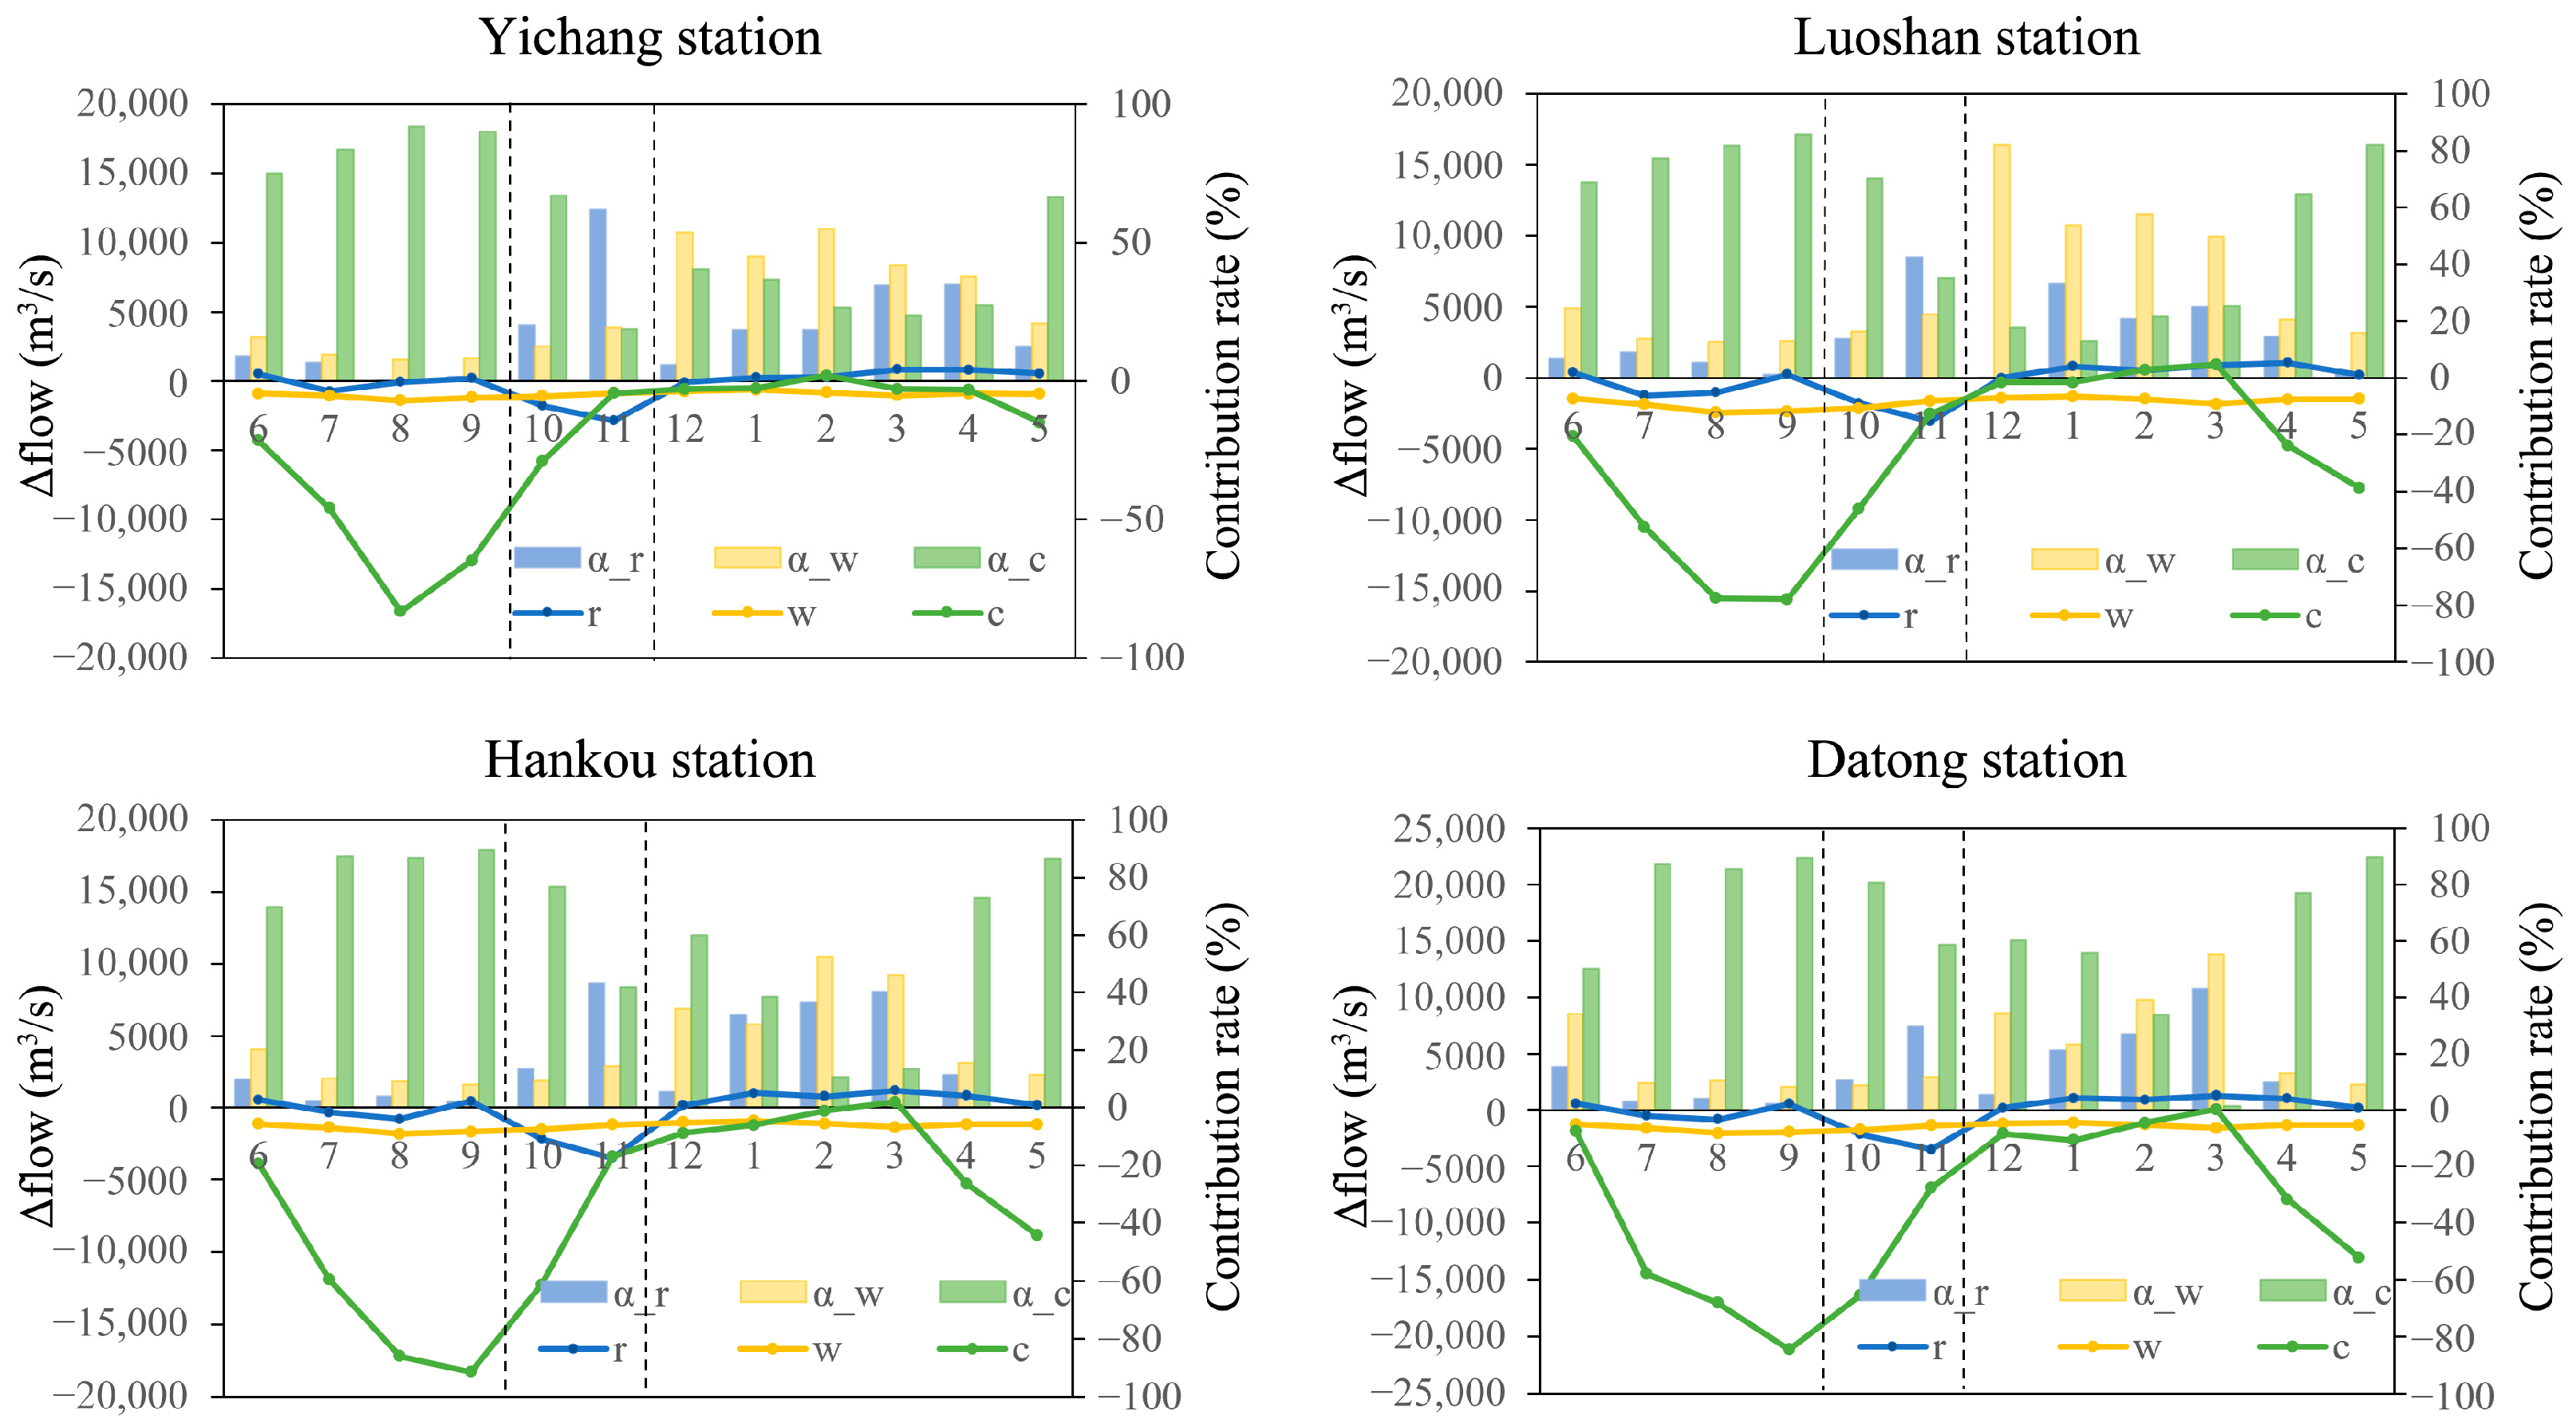
It can be seen in Figure 9 that from June to September 2006, the most important factor causing drought-runoff was meteorological, and its contribution gradually increased, reaching 85.7–92.2% in September. From the upper reaches to the lower reaches, the flow reduction caused by meteorological factors gradually accumulated. For example, in September, the flow reduction caused by meteorological factors in Yichang station, Luoshan station, Hankou station and Datong station (from the upper reaches to the lower reaches) was 7370 m3/s, 13,000 m3/s, 15,600 m3/s, 18,300 m3/s, and 21,100 m3/s, respectively. Due to the intense social and economic activities in the middle and lower reaches of the Yangtze River, the flow reduction caused by the water intake and use also gradually accumulated from the upper reaches to the lower reaches. In 2006, the large-scale reservoir group in the upper reach of the Yangtze River had not yet been constructed and put into operation, and the Three Gorges Reservoir was not operating at full capacity, so the reservoir water supplement effect was weak. Overall, from June to September 2006, the most important factor causing drought was meteorological, followed by the water intake and use, and the reservoir operation and regulation had the least impact on the flow.
Figure 9.
Impacts and contribution rates of meteorology, reservoirs, and water intake and use on drought-runoff in 2006.
From October to November 2006, the reservoirs entered the water storage stage. The flow reduction caused by reservoir operation and regulation reached 1770–2170 m3/s in October and 2850–3510 m3/s in November. At this time, although the impact of meteorology on flow was weakening, it was still relatively large. In October, the flow reduction caused by meteorological factors at the four representative stations was 5780–16,400 m3/s. Drought-runoff during this stage was mainly caused by the combined effects of meteorological factors and reservoir operation and regulation. Overall, reservoir operation and regulation had the greatest contribution to drought-runoff at Yichang station, Luoshan station, and Hankou station, followed by meteorological factors and the water intake and use.
From December 2006 to March 2007, the meteorological drought eased, the reservoirs entered the water supplement stage, and the drought-runoff situation tended to be stable. Overall, water intake and use had the greatest impact on flow during this stage. However, after April, meteorological drought occurred again. By May, the flow reduction caused by meteorological factors at Yichang station, Luoshan station, Hankou station, and Datong station reached 2980 m3/s, 7740 m3/s, 8840 m3/s, and 13,100 m3/s respectively. At this time, the reservoir storage was significantly insufficient, and only 170.5 m3/s of water could be supplemented at Datong station, and the Yangtze River basin suffered from drought again. The contribution rates of meteorological factors at Luoshan station, Hankou station, and Datong station reached 82.0%, 86.7%, and 89.7% respectively.
4.3.2. The Drought-Runoff Event in 2022
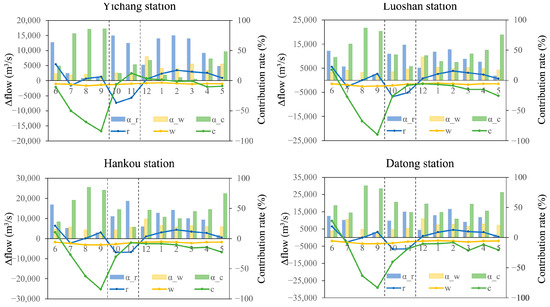
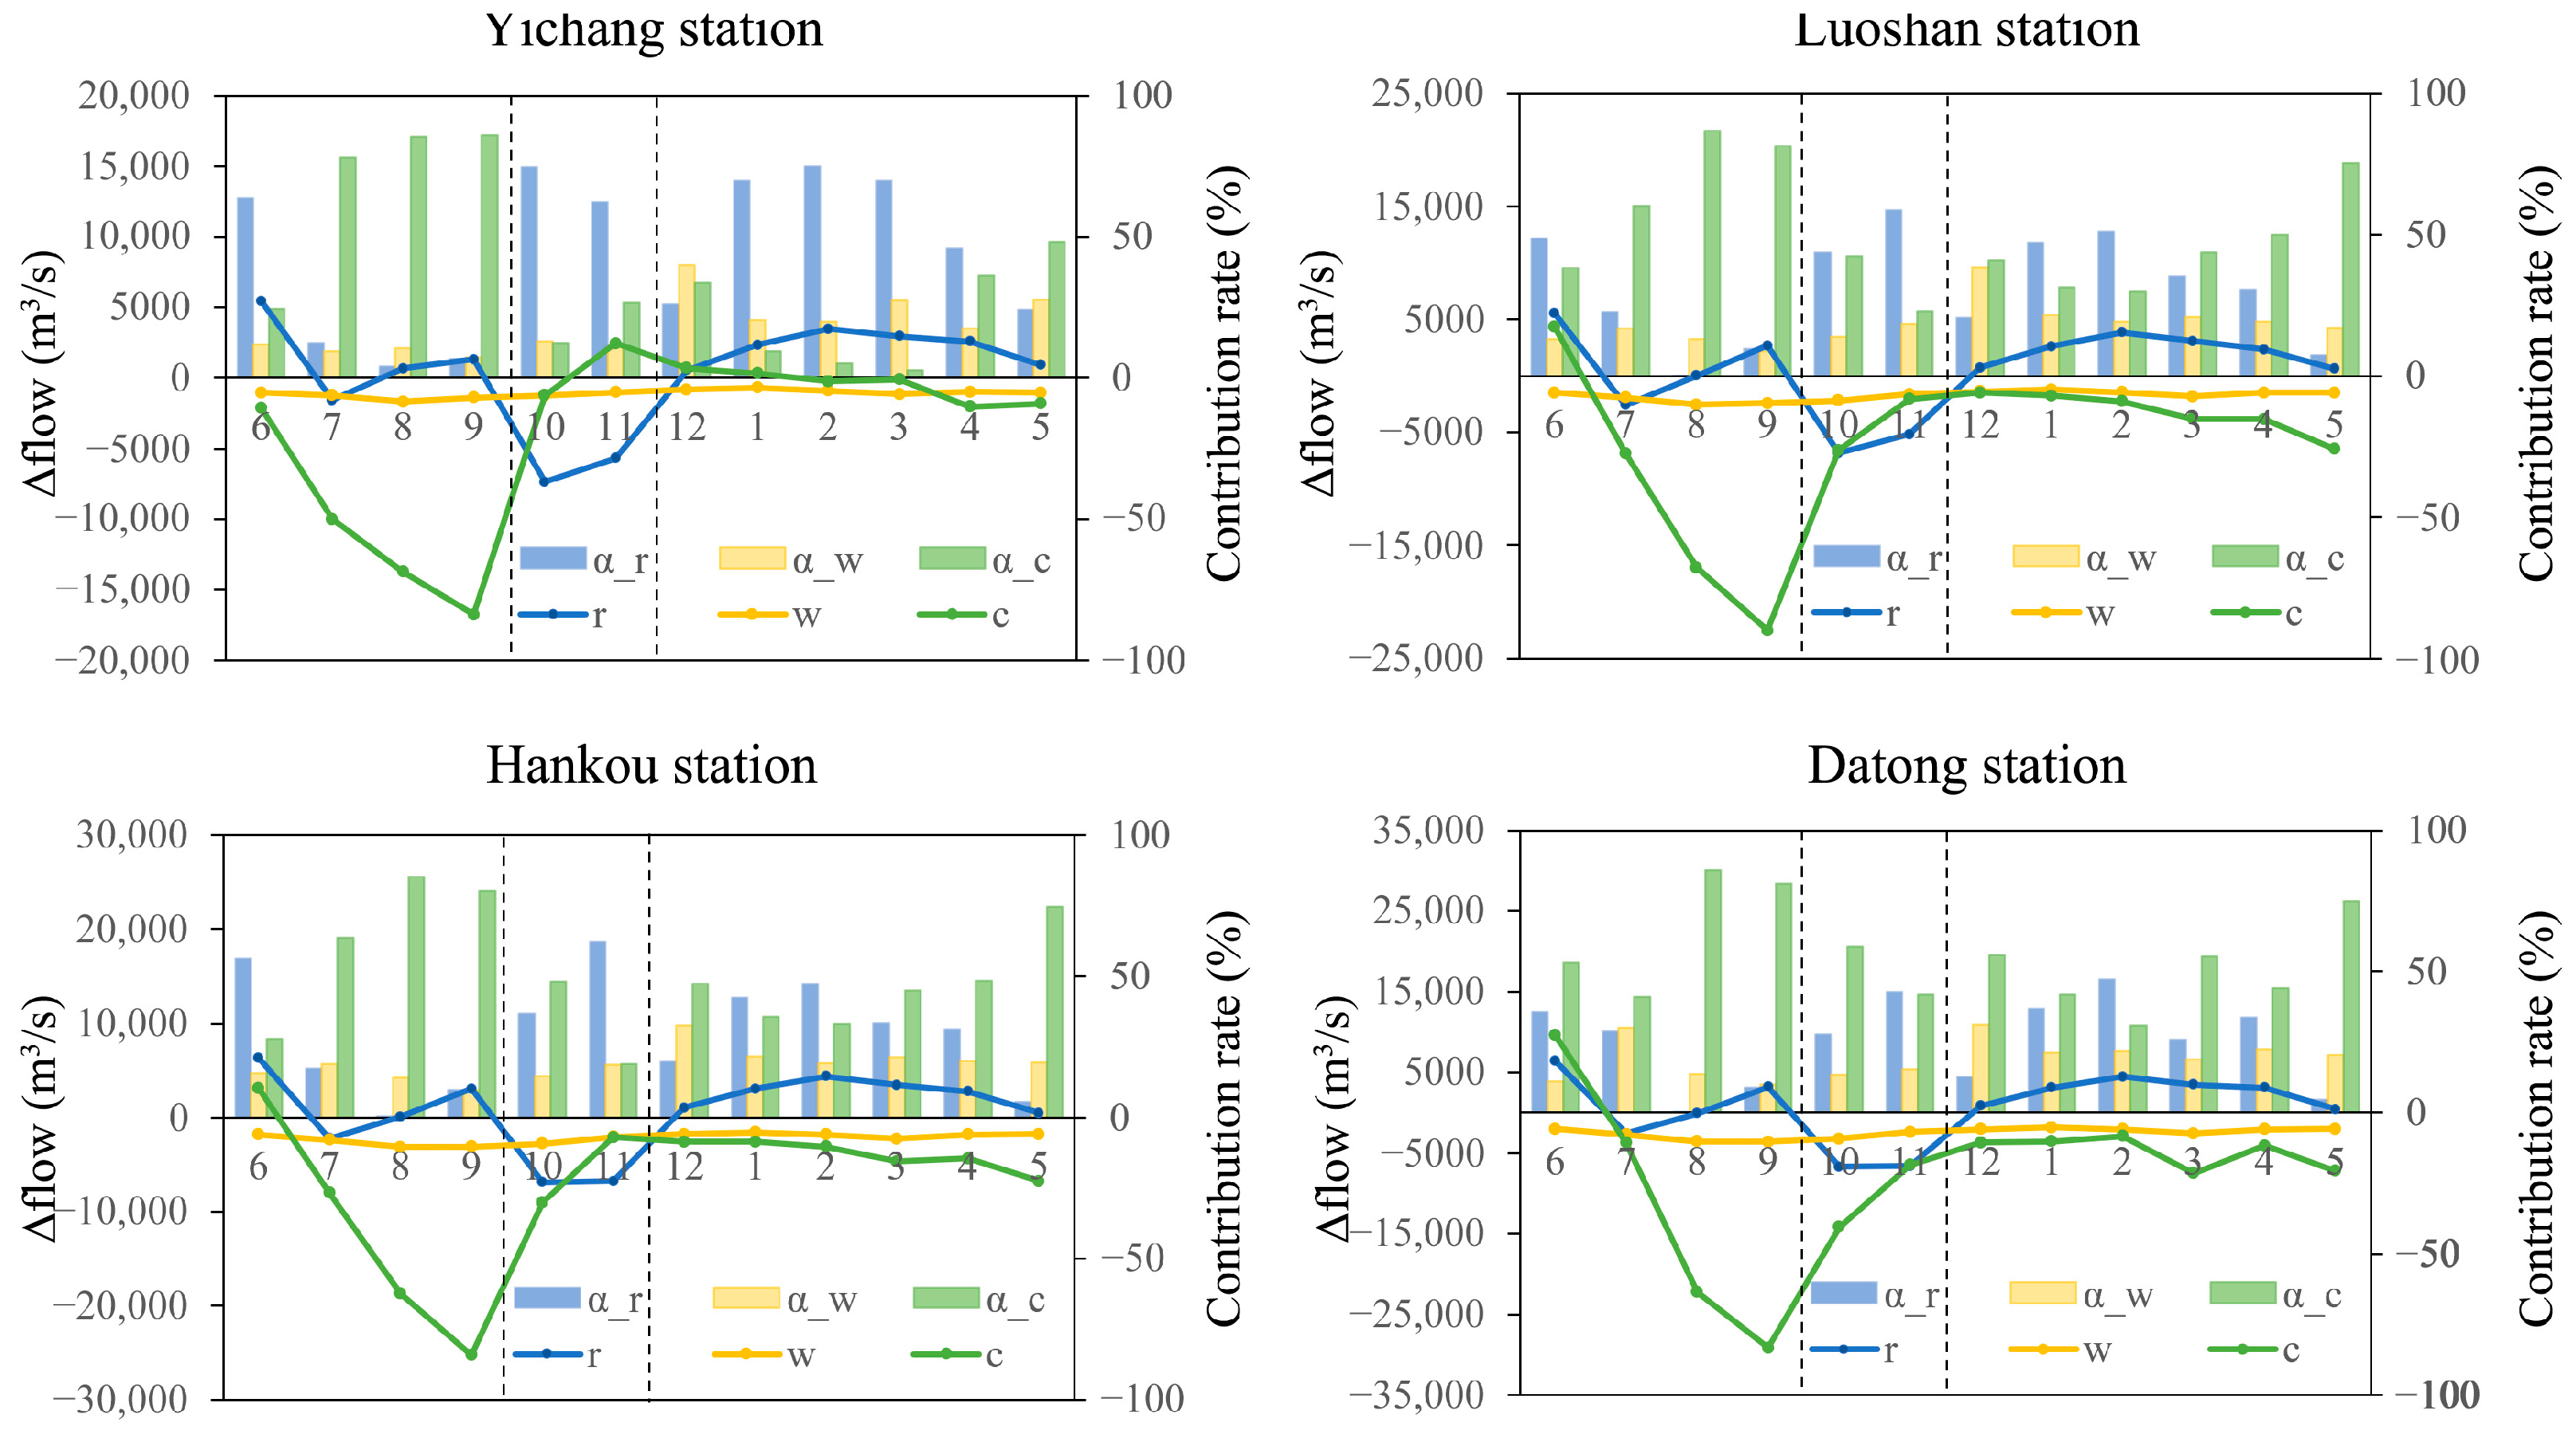
It can be seen in Figure 10 that in June 2022, except for Yichang station, the water inflow was higher than the normal level caused by meteorological factors, and the reservoir group below the Yichang station released 5460–6420 m3/s of water, so the Yangtze River basin was in a relatively waterlogged state in June. This process is defined as the monthly runoff anomaly crossing from >+20% (waterlogging) to <−30% (extreme drought-runoff) within 1 month (June to July 2022), with a runoff change rate of −5200 m3/s per month at Datong station—the fastest drought-flood transition recorded 1956–2024. By July, the flow caused by meteorological factors began to decrease (flow reduction 3200–8900 m3/s). In August, extreme meteorological drought occurred. By September, the flow reduction caused by meteorological factors reached 10,100–29,100 m3/s. From June to September, the Yangtze River Basin experienced a rapid drought-flood abrupt alteration. During the drought stage, the water supplement effect of the reservoir operation and regulation was limited, but in September, the driest month, the reservoir group supplemented 576–3190 m3/s of water, basically offsetting the water intake and use along the river—this supplementation fully offset the flow reduction caused by the water intake and use (320–2980 m3/s) at all four stations, with a net flow supplement of 256–210 m3/s. Overall, the drought-runoff from July to September in 2022 was mainly caused by meteorological factors. At Yichang station, Luoshan station, Hankou station, and Datong station, the contribution rates of meteorological factors reached 78.0–86.0%, 60.3–86.7%, 63.8–85.3%, and 41.2–85.9% respectively.
Figure 10.
Impacts and contribution rates of meteorology, reservoirs, and water intake and use on drought-runoff in 2022.
From October to November in 2022, the reservoirs entered the end-of-flood storage stage. During this stage, the meteorological drought eased, and even at Yichang station, the flow caused by meteorological factors increased. At Luoshan station, Hankou station, and Datong station, meteorological factors still caused flow reduction, but compared with September, the drought-runoff degree was alleviated. Drought was mainly influenced by the combined effects of meteorological factors and the reservoir operation and regulation, with the impact of water intake and use being secondary.
From December 2022 to May 2023 the meteorological drought in the upper reaches of the Yangtze River basically disappeared, while in the middle and lower reaches of the Yangtze River, the flow remained at a relatively dry level caused by meteorological factors; however, the severity of the drought-runoff eased compared with the earlier stage. During this stage, the reservoirs supplemented water to the lower reaches (1800–3500 m3/s), fully offsetting the combined flow reduction caused by meteorological factors and the water intake and use (1600–3200 m3/s) at all the stations. From January to April, the contribution rate of the reservoir operation and regulation was basically the highest, followed by meteorological factors. By May, the amount of water that could be supplemented by the reservoirs to the lower reaches was insufficient, and once again, the most important factor affecting drought-runoff was meteorological.
4.3.3. Comparative Analysis of Drought-Runoff Formation Mechanisms
In the two extreme drought-runoff years (2006 and 2022), the drought-runoff degree was the most severe from June to September, and the primary influencing factor in both years was meteorological (net contribution > 75% via Shapley value analysis). From June to September, the runoff gradually decreased caused by meteorological factors, and the runoff reduction reached the peak in September for both years (21,100 m3/s at Datong in 2006, 29,100 m3/s at Datong in 2022). Although both years showed the common drought-runoff characteristic of “drought in flood season”, there were significant differences in the influencing factors and hydrological processes of drought-runoff. The core similarities and differences are summarized as follows:
- Meteorological driver differences: The 2022 meteorological drought was more severe (basin-average MCI = −2.1 vs. −1.8 in 2006) with a longer duration (177 d vs. 170 d) and wider spatial coverage (95% vs. 92%); 2022 also featured a unique “drought-flood abrupt alteration” (June–July), which was not observed in 2006.
- Reservoir regulation effect differences: In 2006, the upper basin reservoir group was not yet completed, and the Three Gorges Reservoir was not fully operational—the reservoir water supplement was <500 m3/s and was unable to offset any water intake impact. In 2022, the 53 key control reservoirs were fully operational—the reservoir water supplement reached 3190 m3/s in September, fully offsetting the 2980 m3/s flow reduction caused by water intake, with a net flow supplement of 210 m3/s.
- Water intake impact differences: The water intake in 2022 was significantly higher than in 2006 (3200 m3/s vs. 2100 m3/s at Datong in September) due to socioeconomic development, but its impact was fully offset by reservoir supplementation in 2022, while it was an additional drought-runoff driver in 2006.
- Post-flood season (Oct–Nov) differences: In 2006, meteorological factors still dominated drought-runoff (contribution > 40%) in Oct–Nov; in 2022, meteorological drought eased (MCI from −2.3 to −1.2), and drought-runoff was driven by the combined effects of meteorological factors and reservoir storage (each ~40%).
- Non-flood season (Dec–May) differences: In 2006, reservoir storage was insufficient after April, leading to a recurrence of meteorological drought-runoff (contribution > 80%); in 2022, reservoir supplementation remained sufficient until April, fully offsetting meteorological and water-intake impacts, with drought-runoff only recurring in May due to reduced reservoir storage.
From October to November, the reservoir group entered the end-of-flood storage stage, and reservoir operation led to runoff reduction in both years. However, in October 2006, the impact of meteorological factors on runoff did not weaken, and the most important factor causing drought was still meteorological, followed by the reservoir operation and regulation and the water intake and use. At the end of the flood season in 2022, the meteorological drought eased, and drought was mainly influenced by the combined effects of meteorological factors and the reservoir operation and regulation.
From December to May of the following year, the water supplement from the reservoir group to the lower reaches effectively alleviated the impact of drought. The impact of reservoirs on the runoff basically reached the peak in February or March, and then the amount of supplementary water gradually decreased. Overall, there were significant differences in the influencing factors of drought-runoff between 2006 and 2022. Before March 2006, the impact of meteorological factors and reservoirs on drought were very weak, and the impact of water intake and use on runoff accounted for the largest proportion. After April, meteorological drought occurred again, and at this time, the reservoir storage was insufficient, so the impact of meteorological factors accounted for the largest proportion. However, in April 2022, the meteorological drought tended to be stable, and the water supplement capacity of reservoirs was sufficient to offset the runoff reduction caused by meteorological factors and the water intake and use.
5. Discussion
5.1. Advantages of the Proposed Drought-Runoff Discrimination Criteria
The basin-wide three-level quantitative discrimination criteria for drought-runoff proposed in this study have significant advantages compared with existing single-indicator methods (SPI/SPEI/SSI) and non-graded identification approaches. Unlike single-indicator methods that focus on local hydrological/meteorological conditions, the proposed criteria take the simultaneous flow frequency of three key mainstream stations (upper/middle/lower reaches) as the core indicator, with a temporal correlation coefficient of 0.89 (p < 0.01) and a simultaneous occurrence rate of 92% among stations—this ensures the identification of basin-wide drought-runoff events, avoiding misclassification of local droughts as basin-wide events (e.g., the 2011 local drought in the middle reach was correctly identified as severe drought-runoff rather than extreme by this study). The criteria select June-November (the main flood season and drought-runoff period of the Yangtze River Basin) as the analysis period, and define the three-level hazard standards based on Chinese hydrological practice (GB 50201-2014) and historical socio-ecological impacts—this makes the criteria more in line with the actual hydrological characteristics of the Yangtze River Basin, compared with SPI/SPEI which are based on fixed time scales (1/3/6 months) and lack seasonal targeting. The sensitivity analysis of frequency thresholds (97% vs. 98%, 94% vs. 95%, 89% vs. 90%) showed that the event classification results were completely consistent with the original thresholds; the criteria use easily accessible mainstream flow data, which can be directly applied in the operational monitoring of the Yangtze River Basin by hydrological departments, compared with complex multi-indicator coupling models that are difficult to popularize.
Table 4 shows the systematic comparison between the proposed drought-runoff discrimination criteria and four commonly used drought indices (SPI, SPEI, SSI, MCI), clarifying the added value of this study.
Table 4.
Systematic comparison between the proposed drought-runoff discrimination criteria and existing drought indices.
5.2. Comparison with Extreme Drought-Runoff Events in Other River Basins
The extreme drought-runoff events in the Yangtze River Basin (2006, 2022) have both common characteristics and unique features compared with extreme drought-runoff events in other large monsoon river basins worldwide (e.g., the Mekong, the Ganges, and the Amazon). All the extreme drought-runoff events in the monsoon river basins are dominated by meteorological factors (low precipitation + high temperature) in the flood season, with the Western Pacific Subtropical High (WPSH) and monsoon anomalies as the core large-scale circulation drivers [46,47]. For example, the 2019 extreme drought-runoff in the Mekong Basin was also caused by the northward shift of the WPSH and reduced monsoon precipitation, with meteorological factors contributing > 80% [46]. Meanwhile, the Yangtze River Basin has its unique features, such as (1) Strong human intervention: The 53 key control reservoirs in the Yangtze River Basin account for 89% of the total regulation storage capacity, which can effectively offset the impact of water intake and alleviate drought-runoff. This is significantly different from the Mekong and Ganges Basins where the reservoir regulation capacity is weak (<30% of total storage) [46,47]; (2) Compound extreme characteristics: The 2022 event featured a unique “drought-flood abrupt alteration”, which has not been reported in other monsoon river basins in recent decades—this is related to the enhanced variability of the East Asian Monsoon under global warming; (3) Basin-wide hydrological coherence: The Yangtze River Basin has a high temporal correlation coefficient (0.89) of runoff among key stations, leading to simultaneous basin-wide drought-runoff—this is different from the Amazon Basin where hydrological heterogeneity is high, and drought-runoff events are mostly local [48].
5.3. Scientific and Policy Implications of This Study
This study quantified the seasonal variation of the contribution of meteorological factors, the reservoir operation, and the water intake to drought-runoff, and found that the reservoir operation can transform from a drought-runoff driver (flood season storage) to a mitigation factor (non-flood season supplementation)—this enriches the theoretical understanding of hydrological drought evolution under intense human activities in large river basins. The 2022 event was identified as a typical compound extreme event (extreme low precipitation + extreme high temperature + prolonged duration), which amplifies the hydrological response of the basin—this provides a new perspective for the study of drought-runoff in the context of global warming, i.e., paying attention to the combined impact of multiple meteorological extremes rather than to a single factor. The proposed basin-wide drought-runoff analysis framework (discrimination criteria + multi-factor attribution) can be applied to other large monsoon river basins with significant human intervention (e.g., the Mekong, the Ganges) by adjusting the frequency thresholds and key stations according to local hydrological characteristics—this improves the generality of the research results.
Based on the study results, the reservoir joint dispatch rules of the Yangtze River Basin should be optimized—increase water storage in the early flood season (June) when the precipitation is sufficient and increase water supplementation in the late flood season (September) and non-flood season (Dec–May) to offset the meteorological and water intake impacts. For example, the reservoir group can increase the water supplement by 500–1000 m3/s in September to further alleviate the peak drought-runoff. The proposed three-level discrimination criteria can be integrated into the existing drought early warning system of the Yangtze River Basin, with the 90%/95%/98% flow frequency as the early warning thresholds for relatively severe/severe/extreme drought-runoff—this improves the precision and operability of early warning. Aiming at the different characteristics of drought-runoff in different periods, targeted adaptation strategies should be formulated: (1) Flood season (Jun–Sep). Focus on mitigating the impact of meteorological factors, such as optimizing agricultural irrigation schedules to reduce water use; (2) Post-flood season (Oct–Nov). Focus on coordinating reservoir storage and water supply, avoiding excessive storage leading to aggravated drought-runoff; (3) Non-flood season (Dec–May). Focus on maximizing reservoir water supplementation to ensure basic water supply and ecological flow. The proposed criteria and dispatch strategies can be applied to other monsoon river basins (e.g., the Mekong) by adjusting the local parameters—this provides a reference for the global response to hydrological drought in large river basins under the background of climate change and human activities.
5.4. Study Limitations
This study focuses on basin-wide drought-runoff events and selects only mainstream key stations, ignoring the hydrological heterogeneity of tributaries (e.g., Han River, Jialing River)—tributary drought-runoff may have a local impact on water supply and ecology, which needs to be studied in depth. Moreover, the discrimination criteria proposed in this study are only applicable to the summer–autumn drought-runoff (June–November) of the Yangtze River Basin, and cannot identify the spring drought-runoff (January–May)—subsequent research needs to establish spring drought-runoff discrimination criteria based on seasonal hydrological characteristics.
5.5. External Validation
To verify the rationality and applicability of the proposed drought-runoff discrimination criteria, external validation was conducted by correlating the identified drought-runoff years with documented socio-ecological impact records (agricultural losses, water supply disruptions, and ecological impacts) of the Yangtze River Basin from 1956 to 2024.
The identified extreme drought-runoff years (2006, 2022) had the most severe agricultural losses in the study period—2006 caused a 15% reduction in grain production in the middle and lower reaches, and 2022 caused a 20% reduction (vs. multi-year average); severe drought-runoff years (1972, 2011) caused a 8–12% reduction in grain production; relatively severe drought-runoff years (1959, 1992, 2024) caused a 3–5% reduction—the loss degree is positively correlated with the drought-runoff severity level identified by the criteria (correlation coefficient = 0.92, p < 0.01).
Extreme drought-runoff years (2006, 2022) caused water supply disruptions in 23 and 31 cities in the basin, respectively; severe drought-runoff years (1972, 2011) caused disruptions in 12 and 15 cities; relatively severe drought-runoff years caused disruptions in three to five cities—the number of water supply disruptions is consistent with the drought-runoff severity level.
Extreme drought-runoff years (2006, 2022) led to a 40% and a 50% reduction in the water area of Dongting/Poyang Lakes, respectively, and a significant decline in aquatic organism diversity (30% and 35% reduction in fish species); severe drought-runoff years led to a 20–25% reduction in lake water area; relatively severe drought-runoff years led to a <10% reduction—the ecological impact degree is positively correlated with the drought-runoff severity level.
The external validation results show that the drought-runoff severity level identified by the proposed criteria is highly consistent with the actual socio-ecological impact records of the Yangtze River Basin, which verifies the rationality, reliability and applicability of the criteria.
6. Conclusions
Based on the literature research and the analysis of historical drought-runoff events, this study obtained the quantitative discrimination criteria of drought-runoff through the frequency analysis of typical stations. Using the discrimination criteria of drought-runoff, the historical drought-runoff events in the Yangtze River Basin were identified. Then, the meteorological characteristics of extreme drought-runoff events were analyzed, and the main formation mechanisms of extreme drought events were further clarified. The main research conclusions are as follows:
- (1)
- Established a basin-wide three-level quantitative discrimination criteria for drought-runoff and identified historical events from 1956 to 2024. The criteria take the June–November flow frequency of three key mainstream stations (Yichang/Hankou/Datong) as the core indicator, defining extreme (frequency > 98%), severe (frequency > 95% for 5 consecutive months), and relatively severe (frequency > 90% for 4 consecutive months) drought-runoff. The sensitivity analysis and external validation show that the criteria have high robustness and applicability. Based on the criteria, the Yangtze River Basin experienced two basin-wide extreme drought-runoff events (2006 and 2022), two severe drought-runoff events (1972 and 2011), and three relatively severe drought-runoff events (1959, 1992, and 2024) from 1956 to 2024; summer–autumn consecutive drought-runoff is the most common type in the basin.
- (2)
- Clarified the meteorological characteristics of typical extreme drought-runoff events (2006 and 2022) and the statistical basis of the “alleviating trend” of meteorological drought. The Mann-Kendall test was used to analyze the annual average MCI value of the Yangtze River Basin from 1956 to 2024, and the results showed a significant alleviating trend of meteorological drought, which is consistent with climate change projections. Typical extreme drought-runoff events (2006 and 2022) are characterized by sustained low precipitation and continuous high temperature (compound meteorological extremes): the 2006 event lasted 170 days with basin-average MCI = −1.8, and the middle reach was the most severely affected; the 2022 event lasted 177 days with basin-average MCI = −2.1, featuring a unique “drought-flood abrupt alteration” (June–July), and the Dongting/Poyang Lakes were the most severely affected.
- (3)
- Revealed the formation mechanism of extreme drought-runoff events and the seasonal variation of factor contributions under human intervention. Meteorological factors are the primary driver of drought-runoff in the Yangtze River Basin, with the reservoir operation and riverine water intake as secondary factors; the contribution of each factor shows significant seasonal variation. Meteorological factors dominate drought-runoff in the flood season in both 2006 and 2022. In post-flood season, the reservoirs enter the storage stage, and drought-runoff is driven by the combined effects of meteorological factors and the reservoir operation. In non-flood season, the reservoirs enter the supplementation stage, and the water supplement effectively alleviates drought-runoff. The water intake in 2022 is significantly higher than in 2006, but its impact is fully offset by reservoir supplementation in 2022, while it is an additional drought-runoff driver in 2006—this highlights the important role of reservoir joint dispatch in mitigating the drought-runoff under socioeconomic development.
In summary, this study constructs a basin-wide drought-runoff analysis framework applicable to large monsoon river basins with intense human intervention, which provides a robust scientific basis for precise drought-runoff prediction and the development of targeted adaptation strategies in the Yangtze River Basin and other similar basins worldwide.
Author Contributions
Conceptualization, X.G., J.B. and W.L.; methodology, J.B., W.L. and X.C.; validation, X.G., J.B., W.L. and X.C.; formal analysis, W.L. and X.C.; investigation, W.L.; resources, X.G., J.B. and X.C.; data curation, W.L. and X.C.; writing—original draft preparation, W.L.; writing—review and editing, W.L. and J.B.; visualization, W.L. and X.C.; supervision, X.G. and J.B.; project administration, X.G. and J.B.; funding acquisition, X.G. All authors have read and agreed to the published version of the manuscript.
Funding
This research was funded by the National Key Research and Development Program of China (2023YFC3206001), and the Hubei Provincial Natural Science Foundation of China (2024AFB054).
Data Availability Statement
The data supporting the findings of this study are not publicly available due to the confidential nature of the hydrological and reservoir operation data. Meteorological data (precipitation/temperature) from 171 stations are available from the Meteorological Data Sharing Service Network of China Meteorological Administration (http://data.cma.cn/ (accessed on 25 March 2026)); hydrological and reservoir operation data are restricted in order to comply with confidentiality obligations of the Changjiang Water Resources Commission.
Conflicts of Interest
The authors declare no conflicts of interest.
Abbreviations
The following abbreviations are used in this manuscript:
| MCI | Meteorological Drought Comprehensive Index |
| CI | Meteorological Drought Index |
| SSI | Standardized Streamflow Index |
| SPI | Standardized Precipitation Index |
| SPEI | Standardized Precipitation Evapotranspiration Index |
| SWDI | Soil Water Deficit Index |
| NP | North Pacific Teleconnection Pattern Index |
| TSNI | Sunspot Number Index |
| WPWPSI | Western Pacific Warm Pool Intensity Index |
| ENSO | El Niño-Southern Oscillation Index |
| NAO | North Atlantic Oscillation Index |
| SOI | Southern Oscillation Index |
| WPSHII | Western Pacific Subtropical High Intensity Index |
| SCSSHII | South China Sea Subtropical High Intensity Index |
| R2 | determination coefficient |
| VIF | Variance Inflation Factor |
| RMSE | Root Mean Square Error |
Appendix A
Table A1.
An analysis of the drought-runoff grade discrimination in the Yangtze River Basin in 2006.
Table A2.
An analysis of the drought-runoff grade discrimination in the Yangtze River Basin in 2022.
References
- Dong, L.; Jiang, T.; Wang, X. Impact of large-scale circulation anomalies on the 2022 extreme drought in the Yangtze River Basin. Atmos. Ocean. Sci. Lett. 2022, 15, 100968. [Google Scholar]
- Wang, H.; Li, M.; Zhang, Y. Projection of future extreme low flows in the Yangtze River Basin under CMIP6 scenarios. J. Hydrol. Eng. 2023, 28, 04023002. [Google Scholar]
- Zhang, D.; Zhang, Q.; Qiu, J.; Bai, P.; Liang, K.; Li, X. Intensification of hydrological drought due to human activity in the middle reaches of the Yangtze River, China. Sci. Total Environ. 2018, 637–638, 1432–1442. [Google Scholar] [CrossRef] [Scilit]
- Xu, C.; Xu, Y.; Mo, Y.; Ji, M.; Liu, Y.; Zhu, S. Spatio-temporal variations of heat extremes across the yangtze river delta during 2001–2023 based on remotely sensed seamless air temperature. Environ. Res. 2025, 268, 120824. [Google Scholar] [CrossRef] [Scilit]
- Yao, Y.; Zhang, Q.; Liu, J. A new drought index for characterizing hydrological drought in the Yangtze River Basin. Hydrol. Sci. J. 2023, 68, 1298–1312. [Google Scholar]
- Xu, C.; Zhang, L.; Yang, T. Assessment of hydrological drought vulnerability in the Yangtze River Basin. Sustainability 2023, 15, 6689. [Google Scholar]
- Chen, Y.; Liu, J.; Zhang, Q. Quantifying the impacts of climate change and human activities on low flows in the upper Yangtze River Basin. Hydrol. Sci. J. 2020, 65, 2183–2195. [Google Scholar]
- Li, Y.; Chen, D.; Zhang, H. Drought characteristics and their links to large-scale climate indices in the Yangtze River Basin. Clim. Dyn. 2024, 62, 987–1005. [Google Scholar]
- Farahmand, A.; Aghakouchak, A. A generalized framework for deriving nonparametric standardized drought indicators. Adv. Water Resour. 2015, 76, 140–145. [Google Scholar] [CrossRef] [Scilit]
- Tijdeman, E. Drought characteristics derived based on the standardized streamflow index: A large sample comparison for parametric and nonparametric methods. Water Resour. Res. 2020, 56, e2019WR026315. [Google Scholar] [CrossRef] [Scilit]
- Zhang, L.; Xu, C.; Yang, T. Responses of extreme low flows to climate change in the middle Yangtze River Basin. Theor. Appl. Climatol. 2021, 144, 1169–1182. [Google Scholar]
- Singh, V.P. Pearson-III distribution for hydrologic frequency analysis: A review. J. Hydrol. Eng. 2014, 19, 04014075. [Google Scholar]
- Cammalleri, C. A unified streamflow drought index for both perennial and intermittent rivers at global scale. Hydrol. Sci. J. 2024, 69, 1848–1859. [Google Scholar] [CrossRef] [Scilit]
- Wang, W.; Cui, W.; Wang, P. Hydrological drought identification based on multi-indicator fusion in arid regions. J. Hydrol. 2019, 577, 123987. [Google Scholar]
- Zhao, Y.; Zhang, Q.; Liu, S. Comparative analysis of drought indices for hydrological drought monitoring in the Yangtze River Basin. J. Hydrol. Hydromech. 2023, 71, 456–467. [Google Scholar]
- Huang, A.; Gao, G.; Yao, L.; Yin, S.; Li, D.; Do, H.; Fu, B.-J. Spatiotemporal variations of inter-and intra-annual extreme streamflow in the Yangtze River Basin. J. Hydrol. 2024, 629, 130634. [Google Scholar] [CrossRef] [Scilit]
- Li, X.; Zhang, Y.; Wang, H. Heatwave-drought compound events in the Yangtze River Basin: Spatiotemporal patterns and drivers. Clim. Res. 2021, 82, 207–222. [Google Scholar]
- Chen, S.; Wang, Y.; Li, J. Optimization of hydrological drought identification methods in complex river basins. Water Resour. Manag. 2023, 37, 1689–1706. [Google Scholar]
- Guo, Y.; Shen, Y.; Li, J. A modified drought index for extreme drought-runoff identification. J. Hydrol. Eng. 2024, 29, 04023028. [Google Scholar]
- Raczyński, K.; Dyer, J. Development of an objective low flow identification method using breakpoint analysis. Water 2022, 14, 2212. [Google Scholar] [CrossRef] [Scilit]
- Xu, L.; Jiang, T.; Wang, X. Statistical methods for comprehensive drought identification in large river basins. Hydrol. Process. 2022, 36, e14289. [Google Scholar]
- Guo, Y.; Shen, Y.; Wang, L. Evaluation of the Meteorological Drought Comprehensive Index (MCI) in China. Theor. Appl. Climatol. 2019, 135, 1107–1118. [Google Scholar]
- Huang, Q.; Zhang, L.; Liu, C. Spatiotemporal variation in the Meteorological Drought Comprehensive Index (MCI) in northern China during 1961–2023. J. Arid Environ. 2022, 201, 104789. [Google Scholar]
- Zhang, H.; Chen, Y.; Liu, J. Spatiotemporal evolution of drought indicators in the Yangtze River Basin under climate change. Glob. Planet. Change 2023, 219, 103892. [Google Scholar]
- Naim, M.; Bonaccorso, B. Enhancing drought identification and characterization in the Tensift River Basin (Morocco): A comparative analysis of data and tools. Water 2025, 12, 334. [Google Scholar] [CrossRef] [Scilit]
- Wang, W.; Cui, W.; Wang, P. Evaluation and fusion of multi-source evapotranspiration data for drought monitoring in China. J. Hydrol. 2020, 588, 125112. [Google Scholar] [CrossRef] [Scilit]
- Katipoğlu, O.M. Prediction of streamflow drought index for short-term hydrological drought in the semi-arid Yesilirmak Basin using wavelet transform and artificial intelligence techniques. Sustainability 2022, 15, 1109. [Google Scholar] [CrossRef] [Scilit]
- Li, X.; Zhang, Y.; Wang, H. Soil moisture deficit and its impact on drought-runoff in the Yangtze River Basin. Agric. Water Manag. 2022, 265, 107589. [Google Scholar]
- Mohammadia, K.; Wang, G. Impact matters: Detection and early warning of agriculturally impactful flash droughts. Bull. Am. Meteorol. Soc. 2025, 106, e752. [Google Scholar] [CrossRef] [Scilit]
- Chen, D.; Li, Y.; Zhang, H. Human activities and climate change impacts on hydrological drought in the Yangtze River Basin. J. Environ. Manag. 2021, 290, 112567. [Google Scholar]
- Wang, H.; Chen, D.; Zhang, Y. Topographic effects on precipitation distribution in the Yangtze River Basin. Atmos. Res. 2022, 276, 105987. [Google Scholar]
- Zhao, Q.; Zhang, L.; Liu, C. Large-scale atmospheric circulation impacts on drought in the Yangtze River Basin. Int. J. Climatol. 2022, 42, 3567–3584. [Google Scholar]
- Zhou, G.; Zhao, Y.; Liu, S. Long-term trends of meteorological drought in the Yangtze River Basin during 1961–2020. J. Clim. 2022, 35, 3869–3884. [Google Scholar]
- Xu, Y.; Zhang, Q.; Liu, J. Long-term trends of extreme precipitation and temperature in the Yangtze River Basin. J. Clim. 2023, 36, 3457–3476. [Google Scholar]
- Chen, D.; Li, Y.; Zhang, H. Linkages between ENSO and drought in the Yangtze River Basin: A meta-analysis. Int. J. Climatol. 2022, 42, 7689–7706. [Google Scholar]
- Guo, Y.; Shen, Y.; Li, J. Heatwave characteristics and their contribution to drought-runoff in the Yangtze River Basin. J. Geophys. Res. Atmos. 2024, 129, e2023JD039876. [Google Scholar]
- Zhang, H.; Chen, Y.; Liu, J. Effects of reservoir operation on extreme low flows in the middle and lower Yangtze River Basin. J. Water Resour. Plan. Manag. 2022, 148, 04022045. [Google Scholar]
- Liu, Y.; Zhang, Y.; Li, X. Spatiotemporal patterns of meteorological drought in the Yangtze River Basin during 1961–2015. Nat. Hazards 2019, 97, 1567–1585. [Google Scholar]
- Zhao, Q.; Zhang, L.; Liu, C. Assessment of drought vulnerability in the Yangtze River Basin using a fuzzy comprehensive evaluation method. Sustainability 2021, 13, 6289. [Google Scholar]
- Li, M.; Zhang, Y.; Wang, G. Attribution analysis of extreme low flow changes in the Yangtze River Basin using the Budyko framework. J. Hydrol. Hydromech. 2023, 71, 312–323. [Google Scholar]
- Xu, L.; Jiang, T.; Wang, X. Hydrological frequency analysis for drought-runoff threshold determination. J. Hydrol. Eng. 2022, 27, 04022019. [Google Scholar]
- Chen, S.; Wang, Y.; Li, J. Comparison of drought indices for monitoring agricultural drought in the Yangtze River Basin. Agric. Water Manag. 2020, 239, 106238. [Google Scholar]
- Liu, H.; Zhang, Q.; Xu, Z. Temporal and spatial variations of low flow in the Yangtze River Basin during 1956–2016. Hydrol. Res. 2019, 50, 1521–1535. [Google Scholar]
- Chen, Y.; Liu, J.; Zhang, Q. Multi-scale drought-runoff characteristics in the Yangtze River Basin. Hydrol. Sci. J. 2023, 68, 2345–2358. [Google Scholar]
- Wang, Z.; Li, X.; Zhang, Y. Anthropogenic exacerbation in dry-hot probability and consequential record-shattering droughts in the middle and lower reaches of the Yangtze River. J. Geophys. Res. Atmos. 2024, 129, e2024JD041603. [Google Scholar]
- Zhang, M.; Liu, J. Extreme drought-runoff events in the Mekong River Basin: Characteristics and drivers. J. Hydrol. 2023, 621, 130021. [Google Scholar]
- Singh, R.; Jain, S. Hydrological drought in the Ganges River Basin: Impact of climate change and human activities. Hydrol. Process. 2022, 36, e14412. [Google Scholar]
- Costa, M.H.; de Oliveira, P.H. Spatial heterogeneity of hydrological drought in the Amazon Basin. Int. J. Climatol. 2023, 43, 2689–2706. [Google Scholar]

Disclaimer/Publisher’s Note: The statements, opinions and data contained in all publications are solely those of the individual author(s) and contributor(s) and not of MDPI and/or the editor(s). MDPI and/or the editor(s) disclaim responsibility for any injury to people or property resulting from any ideas, methods, instructions or products referred to in the content. |
© 2026 by the authors. Licensee MDPI, Basel, Switzerland. This article is an open access article distributed under the terms and conditions of the Creative Commons Attribution (CC BY) license.