1. Introduction
Population growth has led to changes in land use in urban areas, as increased housing demands result in larger areas of impervious surfaces in former natural land zones. It has been widely demonstrated that these changes increase runoff volumes in cities, due to precipitation events [
1,
2,
3,
4]. This increase leads to floods in urban areas, especially in those lacking adequate land management and stormwater drainage systems, whether conventional or of nature-based solutions (NBS). As a result, it has been concluded that traditional water management in sustainable water services is difficult to achieve [
5,
6], especially due to lack of political will to progress in the field. Moreover, when climate change, ecological degradation, human demands, and urbanization are considered, it is necessary to redefine current approaches. Research should be addressed to set up an interconnection between infrastructure systems and services, the circularity of the water cycle, and the implementation of the NBS [
7,
8].
Therefore, accelerated growth of urban areas and climate change are considered major drivers to develop sustainable strategies for stormwater management in cities, including sustainable urban drainage systems (SUDS). Consequently, it is important to establish strategies to choose alternatives that allow for reduction in water volumes and depths during floods [
9]. From this perspective, terms such as sponge cities have been coined, which allow us to manage floods associated with extreme weather events. This involves considerations such as localized rainfall analysis, adaptation of SUDS to complex hydrological environments, and development of a tool for selecting effective SUDS considering environmental conditions. Finally, we should understand the maintenance required for these systems and their associated costs [
10].
Sponge cities have been conceived as solutions for managing flood risk. They are territories with sustainable urban planning that incorporate measures for flood control, the protection of ecosystems and water resources, and quality improvement of surface runoff water [
11]. However, it is necessary for governments to plan and design their territory to absorb water and replicate natural processes. Therefore, legislative support and the availability of economic resources for building the required infrastructure and its subsequent monitoring must be considered [
12].
Additionally, the SUDS have been used to reduce the load of sediments, nutrients, and chemical pollutants before reaching watercourses. Nonetheless, geophysical aspects such as climate, hydrology, soil use and type, and topography, along with legislation, and social, technical, and economic factors must be considered to change the pipes. This can enhance natural processes such as infiltration, evapotranspiration and reuse, paying special attention to quantity, quality, and amenity/biodiversity [
13,
14].
Nowadays, the SUDS have become a novel alternative for stormwater drainage, aiming to reduce peak runoff flows from rainfall events. This allows for improved volume management, preventing system collapse and flooding. Conventional systems are proving to be inadequate for handling increased flows resulting from land-use changes (such as impervious surfaces due to urbanization) and the extreme weather events brought on by climate change. Therefore, the potential benefits of SUDS installation have been evaluated by using hydraulic modeling software EPA SWMM Version 5.1 to generate flood maps in Geographic Information Systems (GIS). This allows for a comparison of flows and water depths produced by a design storm before and after SUDS installation [
1,
15,
16]. Studies have shown that these comparisons result in a reduction in water volume, preventing the overloading of the conventional sewer network after a rainfall event for a given return period [
1,
2,
17].
Similarly, in tropical areas, this problem is exacerbated by intense rainfall over short periods, increasing the need for comprehensive urban water management through solutions designed for recurring critical events and to reduce peak flows [
18]. Among these solutions, bioretention systems have been tested in a tropical region of Southeast Asia, demonstrating that peak flows and pollutants such as nitrogen and phosphorus, including heavy metals, were reduced. However, it is noted that sediments in the systems must be controlled [
19].
Furthermore, the SUDS offer social and environmental benefits; therefore, their implementation requires the involvement of both the public and private sectors. This requires ensuring the participation of local communities in decision-making related to stormwater management [
20]. Thus, to guarantee the effectiveness of SUDS in areas requiring stormwater management, it is necessary to evaluate different scenarios with various typologies to determine the optimal solutions for each area [
20,
21].
Moreover, analytic hierarchy processes have started to be used to select SUDS, because they turn a subjective, bias-prone process into an objective, structured one [
22]. This methodology and other multi-criteria decision-making (MCDM) techniques have been successfully applied to improve the location and design of low impact development (LID) practices in countries such as the United States, Italy, Poland, China, and France. Recently, it has been used at the scale of individual and collective residential lots, helping select specific systems like bioretention cells, infiltration trenches, and rainwater harvesting systems and always adapting them to the changing priorities of the various stakeholders involved [
23].
Colombia is not an exception to this, due to the close connection between city expansion, the rise in surfaces that cannot be penetrated by water, and the rise in water flow in urban areas. Pantoja Cárdenas demonstrated how implementing permeable pavements reduces surface runoff in urban areas, proposing to use them as an efficient alternative to concrete and asphalt [
24]. Similarly, Cárdenas Quintero et al. have modeled rain-runoff transformation scenarios in SUDS projects, indicating that integrated solutions are needed to respond to the challenges of flooding in densely populated urban areas [
25].
At the strategic level, the state, through the Departamento Nacional de Planeación, DNP (National Planning Department), proposed a national roadmap for implementing nature-based solutions (NBS), considering climate variability and ecological restoration as key axes in resilient urban planning [
26]. Also, Pinto et al. argue that the optimal location of NBS in cities can maximize their benefits, both for flood mitigation and the sustainability of urban systems [
27]. This reaffirms the need to redefine traditional approaches to urban water management, promoting integration between gray and green infrastructure in response to the growing impacts of climate change and urbanization.
Consequently, this research aims to evaluate the efficiency of different configurations of SUDS in reducing the peak flows and total runoff volume, under precipitation scenarios for various return periods in a tropical urban basin, with hydrological modeling and a multi-criteria analysis to identify the SUDS that would perform best in the study area. For this purpose, we considered using the analytic hierarchy process (AHP) to incorporate hydrological considerations [
23], the physical and economic constraints that are inherent in established urban environments [
28], and institutional capacity, a key determinant of long-term sustainability [
22].
3. Materials and Methods
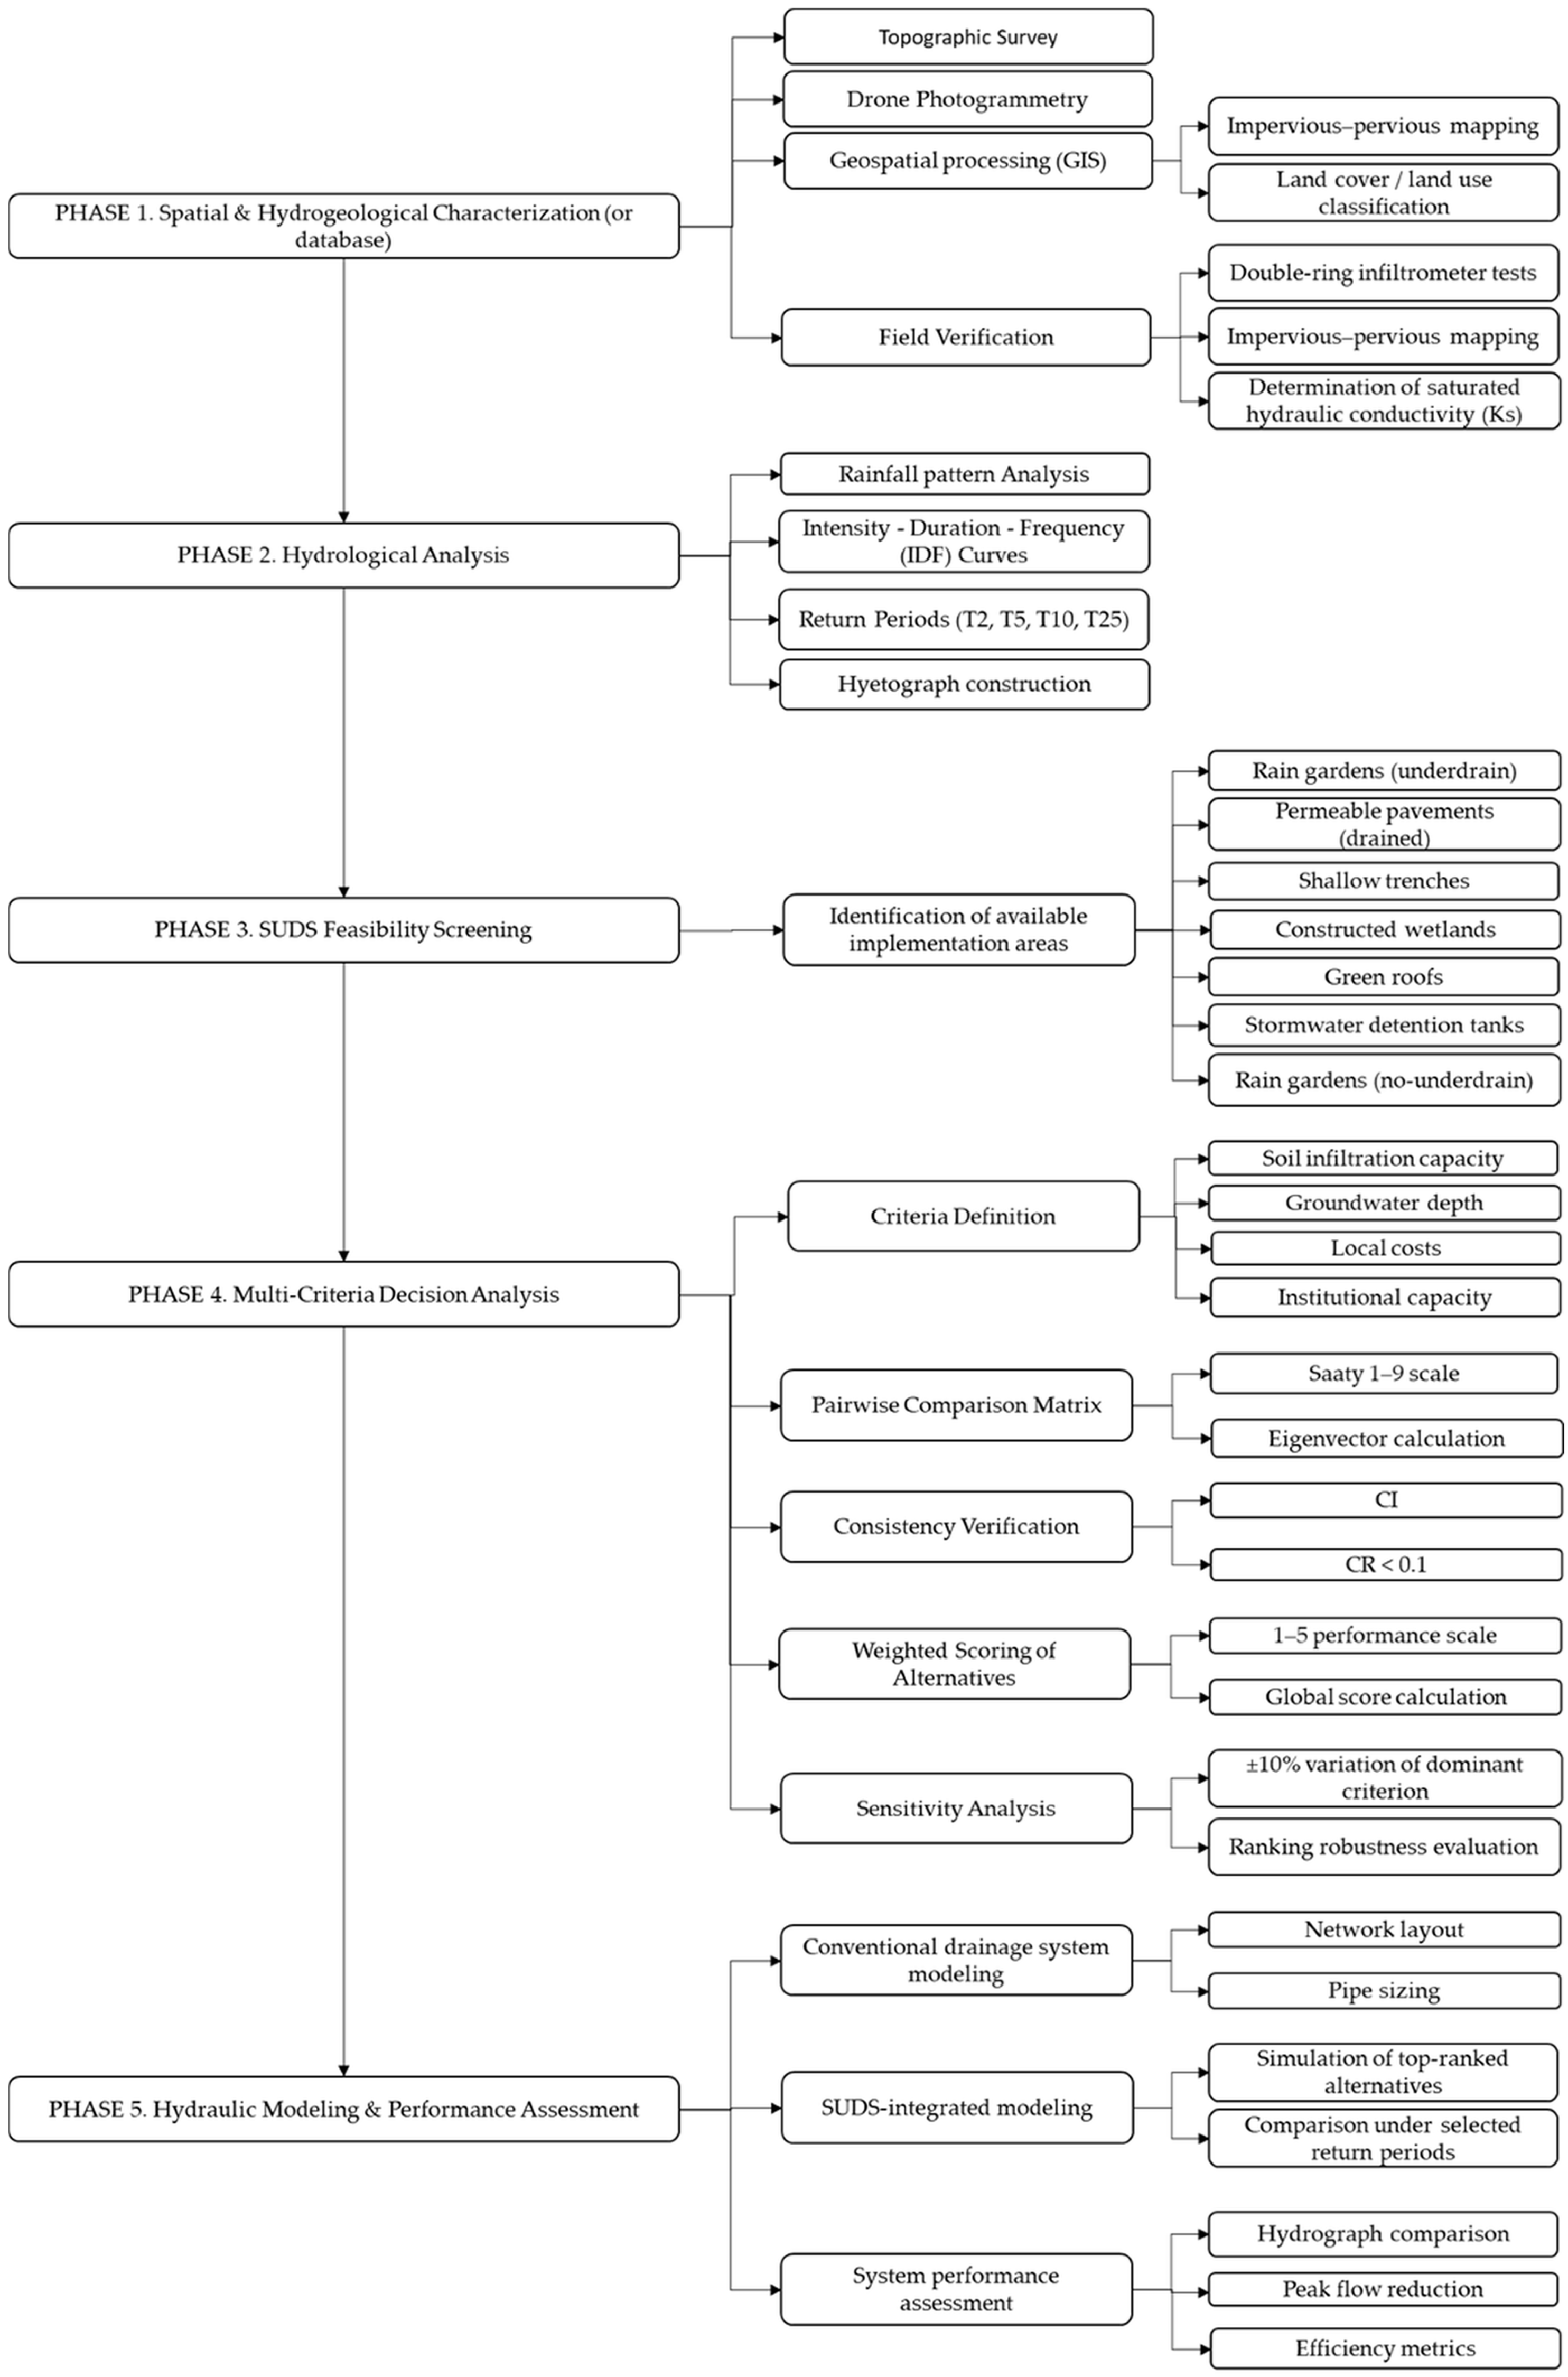
The methodology (
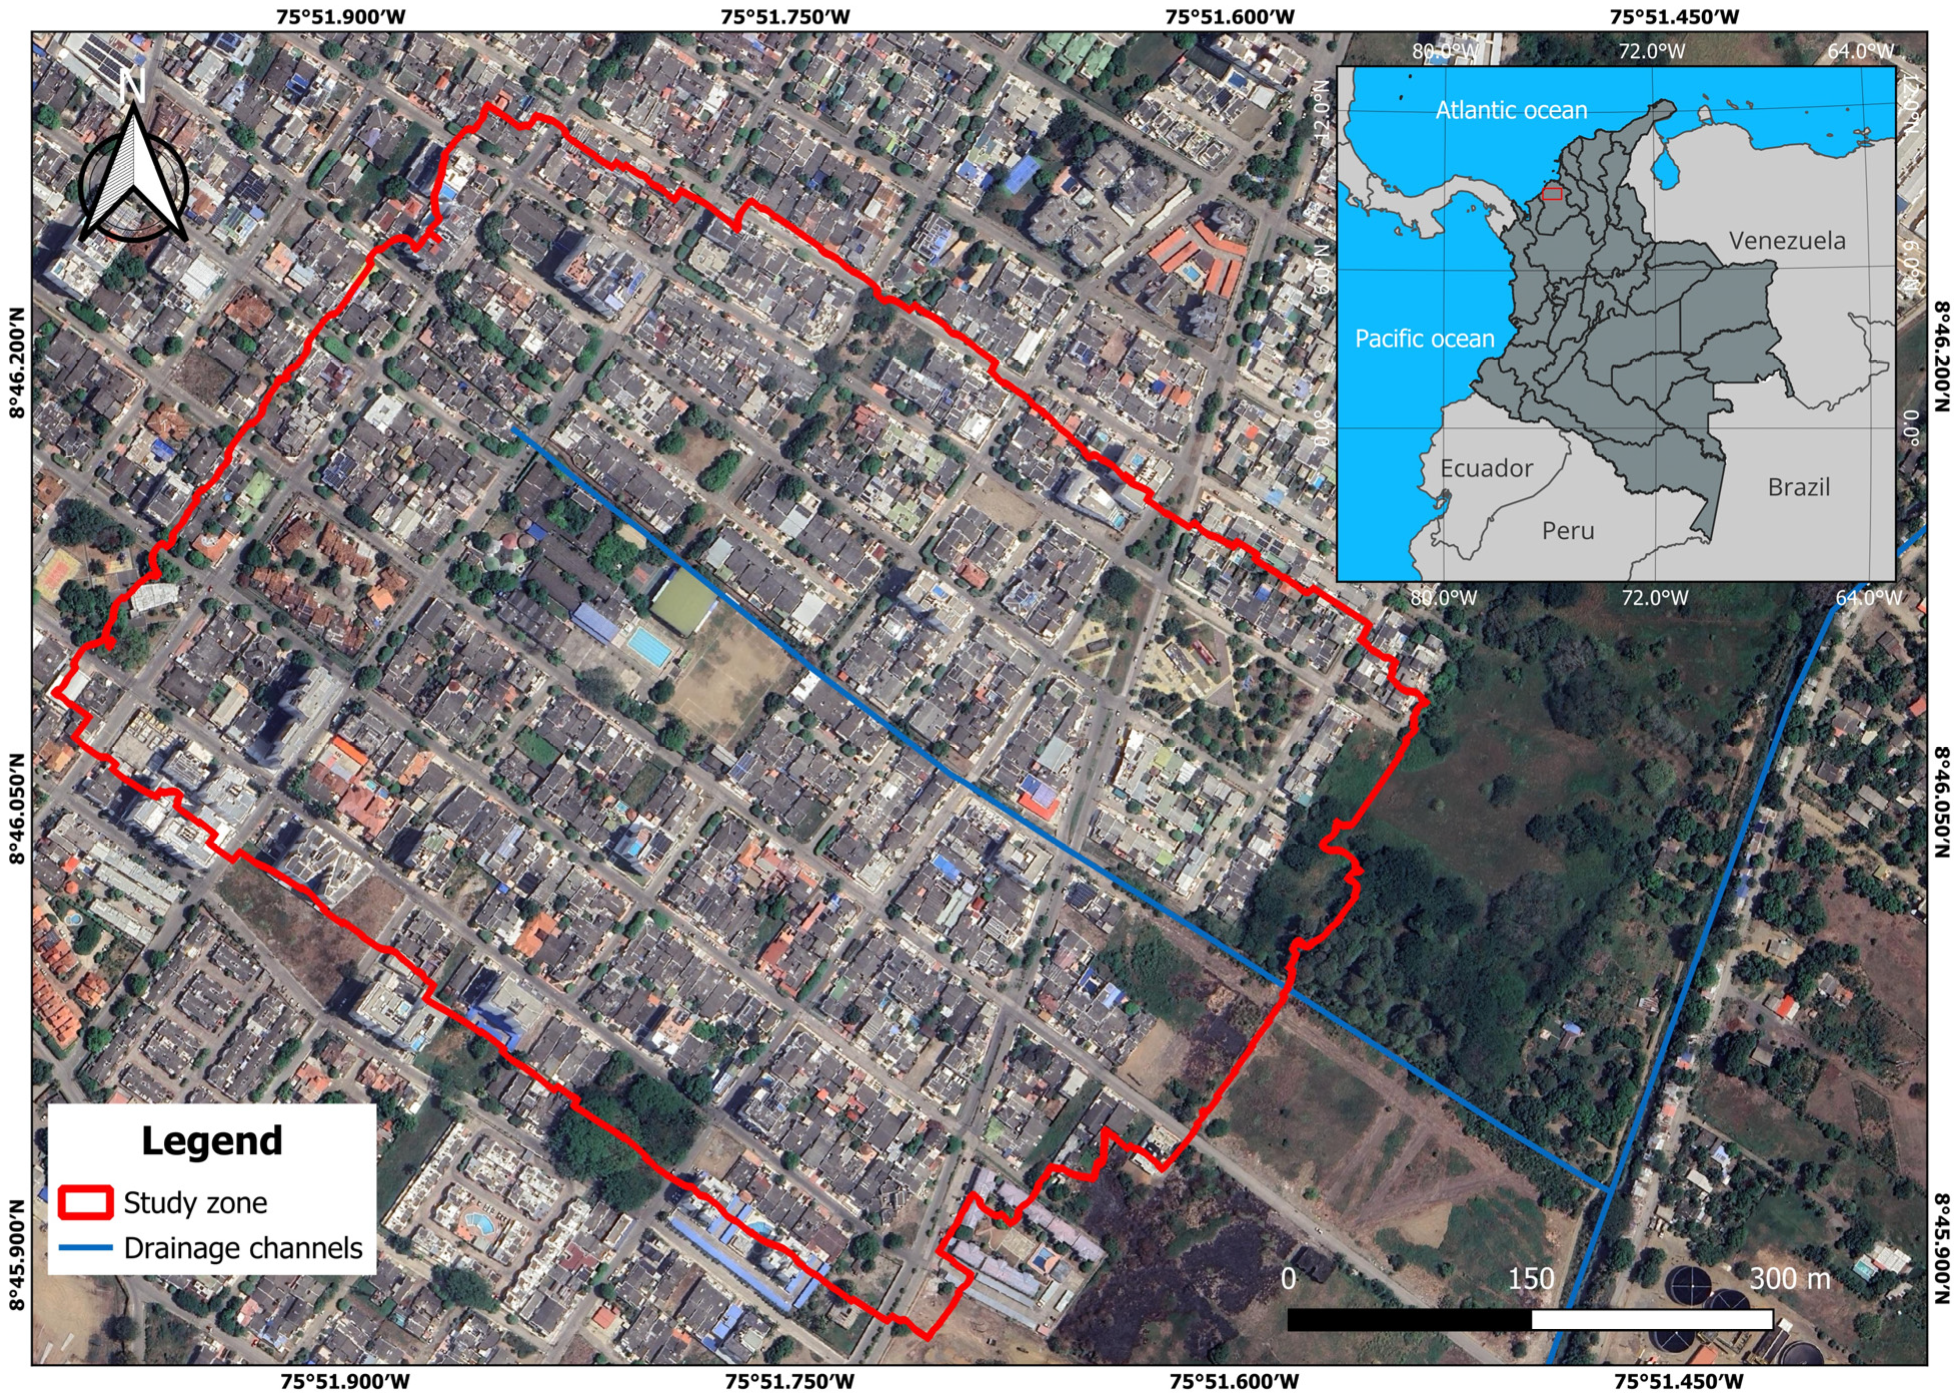
Figure 2) was based on GIS tools and rainfall-runoff models to evaluate the potential of implementing SUDS to alleviate and mitigate floods caused by stormwater runoff in an urban basin. To carry out this evaluation, a topographic survey of the study area was first conducted, and drone photogrammetry was used to get a georeferenced ortho-mosaic. This ortho-mosaic allowed the classification of land cover and land use around the study zone, including roads, rooftops, and green spaces.
After the topographic survey and photogrammetry were finished, the GIS were used to classify the land cover types as impermeable, semi-permeable, and permeable, according to their infiltration potential. It should be noted that for the analysis of permeable zones, only the areas corresponding to public space managed by the municipal administration were considered. Accordingly, roofs and paved areas were considered impermeable areas, as they prevent water from penetrating the subsoil. Permeable areas include green spaces with vegetation and/or natural ground, through which rainwater infiltration occurs, and cobblestone pavements were essentially considered to be semi-permeable areas, since they allow for partial water infiltration. Subsequently, this information was validated in the field, and the potential areas for the implementation of the SUDS were identified, considering the available square meters and the presence of sizable trees that should not be felled.
In addition, the roof materials and configuration of flow directions (roof ridges) were evaluated. This information was used as a criterion for choosing areas in which storm tanks or rain gardens could be used. Roofs with materials that were unsuitable for rainwater harvesting such as bitter palm roofs (Sabal mauritiiformis) were excluded. And roofs located near the potential storm tank sites were selected, with a maximum distance of 4 m to lower the costs of the proposed implementation. Similarly, the roof material was required to estimate the curve number of the sub-basins into which the study area was divided, to determine the roofs’ capacity to generate surface runoff.
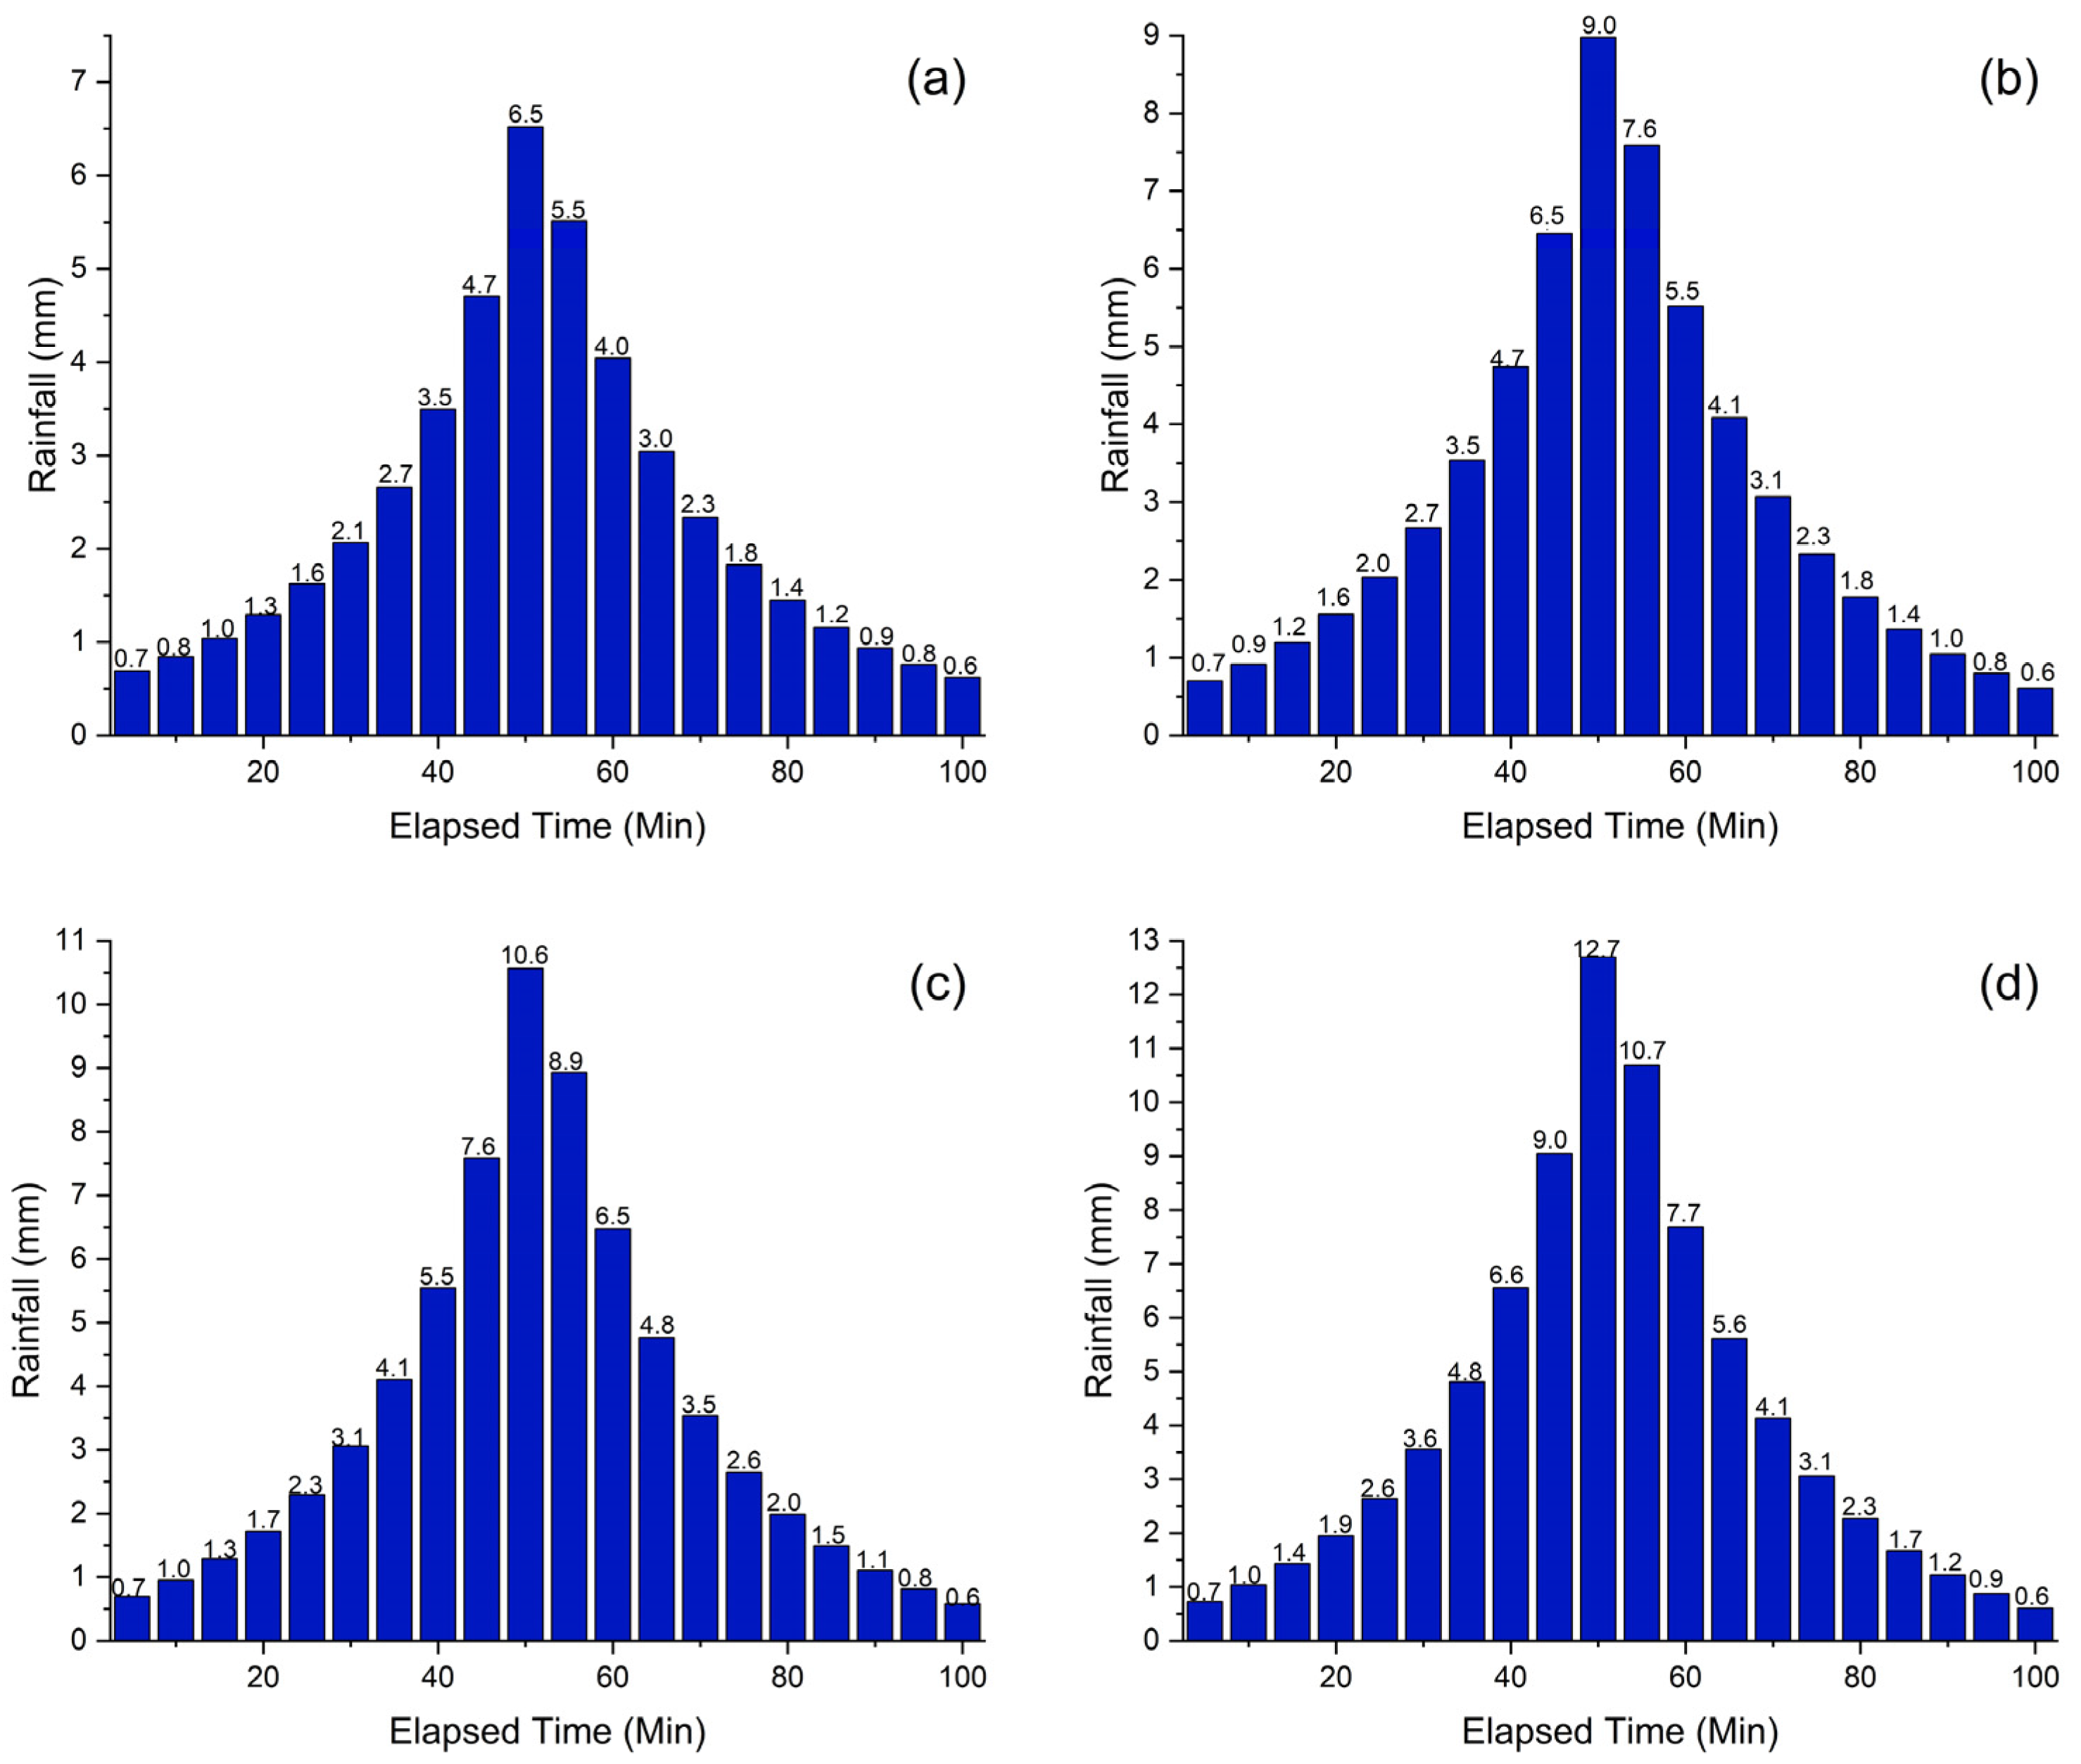
Subsequently, a hydrological analysis of the precipitation in the area was conducted, using curves of Intensity–Duration–Frequency (IDF) from the Los Garzones Airport meteorological station [13035501] (8.8°, −75.86666667°), provided by the Instituto de Hidrología, Metereología y Estudios Ambientales, IDEAM, Colombia, (Institute of Hydrology, Meteorology, and Environmental Studies). The IDEAM is the agency responsible for meteorological data in Colombia. Then, these curves were used to calculate the design intensity based on the return period and concentration times, calculated according to Colombian regulations. Finally, the alternating block method was used to construct design hyetographs for return periods of 2, 5, 10, and 25 years.
After the potential areas to implement the SUDS were identified, typologies that did not require the demolition of existing infrastructure were proposed, thus minimizing the economic constraints on the project’s feasibility. This was achieved by considering the houses’ arrangement, as the orthophotos and field visits revealed that they have wide green areas (especially gardens), and that the public spaces available for the proposed typologies are inadequate and limited.
To determine the modeling types, the analytic hierarchy process (AHP) was used to select the most appropriate SUDS for the study area. Scores were given to each alternative on a scale of 1 to 5 (1 = very unfavorable, 5 = very favorable), based on the technical performance of each SUDS typology against five weighted criteria: soil type (infiltration capacity), water table, space availability, local costs, and institutional capacity. Each criterion assessment was based on the specific conditions of the area, characterized by high urban density and the water table, both of which were identified as dominant limiting factors.
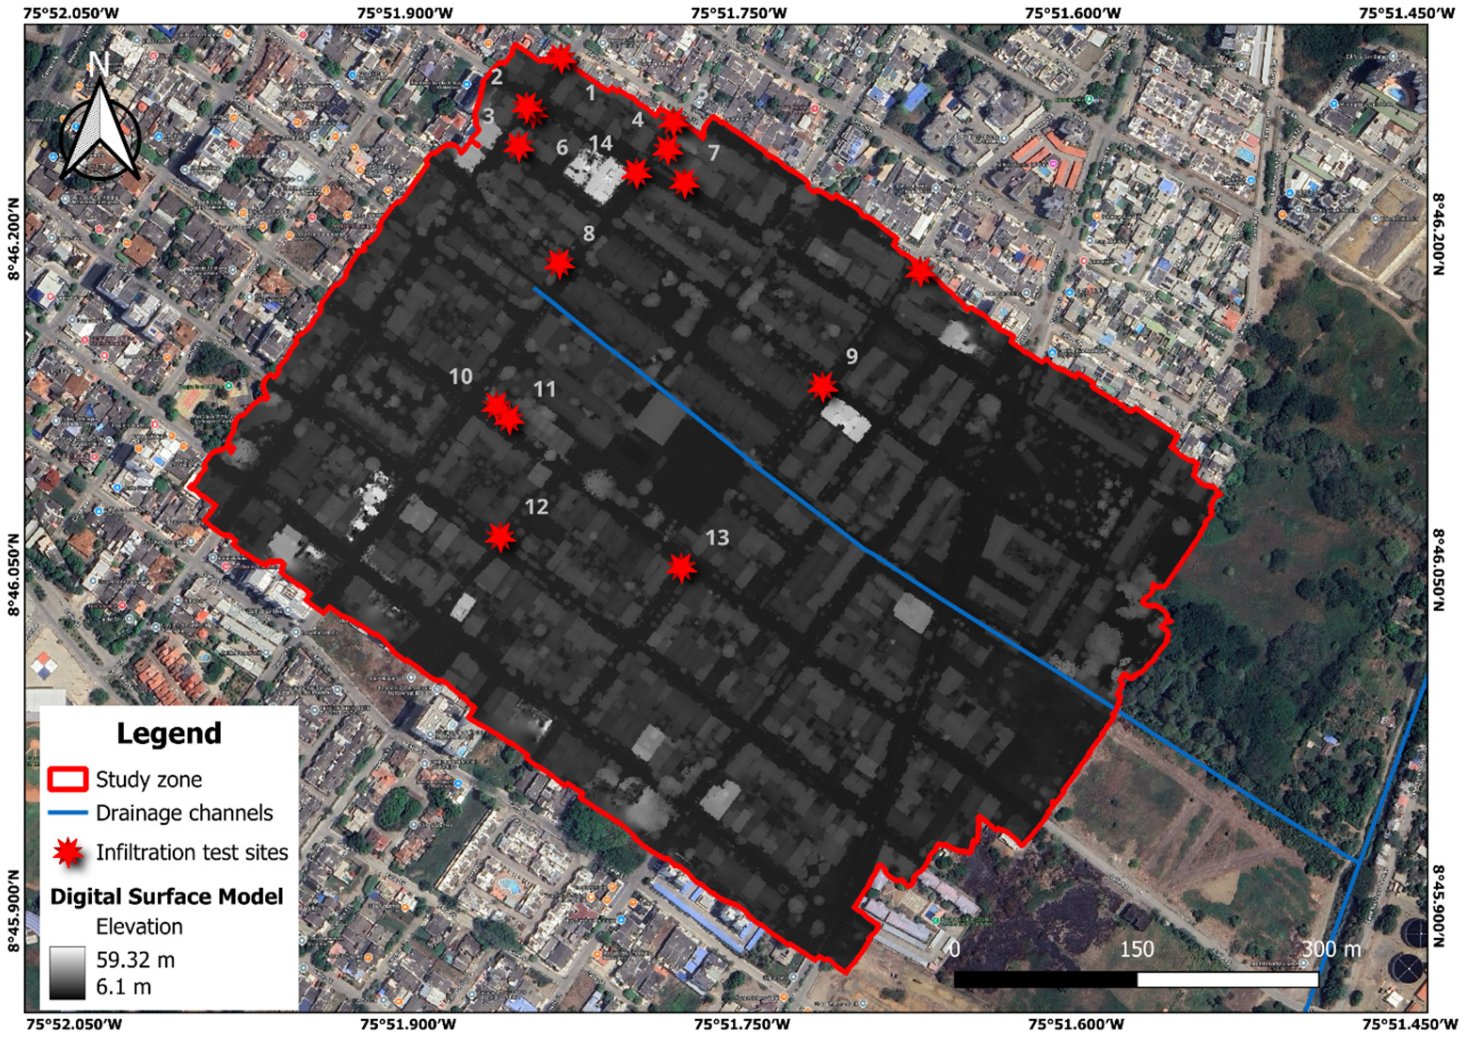
Similarly, to assess the infiltration capacity, tests were conducted using a double ring infiltrometer at various points in the study area (
Figure 3). Then, a 7 × 5 comparison matrix was developed using Saaty’s fundamental scale (1–9), in which each criterion was compared with the others according to its relative importance, considering the water table depth, urban density, spatial limitations, and local economic constraints. The consistency index (CI) and consistency ratio (CR) were then calculated to evaluate the internal consistency of the comparisons [
33]. Finally, the AHP weights were used to weigh the performance of eight SUDS alternatives, which were evaluated on a technical performance scale from 1 to 5, resulting in a ranking validated through sensitivity analysis (±10% in the dominant criteria). The adopted weighting system was based on the existing literature and the Colombian regulatory framework, with the water table depth identified as the most influential criterion due to its direct impact on the feasibility and performance of infiltration-based systems [
23,
34]. Similarly, economic factors were highly relevant, as cost constraints influenced the implementation of stormwater management practices significantly [
22,
35]. Moreover, space constraints for the implementation and institutional capacity have been considered critical in urban contexts [
36,
37]. Finally, these criteria are consistent with Colombia’s drinking water and basic sanitation regulations (Resolution 0330 of 2017), which require an assessment of site conditions, technical feasibility, and economic and institutional factors in the implementation of SUDS. As noted above, the weights assigned to the five AHP criteria were supported by consultations with experts and key stakeholders, including local authorities, engineers, and water managers, using Saaty’s relative importance scale [
38].
On the other hand, the hydraulic analysis for the study area began with a detailed inspection of the area where the structures that are currently used for rainwater drainage were identified. Subsequently, a conventional storm sewer system was designed to transport runoff water to selected strategic points where rainwater could be delivered to the existing storm drainage system channels of the city.
Once the results of the conventional water drainage system were obtained, five alternatives were evaluated, considering three types of SUDS that best suited the area, according to the AHP. Next, an evaluation of effectiveness of the five alternatives for incorporating the SUDS into the mitigation of rainwater flooding in the area was conducted, aiming to determine the best strategy. This effectiveness was determined by calculating the percentage reduction in flow and comparing it with the current regulations, and with other authors who have conducted research using these typologies.
4. Results and Discussion
The study area was selected based on the problems related to rainwater flooding in the zone. In addition, the use of roads and pedestrian areas were evaluated, increased by the presence of an educational institution and three residential apartment towers. Additionally, the population density (108.41 inhabitants/ha) and land use were considered. They consist of 91.01% residential housing, 0.39% mixed use (housing and commerce), 2.10% commercial use, 2.92% services, 0.28% institutional (schools), 3.14% vacant lots, and 0.17% parks (green recreational areas) [
29].
Based on the above, the need for a land cover analysis was appointed. Therefore, a drone topographic survey was conducted to get a digital elevation model (see
Figure 3), representing the area’s elevation (13 m a.s.l.). The drone images provided high-resolution topography, identifying reflective surfaces such as trees, buildings, houses, and other objects above ground level. Orthophotos of the area were also obtained, which allowed us to identify the different land cover types found in the study area (building roofs, permeable, impermeable, and semi-permeable areas).
Figure 3 shows the most significant elevations, and upon field verification, it was confirmed that they were approximately 35 m-high buildings.
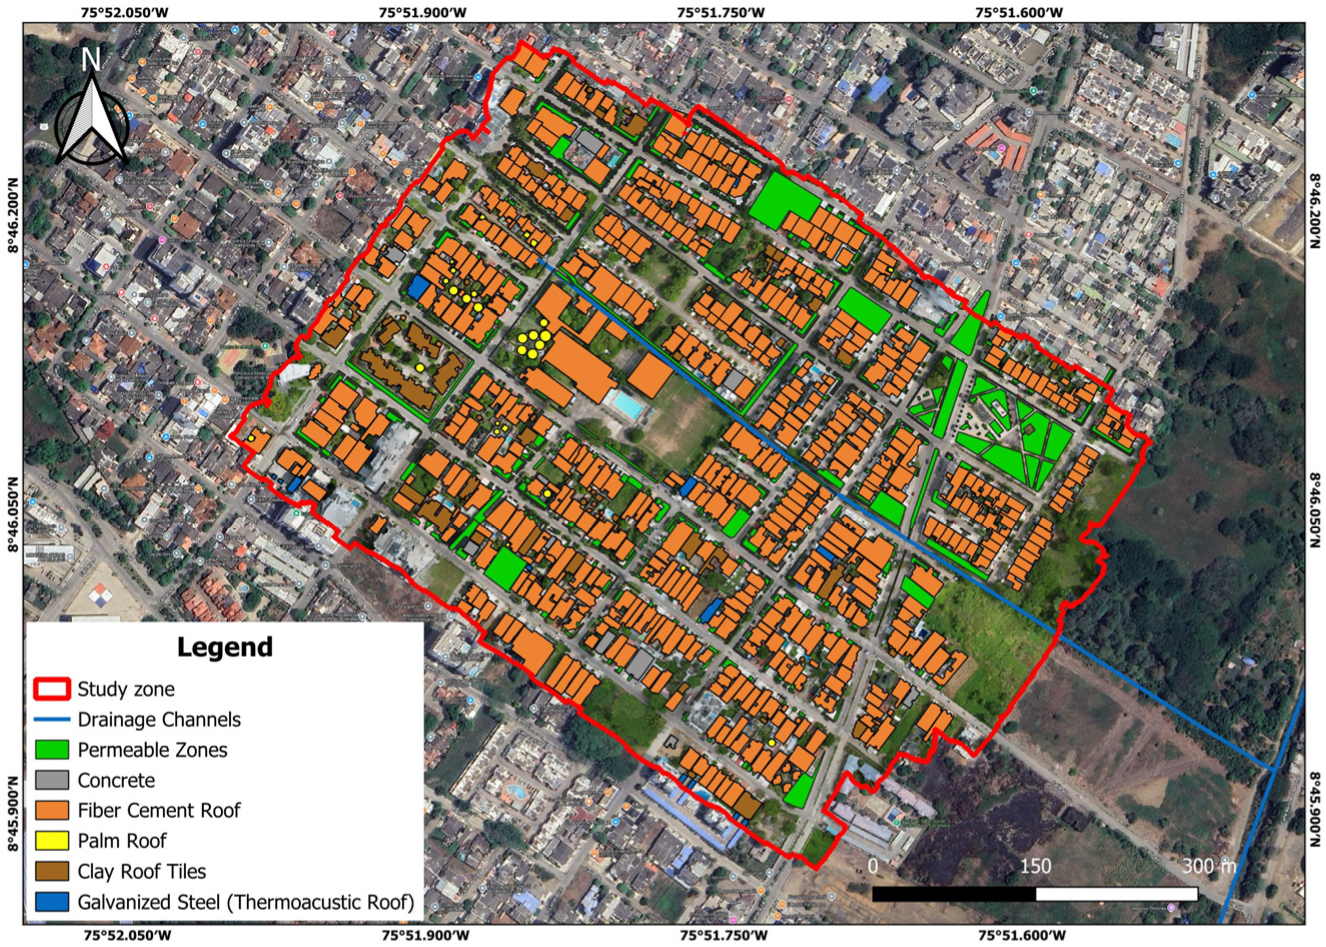
Figure 4 shows the different land cover types in the study zone. The type known as permeable areas occupies 4.96 Ha, corresponding to 11.18% of the analyzed zone (35.38 Ha). The main land cover associated with this type is natural ground and gardens, where the Asian coral tree shrub (
Ixora coccinea) prevails.
On the other hand, in the case of impermeable areas, building roofs represent the largest percentage of this coverage (
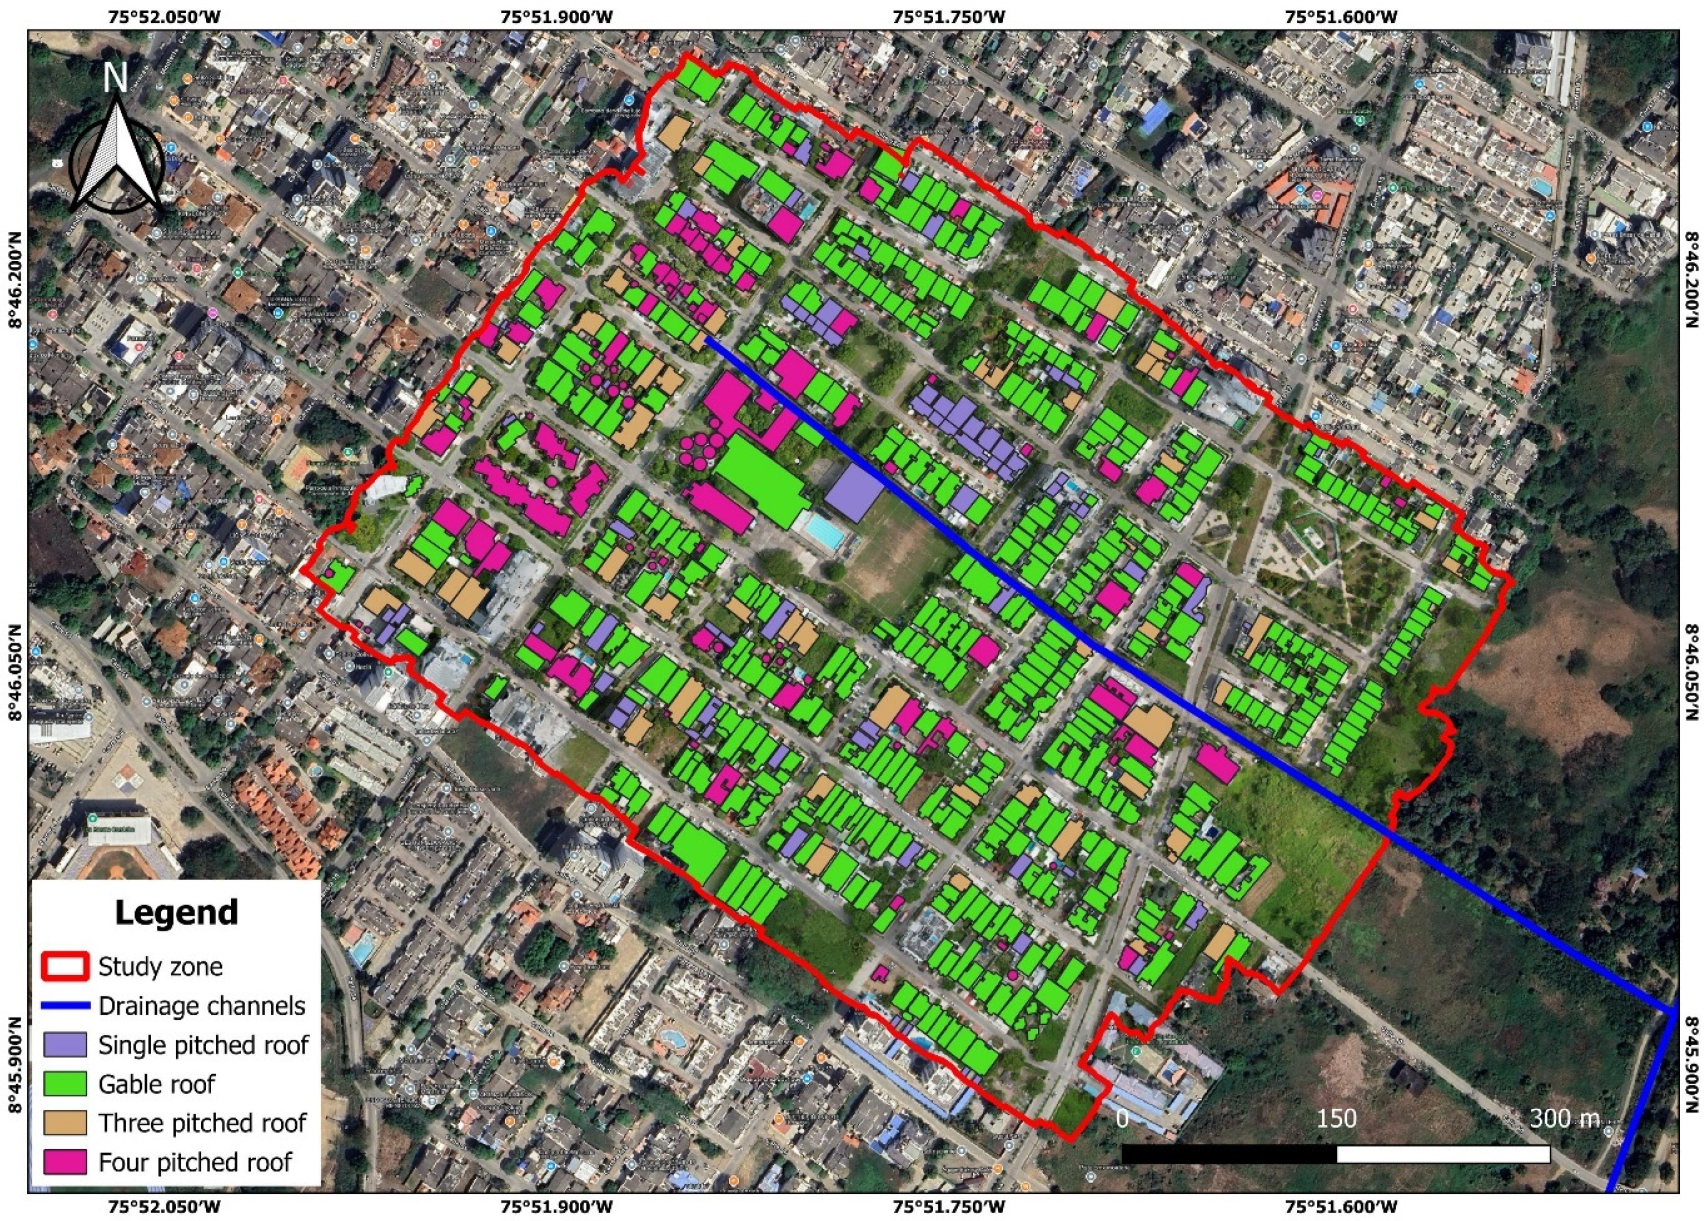
Figure 4). However, transit roads, sidewalks, and parking areas were also identified in this category. Similarly, the number of roofs was counted using orthophotos and GIS (see
Figure 4), representing a total area of 117,190 m
2, with an average of 170.58 m
2 per roof (
Table 1). This analysis found that the most representative roof in the area belongs to an educational institution, with an area of 2170.44 m
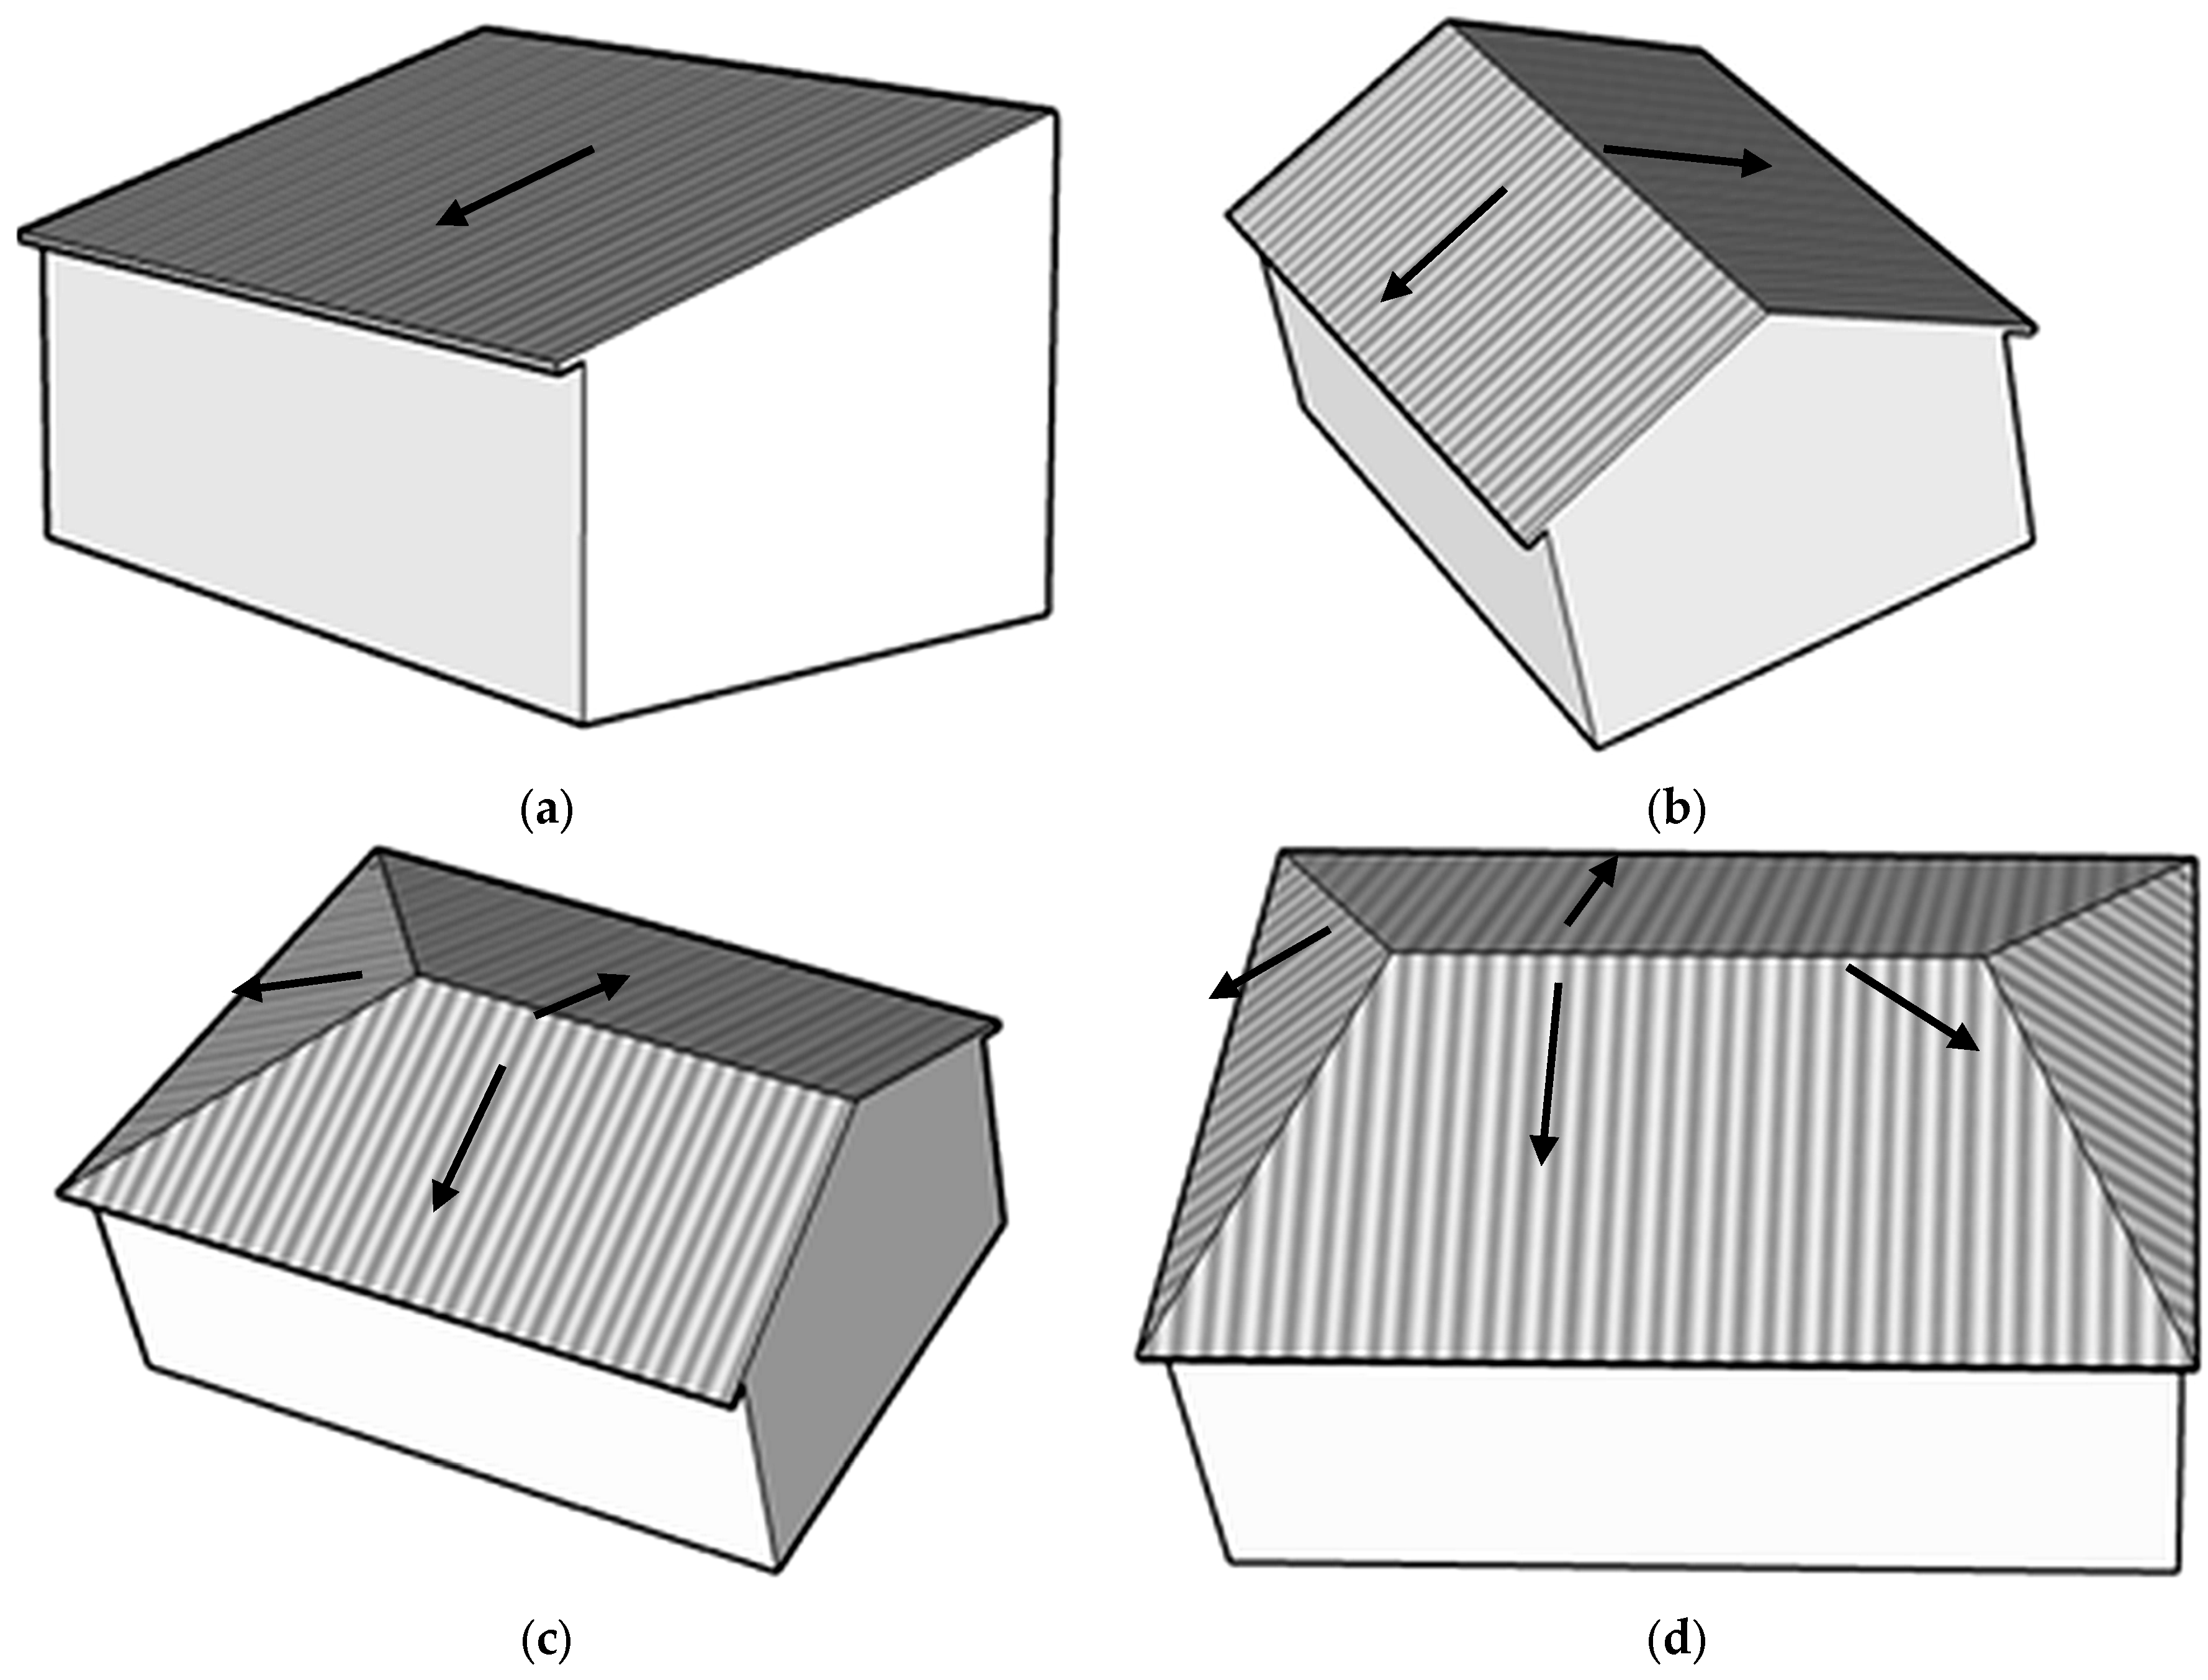
2. Once identified, the roofs were characterized to determine their suitability for use within the project framework. They were classified according to the water flow direction and the roofing material. In the case of the flow direction, this was established by indicating whether the roof has one, two, three or four slopes (single-pitched, gable, three-pitched roof and so on), as seen in
Figure 5.
The roofing materials were verified through on-site inspection, and
Table 2 shows the classification results, revealing that fiber cement roofs abound, representing 85.3% of the total number of roofs counted in the area. Fiber cement is characterized by being made up of cement with reinforcing fibers, with cellulose, polypropylene, or glass being the most common. The widespread use of this material is due to its characteristics that make it ideal for the climatic conditions of tropical zones. These characteristics include a significant reduction in the impact of high temperatures due to heat transfer, providing comfort and energy efficiency in warm climates, as in the case of the study area. In addition, it provides acoustic insulation, offers good drainage, and is non-flammable, resistant, durable, and affordable [
39]. The classification of roof materials and green areas can be seen in
Figure 4, and the configuration of the roofs of the houses, considering the direction of flow, can be seen in the map of
Figure 6.
The study zone was characterized using double ring infiltrometer tests. The results showed stabilized infiltration rates ranging from 12 to 252 mm/h, with an approximate average of 93 mm/h (
Table 3 and
Figure 3). These values indicate that the soil has a high surface infiltration capacity. However, the potential for deep infiltration depends on the site’s hydrogeological characteristics. In this area, the water table is less than 1.0 m deep during the rainy season and between 1.0 and 2.5 m during the dry season, which differs from what has been reported in local studies [
40]. As a result, the water table is the primary constraint on implementing systems that require deep infiltration, making this criterion particularly important in the AHP evaluation.
Although the surface behavior of the soil is favorable, the limited vertical distance between the SUDS potential base and the water table restricts the effectiveness of the solutions based on direct infiltration. This is due to the risk of persistent saturation and reduced hydraulic efficiency.
The use of the AHP allowed us to determine the relative importance of the criteria evaluated on a scale of one to five. The percentage weights assigned to each component were: water table at 0.43, local costs at 0.21, space availability at 0.16, institutional capacity at 0.11, and soil type at 0.09. As mentioned above, the water table carries the highest weight because it is very close to the surface, which is common in floodplains, as in the study area of the Sinu River valley. Additionally, the water table is a constraint and a technical feasibility issue since there is high soil saturation and low effective infiltration capacity, increasing the risk of waterlogging. Moreover, since the SUDS rely on the soil’s infiltration and storage capacity, technical limitations such as rapid saturation of the system and reduced effective storage volume could occur.
Local costs are closely behind in terms of scoring. These costs are relatively high, and under current city regulations, builders must cover them for new residential developments [
41]. Nonetheless, in the study area, these costs should be covered by the municipal administration because there are few locations available for new housing projects. Unfortunately, the absence of a sewer system for rainwater collection means that implementing SUDS requires a high initial investment, as these systems must handle controlling, retaining, conducting, and managing urban runoff [
42,
43]. Similarly, resources are currently allocated to meet high social demands, such as investment in public health, education, roads, and others, along with the pressure to deliver visible projects.
This is followed by the institutional capacity: although the city of Montería has the administrative structure of a first-category municipality, implementing the SUDS may encounter institutional challenges due to fragmentation. Urban drainage management in Colombia, especially in Montería, involves multiple entities such as the Secretariat of Planning and Infrastructure, the Public Services Company (Veolia SA ESP), the Risk Management Office, and the Corporación Autónoma Regional de los Valles del Sinú y del San Jorge, CVS, Córdoba, Colombia, (Environmental Corporation of the Sinu and San Jorge Valleys) [
44]. Having several entities leads to responsibility issues, maintenance problems, and duplicated functions, which have been clear in managing stormwater drainage channels.
Finally, the scores consider the soil type, since altering the natural terrain with housing construction changes its original physical properties—such as permeability, infiltration capacity, and soil structure—thus impacting the SUDS viability and hydraulic performance.
To ensure the robustness of the methodology, consistency verification was conducted.
Table 4 shows the 5 × 5 pairwise comparison matrix resulting from the analytic hierarchy process (AHP) applied to the decision criteria evaluation. The original matrix was validated and corrected using weight rescaling techniques to ensure logical consistency. The resulting consistency index (CI = 0.0847) meets the acceptability threshold satisfactorily (CR ≤ 0.10), thereby validating the analysis’ methodological robustness and facilitating the study’s reproducibility.
As mentioned above, water table was identified as the dominant criterion, reflecting the strong influence of hydrogeological conditions on the technical feasibility of SUDS options. The SUDS typologies evaluated in the AHP included rain gardens with underdrain, rain gardens without underdrain, bioretention systems, permeable pavements (drained systems), shallow infiltration trenches, constructed wetlands, green roofs, and stormwater detention tanks.
Table 5 shows the scores for the SUDS suitable for the study area, listed in order from highest to lowest: stormwater detention tanks (3.95), green roofs (3.86), bioretention systems (3.52), rain gardens with underdrain (3.09), permeable pavements (3.03), constructed wetlands (2.92), rain gardens without underdrain (2.78), and shallow infiltration trenches (2.63). The three highest scoring options are selected for the design in the study area. They exclude green roofs, due to challenges like high temperatures and solar radiation in the city; rainfall concentrated in one season; the need for plant irrigation during other periods; and the technical capacity required for installation and maintenance.
Subsequently, to calculate the potential for roof exploitation, a multi-criteria analysis was carried out where the distance to the storm tank, the material, and flow direction of the roof were considered, to find that only 1.5% of the roofs are not suitable for the possible implementation of the SUDS typologies that involve storm tanks (
Table 6).
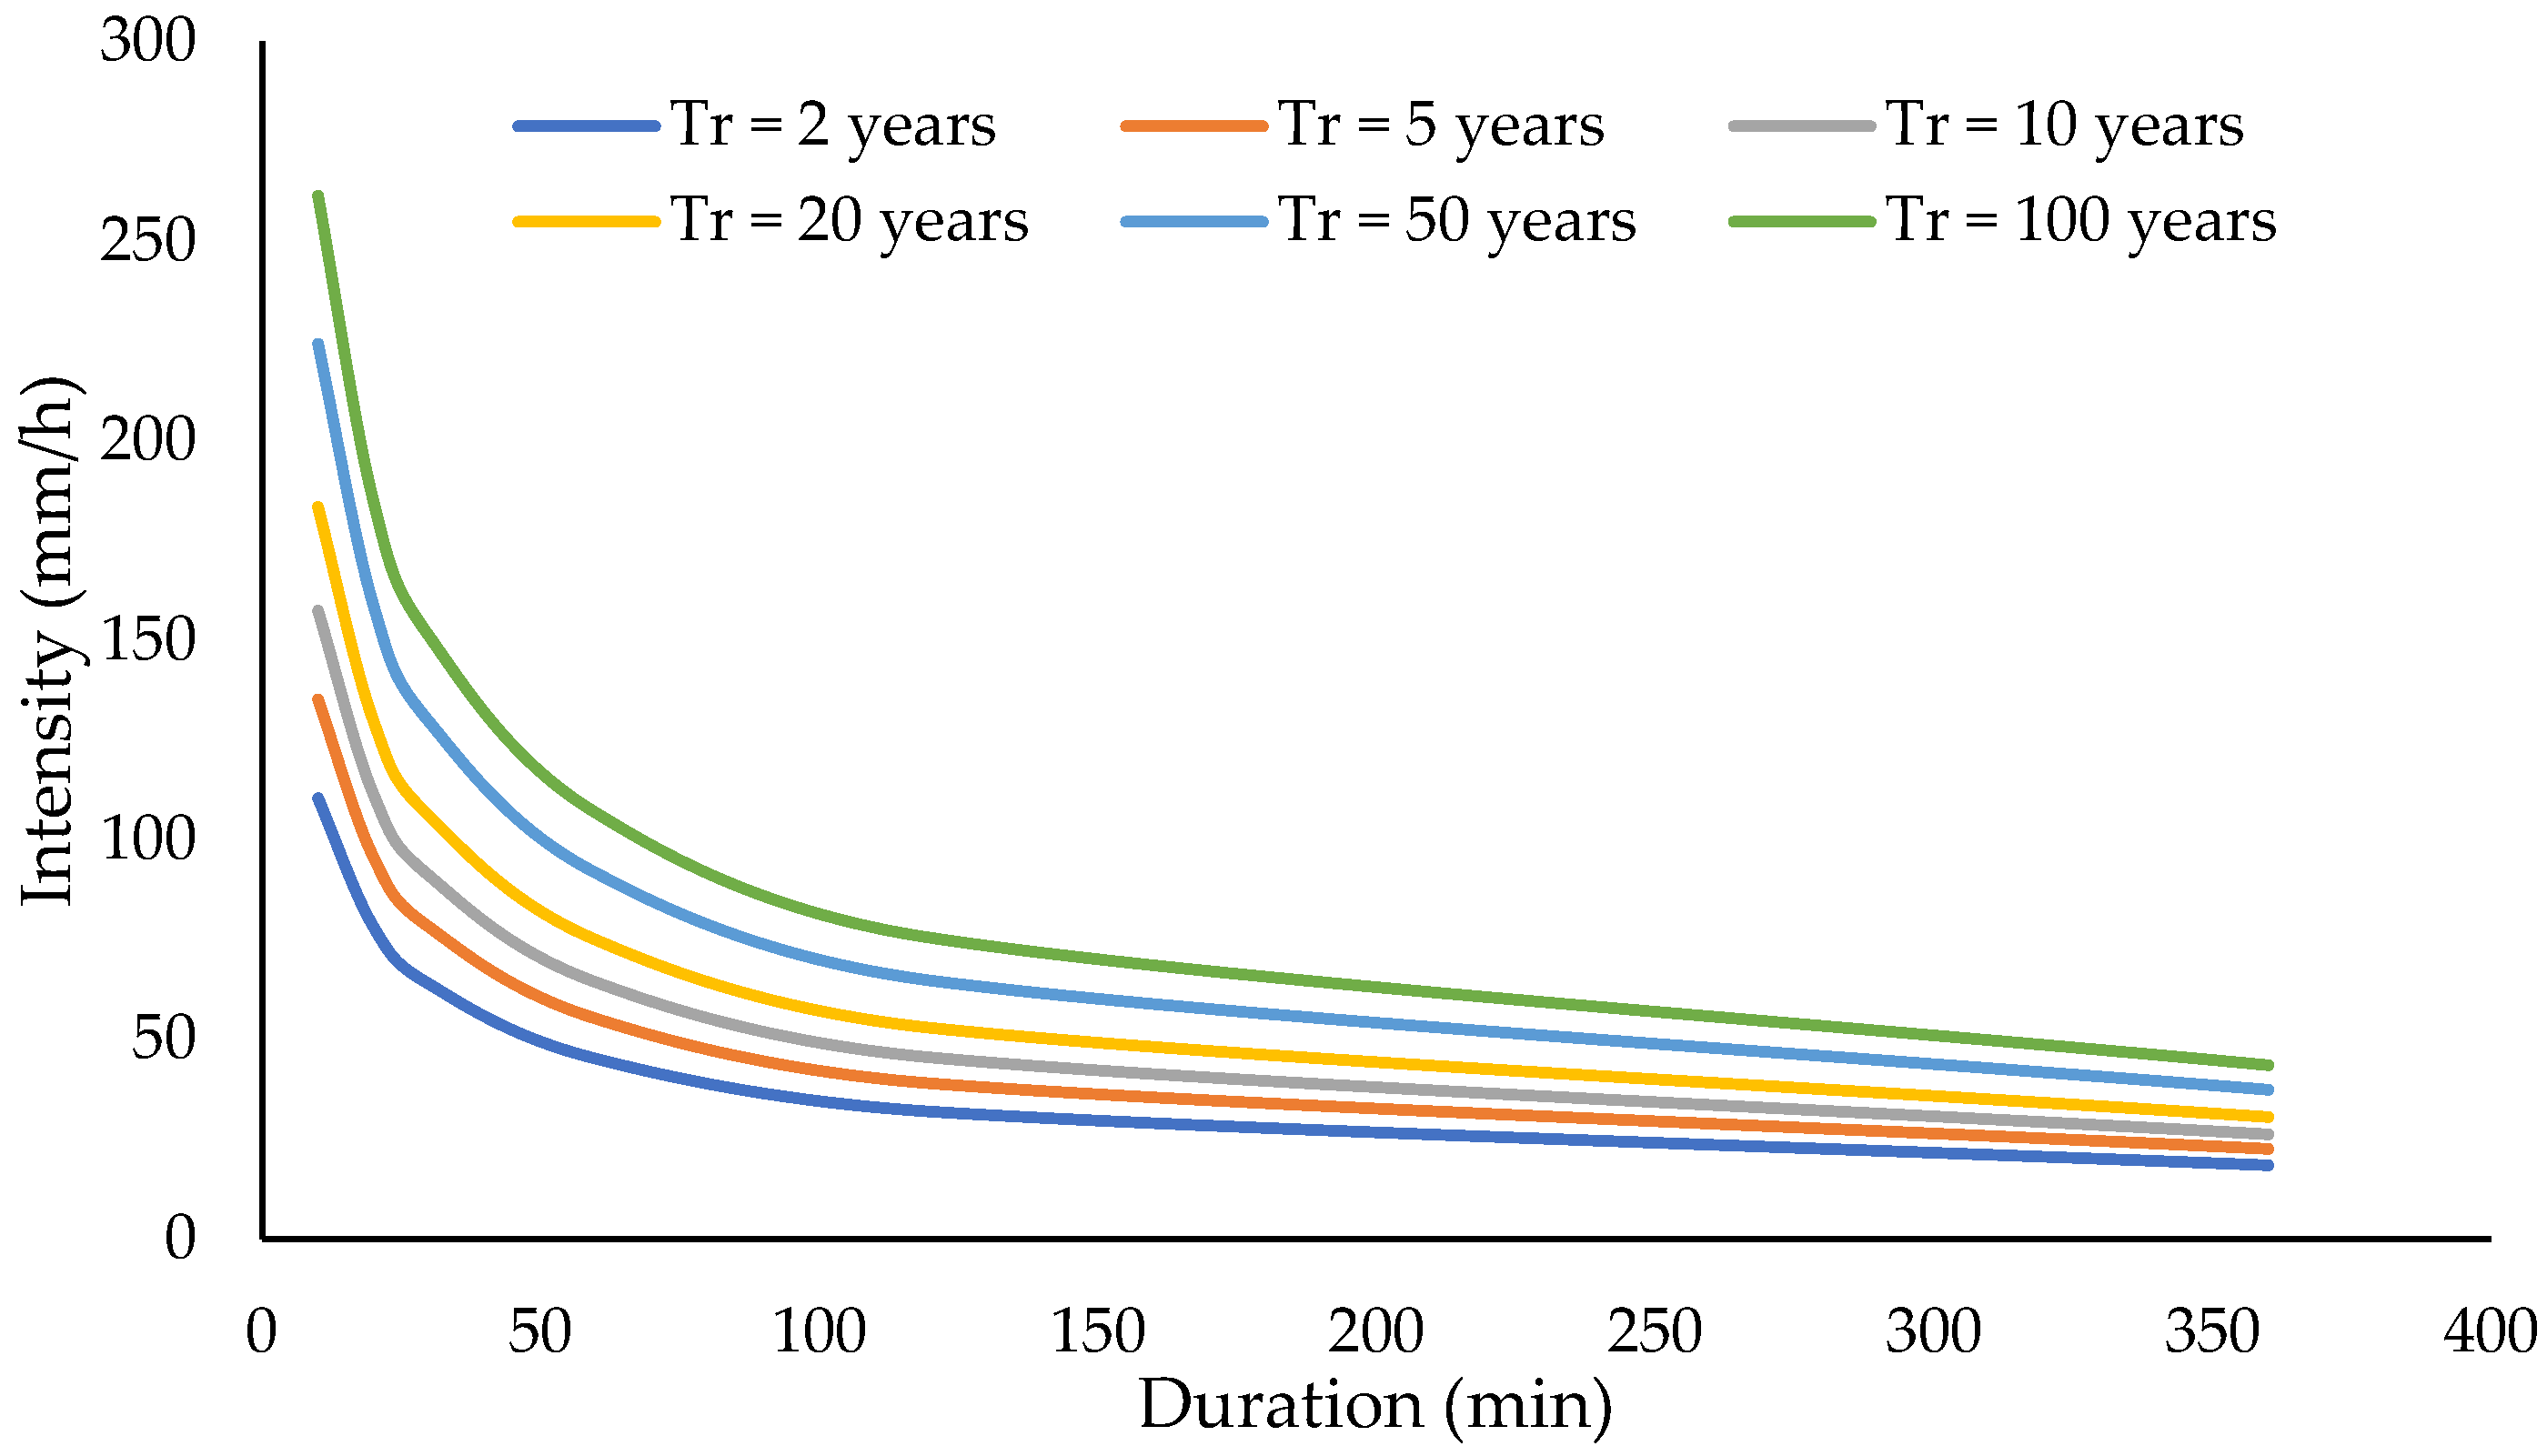
The next phase involved understanding and modeling rainfall intensity. This information is required for the hydraulic infrastructure design of conventional stormwater drainage systems and SUDS. Precipitation data were obtained from the IDEAM meteorological station, Los Garzones Airport [13035501]. The IDF curves were then estimated using the simplified method outlined in the 2019 Road Drainage Manual by the Instituto Nacional de Vías, INVIAS, Colombia, (National Institute of Roads). This approach is synthetic in nature, as it estimates rainfall intensities for different durations and return periods, based on the annual maximum 24 h precipitation. The resulting IDF curves are shown in
Figure 7. Furthermore, the design hyetograph was constructed for different return periods by using the alternating block method, as shown in
Figure 8, where the peak rainfall increases with the return period. This information is essential for the design and evaluation of the SUDS.
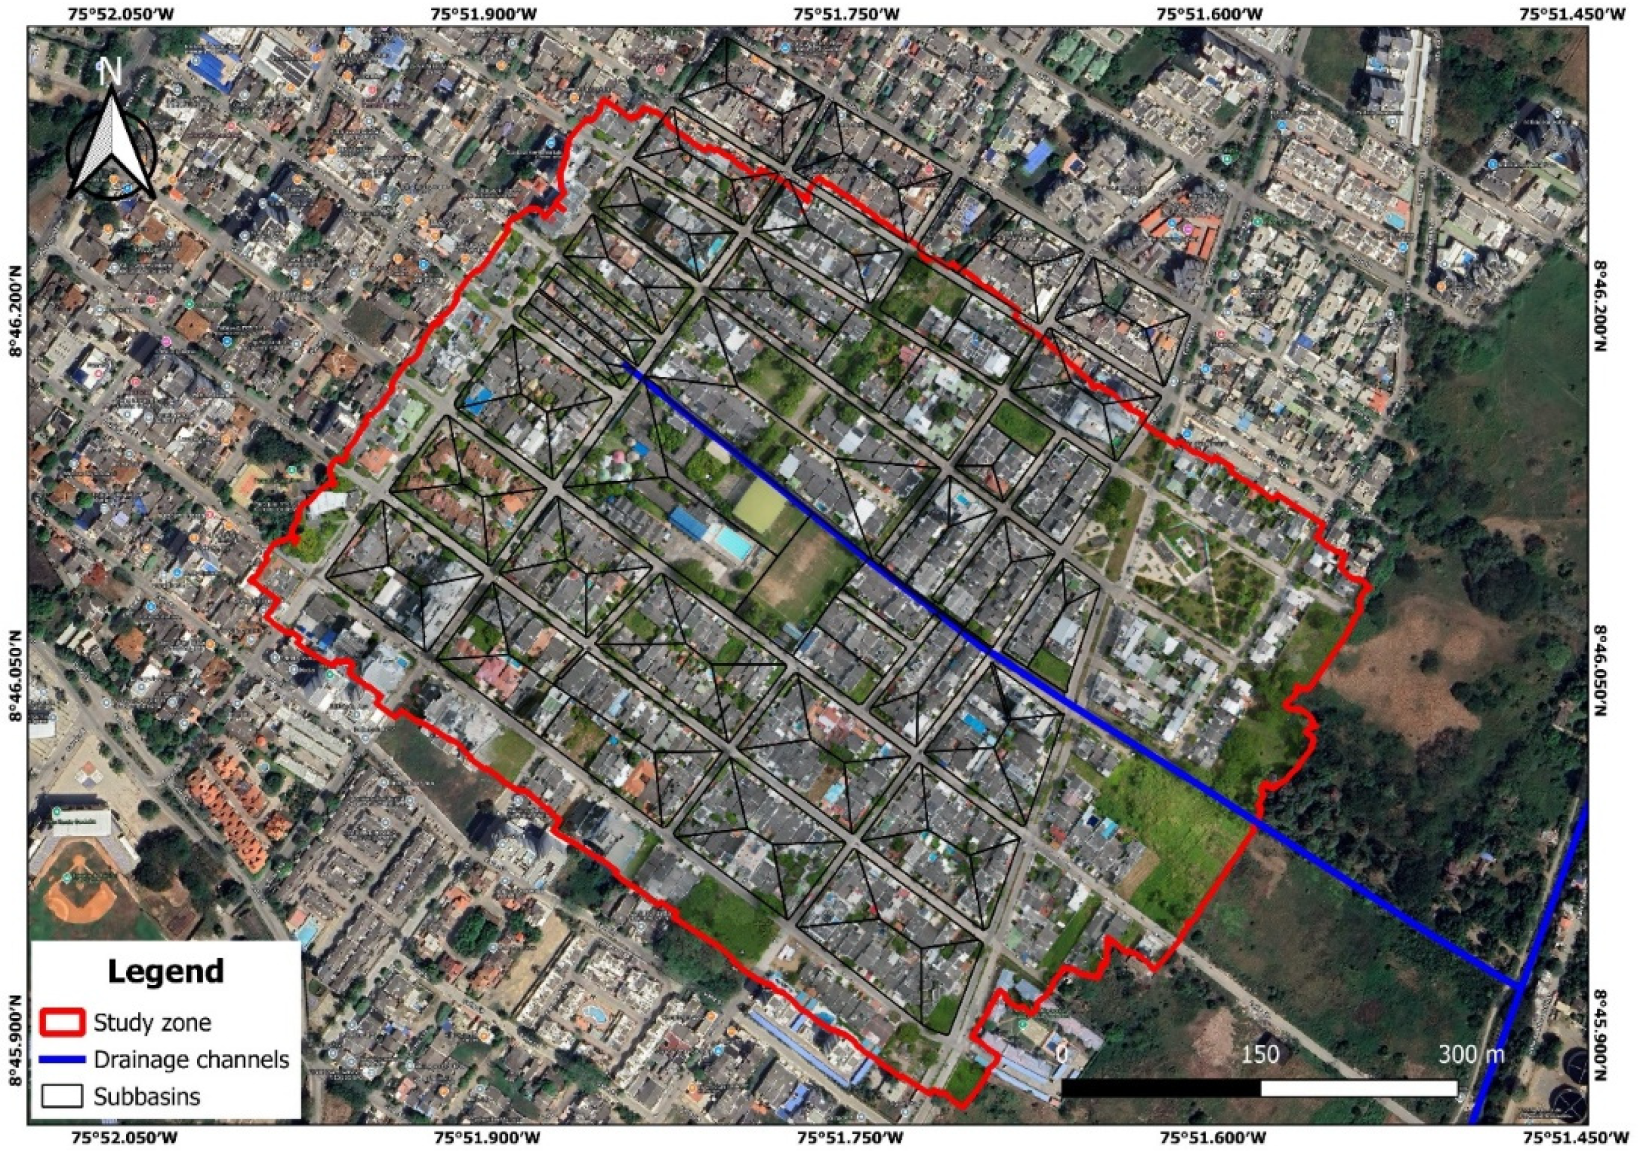
Regarding the hydraulic assessment of the area, drainage basins were established for stormwater runoff, considering the permeable and impermeable areas evaluated previously (
Figure 4). Given that the surface drainage behavior in urban areas is governed by the slopes of the stormwater sewer collectors, rather than natural topography, 125 sub-basins were delineated in such a way that each city block was divided into four parts: typically, two triangles and two trapezoids, each draining toward the nearest collector, covering a total area of 23.10 ha with a mean sub-basin area of 1847.21 m
2 (
Figure 9). Impervious areas predominated, comprising 82% of the total area, consisting of streets, roofs, and sidewalks (
Figure 4). Subsequently, using topographic data, the flow directions for the collectors were determined, considering the need to avoid excessively deep pipes in the designed system due to the minimal difference in elevation in the area.
Furthermore, the stormwater delivery points were identified, as shown in
Figure 10. Outlet S1 was selected because it is at a lower elevation, allowing for stormwater evacuation out of the system. Outlet S2 was chosen because it contains an existing drainage structure (channel—
Figure 11) for water from 61st Street. Therefore, the system will drain to the southeast, points S1 and S2, as shown in
Figure 10. It is also important to note that the system was designed in accordance with Colombian regulations for drinking water and basic sanitation (Resolution 0330 of 2017 and subsequent amendments).
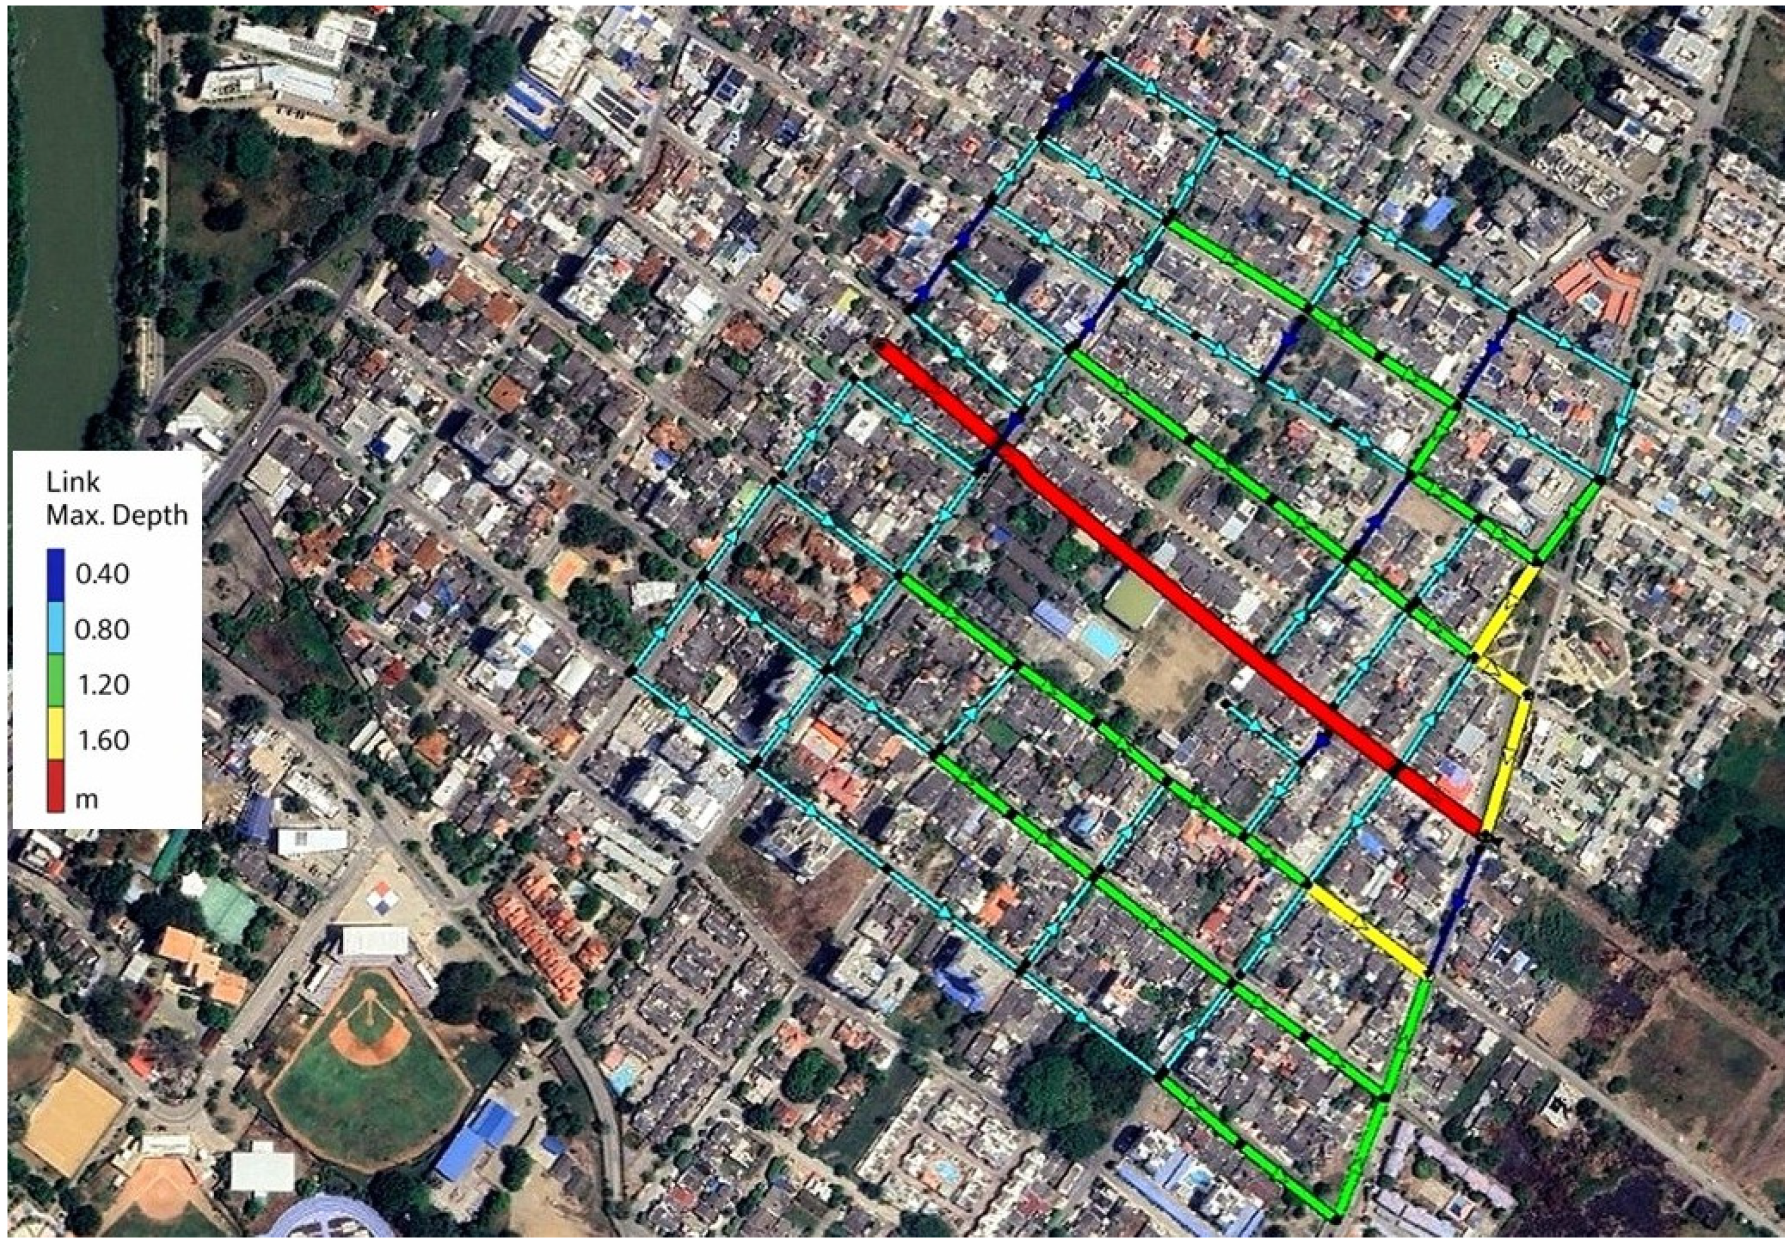
Figure 10 shows the configuration of the proposed conventional stormwater drainage system for the study area, with two delivery zones (S1 and S2) to evacuate the flows produced by the previously defined basins. These basins will be responsible for draining rainwater through catch basins located along the roads. The average design flows for the basins were 70.92 L/s, with a minimum flow of 8.70 L/s and a maximum of 302.02 L/s. Therefore, the design included 92 inspection wells with depths between 1.20 and 2.40 m. The depth of the wells was limited, with the minimum depth determined by Colombian regulations and the maximum depth set to meet the delivery elevations at points S1 and S2. Additionally, 94 pipe sections were configured to evacuate the peak rainwater flows.
The modeling of SUDS was carried out using the EPA SWMM software (version 5.2), employing the low impact development (LID) module to represent three main components: rain garden, bioretention cell, and rain barrel. Additionally, the design parameters were selected by following the guidelines provided in the EPA SWMM Reference Manual [
45] and validated against the simulation and field calibration studies reported in the literature. Specifically, the soil porosity (0.50), hydraulic conductivity (0.04 in/h), and design depths were obtained from Appendix A of the EPA [
45] and from bioretention calibration studies [
46,
47]. For the drainage components, orifice equations validated by Abi Aad et al. were used in EPA SWMM-5.2 modeling. The performance of the components was evaluated under different rainfall scenarios, comparing the results with similar modeling studies reported in the literature [
48].
Table 7 shows the parameters of the rain garden and the bioretention cell, noting that they share the same surface values (berm height 200, vegetation fraction 0.20, Manning’s n 0.13, slope 1%). This indicates that both are assumed to have similar surface detention and hydraulic resistance, so the differences in hydrological response mainly stem from the subsoil. The soil layer shows the greatest difference between the two, with the bioretention cell having a much thicker soil layer (675 vs. 65), while keeping the same hydraulic and retention properties (porosity, field capacity, wilting point, conductivity, etc.). This suggests that increased thickness enhances storage capacity and transit time, typically resulting in better peak attenuation and lower volume through increased infiltration and moisture storage. Nonetheless, because the water table is close to the ground surface, this setup would only be effective partially during dry seasons, which is not ideal, since the problem persists during rainy seasons.
Regarding the storage layer, the rain garden has a storage thickness of 0, i.e., it is modeled without a storage or gravel layer. In contrast, the bioretention cell includes a significant storage layer (390) with a void ratio of 0.75 and a seepage rate of 10, providing additional subsurface detention and exfiltration into the native soil, which is essential for drain-down between events. Lastly, both the bioretention system and the barrel share the same discharge ratio (coefficient 12.3 and exponent 0.5). However, the bioretention has an offset of six, indicating that drainage only starts after a small, stored depth or height is exceeded, allowing for initial retention before discharge. The barrel appears covered, which is consistent with typical operational assumptions (e.g., limiting direct rainfall and evaporation input).
Subsequently, in the last phase, the impact of a possible implementation of the SUDS on stormwater management was evaluated. The EPA-SWMM (Storm Water Management Model Version 5.2) was used for this purpose, which allowed for the inclusion of peak flow reduction, flood probability, and efficient stormwater management. Modeling was conducted using conventional sewerage systems and five scenarios: (1) stormwater tanks, (2) rain gardens, (3) bioretention areas, (4) combining storm tanks and rain gardens; and (5) combining storm tanks and bioretention areas. These were evaluated for different return periods, as mentioned in the methodology. Once the conventional sewer system model was completed, it was found that average diameters of 650 mm were obtained (see
Figure 10), with an average discharge flow of 612.90 L/s occurring 57 min after the start of rainfall. This was calculated using precipitation data from the alternating block hyetograph.
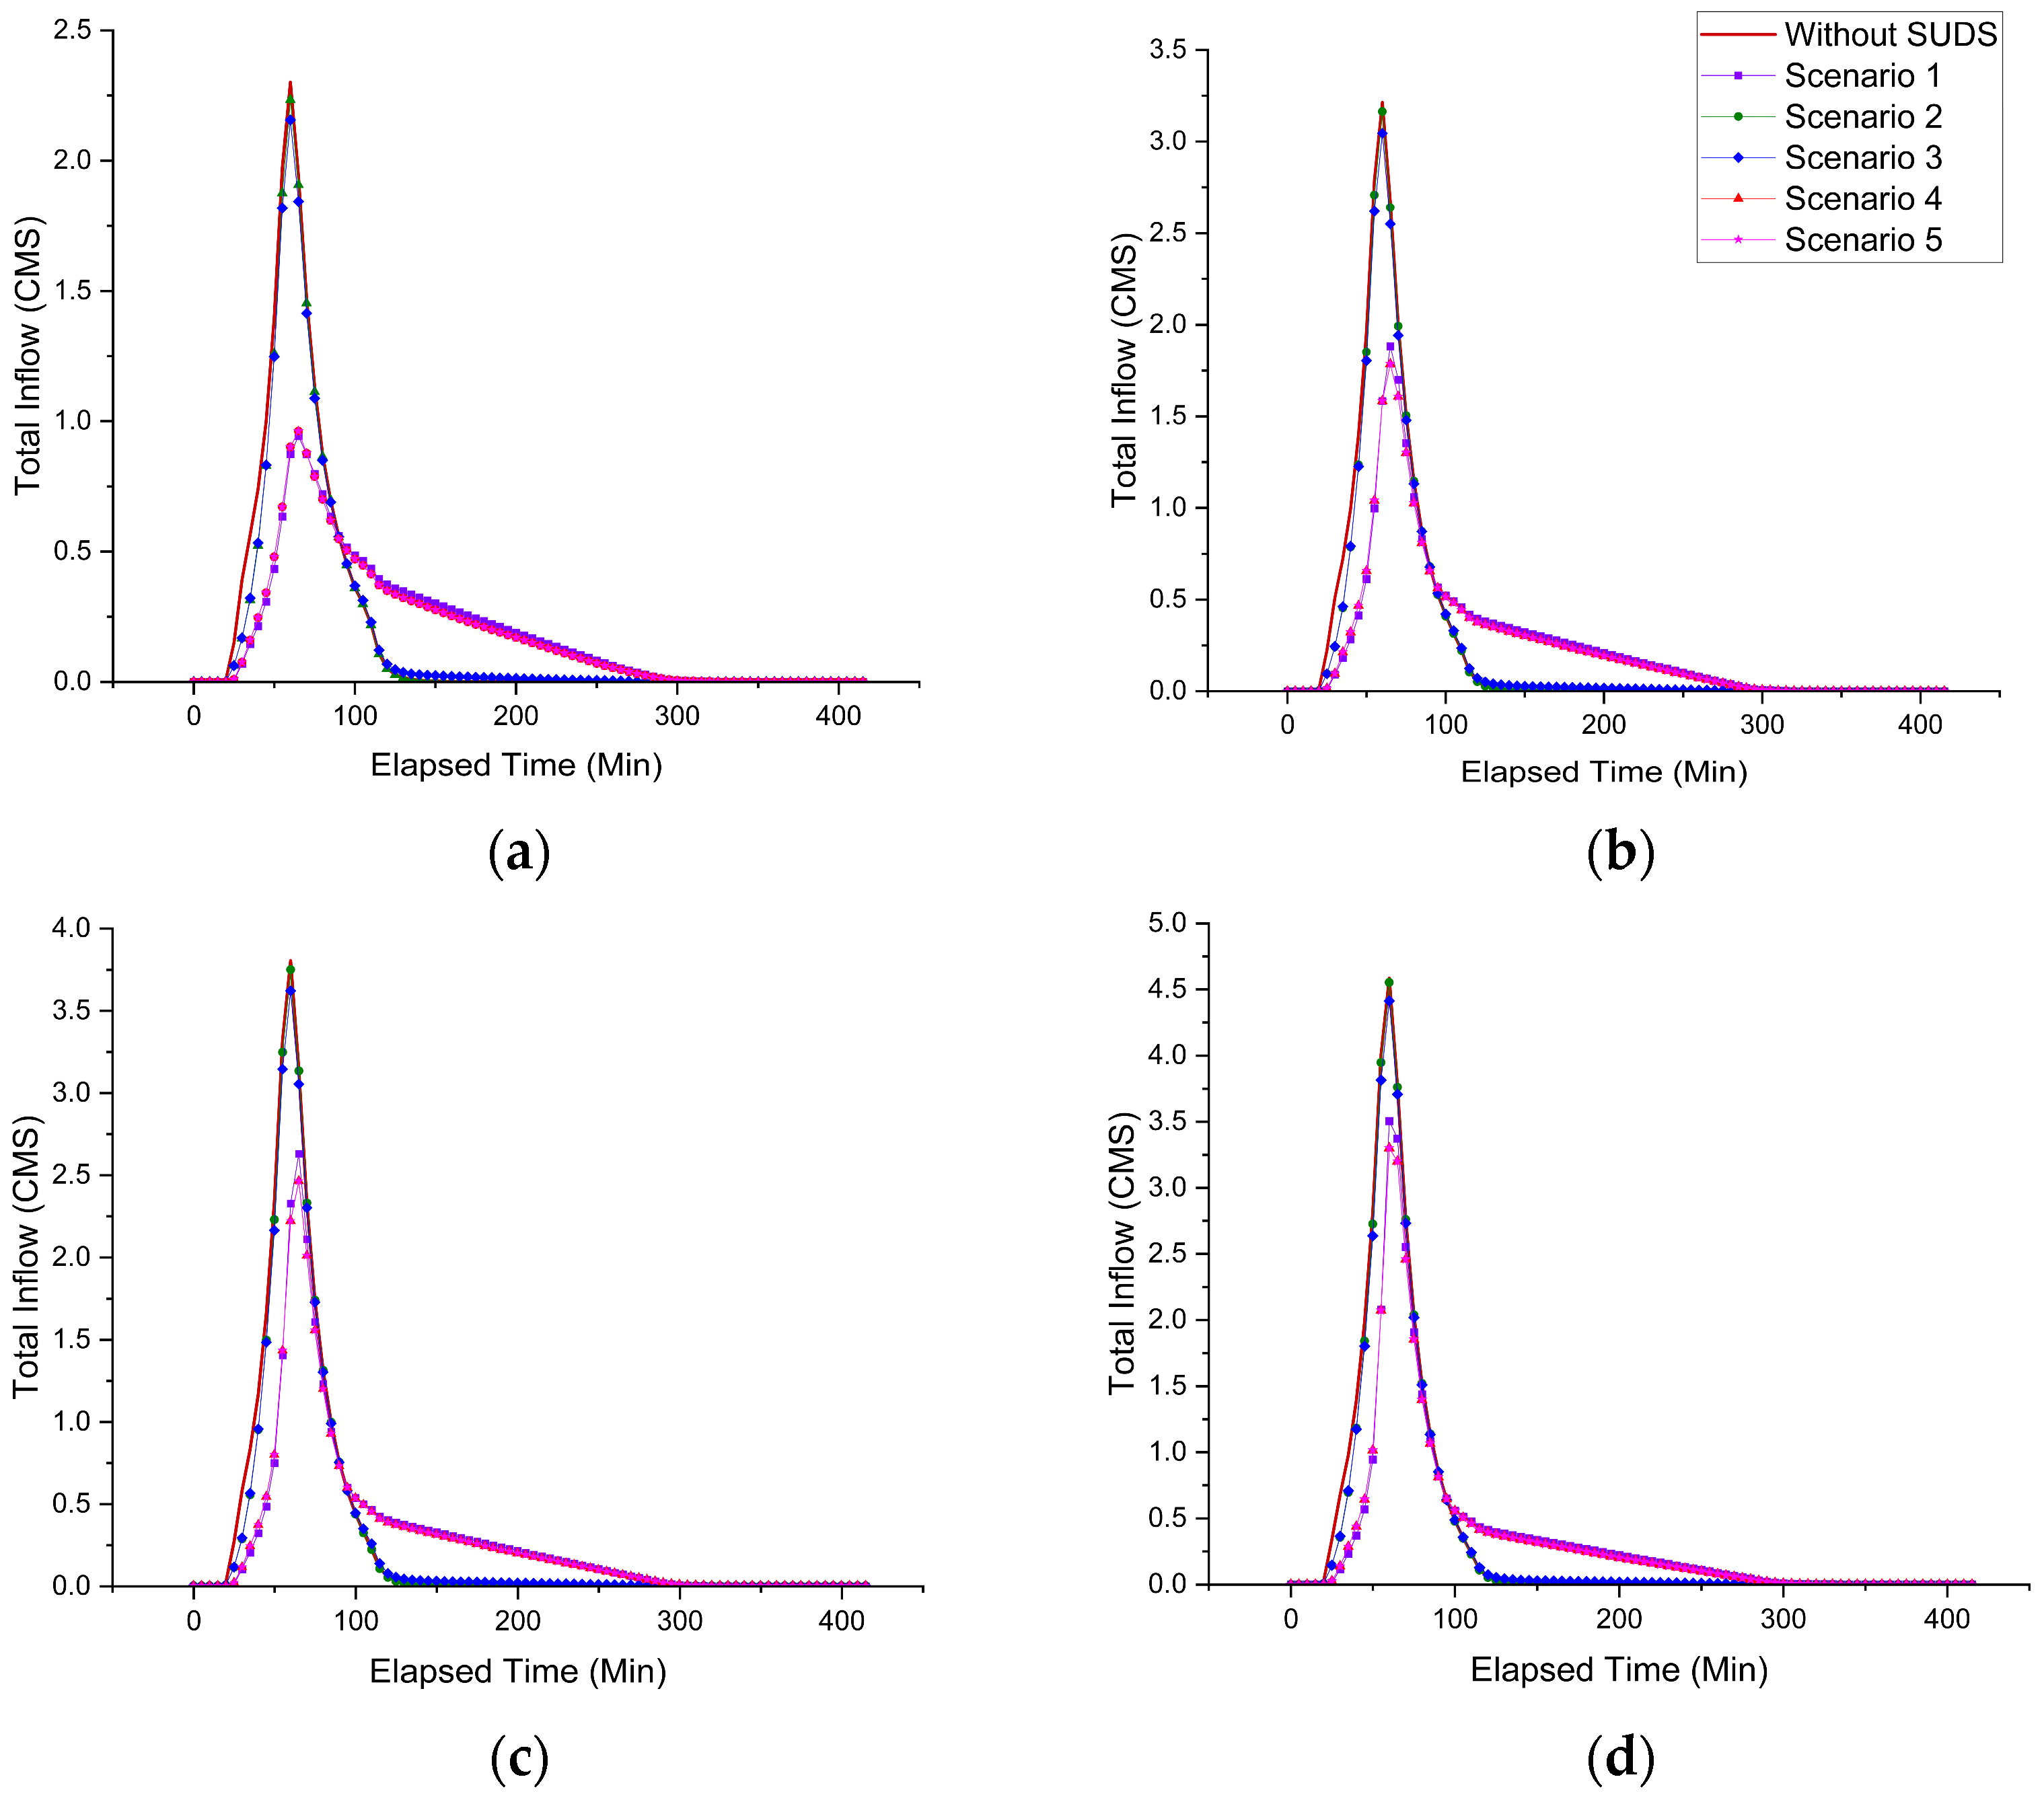
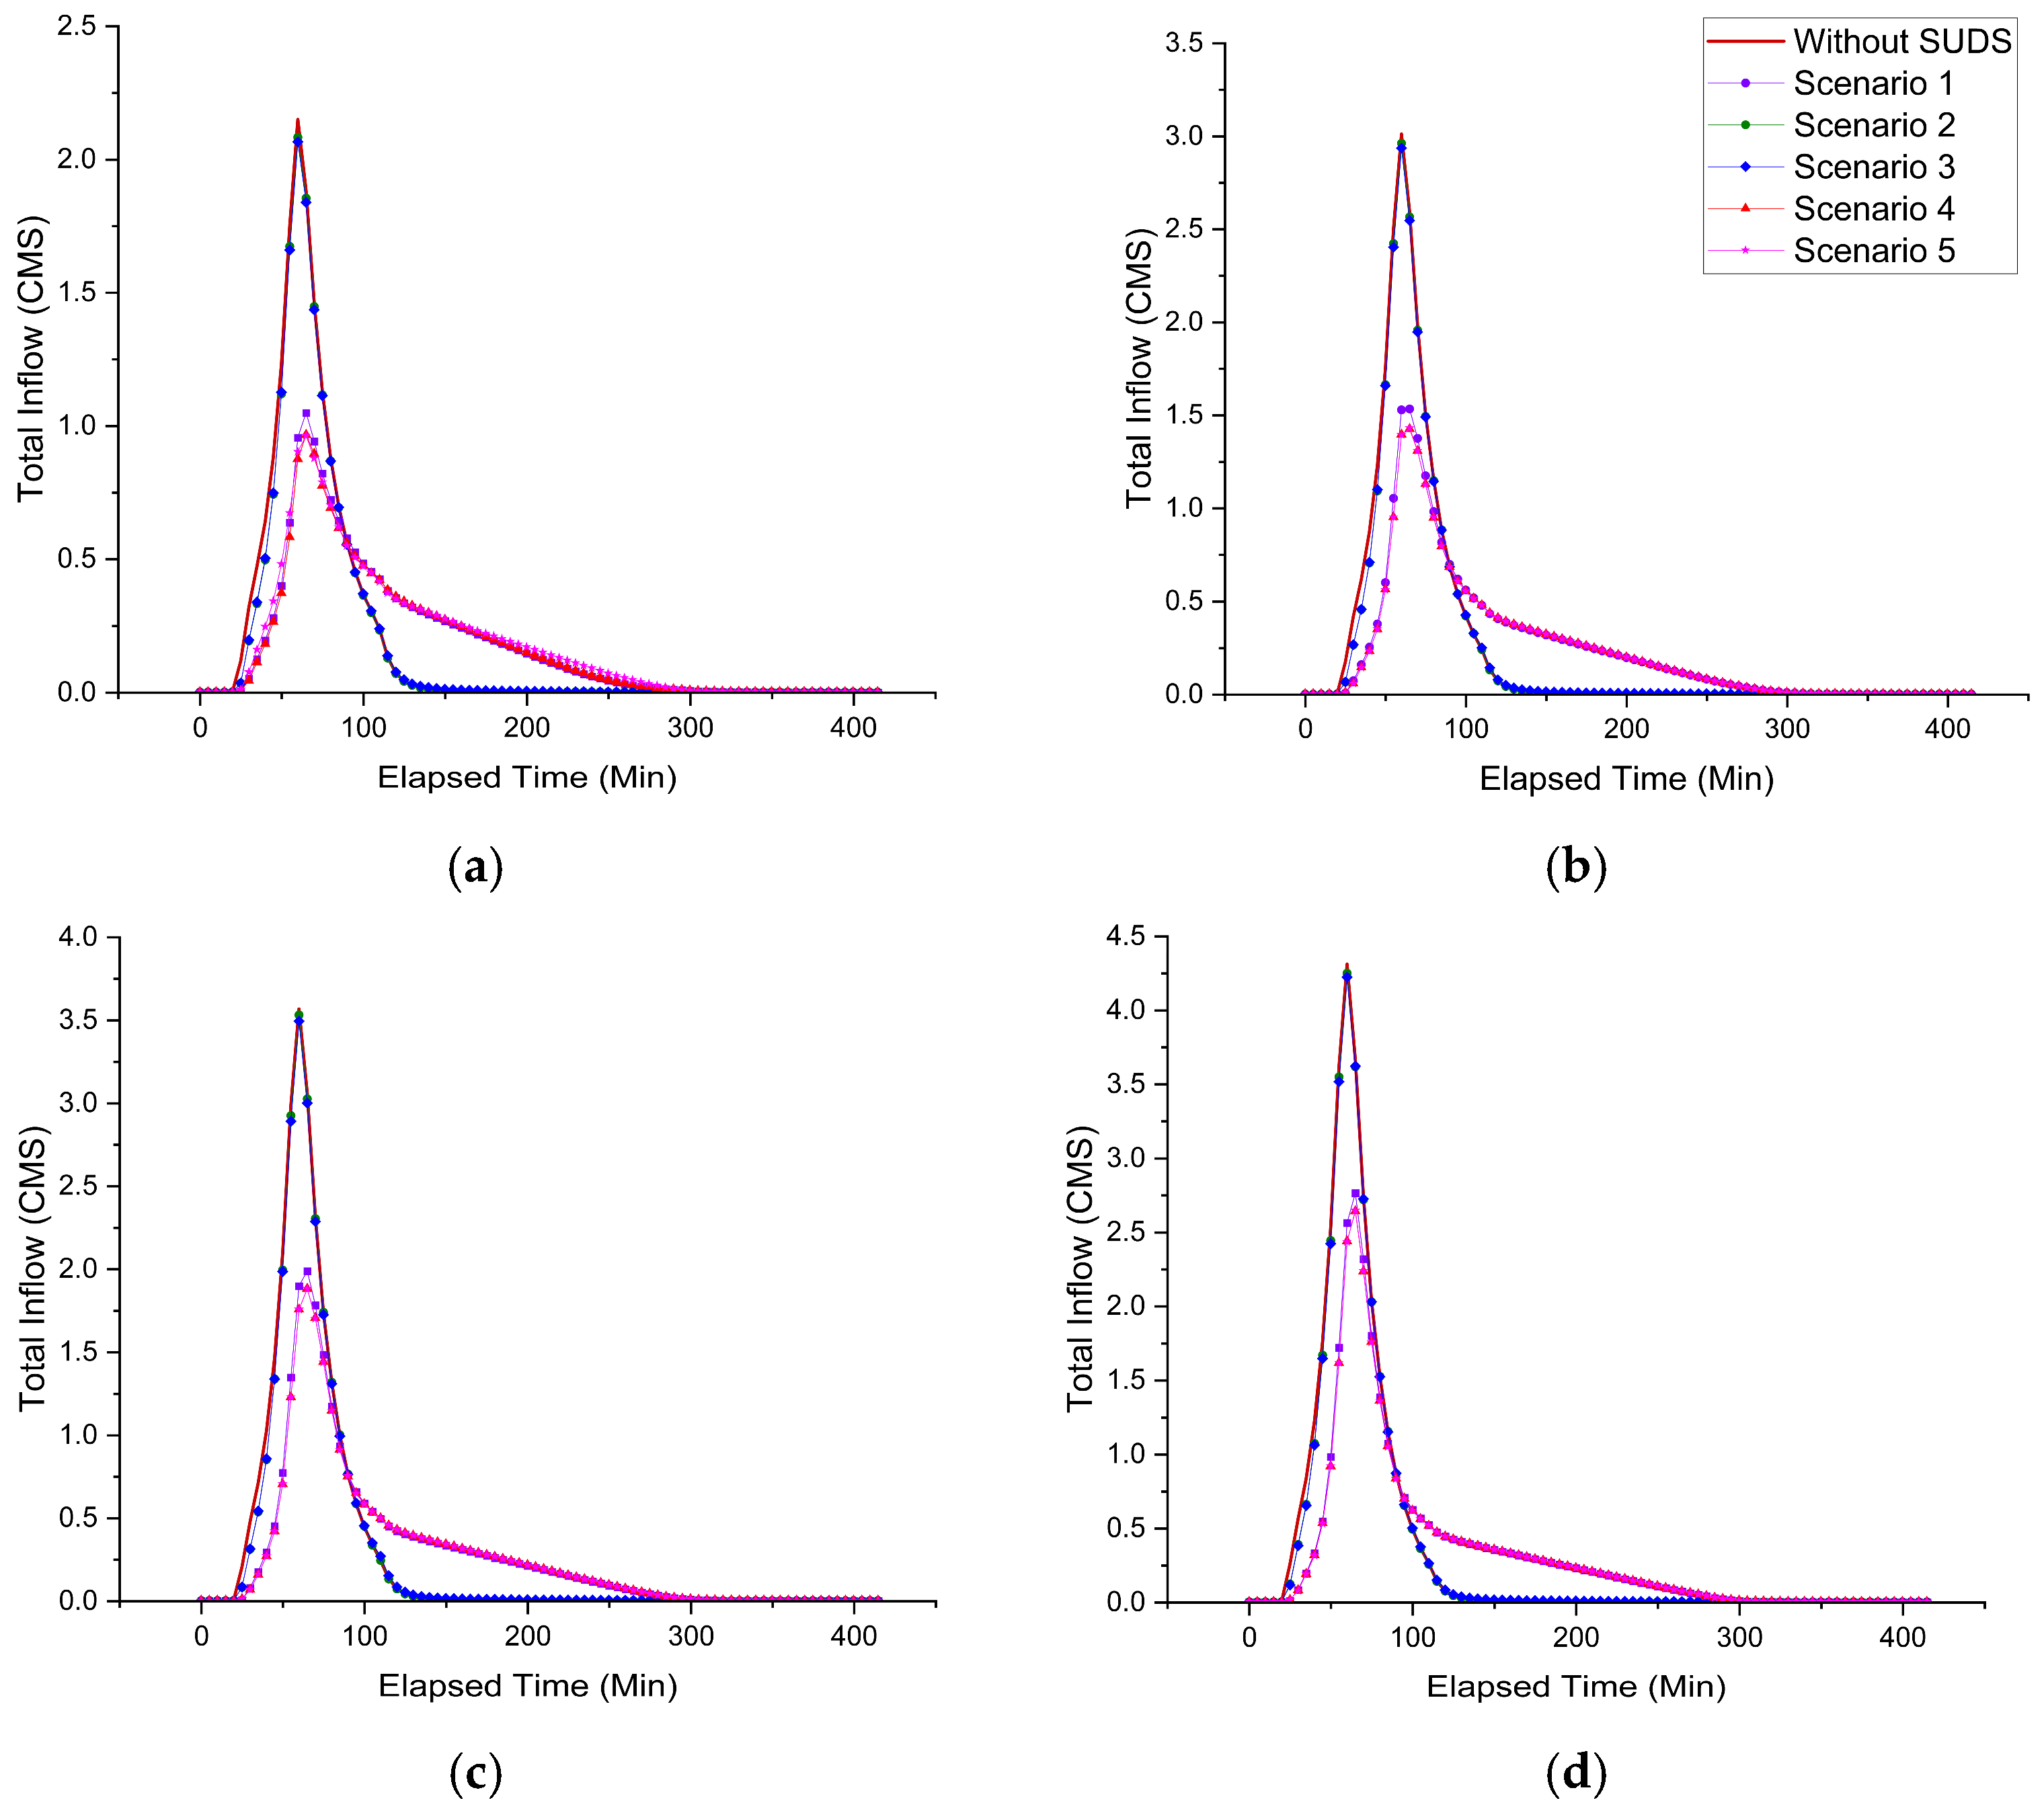
Figure 11 and
Figure 12 show the graphed results for outlets 1 and 2, respectively, after completion of the modeling, with return periods (2, 5, 10, and 25) and five initially established scenarios, including the scenario with only the proposed conventional stormwater drainage system.
Figure 11 and
Figure 12 show that scenarios 2 (rain gardens) and 3 (bioretention zones), for the different return periods, do not exhibit significant changes compared to the conventional stormwater drainage system. On the other hand, storm tanks (scenario 1), storm tanks plus rain gardens (scenario 4), and storm tanks plus bioretention zones (scenario 5) show a significant reduction in peak flows for all return periods. However, if we look at
Figure 11 and
Figure 12, the storm tank scenario shows the greatest reduction, so combining them with bioretention zones and rain gardens causes a significant improvement.
The average design flow rate obtained in the basins was 70.92 L/s, with a minimum flow rate of 8.7 L/s and a maximum of 302.02 L/s. For the pipe connections, 92 inspection wells were set up, with depths ranging from 1.2 m to 2.4 m to meet the delivery elevations at points S1 and S2, where the flows produced by the basins will arrive. These basins are proposed to be drained using catch basins. The average design flow rate handled by each of the inspection wells in the hydraulic modeling is 105.67 L/s, and the cumulative flow rate is 614.95 L/s. Therefore,
Table 8 shows the peak flow rates for outlets 1 and 2 for the conventional system, without proposing any flow minimization strategies.
Table 9 shows the peak flows and how the introduction of stormwater tanks affects the proposed conventional drainage system for stormwater management. In addition, the reduction in peak flow with these tanks was evaluated, demonstrating that they contribute to improved stormwater management, reduced flood risks, and optimized urban drainage in the area.
Table 9 shows the reduction in peak flow at outlets 1 and 2. Under scenarios 1, 4, and 5, the reductions range from 23.53% to 59.02% for the different return periods, highlighting the importance of comprehensive land planning that incorporates sustainable drainage strategies, risk management, and urban planning criteria to strengthen the water’s resilience against extreme precipitation events.
Therefore, after the analysis and in accordance with previous research, the results show that storm tanks are more efficient than rain gardens and bioretention swales in reducing peak flows. Lima Neto et al. found that implementing storm tanks in urban lots allowed for peak flow reductions of up to 71% in stormwater systems [
49]. Similarly, Sandoval and Ahammed reported that connecting the roofs of homes to rainwater tanks resulted in an 86% reduction in peak runoff [
50]. On the other hand, Gomes Jr. et al. demonstrated that when tanks are managed using real-time control strategies, their effectiveness increases even further, achieving reductions of nearly 79% in peak flow [
51].
Additionally, due to the characteristics of the study area, with a high density of buildings and impervious soil conditions, storm tanks (which occupy less surface area compared to volume captured) are more efficient than green infrastructure (rain gardens and bioretention areas), given the occurring extreme storms, which is consistent with the research findings associated with these tropical areas [
20].
On the other hand, and in other contexts, the SUDS that use vegetation may be preferable; however, in tropical countries, the net storage capacity of tanks is a robust response. This validates the premise that site-adapted solutions and a purely green approach may not be enough for the projected urban growth and climate threats [
52]. Detention tanks offer a high degree of hydraulic control and design flexibility, allowing them to be integrated into existing drainage networks and adapted to varying rainfall intensities [
53]. Consequently, they are considered a reliable and efficient strategy for stormwater management in highly urbanized areas [
54].
Therefore, it is important to mention that this problem must be analyzed because the proposed solutions are aimed at minimizing the impact of peak flows by prioritizing the hydraulic response capacity for flash flood management in dense tropical settlements and not water quality, where solutions can focus on other alternatives. These findings reinforce the superiority of storage systems over solutions based solely on infiltration, whose attenuation capacity may be limited by soil conditions or saturation.




 ,
,