


Abstract
Accurate modeling of dam reservoir sedimentation is crucial for effective reservoir management. Traditional approaches for estimating sedimentation include the Hydraulic Approach (HA) and the Empirical Approach (EA). HA involves complex computations and requires substantial data, while the EA relies on equations like the Universal Soil Loss Equation (USLE) and the Revised Universal Soil Loss Equation (RUSLE), which use subjective parameters and lead to inaccurate estimations. This study introduces a novel approach called the hydrological approach, which integrates the sediment rating curve (SRC) and the dam reservoir elevation-capacity curve (ECC) to estimate reservoir sedimentation and evolution of the ECC. This HA leads to a newly developed equation for the estimation of the sediment rise and the corresponding sediment volume. The approach is applied to the Wadi Fatimah Dam in Saudi Arabia. By combining rainfall data from 1985 to 2022 and performing rainfall–runoff hydrological modeling combined with the proposed HA, sediment accumulation trends and reservoir capacity reductions are estimated from past to present. Validation through ground survey and geophysical investigations in 2008 confirms model accuracy. Findings reveal significant sediment buildup, with an estimated average of 7.5 m rise from 1985 to 2008. The study’s main findings highlighted the urgent need for effective sediment management strategies in arid regions, where sedimentation rates are notably higher than in other regions.
1. Introduction
Reservoir sedimentation is a critical issue that affects the functionality and lifespan of man-made reservoirs [1,2,3]. This occurs when sediment, such as sand, silt, and clay, accumulates within a reservoir, gradually reducing storage capacity and impacting water supply, hydropower generation, and flood management [4]. Globally, sedimentation accounts for the loss of 1–2% of total reservoir storage each year [5,6]. Without mitigation, one-fourth of existing dams may lose their effective capacity within the next 25–50 years [7,8]. Alarmingly, annual global storage losses already exceed the gains from constructing new reservoirs [5,9].
The problem is especially pronounced in arid and semi-arid regions, including the Middle East, Australia, and Africa. In these areas, sparse vegetation and intense erosion significantly accelerate sediment delivery to reservoirs [5,10]. In the Middle East, for example, the average annual sedimentation rate reaches 1.02% [5,11], one of the highest globally. This highlights the urgency of adopting effective management and modeling approaches to extend reservoir lifespans.
Against this backdrop, two broad categories of models have traditionally been applied to estimate reservoir sedimentation: physically based (hydraulic) models and empirical models. Hydraulic models rely on detailed hydrodynamic and sediment transport parameters, often requiring extensive datasets [12,13,14,15]. Empirical models, such as the USLE and its derivatives [16,17,18,19], extrapolate sediment yields from observed data but can over- or under-estimate outside their calibration domains. Each approach has limitations, particularly in data-scarce arid environments.
Several studies have been conducted for estimating soil erosion and siltation of reservoirs using models like USLE, RUSLE by integrating them with GIS [20,21,22,23]. For instance, ref. [20] studied impacts of soil erosion on dam siltation in the semi-arid K’sob watershed, Algeria, using a geospatial methodology. By integrating the RUSLE with GIS and remote sensing data, the research identifies critical erosion zones and estimates average annual soil loss at 7.83 t/ha. The study by ref. [21] investigates soil erosion and sediment retention in Wadi Baysh, Saudi Arabia, using the RUSLE model integrated with remote sensing and GIS within the TerrSet platform. The research identifies significant erosion zones, highlighting an annual soil loss of 57.91 million tons, primarily concentrated in mountainous areas.
This study introduces a novel approach to reservoir sedimentation known as the hydrological model. The hydrological model bridges the gap between physical (hydraulic) models and empirical models by integrating hydrological inputs into its framework. This methodology offers a more comprehensive and easier understanding of sedimentation processes. While hydraulic models often rely on intricate physical measurements and detailed data, which can be challenging to obtain, especially in arid regions, empirical models based on historical or observational data may not capture the complex dynamics of sedimentation, leading to potential over- or under-estimation. The hydrological model addresses these limitations by integrating hydrological factors such as precipitation patterns, runoff characteristics, and sediment transport mechanisms.
The background behind this novel approach consists of two steps. First, it integrates the flood hydrograph generated from a rainstorm with the SRC developed from some gauged basins to develop the sediment hydrograph of the storm. In the second step, an ordinary differential equation is developed that relates the sediment discharge to the ECC developed by ref. [24] to estimate the sediment rise that corresponds to the loss of the reservoir volume over time. The developed differential equation is solved numerically using the explicit Euler method. To the best of our knowledge, no previous research has been conducted on the developed approach. Given the significant issue of dam reservoir sedimentation in arid regions, the proposed novel approach aims to achieve the following objectives: (1) propose a new model that establishes a relationship between sediment depth and runoff volume, (2) estimate the loss in dam height resulting from sedimentation, (3) estimate the temporal evolution of ECC, and (4) provide reservoir sedimentation scenarios under rainfall variability and sediment management operations.
2. Model Development
In 2009, ref. [24] introduced a semi-empirical and dimensionless equation that establishes the connection between water depth and storage capacity. This equation was formulated based on the resemblance between the natural logarithmic function curve and the stage-storage capacity curve. It relies on a single dimensionless variable known as the reservoir coefficient “N”.
where is the reservoir storage capacity at depth y and is the reservoir storage capacity at maximum depth and N is the reservoir coefficient derived from fitting.
From Equation (1), the dimensionless depth of the reservoir will be given as:
The dimensionless water surface area derived from Equation (1) will be given as follows.
where surface area of the water at depth y and is the surface area of the water that corresponds to the maximum elevation.
To develop our model, we started by developing SRC, which is an equation that relates the stormwater discharge to the sediment mass discharge. For this purpose, we have used seven gauging stations in southwestern Saudi Arabia, specifically from Wadi Yiba and Liyyah. The SRC typically is expressed in power format, and a logarithm can be introduced to linearize the equation [22,25,26].
where is sediment mass discharge in [M/T], Qw is storm water discharge in [L3/T], and a and b are the fitting parameters for the sediment transport.
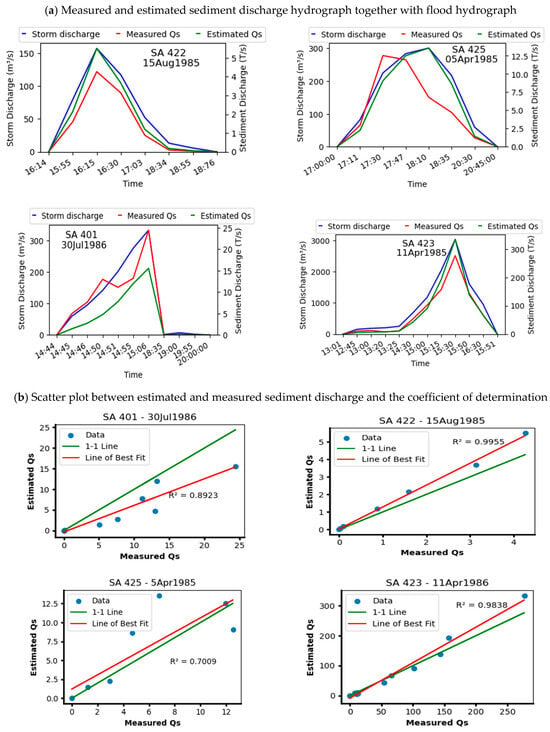
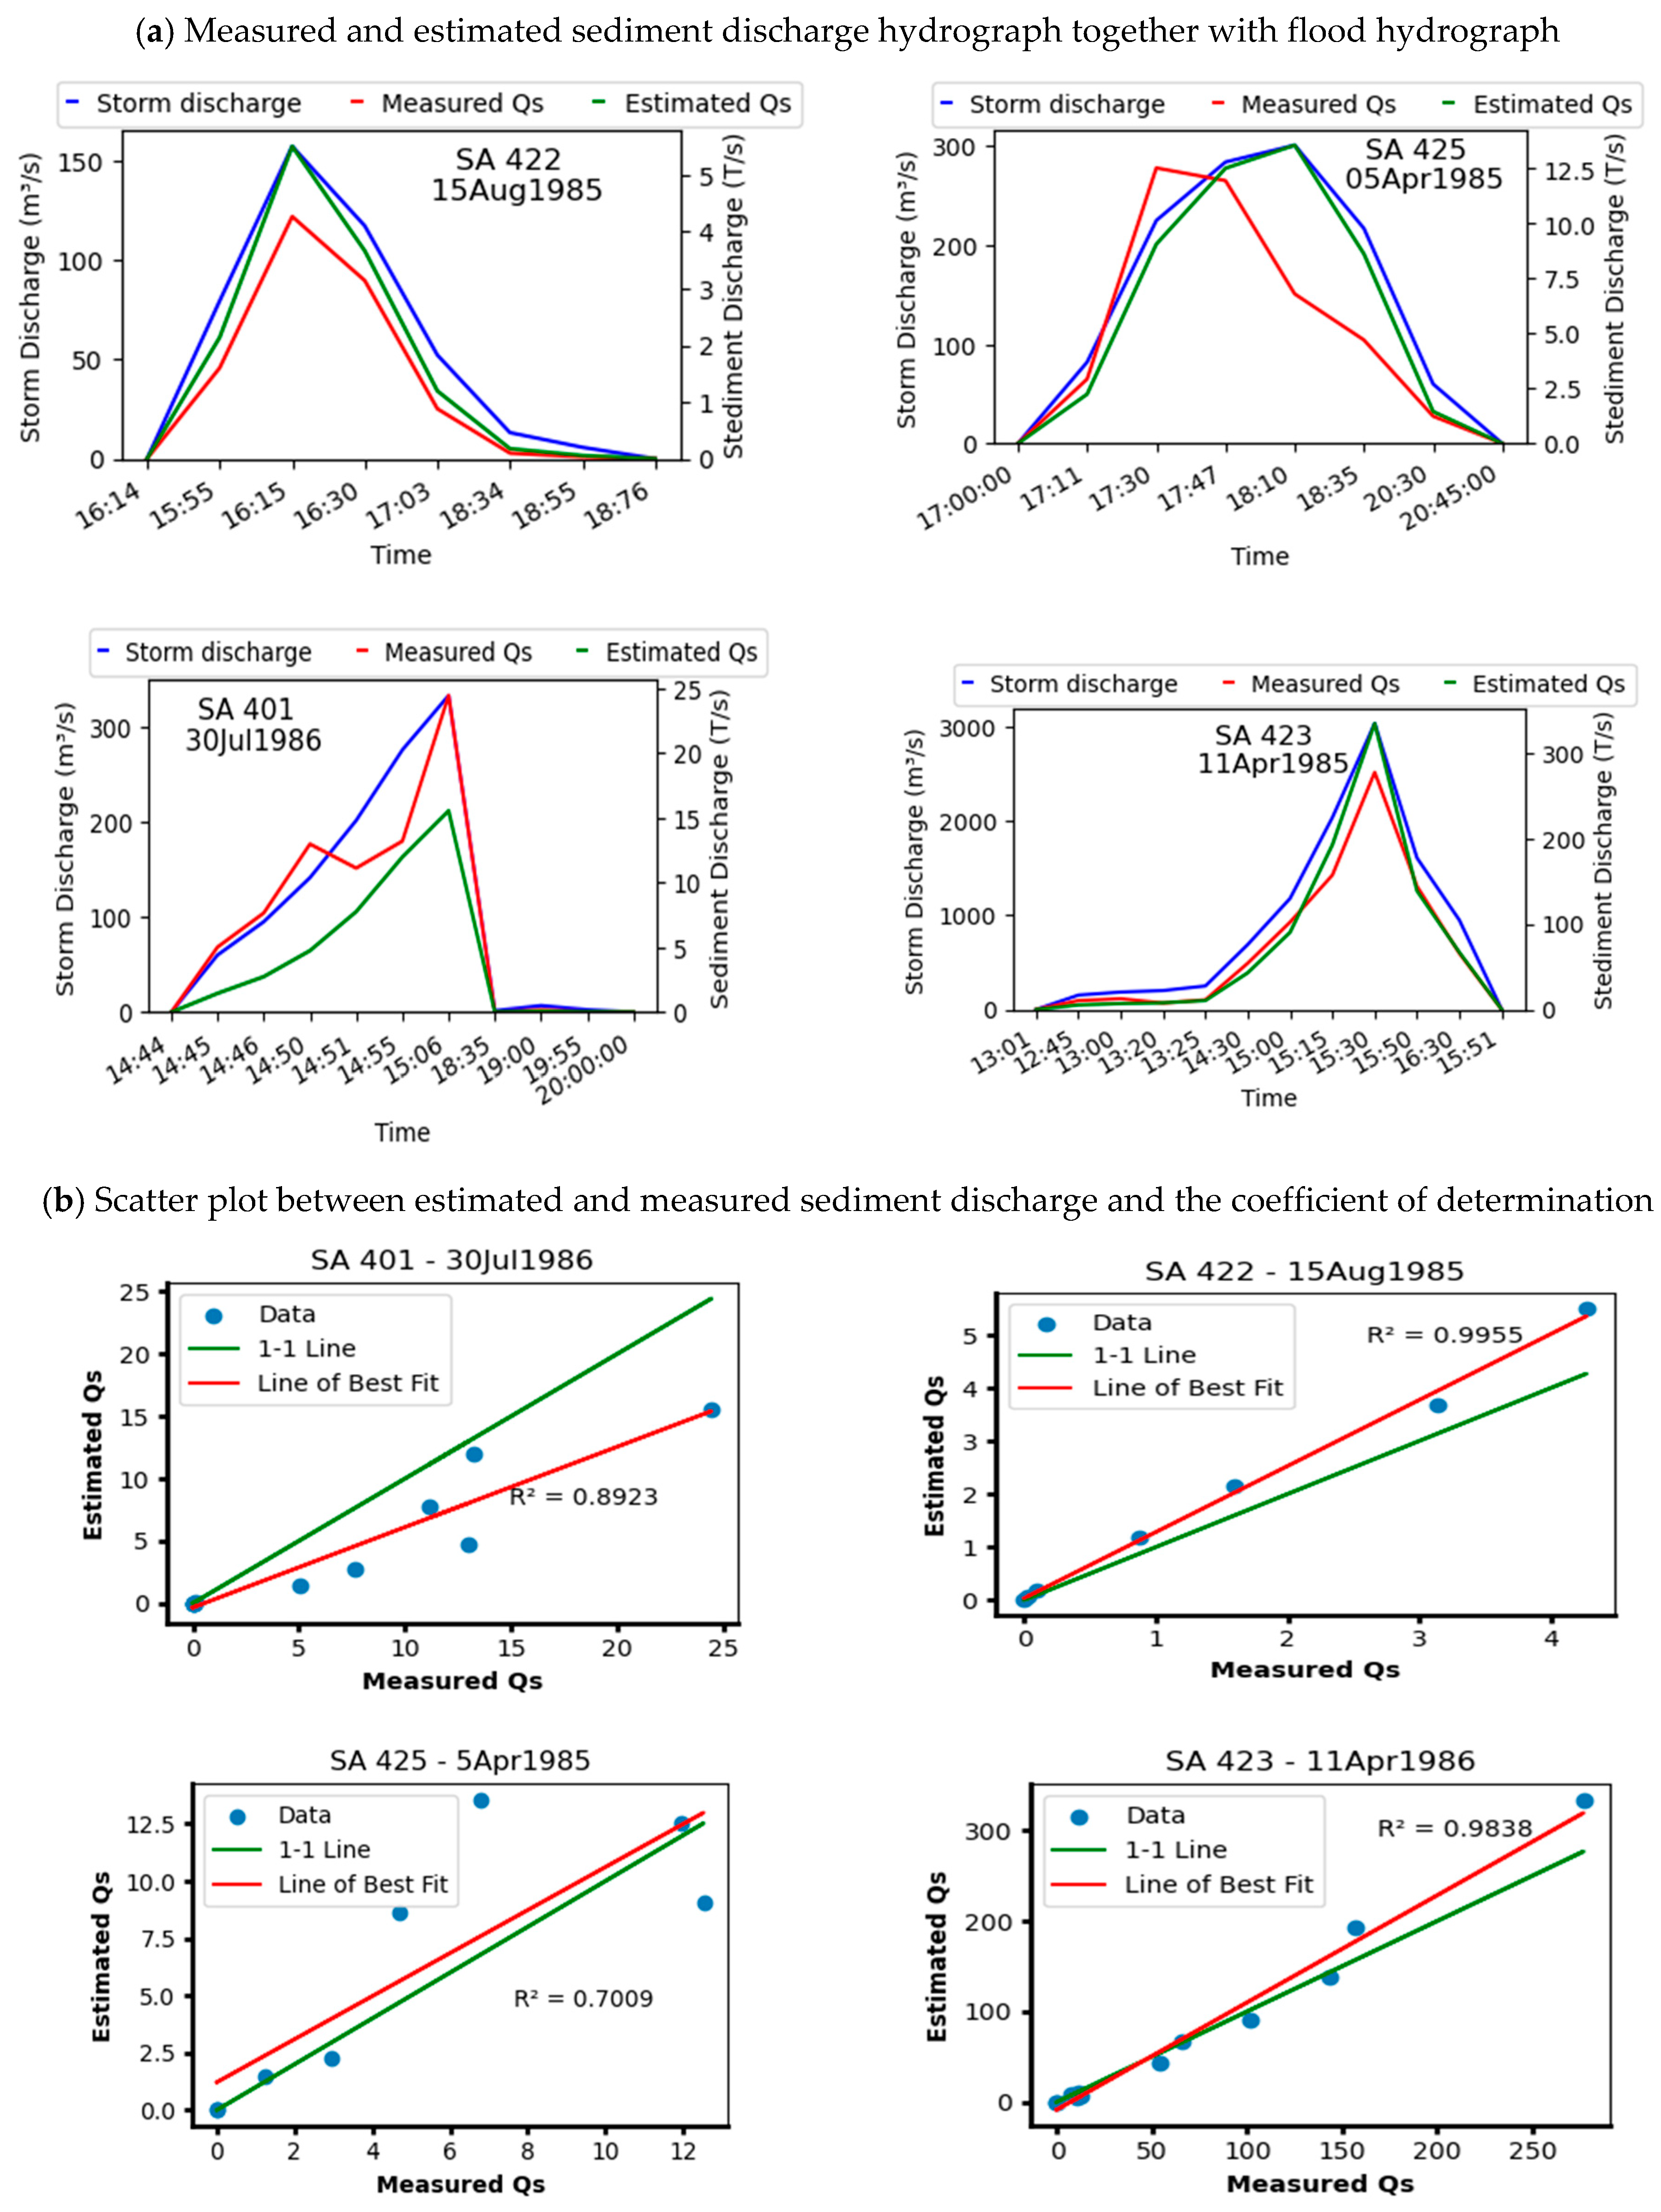
Research on sediment transport dynamics in southwestern Saudi Arabia has been reported [27]. Through their research, ref. [27] did validation and cross-validation in the region and concluded that it is possible to apply a sediment rating curve (SRC) to estimate sediment transport in ungauged basins within the same geographical area, provided that runoff or streamflow data is available for the area under study. Table 1 depicts the parameters a and b of Equations (4) and (5) obtained from ref. [27] for each sub-basin and the general equation for the Yiba basin. Before applying the developed SRC equations for the dam reservoir sedimentation study, the performance of the equations was checked by reconstructing the sediment discharge hydrographs from the water discharge hydrographs at several stations in the basins and some rainfall–runoff events via applying the developed SRC general equation for the Yiba basin, as shown in Figure 1a,b. This hydrologically controlled behavior is also supported by findings from other arid-region studies. For example, ref. [28] demonstrated that sedimentation rates in Lake Urmia (Iran) are primarily governed by water volume and sediment inputs from contributing rivers. Their study further showed long-term stability of sedimentation processes from the early Holocene to the present, indicating that sedimentation dynamics in arid environments are largely controlled by hydrological inputs rather than short-term climatic variability alone [28].
Table 1.
The fitting parameters (a and b) of the SRC equations of the Yiba basin [27].
Figure 1.
Performance of SRC equations: (a) measured water, sediment and estimated sediment hydrographs in Wadi Yiba using the generalized SRC equations with parameters given in Table 1, and (b) scatter plot and coefficient of determination for the measured and estimated sediment discharges.
By combining the available runoff or streamflow data with SRC equations, it becomes possible to estimate sediment discharge in the ungauged basins within southwestern Saudi Arabia, like Wadi Fatimah Dam (the current case study). The SRC provides a means to relate the measured streamflow to sediment concentration, enabling the estimation of sediment discharge or concentration.
The ECC (Equation (2)) can be rearranged as follows,
where y is the reservoir depth in m, is the maximum dam height, is the dam reservoir volume that corresponds to y, is the maximum capacity of the dam and N is a reservoir coefficient specific to the dam.
Differentiating Equation (6) with respect to time, t, one gets the temporal evolution of the ECC as follows,
The term is the volumetric rate of change in the reservoir volume in time, which in our case is the volumetric sediment discharge.
By introducing the average sediment density (), which represents the mass of sediment per unit volume [M/L3], the SRC can be expressed as:
where is sediment discharge at time t in [M/T], is average sediment density [M/L3], and is in [L3/T].
Introducing the SRC equation, one can have a sediment discharge as a function of stormwater discharge as,
is the storm water discharge at time t.
By substituting Equation (9) into Equation (7), one gets,
Rearranging Equation (6) to read,
Then, substituting Equation (11) into Equation (10), one gets,
Equation (12) is a differential equation that relates the sediment rise in the reservoir to the water hydrograph. This equation can be solved numerically using the explicit Euler method with a selected time step (Δt) to read,
where is the sediment buildup height at time t, is the sediment buildup height at time , is the maximum dam height, is the maximum dam storage capacity, is the time step, is water discharge, is average sediment density, N is the reservoir coefficient specific to the dam and a and b are SRC parameters.
Once the sediment depth is estimated from Equation (13), the reservoir volume at a specific time is calculated by,
After applying the aforementioned model and completing the necessary data preparation, modeling, and analysis, the following outlines how the model is implemented to estimate the evolution of the ECC.
- (1)
- Estimating the sediment rise each year by incorporating the proposed equation.where J is the number of years, is the sediment rise at year i, which is estimated by Equation (16), and is sediment rise after J years.
- (2)
- Estimating the volume reduction in the dam.where sediment volume at year i, is the design capacity and is the reservoir capacity after J years.
- (3)
- Estimating the effective dam height by subtracting the total sediment rise from the reservoir design height.where is the reservoir design height, is the sediment rise every year and is the effective reservoir height after J years.
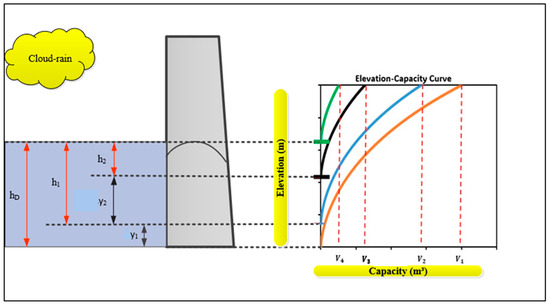
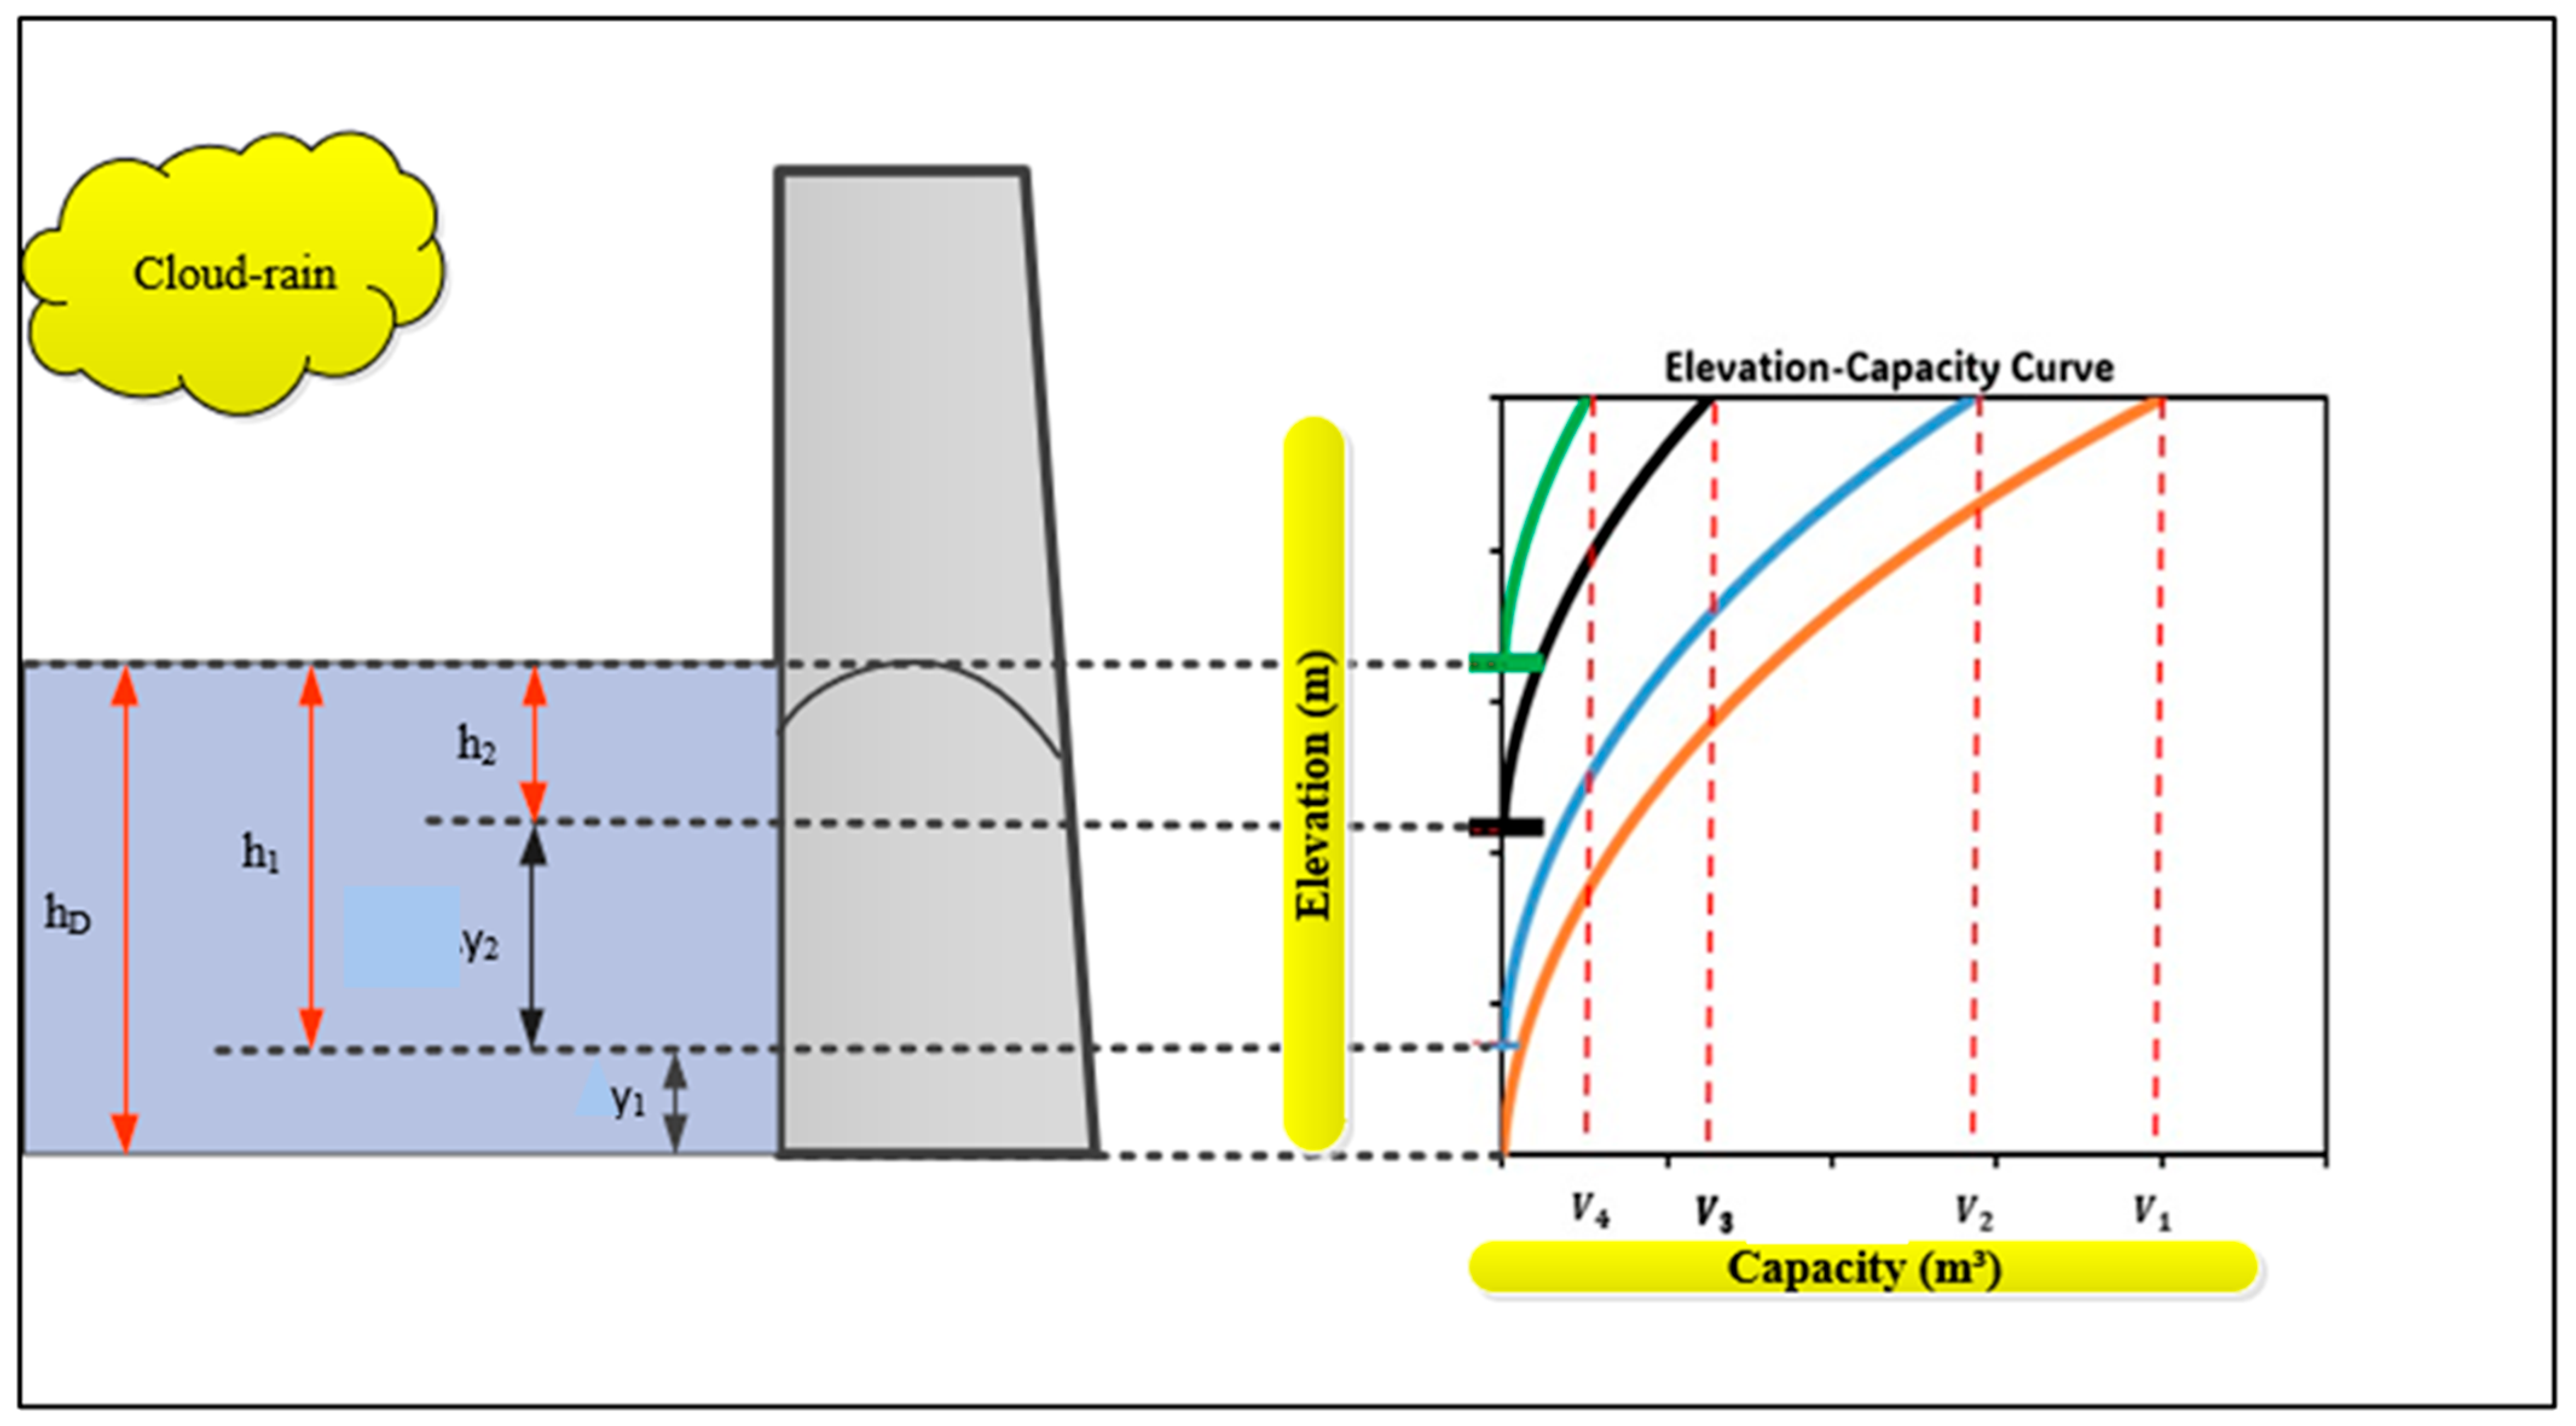
Figure 2 presents a conceptual model for the temporal evolution of the dam capacity curve due to the accumulation of sediments and the corresponding reduction in reservoir capacity.
Figure 2.
Conceptual model showing the sediment rise and the resulting reduction in storage capacity of the dam.
3. Wadi Fatimah Dam as a Case Study
3.1. Study Area
3.1.1. Wadi Fatimah Watershed
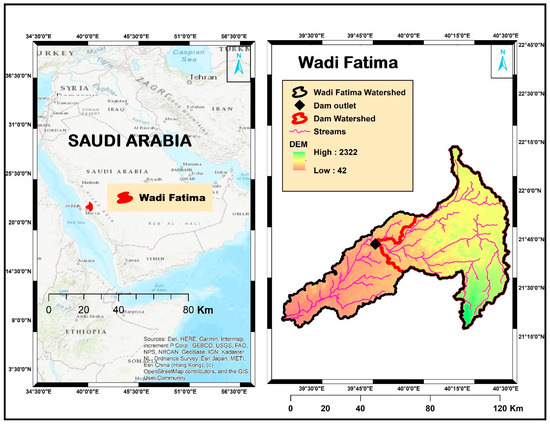
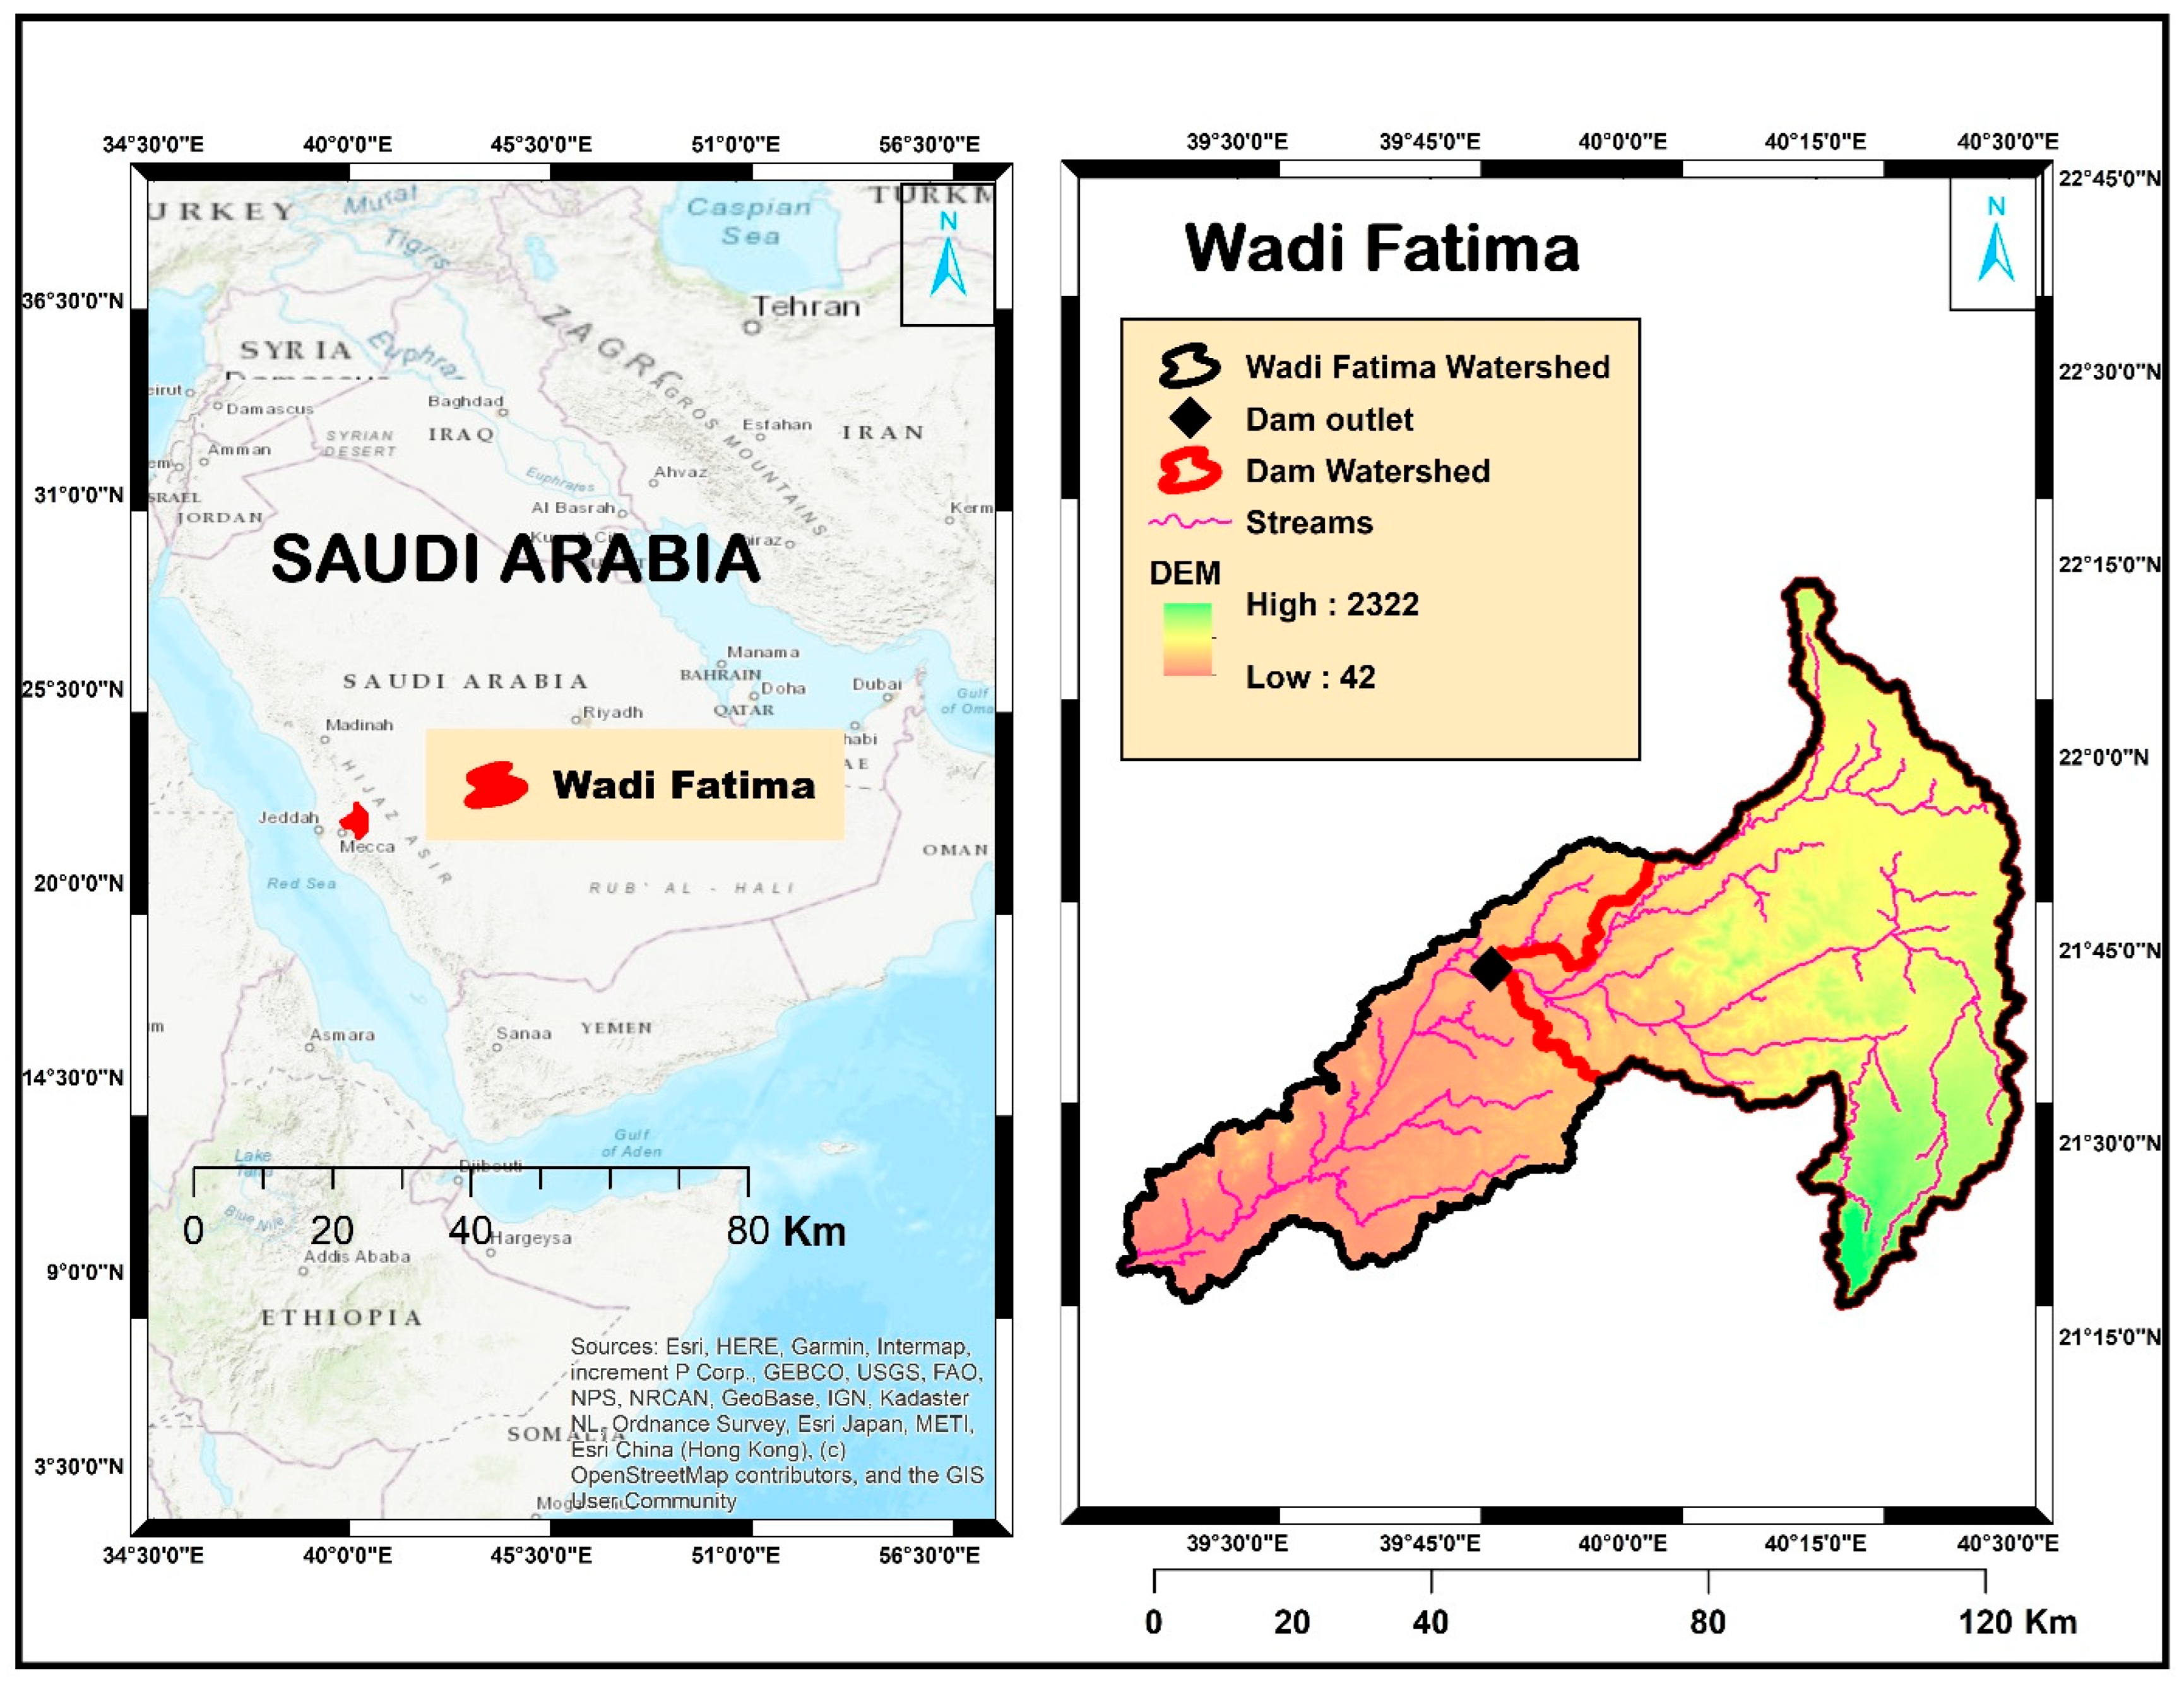
Wadi Fatimah is located in the Makkah region of Saudi Arabia, on the western coast of the country (Figure 3). The wadi is found between the latitudes of 21°16′ and 22°15′ N and longitudes of 39°15′ and 40°30′ E (Figure 3). The recharge areas of the wadi are near Taif province, and some urban areas are located on the side of the wadi, such as Al-Jumum and Bahrah [29,30].
Figure 3.
General location of Wadi Fatimah (left map), Wadi Fatimah watershed, dam location, stream networks, and DEM (right map).
Rainfall events in arid Saudi Arabia, in general, and the study area in particular, are characterized by their sporadic nature and high variability. Wadi Fatimah is an integral component of the Yemeni-Az Zibarah-Fatimah drainage system, stretching from As Sayl Al Kabir, located 125 km east of Jeddah in western Saudi Arabia. Al-Jumum city is positioned approximately 55 km to the east of Jeddah and 30 km northwest of Makkah. Within the Western Region of Saudi Arabia, Wadi Fatimah is recognized as a significant drainage basin, serving as the primary source of groundwater for the cities of Makkah and Jeddah.
The upper reaches of the wadi receive an average annual rainfall of around 280 mm, with more than 70% of this precipitation occurring during the rainy season from December to May. For the remainder of the year, rainfall is scarce. The lower areas of the basin are among the driest in the region, with an average annual rainfall of less than 70 mm [31,32,33,34]. The region experiences substantial evaporation, exceeding 1000 mm per year, significantly impacting the overall water balance and quality.
Wadi Fatimah displays typical wadi characteristics in terms of geomorphology, originating from the western part of the Arabian shield’s escarpment ridge. It starts from an elevated mountain range in the east, which has a steep slope, and gradually descends towards the coastal plain of the Tihama region in the west. Wadi Fatimah has an altitude ranging from 10 to 2314 m and an average elevation of 753 m above sea level (amsl). The region surrounding Wadi Fatimah has diverse geomorphologic characteristics, which can be classified as: (1) high-elevation mountain regions primarily composed of Proterozoic rocks with peaks as high as 2314 m (amsl), which cover the majority of the basin’s catchment area. The region’s topography has a significant impact on rainfall patterns, particularly in the highly elevated areas, which have an orographic influence. (2) A hilly area occupying the eastern and middle parts of the wadi consists of dissected and weathered rocks. (3) Piedmont plains are located in the low-lying areas between the highlands and the Red Sea. These plains include morphotectonic depressions as well as the basin’s primary tributaries [35,36,37,38].
3.1.2. Wadi Fatimah Dam
Wadi Fatimah Dam is one of the biggest dams in the Makkah region of Saudi Arabia. This Dam was built in 1985 to recharge groundwater, as Saudi Arabia is one of the freshwater-scarce regions.
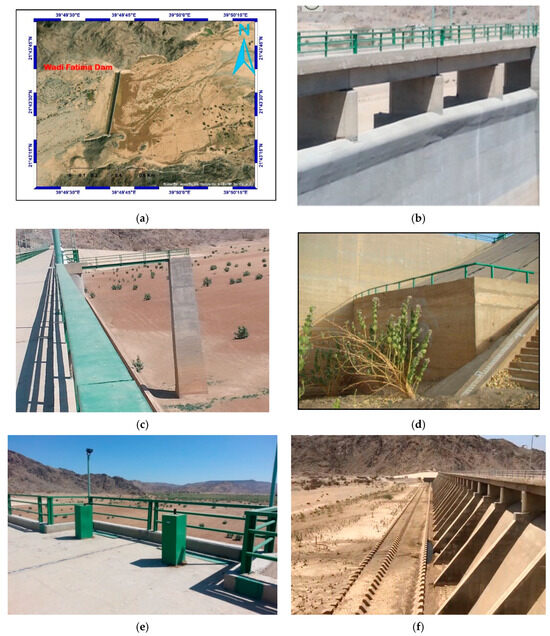
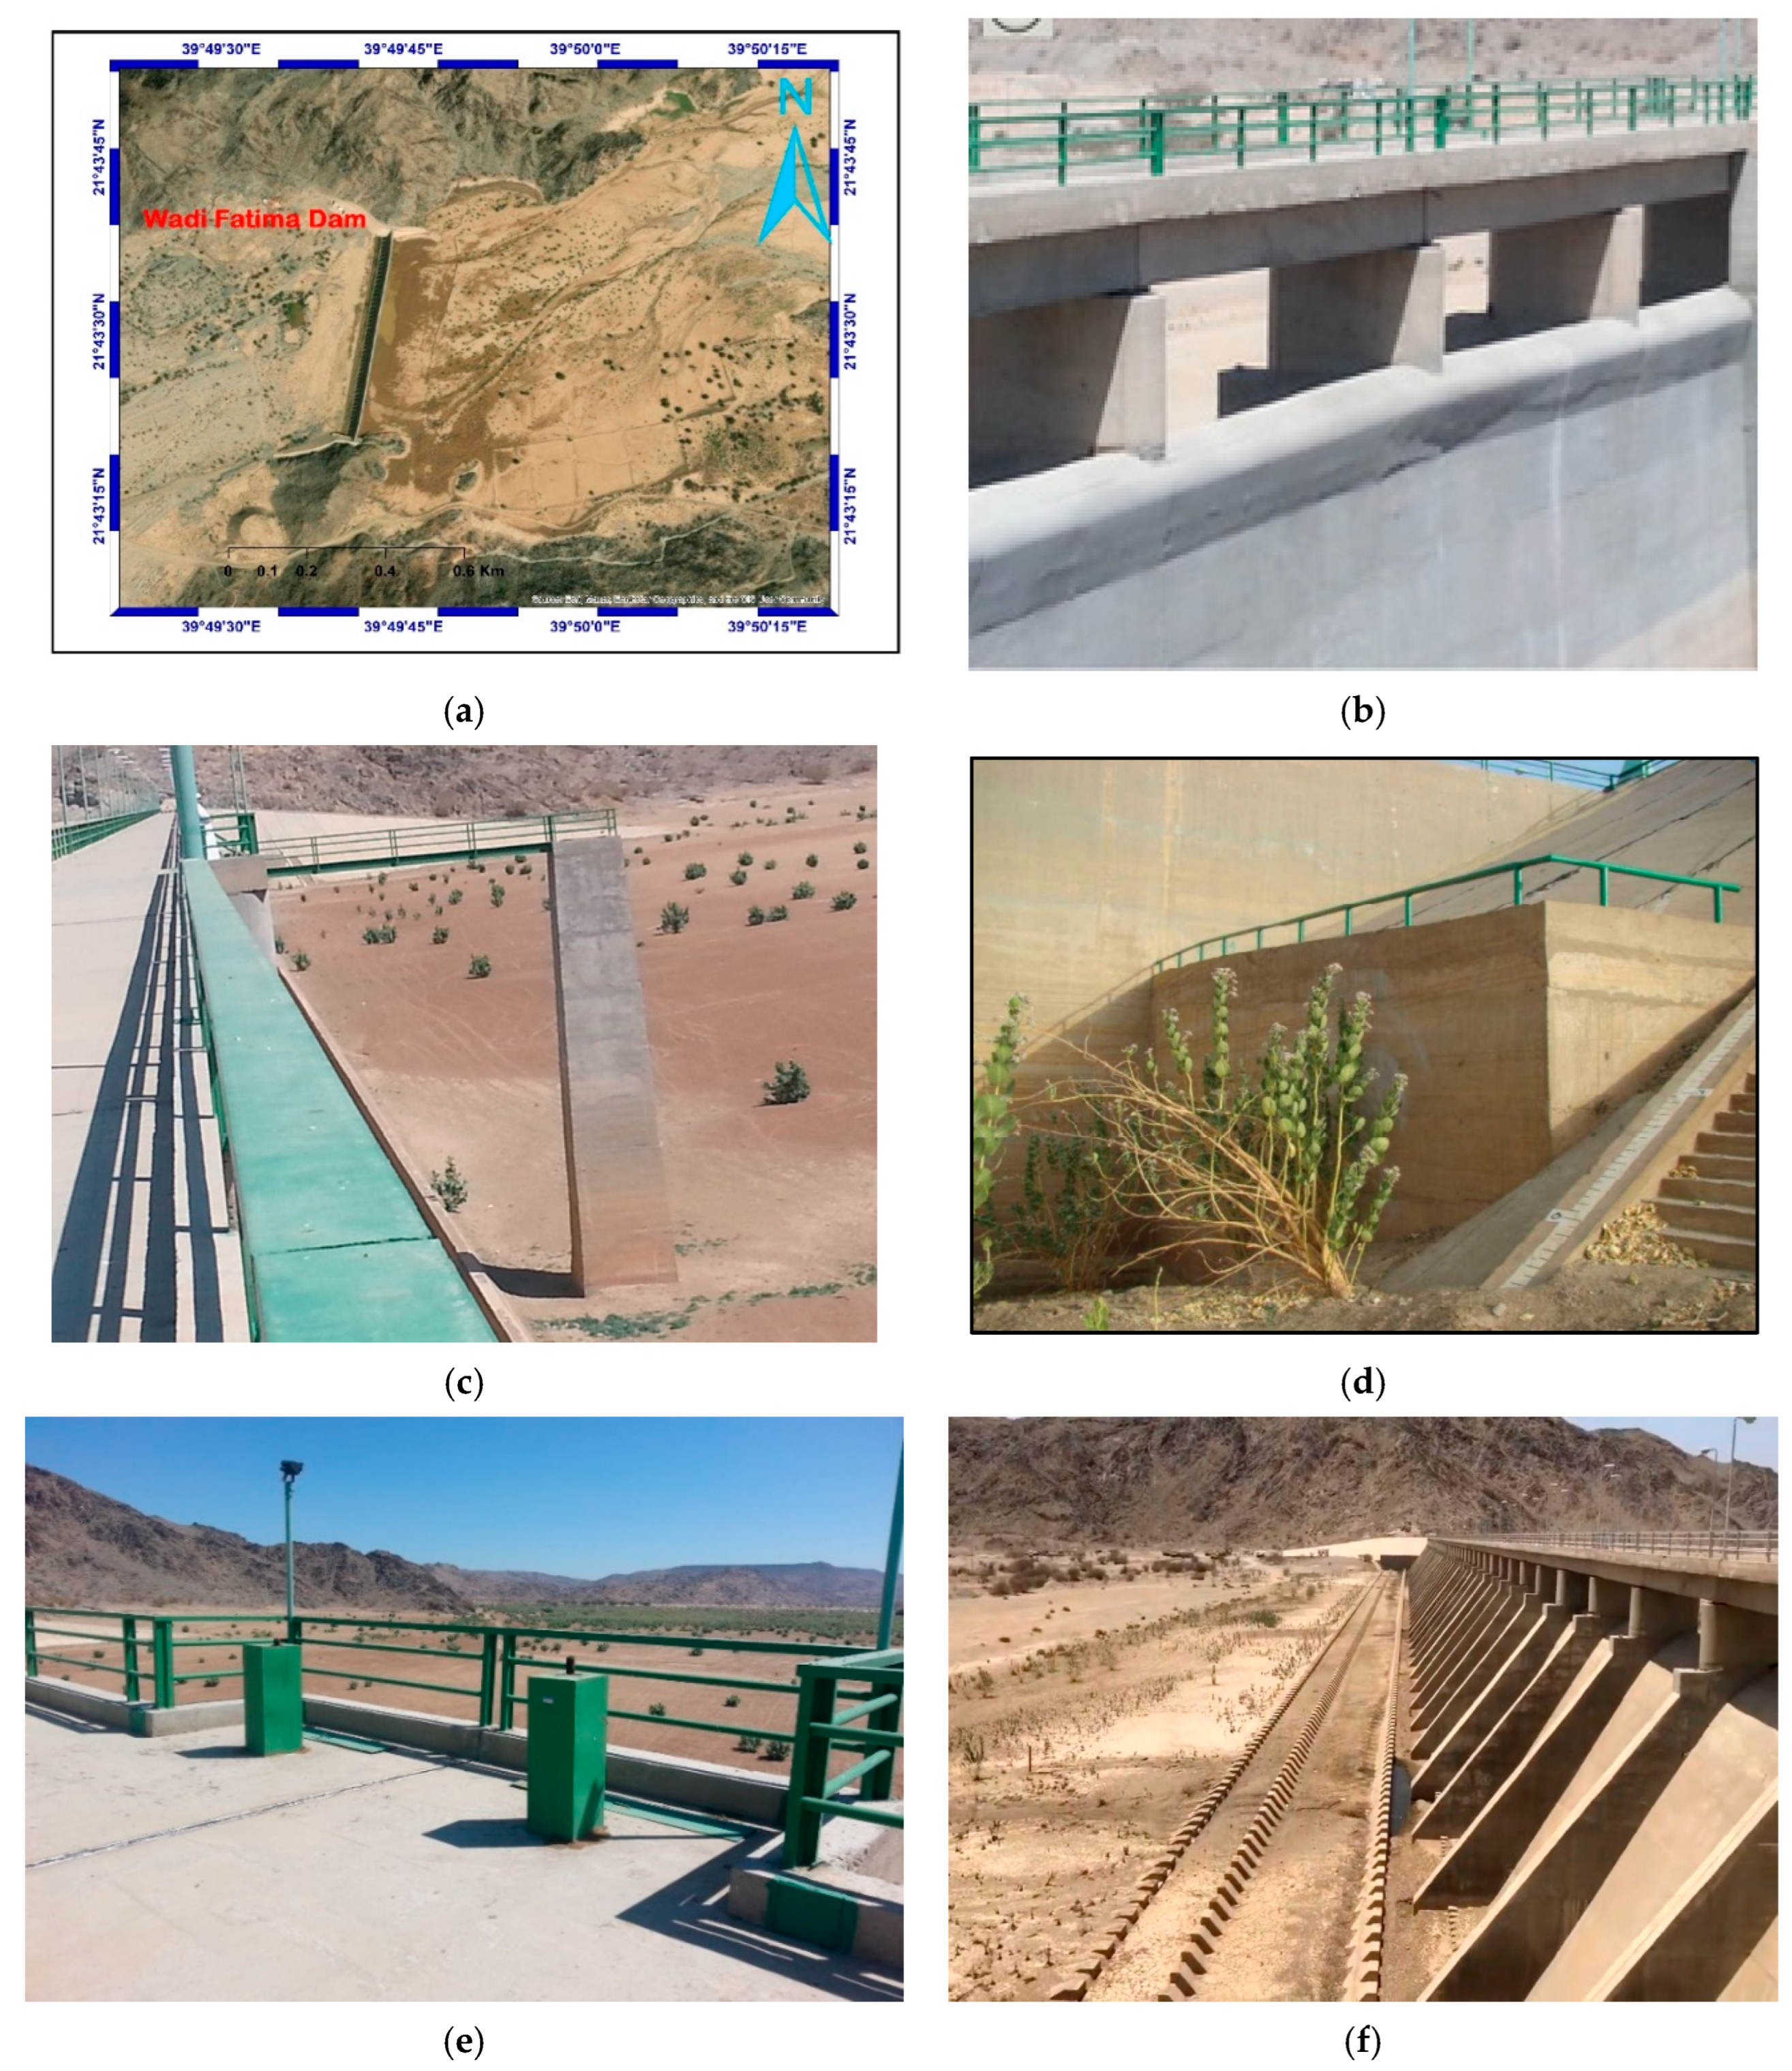
The Wadi Fatimah dam (Figure 4) comprises four primary elements [36]:
Figure 4.
Wadi Fatimah dam images: (a) satellite imagery, (b) dam spillway, (c) dam deck, (d) dam meter bar for measuring water level/sedimentation, (e) dam outlet mechanical part, (f) dam baffle/chute blocks for dissipation of energy.
- The dam structure is constructed using concrete, which is designed as a gravity-type dam.
- The dam spillway is responsible for safeguarding the dam and facilitating the safe release of excess floodwater over the spillway crest.
- The dam outlet, located near the bottom of the dam, aids in the controlled drainage of the dam reservoir when it reaches its maximum capacity.
- The dam stilling basin, situated downstream of the dam, serves the purpose of dissipating the energy of water discharged from either the spillway or the dam outlets. Its role is to shield the downstream channel from erosion and, consequently, prevent the dam from experiencing overturning failure (Figure 4).
The dam properties are described as follows in Table 2.
Table 2.
Wadi Fatimah dam properties.
3.2. Methodology for Model Application
3.2.1. Data Collection
Hydrological investigations in arid and semi-arid regions are frequently constrained by sparse, discontinuous, or entirely absent long-term monitoring records, particularly for streamflow and sediment transport. In Saudi Arabia, this limitation is pronounced due to the ephemeral nature of wadis, high transmission losses, and the limited number of operational gauging stations. Consequently, direct discharge and sediment measurements are unavailable for many basins, including Wadi Fatimah. To overcome these constraints, regionalization approaches that utilize data from nearby gauged basins with comparable climatic, geological, and physiographic characteristics are commonly adopted and widely accepted in arid-zone hydrological studies.
The hydrological data, specifically rainfall data for the Wadi Fatimah Dam, were sourced from the Saudi Arabian Ministry of Environment, Water, and Agriculture. This dataset spans from 1985 to 2022, providing a comprehensive view of precipitation trends in the study area. To address the absence of discharge records in Wadi Fatimah, hydrological parameters were calibrated using data from the Wadi Al-Lith Basin, a gauged watershed in the southwestern region of Saudi Arabia. Wadi Al-Lith was selected due to its geological and climatic similarity to Wadi Fatimah, making it an appropriate proxy for estimating runoff in the ungauged Wadi Fatimah basin.
The sediment data were derived from measurements taken at seven gauging stations in southwestern Saudi Arabia, specifically within the Wadi Yiba and Wadi Liyyah basins. These gauging stations were instrumental in developing SRCs, which relate storm discharge to sediment discharge. The parameters of these SRCs were validated and applied to ungauged basins within the same geographical region, including Wadi Fatimah.
The topographic data, particularly those related to the ECC, were based on the original design data from 1985, the year of the dam’s construction. To validate the ECC and sedimentation results, ground survey data collected in 2008 by the Ministry of Environment, Water, and Agriculture were utilized. Additionally, geophysical investigations employing resistivity methods were conducted upstream and downstream of the dam to further substantiate the findings on sediment accumulation and reservoir capacity changes over time.
3.2.2. Estimation of Wadi Fatimah Basin Hydrograph from a Gauged Basin in the Vicinity (Al-Lith Basin)
Estimating runoff for watersheds without discharge records is a significant concern. In the absence of data, hydrological model parameters can be estimated using regional information. The assumption is that watersheds with similar characteristics exhibit similar hydrological behavior and can be modeled using similar parameter values. Therefore, it is reasonable to regionalize the hydrological model parameters based on watershed characteristics [39,40].
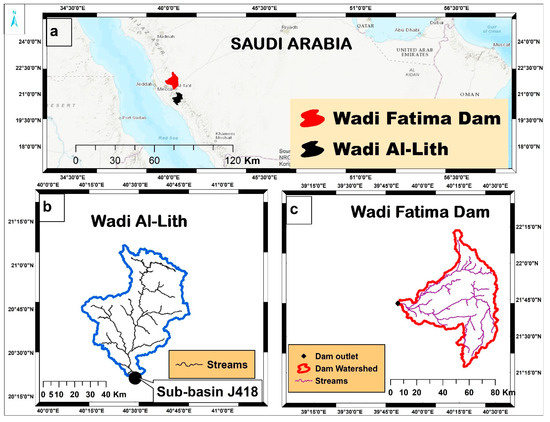
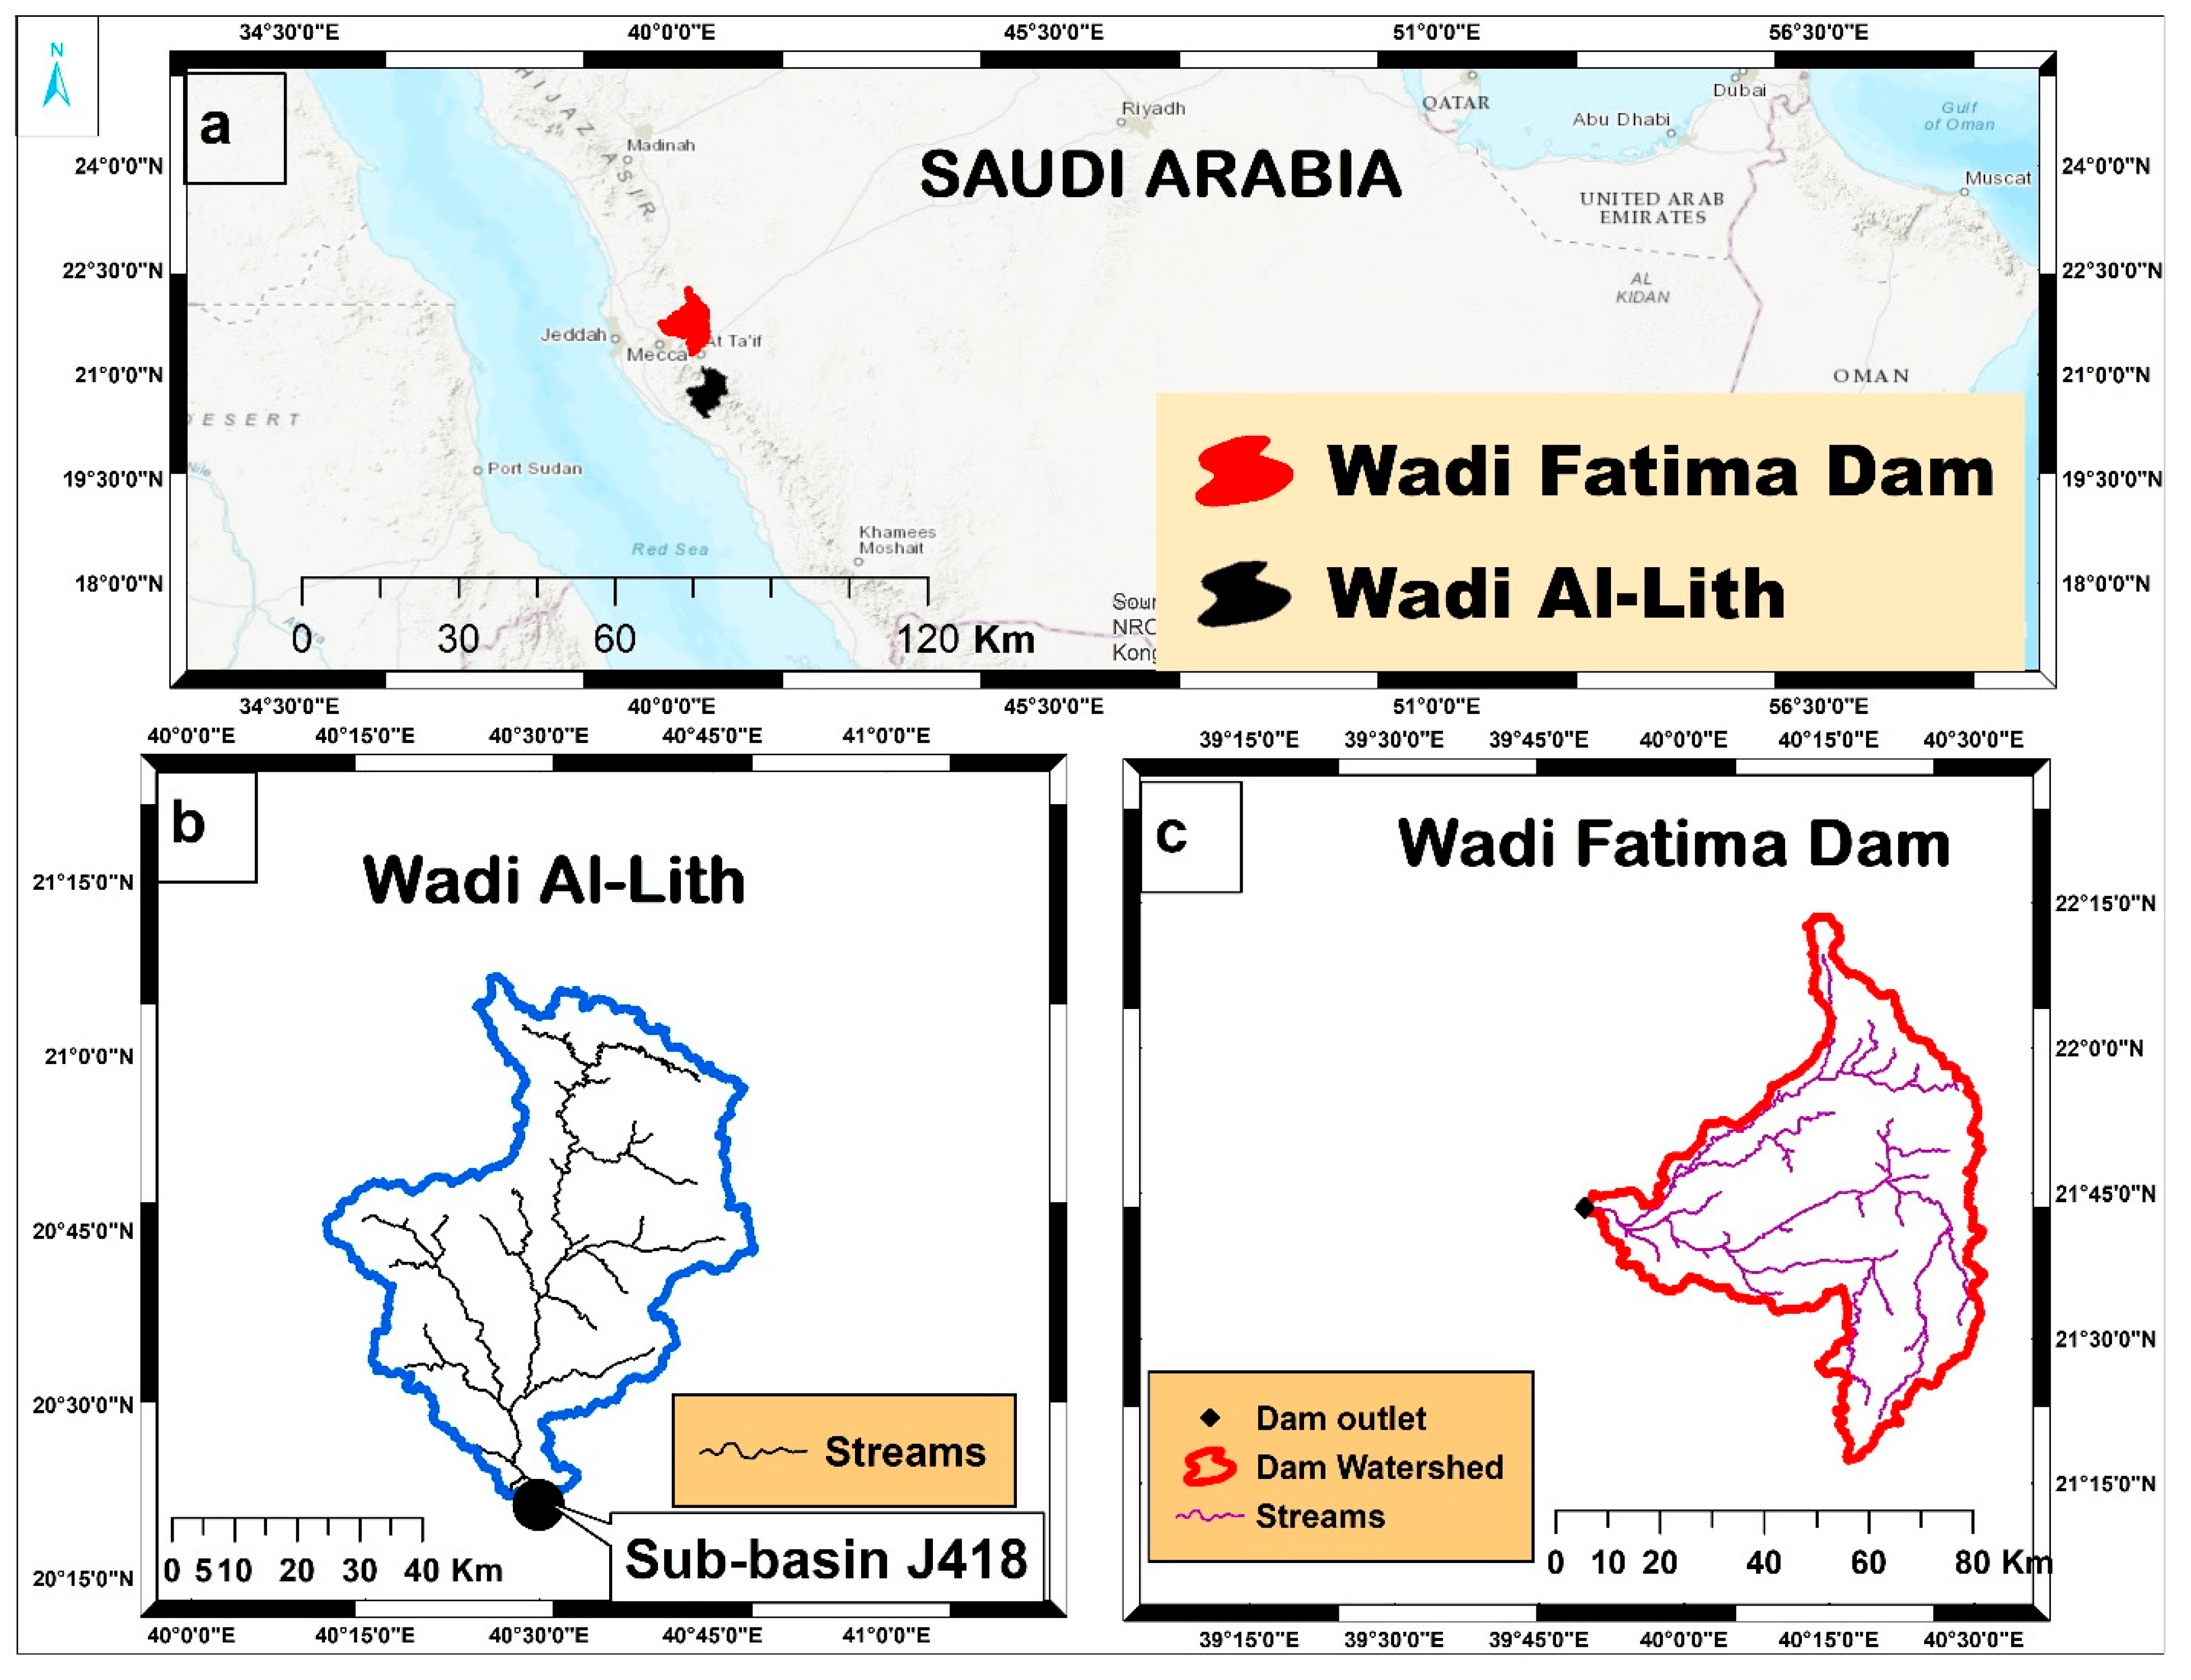
In the southwestern region of Saudi Arabia, only five gauged wadis exist, and Wadi Fatimah is one of the ungagged wadis. Due to this limitation, we selected a gauged wadi (Al-Lith basin) that shares similar morphometric characteristics, geological features typical of the Arabian Shield, climatic conditions, and a comparable drainage area of approximately 3000 km2 with Wadi Fatimah (Table 3). The locations of both wadis are presented in Figure 5. This choice allowed us to calibrate hydrological parameters and estimate reasonable values.
Table 3.
Morphometric parameters of Wadi Fatimah dam and Wadi Al-Lith.
Figure 5.
Comparative locations of the basins: (a) general location of the study area, (b) location map of Wadi Fatimah and (c) location map of Wadi Al-Lith.
The Natural Resources Conservation Services Curve Number (NRCS-CN), formerly known as the Soil Conservation Service (SCS) method, is widely used to estimate surface runoff in both gaged and ungagged watersheds. It is commonly referred to as the NRCS Runoff Equation or NRCS Curve Number method (Equations (18) and (19)).
where R denotes the quantity of surface runoff, P denotes rainfall, represents the initial abstraction ratio traditionally assumed to be 0.2, and the variable S represents the quantity of potential maximum retention. S is estimated by the hydrological parameter CN.
where CN is the curve number and S is the potential maximum retention.
A total of 161 rainfall–runoff events from five basins (19 sub-basins) in southwestern Saudi Arabia were analyzed [41]. They used the least squares method to identify the optimal range of values for λ and CN based on three estimation methods. The analysis revealed that CN values varied between 45 and 85 at λ = 0.2. Lower CN values were attributed to transmission losses, which are common in arid regions. The study also found that an initial abstraction ratio of λ = 0.01 was more representative of arid basins compared to λ = 0.2 [41].
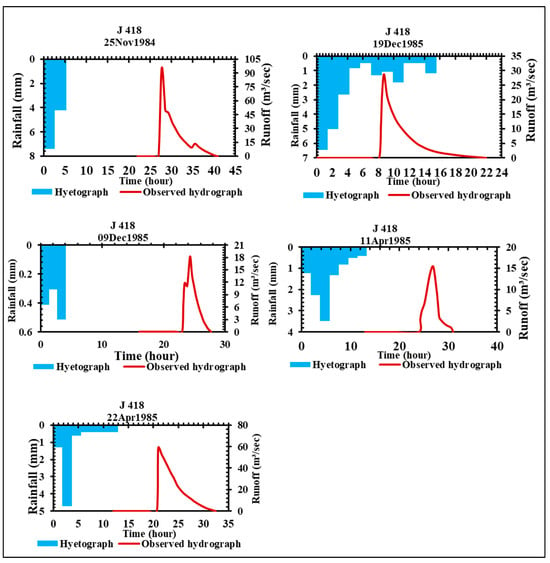
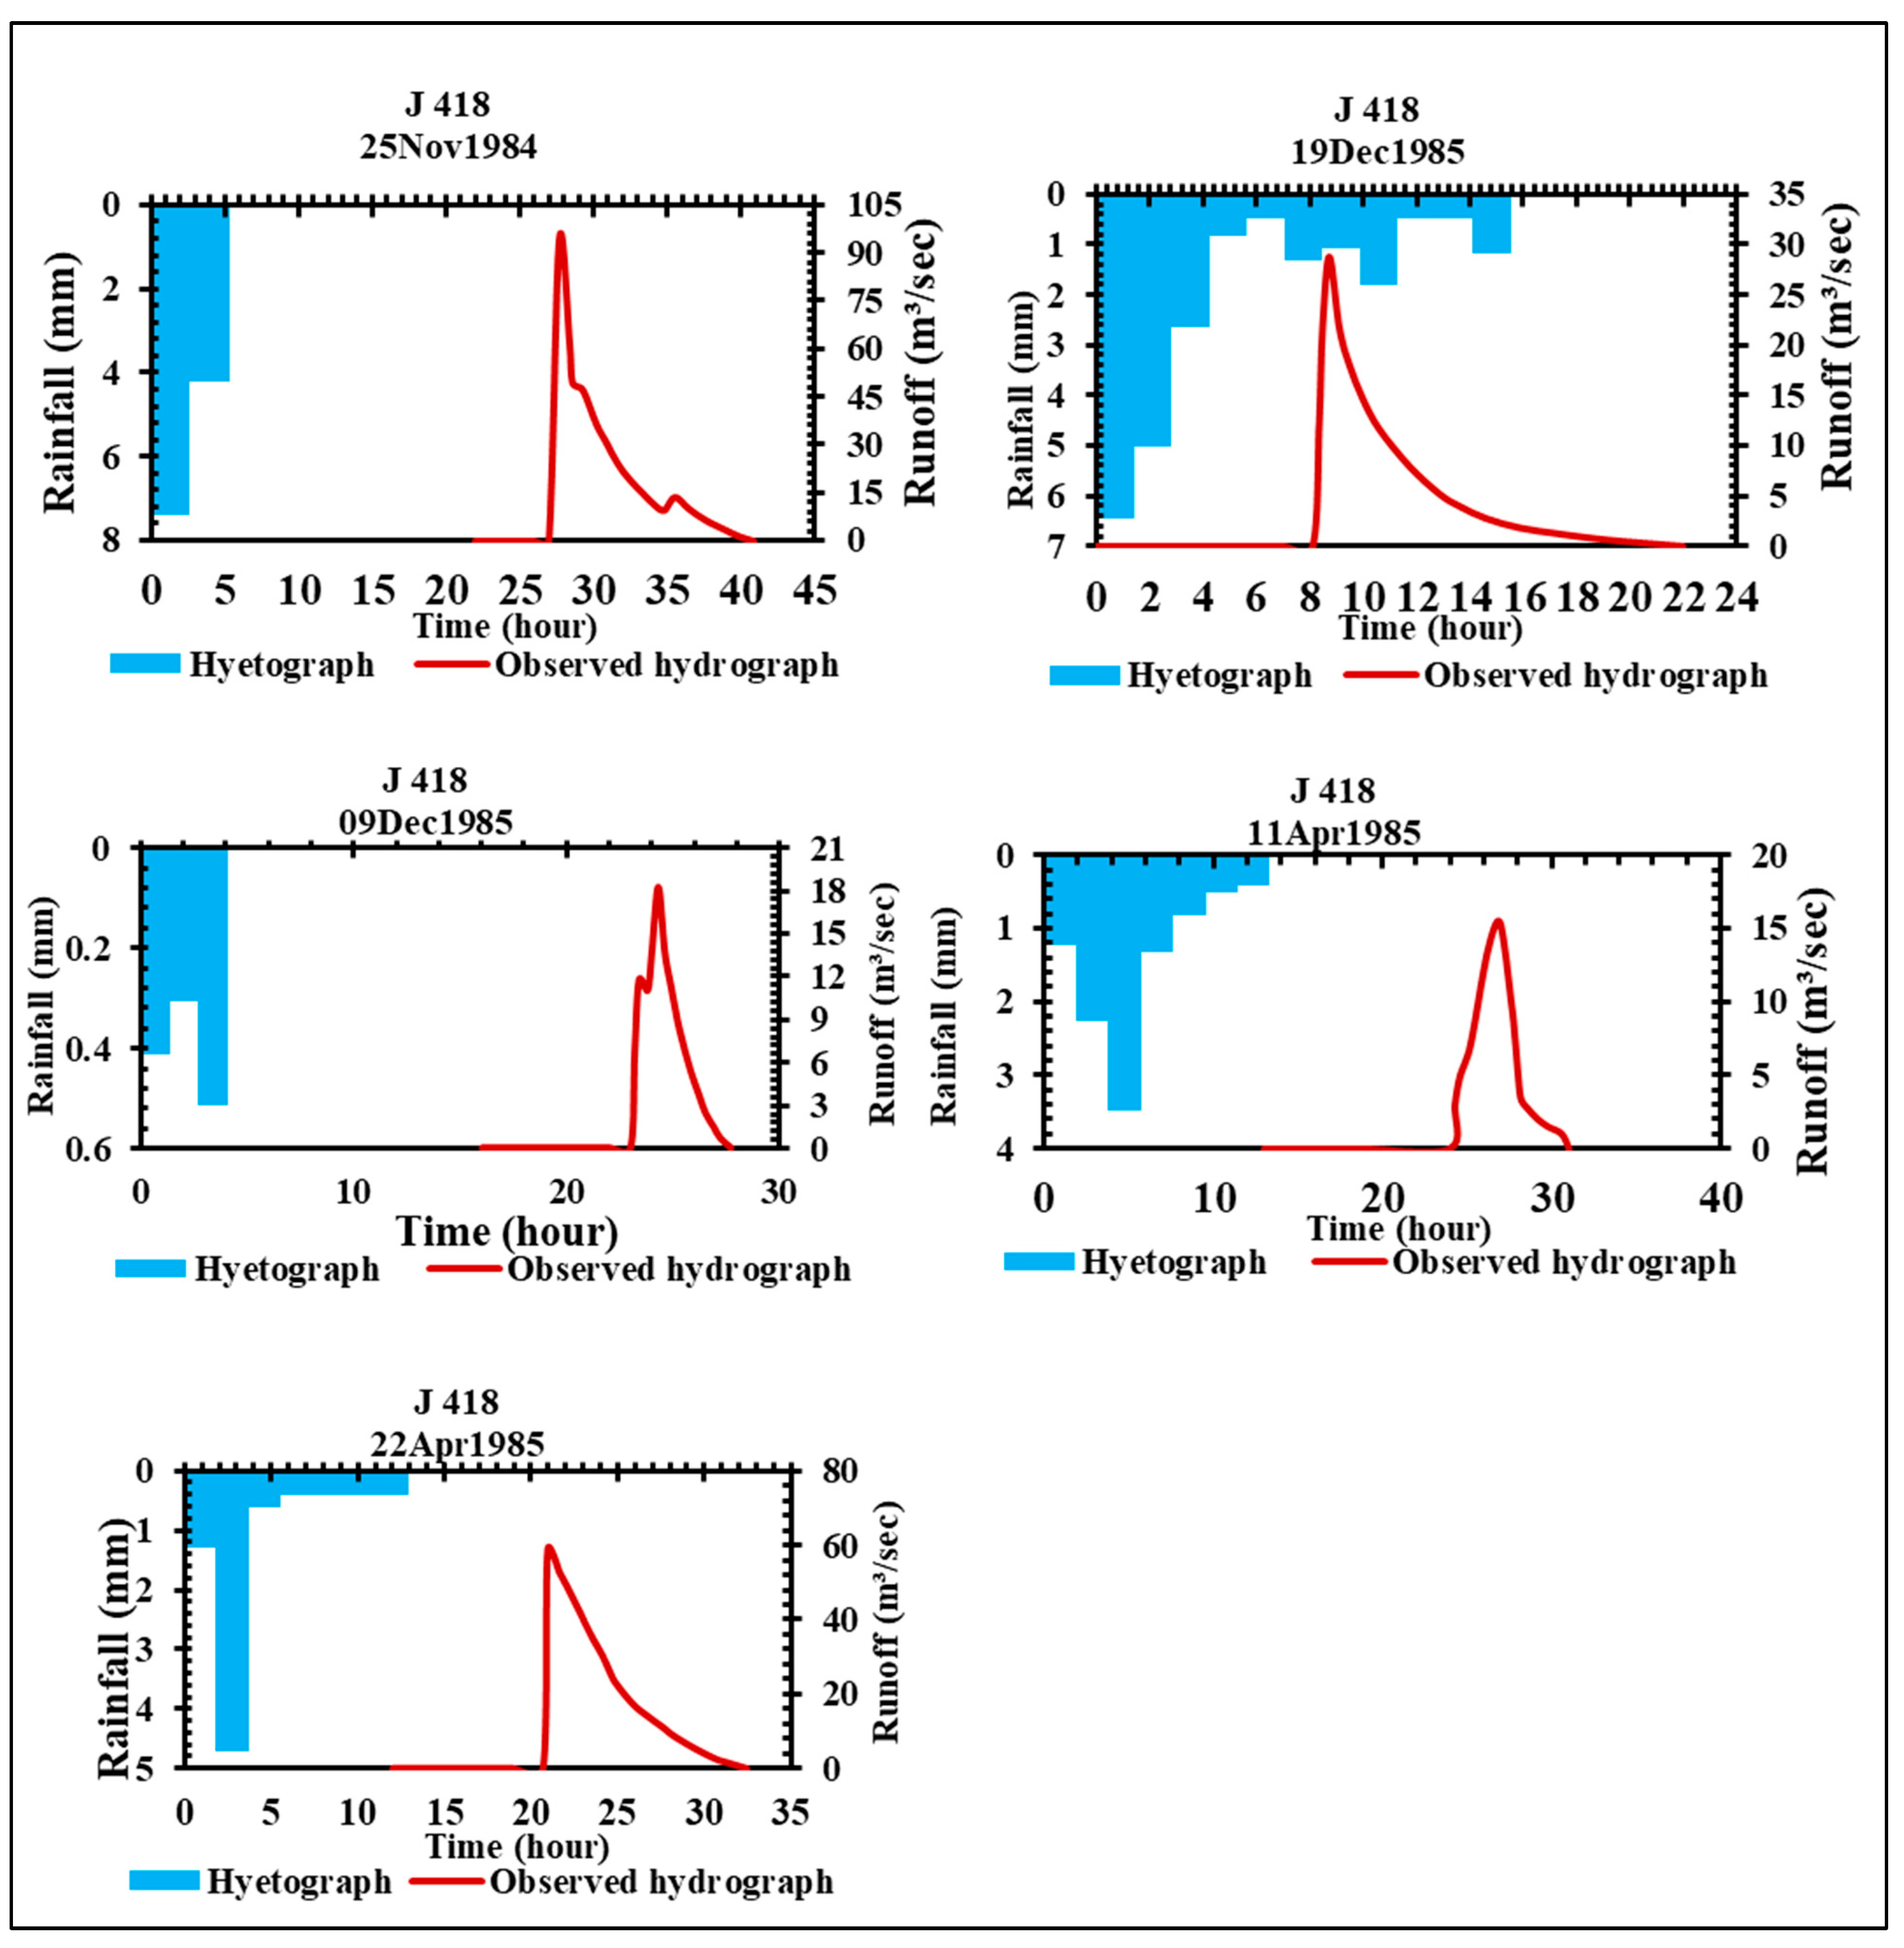
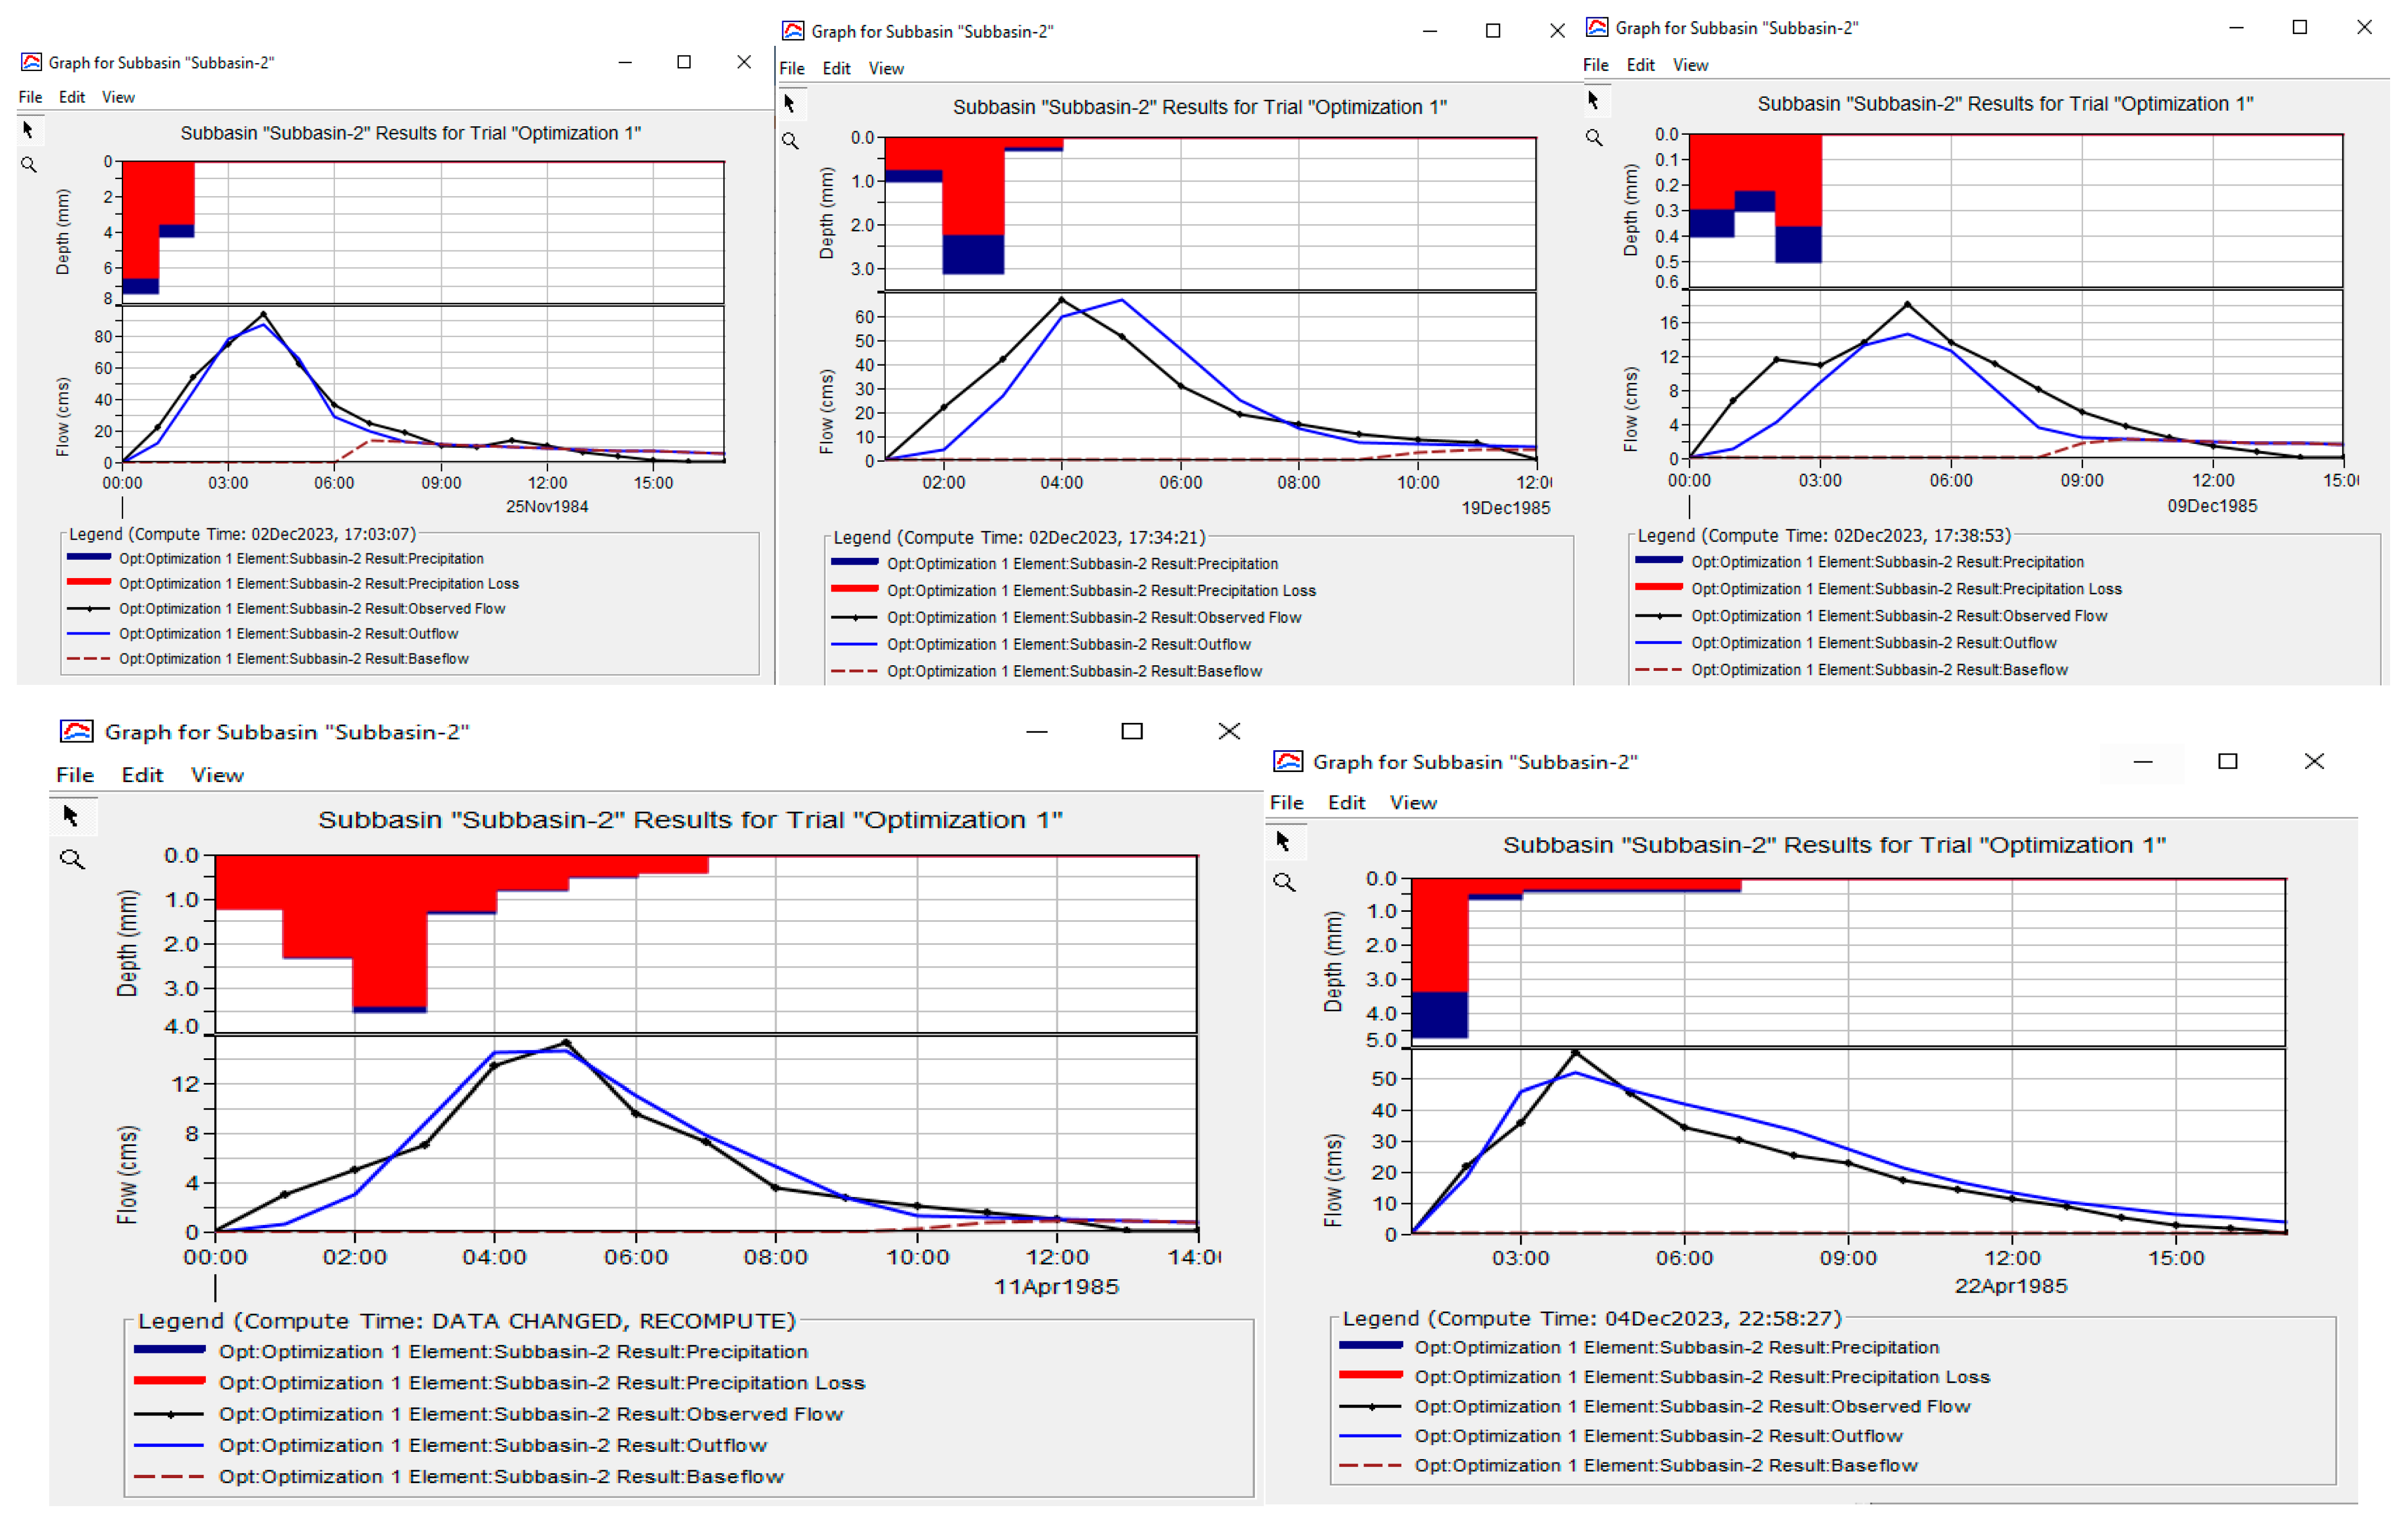
Figure 6 below shows some of the measured hydrographs from Wadi Al-Lith, and Figure 6 illustrates the calibration of hydrological parameters respectively.
Figure 6.
Some of the observed rainfall–runoff events at Wadi Al-Lith basin at the outlet station J418.
The hydrological parameters have been calibrated using the software Hydrological Modeling System (HEC-HMS) version 4.10, and the outcome is illustrated in the following Table 4. The hydrographs in Figure 7 depict very good agreement between observed and simulated hydrographs and the average Nash-Sutcliffe coefficient of the five events is 0.75, which is relatively high. The important parameter in the calibration is the NRCS-CN, which is about 50 on average, indicating the effect of transmission losses in the basin, which has been supported by earlier studies, [41]. Therefore, the NRCS-CN = 50 is used to estimate the flood hydrograph in Wadi Fatimah from the rainfall events recorded in the stations in the vicinity of Wadi Fatimah dam, since there are no runoff stations available in the vicinity of the dam.
Table 4.
Summary of the calibrated parameters and model performance based on Nash-Sutcliffe coefficient.
Figure 7.
Observed and simulated rainfall–runoff events during the calibration of hydrological parameters of Al-Lith basin based on HEC-HMS software.
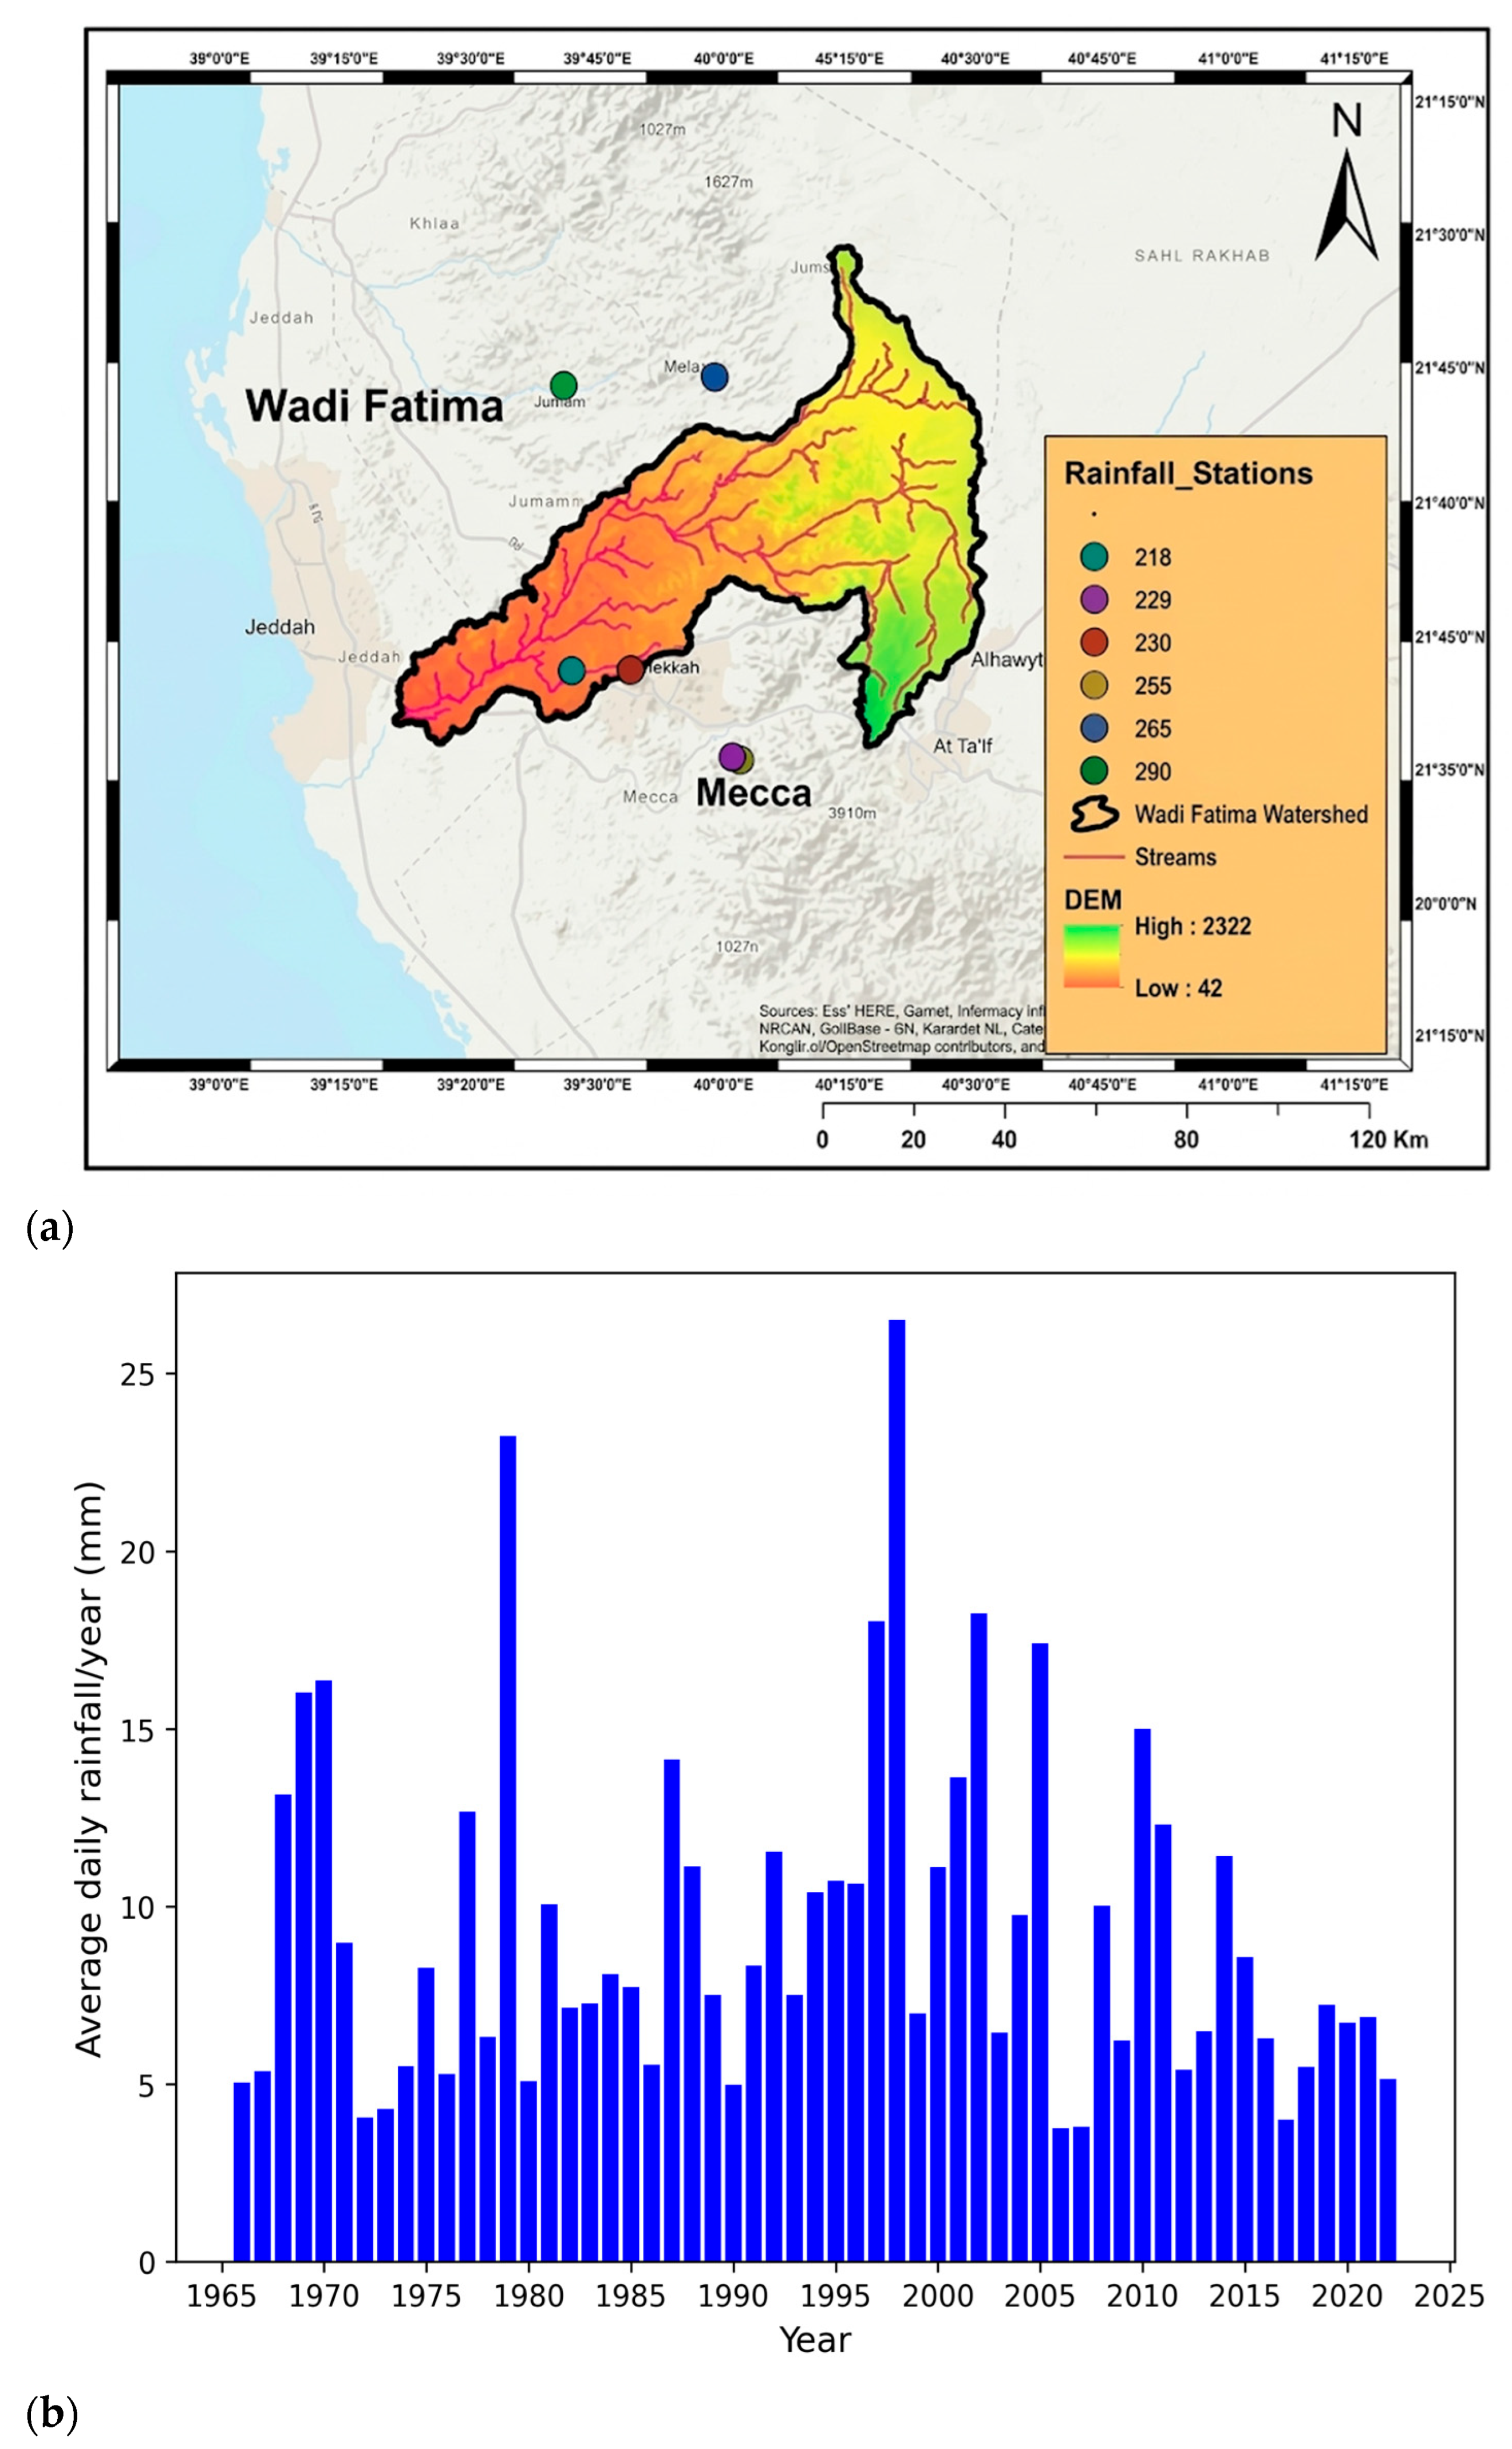
Rainfall data for Wadi Fatimah Dam, spanning the period from 1985 to 2022 were obtained from the Saudi Arabian Ministry of Environment, Water and Agriculture. The stations used are illustrated below in Figure 8.
Figure 8.
Locations of rainfall stations (a), and average daily rainfall over the study area from 1966 to 2022 (b).
By conducting statistical analysis on the rainfall data gathered during the study period spanning from 1966 to 2022, we have employed the calibrated parameters, obtained in Table 3, to develop a rainfall–runoff model of the Wadi Fatimah basin at the dam site using HEC-HMS 4.10 from the recorded events from 1966 to 2022.
3.3. Validation
The model performance was validated by using field measurements, ground survey data collected in 2008 by the Ministry of Environment, Water and Agriculture of Saudi Arabia, geophysical investigations, and observation of some dam reservoirs in Saudi Arabia.
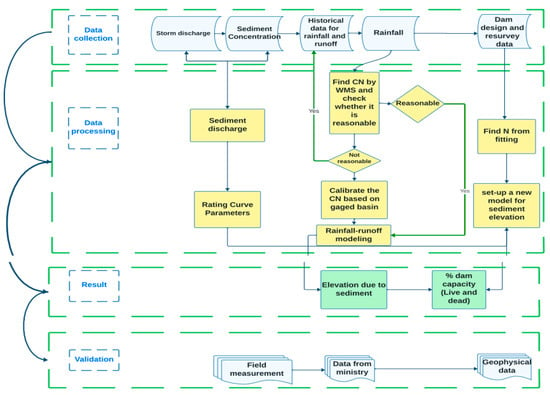
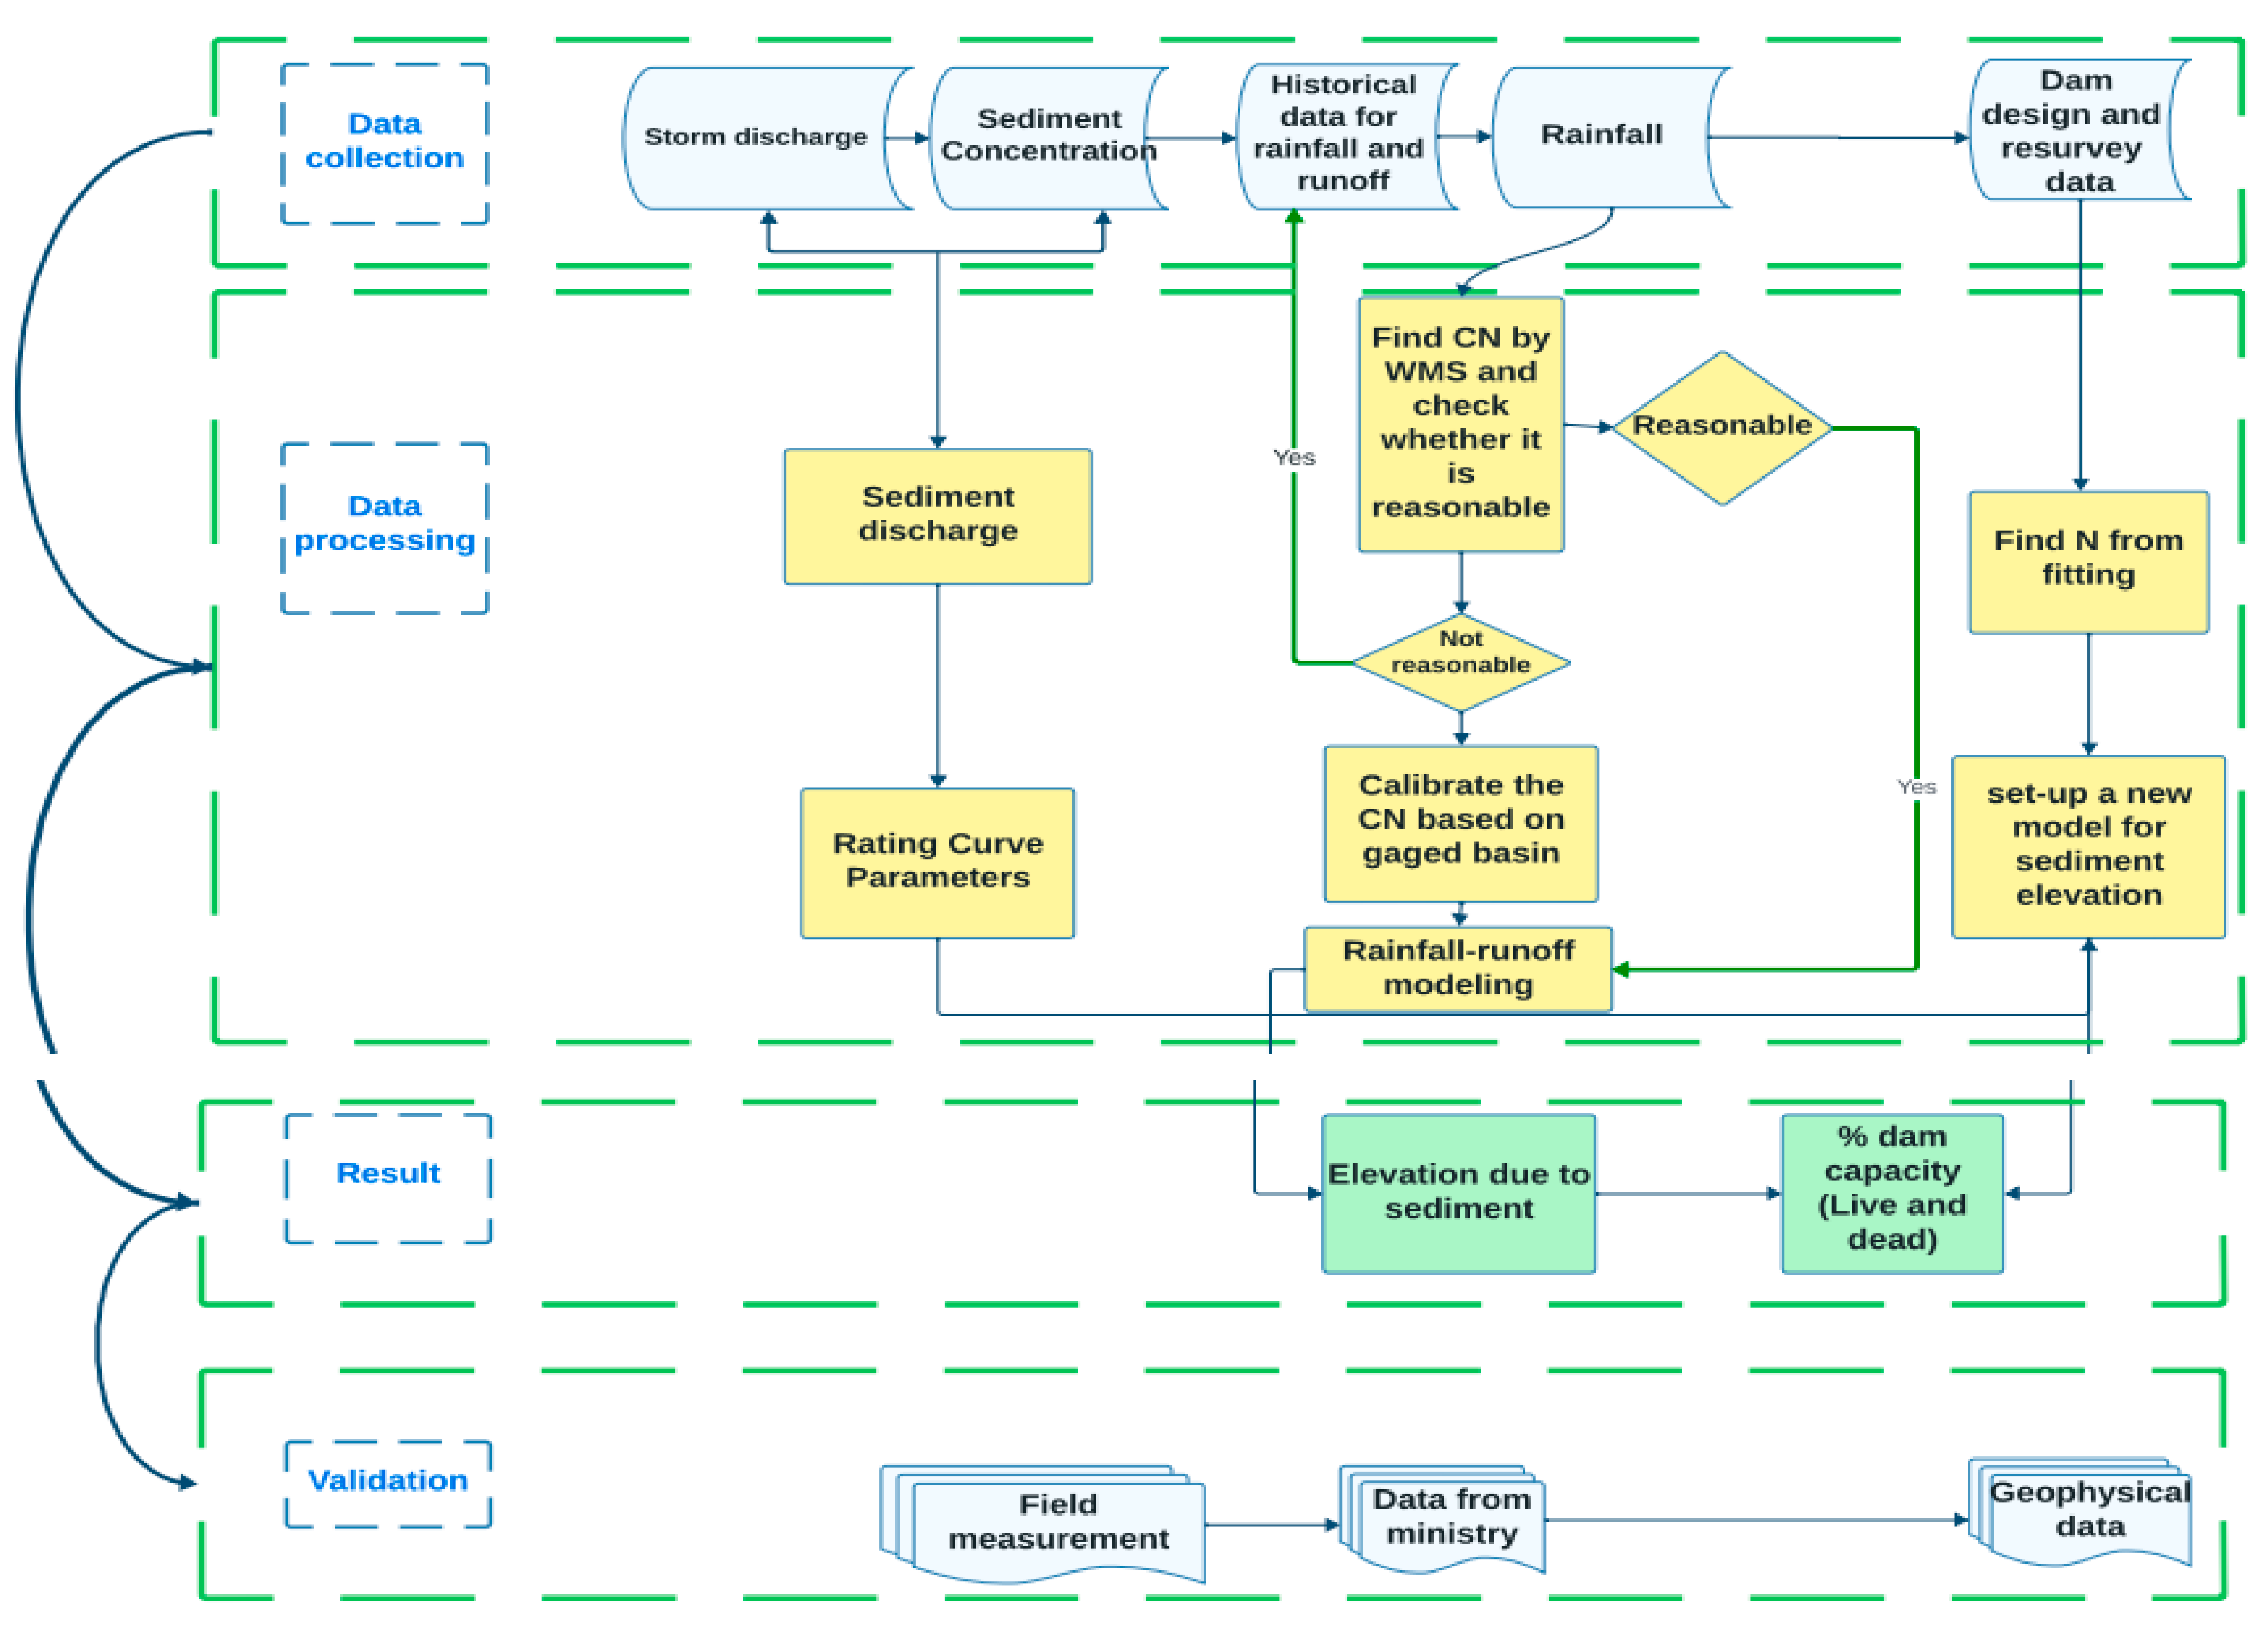
The general framework summary of the methodology of this study is illustrated below (Figure 9).
Figure 9.
The general methodological framework of the study.
4. Results and Discussions
4.1. Estimation of Dam Sedimentation
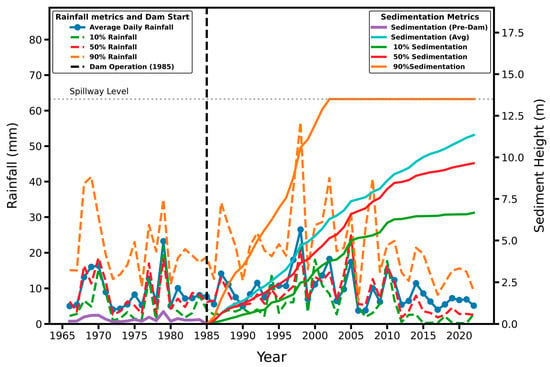
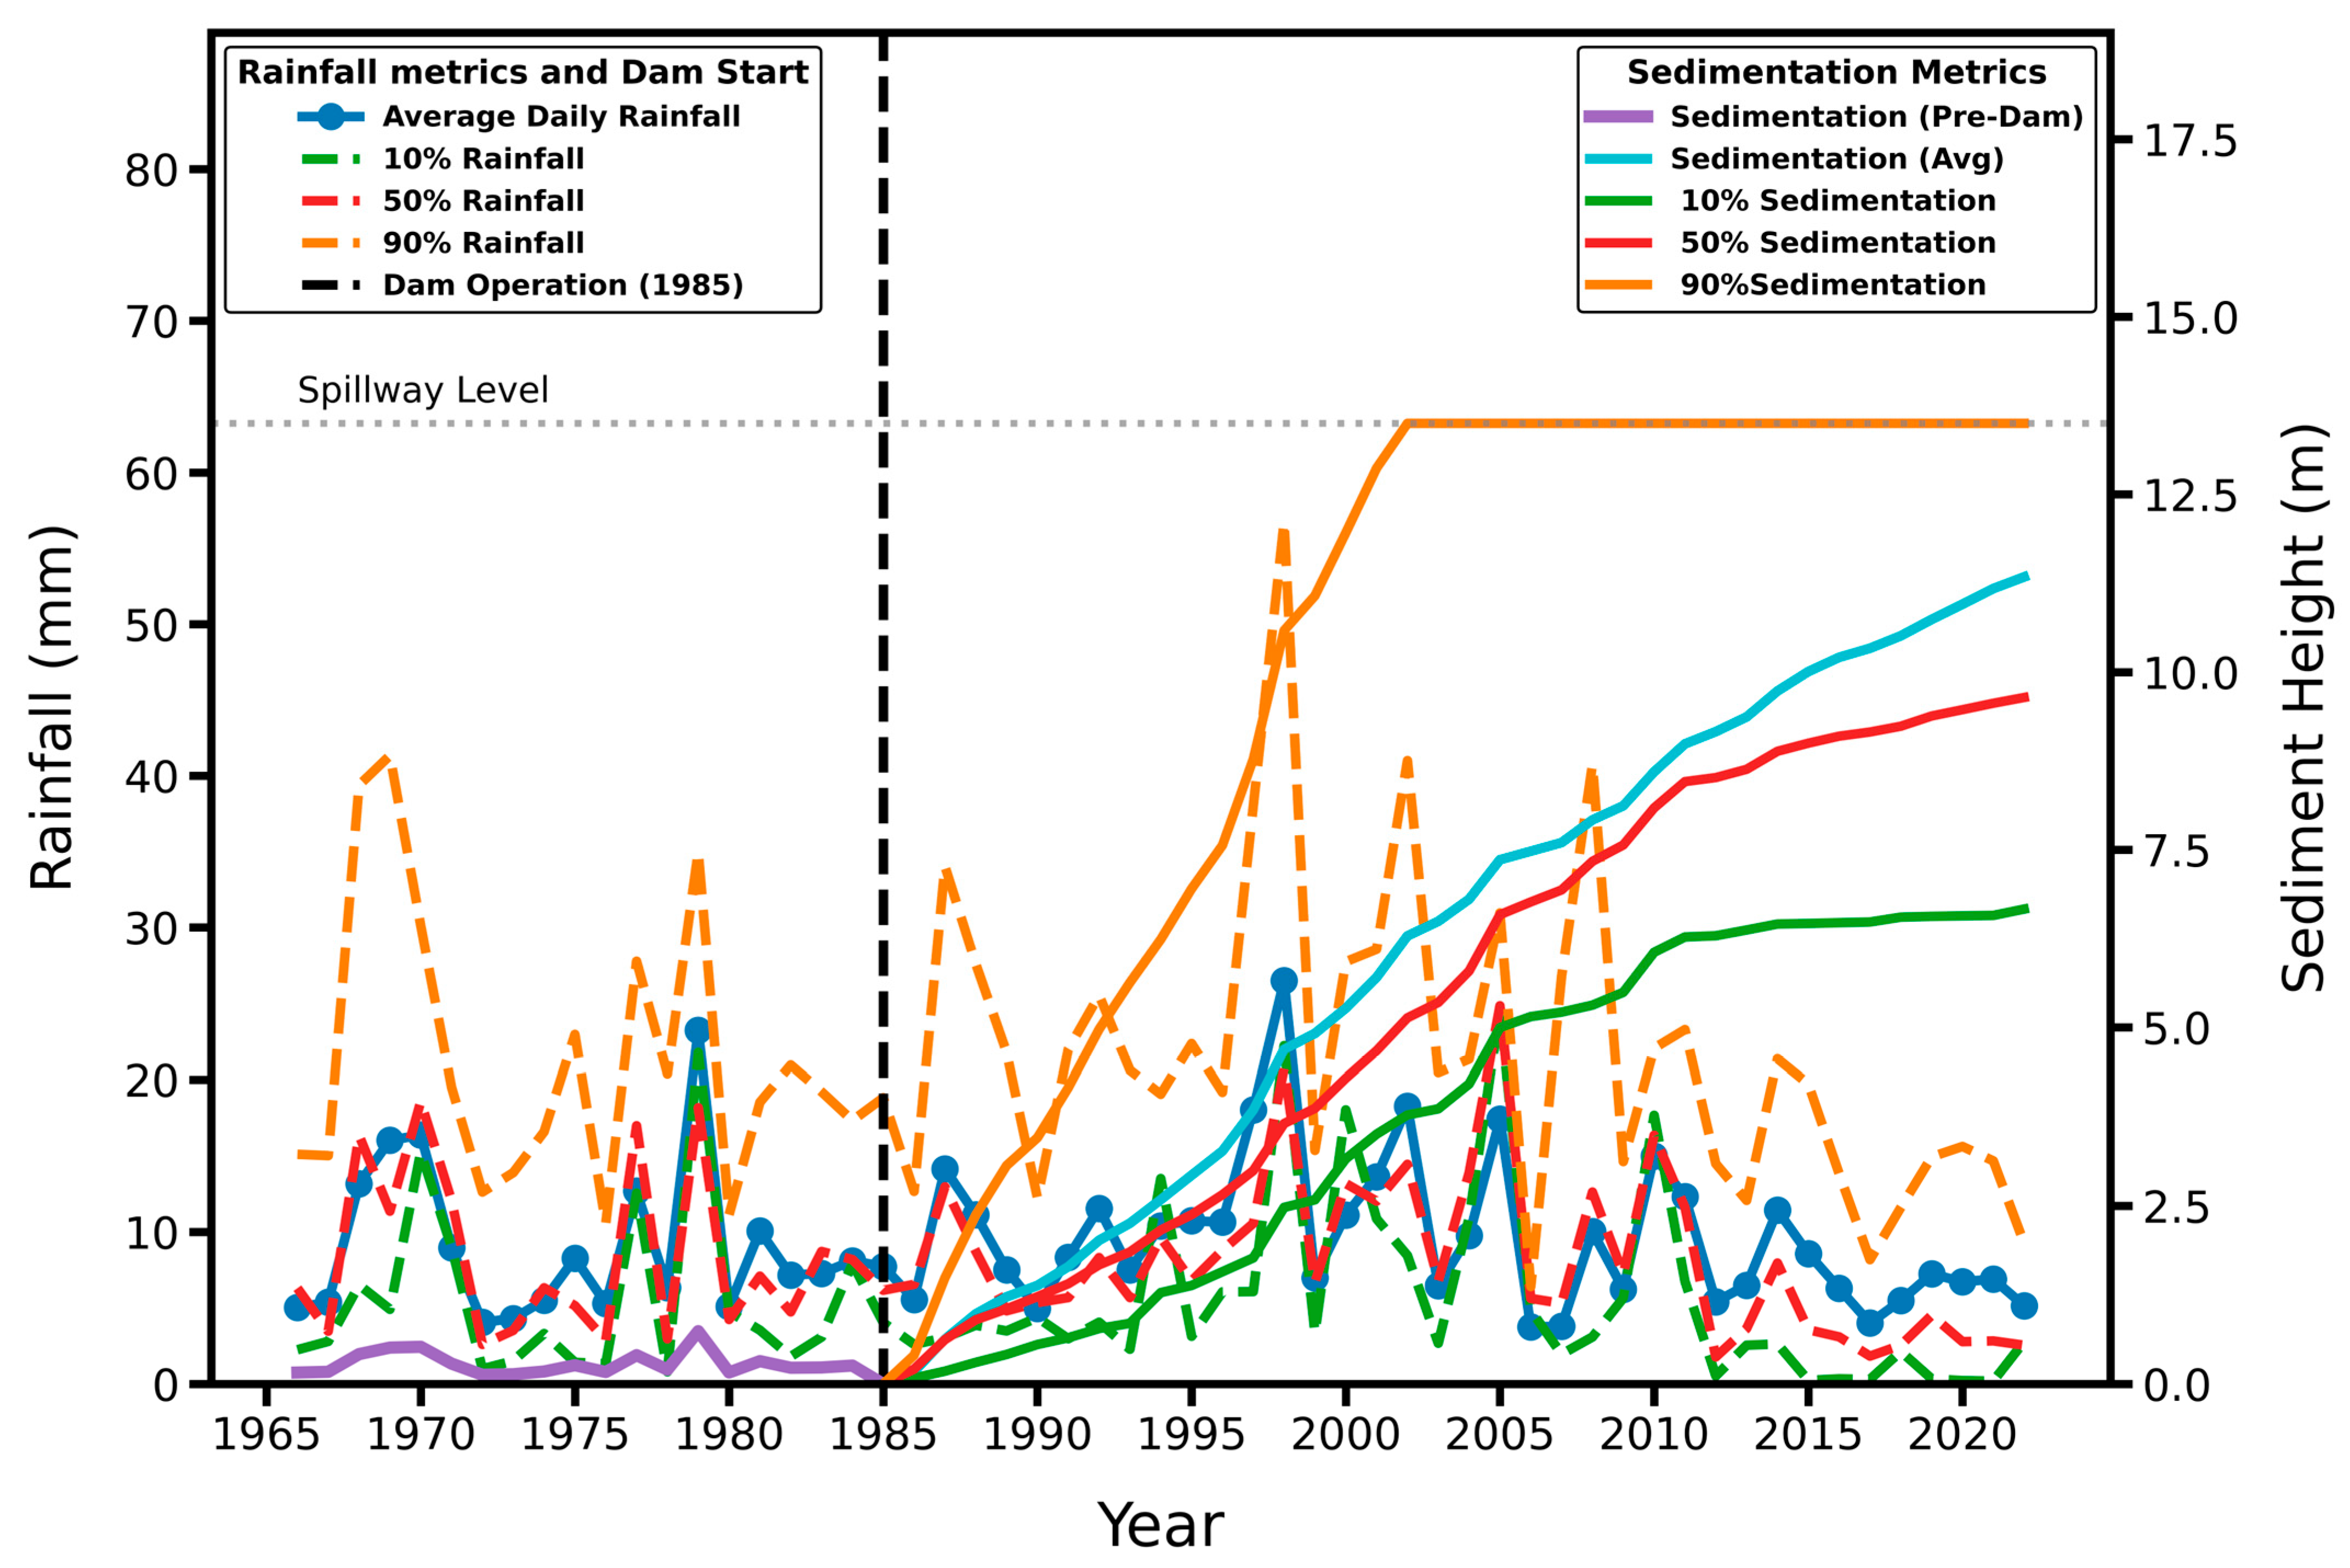
The following Figure (Figure 10) provides insights into the relationship between sedimentation, rainfall patterns, and the impact of the dam on sediment accumulation throughout the study period.
Figure 10.
Time series of the average daily rainfall, 10%, 50%, and 90% rainfall per year, and the corresponding sedimentation rise.
Figure 10 presents the daily average rainfall per year and the sedimentation data from 1966 to 2022. It reveals that from 1965 to 1980, known as the pre-dam phase, no sediment accumulation occurred due to the absence of the dam. However, in 1985, when the dam became operational, there was no sediment accumulation initially because of the excavation carried out during the dam construction. From 1985 onwards, sediment began to accumulate as a direct consequence of the presence of the dam.
Figure 10 also illustrates the sediment height and average daily rainfall data for different percentiles (10th, 50th, and 90th) for the study period of 1965–2022. This figure provides a comprehensive view of the sediment height and rainfall patterns throughout the entire study period, capturing the variability across different percentile values. The sediment height estimates obtained from the model revealed about 11 m of depth of sediments that accumulated over the dam from 1985 to 2022. The 50th percentile sediment height was calculated to be 9.64 m, indicating that this value represents the median or central tendency of the sediment height distribution. Furthermore, the 10th percentile sediment height was estimated to be 6.66 m, and the upper-bound (90th percentile) scenario produced a higher simulated sediment rise, which was limited to the spillway elevation (13 m) to reflect the physical storage constraint of the reservoir (Figure 10). These results demonstrate the variability and uncertainty associated with sediment deposition within the study area.
The variability in sediment yield is directly linked to rainfall fluctuations, as sediment transport in arid environments is strongly event-driven. Not all eroded sediments necessarily reach the reservoir during low-rainfall years. Conversely, extreme rainfall events may generate disproportionately high sediment inflow. For this reason, uncertainty bounds were incorporated into simulations to reflect the variability in rainfall-driven sediment generation and transport processes. These bounds are intended to represent climatic uncertainty.
It should also be noted that several simplifying assumptions were adopted in the present analysis, including uniform sediment bulk density and the use of generalized SRC and regionalized hydrological parameters. While the SRC formulation employed herein has been previously subjected to sensitivity analysis, cross-catchment validation, and statistical significance testing [27], the present study does not explicitly propagate parameter uncertainty into sediment height or reservoir capacity loss estimates. Variations in sediment density and SRC coefficients may influence absolute sediment accumulation volumes; however, the proposed conceptual–mathematical integration framework remains structurally valid under parameter variability. A comprehensive uncertainty propagation analysis (e.g., Monte Carlo simulation or stochastic parameterization) is recommended as a valuable extension of this work to further quantify confidence bounds around predicted sediment rise and storage loss.
The relatively widespread range between the 10th and 90th percentile sediment heights reflects the inherent hydrological variability of ephemeral stream systems, where a limited number of high-magnitude flood events can contribute disproportionately to long-term sediment accumulation. Field observations from several dams in the region indicate that extreme sediment deposition is physically plausible, with some reservoirs nearly or completely filled up to the dam crest. Such high sediment levels may occur in the absence of sediment removal or active reservoir management. Therefore, the percentile range should be interpreted as an uncertainty envelope rather than deterministic outcomes. The median (50th percentile) represents the most representative long-term estimate, while the upper percentile provides a conservative scenario useful for risk-informed reservoir design and sediment management planning.
4.2. Scenarios of Sediment Removal and Its Effects on Sediment Buildup Around the Dam
While comprehensive official maintenance records are not publicly accessible, the study incorporates available documented data and expert judgment to contextualize sediment management at the site. A local report by Okaz [42] documented that approximately 135,000 m3 of sediment was removed from the Wadi Fatimah Dam in 2020. This documented figure is further supported by expert judgment provided by a dam management engineer from the Ministry of Environment, Water and Agriculture. According to this expert input, removal activities are periodically conducted and primarily focus on the upstream side of the dam outlet to maintain water release functionality. Due to the lack of long-term quantitative records, the sediment management scenarios in this study are framed as exploratory simulations. They assess the potential influence of periodic cleaning on reservoir capacity rather than attempting to reconstruct precise historical operational practices.
To assess the impact of sediment removal, we have devised two scenarios:
- In the first scenario, sediment removal is conducted annually, ensuring that the sediment accumulation is limited to a maximum height of 5 m from the reservoir bottom. This approach involves regular cleaning activities to prevent excessive sediment buildup.
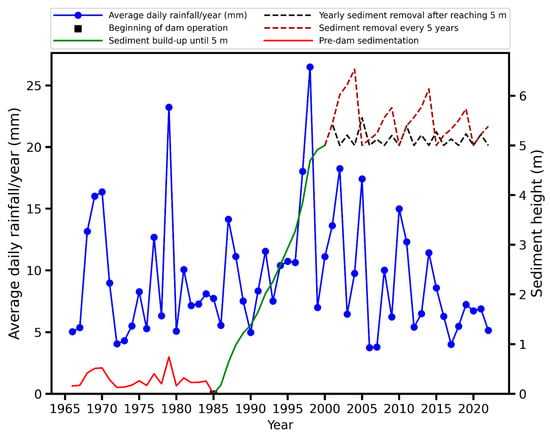
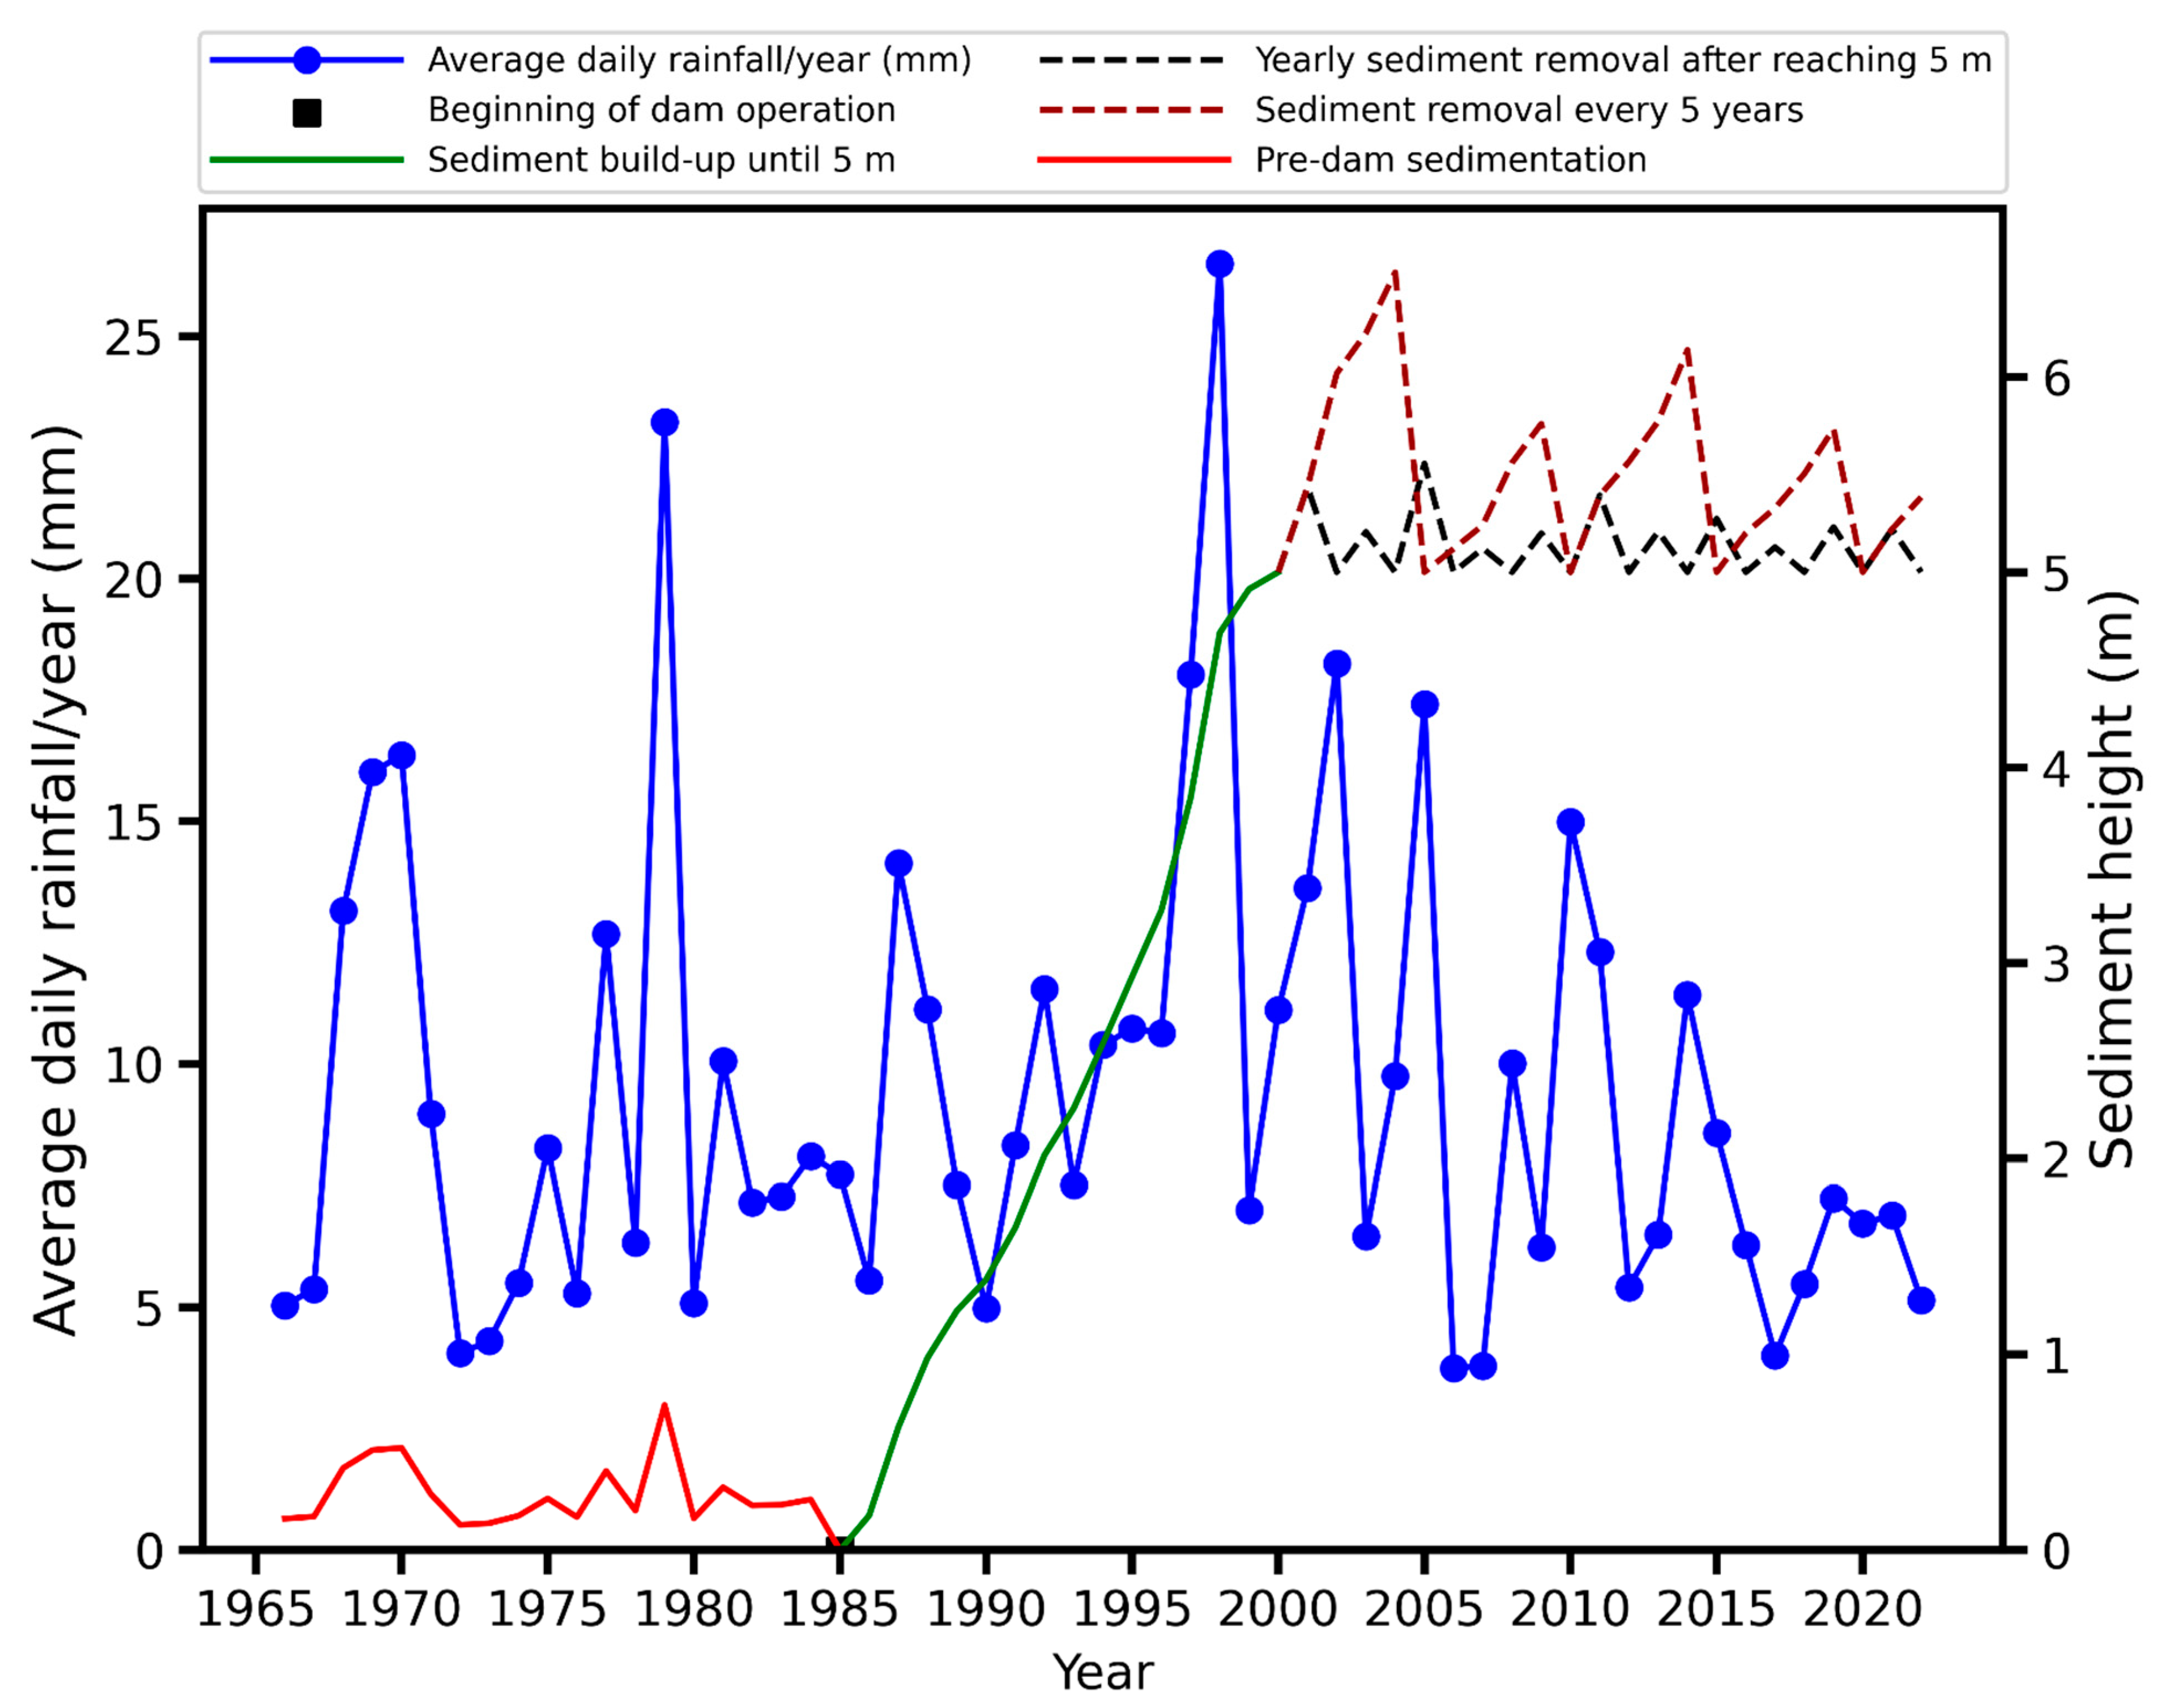
- Similarly, the second scenario involves sediment removal every 5 years (Figure 11). It is worth noting that the outlet of the dam is situated at a height of approximately 5 m, and the cleaning efforts are concentrated in this specific area. In both cases, maintenance starts once sediment accumulation reaches above the height of 5 m from the reservoir bottom to keep the outlet opening clear to allow the water from the reservoir.Figure 11. Scenarios of sediment removal after sediment buildup reaches the height of the bottom of the outlet (i.e., above 5 m from the reservoir bottom).
An animation illustrating the simulated reservoir sedimentation and the evolution of the elevation–capacity curve is available at Temporal Evolution of Elevation Capacity Curve and Simulation of Reservoir Sedimentation for Dams.
4.3. Prediction of the Temporal Evolution of the Elevation–Capacity Curve
As mentioned in the methodology, parameter N can be estimated both numerically and analytically. This is achieved by fitting the measured dimensionless elevation–capacity curve to the model elevation–capacity curve [43].
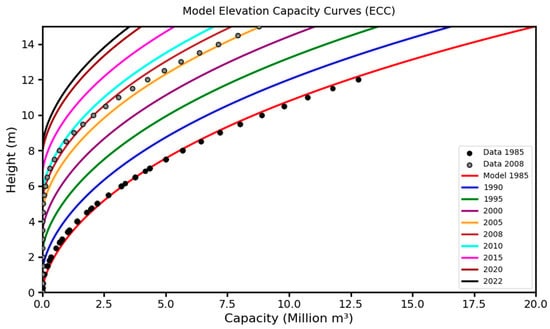
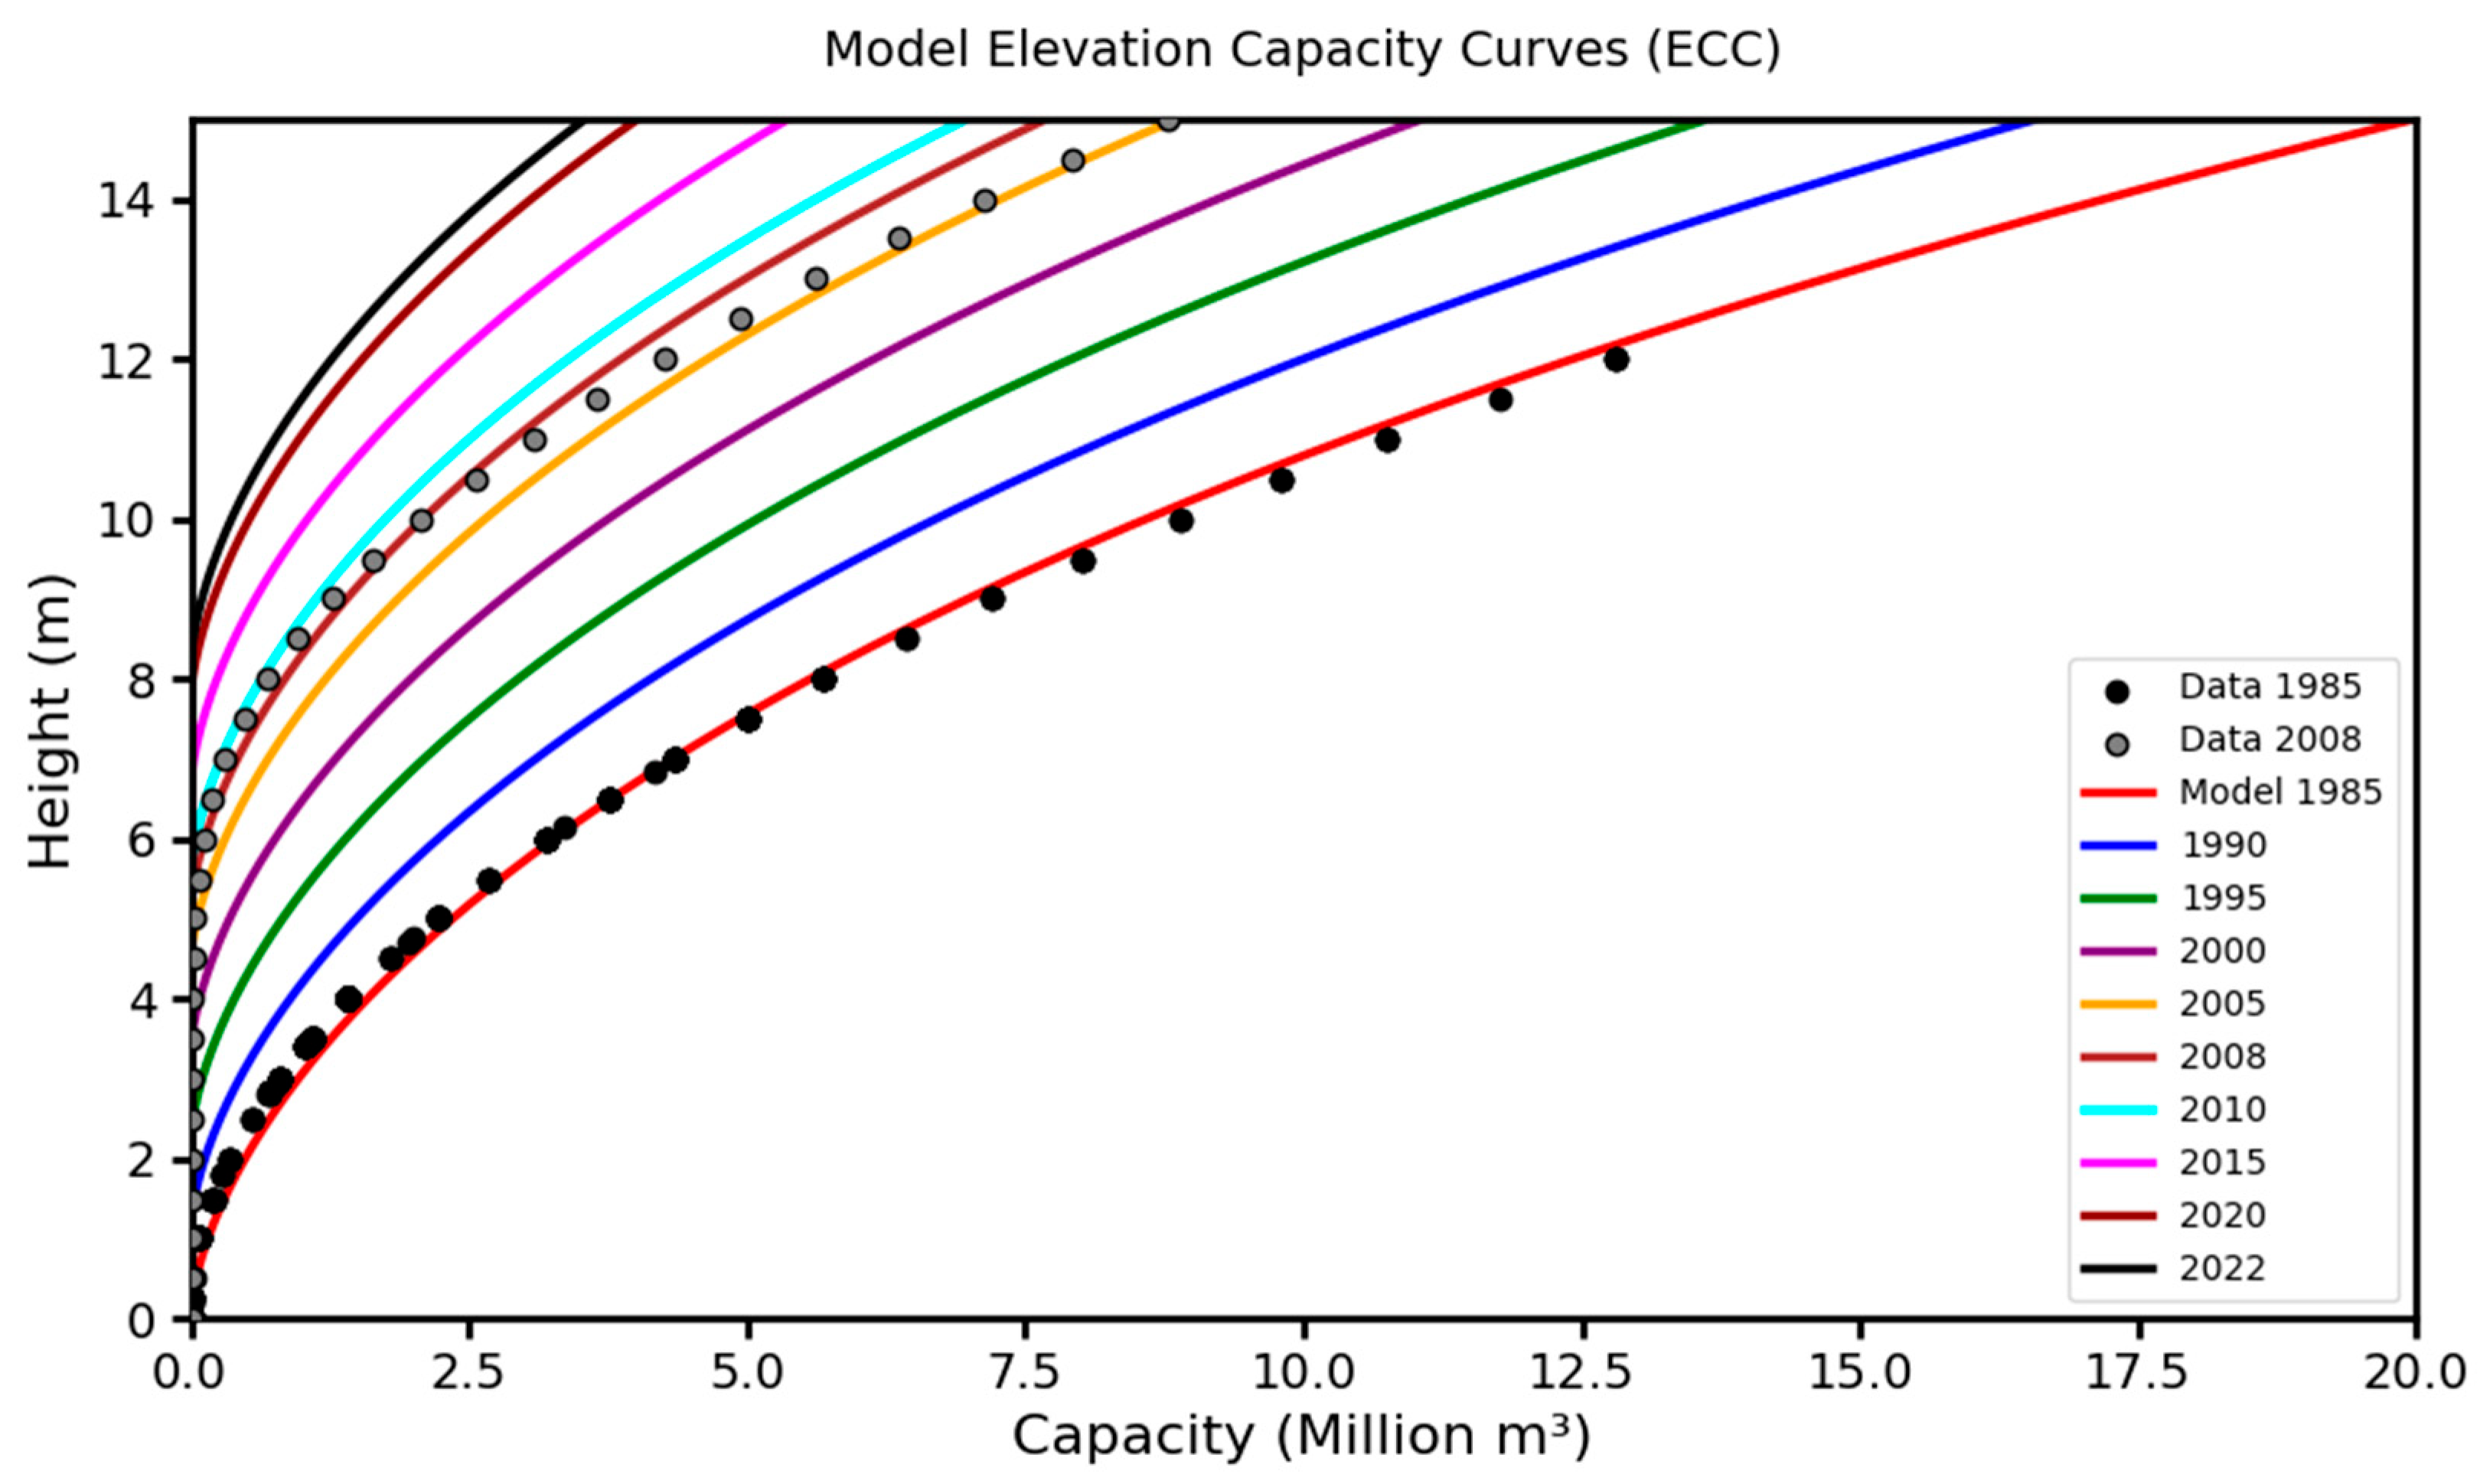
Two recorded measurements of the elevation–capacity curve for Wadi Fatimah dam were found, the first was in the design of the dam in 1985 and the other was the resurvey data in 2008. By utilizing these measurements and assuming a linear sedimentation rate and capacity reduction, we can forecast the elevation–capacity curve for the dam by using the proposed equations in the model development sections. Figure 12 depicts the predicted elevation–capacity curve from the initiation of dam operation and extends up until the year 2022.
Figure 12.
Estimated temporal evolution of the elevation–capacity curve from 1985 until 2022, passing through 2008, where we have a ground survey.
As depicted in the following figure, the storage capacity of the dam was at its maximum level in 1985, with 20 million cubic meters. However, over time, the capacity gradually decreased to 19.56 million cubic meters by 1990. In 2008, the measured live storage capacity was approximately 11.5 million cubic meters, while the model’s estimation of live storage capacity was around 14.5 million cubic meters. By 2022, the capacity had further diminished to about 8.9 million cubic meters, indicating a reduction of approximately 55% of the overall dam capacity.
4.4. Validation of the Capacity-Elevation Curve and the Sediment Rise
Validation of the model sediment height was performed based on (1) the ground survey in 2008, (2) geophysical investigation upstream and downstream of the dam, and (3) comparison with some observed sediments in dams in Saudi Arabia.
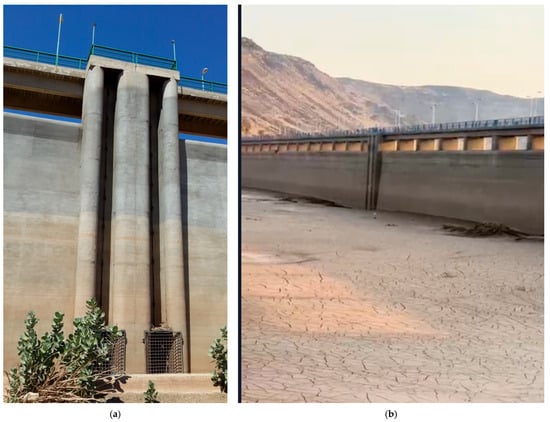
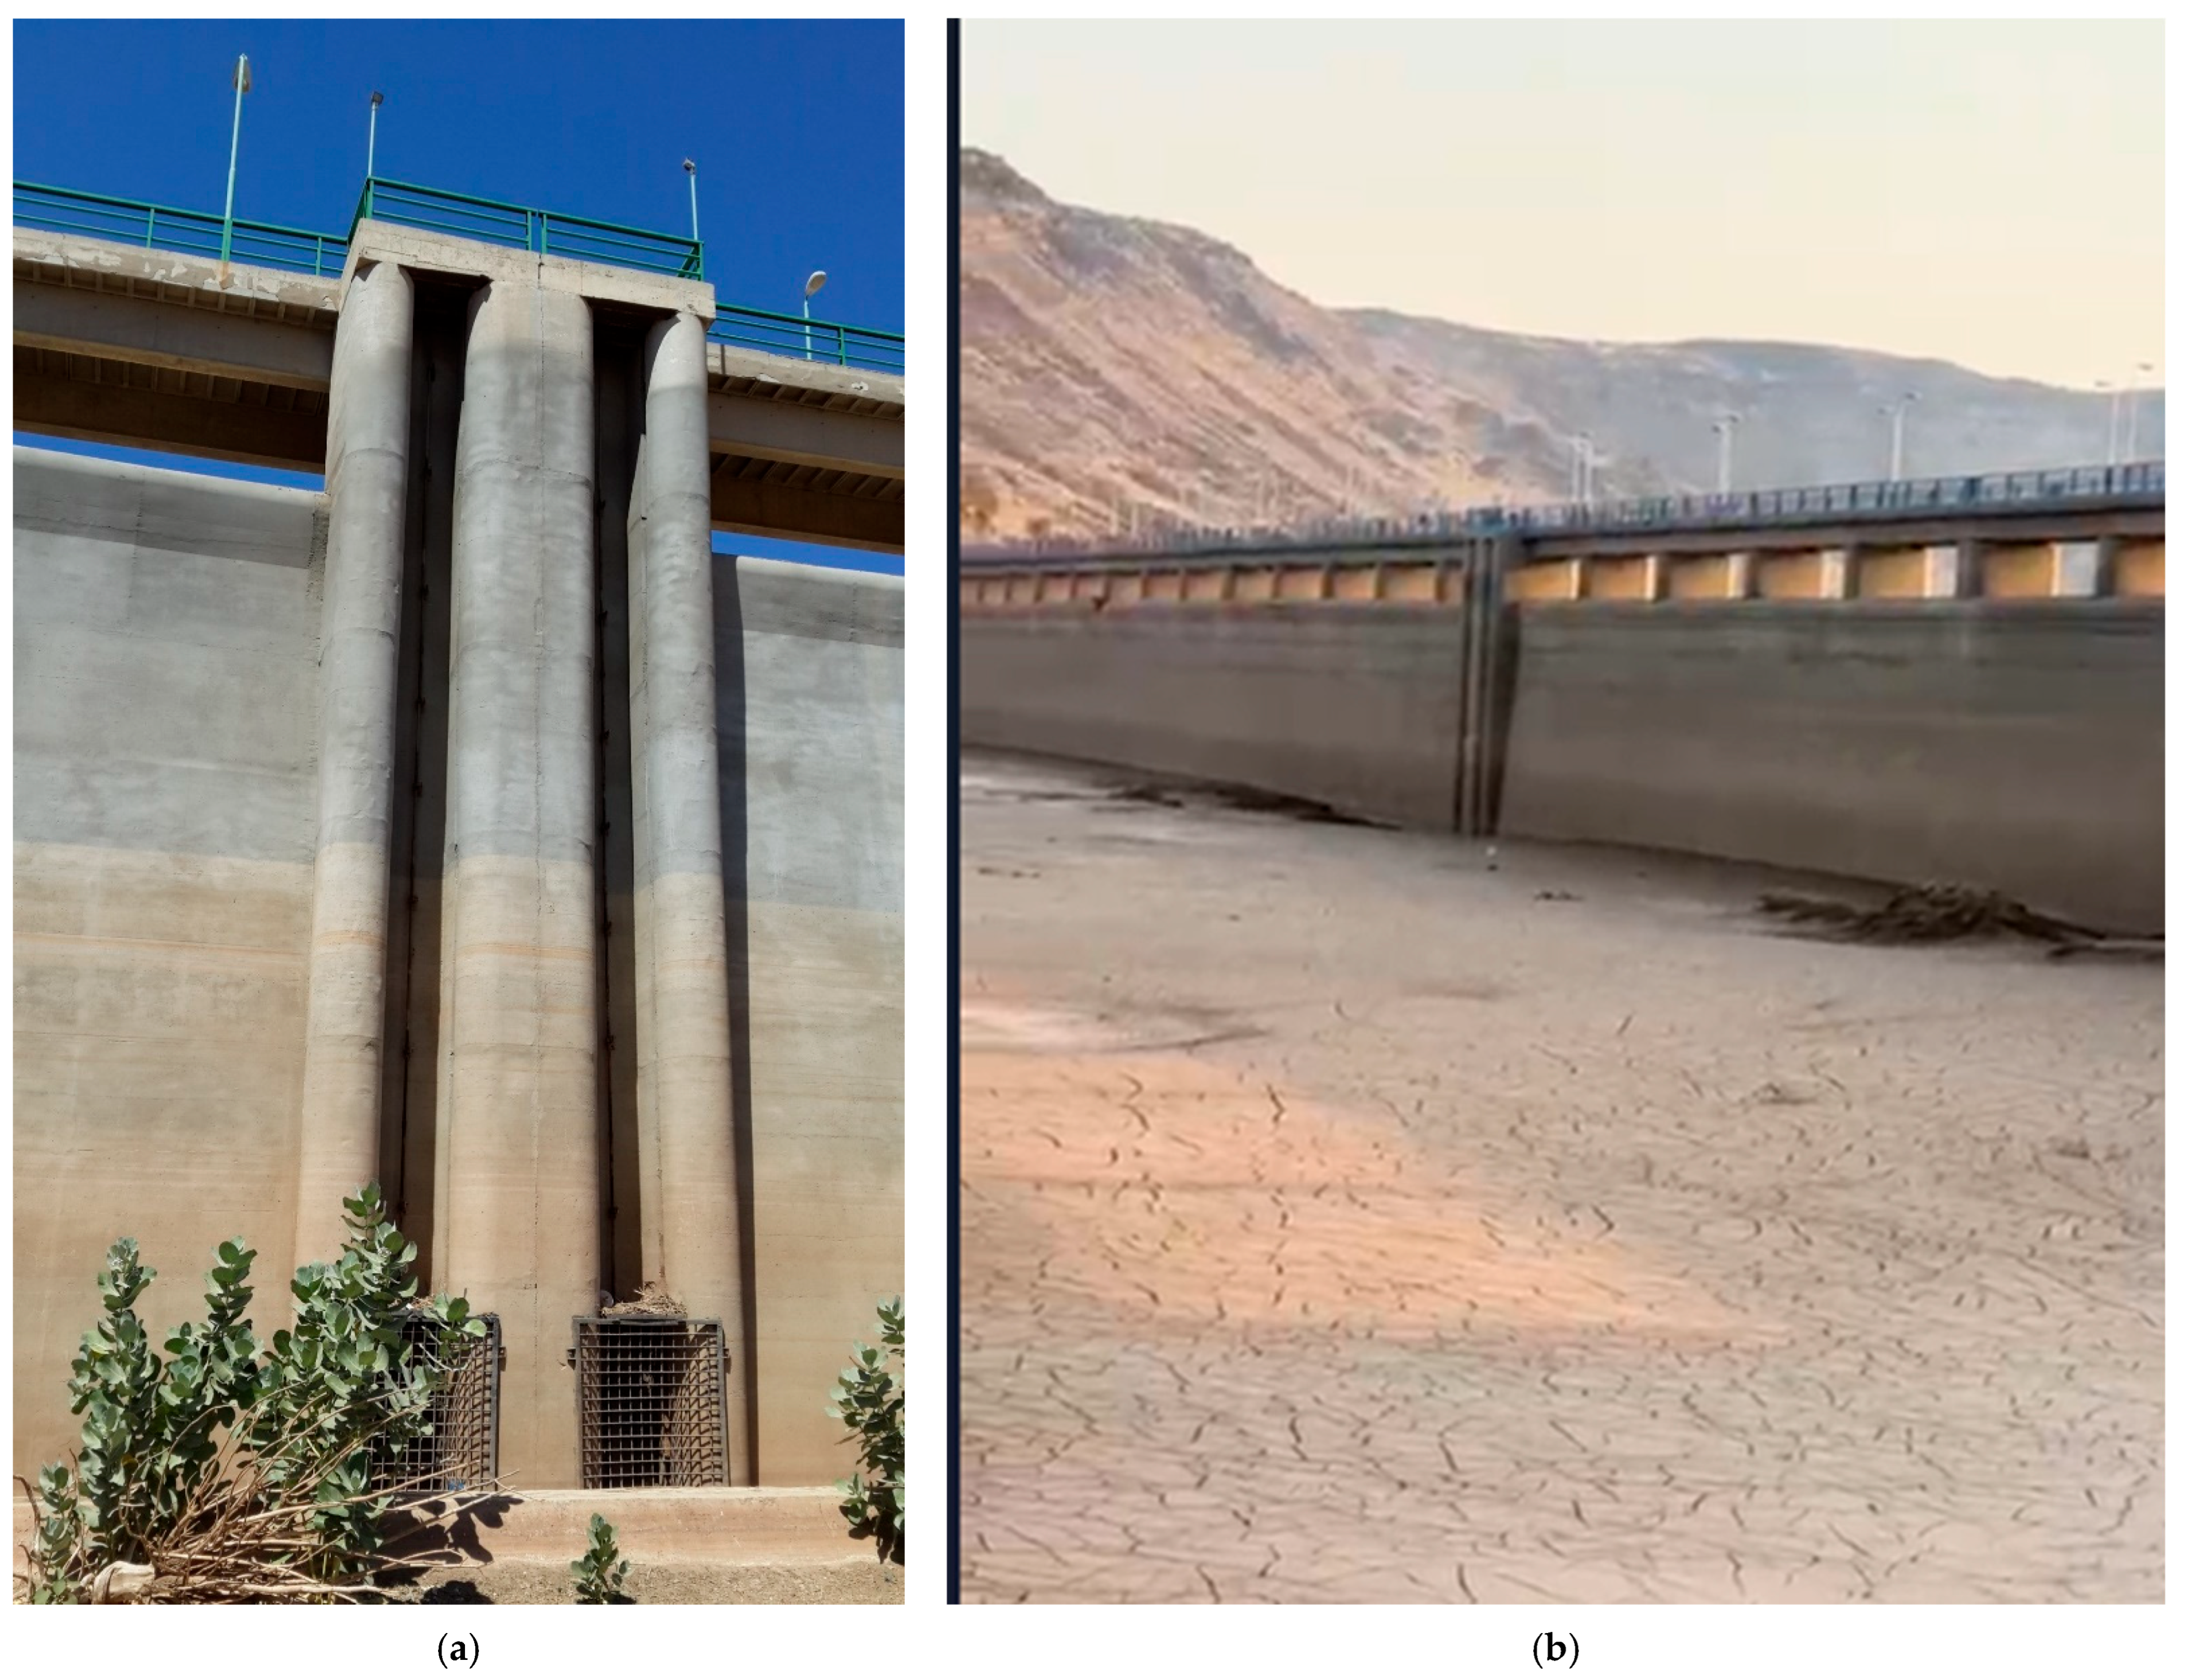
From ground survey data in 2008: The capacity curve measured in 2008 can also serve as a validation reference for sedimentation between 1985 and 2008. In 2008, the model estimated a sediment height of approximately 7.5 m (based on the annual average daily rainfall over the basin), whereas the ground survey conducted in the same year reported a sediment height of about 5 m [44]. It is important to note, however, that the measured ground survey does not account for periodic sediment removal or cleaning activities carried out by the ministry, which can contribute to discrepancies between the modeled and observed values. This interpretation is further supported by Figure 13, which illustrates sediment accumulation: one showing deposits below the outlet (~5 m) and another showing additional accumulation above it [44].
Figure 13.
Sediment accumulation below (a) and above (b) the outlet, highlighting the influence of periodic sediment removal on discrepancies between modeled and surveyed sediment heights.
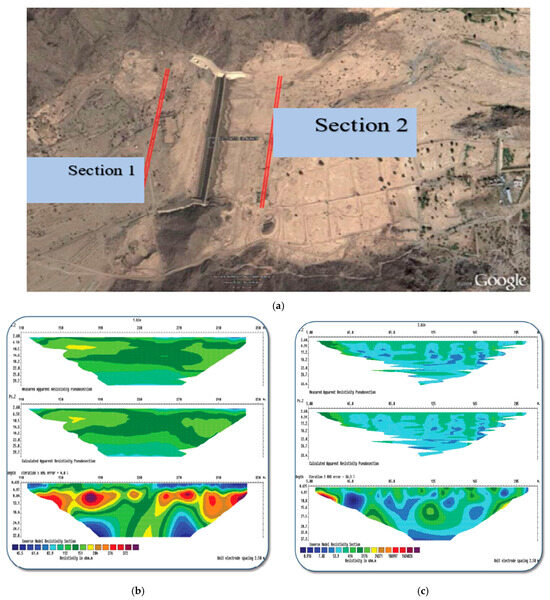
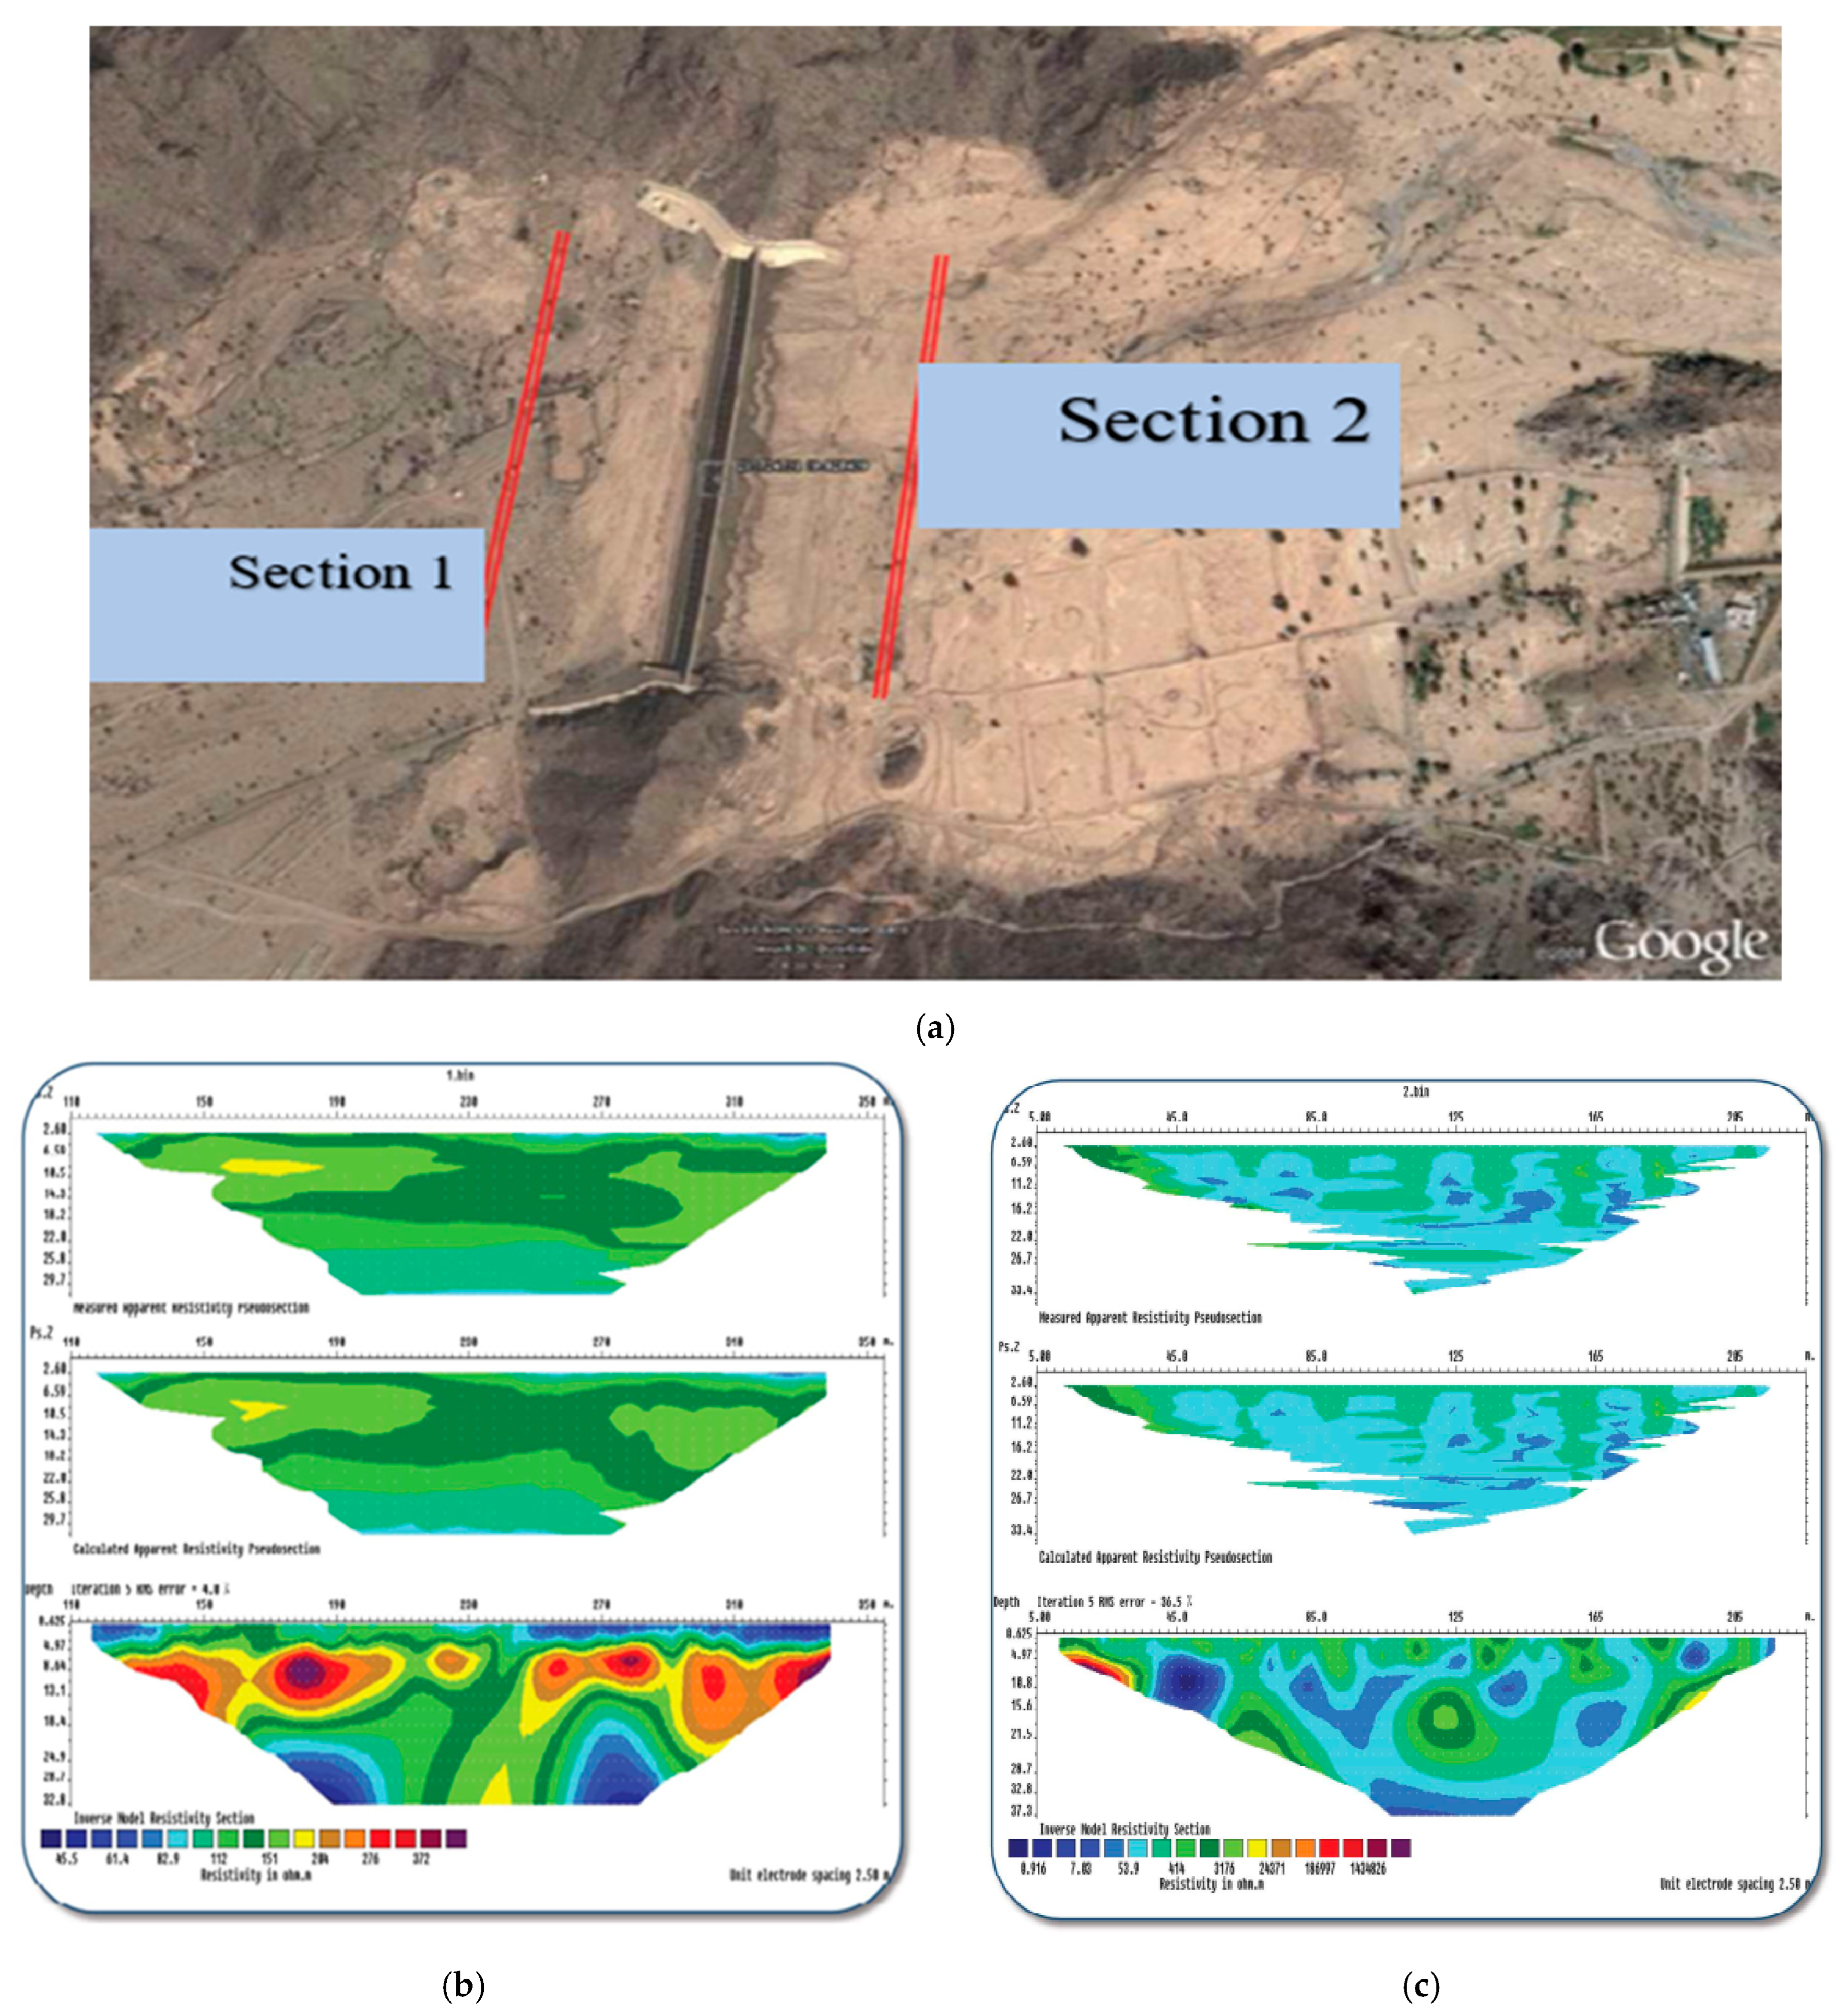
A geophysical investigation based on the resistivity method: A geophysical study is performed on the upstream and downstream sides of the dam. The downstream part is designated by Section 1 (profile 1), and the upstream part is designated by Section 2 (profile 2) as depicted in Figure 14a.
The three models (Figure 14b) represent stages of processing and interpreting geoelectric data for the first section. The blue color indicates low resistance values due to the presence of clay or water saturation, while the green color represents moderate resistance values, mostly indicating clay and limestone deposits relatively saturated with water. The brown and red colors indicate high resistance values, indicating the presence of granite bedrock.
The subsurface electrical sections of the first section (Figure 14b) revealed varying electrical resistance values due to the diverse nature and geology of the area. The high resistance values, depicted in dark red and brown (greater than 2000 Ω m), mostly represent the upper part of the section (up to a depth of 2 m), where the sediments are dry due to evaporation or the high resistance of exposed surface bedrock due to weathering. The deep high resistance values are attributed to the presence of granite bedrock. The low resistance values (ranging from 45 to 90 Ω m), depicted in blue, may indicate a water-bearing layer or water-saturated clay zone. The yellow and green colors indicate moderate resistance values due to the presence of clay deposits.
The saturated mud and clay extend across the section at various depths and may contain fractures in different directions. The section illustrates an irregular boundary between the bedrock and the overlying rocks. The three models in Figure 13 represent stages of processing and interpreting geoelectric data for the second section, with similar color gradations and resistance values as mentioned in the first section (Figure 14b).
The data from the second section (Figure 14c) indicate low resistance values depicted in blue, which may indicate a water-bearing layer or water-saturated clay zone. The high resistance values (greater than 2000 Ω m) are attributed to granite bedrock. The layer above this granite rock is about 5 m thick and has low resistivity. This layer is attributed to the sediment accumulation due to the dam, as it is found on the upstream part of the dam (Section 2).
During the survey conducted in 2008, the measured height was around 5 m, while our model projected it to be around 7.5 m based on the average annual rainfall, with the 10% and 90% corresponding to about 3 m and 40 m sediment buildup. These inconsistencies can be attributed to the irregular sediment removal activities performed by the Ministry of Environment, Water, and Agriculture. Furthermore, because individual rainstorms may not cover the entire watershed, the model may occasionally overestimate sediment rise. Since the frequency and quantity of sediment removal are unknown, accurately predicting the sediment levels in the dam remains challenging. The amount of reservoir volume reduction in the Wadi Fatimah dam reservoir is 42% in 2008 and it is expected to be 55% in 2022 according to the proposed model; however, due to cleaning and sediment removal, it goes to a height of 5 m.
It is important to acknowledge that model validation in this study relies primarily on a single ground survey conducted in 2008, supported by qualitative interpretation of geophysical evidence. While the 2008 survey provides a critical benchmark for assessing sediment elevation and reservoir capacity loss, the absence of repeated temporal surveys limits the ability to fully constrain interannual variability and long-term sedimentation dynamics over the 1985–2022 period. Consequently, uncertainty increases when model predictions are extrapolated across extended time horizons with limited direct field verification. The agreement between modeled sediment accumulation and the available survey data supports the structural consistency of the proposed framework; however, future studies incorporating repeated bathymetric surveys, systematic sediment thickness measurements, or time-lapse geophysical monitoring would substantially enhance model calibration, reduce predictive uncertainty, and strengthen confidence in long-term sedimentation assessments.
Over a span of 29 years, the Hirakund Dam experienced a reduction in reservoir capacity by 18.78%. The original capacity of the dam was 8144 million cubic meters (Mm3), which decreased to 6614 Mm3. Furthermore, when the dam was resurveyed in 2000, after an additional 23 years, its capacity had further reduced by 27.6% [45]. Iradukunda’s research on reservoir sedimentation in Kenya has revealed significant findings. In the case of the Murera Reservoir, it was observed that approximately 14% of its total water storage capacity was lost due to sedimentation, as indicated in Iradukunda’s study. Additionally, the author identified a capacity loss of around 9% for Nakuru Lake in Kenya. These findings highlight the substantial impact of sedimentation on the water storage capacity of these important water bodies in Kenya [6,46].
Mane and Hangergkar studied the Ujjani dam reservoir in India and identified that the reservoir’s design capacity of 7167.2 Mm3 decreased to 5467.5 Mm3 from 1976 to 2004. This shows a total capacity loss of about 23.714% in a span of 28 years [47]. Wadi Fatimah Dam’s reservoir storage capacity during the design of the dam was 20 Mm3, while its capacity during 2008 and 2022 was about 11.5 Mm3 and 8.94 Mm3 respectively. This shows a total storage capacity reduction of 42% in the span of 23 years and a total capacity reduction of 55% in 37 years.
The observed trends in sedimentation rate indicate that arid regions across the globe face a more pronounced challenge of sediment accumulation compared to other geographical areas. Notably, research conducted by references [5] supports this finding, emphasizing that the percentage of reservoir capacity lost to sedimentation annually in the arid Middle East reaches a significant 1.02%. This percentage far exceeds the levels experienced in other parts of the world, underscoring the severity of the issue.
In this study, we focused on the specific case of the Wadi Fatimah dam, which serves as a poignant example of the detrimental impact of sedimentation on reservoirs in arid regions. Within a relatively short period of 23 years (1985–2008), this dam encountered a staggering loss of approximately 42% of its storage capacity due to sedimentation. This finding is alarming, as it showcases the rapid and substantial decline in the dam’s effectiveness in storing water.
Comparatively, when evaluating other dam reservoirs, such as Ujjani and Hirakund mentioned above, the level of sedimentation experienced is significantly lower. The Wadi Fatimah dam’s sedimentation rate is approximately double that of these other reservoirs. This discrepancy highlights the unique and intensified sedimentation challenges faced by arid regions, emphasizing the urgent need for effective mitigation strategies.
These findings emphasize the critical importance of addressing sedimentation issues in arid regions, as the loss of storage capacity directly affects water availability and sustainability. By developing and implementing comprehensive sediment management plans, it is possible to mitigate the adverse effects of sedimentation, safeguarding the long-term viability of reservoirs and ensuring a stable water supply for arid regions and their communities.
4.5. Practical Implications, Significance, and Limitations
The findings on reservoir sedimentation have direct implications for dam safety, flood risk, and water-supply reliability. Sediment accumulation reduces storage capacity and can lead to overtopping during high-flow events, threatening dam stability and downstream communities [48,49]. In arid regions like western Saudi Arabia, the rapid rise in sediment height observed in the Wadi Fatimah Dam underscores the urgent need for proactive sediment management to maintain safety and storage efficiency.
Sedimentation also exacerbates flood risks by reducing the reservoir’s ability to buffer extreme inflows, thereby increasing downstream flood vulnerability [48]. Similarly, it threatens water-supply reliability, particularly in arid zones where reservoirs are vital for domestic and agricultural use [50]. The predicted reduction in Wadi Fatimah’s capacity aligns with recent national findings showing that Saudi Arabia’s cumulative reservoir storage capacity has declined by about 32% relative to design capacity, emphasizing the severity of sedimentation impacts [51].
This study advances hydrological modeling of sedimentation and highlights the importance of integrating sediment dynamics into dam design and management frameworks. However, the study is constrained by data scarcity, simplified modeling assumptions, and the omission of climate-change effects, limitations consistent with ref. [52], who cautioned that hydrological analyses based on rainfall records shorter than 20 years may produce unreliable flood estimations. It should also be noted that sediment transport in arid environments is highly episodic and typically dominated by a limited number of high-intensity storm events. In the present study, annual average daily rainfall was used to represent long-term hydrological forcing for cumulative sediment rise estimation. While the rainfall–runoff modeling framework is event-based, the aggregation of rainfall data to annual averages may smooth the influence of extreme storms that can disproportionately contribute to sediment yield. Consequently, peak-driven sediment pulses may be underrepresented in long-term sedimentation estimates. Future research incorporating high-resolution storm-scale rainfall data and event-based sediment simulations would improve the representation of extreme-event dominance in ephemeral basins. Despite these constraints, the results provide a robust foundation for sustainable reservoir management, offering insights that can inform desilting strategies, risk assessments, and long-term water-security planning across arid regions.
5. Summary and Conclusions
The sediment rating curves (SRC) developed from gauged basins are used to model the sediment transport towards a dam reservoir and consequently can be used to predict the sediment rise in the reservoir and the temporal evolution of the reservoir capacity elevation curve (ECC). The power equation in the following form , where Qs is sediment discharge, Qw is water discharge, a and b are the parameters of the rating curves, was developed for estimating sediment discharge and sediment yield of the basins.
A newly developed model that combines the SRC and the ECC equations is applied to a dam case study in Saudi Arabia. The developed model is solved numerically to estimate the sediment rise as
where is the sediment buildup height at time t, is the sediment buildup height at time , is the maximum dam height, is the maximum dam storage capacity, is the time step, is water discharge, is average sediment density, N is the reservoir coefficient specific to the dam and a and b are SRC parameters.
Once the sediment depth is estimated, the reservoir volume at a specific time is calculated by,
Augmenting both equations with rainfall data from the start date of dam operation in 1985 until 2022, one can predict the changes in the ECC and therefore estimate the sediment rise and the reduction in the reservoir capacity. The results of the model have been validated in Wadi Fatimah dam case study, which produced pretty good results. The model was able to match the ECC measured from the ground survey at the reservoir dam site in 2008.
The model has estimated a rise of 7.5 m of sediment at the dam from 1985 to 2008 based on annual average daily rainfall, assuming no maintenance or sediment removal from the reservoir. This estimate is supported by validation against the 2008 ground survey and geophysical investigations, which indicated a sediment height of approximately 5 m at that time. The observed 5 m is mainly due to regular maintenance at the dam site to keep the outlet opening always clean from sediments to be able to release the reservoir water after each storm.
Author Contributions
Conceptualization, A.E. and B.A.A.; data collection and curation, N.A. and B.A.A.; formal analysis, B.A.A. and A.E.; investigation, N.A.; methodology, B.A.A. and A.E.; validation, A.E. and N.A.; writing—original draft, B.A.A.; writing—review and editing, B.A.A., A.E. and N.A. All authors have read and agreed to the published version of the manuscript.
Funding
This project was funded by the Deanship of Scientific Research (DSR) at King Abdulaziz University, Jeddah, Saudi Arabia under grant number (IPP:817-155-2025). The authors, therefore, acknowledge with thanks DSR for technical and financial support.
Data Availability Statement
The dam data utilized in this study was obtained from a government ministry, and unfortunately, due to restrictions on public access, it cannot be made publicly available.
Conflicts of Interest
The authors declare no conflicts of interest.
References
- Asthana, B.; Khare, D. Reservoir sedimentation. In Recent Advances in Dam Engineering; Springer: Berlin/Heidelberg, Germany, 2022; pp. 265–288. [Google Scholar]
- Obialor, C.; Okeke, O.; Onunkwo, A.; Fagorite, V.; Ehujuo, N. Reservoir sedimentation: Causes, effects and mitigation. Int. J. Adv. Acad. Res. 2019, 5, 92–109. [Google Scholar]
- Wang, Z.-y.; Chunhong, H. Strategies for managing reservoir sedimentation. Int. J. Sediment Res. 2009, 24, 369–384. [Google Scholar] [CrossRef] [Scilit]
- Auel, C.; Kantoush, S.; Sumi, T. Positive effects of reservoir sedimentation management on reservoir life: Examples from Japan. In Proceedings of the 84th Annual Meeting of ICOLD, Johannesburg, South Africa, 11–20 April 2016. [Google Scholar]
- Schleiss, A.J.; Franca, M.J.; Juez, C.; De Cesare, G. Reservoir sedimentation. J. Hydraul. Res. 2016, 54, 595–614. [Google Scholar] [CrossRef] [Scilit]
- Iradukunda, P.; Bwambale, E. Reservoir sedimentation and its effect on storage capacity–A case study of Murera reservoir, Kenya. Cogent Eng. 2021, 8, 1917329. [Google Scholar] [CrossRef] [Scilit]
- Mahmood, K. Reservoir Sedimentation: Impact, Extent and Mitigation; World Bank Technical Paper: Washington, DC, USA, 1987; Volume 71. [Google Scholar]
- Brinkerhoff, J.M. Partnership as a social network mediator for resolving global conflict: The Case of the World Commission on Dams. Int. J. Public Adm. 2002, 25, 1281–1310. [CrossRef] [Scilit]
- Schleiss, A.; De Cesare, G. Physical model experiments on reservoir sedimentation. J. Hydraul. Res. 2010, 48, 54–57. [Google Scholar]
- Batuca, D.G.; Jordaan, J., Jr. Silting and Desilting of Reservoirs; CRC Press: Boca Raton, FL, USA, 2021. [Google Scholar]
- Chamoun, S.; De Cesare, G.; Schleiss, A.J. Managing reservoir sedimentation by venting turbidity currents: A review. Int. J. Sediment Res. 2016, 31, 195–204. [Google Scholar] [CrossRef] [Scilit]
- Weston, D.C.; Gibson, G.E., Jr. Partnering-project performance in US Army Corps of Engineers. J. Manag. Eng. 1993, 9, 410–425. [Google Scholar]
- Yang, C.T.; Simoes, F.J. User’s Manual for Gstars3 (Generalized Sediment Transport Model for Alluvial River Simulation Version 3.0); US Department of the Interior, Bureau of Reclamation: Washington, DC, USA, 2002.
- U.S. Bureau of Reclamation’s (USBR) Technical Service Center. Erosion and Sedimentation Manual; Government Printing Office: Washington, DC, USA, 2006.
- Ghomeshi, M. Reservoir Sedimentation Modelling; University of Wollongong: Wollongong, Australia, 1995. [Google Scholar]
- Neitsch, S.L.; Arnold, J.G.; Kiniry, J.R.; Williams, J.R.; Texas Water Resources Institute. Soil and Water Assessment Tool Theoretical Documentation Version 2009; Texas Water Resources Institute: College Station, TE, USA, 2011.
- Borland, W.M.; Miller, C.R. Distribution of sediment in large reservoirs. J. Hydraul. Div. 1958, 84, 1–18. [Google Scholar] [CrossRef] [Scilit]
- De Jong, S.; Paracchini, M.; Bertolo, F.; Folving, S.; Megier, J.; De Roo, A. Regional assessment of soil erosion using the distributed model SEMMED and remotely sensed data. Catena 1999, 37, 291–308. [Google Scholar] [CrossRef] [Scilit]
- Wang, D.G.; Fan, J.-B.; Siao, C.-J.; Berno, A.; Young, P.; Sapolsky, R.; Ghandour, G.; Perkins, N.; Winchester, E.; Spencer, J. Large-scale identification, mapping, and genotyping of single-nucleotide polymorphisms in the human genome. Science 1998, 280, 1077–1082. [Google Scholar] [CrossRef] [Scilit] [PubMed]
- Djoukbala, O.; Djerbouai, S.; Alqadhi, S.; Hasbaia, M.; Benselama, O.; Abdo, H.G.; Mallick, J. A geospatial approach-based assessment of soil erosion impacts on the dams silting in the semi-arid region. Geomat. Nat. Hazards Risk 2024, 15, 2375543. [Google Scholar] [CrossRef] [Scilit]
- Ejaz, N.; Elhag, M.; Bahrawi, J.; Zhang, L.; Gabriel, H.F.; Rahman, K.U. Soil erosion modelling and accumulation using RUSLE and remote sensing techniques: Case study Wadi Baysh, Kingdom of Saudi Arabia. Sustainability 2023, 15, 3218. [Google Scholar] [CrossRef] [Scilit]
- Benselama, O.; Hasbaia, M.; Djoukbala, O.; Boutaghane, H.; Ferhati, A.; Djerbouai, S. Suspended sedimentary dynamics under Mediterranean semi-arid environment of Wadi El Maleh watershed, Algeria. Model. Earth Syst. Environ. 2022, 8, 1013–1023. [Google Scholar] [CrossRef] [Scilit]
- Djoukbala, O.; Hasbaia, M.; Benselama, O.; Mazour, M. Comparison of the erosion prediction models from USLE, MUSLE and RUSLE in a Mediterranean watershed, case of Wadi Gazouana (N-W of Algeria). Model. Earth Syst. Environ. 2019, 5, 725–743. [Google Scholar] [CrossRef] [Scilit]
- Mohammadzadeh-Habili, J.; Heidarpour, M.; Mousavi, S.-F.; Haghiabi, A.H. Derivation of reservoir’s area-capacity equations. J. Hydrol. Eng. 2009, 14, 1017–1023. [Google Scholar] [CrossRef] [Scilit]
- Hu, B.; Wang, H.; Yang, Z.; Sun, X. Temporal and spatial variations of sediment rating curves in the Changjiang (Yangtze River) basin and their implications. Quat. Int. 2011, 230, 34–43. [Google Scholar] [CrossRef] [Scilit]
- Hasbaia, M.; Paquier, A.; Herizi, T. Hydrological modeling of sediment transport in the semi-arid region, case of Soubella watershed in Algeria. In Water Resources in Arid Areas: The Way Forward; Springer: Cham, Switzerland, 2017; pp. 251–266. [Google Scholar]
- Arebu, B.A.; Alamri, N.; Elfeki, A. Evaluation of Sediment Transport in Ephemeral Streams: A Case Study in the Southwestern Saudi Arabia. Arab. J. Sci. Eng. 2024, 49, 9781–9796. [Google Scholar] [CrossRef] [Scilit]
- Mirzapour, B.; Lak, R.; Aleali, M.; Djamali, M.; Shahbazi, R. Identifying the effects of climate changes on sedimentary environments and determining the sedimentation rate of south wetlands of Lake Urmia during Late Pleistocene and Holocene. Pollution 2021, 7, 113–127. [Google Scholar]
- Al Safry, S.; Al Ghamdi, S.; Ashi, W.; Baedi, W. Wadi Fatimah aquifer as Strategic Groundwater Storage for Makkah Area. In Proceedings of the 6TH Gulf Water Conference, Riyadh, Saudi Arabia, 8–12 March 2003. [Google Scholar]
- Grainger, D.J. A geological excursion in the Wadi Fatima area, near Jiddah, Saudi Arabia. Geol. Today 1992, 8, 215–219. [CrossRef] [Scilit]
- Hasanean, H.; Almazroui, M. Rainfall: Features and variations over Saudi Arabia, a review. Climate 2015, 3, 578–626. [Google Scholar] [CrossRef] [Scilit]
- Almazroui, M. Rainfall trends and extremes in Saudi Arabia in recent decades. Atmosphere 2020, 11, 964. [Google Scholar] [CrossRef] [Scilit]
- Abdullah, M.; Al-Mazroui, M. Climatological study of the southwestern region of Saudi Arabia. I. Rainfall analysis. Clim. Res. 1998, 9, 213–223. [Google Scholar] [CrossRef] [Scilit]
- Aljahdali, M.H.; Adisu, B.; Adem, E.; Chaabani, A.; Boteva, S.; Zhang, L.; Elhag, M. Monitoring of mangrove forests vegetation based on optical versus microwave data: A case study western coast of Saudi Arabia. Open Geosci. 2024, 16, 20220573. [Google Scholar] [CrossRef] [Scilit]
- Masoud, M. Rainfall-runoff modeling of ungauged Wadis in arid environments (case study Wadi Rabigh—Saudi Arabia). Arab. J. Geosci. 2015, 8, 2587–2606. [Google Scholar] [CrossRef] [Scilit]
- Elfeki, A.; Masoud, M.; Niyazi, B. Integrated rainfall–runoff and flood inundation modeling for flash flood risk assessment under data scarcity in arid regions: Wadi Fatimah basin case study, Saudi Arabia. Nat. Hazards 2017, 85, 87–109. [Google Scholar] [CrossRef] [Scilit]
- Masoud, M. Geoinformatics application for assessing the morphometric characteristics’ effect on hydrological response at watershed (case study of Wadi Qanunah, Saudi Arabia). Arab. J. Geosci. 2016, 9, 280. [Google Scholar] [CrossRef] [Scilit]
- Şen, Z.; Al-Harithy, S.; As-Sefry, S.; Almazroui, M. Aridity and risk calculations in Saudi Arabian wadis: Wadi Fatimah case. Earth Syst. Environ. 2017, 1, 26. [Google Scholar] [CrossRef] [Scilit]
- Bárdossy, A. Calibration of hydrological model parameters for ungauged catchments. Hydrol. Earth Syst. Sci. 2007, 11, 703–710. [Google Scholar] [CrossRef] [Scilit]
- Jeon, J.-H.; Lim, K.J.; Engel, B.A. Regional Calibration of SCS-CN L-THIA Model: Application for Ungauged Basins. Water 2014, 6, 1339–1359. [Google Scholar] [CrossRef] [Scilit]
- Farran, M.M.; Elfeki, A.M. Statistical analysis of NRCS curve number (NRCS-CN) in arid basins based on historical data. Arab. J. Geosci. 2020, 13, 31. [Google Scholar] [CrossRef] [Scilit]
- Al-Dahas, A. Removal of 135,000 m3 of sediment from the Wadi Fatimah Dam in Al-Jumum (In Arabic). In Okaz; Okaz: Taif, Saudi Arabia, 2020. [Google Scholar]
- Kamis, A.S.; Bahrawi, J.A.; Elfeki, A.M. Reservoir routing in ephemeral streams in arid regions. Arab. J. Geosci. 2018, 11, 106. [Google Scholar] [CrossRef] [Scilit]
- Consultations, K.R. Report on project and evaluation study for dams and and their operation program at different locations in KSA, Forth folder-Makkah Al-Mukarramah, Al-Taif and Al-Baha (Part2/8), Wadi Fatimah dam in Arabic. 2018; unpublished work.
- Tobgay, S. The Temporal Analysis of Area Capacity Curve of Hirakud Reservoir. Bachelor’s Thesis, Department of Civil Engineering, National Institute of Technology Rourkela, Rourkela, India, 2014. [Google Scholar]
- Iradukunda, P.; Sang, J.K.; Nyadawa, M.O.; Maina, C.W. Sedimentation effect on the storage capacity in lake Nakuru, Kenya. J. Sustain. Res. Eng. 2020, 5, 149–158. [Google Scholar]
- Mane, M.R.; Hangergekar, P. A Review on Reservoir Sedimentation Studies Using Satellite Remote Sensing Technique. Int. J. Innov. Eng. Res. Technol. 2015, 2, 1–7. [Google Scholar]
- Adamo, N.; Al-Ansari, N.; Laue, J.; Knutsson, S.; Sissakian, V. Risk management concepts in dam safety evaluation: Mosul Dam as a case study. J. Civ. Eng. Archit. 2017, 11, 635–652. [Google Scholar]
- Malavoi, B.; Abderrezzak, K.E.K. Reservoir sedimentation, dam safety and hydropower production: Hazards, risks and issues. Hydrolink 2019, 2, 50–53. [Google Scholar]
- Kamtukule, S.L. Investigating Impacts of Sedimentation on Water Availability in Small Dams: Case Study of Chamakala II Small Earth Dam in Malawi. Master’s Thesis, Department of Civil Engineering, University of Zimbabwe, Harare, Zimbabwe, 2008. [Google Scholar]
- Dash, S.S.; Ivanović, N.; Alharbi, R.; Hancock, G.R.; Wada, Y.; McCabe, M.F.; Pal, D.; Marttila, H.; Beck, H.E. Sedimentation in Saudi Arabia’s 574 reservoirs: Nationwide assessment using remote sensing and erosion modeling. J. Environ. Manag. 2025, 394, 127199. [Google Scholar] [CrossRef] [Scilit]
- Elfeki, A.; Kamis, A.S.; Marko, K. Hydrological assessment of some old dams in Saudi Arabia under the current climate, environmental conditions, and the use of the advanced technology. Appl. Water Sci. 2023, 13, 188. [Google Scholar] [CrossRef] [Scilit]

Disclaimer/Publisher’s Note: The statements, opinions and data contained in all publications are solely those of the individual author(s) and contributor(s) and not of MDPI and/or the editor(s). MDPI and/or the editor(s) disclaim responsibility for any injury to people or property resulting from any ideas, methods, instructions or products referred to in the content. |
© 2026 by the authors. Licensee MDPI, Basel, Switzerland. This article is an open access article distributed under the terms and conditions of the Creative Commons Attribution (CC BY) license.