


Abstract
Peatland transformation to oil palm in Indonesia has accelerated lowering groundwater levels leading to peat degradation. However, how subsurface flow contributes to groundwater-level recession across peat horizons remains unclear. This study modeled lateral seepage in a 30 ha oil palm block at Siak Regency, Indonesia. We used weather and water table data for January 2020–December 2021, and we employed single-well recovery analysis and Darcy’s law to estimate saturated hydraulic conductivity. Subsurface barrier effects were evaluated through an elliptical seepage-path model based on the Ramanujan approximation. The results showed that groundwater levels fluctuated during the observation period, and on average it is below 40 cm threshold. Groundwater recession after a dry spell reached 16.4 mm/day over 29 days. Our findings also reveal a mean subsurface discharge is more than five times that of evapotranspiration (mean rates of 13.2 versus 2.3 mm/day), which drives groundwater decline by 15.5 mm/day. This confirms that lateral seepage as the dominant export pathway. A modeled impermeable barrier installed at approximately 2.5 m depth theoretically reduced lateral discharge by about 86% relative to unblocked conditions—theoretical reductions of 36.8%, 71.5%, and 93.4% at 1.0, 2.0, and 2.75 m, respectively. Deep subsurface barriers therefore complement canal blocking by intercepting profile-scale lateral losses below the ground surface, yielding an integrated hydraulic-control strategy for limiting both components of water export in cultivated peatlands. This research will support and provide knowledge on how to conduct peat restoration effectively.
1. Introduction
Peatlands represent a critical component of the global biosphere, comprising 50–70% of total wetland areas and covering over four million km2, or approximately 3% of Earth’s terrestrial and freshwater surfaces [1]. These ecosystems serve as vital reservoirs, sequestering one-third of global soil carbon stocks while providing 10% of the world’s freshwater resources. The functional integrity of these environments is fundamentally governed by specific hydrological processes, including water retention capacity, supply volume, chemical quality, and source variability [2].
Southeast Asia contains the world’s largest expanse of tropical peatlands, accounting for 56% of such areas and storing 77% of global soil carbon due to extensive surface coverage and substantial peat thickness exceeding 10 m [3]. Within this region, Indonesia has the largest tropical peat by more than 13M ha, with major distributions located in Sumatra, Kalimantan, and Papua [4]. Peat depth across these Indonesian provinces is highly variable, as deposits in Sumatra and Kalimantan often exceed 7 m, whereas layers in Papua and Sulawesi are predominantly shallower than 3 m.
The conversion of peatlands for agricultural purposes, particularly oil palm cultivation, requires extensive canal drainage to lowering groundwater levels [5,6,7] for optimal growth of root. This drainage leads to drying peatland that triggers a cascade of degradation processes including organic matter oxidation, decomposition, and significant moisture loss. These phenomena collectively drive surface subsidence through volumetric reduction caused by both shrinkage above the water table and compression below it [8]. While compaction may serve as a primary driver of subsidence relative to shrinkage alone [9], excessive drainage often results in irreversible morphological changes and desiccation [10]. Physical shifts in pore pressure during drainage fundamentally alter peat structure and density. Decreased hydrostatic pressure in saturated peat transfers weight from pore fluids to peat fibers, thereby increasing bulk density via compression [11]. Volume loss occurs through consolidation, where water is removed under maintained saturation [12], followed by further shrinkage induced by capillary suction as air enters the pores during subsequent drying [13].
Soil physical properties are also fundamental for groundwater dynamics related to carbon emissions. Peat soils exhibit strong hydraulic conductivity anisotropy, characterized by horizontal conductivity that is typically four times higher than vertical conductivity [8]. As groundwater levels decline, CO2 emissions increase [14,15,16], therefore maintaining optimal water table depths is crucial as a primary mitigation strategy to support agricultural productivity while minimizing greenhouse gas emission.
Canal blocking represents an effective management tool for wetland restoration and fire prevention by regulating surface water elevation and retaining subsurface moisture [17,18]. A study showed that elevating water tables by canal blocking effectively reduced both land subsidence and CO2 emissions [19]. By regulating groundwater via channel-blocking structures, these interventions facilitate the leaching of toxic substances and mitigate seasonal fluctuations between extreme flooding and desiccation [20,21,22].
Indonesian Government Regulation No. 57 of 2016 establishes a strict criterion for peatland health, defining cultivated areas as degraded when groundwater levels fall more than 0.4 m below the surface or when pyrite-bearing sediments become exposed. Empirical monitoring within Siak Regency oil palm plantations revealed a decline groundwater table, in ranges from 7 to 15 mm per day [23], or about 45 cm a month in case of no rainfall. This may illustrate the substantial difficulty of maintaining consistent regulatory compliance.
A comprehensive understanding of groundwater flow dynamics and hydraulic properties across diverse peat horizons remains a critical research priority, particularly in the context of sustainable peatland management and restoration. Although canal blocking has been widely implemented as a restoration strategy to reduce drainage and maintain groundwater levels, rapid groundwater-level recession can still occur during prolonged dry periods, even in well-managed tropical peatlands. Groundwater depletion may not be driven only by surface drainage and evapotranspiration (ET), but may also involve lateral subsurface water losses through the permeable peat layers. However, a critical knowledge gap remains regarding the magnitude and relative contribution of profile-scale lateral subsurface flow to groundwater recession compared with atmospheric ET and surface boundary dynamics. Most current restoration models treat peatland water loss primarily as a surface-channel or vertical evaporative flux, leaving deep profile lateral export under-quantified. To address this gap, this study integrates field-derived saturated hydraulic conductivity (Ks) from single-well pumping recovery tests, continuous high-frequency hydrometric logging across dry-spell episodes, and a novel semi-elliptical flow-path model. Specifically, we quantify the volumetric contribution of lateral subsurface seepage to phreatic drawdown and evaluate the theoretical efficacy of embedded subsurface flow barriers, providing an integrated surface-subsurface hydraulic-control framework for tropical peatland restoration.
2. Materials and Methods
2.1. Study Location
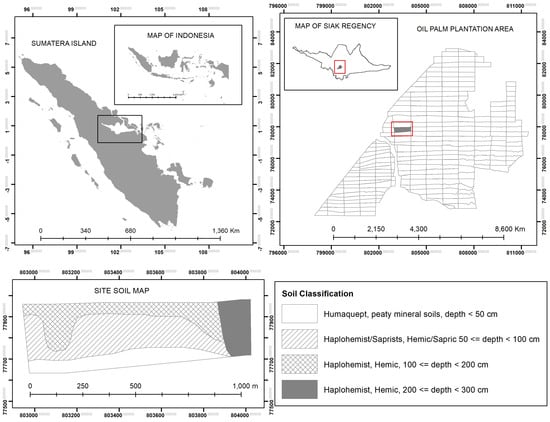
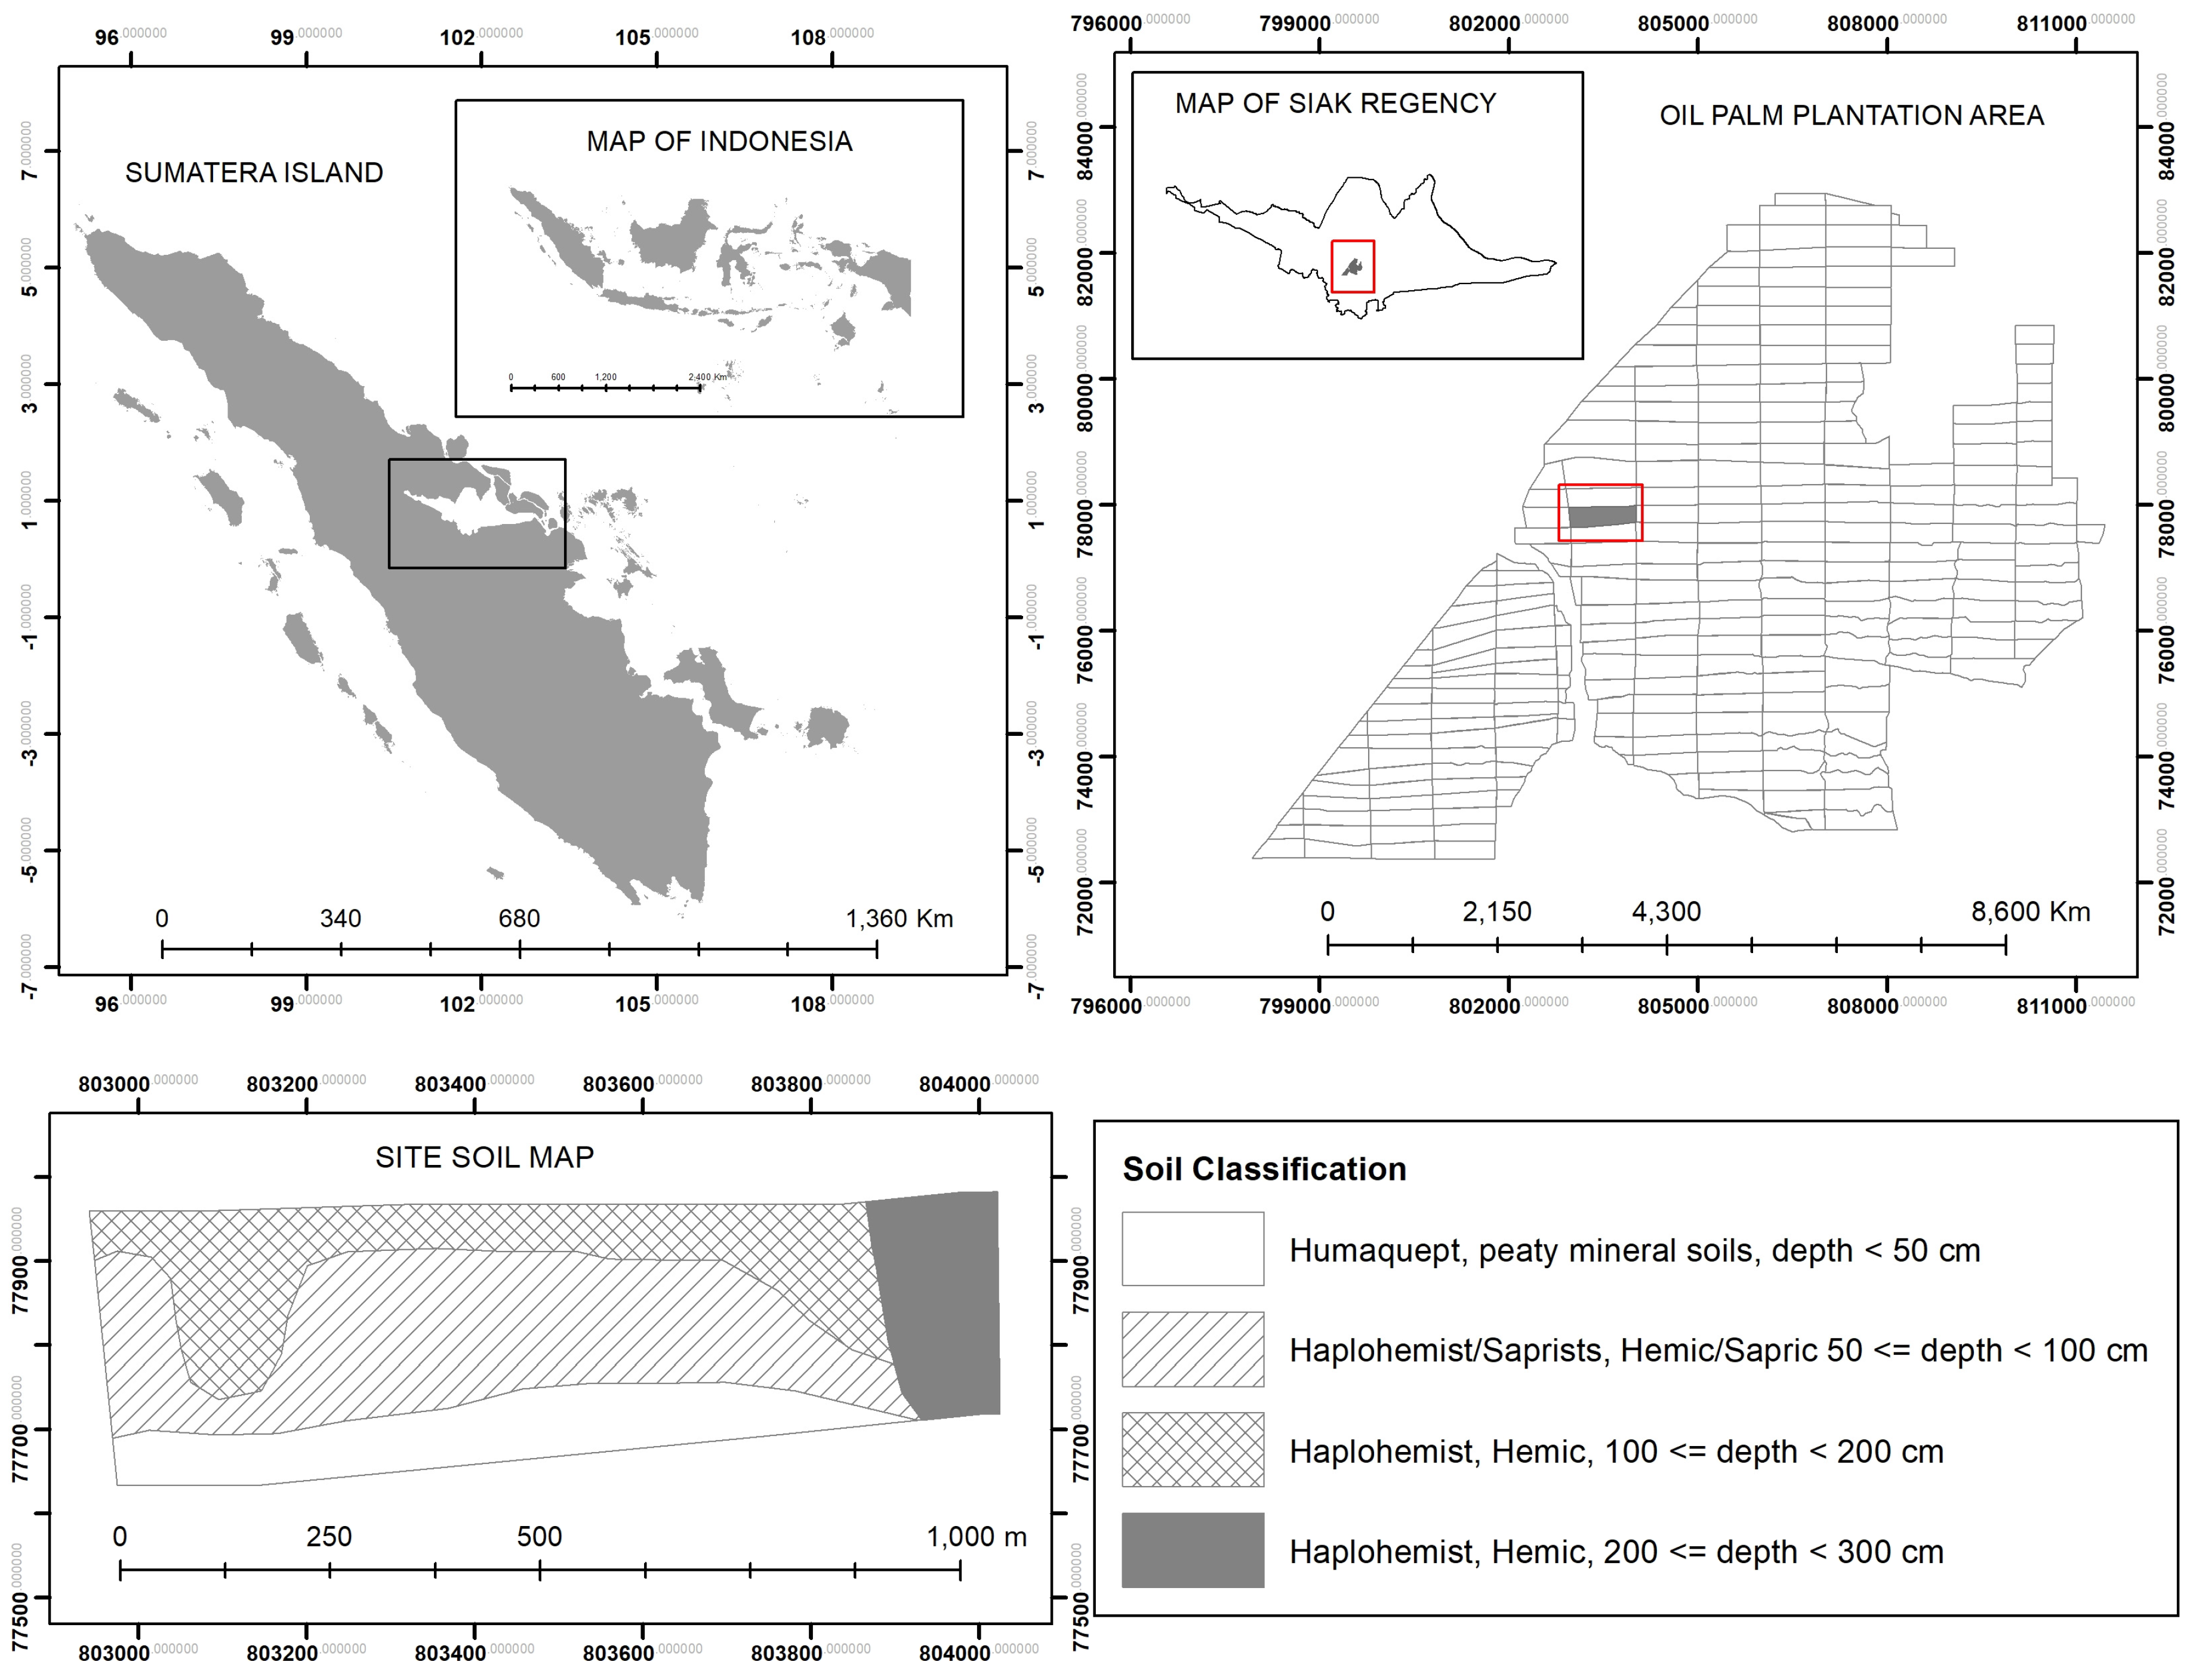
The research was conducted on a 30 ha planting block within an oil palm plantation located in Pangkalan Pisang Village, Koto Gasib District, Siak Regency, Riau Province, for January 2020 to December 2021. The study site is situated on peat soil classified under Soil Taxonomy as Hemic to Sapric horizons [24], ranging from moderately decomposed to highly decomposed, with depths of less than 3 m. Geographic location of the study area and its soil classification is provided in Figure 1.
Figure 1.
Geographic location of the study area in Pangkalan Pisang Village, Koto Gasib, Siak, Riau Province in Indonesia and its soil classification.
2.2. Data Monitoring
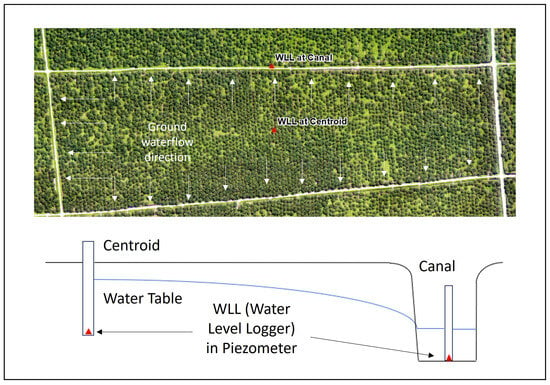
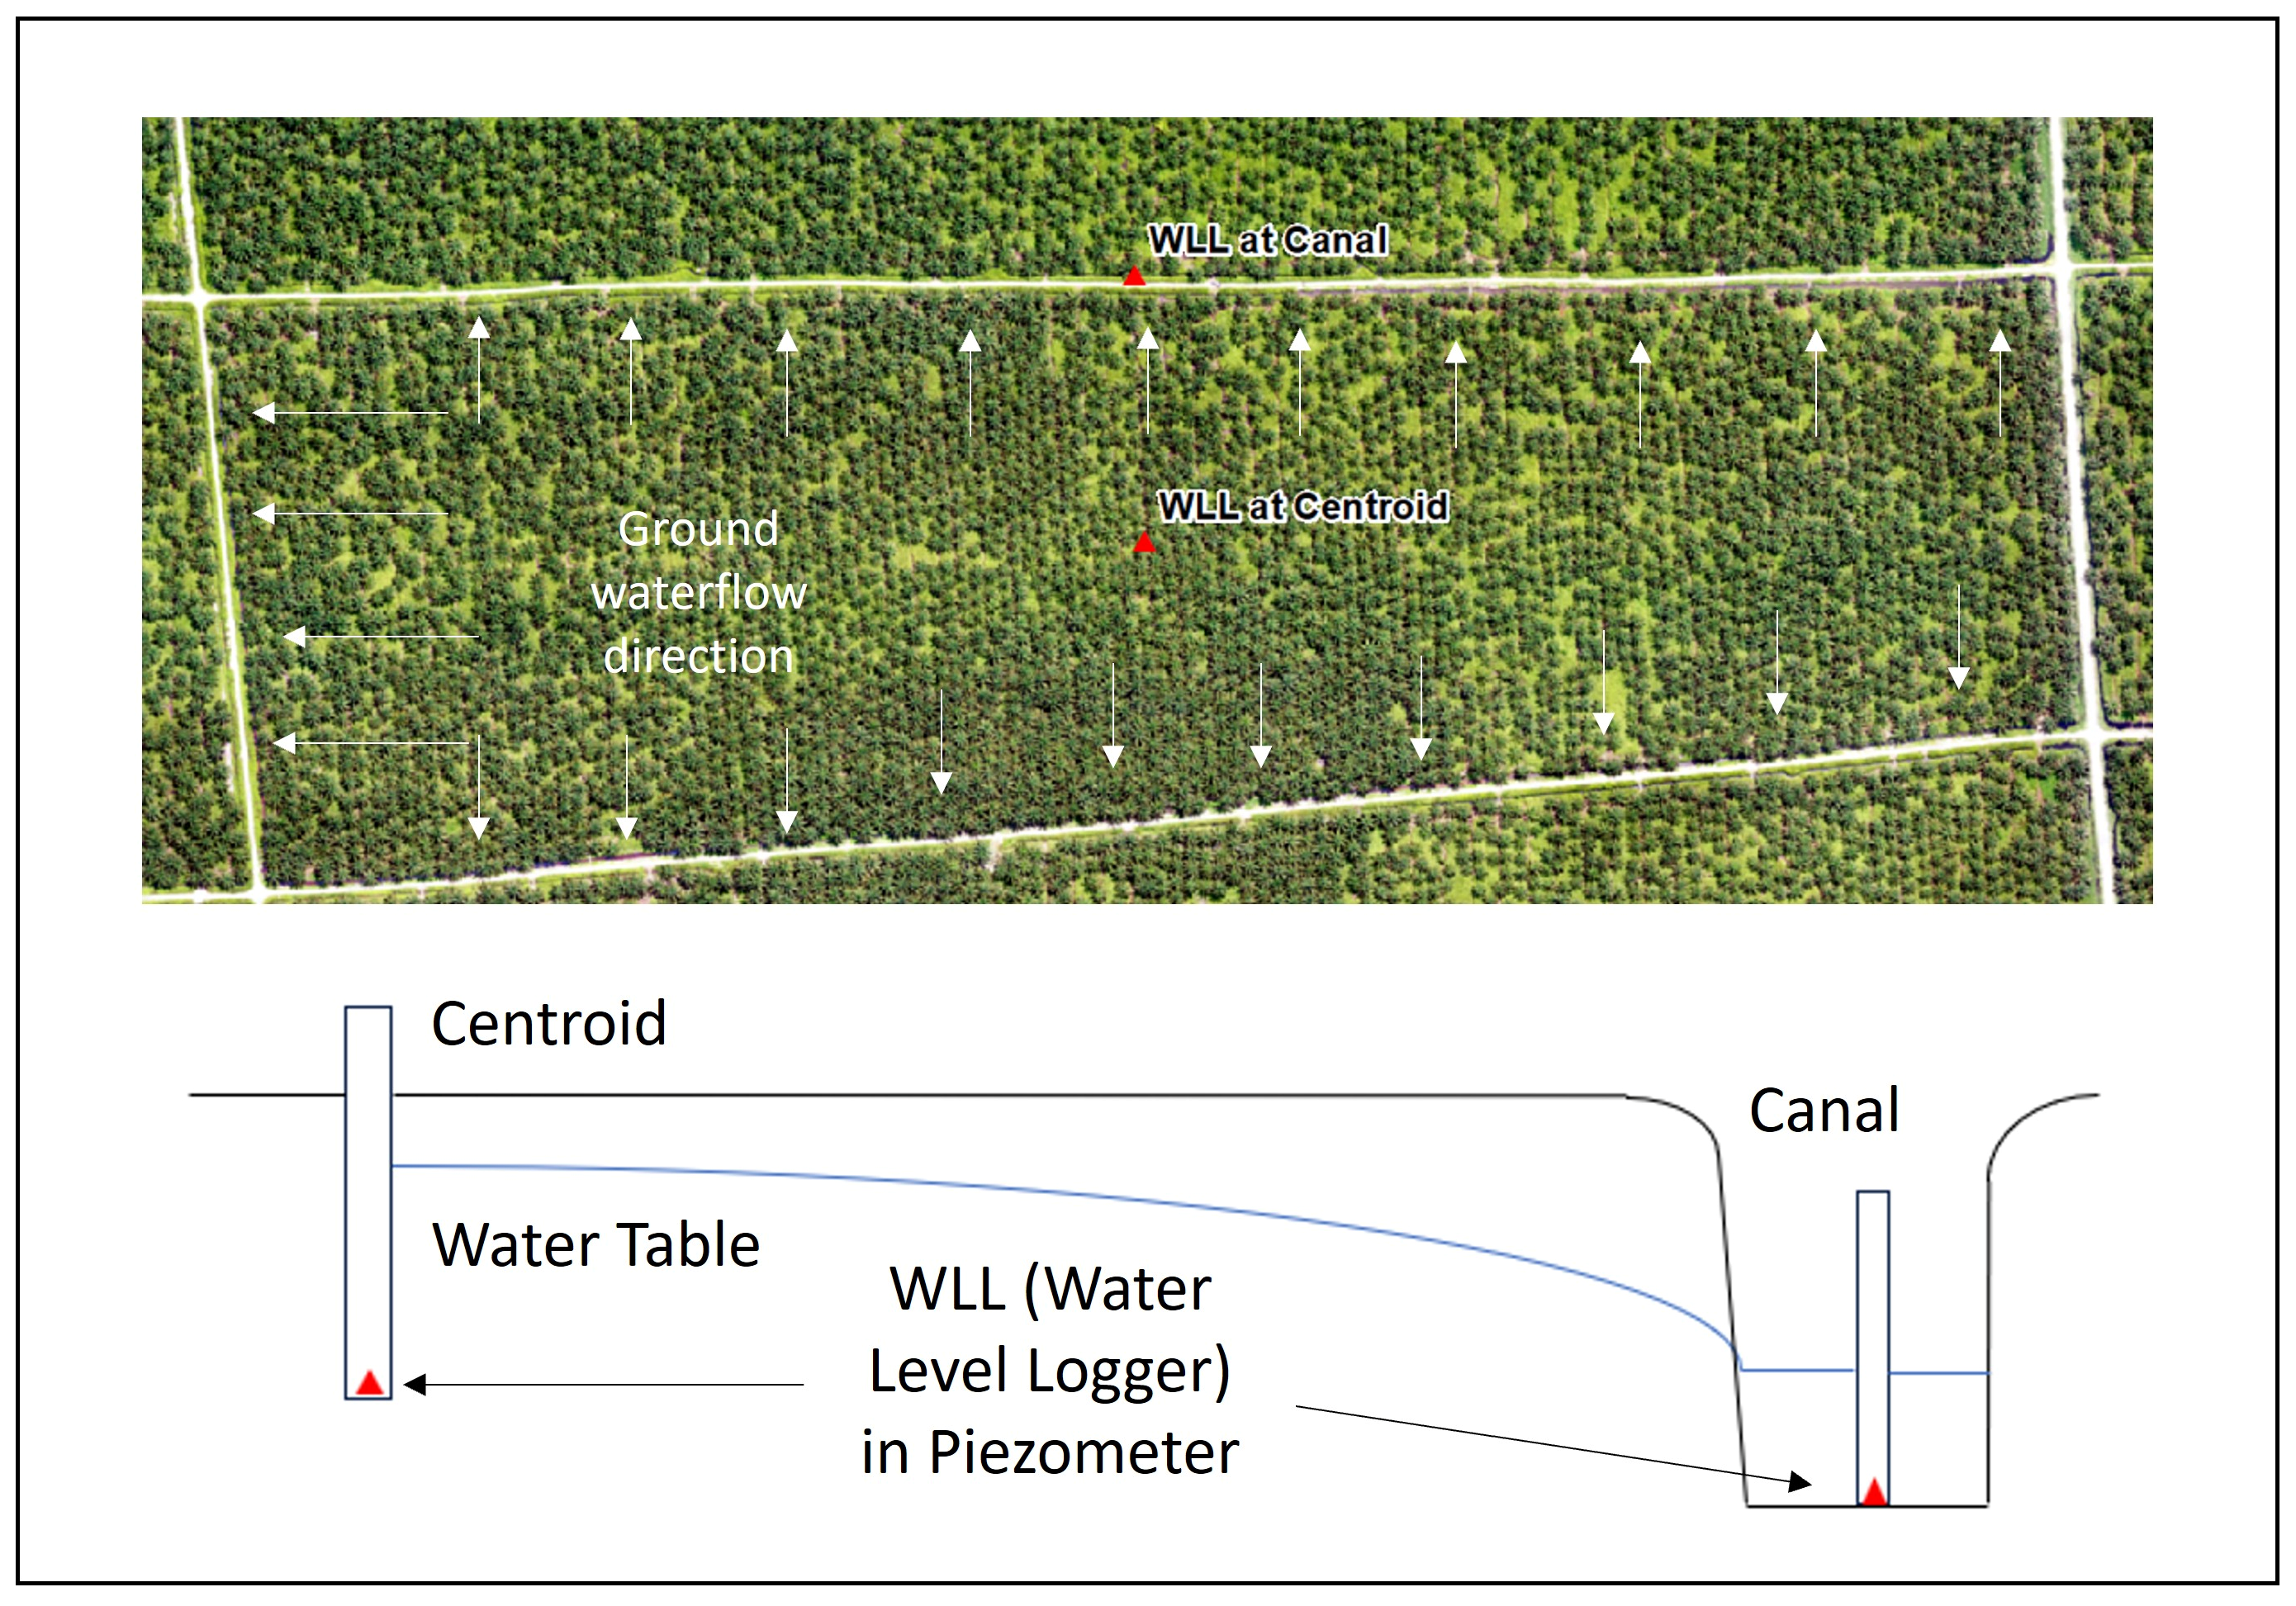
Weather data were monitored using an Automatic Weather Station (AWS), which is geographically installed at 0°40′26.4″ N and 101°43′40.8″ E. AWS data were recorded at 30 min interval for temperature, relative humidity, rainfall, wind speed, and solar radiation. Daily evapotranspiration was calculated using the Penman approach. Groundwater level elevation (GWL, m asl) was continuously recorded at 30 min intervals using a single automatic water level logger installed within a piezometer at the geometric centroid of the 30 ha experimental block (150 m from adjacent parallel drainage canals). Canal water level elevation (CWL, m asl) was concurrently logged at an adjacent boundary canal station hydraulically aligned with the centroid piezometer (Figure 2). To evaluate decline rates during dry periods, the analysis utilized a recession curve equation [25]:
in which, Ht is the GWL at time t, H0 is the initial GWL, k as the recession constant, where t is the time interval.
Figure 2.
Water level logger (WLL) installation at the study area and the assumed groundwater flow direction.
2.3. Hydraulic Conductivity
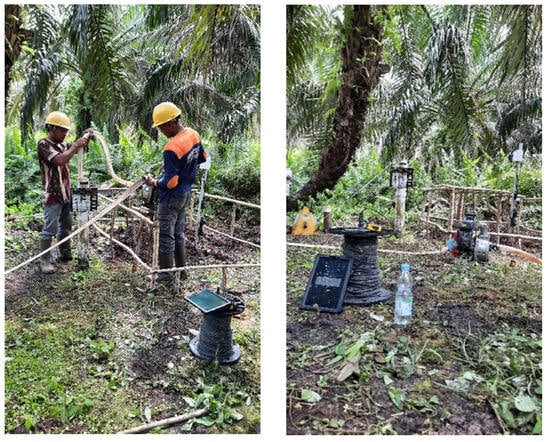
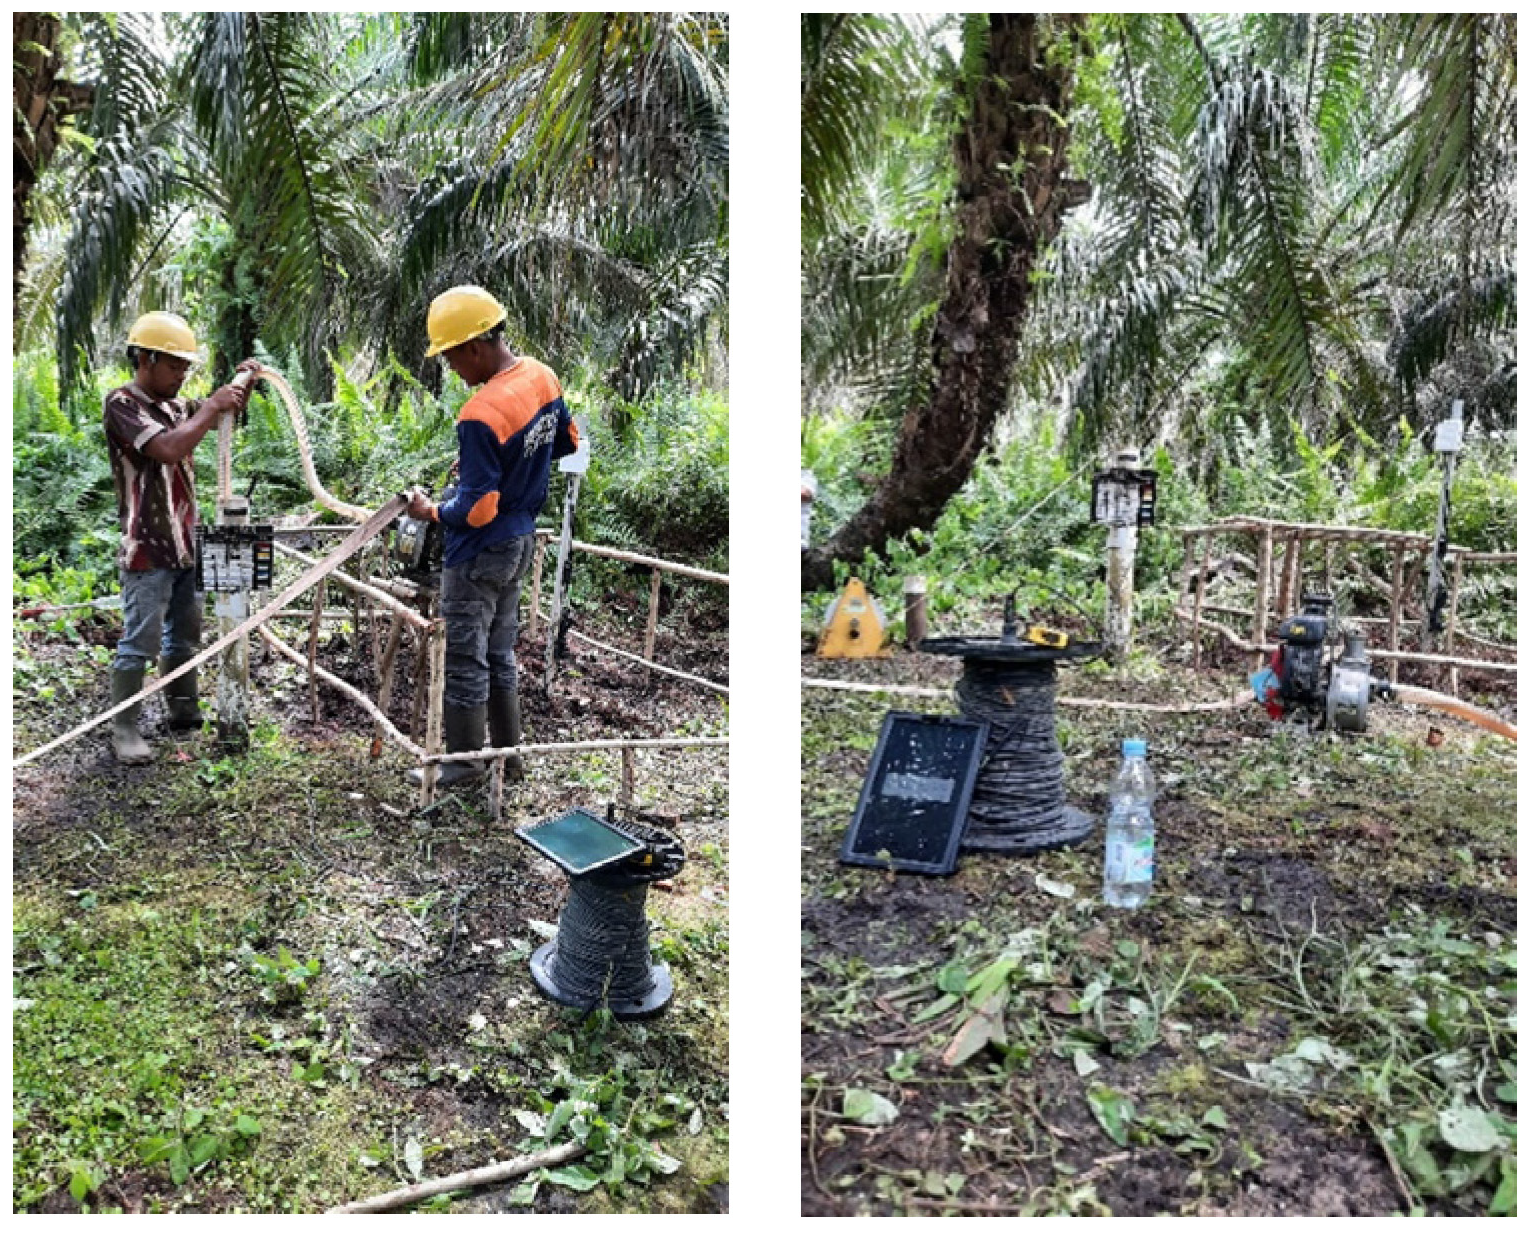
Saturated hydraulic conductivity (Ks) was quantified through a single-well recovery test performed in a 2 m deep well featuring a 3 inch PVC casing (Figure 3). Following water extraction, the water level recovery rate was monitored continuously using a pressure transducer. The hydraulic conductivity, Ks, was estimated with a simplified Darcy-based radial flow model, assuming a unit hydraulic gradient (i = 1). Under this assumption, the inflow rate toward the well was expressed as:
where Q is discharge rate (m3s−1), π is the pi constant, r is well radius (m), s is residual drawdown relative to the equilibrium groundwater table depth (m), and Ks is saturated hydraulic conductivity (m s−1). Based on the conservation of water volume within the well, the inflow rate Q is related to the rate of change in residual drawdown, such that ; therefore:
Integrating Equation (3) with respect to elapsed recovery time t gives the continuous decay relationship for residual drawdown:
in which st is residual drawdown at time t (m), s0 is the initial drawdown depth (m), and α is the log-linear recovery rate constant derived from the slope of versus time t (s). Equations (3) and (4) show that , therefore, the saturated hydraulic conductivity Ks can then be estimated using formula:
in which α is the empirical recovery slope coefficient (s−1) and r is the PVC casing (well) radius, i.e., r = 0.0381 m for a 3-inch PVC.
Figure 3.
Pumping well water before the recovery test (left image), as well as observing the rate of increase in water level during the recovery test using a water level logger (right image).
It should be noted that this single-well recovery test yielded a site-specific, profile-integrated horizontal hydraulic conductivity (Ks) across the active 0–2.0 m hemic to sapric root zone. It provided an operational transmissivity parameter for block-scale lateral seepage modeling at this site. Localized variations in soil micro-topography, macropores, and vertical humification gradients were addressed through sensitivity analysis.
2.4. Subsurface Flow
Subsurface flow from the peatland toward drainage canals was estimated by applying Darcy’s law [26]. For this modeling, the 30 ha experimental block (300 m × 1000 m) was conceptualized as two equal 15 ha contributing zones with an assumed representative flow-path length of 150 m from the block centroid to each adjacent canal. The subsurface flow rate (Q) was estimated as:
where Q is the subsurface flow rate (m3d−1), Ks is the saturated hydraulic conductivity of the peat (md−1), A is the cross-sectional area perpendicular to the direction of subsurface flow (m2), and i is the hydraulic gradient (dimensionless). The hydraulic gradient was calculated from the difference between the groundwater elevation in the peatland and the water level elevation in the adjacent drainage canal:
where GWL is the groundwater level elevation in the peatland (m asl), CWL is the canal water level elevation (m asl), and L is the horizontal flow path from the groundwater observation point to the drainage canal. In this study, L was set to 150 m, corresponding to half of the block width. The cross-sectional area of subsurface flow was calculated as:
where Lb is the length of the block parallel to the drainage canal (1000 m), and b(t) is the effective saturated thickness of the peat contributing to lateral flow (m), calculated as b(t) = Zpeat − dgw(t) where Zpeat is the total permeable peat depth (3.0 m) measured above the underlying mineral substrate, and dgw(t) is the instantaneous groundwater table depth below the ground surface (m). Accordingly, the temporal variation in subsurface flow was expressed as:
Temporal variations in subsurface flow (Q) were modeled based on observed fluctuations in GWL and CWL. Assuming constant hydraulic conductivity and fixed block geometry, temporal changes in Q are primarily controlled by variations in the effective saturated thickness and the hydraulic gradient. The hydraulic gradient between the peatland and drainage canal was characterized by the head difference between the GWL measured at the centroid and the CWL recorded at a hydraulically aligned location.
To link observed phreatic table drawdown to profile water storage depletion, volumetric changes (ΔS, mm day−1) within the unconfined peat aquifer were parameterized using specific yield (Sy):
where Sy is the drainable porosity (Sy ≈ 0.20 for hemic to sapric peat horizons), ΔGWL is the phreatic table decline rate (mm day−1). Volumetric subsurface discharge (Q, m3 day−1) was normalized over the 30 ha experimental block area (Ablock = 300,000 m2) as:
Both actual evapotranspiration (ET) and subsurface discharge (q) are evaluated as normalized volumetric water fluxes (mm day−1), therefore, the relative contribution of lateral subsurface flow to total profile water export (ΔS) was calculated as q/(ET + q).
2.5. Hydraulic Estimation of the Subsurface Flow Barrier
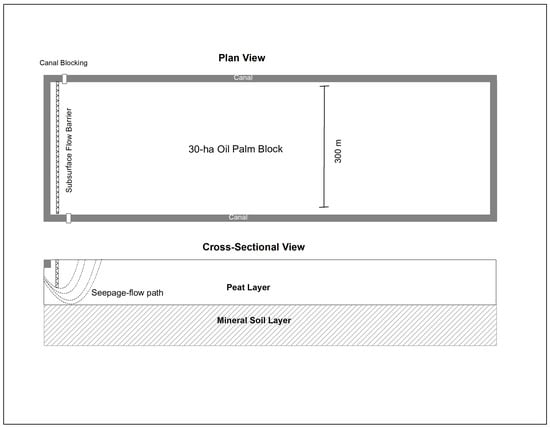
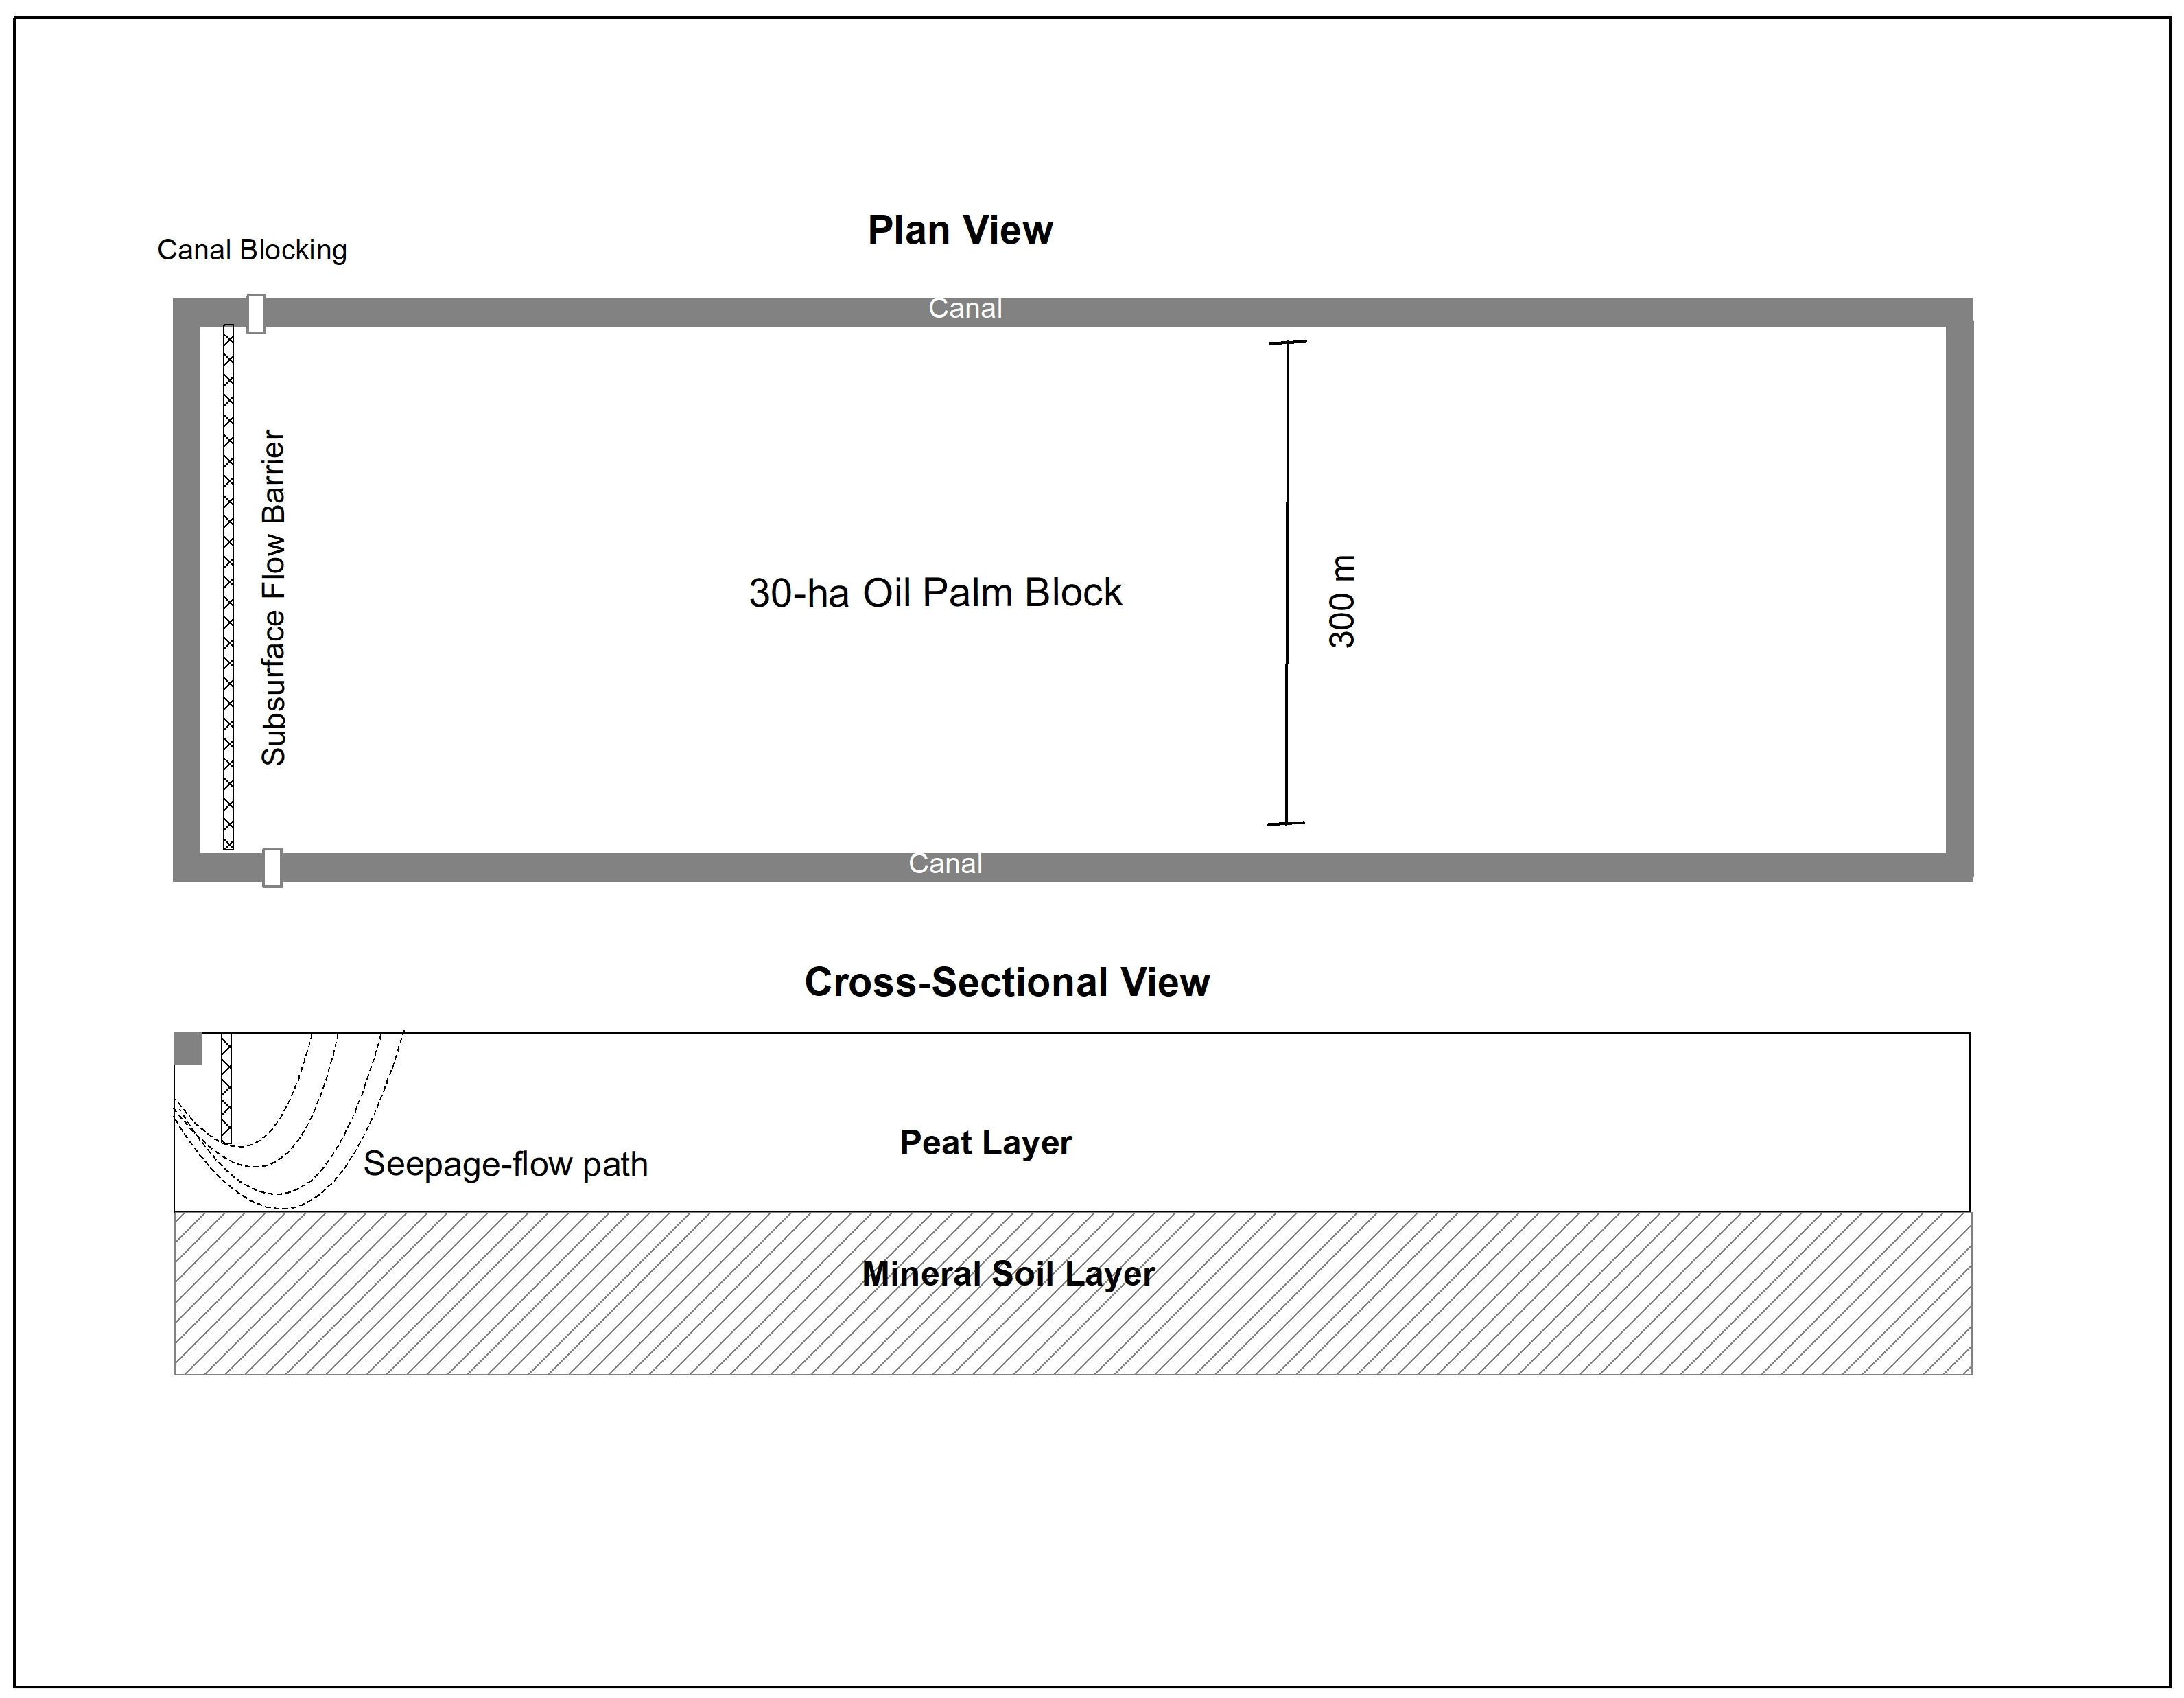
Lateral water loss through peatland drainage infrastructure represents a primary driver of hydrological degradation and subsidence within agricultural landscapes. To mitigate these losses, a subsurface flow barrier is proposed across the downstream boundary of oil palm drainage blocks to restrict lateral seepage through the peat matrix (Figure 4). The barrier comprises either compacted clay or an impermeable geomembrane embedded at a prescribed depth within the soil profile. By obstructing direct lateral pathways, this intervention forces groundwater to traverse an elongated curvilinear flow path, thereby reducing the effective hydraulic gradient and diminishing total seepage discharge.
Figure 4.
Conceptual configuration of the subsurface flow barrier and elliptical seepage flow path in the 30 ha oil palm block.
To evaluate subsurface flow attenuation around the cut-off barrier, the system was conceptualized as a two-dimensional domain perpendicular to the drainage canals under quasi-steady state potential flow conditions. The domain is bounded by four distinct hydrogeological boundary conditions:
- Upstream boundary: Constant head anchored at the block centroid piezometer (GWL, evaluated across L = 150 m).
- Downstream boundary: Fixed canal stage (CWL) establishing a driving hydraulic head difference across the barrier (ΔH = GWL − CWL, nominal ΔH = 0.30 m).
- Lower boundary: Impermeable mineral subsoil interface located at total profile depth PT = 3.0 m (zero-flux bottom boundary, ∂H/∂z = 0).
- Barrier boundary: Thin vertical impermeable wall embedded from the ground surface (z = 0) to depth Pa.
Flow through the remaining permeable peat matrix (PT − Pa) was modeled assuming isotropic horizontal-vertical hydraulic conductivity (Kh = Kv = Ks) within discrete sub-layers, with potential flow lines expanding around the barrier tip following confocal semi-elliptical trajectories.
The hydrological impact of the barrier was quantified through a conceptualized flow-path model that accounts for the geometric constraints imposed by the impermeable layer. Following installation, the subsurface seepage trajectory within the remaining permeable peat horizon was modeled as a semi-elliptical flow path to approximate the actual curvilinear geometry without requiring complex analytical solutions. The length of this extended pathway was estimated using the Ramanujan approximation for the circumference of an ellipse [27]. This calculated flow-path length was subsequently integrated into Darcy’s law to evaluate the modified hydraulic gradient and determine the resulting theoretical reduction in subsurface discharge rates. For a full ellipse with semi-major axis (a) and semi-minor axis (b), the Ramanujan first approximation is expressed as [27,28]:
Because the physical seepage trajectory around the cut-off barrier corresponds to a semi-elliptical arc, the active flow-path length Li for stream tube i was then defined as:
To integrate flow across the profile, the remaining permeable peat layer (PT − Pa) was discretized into N = 10 sub-layers of equal thickness Δz = (PT − Pa)/10. For each sub-layer i, the semi-minor axis was set to the vertical depth from the water table to the layer midpoint (bi = Pa + (i − 0.5)Δz), and the semi-major axis is set to ai = bi under isotropic horizontal flow expansion.
Applying Darcy’s law to each sub-layer i, the unit-width seepage discharge (qi, m3h−1m−1) was computed as [26]:
where PT is the peat depth (m), Pa is the depth of the subsurface barrier (m), qi is the seepage discharge per unit width for the i-th flow segment (m3 h−1 m−1), Ks is the conductivity hydraulic (m s−1), and H is the hydraulic head difference between the upstream and downstream sides of the subsurface barrier (m). The total lateral seepage discharge per unit width (Q, m3h−1m−1) across the permeable peat profile was obtained by summing all discrete flow segments:
2.6. Uncertainty and Error Propagation Analysis
To quantify parameter uncertainty and evaluate error propagation across hydrometric measurements and model outputs, standard quadrature error propagation (root-sum-of-squares rule) and Monte Carlo sampling (N = 10,000 iterations) were applied. Standard errors (σ) for measured parameters—including saturated hydraulic conductivity (Ks), water table elevation (GWL), canal head (CWL), and saturated profile thickness (b(t))—were propagated through Darcy’s Law as:
For the analytical subsurface barrier model, parameter sensitivity and uncertainty were evaluated by sampling peat depth (PT = 3.0 ± 0.3 m), hydraulic head difference (ΔH = 0.30 ± 0.08 m), and conductivity (Ks = 4. 125 × 10−5 ± 0.38 × 10⁻⁵ m s−1) across 10,000 random realizations to derive 95% confidence intervals for theoretical seepage reductions.
Peat profile geometry and baseline horizons (PT = 3.0 ± 0.3 m) were established directly through physical peat soundings, soil coring, and continuous piezometric logging rather than geophysical inversion techniques (such as electrical resistivity tomography). Standard measurement variances (, , and transducer head fluctuations σΔH = ±0.04 m) reflect direct physical sampling noise and were propagated through the analytical equations to evaluate output confidence bounds.
3. Results and Discussion
3.1. Rainfall and Potential Evapotranspiration Dynamic
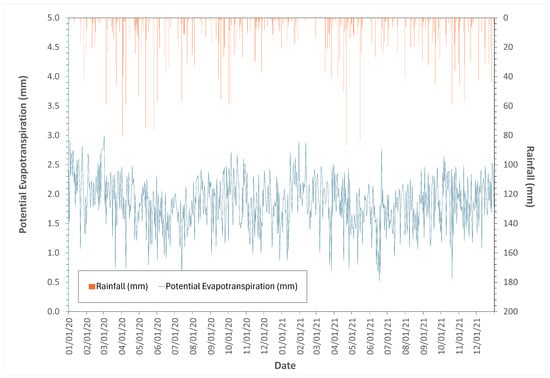
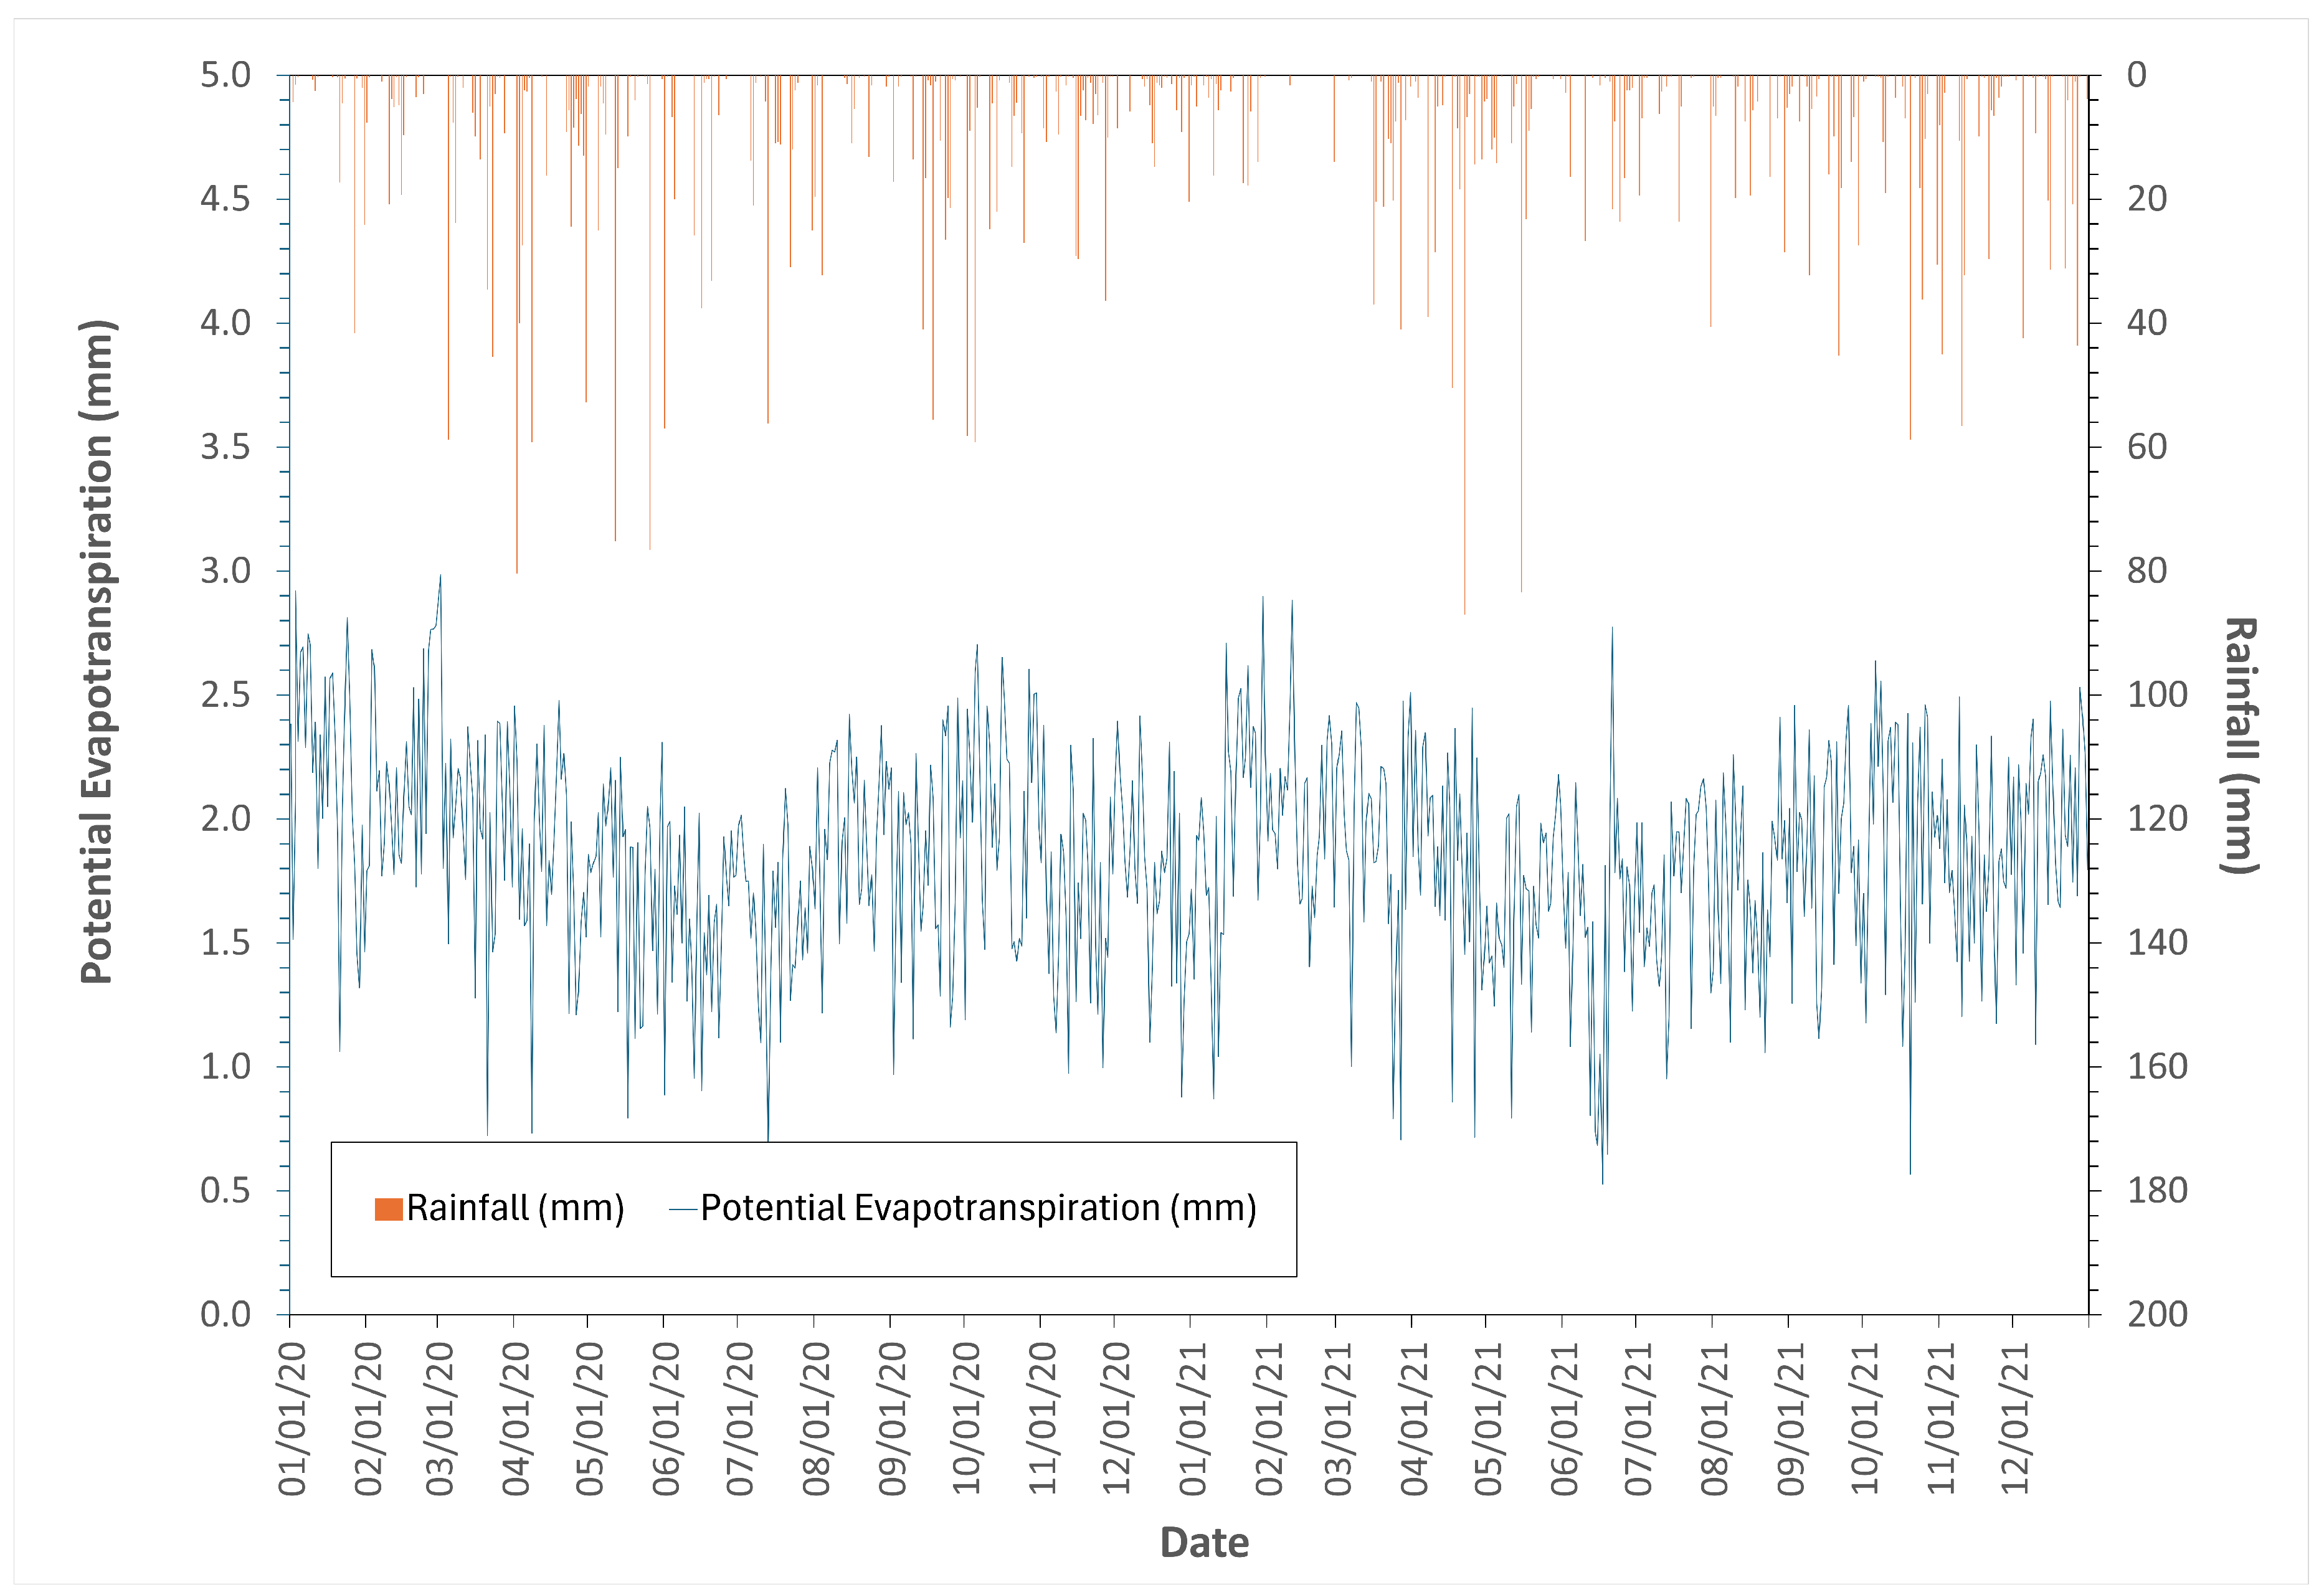
Hourly climatic data processed via the Penman method reveal significant intra-daily variability in potential evapotranspiration (PET) rates, driven by local atmospheric conditions (Figure 5). At the daily scale, evaporative demand exhibits pronounced fluctuations, typically ranging between 1.5 and 2.5 mm day−1 with occasional peaks approaching 3.0 mm day−1. Concurrently, precipitation patterns are highly intermittent, characterized by frequent dry spells punctuated by sporadic high-intensity rainfall events that deliver limited sustained water input to the peatland system. These dynamics create multiple periods where PET exceeds local rainfall inputs, resulting in short-term water input deficits for the ecosystem [29].
Figure 5.
Temporal dynamics of daily potential evapotranspiration (PET) and rainfall during 2020–2021.
Despite these daily imbalances, cumulative annual rainfall substantially exceeds potential evaporative demand across both study years. In 2020, annual PET reached 685.1 mm year−1 against a much larger rainfall input of 2215.8 mm year−1 (PET-to-rainfall ratio ~30.9%), while in 2021, annual PET was 672.1 mm year−1 with rainfall totaling 1948.4 mm year−1 (PET-to-rainfall ratio ~34.5%). These figures confirm a robust annual hydroclimatic water surplus, indicating that the temporal distribution of rainfall and the occurrence of prolonged dry periods remain critical factors governing peatland drying conditions despite the overall abundance of atmospheric water availability [30].
The hydrological significance of these drivers lies primarily in the temporal imbalance between consistent atmospheric evaporative demand and erratic rainfall inputs. During limited-rainfall periods, persistent PET reduces soil–vegetation water storage when supply is insufficient, leading to near-surface peat moisture depletion and contributing to groundwater-level decline [31]. This process is particularly pronounced in drained or hydrologically modified peatlands, where drainage infrastructure enhances water losses during rainfall-free periods [32].
3.2. Groundwater and Canal Water Level Dynamic
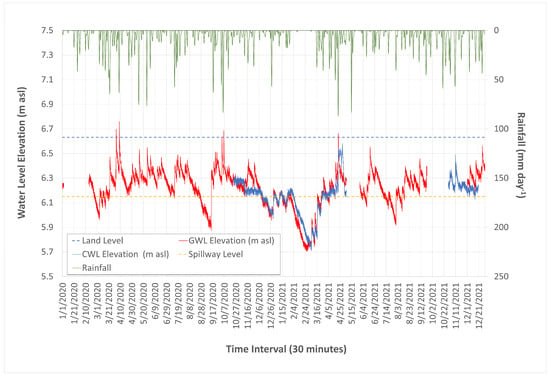
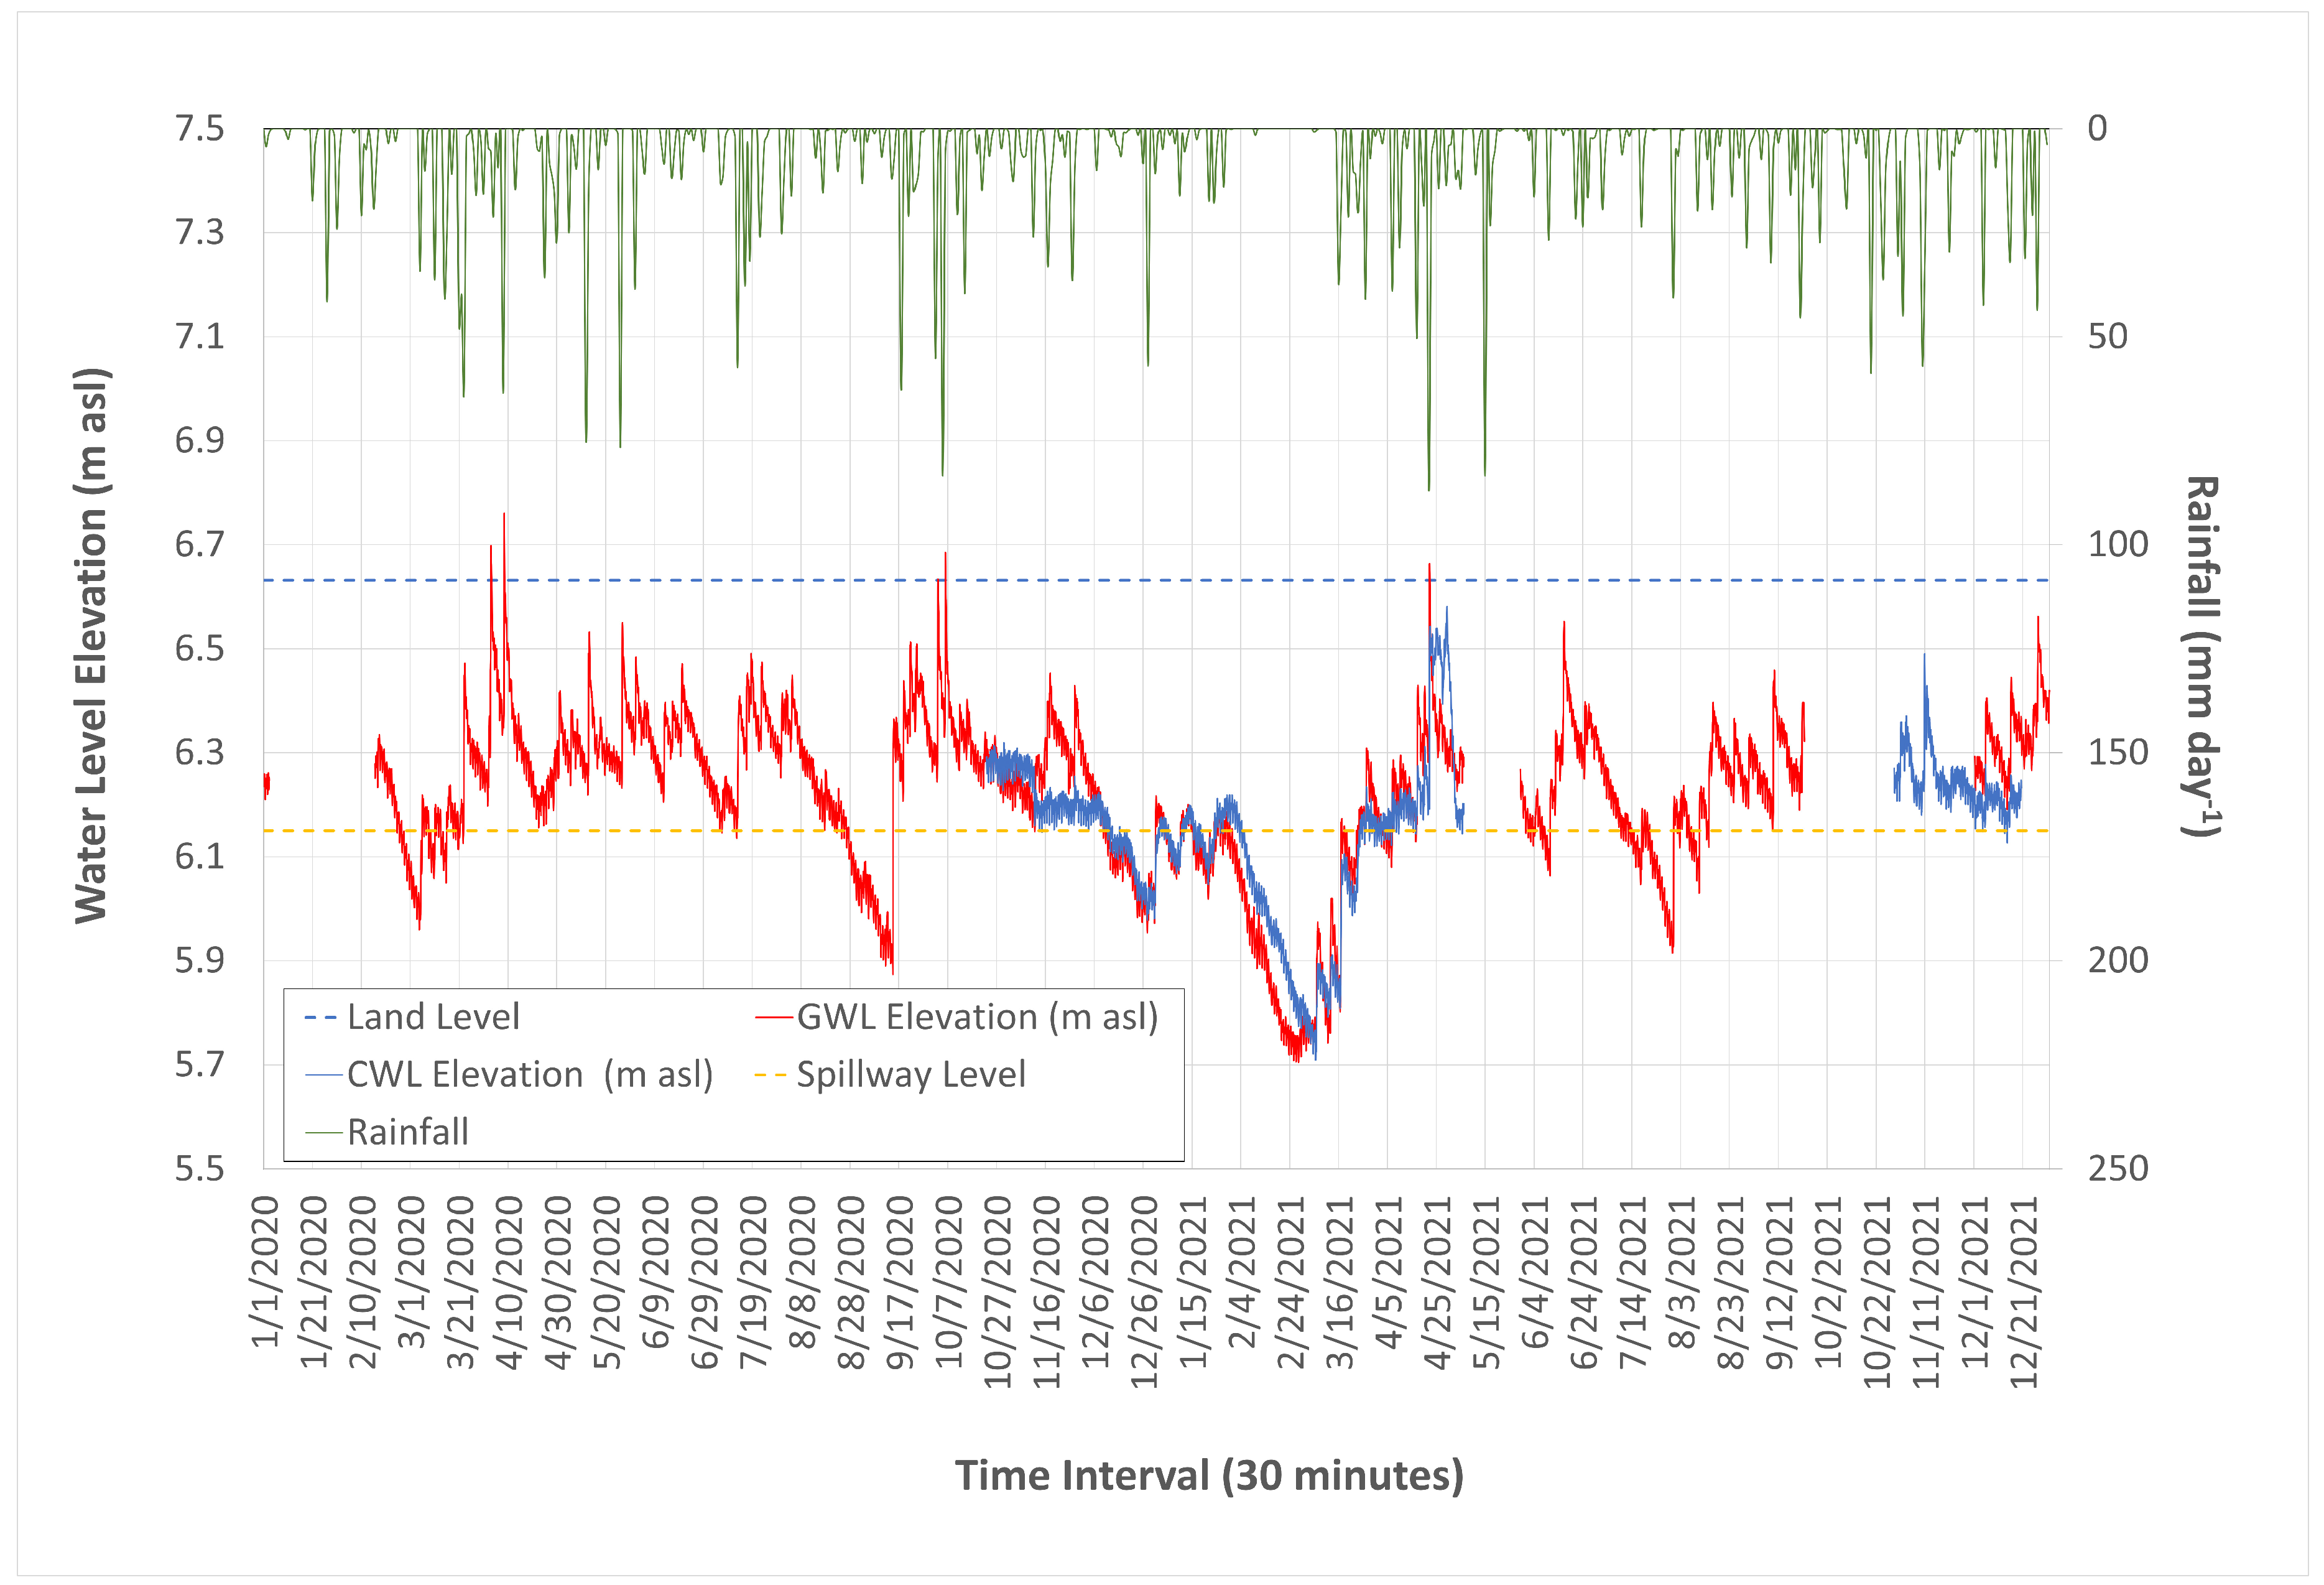
Groundwater level elevation (GWL) within the study site exhibited significant temporal variability, fluctuating between a maximum elevation of 6.76 m asl on 27 February 2021, and a minimum of 5.70 m asl on 25 February 2021 (Figure 6). The mean GWL elevation averaged 6.22 m asl corresponds to an average depth of 41.23 cm relative to the 6.63 m asl ground surface. Recorded depths ranged from a maximum of 92.70 cm to a minimum of −12.80 cm, indicating instances where water levels exceeded the peat surface. These fluctuations, with GWL falling below 40 cm from the surface in 55.76% of recorded instances, suggest a high susceptibility to water table recession.
Figure 6.
Ground water level (GWL) and canal water level (CWL) dynamics in the study location during monitoring period.
Canal water levels (CWL) displayed a distinct range of movement, reaching a maximum elevation of 6.581 m asl on 29 March 2021, and a minimum of 5.709 m asl on 6 March 2021. The mean CWL elevation was 6.154 m asl, resulting in an average depth of 47.80 cm relative to the ground surface. Extreme depth values varied from 5.10 cm to 92.30 cm throughout the observation period. This wide range of CWL movement reflects the high degree of hydrological instability present within the drainage network.
The observed water level fluctuations align with hydrological patterns reported in other Indonesian peatland ecosystems. In the Mawas peat dome of Central Kalimantan, GWL levels averaged less than 50 cm below the surface and were modulated by climatic events and accelerated by drainage infrastructure existence [33]. Similar monitoring in Ogan Komering Ilir, South Sumatra, demonstrated that severe dry-season conditions associated with positive Indian Ocean Dipole (IOD+) events led to extended groundwater table drawdowns below the critical 40 cm regulatory threshold, which correlated with increased peat fire hotspots [34]. These regional dynamics highlight the compounded vulnerability of drained peatlands when anthropogenic drainage infrastructure interacts with climate-driven precipitation deficits.
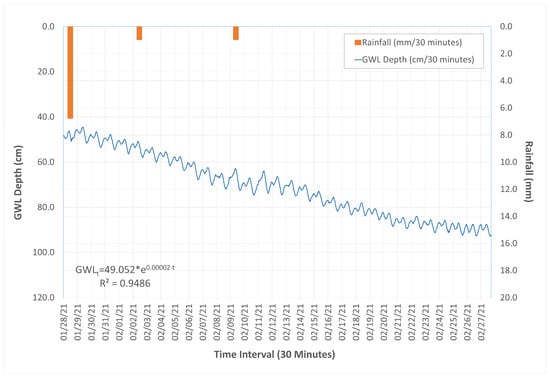
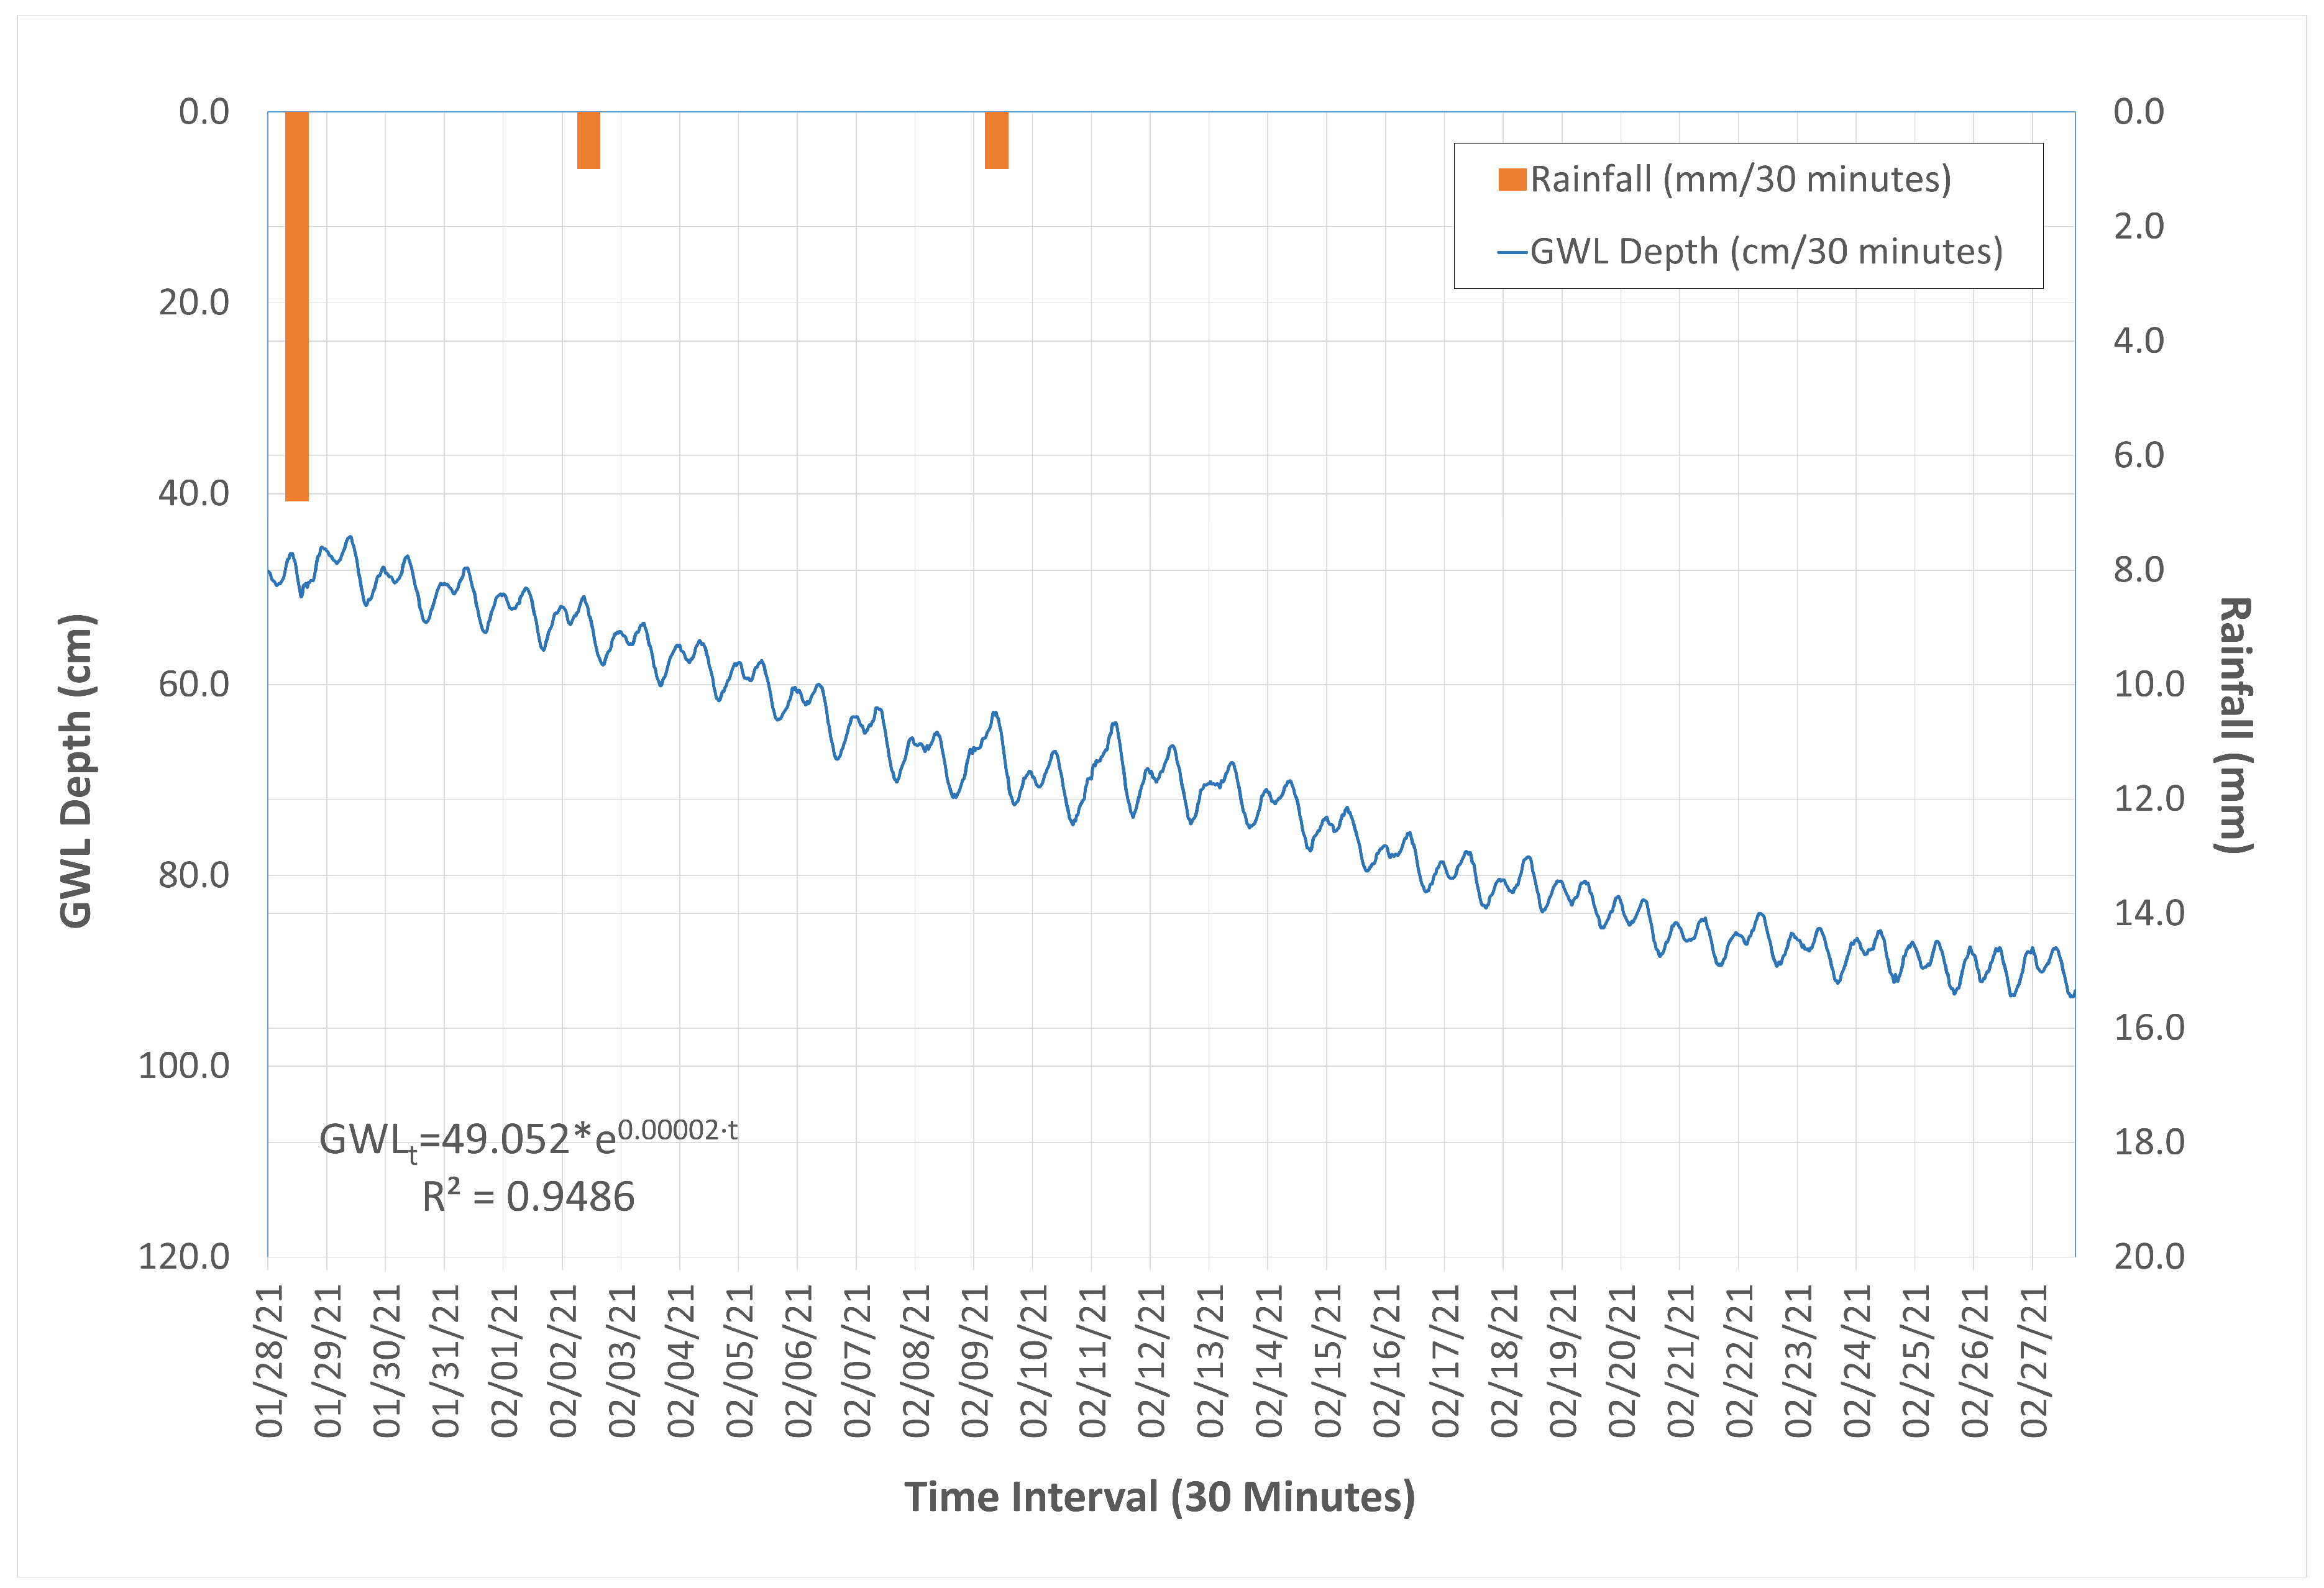
Subsurface water loss via internal drainage represents a primary driver of peatland desiccation, as evidenced by high recession rates during dry periods. Following a 40 mm/day rainfall event and a subsequent 29-day dry period, the GWL decline rate reached 16.4 mm/day (Figure 7). This rate exceeds the typical Indonesian daily evapotranspiration rate of 3–6 mm/day by approximately three to five times. Such rapid depletion suggests that canal blocking alone may be insufficient to maintain required GWL depths in cultivated landscapes, necessitating the development of alternative technologies to mitigate subsurface flow [35].
Figure 7.
Ground water table depth recession curve over the 29 days of single consecutive dry day period (28 January–27 February 2021). Inset equation shows the fitted exponential recession model, where GWL(t) is water table depth below surface (cm) and t is elapsed time in minutes (t in min, corresponding to k = 0.0288 day−1). Daily recession rates (mm day−1) were calculated via derivative evaluation .
3.3. Estimated Hydraulic Conductivity
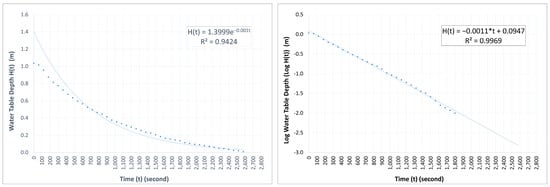
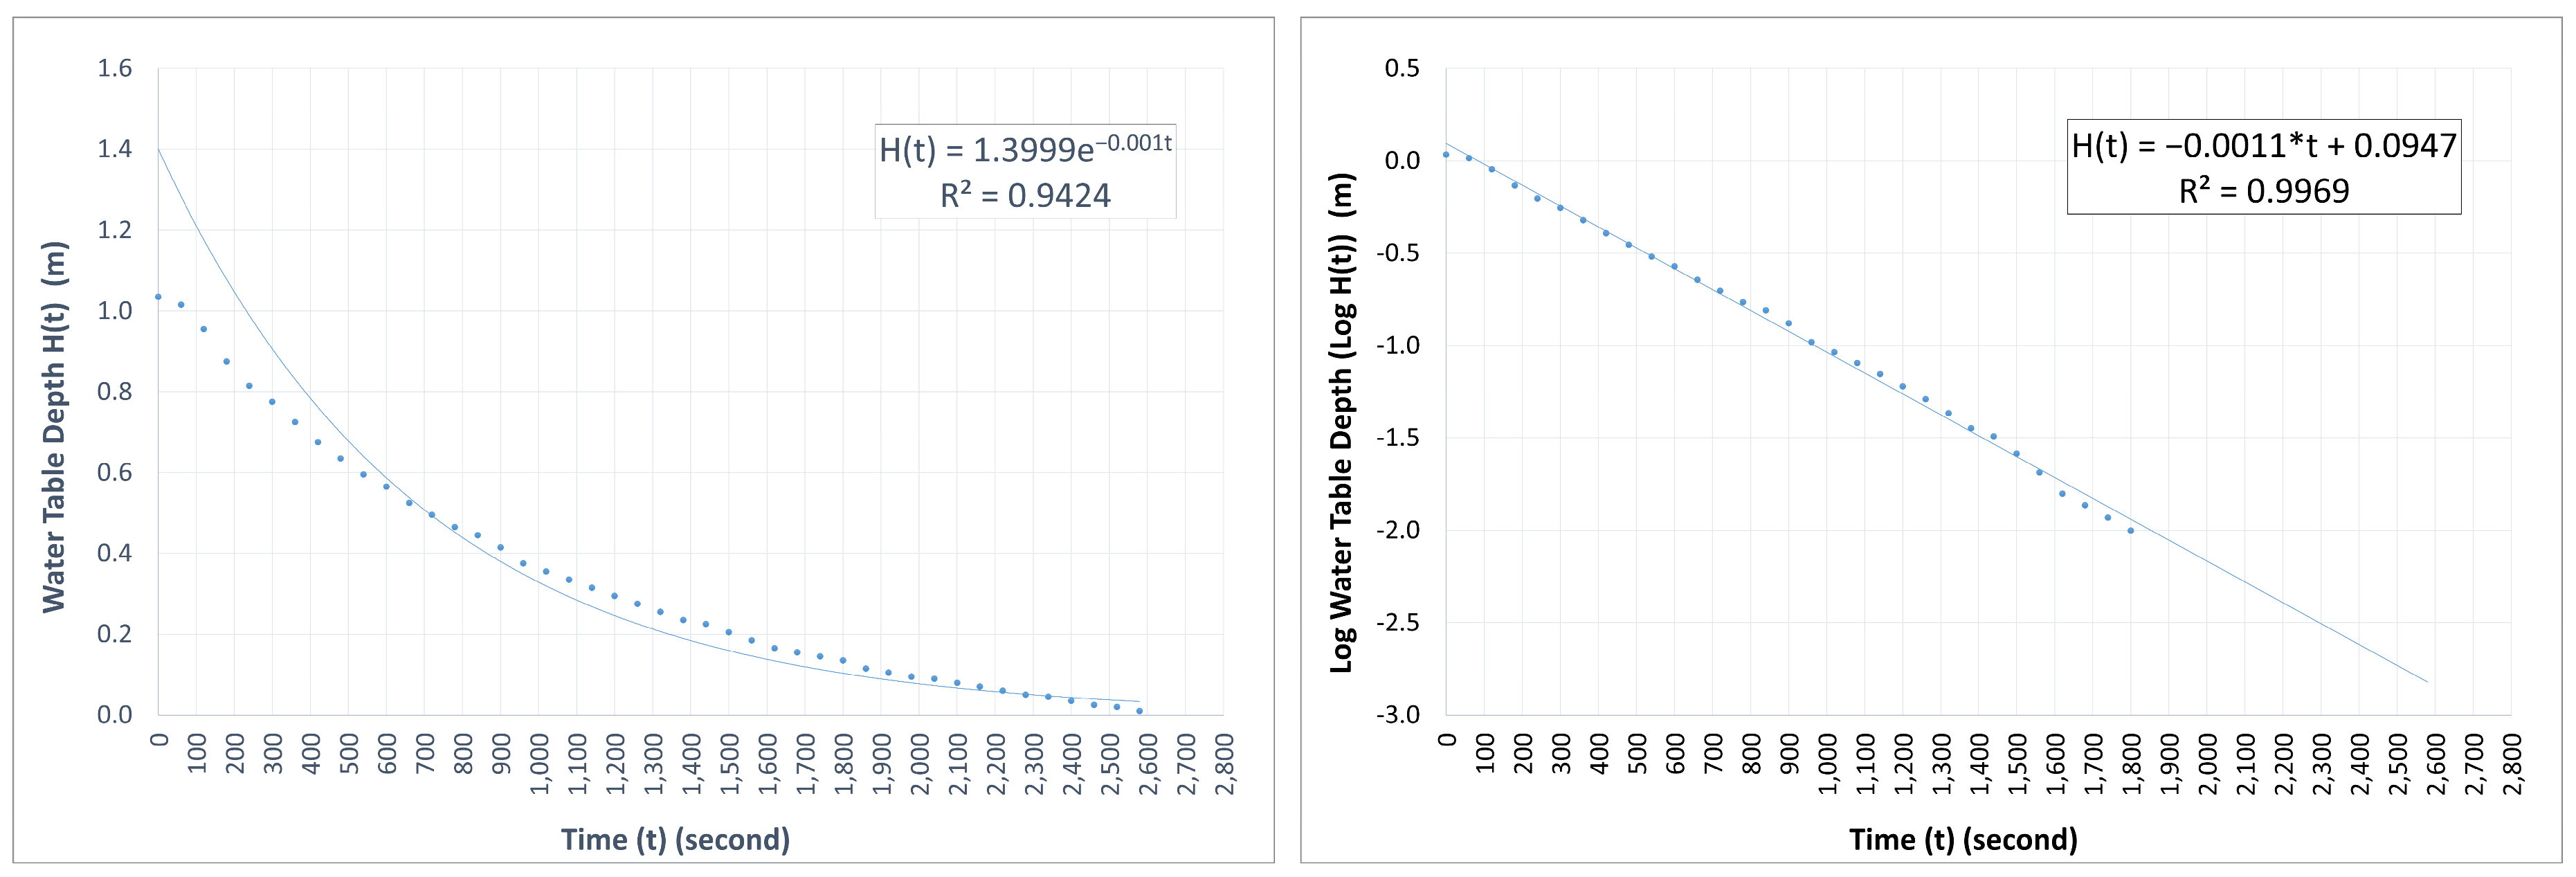
Saturated hydraulic conductivity (Ks) was quantified through a semi-logarithmic analysis of the GWL recovery rate following pumping tests (Figure 8). The recovery phase exhibited a linear relationship between the log of the water table depth and time (logH(t) = −0.0011t + 0.0947, R2 = 0.99), providing a recovery slope parameter α = −0.0011 s−1. This high coefficient of determination validates the use of the semi-logarithmic model for characterizing recovery dynamics in these organic soils. Substituting the discovered α value and the 3-inch PVC casing radius (r = 0.0381 m) into the Equation (5) yielded a saturated hydraulic conductivity (Ks) value of 4.125 × 10⁻⁵ m·s−1. The derived Ks value represents the effective horizontal transmissivity integrated across the upper 0–2.0 m active horizon of the 30 ha experimental block, and is consistent with established hydraulic conductivity ranges reported for tropical peatland ecosystems [36,37,38,39]. Moreover, this Ks value reflects specific local matrix conditions rather than a uniform regional constant. Spatial heterogeneity and vertical conductivity attenuation with depth are subsequently evaluated in the parameter sensitivity analysis.
Figure 8.
Single-well pumping recovery test analysis. (Left) Direct non-linear exponential decay fit of residual head H(t) = 1.3999 ⋅ e−0.0011⋅t (R2 = 0.9424), where t is elapsed time in seconds. (Right) Linearized log-transformed regression ln(H(t)) = −0.0011 ⋅ t + 0.0947) (R2 = 0.9969), validating saturated hydraulic conductivity Ks = 4.125 × 10⁻⁵ m s−1.
3.4. Modeled Subsurface Flow
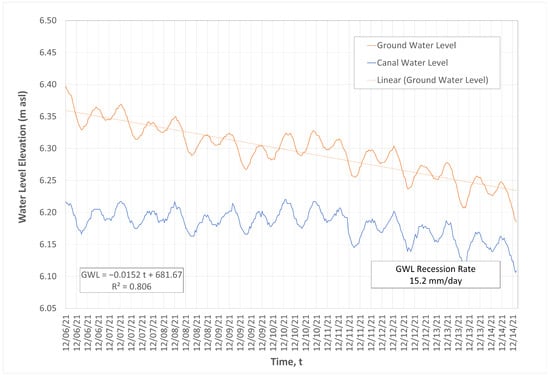
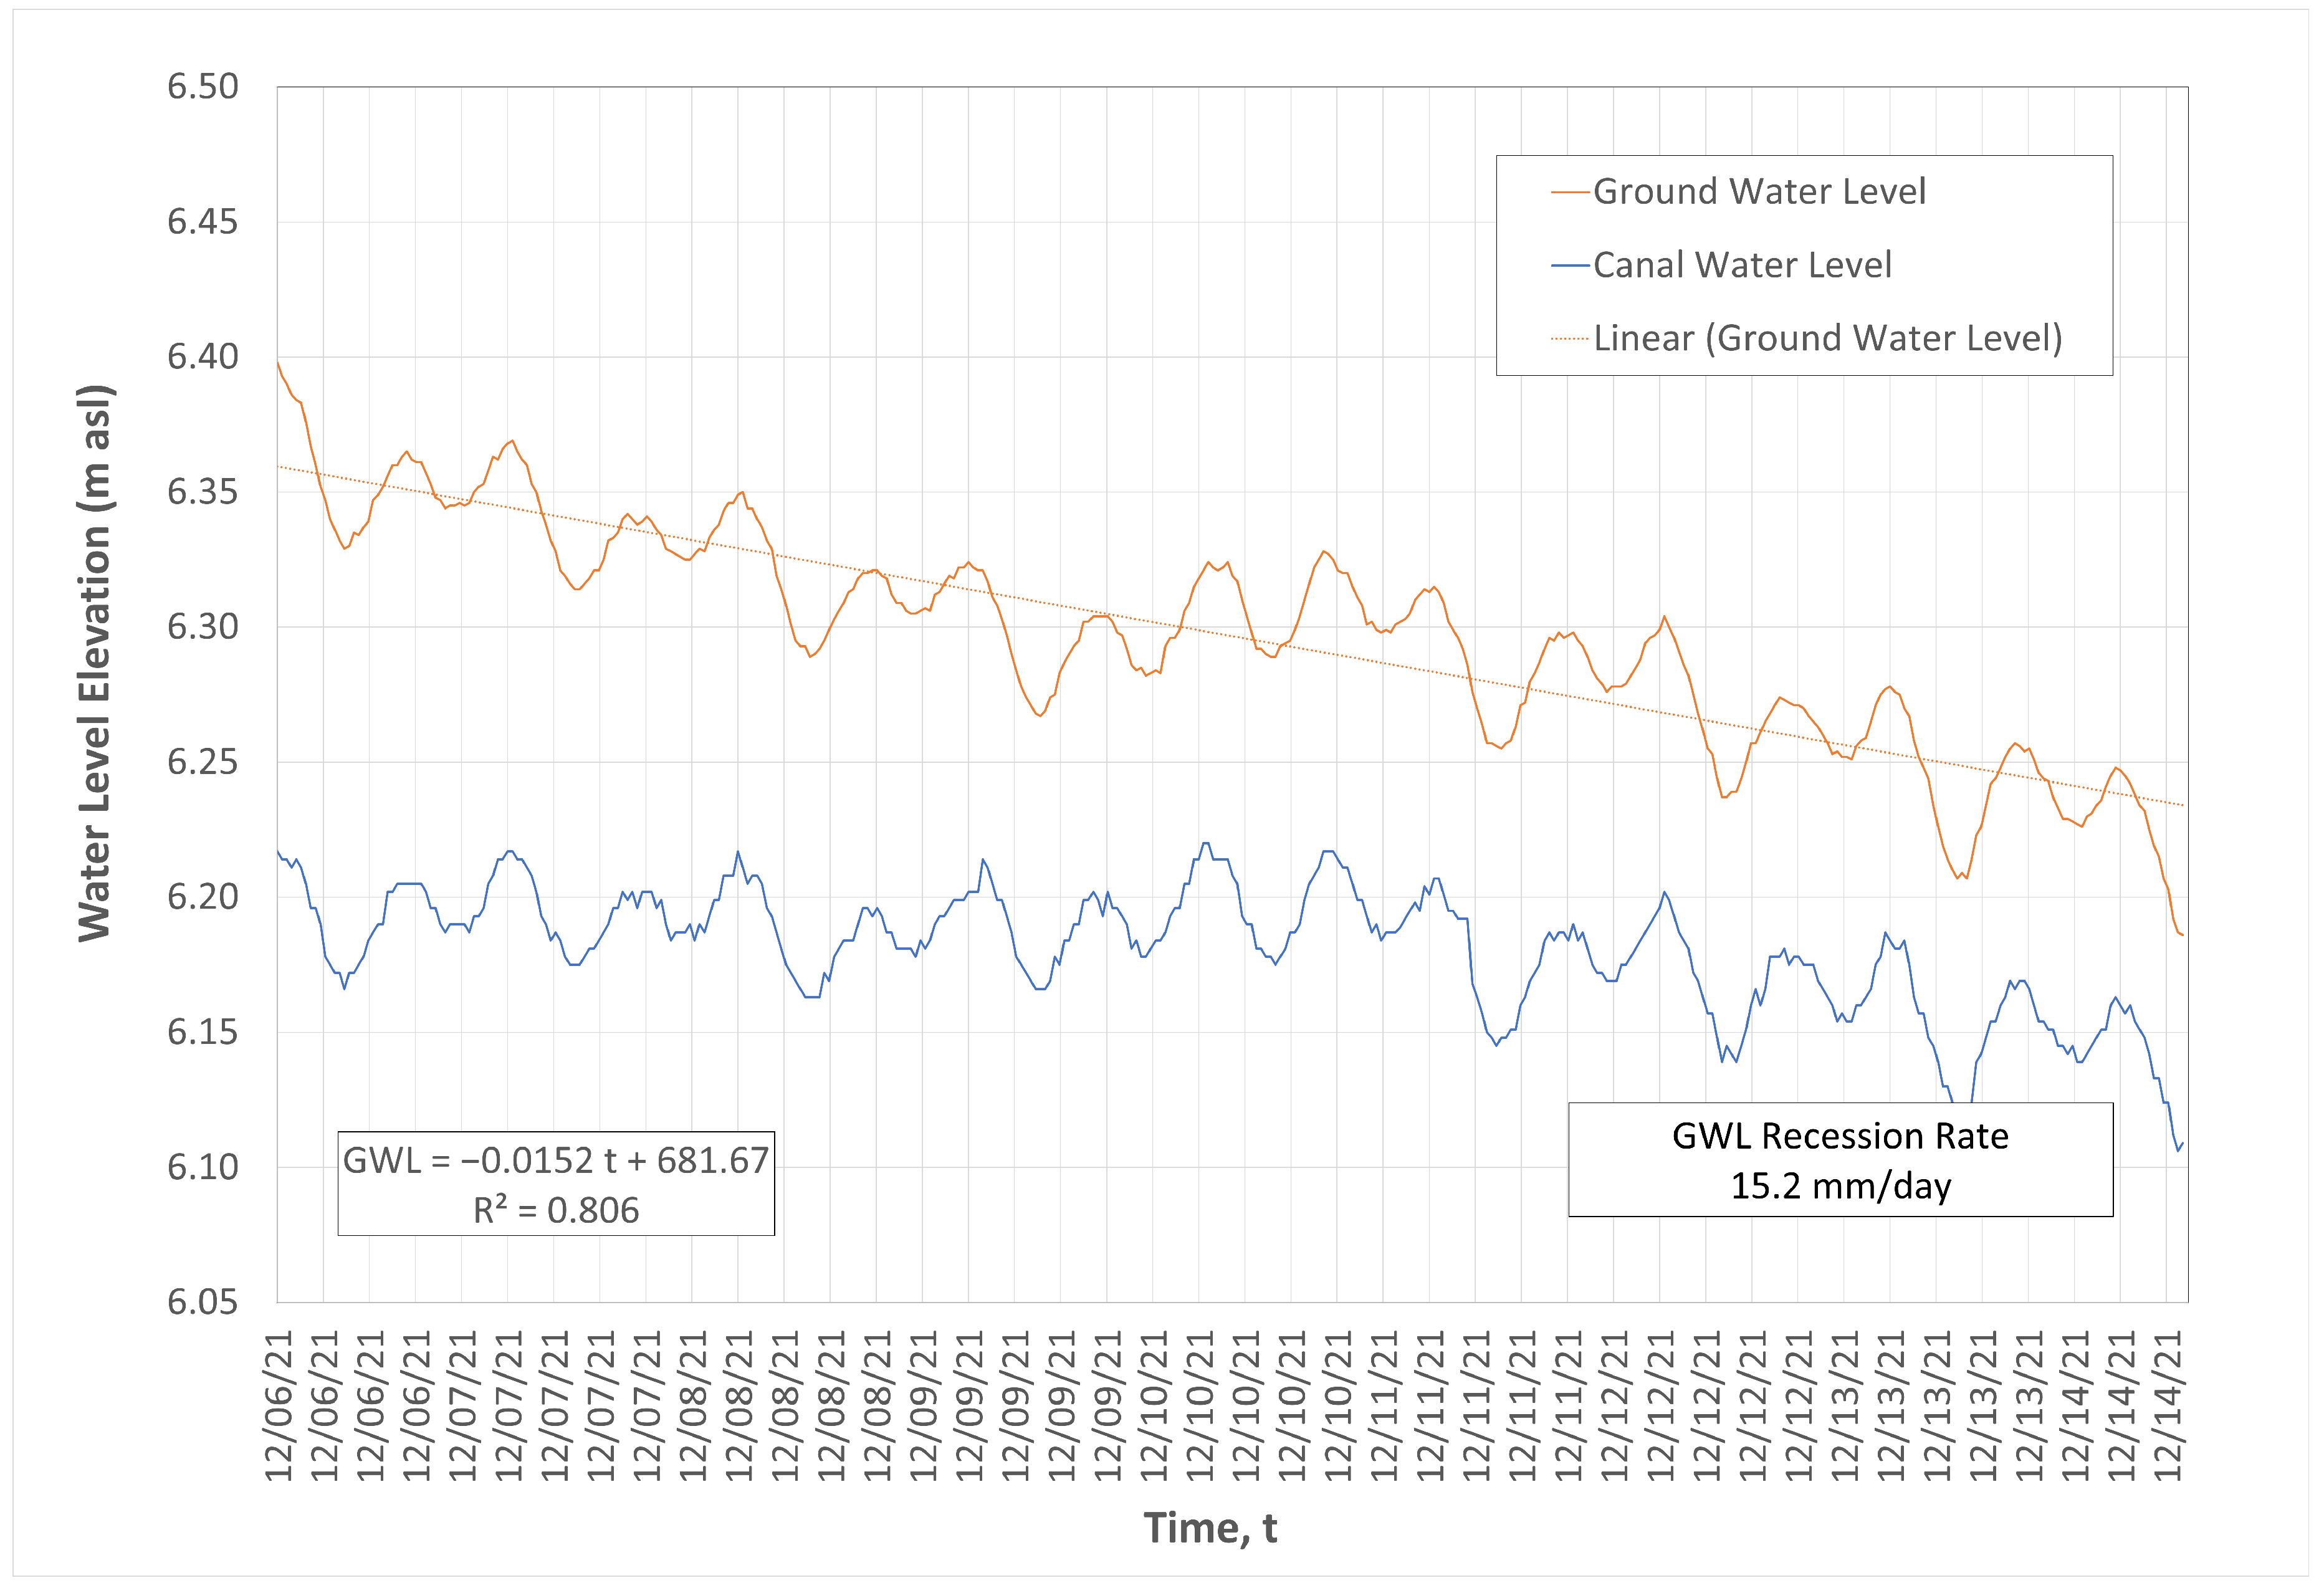
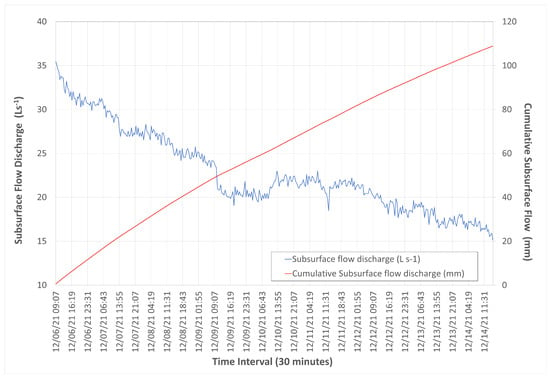
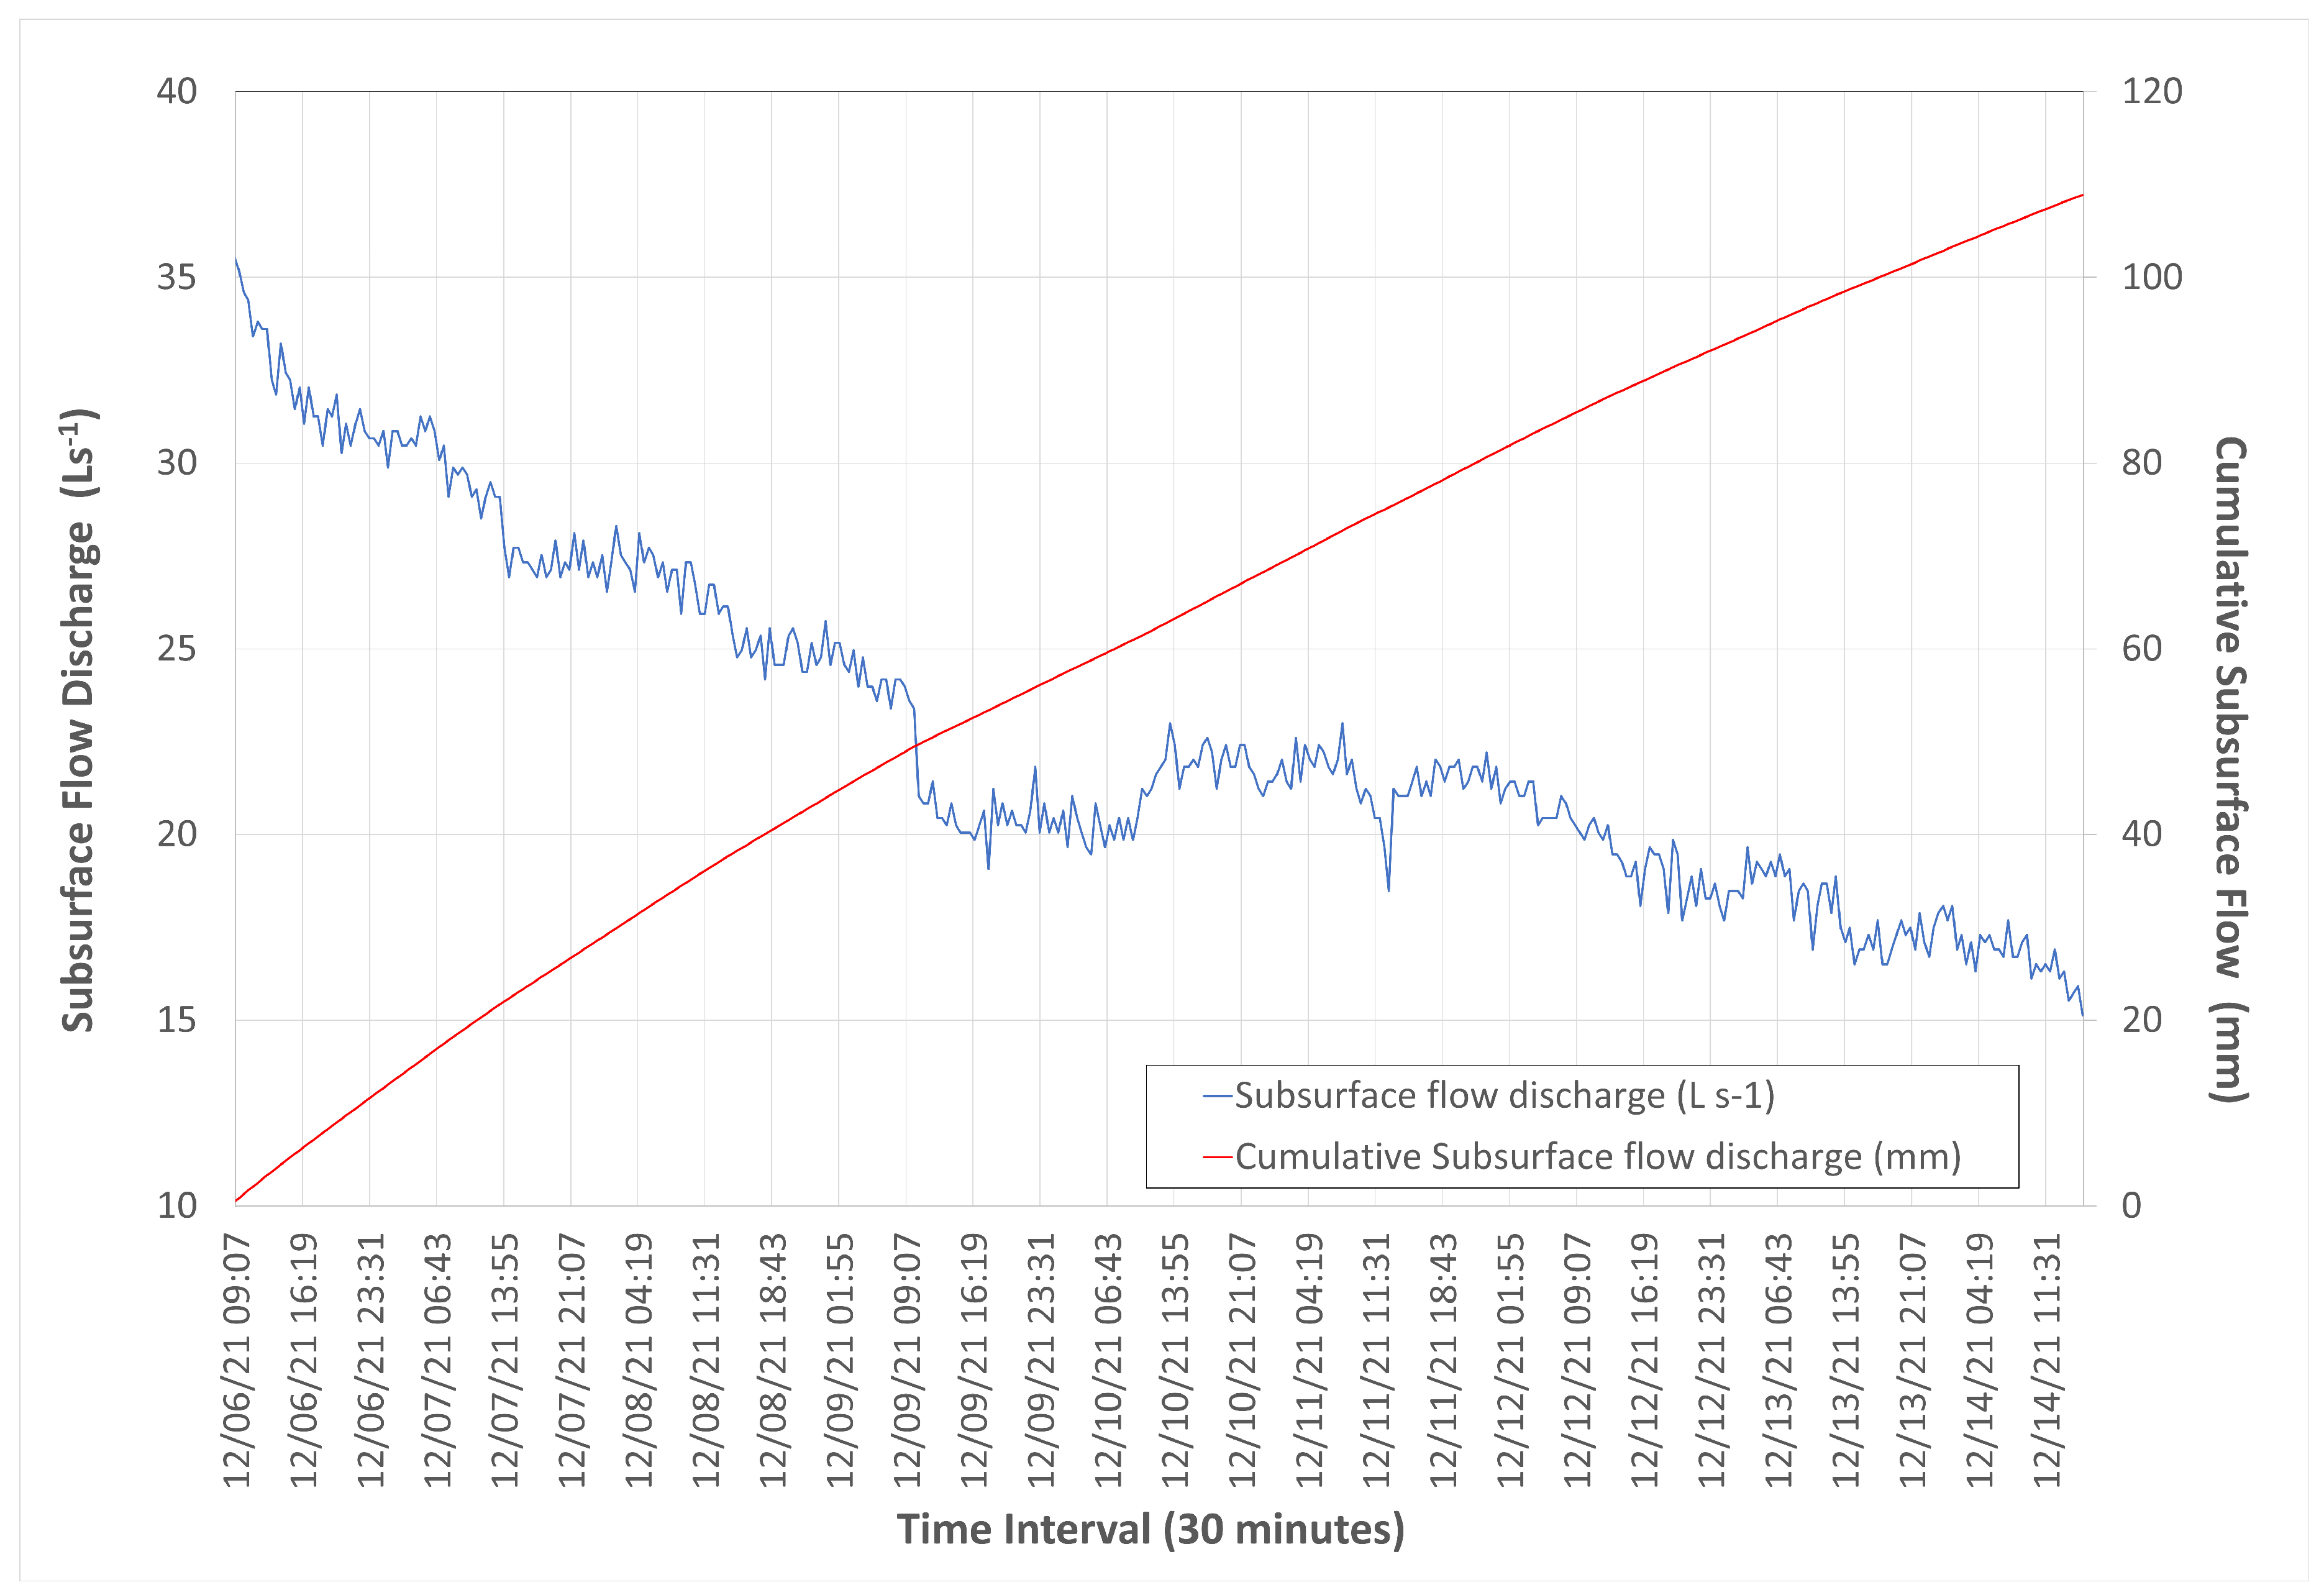
The subsurface discharge was estimated using GWL observations over the period of 6–14 December 2021. This 8.27-day period was selected for detailed water-balance and subsurface discharge modeling because it represented an intensive evaluation window immediately following a major profile-recharge event (42.4 mm on 5 December 2021). This event established a well-defined initial phreatic elevation near the surface (dgw = −24.1 cm), eliminating confounding surface runoff or intermittent rainfall infiltration during the subsequent drawdown phase. Continuous 30 min transducer records at both the centroid piezometer and canal gauge tracked a total phreatic drawdown of 125.7 mm over 8.27 days, yielding a mean groundwater recession rate of 15.2 mm day−1. Figure 9 presents the temporal dynamics of GWL and CWL during the episode. Furthermore, the subsurface discharge rates and their corresponding accumulated volumes is illustrated in Figure 10.
Figure 9.
Measured groundwater level (GWL) and canal water level (CWL) elevation over the period of 6–14 December 2021.
Figure 10.
Peatland subsurface flow dynamics calculated based on the measured groundwater level elevation over the period of 6–14 December 2021.
Subsurface discharge acts as the primary driver of water loss in the studied peatland, significantly outpacing local evapotranspiration. During the monitoring episode of 6–14 December 2021 (period without rain), the GWL depth exhibited a recession rate of 15.2 mm day−1. Estimate derived from Darcy’s law indicates that subsurface discharge rates (Q) declined from 35.58 L s−1 to 15.14 L s−1 over 8.27 days. Spatially normalized over the 30 ha block footprint (Ablock = 300,000 m2), this Q values correspond to daily equivalent phreatic recession rates (q) ranging between 20.5 mm day−1 and 8.7 mm day−1 (Figure 10). This process resulted in a total accumulated water-level decline of 108.9 mm, yielding a mean normalized subsurface discharge rate of q = 13.2 mm day−1. This rate significantly exceeds the site-specific average daily evapotranspiration (ET) of 2.3 mm day−1. Combined atmospheric (ET = 2.3 mm day−1) and boundary subsurface export (q = 13.2 mm day−1) yielded a total profile water depletion rate of ΔS = 15.5 mm day−1 (126.9 mm cumulative loss over 8.27 days). Expressed as volumetric liquid water fluxes normalized over the 30 ha block (Ablock = 300,000 m2), subsurface seepage accounted for 85.2% (13.2/15.5) of total profile water export (Table 1). Parameterized with a representative peat specific yield (Sy ≈ 0.20), the field-observed phreatic drawdown of ΔGWL = 15.2 mm day−1 corresponds to an effective volumetric liquid storage depletion rate of 3.04 mm day−1 (Equation (10)), confirming that lateral subsurface seepage—rather than atmospheric demand—dominates volumetric profile water depletion.
Table 1.
Water loss components during the period of 6–14 December 2021.
To verify that the 6–14 December evaluation period reflects general site hydrology, phreatic recession rates were screened across all extended dry spells (≥7 days, total rainfall ≤1.0 mm, initial dgw ≥ −50 cm) in the 2020–2021 dataset. Across seven identified background dry-spell episodes, mean potential evapotranspiration (PET) remained tightly bounded (2.17 ± 0.22 mm day−1, range: 1.85 to 2.57 mm day−1), while daily water table drawdown averaged 18.55 ± 2.10 mm day−1 (range: 15.86 to 21.37 mm day−1). Including the 6–14 December intensive benchmark period (15.2 mm day−1), daily phreatic drawdown across all evaluated dry spells spanned 15.2 to 21.4 mm day−1. The 6–14 December episode thus represents a conservative lower bound for phreatic recession. Because daily phreatic drawdown consistently exceeds atmospheric demand by a factor of 7 to 10 across all drying cycles, lateral subsurface seepage to bounding drainage canals persistently governs groundwater recession.
The dominance of lateral subsurface flow over evapotranspiration, particularly when GWL was shallow, aligns with documented hydrological behaviors in tropical peatland ecosystems. In upper peat layers with high saturated hydraulic conductivity (Ks > 10 m/day), rapid lateral transport through artificial canals often dominates total water export, far exceeding baseline daily ET [19]. During periods of shallow water table (rainy season), subsurface seepage and runoff function as the primary export pathways, shedding water at rates several times higher than steady daily ET [40]. In canalled sites characterized by low ET/P ratios, lateral subsurface flow and artificial drainage can account for approximately 63% of total water loss [41].
3.5. Subsurface Flow Barriers Model for Peatland Seepage Reduction
Deeper subsurface flow barriers modify the hydraulic conditions governing lateral movement by progressively reducing the effective thickness of permeable peat available for flow across the profile. As barrier depth increases, water is compelled to traverse longer pathways through the remaining saturated zone, which simultaneously attenuates both the hydraulic gradient and the cross-sectional area of the active seepage region. The combined geometric restriction on flow-path length and conduction area yields a systematic decline in estimated seepage discharge as the impermeable barrier extends deeper into the peat column [42].
Using the unblocked condition as a reference, percentage reductions in lateral subsurface water losses were calculated across a range of barrier depths to quantify the depth-dependent response of seepage discharge (Table 2). A barrier at 1.0 m reduced estimated discharge by approximately 36.8% relative to the baseline, and this reduction intensified with increasing depth: 71.5% at 2.0 m and an approximate 86.4% at 2.5 m. The steepest decline occurred at a barrier depth of 2.75 m, where calculated discharge fell by approximately 93.4%, leaving only 0.25 m of permeable peat beneath the barrier to facilitate lateral flow [43].
Table 2.
Analytical model predictions of depth-dependent seepage discharge and theoretical percentage reductions under different subsurface barrier depths (Pa).
A barrier depth of approximately 2.50 m emerges as the practical design criterion for achieving an 86% reduction in lateral seepage discharge relative to unblocked conditions under the specified hydraulic regime (Table 3) [43,44]. This recommended depth corresponds to roughly 90% of total 3.00 m peat thickness, leaving a 0.50 m thick permeable zone beneath the barrier that continues to permit residual lateral flow. The hydraulic head difference remains the primary driving force for subsurface seepage; even at a modest head difference of 0.5 m, the high intrinsic hydraulic conductivity of the peat sustains significant lateral water movement toward downstream canals. Subsurface barriers therefore function as an additional hydraulic-control mechanism by simultaneously restricting the available seepage cross-section and increasing effective flow-path length through geometric elongation.
Table 3.
Modeled design depths (Pa) required to achieve targeted theoretical percentage reductions in lateral seepage discharge.
To validate the mathematical precision of the proposed Ramanujan semi-elliptical flow-path model, theoretical reduction predictions were benchmarked against Dachler’s classic conformal mapping solution for seepage beneath a vertical cut-off wall in a permeable stratum of finite depth [26,45]. For a nominal penetration ratio (a 2.5 m barrier in a 3.0 m peat profile), Dachler’s exact conformal mapping yields a theoretical seepage reduction of 84.1%. This compares exceptionally well with our discretized semi-elliptical model prediction of 86.4% (<2.3% absolute discrepancy), confirming that geometric flow-path expansion via Ramanujan’s approximation captures boundary-value potential flow dynamics with high analytical accuracy.
Modeling results indicate that subsurface barriers effectively complement conventional surface drainage management, such as canal blocking, in peatland plantations by targeting a distinct component of water loss [44,46]. Canal blocking primarily mitigates discharge by raising groundwater levels at the surface drainage boundary and increasing overall block retention during dry periods, whereas subsurface barriers specifically intercept lateral groundwater losses that occur below the ground surface. The combination of controlled canal water levels with strategically placed deep barriers thus provides an integrated approach to limiting both surface-driven and profile-deep lateral exchange between peatland storage and downstream drainage canals [46].
3.6. Sensitivity and Parameter Uncertainty Analysis
A key source of uncertainty in profile-scale discharge modeling stems from spatial and vertical variations in peat hydraulic properties. Hydraulic conductivity in tropical peatlands typically decreases with depth as the degree of humification increases from fibric surface layers to dense, highly decomposed sapric sub-surfaces [36,39]. Furthermore, horizontal conductivity (Kh) often exceeds vertical conductivity (Kv) by up to four-fold (Kh > Kv) [8].
To evaluate how spatial heterogeneity in Ks impacts the water-balance conclusions, a sensitivity analysis was conducted across a characteristic conductivity range for cultivated tropical peatlands (Ks = 1.0 × 10⁻⁵ to 1.0 × 10⁻⁴ m s−1, or 0.86 to 8.64 m day−1). Within this range, baseline normalized subsurface discharge (q) varies from 3.2 mm day−1 to 32.0 mm day−1. Even at the lower conductivity bound (Ks = 1.0 × 10⁻⁵ m s−1), subsurface discharge (3.2 mm day−1) still exceeds baseline daily evapotranspiration (2.3 mm day−1), confirming that lateral seepage remains the primary pathway governing water table drawdown during dry spells across realistic operational parameter bounds.
To further assess the effect of vertical profile stratification, an alternative model incorporating exponential conductivity decay with depth Ks(z) = K0∙e−λ∙z and decay coefficient λ = 0.8 m−1 was evaluated. The decay coefficient λ = 0.8 m−1 was selected based on field literature in degraded Southeast Asian peatlands [38,39], representing a characteristic 1 − log (90%) reduction in saturated hydraulic conductivity from the active surface layer (z = 0 m) to the basal sapric horizon at z ≈ 2.9 m. Accounting for vertical attenuation reduces deep basal seepage by approximately 18–24% during high water table conditions. However, because the vast majority of lateral discharge occurs within the highly transmissive upper 1.5 m of the profile, profile-scale lateral seepage continues to dominate overall groundwater table recession. Additionally, varying total profile depth (PT = 2.0 to 4.0 m) demonstrates that relative barrier reduction efficiency (%) remains governed almost entirely by the geometric penetration ratio (), proving that flow-path truncation remains effective despite underlying profile heterogeneity.
It is important to emphasize that the discharge reductions presented in Table 2 and Table 3 represent theoretical predictions derived from an analytical boundary-value model rather than in situ empirical measurements. To evaluate the reliability of these analytical estimates across varying field environments, a multi-parameter sensitivity analysis was conducted. The model was tested across variations in peat profile thickness (PT = 2.0 to 4.0 m), hydraulic conductivity (Ks = 1.0 × 10⁻⁵ to 1.0 × 10⁻⁴ m s−1), and driving hydraulic head differences (ΔH = 0.1 to 0.8 m). The results indicated that while the absolute magnitude of lateral discharge (Q, m3 day−1) scales linearly with hydraulic conductivity (Ks) and head difference (ΔH), the relative seepage reduction efficiency (%) was controlled almost entirely by the dimensionless penetration ratio (). For a penetration ratio ψ ≈ 0.83 (corresponding to a 2.5 m barrier in a 3.0 m peat profile), predicted seepage reduction remains remarkably stable between 84.2% and 88.6% across the entire range of hydraulic gradients and conductivity values. Conversely, in deeper peat profiles (PT = 4.0 m), a 2.5 m barrier achieved a lower relative penetration (ψ = 0.625), resulting in a predicted seepage reduction of 64.5%. This confirms that barrier design depth must be normalized to total peat depth (Pa ≈ 0.85 PT) to achieve high reduction performance in the field.
Propagating direct field measurement variances—derived from physical soil coring and transducer loggers—through standard quadrature error analysis (Equation (16)) revealed well-bounded uncertainty intervals around our primary numerical findings. Linear regression of single-well pumping recovery curves validated Ks = 4.125 × 10⁻⁵ m s−1 with a 95% confidence range of 3.75 × 10⁻⁵ to 4.51 × 10⁻⁵ m s−1 (3.23 to 3.89 m day−1). Propagating this variance alongside hourly hydrometric head fluctuations (σΔH = ±0.04 m) yielded an estimated mean subsurface discharge of 13.2 ± 1.8 mm day−1 during the 6–14 December 2021 dry-spell episode. Monte Carlo uncertainty analysis (N = 10,000) for the proposed subsurface barrier demonstrated high stability in relative seepage reduction efficiency. For a nominal 2.5 m barrier installed in a 3.0 m peat profile (ψ = 0.833), the predicted seepage reduction of 86.4% falls within a narrow 95% confidence interval of 84.1% to 88.7% across the full range of operational conductivity and head variations. Sensitivity coefficients indicated that the barrier depth penetration ratio () accounts for 91.4% of total output variance, whereas absolute conductivity and head differences affect total discharge volume but exert negligible influence on percentage reduction efficiency. This confirms that geometric flow-path truncation remains a reliable design principle despite underlying hydrogeological heterogeneities. A consolidated summary of all tested sensitivity scenarios—spanning spatial conductivity variability, vertical decay profiles, driving hydraulic heads, and barrier penetration geometry—is presented in Table 4. The results demonstrate that while absolute lateral discharge (q) varies directly with Ks and ΔH, relative barrier reduction efficiency (η) is governed almost entirely (91.4% variance contribution) by the dimensionless geometric penetration ratio ().
Table 4.
Multi-parameter sensitivity analysis and propagated uncertainty for profile subsurface discharge (q) and barrier seepage reduction efficiency (η).
The analytical barrier model predictions are strongly supported by our empirical field observations. Continuous transducer logs established that rapid phreatic recession (15.2 to 21.4 mm day−1) occurs primarily during shallow water table periods when lateral flow is concentrated in the highly transmissive upper horizon (0–2.0 m, where single-well tests confirmed Ks = 4.125 × 10⁻⁵ m s−1). Because the upper 2.0 m drives over 80% of total profile water export, placing a barrier to a relative depth ratio of ψ = Pa/PT ≈ 0.83 (2.5 m in a 3.0 m profile) physically truncates the active horizontal flow zone, validating why geometric flow-path elongation achieves an 86.4% theoretical reduction in lateral seepage.
3.7. Results Limitations
Apart from the discussed results, this research might have some limitations related to peat maturity, climate variability, data measurement, and model assumption. Different types of peat may respond differently on how water flow through peat profiles. Research shows soil hydrological characteristic greatly influences groundwater drawdown controlling peat fire [47]. This study might not cover all peat types, but it provides deeper knowledge on how large water loss in drainage peat. Also, this study was limited to only 2-year observations, which may undermine the influence of extreme climate events triggered by strong ENSO such as in 2015. During strong ENSO, groundwater decline may be accelerated due to hot and dry atmospheric condition. Further, although our findings benefit for restoration project activities, more efforts are required to integrate our approach in national mitigation strategies to keep peatland wet and prevent fire in the future.
A methodological constraint of this study is reliance on a single centroid piezometer to estimate the hydraulic gradient across the 30 ha block. Approximating the phreatic head drop over a 150 m flow distance using a linear gradient [i = (GWL − CWL)/L] simplified the non-linear, parabolic water table profile typical of unconfined peat aquifers under drainage. Spatial variability in micro-topography, peat bulk density, and localized horizontal hydraulic conductivity (Ks) across the 300 m × 1000 m block might also induce spatial variations in actual seepage rates, particularly where Ks decays exponentially with depth [Ks(z) = K0e−λz] across advancing humification horizons. While the centroid monitoring location provides a representative mean head for evaluating block-scale recession dynamics, future investigations should incorporate multi-node piezometer transects perpendicular to drainage channels to resolve spatial phreatic surface curvature and refine gradient calculations.
The conceptualized semi-elliptical flow-path model provided a physically grounded analytical framework for quantifying depth-dependent seepage reduction in an ideal geometric boundary condition. Translating these findings to field-scale engineering interventions requires empirical validation through pilot demonstration plots, as in situ field validation for physical cut-off barriers remains currently unexamined. In situ effectiveness might be depended on profile-scale factors not fully captured in the 2D domain, including vertical anisotropy (Kh/Kv), structural heterogeneities within sapric–hemic horizons, and edge-effect leakage along barrier boundaries. Field trials incorporating multi-depth piezometer transects installed upstream and downstream of physical barriers (e.g., geomembranes or compacted clay walls), paired with local hydraulic tracer experiments, are recommended to validate the modeled reduction efficiencies (86.4% nominal reduction; 95% CI: 84.1% to 88.7% for a 2.5 m barrier) and optimize installation depth under operational plantation conditions.
4. Conclusions
This study demonstrates that lateral subsurface seepage through permeable peat horizons represents the primary driver of groundwater table recession in drained tropical peatlands, substantially exceeding baseline atmospheric evapotranspiration. Field monitoring across the 30 ha experimental block revealed persistent groundwater table drawdown during dry spells, with continuous 30 min logging recording phreatic recession rates ranging from 15.2 mm day−1 (during the 6–14 December benchmark episode) up to 21.4 mm day−1 across seasonal dry spells. These drawdown rates substantially exceed site-specific daily potential evapotranspiration demand (PET = 1.85 to 2.57 mm day−1). Profile-scale mass-balance calculations indicated that lateral subsurface seepage to artificial drainage canals averaged 13.2 ± 1.8 mm day−1 equivalent volumetric water depth during intensive recession monitoring. Normalized over the block footprint, subsurface discharge accounted for 85.2% of total volumetric profile water export with 15.5 mm day−1 total flux. Scaling this field-observed phreatic decline rate via matrix specific yield (Sy ≈ 0.20) showed an effective liquid storage loss of ΔSobs = 3.04 mm day−1, confirming that internal lateral boundary loss—rather than atmospheric demand alone—is the primary driver of water table drawdown in drained peatlands. Furthermore, conceptual boundary-value modeling demonstrates that embedded vertical subsurface barriers attenuate lateral seepage by restricting the active permeable cross-sectional flow area and elongating curvilinear flow paths. Theoretical simulations indicate that a barrier penetration ratio of ψ = Pa/PT ≈ 0.83 (e.g., a nominal 2.5 m barrier depth within a 3.0 m peat profile) yields a theoretical seepage discharge reduction of 86.4% (95% CI: 84.1–88.7%) relative to unblocked conditions. This analytical prediction is directly anchored by field piezometric observations, which confirmed that rapid lateral drawdown is concentrated within the upper permeable horizon that the barrier effectively intercepts. While boundary-value modeling identifies deep profile penetration (ψ ≈ 0.83 to 0.85) as an effective target for seepage suppression, the 2.5 m barrier depth should be interpreted as a preliminary design benchmark normalized to profile thickness rather than a fixed prescription. Practical field implementation must account for real-world engineering constraints, including sheet-pile or geomembrane installation costs, potential mechanical disturbance to soft peat horizons, localized preferential flow around barrier edges, and soil stability at the mineral sub-soil interface. Pilot-scale field trials incorporating upstream/downstream piezometer arrays are necessary to validate these analytical predictions under operational conditions. While traditional surface interventions, such as canal blocking, effectively regulate boundary water levels and enhance surface storage, deep subsurface barriers target internal lateral flux occurring beneath the ground surface. Integrating deep subsurface barriers with conventional canal blocking provides a dual-action hydraulic-control strategy that intercepts both surface-driven and profile-deep water export, offering a robust framework for improving water retention and advancing hydrological restoration in cultivated peatlands.
Author Contributions
B.K. and S.H.A. conceived and designed the study, performed the initial literature search, and wrote the first draft of the manuscript. B.K., R.S., R.D.Y. and P.P.U. were responsible for data acquisition, laboratory analysis, and database management. B.K., S.H.A., P.R., H.S., A.D. and S. conducted the data analysis and contributed to the interpretation of the data. B.K. and M.T. critically revised the manuscript for important intellectual content and supervised the project implementation. All authors (B.K., S.H.A., P.R., H.S., A.D., R.S., S., R.D.Y., P.P.U. and M.T.) equally contributed significantly to the work, reviewed and edited subsequent drafts, gave final approval of the version to be published, and agreed to be accountable for all aspects of the work in ensuring that questions related to the accuracy or integrity of any part of the work are appropriately investigated and resolved. All authors have read and agreed to the published version of the manuscript.
Funding
This study was supported by Indonesian Agency for Agricultural Research and Development, for the 2020–2021 fiscal years. The funder had no role in study design, data collection and analysis, decision to publish, or preparation of the manuscript.
Data Availability Statement
The raw data supporting the conclusions of this article will be made available by the authors on request.
Conflicts of Interest
The authors declare no conflicts of interest.
References
- Joosten, H.; Clarke, D. Wise Use of Mires and Peatlands. Int. Mire Conserv. Group Int. Peat Soc. 2002, 304, 239–250. [Google Scholar]
- Labadz, J.; Allott, T.; Evans, M.; Butcher, D.; Billett, M.; Stainer, S.; Yallop, A.; Jones, P.; Innerdale, M.; Harmon, N.; et al. Peatland Hydrology: Draft Scientific Review. IUCN UK Peatland Programme’s Commission of Inquiry on Peatlands, October 2010. Available online: https://live-twt-d8-iucn.pantheonsite.io/sites/default/files/2025-06/Review Peatland Hydrology%2C June 2011 Draft_0.pdf (accessed on 8 May 2026).
- Rieley, J.; Page, S. Tropical Peatland of the World. In Tropical Peatland Ecosystems; Springer: Tokyo, Japan, 2016; pp. 3–32. [Google Scholar]
- Anda, M.; Ritung, S.; Suryani, E.; Sukarman; Hikmat, M.; Yatno, E.; Mulyani, A.; Subandiono, R.E.; Suratman; Husnain. Revisiting Tropical Peatlands in Indonesia: Semi-Detailed Mapping, Extent and Depth Distribution Assessment. Geoderma 2021, 402, 115235. [Google Scholar] [CrossRef] [Scilit]
- Adesiji, A.R.; Adeoye, P.A.; Gbadebo, A.O. Effects of Water Table Fluctuations on Peatland-a Review. Sch. J. Eng. Tech. 2014, 2, 482–487. [Google Scholar]
- Noor, M. Pertanian Lahan Gambut, Potensi Dan Kendala; Kanisius: Yogyakarta, Indonesia, 2001. [Google Scholar]
- Suwondo; Sabiham, S.; Sumardjo; Pramudya, B. Analisis Lingkungan Biofisik Lahan Gambut Pada Perkebunan Kelapa Sawit. J. Hidrolitan 2010, 1, 20–28. [Google Scholar]
- Schlotzhauer, S.M.; Price, J.S. Soil Water Flow Dynamics in a Managed Cutover Peat Field, Quebec: Field and Laboratory Investigations. Water Resour. Res. 1999, 35, 3675–3683. [Google Scholar] [CrossRef] [Scilit]
- Sabiham, S.; Sukarman, S. Pengelolaan Lahan Gambut Untuk Pengembangan Kelapa Sawit Di Indonesia. J. Sumberd. Lahan 2012, 6, 133402. [Google Scholar]
- Sabiham, S. Pengembangan Lahan Secara Berkelanjutan Sebagai Dasar Dalam Pengelolaan Gambut Di Indonesia. In Proceedings of the Makalah Utama Seminar Nasional Pertanian Lahan Rawa, Kapuas; Universitas Lambung Mangkurat: Banjarmasin, Indonesia, 2008; pp. 3–4. [Google Scholar]
- Fetter, C.W. Applied Hydrogeology, 3rd ed.; Macmillan College Publication: New York, NY, USA, 1994. [Google Scholar]
- McLay, C.D.A.; Allbrook, R.F.; Thompson, K. Effect of Development and Cultivation on Physical Properties of Peat Soils in New Zealand. Geoderma 1992, 54, 23–37. [Google Scholar] [CrossRef] [Scilit]
- Hobbs, N.B. Mire Morphology and the Properties and Behaviour of Some British and Foreign Peats. Q. J. Eng. Geol. 1986, 19, 7–80. [Google Scholar] [CrossRef] [Scilit]
- Hirano, T.; Ohkubo, S.; Itoh, M.; Tsuzuki, H.; Sakabe, A.; Takahashi, H.; Kusin, K.; Osaki, M. Large Variation in Carbon Dioxide Emissions from Tropical Peat Swamp Forests Due to Disturbances. Commun. Earth Environ. 2024, 5, 221. [Google Scholar] [CrossRef] [Scilit]
- Wösten, J.H.M.; Clymans, E.; Page, S.E.; Rieley, J.O.; Limin, S.H. Peat–Water Interrelationships in a Tropical Peatland Ecosystem in Southeast Asia. Catena 2008, 73, 212–224. [Google Scholar] [CrossRef] [Scilit]
- Agus, F. Cadangan Karbon, Emisi Gas Rumah Kaca Dan Konservasi Lahan Gambut. In Proceedings of the Prosiding Seminar Dies Natalis Universitas Brawijaya ke 46, Malang, Indonesia, 5 January 2009. [Google Scholar]
- Taufik, M.; Minasny, B.; McBratney, A.B.; Dam, J.C.V.; Jones, P.D.; Lanen, H.A.J.V. Human-Induced Changes in Indonesian Peatlands Increase Drought Severity. Environ. Res. Lett. 2020, 15, 084013. [Google Scholar] [CrossRef] [Scilit]
- Taufik, M.; Setiawan, B.I.; Van Lanen, H.A.J. Increased Fire Hazard in Human-Modified Wetlands in Southeast Asia. Ambio 2019, 48, 363–373. [Google Scholar] [CrossRef] [Scilit]
- Ritzema, H.; Limin, S.; Kusin, K.; Jauhiainen, J.; Wösten, H. Canal Blocking Strategies for Hydrological Restoration of Degraded Tropical Peatlands in Central Kalimantan, Indonesia. Catena 2014, 114, 11–20. [Google Scholar] [CrossRef] [Scilit]
- Dariah, A.; Nurzakiah, S. Pengelolaan Tata Air Lahan Gambut. In Pengelolaan Berkelanjutan Lahan Gambut Terdegradasi; Nurida, N.L., Wihardjaka, A., Eds.; Badan Penelitian dan Pengembangan Pertanian: Jakarta Selatan, Indonesia, 2014; pp. 30–46. [Google Scholar]
- Dariah, A. Maswar Isu Lingkungan Gambut Tropika Indonesia. In Lahan Gambut Indonesia: Pembentukan, karakteristik, dan Potensi Mendukung Ketahanan Pangan; Agus, F., Anda, M., Jamil, A., Masganti, Eds.; IAAD Press: Jakarta Selatan, Indonesia, 2018; pp. 101–129. [Google Scholar]
- Runtunuwu, E.; Kartiwa, B.; Hardiyanti, K.S.; Sudarman, K.; Nugroho, W.T.; Firmansyah, A. Dinamika Elevasi Muka Air Pada Lahan Dan Saluran Di Lahan Gambut. Ris. Geol. Dan Pertamb. 2011, 21, 65–73. [Google Scholar] [CrossRef] [Scilit]
- Kartiwa, B.; Maswar; Dariah, A.; Suratman; Nurida, N.L.; Heryani, N.; Rejekiningrum, P.; Sosiawan, H.; Adi, S.H.; Lenin, I.; et al. Modeling of Peatland Fire Risk Early Warning Based on Water Dynamics. Glob. J. Environ. Sci. Manag. 2023, 9, 233–250. [Google Scholar] [CrossRef]
- Soil Survey Staff. Keys to Soil Taxonomy, 12th ed.; USDA-Natural Resources Conservation Service: Washington, DC, USA, 2014. [Google Scholar]
- Toebes, C.; Morrisey, W.B.; Shorter, R.; Hendy, M. Base Flow Recession Curves. In Handbook of Hydrological Procedures: Procedure No.8; Water and Soil Divisions, Ministry of Works, for the National Water and Soil Conservation Organization: Wellington, New Zealand, 1969. [Google Scholar]
- Bear, J.; Cheng, A.H.-D. Modeling Groundwater Flow and Contaminant Transport; Springer: Dordrecht, The Netherlands, 2010; ISBN 978-1-4020-6681-8. [Google Scholar]
- Ramanujan, S. Modular Equations and Approximations to π. Q. J. Math. 1914, 45, 350–372. [Google Scholar]
- Moscato, P.; Ciezak, A. A New Approximation for the Perimeter of an Ellipse. Algorithms 2024, 17, 464. [Google Scholar] [CrossRef] [Scilit]
- Gunawardhana, M.; Silvester, E.; Jones, O.A.H.; Grover, S. Evapotranspiration and Biogeochemical Regulation in a Mountain Peatland: Insights from Eddy Covariance and Ionic Balance Measurements. J. Hydrol. Reg. Stud. 2021, 36, 100851. [Google Scholar] [CrossRef] [Scilit]
- Antala, M.; Juszczak, R.; Van Der Tol, C.; Rastogi, A. Impact of Climate Change-Induced Alterations in Peatland Vegetation Phenology and Composition on Carbon Balance. Sci. Total Environ. 2022, 827, 154294. [Google Scholar] [CrossRef] [Scilit]
- Soulsby, C.; Scheliga, B.; Neill, A.; Comte, J.; Tetzlaff, D. A Longer-term Perspective on Soil Moisture, Groundwater and Stream Flow Response to the 2018 Drought in an Experimental Catchment in the Scottish Highlands. Hydrol. Process. 2021, 35, e14206. [Google Scholar] [CrossRef] [Scilit]
- Minasny, B.; Adetsu, D.V.; Aitkenhead, M.; Artz, R.R.E.; Baggaley, N.; Barthelmes, A.; Beucher, A.; Caron, J.; Conchedda, G.; Connolly, J.; et al. Mapping and Monitoring Peatland Conditions from Global to Field Scale. Biogeochemistry 2023, 167, 383–425. [Google Scholar] [CrossRef] [Scilit]
- Hikouei, I.S.; Eshleman, K.N.; Saharjo, B.H.; Graham, L.L.B.; Applegate, G.; Cochrane, M.A. Using Machine Learning Algorithms to Predict Groundwater Levels in Indonesian Tropical Peatlands. Sci. Total Environ. 2023, 857, 159701. [Google Scholar] [CrossRef] [Scilit]
- Irfan, M.; Koriyanti, E.; Saleh, K.; Hadi; Safrina, S.; Awaludin; Sulaiman, A.; Akhsan, H.; Suhadi; Suwignyo, R.A.; et al. Dynamics of Peatland Fires in South Sumatra in 2019: Role of Groundwater Levels. Land 2024, 13, 373. [Google Scholar] [CrossRef] [Scilit]
- Urzainki, I.; Palviainen, M.; Hökkä, H.; Persch, S.; Chatellier, J.; Wang, O.; Mahardhitama, P.; Yudhista, R.; Laurén, A. A Process-Based Model for Quantifying the Effects of Canal Blocking on Water Table and CO2 Emissions in Tropical Peatlands. Biogeosciences 2023, 20, 2099–2116. [Google Scholar] [CrossRef] [Scilit]
- Kurnianto, S.; Selker, J.; Kauffman, J.B.; Murdiyarso, D.; Peterson, J.T. The Influence of Land-Cover Changes on the Variability of Saturated Hydraulic Conductivity in Tropical Peatlands. Mitig. Adapt. Strateg. Glob. Change 2019, 24, 535–555. [Google Scholar] [CrossRef] [Scilit]
- Kunarso, A.; Bonner, M.T.L.; Blanch, E.W.; Grover, S. Differences in Tropical Peat Soil Physical and Chemical Properties Under Different Land Uses: A Systematic Review and Meta-Analysis. J. Soil Sci. Plant Nutr. 2022, 22, 4063–4083. [Google Scholar] [CrossRef] [Scilit]
- Kelly, T.J.; Baird, A.J.; Roucoux, K.H.; Baker, T.R.; Coronado, E.N.H.; Ríos, M.; Lawson, I.T. The High Hydraulic Conductivity of Three Wooded Tropical Peat Swamps in Northeast Peru: Measurements and Implications for Hydrological Function. Hydrol. Process. 2014, 28, 3373–3387. [Google Scholar] [CrossRef] [Scilit]
- Baird, A.J.; Low, R.; Young, D.; Swindles, G.T.; Lopez, O.R.; Page, S. High Permeability Explains the Vulnerability of the Carbon Store in Drained Tropical Peatlands. Geophys. Res. Lett. 2017, 44, 1333–1339. [Google Scholar] [CrossRef] [Scilit]
- Apers, S.; Lannoy, G.J.M.D.; Baird, A.J.; Cobb, A.R.; Dargie, G.C.; Pasquel, J.d.A.; Gruber, A.; Hastie, A.; Hidayat, H.; Hirano, T.; et al. Tropical Peatland Hydrology Simulated With a Global Land Surface Model. J. Adv. Model. Earth Syst. 2022, 14, e2021MS002784. [Google Scholar] [CrossRef] [Scilit]
- Treby, S.; Jayasekara, C.; Idrus, N.I.; Ningsih, S.N.A.; Graham, L.L.B.; Hutley, L.B.; Beringer, J.; Grover, S. Hydrological Fluxes From a Drained Tropical Peatland: Evapotranspiration Consistent Despite Large Fluctuations in Precipitation and Soil Moisture. Hydrol. Process. 2025, 39, e70240. [Google Scholar] [CrossRef] [Scilit]
- Mei, J.; Cao, H.; Luo, G.; Pan, H. Analytical Method for Groundwater Seepage through and Beneath a Fully Penetrating Cut-off Wall Considering Effects of Wall Permeability and Thickness. Water 2022, 14, 3982. [Google Scholar] [CrossRef] [Scilit]
- Putra, S.S.; Baird, A.J.; Holden, J. Modelling the Performance of Bunds and Ditch Dams in the Hydrological Restoration of Tropical Peatlands. Hydrol. Process. 2022, 36, e14470. [Google Scholar] [CrossRef] [Scilit]
- Putra, S.S.; Holden, J.; Baird, A.J. The Effects of Ditch Dams on Water-level Dynamics in Tropical Peatlands. Hydrol. Process. 2021, 35, e14174. [Google Scholar] [CrossRef] [Scilit]
- Dachler, R. Grundwasserströmung; Julius Springer: Vienna, Austria, 1936. [Google Scholar]
- Salla, A.; Salo, H.; Tähtikarhu, M.; Marttila, H.; Läpikivi, M.; Liimatainen, M.; Lötjönen, T.; Koivusalo, H. Simulating Controlled Drainage and Hydrological Connections in a Cultivated Peatland Field. Vadose Zone J. 2024, 23, e20387. [Google Scholar] [CrossRef] [Scilit]
- Taufik, M.; Veldhuizen, A.A.; Wösten, J.H.M.; van Lanen, H.A.J. Exploration of the Importance of Physical Properties of Indonesian Peatlands to Assess Critical Groundwater Table Depths, Associated Drought and Fire Hazard. Geoderma 2019, 347, 160–169. [Google Scholar] [CrossRef] [Scilit]

Disclaimer/Publisher’s Note: The statements, opinions and data contained in all publications are solely those of the individual author(s) and contributor(s) and not of MDPI and/or the editor(s). MDPI and/or the editor(s) disclaim responsibility for any injury to people or property resulting from any ideas, methods, instructions or products referred to in the content. |
© 2026 by the authors. Licensee MDPI, Basel, Switzerland. This article is an open access article distributed under the terms and conditions of the Creative Commons Attribution (CC BY) license.