


Abstract
Drought is a major hydroclimatic hazard in Mediterranean environments, affecting water availability and agricultural systems. This study investigates meteorological and hydrological drought variability and trends in the Oued Rdat Basin, Morocco, over 1970–2022. Meteorological and hydrological droughts were characterized using the Standardized Precipitation Index (SPI) and Standardized Streamflow Index (SSFI), respectively. Trends were assessed using the non-parametric Mann–Kendall and Spearman’s Rho tests, while Innovative Trend Analysis (ITA) was used to examine changes across different portions of the index distributions. The results reveal pronounced interannual variability, with recurrent alternation between dry and wet years and differences in hydrological variability between the upper and lower parts of the basin. Although positive and negative Sen’s slope estimates were observed for some SPI and SSFI series, all Mann–Kendall p-values exceeded 0.05, indicating that none of the detected monotonic trends were statistically significant at the 5% level. ITA nevertheless indicated distribution-dependent tendencies across different portions of the index distributions that were not identified by the conventional monotonic trend tests. Overall, drought variability was characterized by substantial interannual and distributional variability rather than a statistically significant long-term monotonic trend. The integrated SPI–SSFI framework provides useful information for drought assessment and water-resource management in the basin.
1. Introduction
Drought is one of the most complex natural hazards affecting water resources, ecosystems, agricultural production, and socio-economic activities worldwide. Unlike other natural disasters, drought develops gradually over time, and its impacts can persist for long periods, making its identification and management a major challenge. The severity of drought depends on several factors, including precipitation variability, temperature conditions, evapotranspiration demand, hydrological characteristics, and human pressure on water resources [1,2].
The Mediterranean region is considered one of the most vulnerable areas to drought due to its strong spatial and temporal rainfall variability and its sensitivity to climate change. Several studies have reported increasing temperature trends and modifications in precipitation regimes across the Mediterranean basin, contributing to a higher frequency and intensity of drought events during recent decades [3,4]. These climatic changes have important consequences for water availability, particularly in semi-arid regions where surface water and groundwater resources are highly dependent on rainfall variability [5].
Morocco, located in the western Mediterranean region, is particularly exposed to recurrent drought events due to its irregular precipitation distribution and strong dependence on climate-sensitive water resources. Several studies have identified significant changes in Moroccan hydroclimatic conditions, including decreasing precipitation trends in several regions and increasing temperatures during recent decades [6,7]. Such changes have affected river discharge, reservoir storage, groundwater recharge, and agricultural activities, increasing the need for reliable drought monitoring and assessment approaches [8,9].
Drought is generally classified into several categories, including meteorological, agricultural, and hydrological drought. Meteorological drought refers to a prolonged deficit in precipitation compared with normal climatic conditions, while hydrological drought occurs when water availability in rivers, reservoirs, and groundwater systems decreases below expected levels [10]. Although these drought types are interconnected, their evolution and propagation depend on climatic conditions, basin characteristics, soil properties, and hydrological processes. Therefore, analyzing both precipitation and streamflow variations is essential for understanding drought dynamics and improving water resource management.
Several drought indices have been developed to quantify drought characteristics and compare drought conditions between different regions. Among meteorological drought indicators, the Standardized Precipitation Index (SPI), introduced by McKee et al. [11], is one of the most widely used indices due to its simplicity, flexibility, and limited data requirements. The SPI is based on precipitation anomalies and allows drought analysis at different temporal scales, making it suitable for identifying drought duration, intensity, and frequency [12,13].
However, precipitation deficits do not always directly represent the impact of drought on water resources. Hydrological drought assessment requires the analysis of streamflow variability because river discharge integrates the effects of climatic conditions and watershed responses. Consequently, several streamflow-based standardized indices have been developed to characterize hydrological drought by transforming streamflow anomalies into comparable statistical values [14]. The Standardized Stream Flow Index (SSFI) is one of these approaches, allowing the identification of hydrological drought conditions based on deviations of observed streamflow from long-term statistical characteristics. This index provides valuable information about the temporal variability of river flow and the occurrence of hydrological drought events at different time scales [15].
The combined use of precipitation-based and streamflow-based indices provides a better understanding of drought propagation processes from climatic conditions to hydrological responses. Previous studies have demonstrated that the relationship between meteorological and hydrological drought is influenced by basin characteristics, storage capacity, and the delayed response of river systems to precipitation anomalies [16,17]. Therefore, integrated drought analysis using SPI and SSFI represents an effective approach for evaluating the vulnerability of watersheds to climate variability.
In Morocco, several studies have applied drought indices to investigate the temporal variability of meteorological and hydrological drought. Research conducted in different Moroccan watersheds has revealed the recurrence of severe drought periods and highlighted the sensitivity of water resources to climatic fluctuations [18,19,20,21]. These studies emphasized the importance of long-term hydroclimatic records and statistical approaches for detecting drought evolution and supporting sustainable water management strategies.
The Sebou watershed is one of the most important river basins in Morocco due to its contribution to agricultural activities and water resources. However, several sub-basins within this watershed remain insufficiently studied despite their sensitivity to climatic and environmental changes. The Oued Rdat Basin, located within the Sebou watershed, represents a particularly important area for investigating drought variability because of its dependence on rainfall conditions and surface water resources. Recent research has highlighted significant multi-decadal land use and land cover changes in the Wadi Rdat Basin, indicating important environmental transformations that may influence runoff processes, hydrological responses, and water resource availability [22].
Despite the importance of this basin, limited studies have focused on the integrated assessment of meteorological and hydrological drought by combining precipitation-based and streamflow-based standardized indices with complementary trend analysis approaches. Previous investigations in Morocco have mainly focused on drought characterization using individual indicators or conventional monotonic trend methods, which may not fully capture changes occurring within different parts of the hydroclimatic distribution. In addition, the propagation of precipitation anomalies into hydrological responses remains insufficiently documented in several semi-arid Moroccan basins, particularly where land-use changes and catchment characteristics may influence the transformation of climatic signals into streamflow variability.
To address this knowledge gap, this study proposes an integrated framework for assessing drought dynamics in the Oued Rdat Basin by combining the Standardized Precipitation Index (SPI) and the Standardized Streamflow Index (SSFI) with complementary trend-detection methods, including Mann–Kendall, Spearman’s Rho, and Innovative Trend Analysis (ITA). Unlike conventional approaches based only on monotonic trend evaluation, the combined use of these methods allows a more comprehensive assessment of temporal variability and potential changes within different portions of the drought distribution. This approach provides new insights into the interactions between meteorological variability, hydrological response, and basin characteristics in a semi-arid Mediterranean environment.
The objective of this study is to investigate the temporal variability and evolution of meteorological and hydrological drought in the Oued Rdat Basin during the period 1970–2022. The Standardized Precipitation Index (SPI) and the Standardized Streamflow Index (SSFI) are applied to characterize drought intensity, frequency, and duration. In addition, statistical trend analysis methods are used to identify possible changes in drought behaviour over the study period. The results aim to improve the understanding of climate–streamflow interactions and contribute to sustainable water resource management in the basin.
2. Materials and Methods
2.1. Study Area
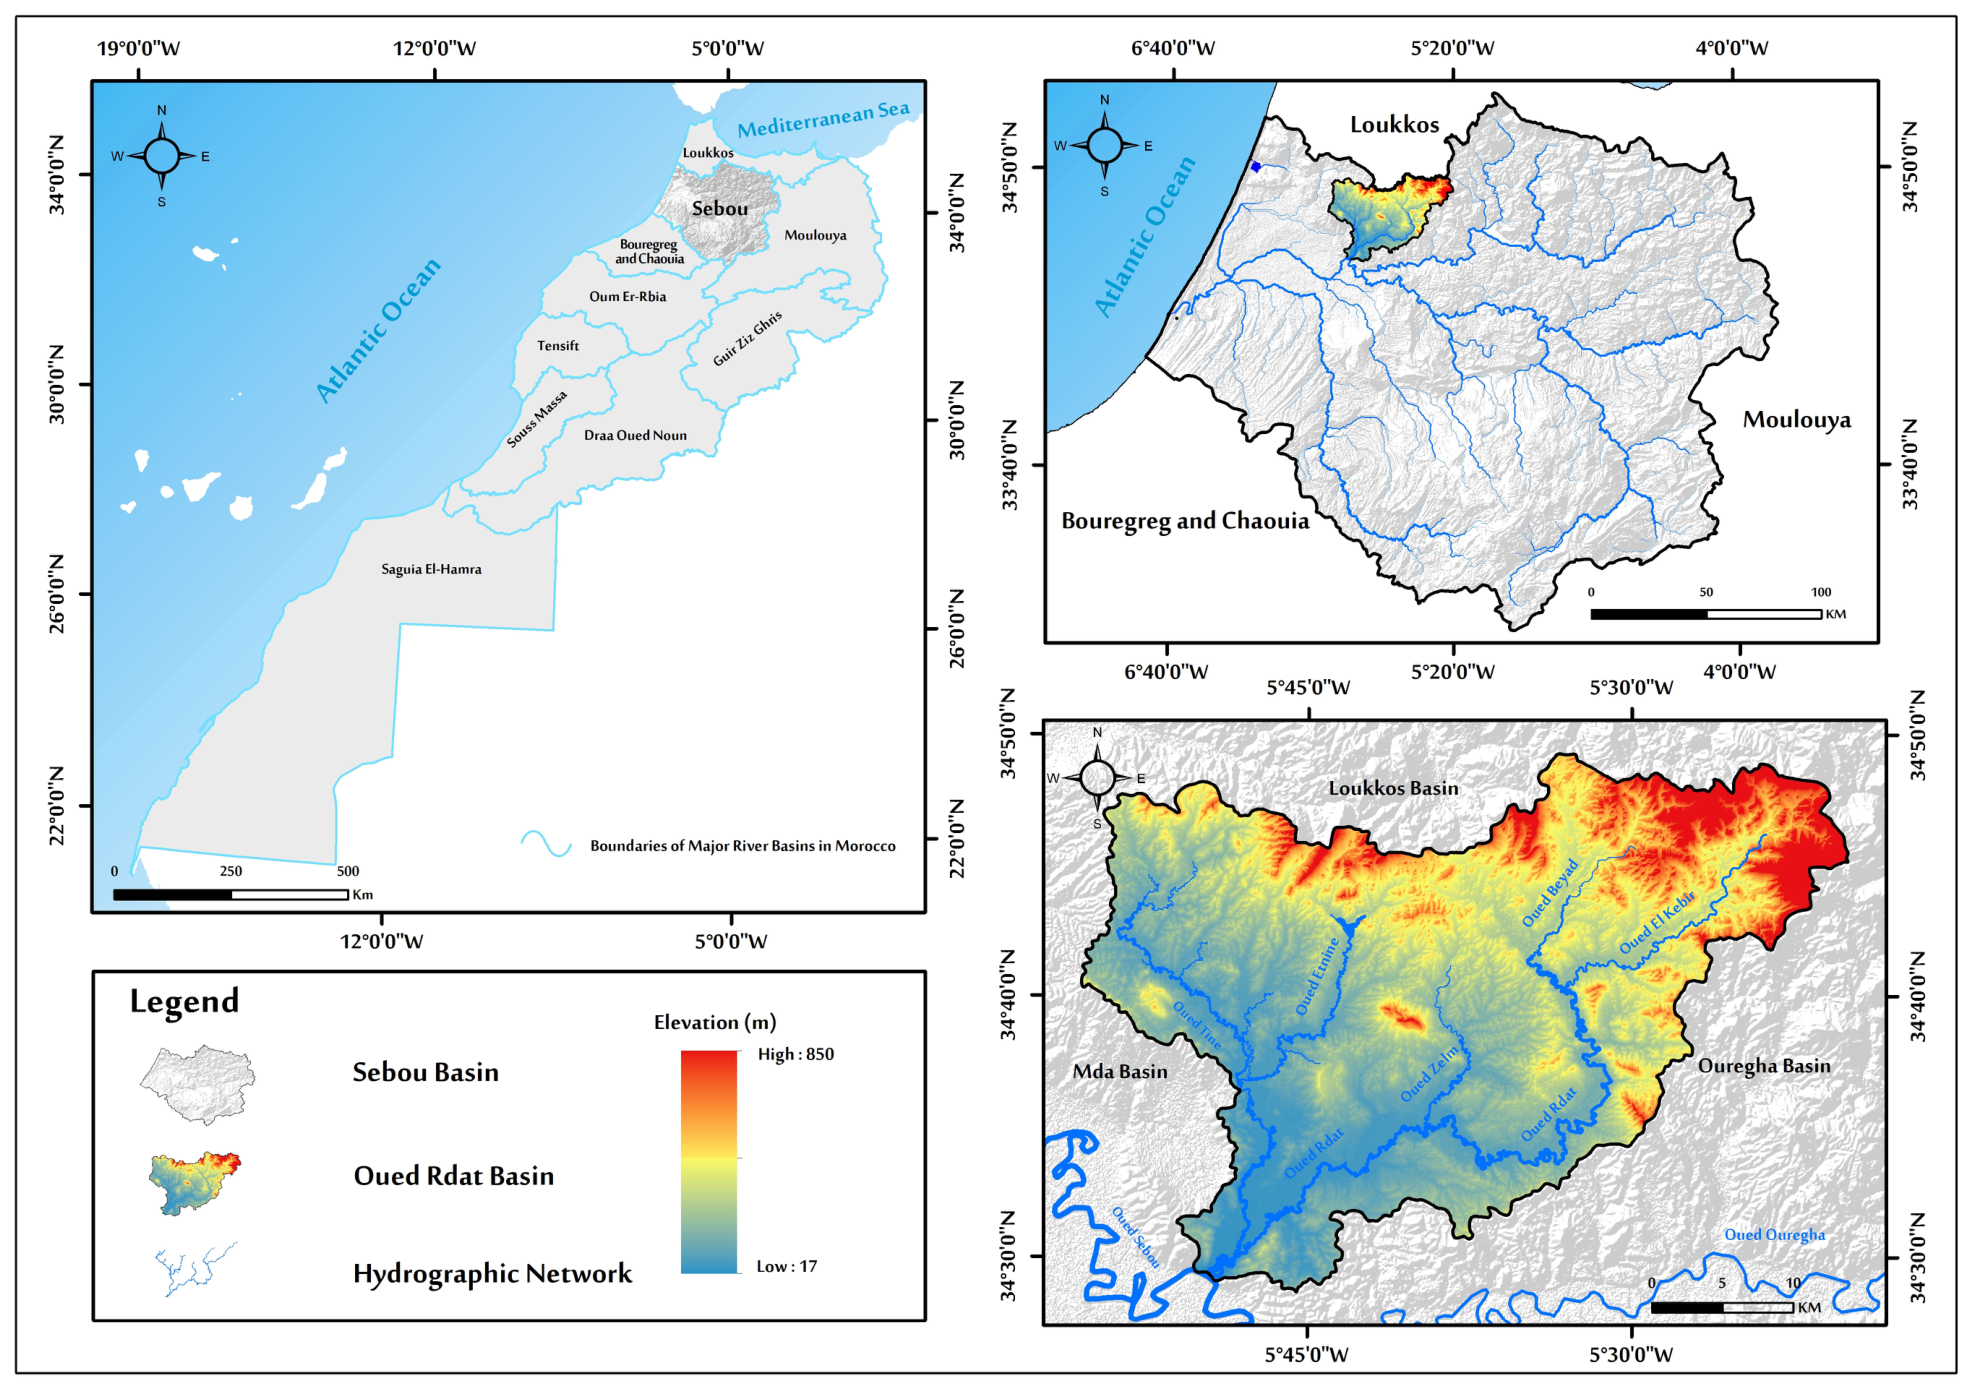
The Oued Rdat Basin is located in northwestern Morocco and forms part of the northern sector of the Sebou River Basin. The basin extends between approximately 34°28′ and 34°49′ N and 5°20′ and 5°55′ W, covering an area of about 1165 km2. It is bounded by the Mda Basin to the west, the Ouergha Basin to the east, and the Loukkos Basin to the north (Figure 1). The Oued Rdat is a tributary of the Sebou River and constitutes an important drainage system within this part of northern Morocco [22].
Figure 1.
Location map of the Oued Rdat Basin.
The basin extends across parts of the Sidi Kacem, Ouezzane, and Kenitra provinces and is predominantly rural, with agricultural activities constituting an important component of land use. The basin has experienced considerable changes in land use and vegetation cover during recent decades, including a marked reduction in vegetated surfaces, particularly in central and downstream sectors [23]. These changes may influence infiltration, runoff generation, soil-water storage, and consequently the hydrological response to precipitation variability.
2.2. Dataset
The dataset used in this study consists of long-term meteorological and hydrological records collected for the Oued Rdat Basin during the period 1970–2022. Two hydroclimatic variables were considered: precipitation data for meteorological drought assessment and streamflow data for hydrological drought characterization.
Monthly precipitation data were collected from four rainfall stations located within and around the Oued Rdat Basin. Among these stations, two stations (Had Kourt 1 and Kharrouba) provided both precipitation and streamflow records, while the other two stations (Had Kourt 2 and Ouezzane) provided only precipitation data. The streamflow data used for hydrological drought assessment were obtained from the two hydrometric stations (Had Kourt 1 and Kharrouba). The streamflow records were available at a monthly time step and were subsequently aggregated into annual mean streamflow values based on a hydrological year extending from September to August. The selected stations were chosen based on the availability of long-term records, data continuity, and data quality.
The meteorological and hydrological datasets were provided by the Sebou Hydraulic Basin Agency (ABHS) and the National Office of Agricultural Advisory Services (ONCA). Before drought analysis, the datasets underwent quality control procedures, including the detection of missing values, verification of temporal consistency, and assessment of data homogeneity. The main characteristics of the selected stations, including geographical coordinates, altitude, station type, data source, and available variables, are presented in Table 1.
Table 1.
Characteristics of meteorological and hydrological stations used in this study.
2.3. Drought Indices
The selection of SPI and SSFI was based on their complementary ability to characterize different components of drought dynamics. SPI was selected to represent meteorological drought because it requires only precipitation data and allows drought assessment at different temporal scales. However, precipitation deficits alone do not fully describe the impacts of drought on water resources. Therefore, SSFI was incorporated to characterize hydrological drought by considering streamflow variability and the integrated response of the catchment to climatic anomalies. The combined application of SPI and SSFI enables the analysis of drought propagation from atmospheric conditions to hydrological responses.
2.3.1. Standardized Precipitation Index (SPI)
The Standardized Precipitation Index (SPI), proposed by McKee et al. [11], is one of the most widely used drought indices for meteorological drought assessment due to its simplicity, limited data requirements, and applicability to different climatic regions. The SPI is based exclusively on precipitation data and allows the identification of dry and wet periods at different time scales [24].
The calculation of SPI requires fitting the precipitation series to an appropriate probability distribution. The gamma distribution was adopted for the precipitation series in the Oued Rdat Basin because the monthly precipitation data are non-negative and exhibit the positive skewness commonly associated with precipitation variability. Its use provides a suitable probability framework for representing the observed precipitation distribution and transforming precipitation anomalies into standardized SPI values [11,24]. The probability density function of the gamma distribution is expressed as
where α and β represent the shape and scale parameters of the gamma distribution, respectively.
The parameters of the gamma distribution are estimated using the maximum likelihood method [24]
where represents the mean precipitation value, and A is calculated as
where n is the number of precipitation observations.
The cumulative probability distribution is then transformed into the standard normal distribution to obtain SPI values [11,25]. Positive SPI values indicate wetter-than-normal conditions, whereas negative values indicate drought conditions. The drought severity classes are generally defined according to SPI thresholds, with lower values representing more severe drought events [25].
In this study, monthly precipitation data from the selected rainfall stations (Had Kourt 1, Had Kourt 2, Kharrouba, and Ouezzane) were used to calculate SPI during the period 1970–2022. The resulting SPI values were used to characterize the frequency, duration, and intensity of meteorological drought events in the Oued Rdat Basin.
2.3.2. Standardized Stream Flow Index (SSFI)
The Standardized Stream Flow Index (SSFI) was applied to characterize hydrological drought variability using annual mean streamflow derived from the available monthly streamflow records. The SSFI was obtained by estimating the cumulative probability distribution of the annual mean streamflow series and subsequently transforming the cumulative probabilities into standardized normal values, allowing annual streamflow anomalies to be expressed on a common standardized scale [14,26,27]. Because the annual mean streamflow series from the Oued Rdat Basin includes zero-flow observations, a mixed distribution approach was adopted to explicitly account for these conditions. The positive streamflow observations were represented using their empirical cumulative distribution, while zero-flow years were treated as a separate probability mass. This approach was selected to preserve the observed zero-flow conditions in the streamflow records rather than replacing them with arbitrarily small positive values, thereby providing a probability representation consistent with the characteristics of the available hydrological data.
The probability of zero-flow conditions was calculated as
where n0 is the number of zero-flow years, and n is the total number of hydrological years. For positive streamflow values, the empirical cumulative distribution function was estimated from the ranked positive observations. The mixed cumulative probability was then calculated as
where F(Q) represents the empirical cumulative distribution function of the positive streamflow values. For zero-flow years, H(0) = p0. The cumulative probabilities were subsequently transformed into standardized normal values using
p0 = n0/n,
H(Q) = p0 + (1 − p0) F(Q),
SSFI = Φ−1 [H(Q)].
The resulting SSFI values are dimensionless and standardized relative to the cumulative probability distribution. Negative SSFI values indicate below-normal streamflow conditions associated with hydrological drought, whereas positive values represent wetter-than-normal hydrological conditions.
In this study, monthly streamflow records from the Kharrouba and Had Kourt hydrometric stations were aggregated into annual mean streamflow values for hydrological years extending from September to August. These annual mean values were then used to calculate SSFI, resulting in one SSFI value for each hydrological year during 1970–2022.
Zero-flow observations were treated as genuine zero-flow conditions and were incorporated into the mixed probability distribution rather than being replaced by arbitrary small values. At the monthly scale, 157 zero-flow observations were identified at Had Kourt 1 out of 624 monthly observations (25.16%), while 157 zero-flow observations were identified at Kharrouba out of 540 monthly observations (29.07%). At the annual scale, two hydrological years had zero annual mean streamflow at each station, corresponding to 3.85% of the Had Kourt 1 record and 4.44% of the Kharrouba record. These observations were retained in the analysis to preserve the observed intermittency of streamflow in the basin.
The obtained index values were subsequently analysed to characterize the temporal variability and occurrence of hydrological drought events in the Oued Rdat Basin.
2.4. Drought Classification
Although standardized drought indices provide continuous numerical values, their interpretation is usually facilitated by grouping index values into different drought and wetness categories. In this study, the drought classification thresholds originally proposed by McKee et al. [11] for SPI were also applied to SSFI to facilitate a consistent comparison between meteorological and hydrological drought conditions.
This classification allows the identification of extreme, severe, and moderate drought events, as well as normal and wet conditions. The same thresholds were applied consistently to both meteorological and hydrological drought indices throughout the study.
The drought classification used in this study is presented in Table 2.
Table 2.
Classification of standardized drought indices based on SPI and SSFI values, adapted from McKee et al. [11].
2.5. Trend Analysis
2.5.1. Mann–Kendall Trend Test (MK)
The non-parametric Mann–Kendall (MK) test was employed to identify the direction and statistical significance of monotonic trends in the hydroclimatic time series. The MK test is widely used for hydro-meteorological data because it does not require the observations to follow a specific probability distribution [28,29]. The Mann–Kendall statistic S was calculated by comparing all possible pairs of observations in the time series
where n is the number of observations, and the sign function is defined as
When tied observations are present, the variance of S was calculated as
where m is the number of groups of tied observations, and ti denotes the number of observations in the i-th tied group. The standardized test statistic Z was subsequently calculated as
The positive Z value indicates an increasing trend, whereas a negative Z value indicates a decreasing trend. The statistical significance of the trend was evaluated using the corresponding p-value, with p < 0.05 considered statistically significant at the 95% confidence level [28,29]. The MK test was applied to the precipitation, SPI, and SSFI series to assess their temporal evolution over the study period.
2.5.2. Sen’s Slope Estimator
The magnitude of the identified trends was quantified using Sen’s slope estimator, a robust non-parametric method proposed by Sen [30]. For each pair of observations, the individual slope was calculated as
where xi and xj are the observations at times i and j, respectively. Sen’s slope was then obtained as the median of all pairwise slopes
QSen = median(Qij).
A positive Sen’s slope indicates an increasing tendency, whereas a negative value indicates a decreasing tendency. The estimator was used together with the MK test to quantify the magnitude and direction of temporal changes in precipitation, SPI, and SSFI [30]. The Sen estimator is particularly appropriate for hydroclimatic series because it provides a robust estimate of the trend magnitude without requiring a normal distribution of the observations.
2.5.3. Spearman’s Rho Trend Test
Spearman’s Rho test was applied to assess the direction and statistical significance of monotonic trends in the hydroclimatic time series [31]. This non-parametric test evaluates the strength of the relationship between two variables based on their ranks and is suitable for detecting monotonic trends without requiring the data to follow a specific probability distribution. The Spearman rank correlation coefficient rs was calculated as follows:
where n is the number of observations, and R(xi) and R(yi) represent the ranks of the i-th observations in the two corresponding series. For trend assessment, the time sequence was compared with the corresponding ranked observations. The standardized test statistic Z was subsequently calculated as
A positive value of Z indicates an increasing trend, whereas a negative value indicates a decreasing trend. The statistical significance of the detected trend was evaluated using the corresponding p-value, with p < 0.05 considered statistically significant at the 95% confidence level [31].
2.5.4. Sen’s Innovative Trend Analysis (ITA)
The Innovative Trend Analysis (ITA) method was employed to assess the temporal trends in the hydroclimatic time series both graphically and statistically. The method, introduced by Şen (2012), allows trends to be identified without requiring the data to satisfy specific statistical distribution assumptions [32]. In the graphical procedure, the original time series was first arranged in chronological order from the beginning to the end of the observation period. The dataset was then divided into two equal parts, and each sub-series was arranged in ascending order. The first sub-series was plotted on the horizontal axis, whereas the second sub-series was plotted on the vertical axis. The 1:1 line was used as the reference line. If the plotted points are distributed along the 1:1 line, no apparent trend is indicated. Points located below the 1:1 line indicate a decreasing trend, whereas points located above the line indicate an increasing trend [32].
For the statistical assessment, the null hypothesis (H0) assumes the absence of a statistically significant trend. Following Şen (2017), the slope of the data series was calculated as follows [33]:
where E() represents the mean of the second sub-series, E() represents the mean of the first sub-series, and n is the total number of observations. If E(s) is equal to zero, no trend can be identified. The variance of the slope was then calculated as
The correlation coefficient between the two sub-series was calculated using
The standard deviation of the samples was subsequently determined as
The lower and upper confidence limits were then determined according to the selected significance level as
where Scr is the critical value corresponding to the selected significance level. In this study, the critical value z = 1.96 was adopted at the 95% significance level [33]. The statistical significance and direction of the detected trend were subsequently evaluated by comparing the calculated slope with the corresponding confidence limits. Positive and negative slope values indicate increasing and decreasing trends, respectively.
CL(1+α) = 0 ± Scrσs,
3. Results
3.1. Temporal Variability of the Standardized Precipitation Index (SPI)
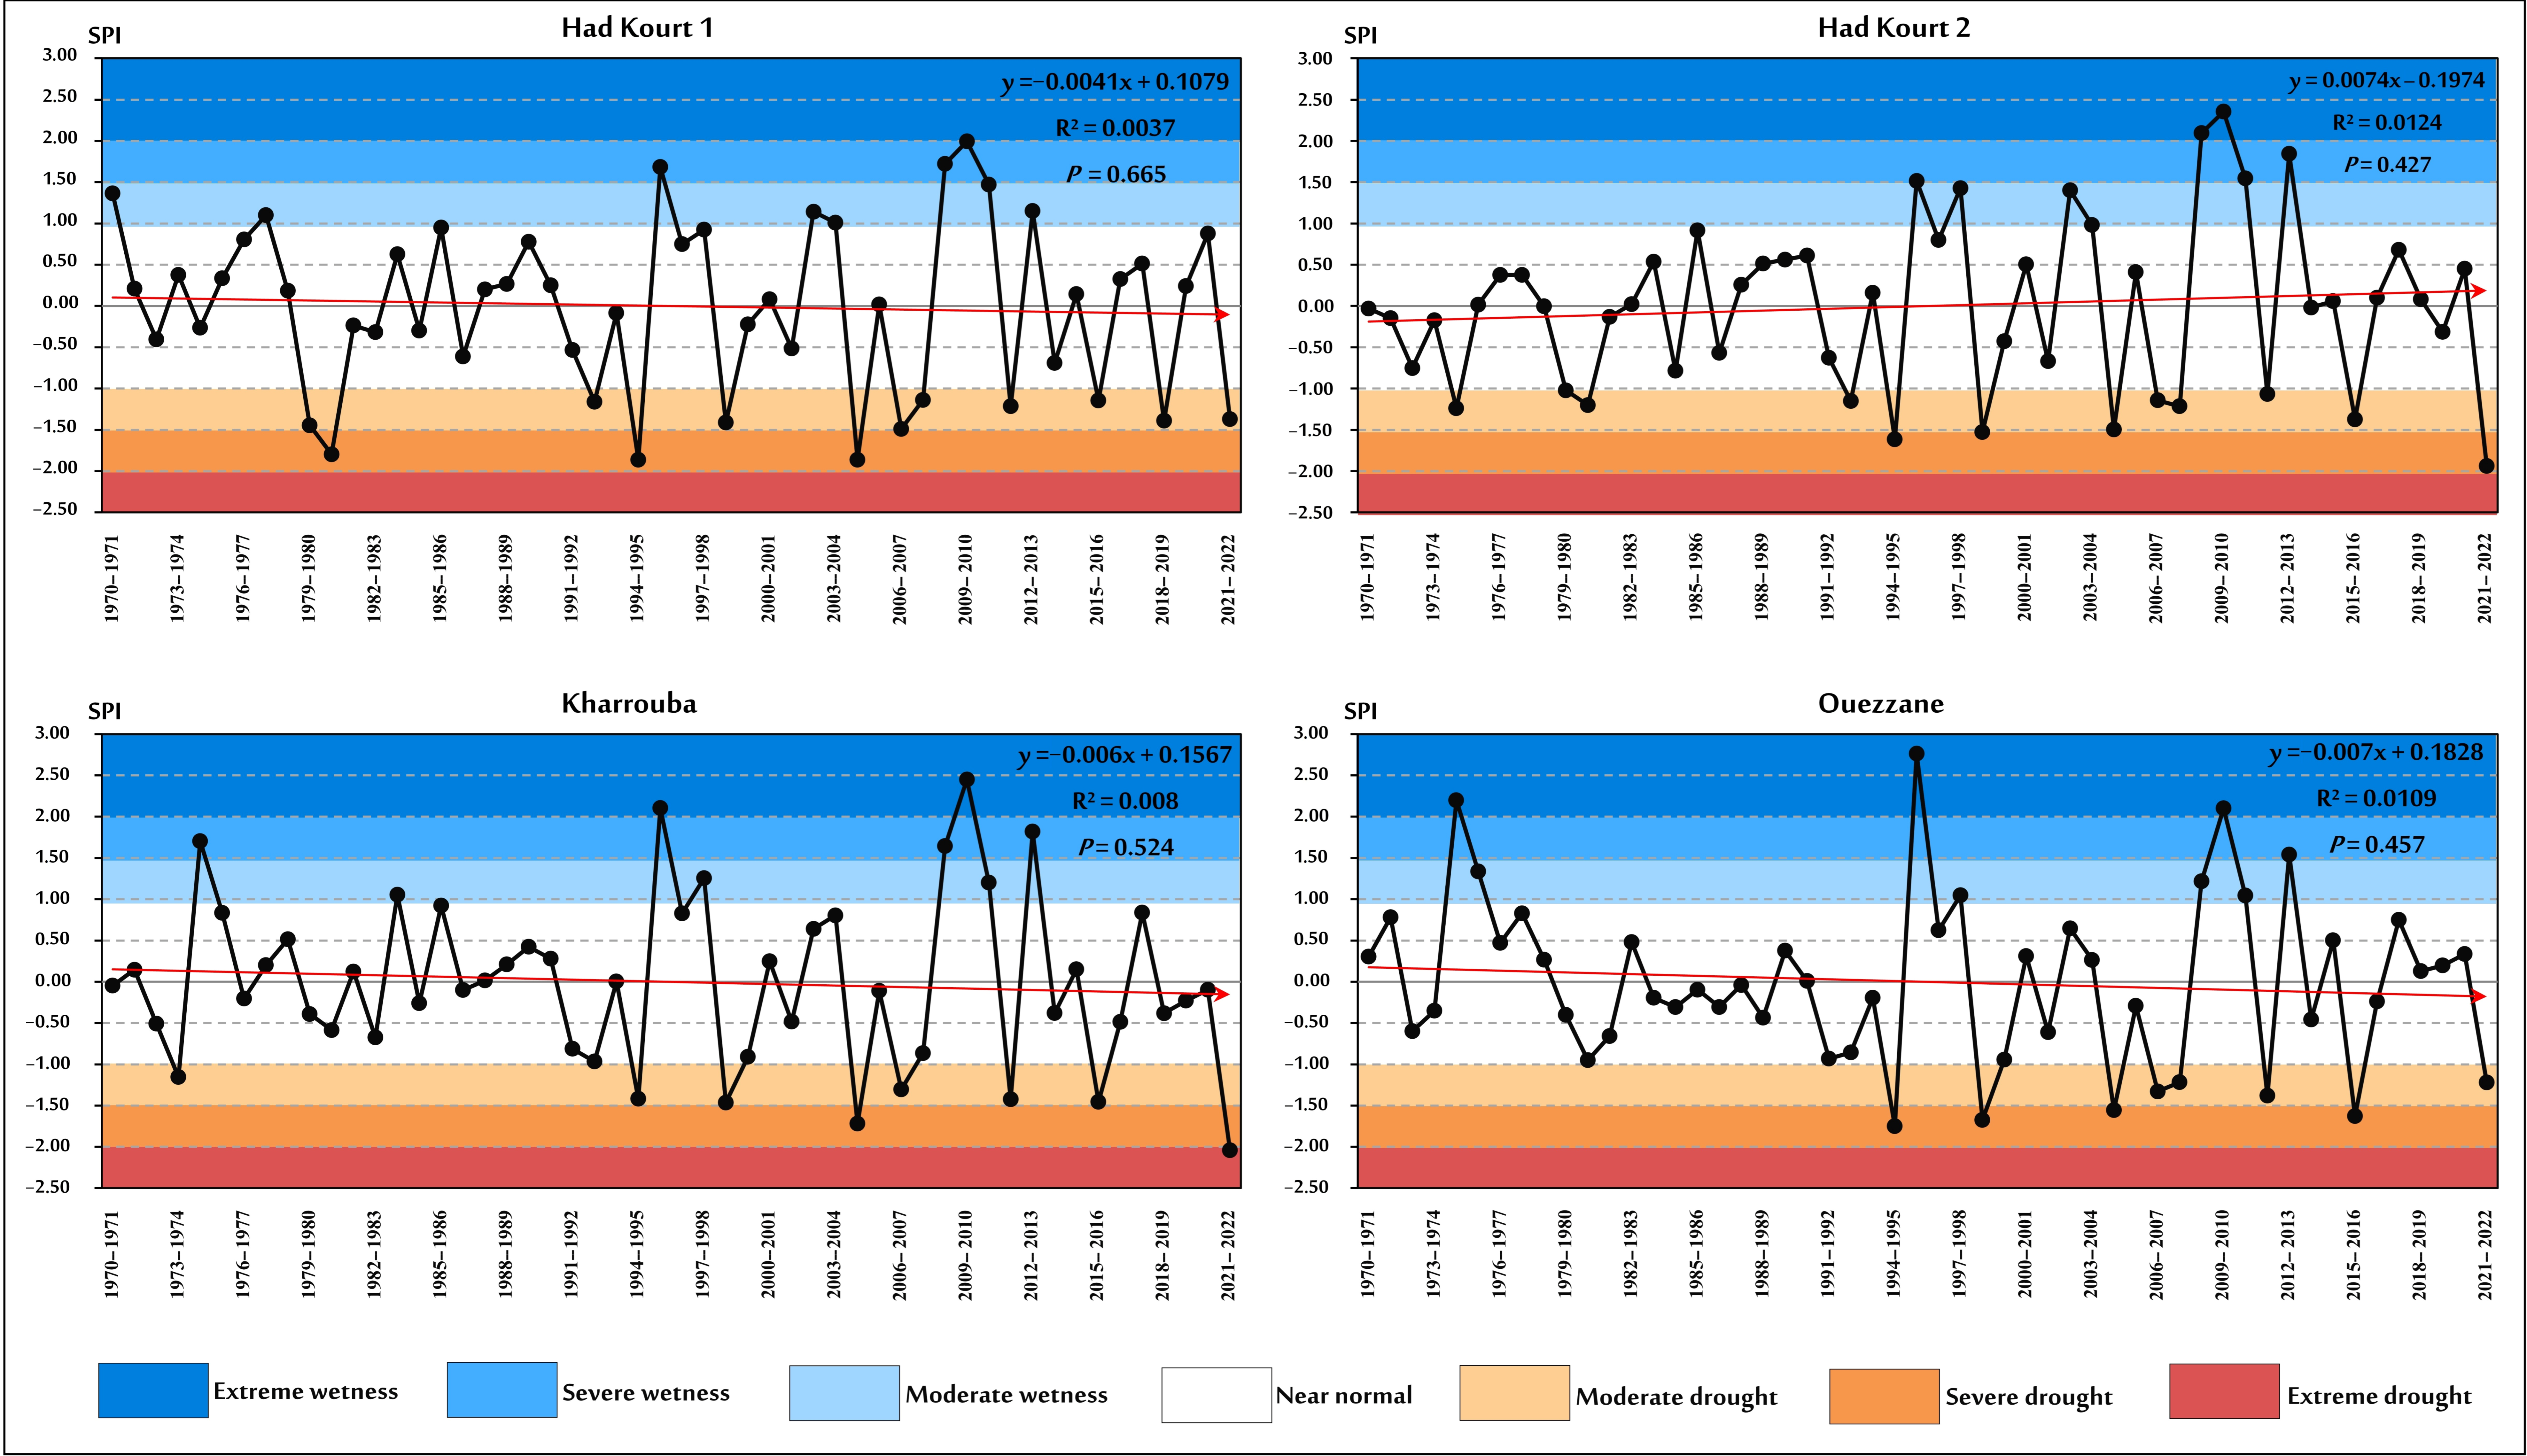
The temporal evolution of the Standardized Precipitation Index (SPI) during the years 1970–2022 reveals a clear alternation between dry and wet conditions across the Oued Rdat Basin (Figure 2). The SPI series from the selected rainfall stations show a high degree of temporal coherence, with similar sequences of positive and negative anomalies observed in both upstream and downstream areas. This suggests that precipitation variability and meteorological drought occurrence are influenced by regional climatic fluctuations affecting the basin.
Figure 2.
Interannual variability of meteorological drought based on SPI during (1970–2022).
Most years were characterized by near-normal conditions, reflecting the predominance of moderate interannual variability in precipitation. However, several distinct drought phases were identified during the study period. Notable dry periods occurred during 1979–1981, 1994–1995, 2004–2008, and 2021–2022, corresponding to recurrent precipitation deficits affecting different parts of the basin. The persistence of negative SPI anomalies during these periods highlights the occurrence of prolonged meteorological drought episodes.
Conversely, the most pronounced wet conditions were observed during years 1995–1996 and 2009–2010, with an additional wet episode occurring in 2012–2013. These periods of above-normal precipitation alternated with drought episodes, highlighting the strong interannual variability of rainfall and the succession of dry and humid conditions in the basin.
The comparison between the upstream and downstream sectors shows that drought and wetness phases generally occurred simultaneously, although the magnitude of SPI anomalies differed between stations. This spatial variability may reflect the influence of local factors, including elevation differences, rainfall distribution patterns, and the position of stations within the basin. Overall, the SPI analysis highlights the recurrent nature of meteorological drought in the Oued Rdat Basin and indicates the regional consistency of precipitation anomalies during the years.
3.2. Interannual Variability of Hydrological Drought Based on the Standardized Stream Flow Index (SSFI) During Years (1970–2022)
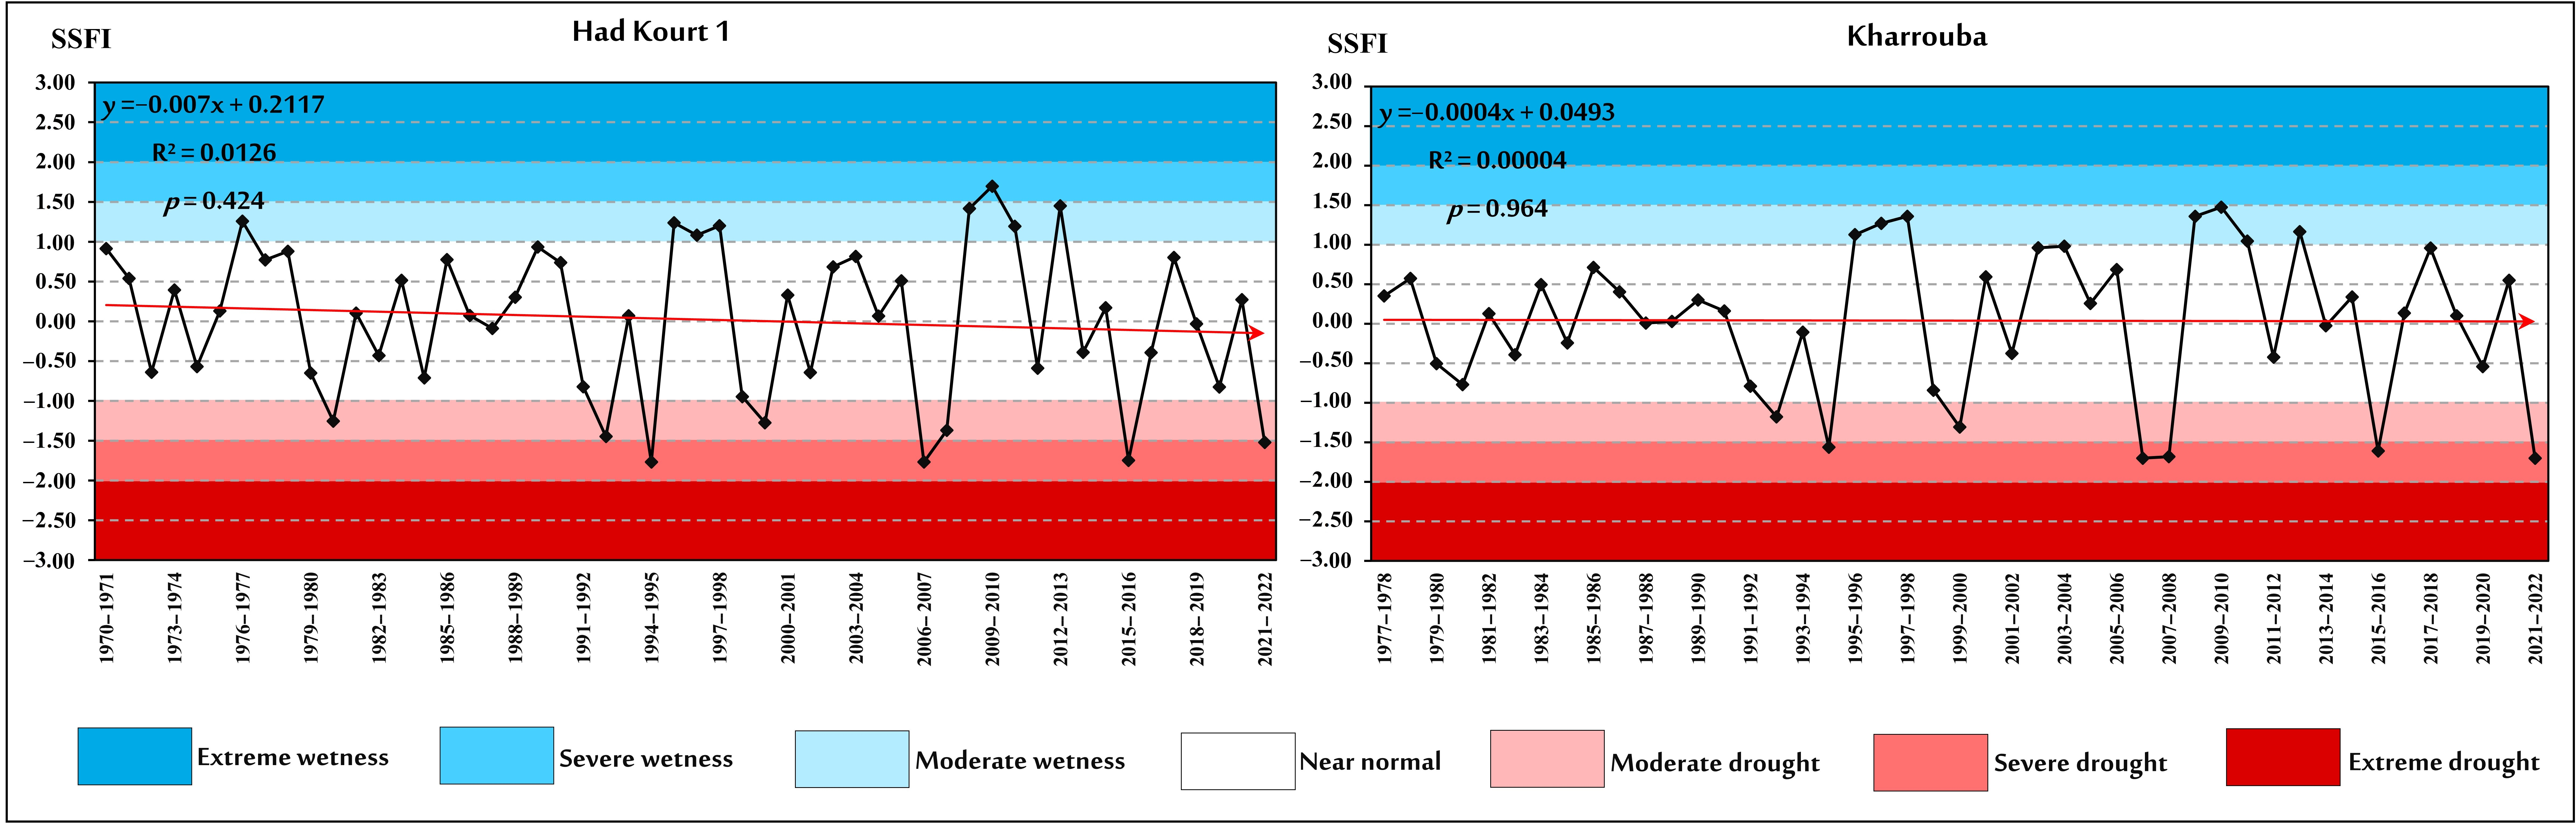
The temporal evolution of the Standardized Stream Flow Index (SSFI) over the 1970–2022 hydrological-year period reveals a marked variability in hydrological conditions across the Oued Rdat Basin (Figure 3). The SSFI series indicates alternating periods of reduced and increased streamflow, reflecting the irregular response of river discharge to climatic fluctuations and hydrological processes within the basin.
Figure 3.
Temporal evolution of hydrological drought based on the Standardized Stream Flow Index (SSFI) over the 1970–2022 hydrological year period.
The comparison between the upstream and downstream hydrological stations shows a generally consistent temporal pattern, although differences in the magnitude of SSFI anomalies are observed. Both stations experienced recurrent periods of negative SSFI values, indicating the occurrence of hydrological drought episodes, interspersed with short periods characterized by above-normal streamflow conditions.
The most notable low-flow periods occurred during hydrological years 1979–1981, 1991–1995, 1998–2002, 2006–2008 and 2015–2022, reflecting persistent reductions in water availability. These drought phases were particularly evident in the lower values of SSFI recorded at both hydrological stations, indicating a temporal correspondence between prolonged precipitation deficits and below-normal streamflow conditions.
Conversely, several high-flow periods were identified, particularly during hydrological years 1995–1998 and 2008–2013, when streamflow conditions became considerably wetter. These episodes correspond to years of enhanced water availability and indicate the occurrence of hydrologically favourable conditions within the basin.
Linear trend analysis of the SSFI series showed weak trends at both stations. At Had Kourt 1, the estimated slope was −0.0070, with R2 = 0.0126 and p = 0.424. At Kharrouba, the slope was −0.0004, with R2 = 0.00004 and p = 0.964. The regression p-values were greater than 0.05 at both stations, indicating that the fitted linear trends were not statistically significant.
The comparison between SSFI and SPI temporal behavior suggests a general agreement between meteorological and hydrological drought variability, with major dry and wet phases occurring during similar periods. However, differences in the intensity and persistence of SSFI anomalies may reflect the influence of basin hydrological characteristics, including runoff generation, storage capacity, and catchment response time. Overall, the SSFI analysis highlights the strong interannual variability of hydrological conditions and confirms the alternation of drought and wet periods in the Oued Rdat Basin.
3.3. Trend Analysis: The Mann–Kendall Test
The Mann–Kendall (MK) test and Sen’s slope estimator were applied to the SPI and SSFI series to assess the direction, magnitude, and statistical significance of temporal trends over the 1970–2022 hydrological year period. The results are presented in Table 3.
Table 3.
Mann–Kendall trend test and Sen’s slope results for SPI and SSFI.
The SPI results indicate weak decreasing tendencies at Had Kourt 1, Kharrouba, and Ouezzane, whereas Had Kourt 2 exhibits a weak increasing tendency. However, none of these trends is statistically significant, as all p-values exceed the 0.05 significance level. The negative Sen’s slopes at Had Kourt 1, Kharrouba, and Ouezzane therefore indicate only a slight tendency toward decreasing SPI values, rather than a statistically significant intensification of meteorological drought. Conversely, the positive slope at Had Kourt 2 indicates a weak tendency toward increasing SPI values.
The linear trend analysis of the SPI series showed weak trends across the four stations. Had Kourt 1 showed a negative slope of −0.0041 (R2 = 0.0037; p = 0.665), whereas Had Kourt 2 showed a positive slope of 0.0074 (R2 = 0.0124; p = 0.427). Kharrouba and Ouezzane showed negative slopes of −0.0060 and −0.0070, respectively, with R2 values of 0.0080 and 0.0109 and corresponding p-values of 0.524 and 0.457. All regression p-values were greater than 0.05, indicating that the fitted linear trends were not statistically significant.
For SSFI, the Mann–Kendall results indicate a weak decreasing tendency at Had Kourt 1 and a very weak increasing tendency at Kharrouba. However, neither trend is statistically significant, with Mann–Kendall p-values of 0.449 and 0.922, respectively. The corresponding Sen’s slope estimates (−0.005 for Had Kourt 1 and +0.0002 for Kharrouba) indicate the direction of the estimated tendencies but provide no statistical evidence of a significant long-term change in hydrological conditions.
Overall, the MK and Sen’s slope results do not provide evidence of a statistically significant long-term trend toward either increasing or decreasing drought conditions in the Oued Rdat Basin. The observed variability in SPI and SSFI therefore appears to be dominated by interannual fluctuations rather than a persistent monotonic trend over the 1970–2022 hydrological-year period. The non-significant p-values indicate that the positive and negative Sen’s slope estimates should be interpreted as the direction of the estimated tendencies rather than as evidence of statistically significant long-term trends.
3.4. Spearman’s Rho Trend Analysis
Spearman’s rank correlation test was applied to the SPI and SSFI series to further assess the direction and statistical significance of monotonic trends during 1970–2022. The results show negative Spearman’s ρ coefficients for SPI at Had Kourt 1, Kharrouba, and Ouezzane, whereas Had Kourt 2 exhibits a positive coefficient. For SSFI, Had Kourt 1 exhibits a weak negative Spearman’s ρ coefficient, whereas Kharrouba shows a weak positive coefficient. However, all corresponding p-values were greater than 0.05, indicating that the null hypothesis of no monotonic trend could not be rejected at the 5% significance level. Therefore, the positive and negative correlation coefficients indicate only the direction of the estimated monotonic tendency and do not provide sufficient statistical evidence to conclude that significant monotonic trends occurred during the study period.
Overall, Spearman’s Rho results indicate that neither the SPI nor SSFI series exhibits a statistically significant monotonic trend over 1970–2022. The negative and positive coefficients describe the direction of the estimated tendencies, while the associated p-values indicate that these tendencies are not statistically significant at the 5% level. These findings are consistent with the Mann–Kendall results and support the interpretation that the observed drought variability is primarily characterized by interannual fluctuations rather than a statistically significant persistent monotonic change. (Table 4)
Table 4.
Spearman’s Rho trend test results for SPI and SSFI.
3.5. Innovative Trend Analysis (ITA)
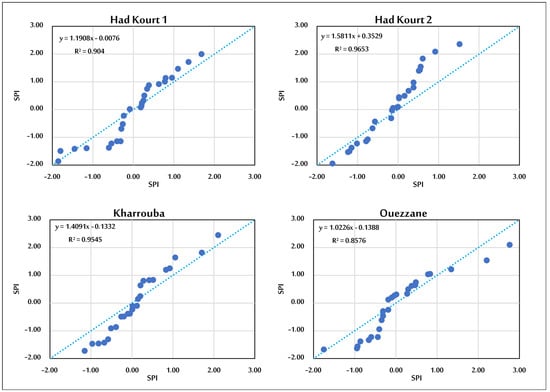
The Innovative Trend Analysis (ITA) method was applied to the SPI and SSFI series to complement the Mann–Kendall and Spearman’s Rho tests and to identify possible changes across different portions of the distributions. Following the graphical ITA approach, the ordered values of the first half of each year series were plotted against those of the second half, with the 1:1 line used as a reference for trend interpretation (Figure 4). This approach allows increasing and decreasing tendencies to be identified across low, medium, and high values rather than considering only a single overall monotonic trend.
Figure 4.
Graphical Innovative Trend Analysis (ITA) of SPI.
The graphical ITA results for SPI indicate a predominantly decreasing tendency across the basin, particularly for the lower and middle portions of the SPI distribution (Figure 4). This pattern is more evident at the upstream stations, whereas the downstream stations show weaker and more heterogeneous behavior, including a slight increasing tendency at Had Kourt 2. The results therefore suggest that changes in precipitation-related drought conditions are not uniform across the basin and may vary according to the position within the SPI distribution.
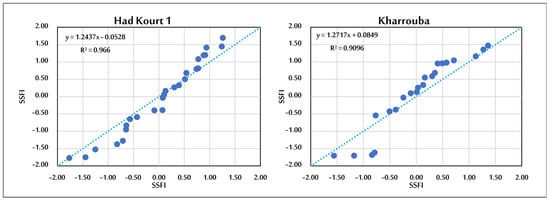
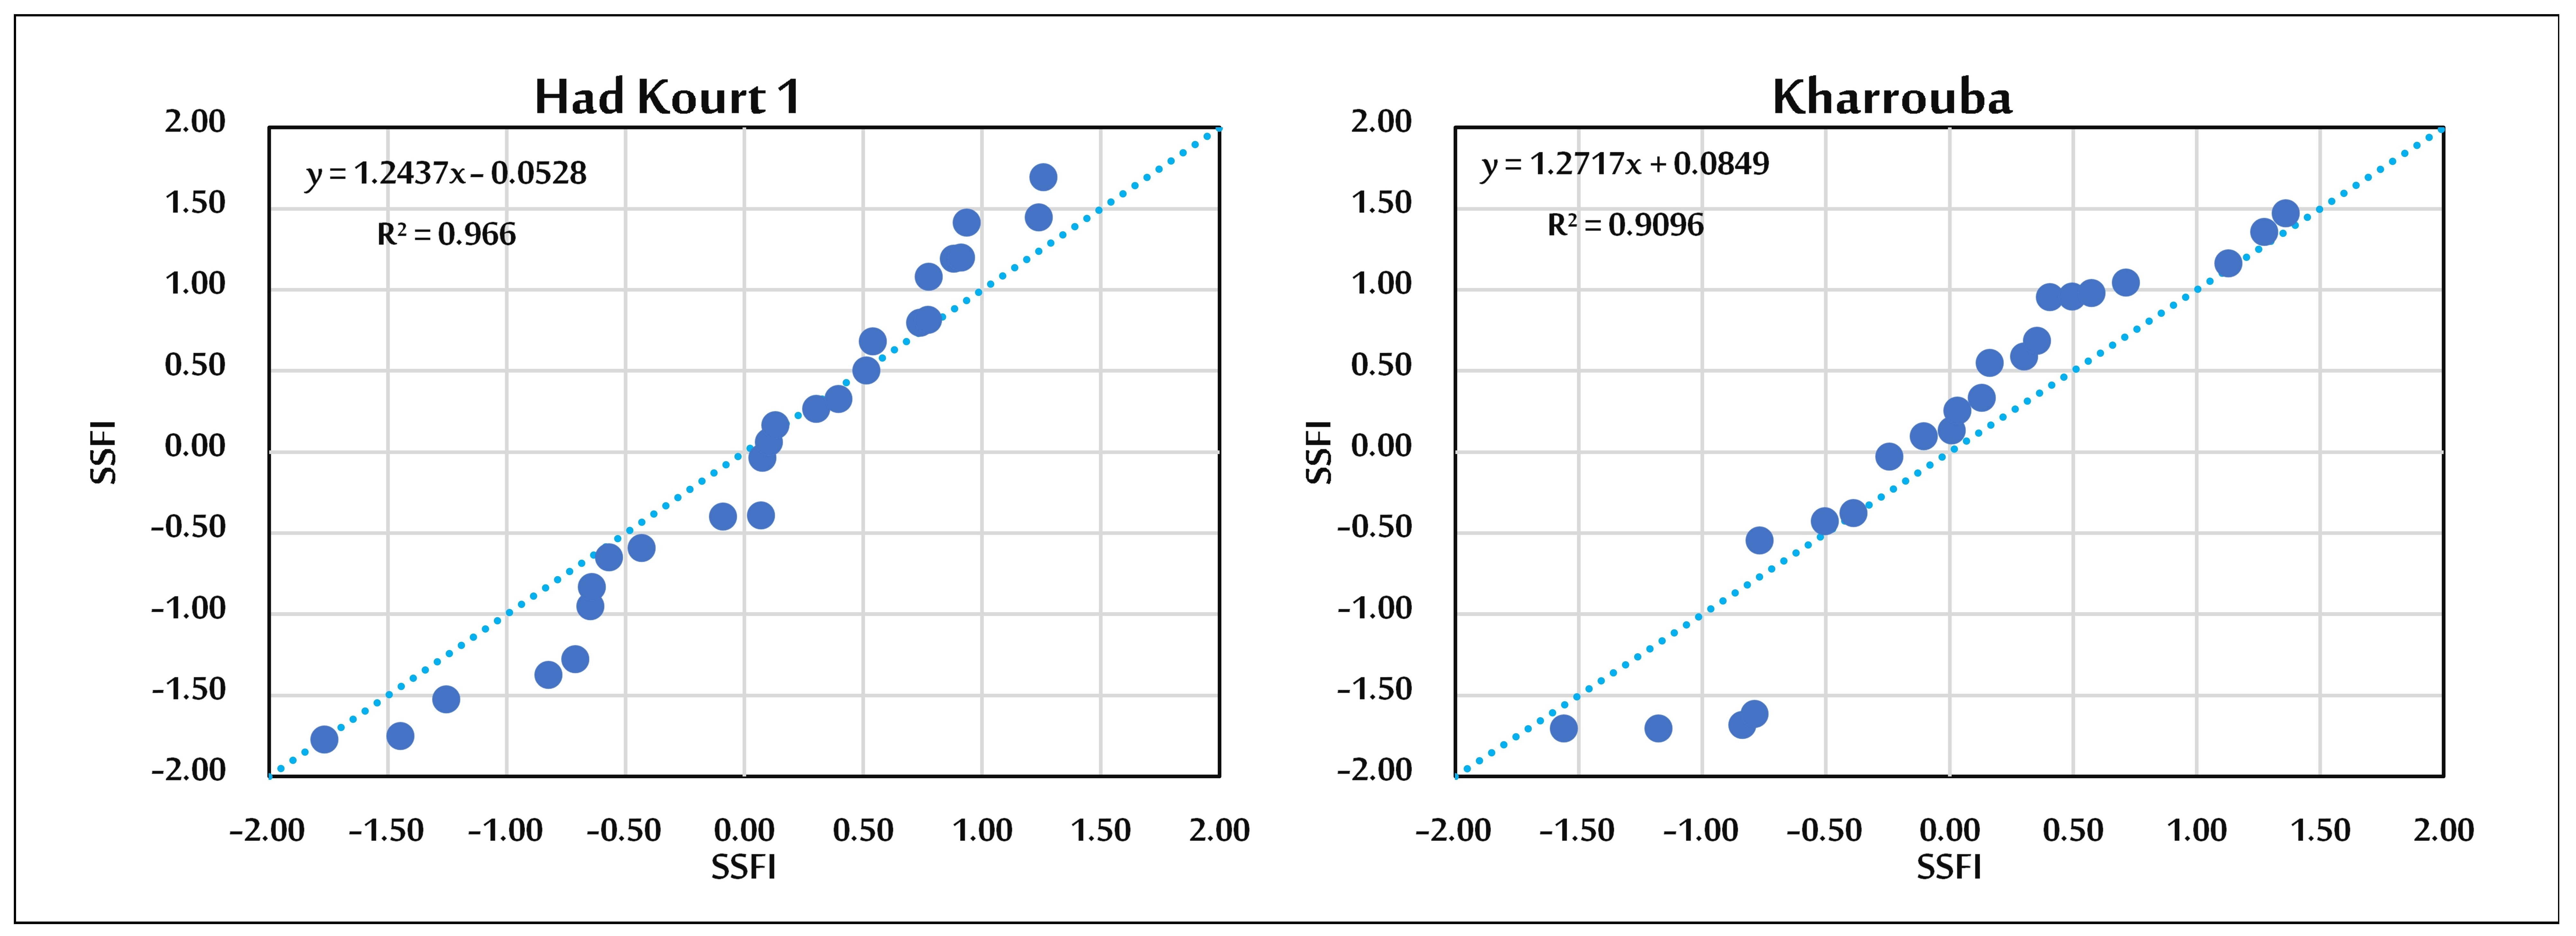
For SSFI, the ITA results show different tendencies between the two hydrometric stations (Figure 5). At Had Kourt 1, the graphical ITA indicates a predominantly decreasing tendency, particularly across the lower and middle portions of the SSFI distribution. This pattern may indicate a tendency toward lower streamflow conditions within these portions of the distribution. In contrast, Kharrouba shows a predominantly increasing tendency, especially across the middle and higher portions of the distribution. The increasing tendency in the higher portion may indicate changes in relatively wet or high-flow hydrological conditions, whereas the behavior of the middle portion reflects changes in more typical streamflow conditions. These distribution-dependent patterns suggest that changes in hydrological variability are not uniform across the full range of SSFI values and may differ according to both station location and hydrological condition.
Figure 5.
Graphical Innovative Trend Analysis (ITA) of SSFI.
The statistical evaluation of ITA is presented in Table 5. The results show that the ITA trend is statistically non-significant for SPI at all stations and for SSFI at Had Kourt 1. In contrast, the SSFI series at Kharrouba is identified as statistically significant at the 95% confidence level, with an increasing tendency. This result indicates a statistically significant distribution-dependent increasing tendency in the SSFI series at Kharrouba that is not detected by the overall Mann–Kendall and Spearman’s Rho tests. The contrast between the ITA and conventional monotonic trend tests suggests that changes in hydrological conditions may occur within specific portions of the SSFI distribution even when the overall monotonic trend remains statistically non-significant.
Table 5.
Statistical evaluation of Innovative Trend Analysis (ITA).
4. Discussion
The results obtained for the Oued Rdat Basin indicate a highly variable hydroclimatic regime characterized by recurrent alternation between dry and wet years and by differences in streamflow variability associated with precipitation fluctuations. Such behavior is consistent with the multidimensional nature of drought, which is not only defined by precipitation deficits but also by their persistence, temporal scale, and propagation through the hydrological system [1,2,10,17]. The SPI series exhibits marked interannual fluctuations, with recurrent dry episodes alternating with wetter periods, rather than a simple and continuous shift toward increasingly dry conditions. This temporal variability agrees with previous studies conducted in Morocco, which have highlighted substantial spatial and temporal variability in precipitation regimes and significant differences in observed climate trends across the country [6,7]. At the Mediterranean scale, drought assessment remains challenging due to strong precipitation variability and the influence of regional hydroclimatic processes, which can generate complex temporal patterns and obscure persistent drought signals [4]. Therefore, the alternation between dry and wet years observed in the Oued Rdat Basin emphasizes the importance of long-term standardized drought indices for characterizing hydroclimatic variability and assessing changes in water availability.
The comparison between SPI and SSFI indicates that precipitation anomalies are transferred into the hydrological system, although the response is not necessarily immediate or proportional. Streamflow integrates the combined effects of precipitation variability, antecedent moisture conditions, catchment storage, groundwater contributions, evapotranspiration and runoff-generation processes [10,17]. Consequently, identical precipitation anomalies may produce different hydrological responses depending on the initial state of the catchment. This behavior reflects the concept of drought propagation, in which meteorological drought conditions progressively affect soil moisture, water availability and eventually streamflow regimes [16,17]. Previous studies in Moroccan basins have demonstrated that the transition from meteorological to hydrological drought depends strongly on basin characteristics and hydrological memory rather than precipitation deficits alone [18,19,20]. Therefore, differences between SPI and SSFI may reflect hydrological filtering and propagation processes rather than inconsistencies between the two indicators.
The spatial variability observed between the upper and lower parts of the Oued Rdat Basin further highlights the influence of catchment characteristics on drought response. Although both stations are subjected to the same regional climatic forcing, differences in precipitation distribution, topography, drainage organization, storage capacity and land-surface conditions may modify the magnitude and timing of hydrological responses [4,19]. The upper basin tends to reflect more directly local climatic variability, whereas the lower basin integrates upstream contributions and therefore represents the cumulative effect of hydrological processes occurring throughout the drainage network. Such spatial differences are particularly important for interpreting SSFI because hydrological drought represents an integrated catchment response rather than a direct atmospheric signal [10,17]. In addition, documented land-use and vegetation-cover changes within the Oued Rdat Basin [22,23] may influence infiltration, evapotranspiration, runoff generation and soil-water storage, potentially modifying the relationship between precipitation and streamflow.
Changes in land use and vegetation cover may modify the hydrological response of the basin by altering infiltration capacity, surface runoff generation, and soil-water storage. A reduction in vegetation cover may decrease interception and soil protection, potentially increasing surface runoff and reducing effective infiltration, whereas changes in cultivated or sparsely vegetated areas may modify soil moisture dynamics and runoff generation. These changes can therefore influence the transformation of precipitation anomalies into streamflow variability and contribute to differences between SPI and SSFI responses.
The Mann–Kendall and Spearman’s Rho results indicate that the observed variability does not correspond to a statistically significant monotonic trend in the investigated series. The weak directional tendencies identified by these tests should therefore be interpreted as temporal fluctuations rather than as evidence of a persistent long-term increase or decrease in drought conditions. This interpretation is consistent with previous assessments of Moroccan climate trends, which have reported strong spatial and seasonal variability rather than a uniform country-wide evolution [6,7]. Moreover, the absence of significant monotonic trends does not exclude the occurrence of important drought episodes, as changes in variability and extreme events may occur without producing a significant trend in the mean behavior of the series [4].
The differences observed between ITA and conventional trend tests (Mann–Kendall and Spearman’s Rho) do not represent contradictory results but rather reflect the different statistical principles of these approaches. Mann–Kendall and Spearman’s Rho evaluate the overall monotonic behavior of the time series, whereas ITA examines changes occurring within different portions of the data distribution by comparing lower, medium and higher values separately. Consequently, ITA may identify increasing or decreasing tendencies in specific ranges of the distribution even when the overall monotonic trend remains statistically insignificant. The ITA results therefore provide complementary information by revealing distributional changes that may not be detected by conventional monotonic trend tests. This approach is particularly relevant for drought analysis because variations in extreme dry or wet conditions can have important environmental and water-resource implications even in the absence of a significant overall trend. The combined interpretation of MK, Spearman’s Rho and ITA suggests that the hydroclimatic behavior of the Oued Rdat Basin is better characterized by interannual variability and changes within the distribution of drought conditions rather than by a simple linear evolution.
For the SSFI series, the distribution-dependent tendencies identified by ITA suggest that changes in relatively wet and typical hydrological conditions may differ from those affecting lower-flow conditions. However, the statistical significance of the ITA result at Kharrouba indicates that this distribution-dependent pattern should be considered alongside the non-significant overall monotonic trends identified by the Mann–Kendall and Spearman’s Rho tests.
From a water-resource and agricultural perspective, the results demonstrate that the absence of a significant monotonic trend does not necessarily imply a low drought risk. Recurrent dry years and the propagation of precipitation deficits into streamflow may still generate considerable impacts on water availability. The combined use of SPI and SSFI provides complementary information, with SPI representing atmospheric drought conditions and SSFI describing the hydrological expression of these anomalies after interaction with catchment processes [14,16,17]. This integrated approach is particularly important in the Oued Rdat Basin because climatic variability interacts with land-use and vegetation-cover changes [22,23], potentially affecting the transformation of precipitation anomalies into hydrological responses.
Overall, the findings indicate that drought dynamics in the Oued Rdat Basin are influenced by the interaction between precipitation variability, hydrological propagation and spatially heterogeneous catchment responses. The results support the consideration of drought as a multidimensional hydroclimatic hazard whose characteristics depend on the selected indicator, temporal scale and basin context [1,2,4]. The combined application of SPI, SSFI, Mann–Kendall, Spearman’s Rho and ITA provides a more comprehensive assessment of drought variability than the use of a single indicator or trend method.
This study has some limitations that should be considered when interpreting the results. First, the analysis relies on four rainfall stations and two hydrometric stations, which provide valuable long-term observations but represent point-based measurements within the Oued Rdat Basin. Consequently, the available monitoring network may not fully capture the spatial heterogeneity of precipitation and hydrological drought across the entire basin. Second, the analysis focuses primarily on precipitation and streamflow indices and does not explicitly incorporate evapotranspiration, soil moisture, or groundwater dynamics. The absence of these variables limits the ability to fully explain the differences between meteorological and hydrological drought responses, since streamflow is influenced by atmospheric water demand, soil-moisture conditions, groundwater contributions, and catchment storage. In addition, the available streamflow records may not fully capture the contribution of individual catchment processes to the observed hydrological variability. These limitations should be considered when interpreting the spatial and temporal patterns identified in this study and when extending the findings to other locations or broader hydroclimatic conditions.
Future studies incorporating evapotranspiration, soil moisture, groundwater storage and land-use dynamics would further improve the understanding of the relative contribution of climatic and catchment processes to drought variability and enhance assessments of future water-resource vulnerability under climate change [3,4,8,9].
5. Conclusions
This study provides an integrated assessment of meteorological and hydrological drought variability in the Oued Rdat Basin, Morocco, over the 1970–2022 hydrological-year period using the Standardized Precipitation Index (SPI), the Standardized Stream Flow Index (SSFI), and complementary trend-analysis methods. The results show pronounced interannual variability, characterized by recurrent alternation between dry and wet periods, rather than a statistically significant persistent monotonic trend in the conventional trend tests.
The SPI analysis indicates substantial temporal variability in precipitation conditions across the basin, with both decreasing and increasing tendencies depending on the station. However, the Mann–Kendall and Spearman’s Rho tests did not identify statistically significant monotonic trends at the 5% significance level. Similarly, the SSFI series showed contrasting tendencies between Had Kourt 1 and Kharrouba, but the corresponding Mann–Kendall and Spearman’s Rho results were not statistically significant. These findings indicate that the observed drought variability is dominated by interannual fluctuations rather than by a statistically significant long-term monotonic change.
The Innovative Trend Analysis provided complementary information by identifying distribution-dependent patterns that are not necessarily captured by conventional monotonic tests. In particular, the SSFI series at Kharrouba showed a statistically significant increasing tendency according to the ITA analysis, whereas the overall Mann–Kendall and Spearman’s Rho tests remained non-significant. This result suggests that changes may occur within specific portions of the hydrological drought distribution without producing a significant overall monotonic trend. The comparison between SPI and SSFI also indicates that meteorological and hydrological drought variability do not necessarily evolve with the same magnitude or persistence, which may reflect the influence of catchment characteristics, storage processes, antecedent conditions, and land-surface conditions.
From a water-resource perspective, the recurrent occurrence of dry periods remains relevant for agricultural activities and water management despite the absence of a significant long-term monotonic trend in the conventional tests. The combined use of SPI and SSFI therefore provides complementary information on atmospheric and hydrological drought conditions and can contribute to improved drought monitoring and water-resource planning in the basin.
The interpretation of these results is subject to several limitations. The analysis relies on four rainfall stations and two hydrometric stations, which provide valuable long-term observations but represent point-based measurements and may not fully capture the spatial heterogeneity of drought across the basin. In addition, evapotranspiration, soil moisture, and groundwater dynamics were not explicitly incorporated into the analysis, limiting the ability to fully explain the mechanisms governing drought propagation and differences between SPI and SSFI. Future studies incorporating these variables, together with land-use and vegetation dynamics, could provide a more complete understanding of drought processes and improve assessments of water-resource vulnerability under changing hydroclimatic conditions.
Author Contributions
L.B.: Conceptualization, methodology, data curation, formal analysis, investigation, visualization, writing—original draft, writing—review and editing. T.-d.R.: Methodology, data curation, formal analysis, investigation, visualization, writing—original draft, writing—review and editing. A.M.: Conceptualization, methodology, supervision, project administration, interpretation of the findings, writing—review and editing. M.A.: Conceptualization, methodology, supervision, environmental interpretation, validation, writing—review and editing. R.N.: Statistical analysis, methodology, model validation, interpretation and discussion of the findings, writing—original draft, writing—review and editing. M.E.: Supervision and Funding acquisition. All authors have read and agreed to the published version of the manuscript.
Funding
This research received no external funding.
Institutional Review Board Statement
Not applicable.
Informed Consent Statement
Not applicable. The manuscript does not contain any individual person’s identifiable data, images, or personal information requiring consent for publication.
Data Availability Statement
The datasets generated and analyzed during the current study are available from the corresponding author upon reasonable request. Individual participant responses are not publicly available to protect participant confidentiality and privacy.
Acknowledgments
I would like to express my sincere gratitude to the Sebou Hydraulic Basin Agency (ABHS) and the National Office of Agricultural Advisory Services (ONCA) for providing the precipitation and streamflow data used in this study. I also extend my appreciation to the anonymous reviewers for their valuable and constructive comments, which contributed to improving the quality of this manuscript.
Conflicts of Interest
The authors declare that they have no known competing financial interests or personal relationships that could have appeared to influence the work reported in this manuscript.
References
- Wilhite, D.A. Drought as a Natural Hazard: Concepts and Definitions. In Drought: A Global Assessment; Wilhite, D.A., Ed.; Routledge: London, UK, 2000; pp. 3–18. [Google Scholar]
- Mishra, A.K.; Singh, V.P. A review of drought concepts. J. Hydrol. 2010, 391, 202–216. [Google Scholar] [CrossRef] [Scilit]
- Dai, A. Increasing drought under global warming in observations and models. Nat. Clim. Change 2013, 3, 52–58. [Google Scholar] [CrossRef] [Scilit]
- Tramblay, Y.; Koutroulis, A.; Samaniego, L.; Vicente-Serrano, S.M.; Volaire, F.; Boone, A.; Le Page, M.; Llasat, M.C.; Albergel, C.; Burak, S.; et al. Challenges for drought assessment in the Mediterranean region under future climate scenarios. Earth-Sci. Rev. 2020, 210, 103348. [Google Scholar] [CrossRef] [Scilit]
- Vicente-Serrano, S.M.; Beguería, S.; López-Moreno, J.I. A multiscalar drought index sensitive to global warming: The Standardized Precipitation Evapotranspiration Index. J. Clim. 2010, 23, 1696–1718. [Google Scholar] [CrossRef] [Scilit]
- Sebbar, A.; Badri, W.; Fougrach, H.; Hsaine, M.; Saloui, A. Étude de la variabilité du régime pluviométrique au Maroc septentrional (1935–2004). Sécheresse 2011, 22, 139–148. [Google Scholar]
- Driouech, F.; Stafi, H.; Khouakhi, A.; Moutia, S.; Badi, W.; El Rhaz, K.; Chehbouni, A. Recent observed country-wide climate trends in Morocco. Int. J. Climatol. 2021, 41, E855–E874. [Google Scholar] [CrossRef] [Scilit]
- Hssaisoune, M.; Bouchaou, L.; Sifeddine, A.; Bouimetarhan, I.; Chehbouni, A. Moroccan groundwater resources and evolution with global climate changes. Geosciences 2020, 10, 81. [Google Scholar] [CrossRef] [Scilit]
- Schilling, J.; Freier, K.P.; Hertig, E.; Scheffran, J. Climate change, vulnerability and adaptation in North Africa with focus on Morocco. Agric. Ecosyst. Environ. 2012, 156, 12–26. [Google Scholar] [CrossRef] [Scilit]
- Tallaksen, L.M.; Van Lanen, H.A.J. Hydrological Drought: Processes and Estimation Methods for Streamflow and Groundwater; Elsevier: Amsterdam, The Netherlands, 2004. [Google Scholar]
- McKee, T.B.; Doesken, N.J.; Kleist, J. The relationship of drought frequency and duration to time scales. In Proceedings of the 8th Conference on Applied Climatology, Anaheim, CA, USA, 17–22 January 1993; pp. 179–184. [Google Scholar]
- McKee, T.B.; Doesken, N.J.; Kleist, J. Drought monitoring with multiple time scales. In Proceedings of the 9th Conference on Applied Climatology, Dallas, TX, USA, 15–20 January 1995; pp. 233–236. [Google Scholar]
- Guttman, N.B. Accepting the Standardized Precipitation Index: A calculation algorithm. JAWRA J. Am. Water Resour. Assoc. 1999, 35, 311–322. [Google Scholar] [CrossRef] [Scilit]
- Shukla, S.; Wood, A.W. Use of a standardized runoff index for characterizing hydrologic drought. Geophys. Res. Lett. 2008, 35, L02405. [Google Scholar] [CrossRef] [Scilit]
- Modarres, R. Streamflow drought time series forecasting. Stoch. Environ. Res. Risk Assess. 2007, 21, 223–233. [Google Scholar] [CrossRef] [Scilit]
- Wang, W.; Ertsen, M.W.; Svoboda, M.D.; Hafeez, M. Propagation of drought: From meteorological drought to agricultural and hydrological drought. Adv. Meteorol. 2016, 2016, 6547209. [Google Scholar] [CrossRef] [Scilit]
- Van Loon, A.F. Hydrological drought explained. WIREs Water 2015, 2, 359–392. [Google Scholar] [CrossRef] [Scilit]
- Boudad, B.; Sahbi, H.; Manssouri, I. Analysis of meteorological and hydrological drought based in SPI and SDI index in the Inaouen Basin (Northern Morocco). J. Mater. Environ. Sci. 2018, 9, 219–227. [Google Scholar] [CrossRef] [Scilit]
- Zkhiri, W.; Tramblay, Y.; Hanich, L.; Jarlan, L.; Ruelland, D. Spatiotemporal characterization of current and future droughts in the High Atlas basins (Morocco). Theor. Appl. Climatol. 2019, 135, 593–605. [Google Scholar] [CrossRef] [Scilit]
- Houmma, I.H.; Hadri, A.; Boudhar, A.; Karaoui, I.; Oussaoui, S.; El Khalki, E.M.; Chehbouni, A.; Kinnard, C. Analysis of the propagation characteristics of meteorological drought to hydrological drought and their joint effects on low-flow drought variability in the Oum Er Rbia watershed, Morocco. Remote Sens. 2025, 17, 281. [Google Scholar] [CrossRef] [Scilit]
- Kessabi, R.; Hanchane, M.; Krakauer, N.Y.; Belmahi, M. Assessment of the rainfall trend effect on meteorological and hydrological drought in the Upper Sebou Basin, Morocco. Climate 2026, 14, 118. [Google Scholar] [CrossRef] [Scilit]
- Belhak, L.; Rahmani, T.; Nmiss, M.; Essami, A. Multi-decadal Land Use and Land Cover Change Detection Using Landsat Time Series in the Wadi Rdat Basin, Morocco. Pesqui. Geociênc. 2026, 53. [Google Scholar] [CrossRef]
- Rahmani, T.; Belhak, L.; Fertahi, A.; Ezoubair, M. Bi-temporal assessment of vegetation-cover change using Landsat modified soil adjusted vegetation index (1984–2022): The Oued Rdat Basin, Morocco. Ecol. Eng. Environ. Technol. 2026, 27, 470–481. [Google Scholar] [CrossRef] [Scilit]
- Edwards, D.C.; McKee, T.B. Characteristics of 20th Century Drought in the United States at Multiple Time Scales; Atmospheric Science Paper No. 634; Colorado State University: Fort Collins, CO, USA, 1997. [Google Scholar]
- World Meteorological Organization (WMO). Standardized Precipitation Index User Guide; WMO-No. 1090; World Meteorological Organization: Geneva, Switzerland, 2012. [Google Scholar]
- Svensson, C.; Hannaford, J.; Prosdocimi, I. Statistical distributions for monthly aggregations of precipitation and streamflow in drought indicator applications. Water Resour. Res. 2017, 53, 99–1018. [Google Scholar] [CrossRef] [Scilit]
- Tijdeman, E.; Stahl, K.; Tallaksen, L.M. Drought characteristics derived based on the Standardized Streamflow Index: A large sample comparison for parametric and nonparametric methods. Water Resour. Res. 2020, 56, e2019WR026315. [Google Scholar] [CrossRef] [Scilit]
- Mann, H.B. Nonparametric tests against trend. Econometrica 1945, 13, 245–259. [Google Scholar] [CrossRef] [Scilit]
- Kendall, M.G. Rank Correlation Methods, 4th ed.; Griffin: London, UK, 1975. [Google Scholar]
- Sen, P.K. Estimates of the regression coefficient based on Kendall’s tau. J. Am. Stat. Assoc. 1968, 63, 1379–1389. [Google Scholar] [CrossRef]
- Spearman, C. The proof and measurement of association between two things. Am. J. Psychol. 1904, 15, 72–101. [Google Scholar] [CrossRef] [Scilit] [PubMed]
- Şen, Z. Innovative Trend Analysis Methodology. J. Hydrol. Eng. 2012, 17, 1042–1046. [Google Scholar] [CrossRef] [Scilit]
- Şen, Z. Innovative Trend Significance Test and Applications. Theor. Appl. Climatol. 2017, 127, 939–947. [Google Scholar] [CrossRef] [Scilit]

Disclaimer/Publisher’s Note: The statements, opinions and data contained in all publications are solely those of the individual author(s) and contributor(s) and not of MDPI and/or the editor(s). MDPI and/or the editor(s) disclaim responsibility for any injury to people or property resulting from any ideas, methods, instructions or products referred to in the content. |
© 2026 by the authors. Licensee MDPI, Basel, Switzerland. This article is an open access article distributed under the terms and conditions of the Creative Commons Attribution (CC BY) license.