


Abstract
River basins constitute a suitable natural territorial unit for the integrated management of natural resources. The El Fuerte River basin (EFRB) in northwestern Mexico is located on the western slope of the Sierra Madre Occidental. Its importance lies in its contribution to irrigation systems in the state of Sinaloa and to hydroelectric power generation, as well as its strong dependence on seasonal precipitation associated with the North American Monsoon (NAM). A reduction in NAM precipitation has been observed in northwestern Mexico. Using CHIRPS precipitation data and ERA5 reanalysis, we analyzed the relationship between precipitation trends and the variability of the Normalized Difference Vegetation Index (NDVI) in the El Fuerte River basin for the 2000–2025 period. Land vegetation cover in EFRB is dominated by Tropical Dry Forest (TDF). The results indicate that the TDF responds directly to precipitation conditions during both the dry and wet seasons. The exceptional drought and a cold wave in 2011 disrupted NDVI values in EFRB, causing an increase in greenness during the post-disturbance recovery period associated with a shift in the basin’s vegetation composition. The decline in NAM precipitation may be linked to multiple factors, including reduced moisture transport due to weakened low-level zonal winds and changes in land vegetation cover. The effects of these changes in precipitation trends and recurrent droughts could drive further changes in vegetation structure, thereby altering the basin’s hydrological cycle.
1. Introduction
River basins constitute a natural territorial unit appropriate for the integrated management of natural resources. Their eco-hydrological functioning relies on a dynamic equilibrium resulting from the complex interaction between biophysical components and human activities. Adopting a basin-scale perspective facilitates an understanding of the hydrological cycle [1], enables the identification and quantification of cumulative impacts from anthropogenic effluents and waste, such as sediments, nutrients, and pollutants throughout the drainage network. These ecological alterations directly affect water quantity and quality, the adaptive capacity of ecosystems, and the well-being of local populations [2]. Consequently, the river basin is recognized as the fundamental spatial unit for land-use planning, water resource management, and the implementation of climate change adaptation strategies [3].
One of the main impacts of climate change are evident in water resource dynamics. Projected changes in temperature and precipitation patterns are expected to affect water availability for human consumption and productive activities, while also increasing the frequency and intensity of extreme climate events such as droughts and floods [2]. The changes in water availability stem not simply from climate variability or physical scarcity, but primarily from governance deficiencies and inefficient resource management amid rapid population and industrial growth [4,5]. This scenario is further exacerbated by land-use and land-cover changes [6], a critical process governed by variables that interact across spatial and temporal scales [7]. Natural drivers of ecological succession include climatic variations, extreme temperatures, and tropical cyclones, whereas anthropogenic factors are primarily driven by demographic, social, and economic dynamics [8].
A representative example of this interaction is found in the El Fuerte River Basin (EFRB) in northwestern Mexico, a region crucial for supplying water to irrigation systems in the state of Sinaloa. Its hydrological dynamics rely heavily on seasonal precipitation, primarily associated with the North American Monsoon (NAM) [9,10,11,12] and the occurrence of tropical cyclone activity [13], and daily maximum precipitation [14]. This marked seasonality renders the basin highly sensitive to drought episodes, which are intensified when rainfall deficits coincide with elevated temperatures. During such events, reduced surface runoff and reservoir depletion disrupt both riparian ecosystems—affecting tropical dry forests (TDF) and adjacent aquatic habitats due to baseflow loss—and hillside ecosystems, where water stress in mountain plant communities reduces soil infiltration and compromises vegetation stability on steeper slopes [4]. Within the EFRB, annual storage levels in its three main reservoirs—Miguel Hidalgo y Costilla, Josefa Ortiz de Domínguez, and Luis Donaldo Colosio—have exhibited a downward trend over the past decade, with average annual reductions of 5.4%, 6.5%, and 7.5% respectively. In recent years, recurrent drought in northwestern Mexico has severely impacted regional water reserves and agricultural production, maintaining these reservoirs at critical levels since 2022, with usable storage below 25% of total capacity [15].
The natural vegetation in the middle and lower sections of the EFRB responds rapidly to water stress through foliage loss, reduced photosynthetic activity, and decreased primary productivity [16]. The seasonal growth status of these plant communities is closely linked to precipitation during their development stage relationship, frequently documented using the Normalized Difference Vegetation Index (NDVI) [17]. Across northwestern Mexico, the phenological response of vegetation to interannual rainfall variability associated with the NAM has been extensively evaluated [17,18].
During the summer rainy season, NDVI peaks as vegetation cover expands rapidly. A clear example is the tropical dry forest, which exhibits an increase in productivity during hyper-humid years; conversely, during drought periods, regional NDVI values for this vegetation type decline significantly [17,18,19].
This scenario is particularly relevant given that northwestern Mexico has recorded a sustained descending trend in effective summer precipitation [20,21,22,23]. These trends are expected to significantly affect both vegetation dynamics and water availability in the EFRB—a critical region due to its strategic contribution to regional agricultural production and hydroelectric power generation. Beyond analyzing a major river basin in northwestern Mexico and its ecological and social significance, this study introduces a new approach by examining the dynamic processes that influence circulation patterns associated with reduced rainfall and the delayed onset of the NAM. Therefore, the objective of this research is to analyze the effect of precipitation trends on vegetation status within the Fuerte River basin using NDVI time series.
2. Materials and Methods
2.1. Study Area
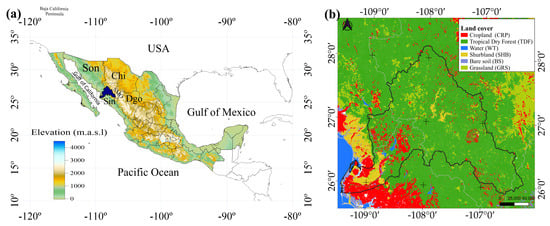
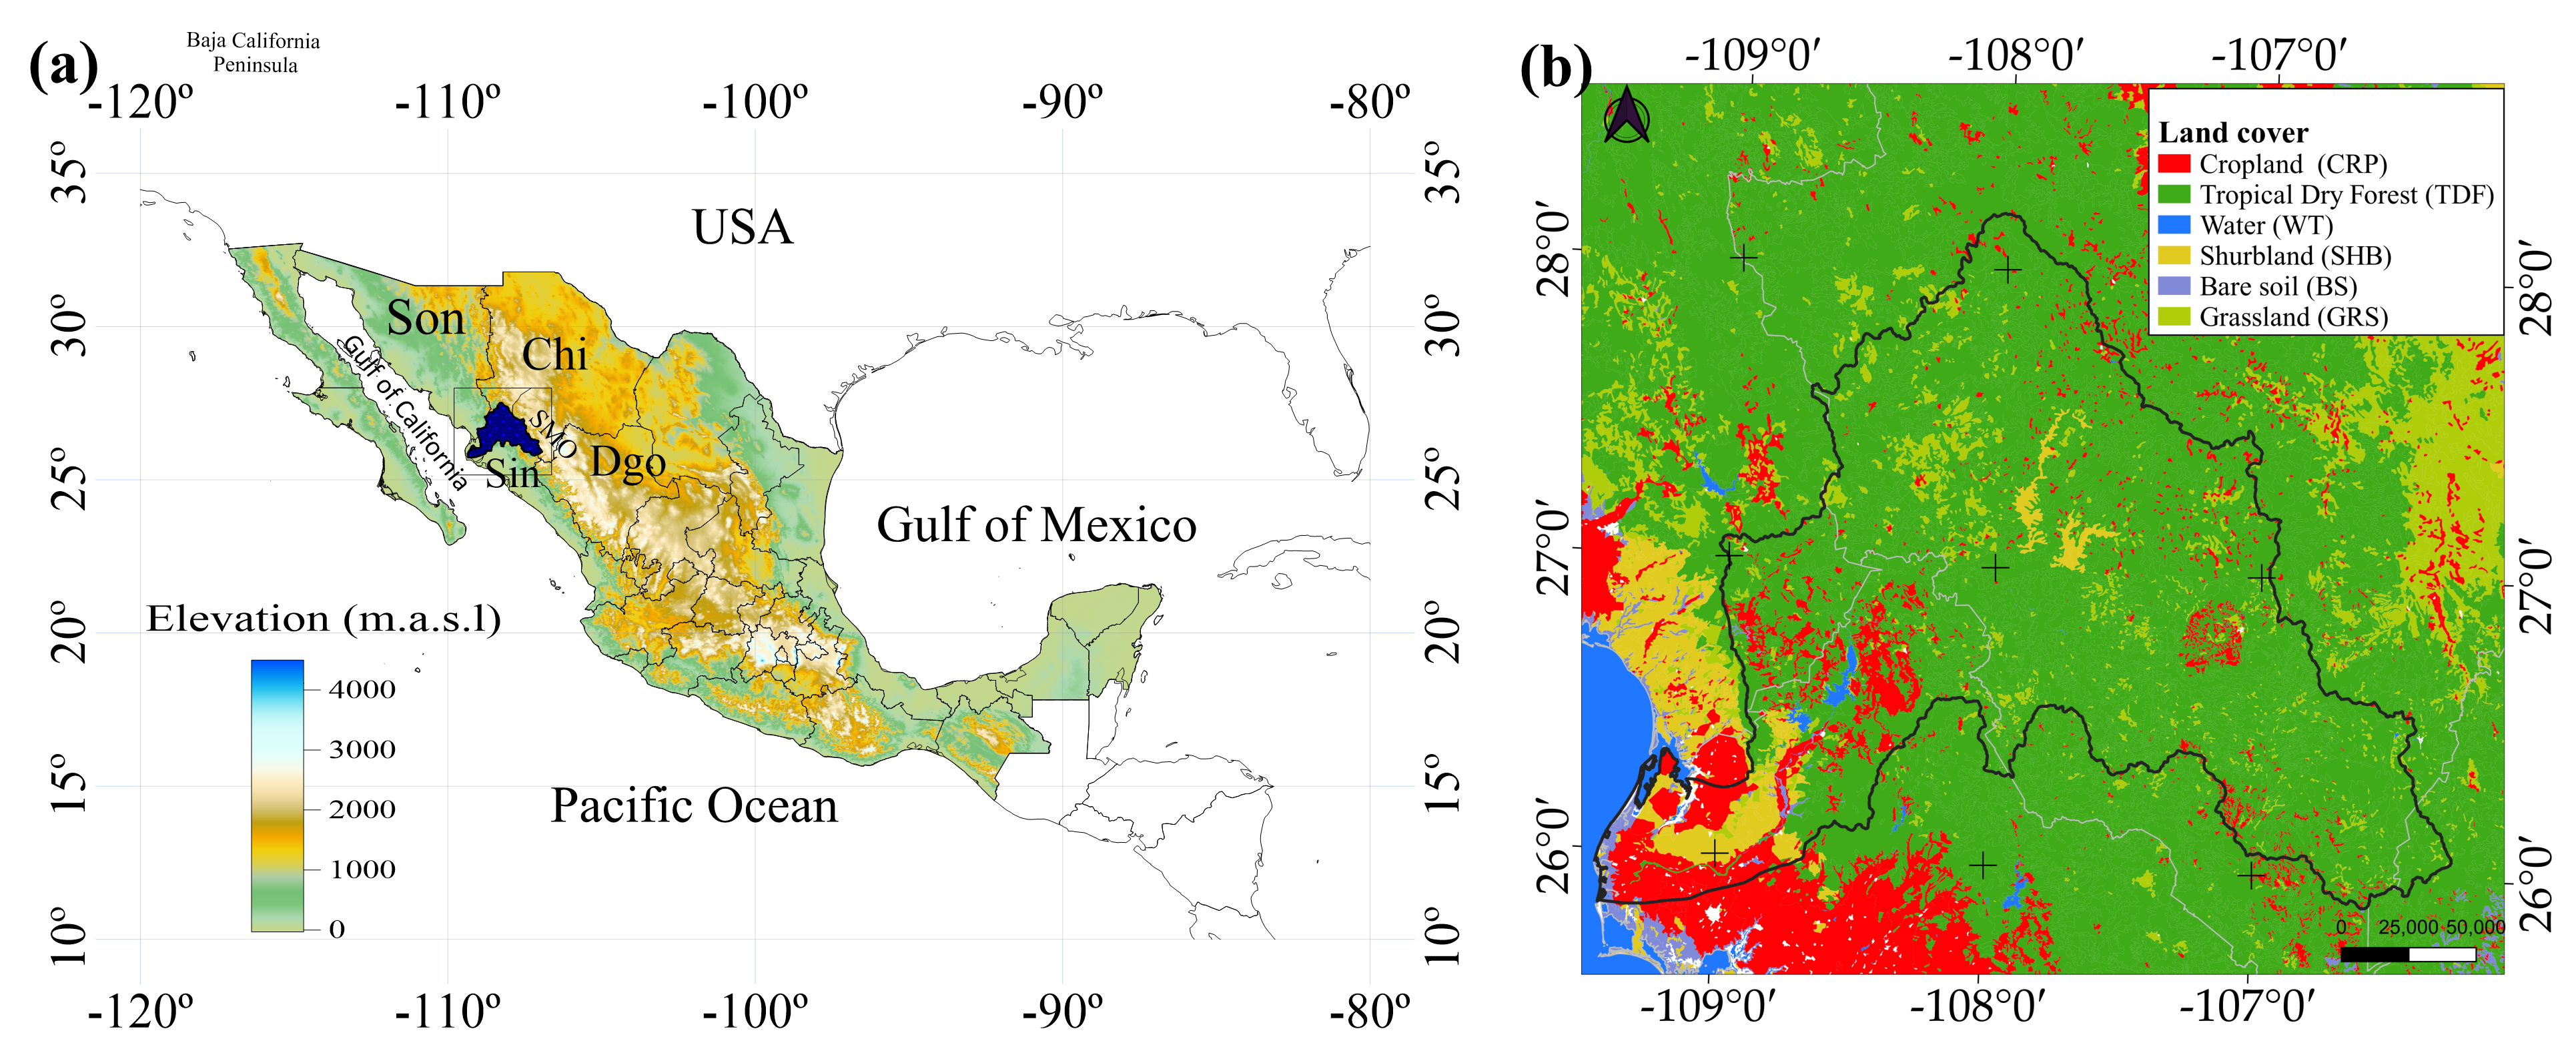
The El Fuerte River basin is in northwestern Mexico; forming part of the Sinaloa hydrological region (RH10) and spanning portions of the states of Sinaloa (Sin), Chihuahua (Chi), Sonora (Son), and Durango (Dgo) (Figure 1a). It is bounded to the north by the Río Bravo and Yaqui River basins, to the west by the Mayo River basin, to the south by the Gulf of California, and to the east by the Sinaloa, Culiacán, and Nazas River basins. Covering a surface area of 42,300.57 km2 [24]. The EFRB spans two physiographic provinces—the Sierra Madre Occidental and the Pacific Coastal Plain—and accounts for 2.18% of the national territory. Vegetation cover in the basin (Figure 1b) is dominated by Tropical Dry Forest (TDF) [25].
Figure 1.
(a) Elevation map and location of the El Fuerte River Basin in northwestern Mexico. (b) Land cover and location map of the El Fuerte River Basin (EFRB) on the northwest of Mexico.
2.2. CHRPS Data
Rain gauge data for the northwestern region of Mexico are inconsistent and have poor spatial and temporal coverage; for this study two gridded databases were used. Precipitation grids are generated by combining rain gauge observations with infrared-based satellite estimates. CHIRPS is a quasi-global precipitation dataset spanning 50° S to 50° N with a record of more than 35 years, developed and maintained by the Climate Hazards Center at the University of California, Santa Barbara [26]. CHIRPS has been widely used for precipitation analysis in Mexico, as well as for calculating trends, and has proven to be reliable [21,22].
2.3. ERA5 (ECMWF Global Reanalysis)
ERA5 is the fifth-generation atmospheric reanalysis produced by the European Centre for Medium-Range Weather Forecast (ECMWF), combining numerical model data with global observations to construct a physically consistent, globally complete dataset [27]. The reanalysis employs data assimilation—integrating ground-based, satellite, and marine measurements into numerical prediction models—across regular analysis cycles. It also quantifies uncertainty using a 10-member ensemble, calculated at 3 h intervals to account for variability, dispersion, and flow-dependent observational-system uncertainty. ERA5 is produced by the ECMWF’s Copernicus Climate Change Service as a global climate reanalysis spanning over 30 years [27]. Additionally, geopotential height (HGT), zonal and meridional wind, and specific humidity data were retrieved from ERA5 to calculate the specific humidity at 925 and 500 hPa. All parameters were averaged monthly, and anomalies were calculated for the 2000–2025 period.
2.4. Landsat NDVI
Normalized Difference Vegetation Index (NDVI) values were derived from combined reflectance data from the Landsat 5, 7, 8, and 9 missions, utilizing visible, near-infrared, shortwave-infrared, and thermal spectral bands to cover the 2000 to 2025 study period. The harmonization aligns surface reflectance (SR) and NDVI values to maintain temporal continuity. Since sensors have evolved throughout the Landsat series, spectral response functions (SRFs), bandwidths, and radiometric resolutions differ; for instance, Landsat 8 and 9 feature narrower red and near-infrared bands compared to Landsat 5 and 7 [28]. The filtering for atmospheric contaminants and cloud cover is performed via pixel-by-pixel quality assessment (QA) of the bands. Once the cleaned and harmonized surface reflectance scenes are obtained, NDVI is generated, and the data are aggregated into a defined time window. The per-scene NDVI was calculated as:
The data were seasonally averaged, with the monsoon season defined from June through September. Each entry corresponds to an image from each of the 16 days. Spatial resolution was resampled to 1 km per pixel. To maintain computational efficiency and reduce file size while preserving spatial detail, also the downscaled resolution is nearer to vegetation map data (~1 km), which allows for a better comparison between the NVDI and the vegetation map; the analysis domain was restricted by using a bounding box encompassing the El Fuerte basin area (Figure 1b).
2.5. Methods
Climate Engine version 2.1 is a web-based application hosted on Google App Engine; its source code resides in a GitHub repository, and the web interface handles data generation and processing [29,30]. The platform was used to compute annual precipitation and the Standardized Precipitation Index (SPI) across northwestern Mexico—within a domain spanning 22.5–32° latitude and −117° to −101.2° longitude—at each raster’s native resolution. The nonparametric Sen’s slope estimator [31] was used to calculate the magnitude of trend, and the Kendall Tau-b test to estimate their statistical significance [32]. Zonal time series were calculated exclusively for pixels within the El Fuerte River basin polygon and exported as CSV files. Additionally, spatial raster outputs were exported in NetCDF format for subsequent processing in QGIS.
Standardized Precipitation Index (SPI)
The SPI recommended by the World Meteorological Organization was applied to the representative series to characterize meteorological droughts [33]. The SPI at monthly, semi-annual, and annual time scales involves adjusting the historical accumulated rainfall records in n months to the function of incomplete gamma probabilistic distributions [34]. The resulting values were transformed into standardized values (z variable values) of the normal standard distribution function [35]. To estimate the SPI, we applied the methodology proposed by McKee et al. [36]. The analysis was conducted using the CHIRPS and ERA5 Land datasets for the period 2000–2025, at a 12-month scale (SPI-12), corresponding to hydrological droughts. The onset of a drought event is identified when the SPI reaches a value of ≤−1 and remains negative for at least twelve months for the SPI-12. The event ends when the index returns to a positive value. Duration corresponds to the total number of months that the SPI remained below the threshold; maximum intensity is defined as the lowest value recorded during the event [36].
3. Results
3.1. Temporal and Spatial Variation in the NDVI Response to Precipitation
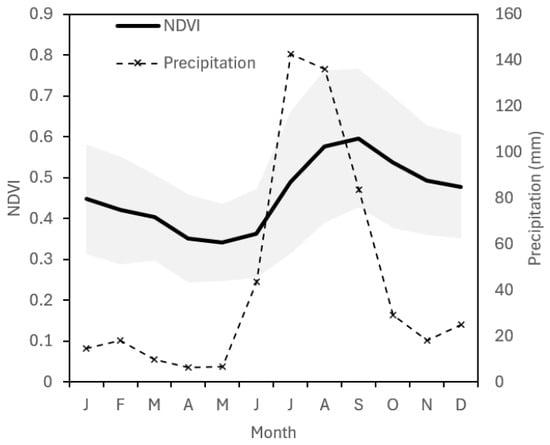
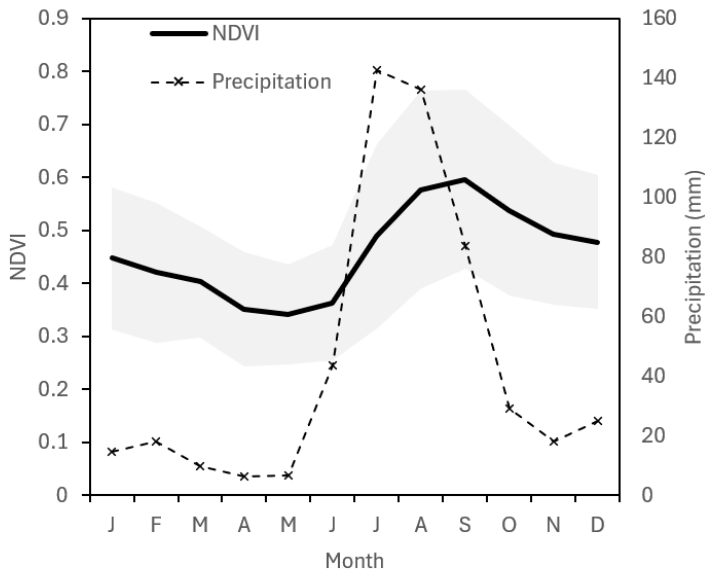
The El Fuerte River basin is located within the core region of the NAM, an area encompassing the states of Sinaloa and Sonora that receives rainfall primarily during the summer months (June through September). Rainfall in this region peaks during July and August, accounting for up to 80% of the mean annual precipitation (Figure 2) [20,21,22,23]. The onset of the rainy season occurs in June, driven by the rapid seasonal intensification of the monsoon [37]. Based on climatological data from 1990 to 2020 [38], the mean annual precipitation across the basin is 561 mm yr−1 (Figure 2).
Figure 2.
Monthly averaged values of NDVI and precipitation (mm) for the El Fuerte River basin from January 2000 to December 2025, derived from Landsat data and rain gauge observations [38]. The shaded areas indicate the range between monthly maximum and minimum NDVI values.
In northwestern Mexico, the vegetation growing season begins primarily in summer with the onset of NAM [17,18]. Precipitation controls water availability during the wet season, thereby controlling primary productivity and canopy greenness [19,39,40]. Tropical Dry Forest (TDF) constitutes the dominant land cover in the basin; exhibits a direct and rapid response to early monsoon rainfall [41]. Consequently, vegetation greenness increases swiftly following rain events, reaching maximum NDVI values towards the end of the monsoon season between September and October (Figure 2; see also [17]).
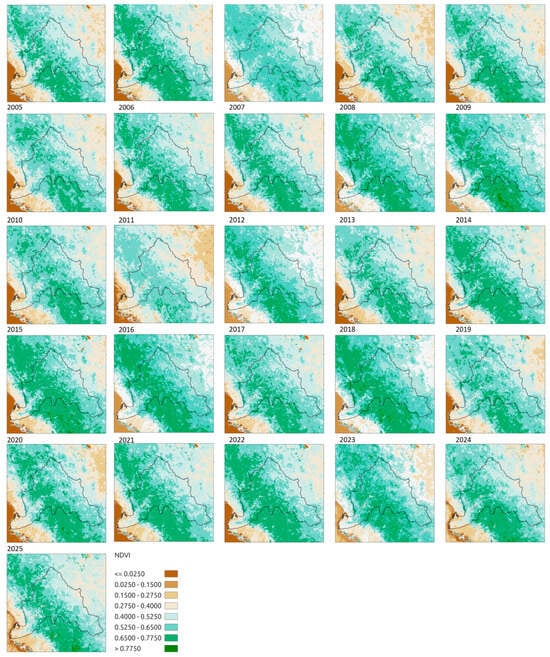
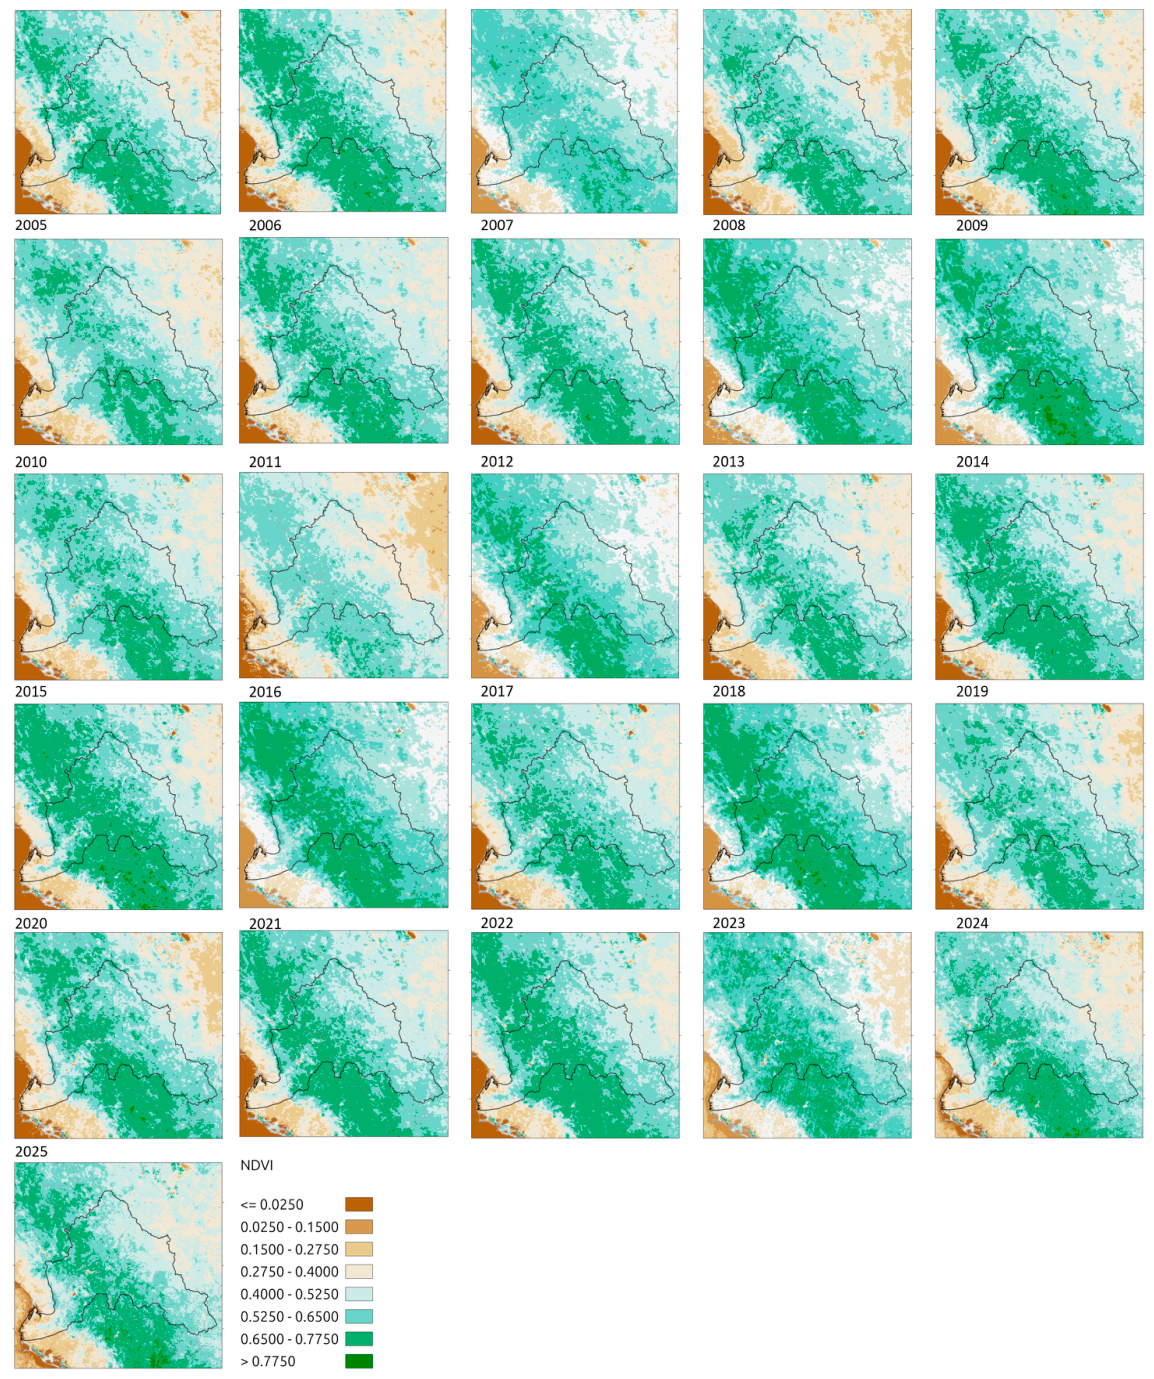
Consistent with these seasonal dynamics, interannual precipitation variability drives a widespread vegetation response across the basin (Figure 3). Interannual NDVI fluctuations are largely governed by precipitation anomalies—manifested as enhanced productivity during wet years and canopy decline during droughts—a pattern characteristic of northwestern Mexico [18,42].
Figure 3.
Average summer data of NDVI (JJAS) for the period 2000–2025.
Interannual variation in the growing season (green season) can thus be largely attributed to fluctuations in precipitation-driven water availability. However, precipitation is not the sole factor influencing NDVI values. Although previous studies have established that interannual NDVI variability across the NAM region is highly dependent on rainfall [19,41], other environmental drivers also influence vegetation greenness. Soil moisture retention capacity, as an intrinsic control on plant community ecology, plays a critical role in sustaining vegetation vigor [41]. For instance, ecosystems characterized by high sunlight exposure and high water-use efficiency can maintain elevated NDVI values [43]. Consequently, distinct wet, green years (e.g., 2005, 2015, and 2019) contrast sharply with dry years (e.g., 2003, 2006, and 2011) marked by suppressed NDVI value. Notably, following 2011, the basin exhibited a trend towards higher greenness regardless of interannual precipitation variations (Figure 3).
3.2. Precipitation as a Driver of NDVI
Although NDVI values are primarily governed by water availability during the NAM season, severe drought events can alter ecosystem floristic composition [40]. Such drought often suppresses the NDVI response in the subsequent growing seasons, thereby impairing the vegetation’s rain-use efficiency [44]. These prolonged dry periods are particularly critical because they can disrupt the overall functional dynamics of TDF [40,44].
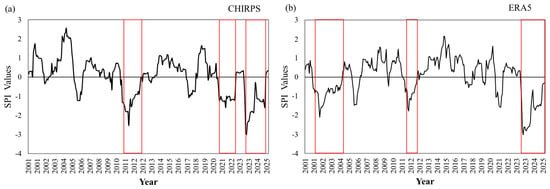
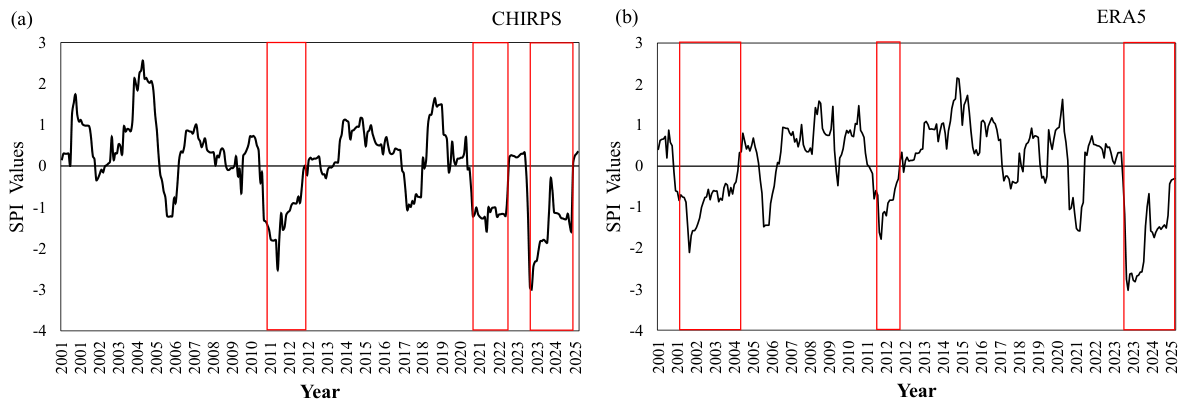
The region is frequently subject to recurrent droughts driven by interannual precipitation variability. Drought episodes were identified using the SPI-12 index (Figure 4), calculated from both the CHIRPS and ERA5 Land datasets for the 2000–2025 period. The two datasets consistently reveal major multi-year drought events, most notably during 2010–2012 and, more recently, throughout 2023–2025.
Figure 4.
Time series of Standardized Precipitation Index (SPI) values for (a) CHIRPS monthly data and (b) ERA5 Reanalyzes. The red boxes highlight exceptional drought episodes identified according to the SPI–12 scale.
The key characteristics of the analyzed drought events are summarized in Table 1. In terms of duration, the most prolonged droughts identified in the CHIRPS dataset occurred during 2010–2012 and 2023–2025, lasting 24 and 26 months, respectively. In contrast, the ERA5 time series recorded its longest droughts events during 2002–2004 and 2023–2025, each lasting for 30 months. In both datasets, the most severe droughts episodes correspond to the most recent event (2023–2025).
Table 1.
Characteristics of drought events in the Fuerte River Basin for the period 2000–2025.
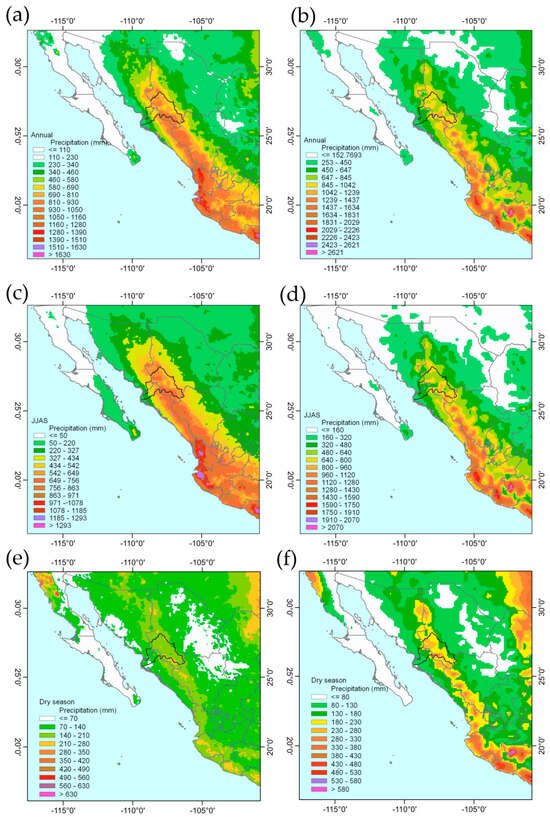
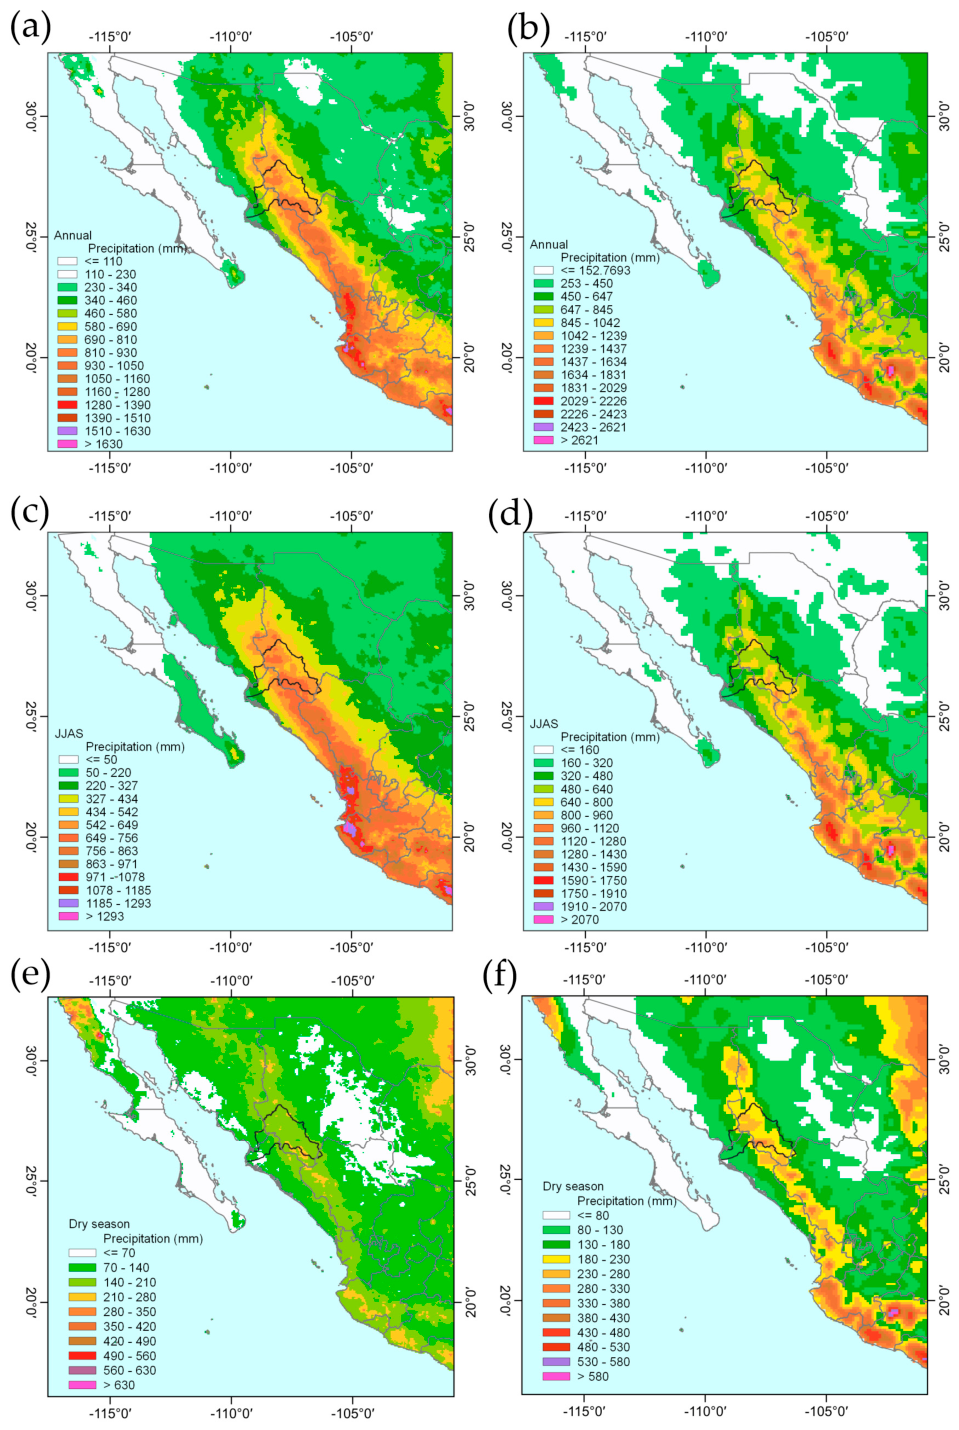
Figure 5 shows the cumulative annual precipitation maps for the CHIRPS and ERA5 datasets. The spatial distribution of precipitation is similar across both databases, displaying a gradient from coastal areas towards the mountainous regions in northwestern Mexico, with minimum values in the southern Baja California Peninsula. Lower precipitation is also observed toward the highlands in central México. Topography influences precipitation distribution, which both grid datasets represent well in the Sierra Madre Occidental region, decreasing toward the state of Sonora at the margin of the Sonoran Desert. Finally, the precipitation ranges for both data sets are similar, at least in terms of total annual accumulation.
Figure 5.
Annual and seasonal precipitation maps for northwestern Mexico (mm yr-1). Gridded total annual precipitation for (a) CHIRPS and (b) ERA5. Plots of seasonal precipitation divided by summer (JJAS) (c) CHIRPS and (d) ERA5. The dry season includes the remaining months (October to May) for (e) CHIRPS and (f) ERA5.
Maximum precipitation occurs during the summer monsoon, from June to September. During the remaining months (the dry season), precipitation decreases, except in the northern part of the Baja California Peninsula, where rainfall is primarily in winter. The highest precipitation values in the region are observed in the southern part of the Sierra Madre Occidental. The Gulf of California region is also influenced by tropical cyclones, which increase precipitation during the hurricane season [13,45].
3.3. Disturbance from Extreme Climate Events
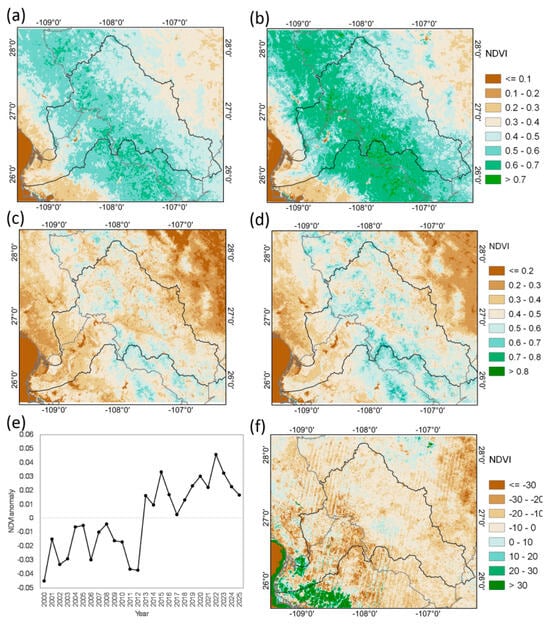
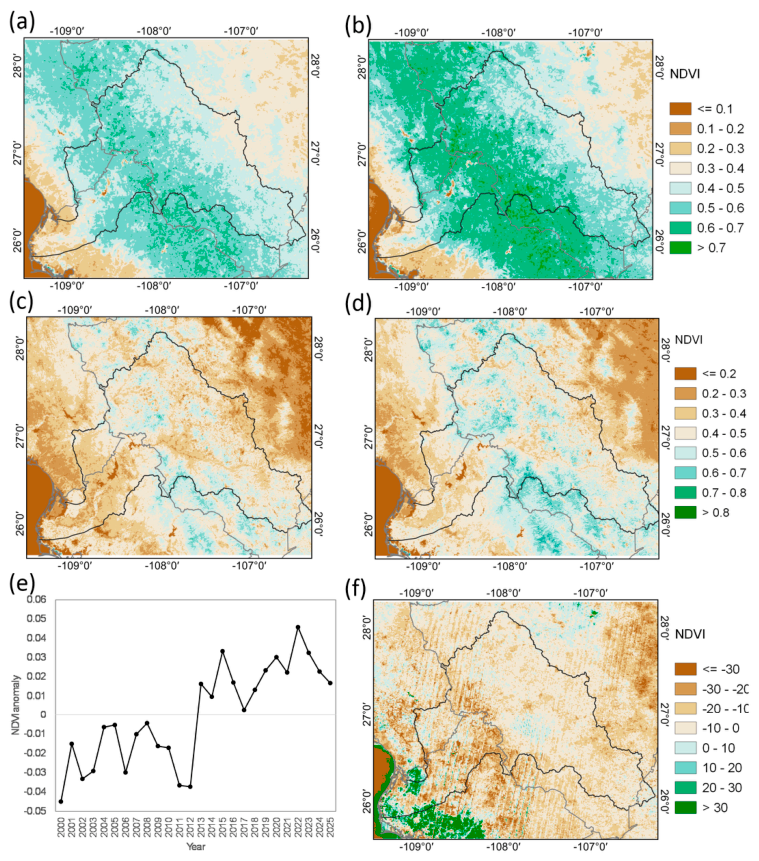
Interannual variability in NDVI values indicates that vegetation dynamics do not depend solely on seasonal precipitation. The severe drought from 2010 to 2012 affected much of northwestern Mexico, accounting for the observed decline in NDVI. However, drought alone does not fully explain the transition to a greener state from 2012 to 2025. Such trends, specifically the sustained increase in NDVI, may reflect a response to CO2 fertilization, a phenomenon widely documented across North America and globally [46]. Additionally, the region experienced an intense cold wave in February 2011, which caused high tree mortality in the TDF [39]. This vegetation mortality resulted from a combination of drought and extreme cold events, as reflected in the NDVI anomaly values (Figure 6b).
Figure 6.
NDVI average values for summer JJAS of (a) pre-disturbance period (2000–2010) and (b) recovery period (2012–2025). NDVI average values for dry season October to May for (c) pre-disturbance period (2000–2010) and (d) recovery period (2012–2025). (e) Time series of annual NDVI anomalies averaged for pixels of the entire basin area and (f) percentage difference relative to the 2011 average summer values.
Using the 2011 disturbance (drought and cold wave) as a reference point, NDVI was analyzed across two main periods: pre-disturbance and recovery. During the first decade, the highest NDVI values occurred in the mid-basin region within the TDF. Conversely, the lowest NDVI values during the first period were consistently recorded in the grassland and shrubland located in topographic depressions. At medium elevations, TDF-dominated areas exhibited the highest values.
The disturbance resulted in high tree mortality, primarily within the TDF [39]. The second period exhibits a pattern typical of vegetation recovery, characterized by high NDVI values [40].
The NDVI time series in Figure 6d illustrates lower values during the first period, reaching a minimum in 2011. From 2012 onwards, NDVI values steadily increased, eventually surpassing those of the pre-disturbance period.
The higher NDVI values observed during the second period may be linked to a proliferation of annual plants and lianas [39]. Furthermore, vegetation in early successional stages retains its leaves longer after a disturbance, extending into October and November [43].
The 2011 drought and cold wave reduced TDF cover, leading to vegetation patch fragmentation and expanded bare soil during the dry season. This spatial distribution is also evident in the dry-season NDVI values spanning October through May of the hydrological year (Figure 6c,d).
3.4. Precipitation Trends
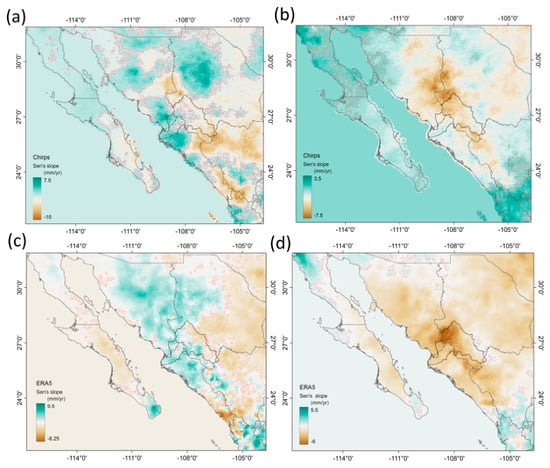
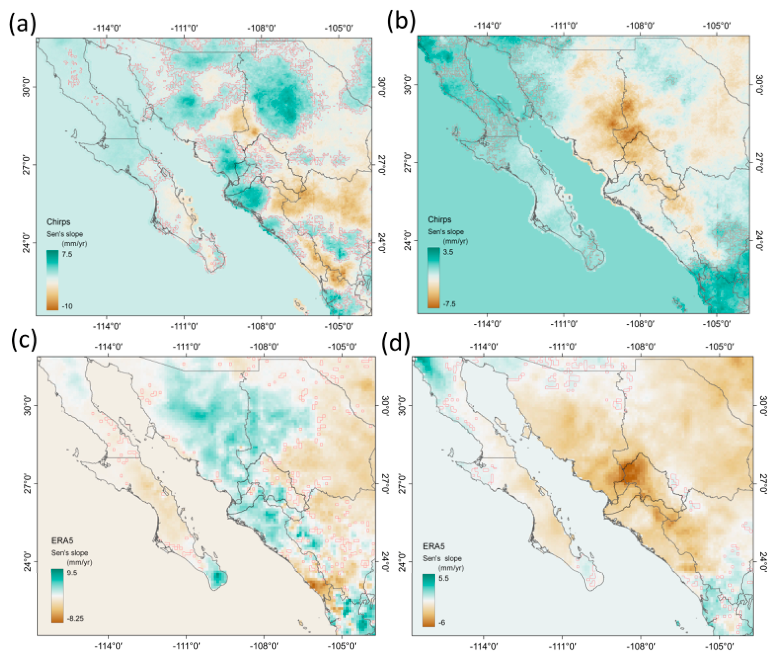
Figure 7 displays seasonal precipitation trends derived from CHIRPS and ERA5 for the 2000–2025 period. Within the core monsoon zone, summer rainfall declined at a rate of ~10 mm yr−1 in summer and ~8 mm yr−1 for dry season. Negative trends extend from the upper basin in the Sierra Madre Occidental (SMO) to the high plateau region of central México. Conversely, positive trends appear in the lower basin and coastal regions of Sinaloa and Sonora; these are distinct in the CHIRPS dataset but less pronounced in ERA5.
Figure 7.
Maps of decadal trend (Sen’s slope) of seasonal accumulated precipitation for summer, June to September (JJAS), and dry season, the remaining months October to May in the period 2000–2025, for CHIRPS; left panels (a,c). ERA5 right panels (b,d). Shaded red contour areas indicate statistically significant values (p < 0.05).
These results are consistent with other studies that test the robustness of precipitation trend estimates in this region [20,21,47]. In this study, the significant trends (p < 0.05) show low values—partly because of the specific study period—and because Sen’s slope and other estimators face challenges with spatial autocorrelation when applied to gridded precipitation datasets, limiting trend estimation from gridded data. Nevertheless, the core monsoon region is expected to be among the areas most impacted by climate change [48,49]. Studies across the NAM region indicate that the most significant declines occur during the peak precipitation months of June through August [21,48,49]. Consequently, monthly precipitation peaks have shifted toward September and October, a trend linked to increased tropical cyclone activity in the Northeastern Pacific [50]. Furthermore, reductions in total annual rainfall and a negative trend in heavy precipitation events are well-documented across the NAM region [47,51,52].
4. Discussion
4.1. NDVI Interannual Variability
The NDVI in the EFRB exhibits interannual variability that is primarily linked to total precipitation in the northwestern monsoon region. Tropical dry forests (TDF) globally are highly sensitive to water availability, displaying a strong, direct coupling between precipitation patterns and vegetation greenness [44,53,54]. Consequently, drought conditions lead to lower growing-season NDVI values and causes substantial shifts in the duration of the phenological cycle [53].
Declining precipitation in northwestern Mexico will directly impact in TDF due to their limited capacity to cope with water deficits. Consequently, negative precipitation trends will profoundly alter vegetation dynamics in both TDF and mid-latitude mountain deciduous forests within monsoon regions, manifesting as a reduction in NDVI values. Because green-up onset is closely tied to initial NAM rainfall, drought can disrupt not only current-season greenness but also the timing and duration of the growing season [18]. Previous studies have highlighted the marked influence of interannual precipitation variability on NDVI [54], and it has also been reported that, for most of the world’s semi-arid regions, NDVI values during the peak of vegetation activity were highly correlated with drought variability [55]. Hein et al. [56] reported that the response of semi-arid vegetation to precipitation variability can be disrupted by other factors, including nutrient status, time lags between precipitation and subsequent vegetation activity and growth [54], and rainfall-runoff relationships, which are determined by the intensity of specific rainfall events.
The correlations between NDVI and precipitation do not show strong correlations, either before or after 2011. Seasonal and one-year lag tests were also performed, and no statistically relevant relationships were observed. Interestingly, vegetation was found to be conditioned by the NDVI of previous seasons, with high and significant correlations (not shown). This has already been discussed by other authors [18,19]. However, annual data indicates a significant relationship between NDVI and precipitation when a 1+ year lag is applied (Table 2). The same occurs when both periods are analyzed. Although modest, this relationship confirms that summer rainfall affects vegetation growth, aligning with previous NAM region studies that link interannual precipitation variability is significantly linked to vegetation productivity [18,57]. However, Forzieri et al. [19] noted that this correlation between rainfall and vegetation indices has weakened over time.
Table 2.
Lag time coefficient (+1 yr) of Spearman’s correlation between annual values of NDVI and precipitation.
The disturbance in the watershed—associated with an exceptional drought and a cold wave event in 2011—caused high mortality in the tropical dry forest [31]. In accordance with [40], who reported that, for a region in northwestern Mexico, lower landscape greenness levels appeared to be related to prolonged droughts and extreme frost events. They observed a change from negative to positive NDVI anomalies in the years following the extreme frost of February 2011, which affected much of North America, including northern Mexico. During the subsequent recovery phase, secondary succession in the dry forest led to higher summer NDVI values. It has been reported that understory biomass increases rapidly during these early stages, generating a strong NDVI signal due to increased reflectance [42]. These ecosystems have demonstrated an ability to acclimate to reduced water availability, possibly facilitated by CO2 fertilization effects [38]. However, other key factors have also been identified; for example, high organic matter and litter content in the topsoil may enhance soil moisture recovery during the early stages of succession [46,58]. This increase in soil moisture can trigger the proliferation of fast-growing pioneer vegetation, which takes advantage of canopy gaps [40,57]. Consequently, the increase in volumetric water content within the surface soil layer may explain the rise in secondary-successional pioneer plants within the watershed.
Thus, rapid increases in NDVI values may reflect the proliferation of this successional vegetation rather than a genuine recovery of the tropical dry forest itself. Regarding the TDF in the watershed, post-2012 NDVI values have consistently failed to return to pre-disturbance levels. Furthermore, a decline in NDVI values, observed particularly in 2024 and 2025, can be attributed to the latest drought event. Although field validation is necessary to fully identify these mechanisms within EFBR.
4.2. Decreasing Moisture Flux in NAM
The trends in the onset delay of NAM can cause vegetation greening to occur later—coinciding with peak precipitation in September and October—thereby shortening the growing season [40]. A more pronounced negative precipitation trend is observed in the upper basin, whereas a slight increase is apparent on the coastal plains. This may result from altered circulation patterns along the elevation gradient, shifting convective cells closer to the coast [37]. These mechanisms drive the expansion (thermal expansion) of the lower and middle atmospheric layers, reducing moisture flux toward the Sierra Madre Occidental (SMO); this reduction is primarily due to increased moist stability [59,60]. It has also been shown that the onset of the monsoon has been delayed until the third week of June [21,29,39,41]; although, this specific delay was not observed in the present study. This aligns with previous studies indicating a decrease in summer precipitation within the North American Monsoon region, as well as a latitudinal shift toward the southeastern United States [9,17].
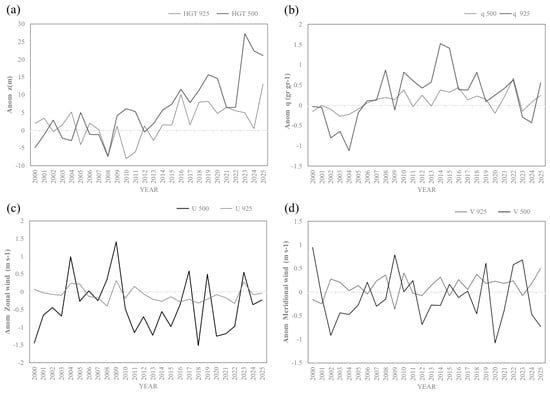
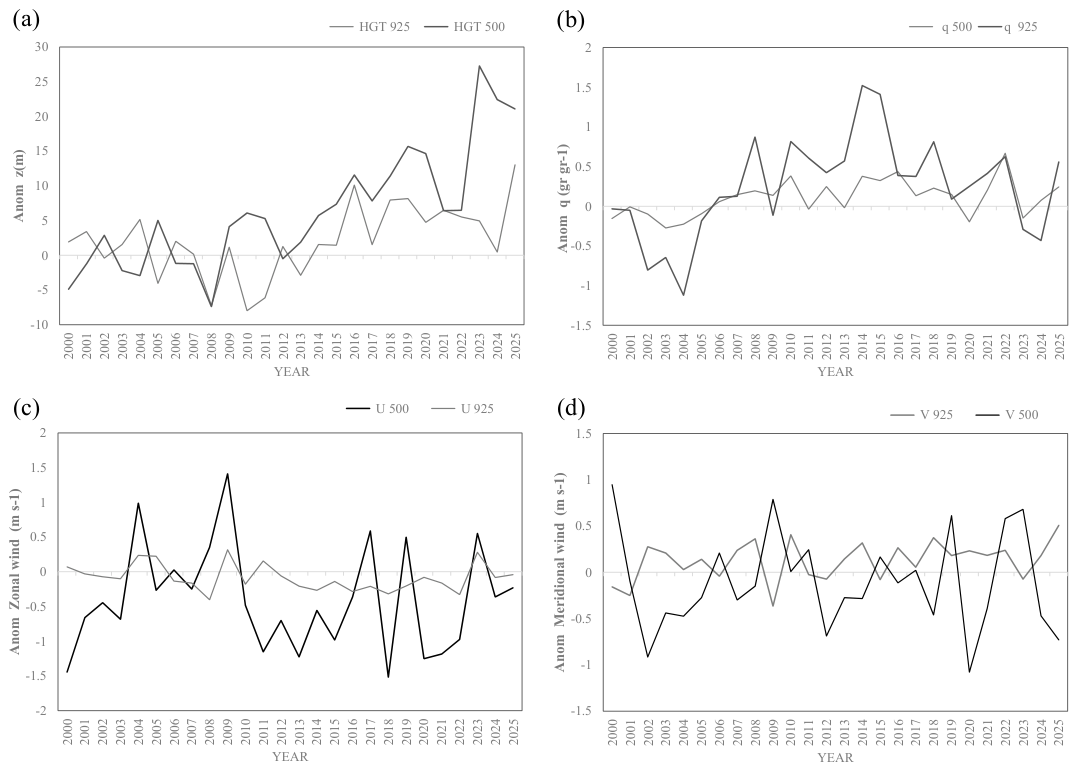
Geopotential height (HGT) shows changes associated with variations in atmospheric circulation at the low (925 mb) and mid (500 mb) levels (Figure 8). HGT values show an upward increase starting in 2015. Thermal expansion of the atmosphere can lead to lower moisture concentration, resulting in decreased atmospheric specific humidity [29,41,45]. Circulation patterns of the zonal and meridional components at low and mid-levels exhibit similar interannual variability (Figure 8). An increase in the northward meridional component has been linked to a northwestward shift in precipitation of NAM [49,60]. This, combined with weakened zonal winds, reduces moisture transport from the ocean into the EFRB. This weakened circulation is associated with drought conditions in the region [12].
Figure 8.
ERA5 summer (JJAS) anomalies for two levels regarding: (a) geopotential height (HGT), (b) specific humidity (q), (c) zonal wind (u), and (d) meridional wind (v). Values correspond to the area over the El Fuerte basin.
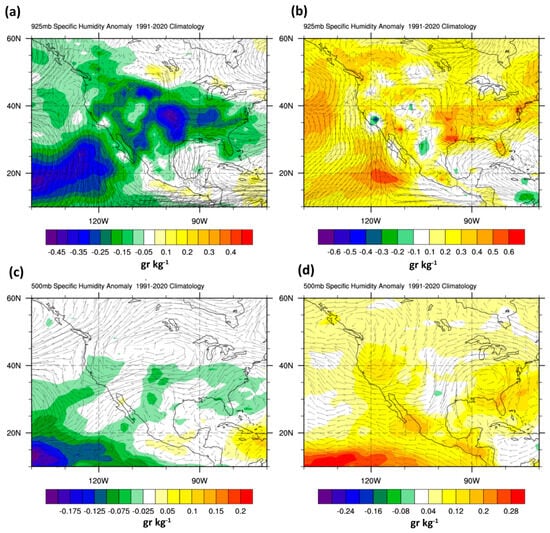
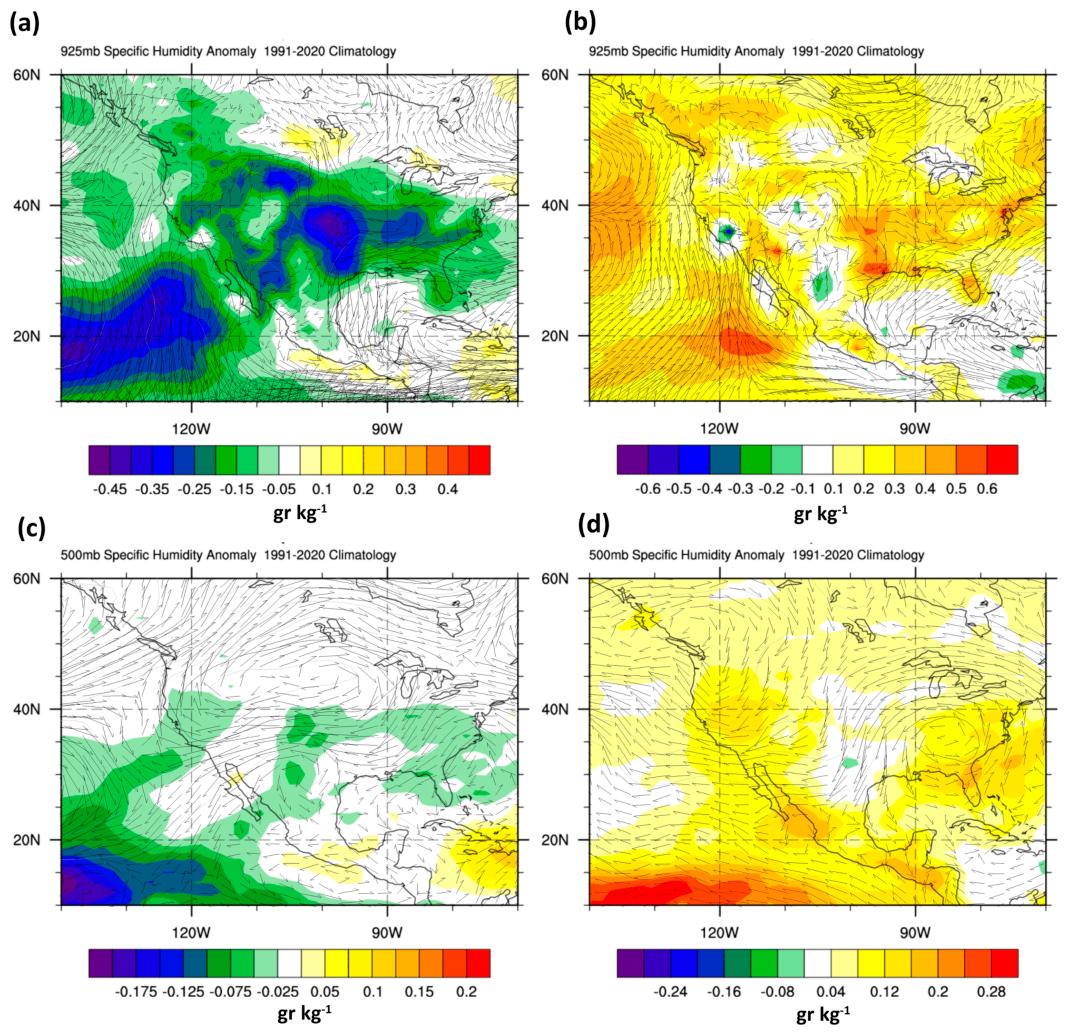
There are significant differences in synoptic circulation between the two analysis periods, distinguishing an initial “wet period” in the first decade from a “dry period” that began in 2012 (Figure 9). During the first decade, moisture is concentrated in north-western Mexico, and a circulation pattern favors its transport from the eastern Pacific (Figure 9a). These conditions can be associated with a more intense monsoon during these years. The second period shows a decrease in precipitation in the NAM (dry years), associated with synoptic circulation conditions featuring an anticyclone over northwestern Mexico, which reduces moisture flux from the eastern Pacific toward the continent (Figure 9b,d) [61]. This mechanism has also been linked to a weakening of NAM and changes in its onset and intensity [48,50,51].
Figure 9.
Plots of the anomaly for geopotential height (HGT), specific humidity (q) shading, and wind vectors (v) for two analyzed periods defined as pre-disturbance (2000–2012) and recover (2013–2025). (a) Pre-disturbance and wet period charts at 925 mb level; (b) recovery and dry period at 925 mb level. (c) Pre-disturbance period and wet charts at 500 mb level; (d) recovery and dry period at 500 mb level.
In the mid-levels (500 mb), positive anomalies—both in specific humidity and geopotential height—are also observed during the first period, particularly over the EFRB area. Anomalies in the second period become negative, with the anticyclone displaced westward. This westward and northwestward displacement and expansion of the NAM anticyclone—shifting away from its climatological maximum—has been reported in other studies [58,59]. The increase in geopotential heights could also contribute to greater moisture stability, allowing moisture transport at higher levels to reach regions farther north of the NAM ridge. This dynamic can also increase the intensity and frequency of rainfall, affecting the distribution of moisture in the higher regions of SMO [59,60].
Changes in thermal contrast conditions have been identified as a key factor in the reduced activity or intensity of global monsoon regions [50]. Global climate projections indicate that the North American Monsoon (NAM) may experience weakening linked to a strengthened remote stabilizing effect—driven by rising sea surface temperatures (SST)—and changes in the positions of upper-level inverted troughs, which are crucial processes for convective activity [49,59,60].
In the EFRB region, the decrease in precipitation during the second period, which includes at least four intense drought events, suggests that the mechanisms driving this drier period may involve local factors—such as vegetation changes—as well as atmospheric circulation patterns influenced by SST variations in the Gulf of California [51]. Also, the increased low-level meridional wind appears linked to an expansion and northwestward shift in the NAM ridge, consistent with other studies [49,62].
Global climate trends toward a warmer environment affect monsoon systems world-wide [49]. While remote mechanisms can induce greater atmospheric stability due to high moisture concentrations, local mechanisms, such as changes in vegetation cover or reductions in thermal contrasts, play a more significant role in controlling local moisture fluxes and advection.
5. Conclusions
Global trends in monsoon regions indicate a decline in precipitation. The North American Monsoon (NAM) region also exhibits these negative precipitation trends, signaling a shift toward drier conditions. This impacts both the vegetation of the NAM core region and water availability for the Tropical Dry Forest (TDF) and reservoirs, particularly within the El Fuerte River basin.
Changes in atmospheric stability play a key role in reducing moisture flux into the EFRB, a factor associated with declining precipitation. While moisture transport at higher altitudes could be linked to increased convective activity in the northern reaches of the basin, further study is needed to examine trends in extreme rainfall events.
Tropical dry forests are highly susceptible to drought and, more generally, to negative precipitation trends that reduce the volume of water accessible to vegetation. A cold wave event combined with an exceptional drought in 2011 caused a substantial shift in vegetation—particularly within the TDF—resulting in increased NDVI values.
In the context of climate change, this ecosystem as TDF will face significant impacts that could affect the ecological status of the El Fuerte River basin, as well as productive sectors reliant on water capture for agriculture and electricity generation.
Author Contributions
Conceptualization, L.F.P.-M., J.P.V.-C. and B.R.-G.; methodology, L.F.P.-M., J.P.V.-C. and B.R.-G.; software, L.F.P.-M. and J.P.V.-C.; validation, B.R.-G.; F.d.J.E.A.; F.A.O. and O.A.D.G.; formal analysis, L.F.P.-M.; J.P.V.-C.; F.d.J.E.A.; and F.A.O.; investigation, L.F.P.-M.; data curation, L.F.P.-M. and J.P.V.-C.; writing—original draft preparation, L.F.P.-M.; J.P.V.-C.; F.d.J.E.A.; and F.A.O.; writing—review and editing, B.R.-G.; F.d.J.E.A.; F.A.O. and O.A.D.G.; visualization, L.F.P.-M. and J.P.V.-C.; supervision, L.F.P.-M. All authors have read and agreed to the published version of the manuscript.
Funding
This research received no external funding.
Data Availability Statement
The data presented in this study are openly available on the following websites: ERA-5 https://cds.climate.copernicus.eu/datasets/reanalysis-era5-single-levels-monthly-means (accessed on 15 May 2026); CHIRPS, ERA5 precipitation and LANDSAT https://app.climateengine.org/climateEngine (accessed on 15 May 2026); ERA5 atmospheric pressure level analysis and graphics https://psl.noaa.gov/data/atmoswrit/map/ (accessed on 30 May 2026).
Conflicts of Interest
The authors declare no conflicts of interest.
Abbreviations
The following abbreviations are used in this manuscript:
| EFRB | El Fuerte River Basin |
| NAM | North American Monsoon |
| SPI | Standardized Precipitation Index |
| TDF | Tropical Dry Forest |
| NDVI | Normalized Difference Vegetation Index |
| SMO | Sierra Madre Occidental |
| RH10 | Hydrological Region 10 |
| CHIRPS | Climate Hazards Group InfraRed Precipitation with Station Data |
| ECMWF | European Centre for Medium-Range Weather Forecast |
| HGT | Additionally, geopotential height |
| VIMC | Vertically Integrated Moisture Convergence |
References
- Escolero, O.; Domínguez, E.; Martínez, S. “Ciclo hidrológico”. In Atlas de la Cuenca Lerma Chapala, Construyendo una Visión Conjunta; Cotler, H., Mazari, M., de Anda, J., Eds.; Instituto Nacional de Ecología: Ciudad de México, Mexico, 2006. [Google Scholar]
- López, R.F.P.; Patrón, E.R. Cuencas Hidrográficas. Fundamentos y Perspectivas Para su Manejo y Gestión. Instituto Mexicano de Tecnología del Agua. 2013. Available online: https://www.produccion-animal.com.ar/agua_cono_sur_de_america/80-Cuencas_hidrograficas.pdf (accessed on 15 August 2026).
- Biesbroek, G.R.; Swart, R.J.; van der Knaap, W.G.M. Themitigation-adaptation dichotomy and the role of spatial planning. Habitat Int. 2009, 33, 230–237. [Google Scholar] [CrossRef] [Scilit]
- Biswas, A.K. Integrated water resources management: A reassessment. Water Int. 2004, 29, 248–256. [Google Scholar] [CrossRef] [Scilit]
- Biswas, A.K. Integrated water resources management: Is it working? Int. J. Water Resour. Dev. 2008, 24, 5–22. [Google Scholar] [CrossRef] [Scilit]
- Gómez-Mendoza, L.; Vega-Pena, E.; Ramírez, M.I.; Palacio-Prieto, J.L.; Galicia, L. Projecting land-use change processes in the Sierra Norte of Oaxaca, Mexico. Appl. Geogr. 2006, 26, 276–290. [Google Scholar] [CrossRef] [Scilit]
- Thaden Ugalde, J.J.V.; Lithgow, D.; Revollo-Fernández, D.A.; Salazar Vargas, M.D.P.; Rodríguez de los Santos, A. Cambios en uso de suelo y vegetación en tres cuencas de México con modelos de Markov. Madera Bosques 2023, 29, 3. [Google Scholar] [CrossRef] [Scilit]
- Liu, C.; Li, W.; Zhu, G.; Zhou, H.; Yan, H.; Xue, P. Land use/land cover changes and their driving factors in the Northeastern Tibetan Plateau based on Geographical Detectors and Google Earth Engine: A case study in Gannan Prefecture. Remote Sens. 2020, 12, 3139. [Google Scholar] [CrossRef] [Scilit]
- Brito-Castillo, L.; Vivoni, E.R.; Gochis, D.J.; Filonov, A.; Tereshchenko, I.; Monzon, C. An anomaly in the occurrence of the month of maximum precipitation distribution in northwest Mexico. J. Arid. Environ. 2010, 74, 531–539. [Google Scholar] [CrossRef] [Scilit]
- Higgins, R.W.; Chen, Y.; Douglas, A.V. Interannual variability of the North American warm season precipitation regime. J. Clim. 1999, 12, 653–680. [Google Scholar] [CrossRef] [Scilit]
- Higgins, R.W.; Shi, W. Intercomparison of the principal modes of interannual and intraseasonal variability of the North American Monsoon System. J. Clim. 2001, 14, 403–417. [Google Scholar] [CrossRef] [Scilit]
- Vega-Camarena, J.P.; Brito-Castillo, L.; Farfán, L.M.; Gochis, D.J.; Pineda-Martínez, L.F.; Díaz, S.C. Ocean–atmosphere conditions related to severe and persistent droughts in the Mexican Altiplano. Int. J. Climatol. 2018, 38, 853–866. [Google Scholar] [CrossRef] [Scilit]
- Martinez-Sanchez, J.N.; Cavazos, T. Eastern Tropical Pacific hurricane variability and landfalls on Mexican coasts. Clim. Res. 2014, 58, 221–234. [Google Scholar] [CrossRef] [Scilit]
- Vega-Camarena, J.P.; Brito-Castillo LFarfán, L.M. Precipitation in Northwestern Mexico: Daily extreme events. Theor. Appl. Climatol. 2024, 155, 2689–2703. [Google Scholar] [CrossRef] [Scilit]
- Comisión Nacional del Agua (Conagua). Sistema Nacional de Información del Agua. Portal de Sistemas. 2026. Available online: https://sinav30.conagua.gob.mx:8080/portalp.html (accessed on 15 June 2026).
- Luna-Flores, W.; Estrada-Medina, H.; Morales-Maldonado, E.; Álvarez Rivera, O. Estrés Por Déficit Hídrico En Plantas: Una Revisión. Chil. J. Agric. Anim. Sci. 2023, 31, 61–69. [Google Scholar]
- Forzieri, G.; Castelli, F.; Vivoni, E.R. Vegetation dynamics within the North American monsoon region. J. Clim. 2011, 24, 1763–1783. [Google Scholar] [CrossRef] [Scilit]
- Salinas-Zavala, C.A.; Douglas, A.V.; Diaz, H.F. Interannual variability of NDVI in northwest Mexico. Associated climatic mechanisms and ecological implications. Remote Sens. Environ. 2002, 82, 417–430. [Google Scholar] [CrossRef] [Scilit]
- Forzieri, G.; Feyen, L.; Cescatti, A.; Vivoni, E.R. Spatial and temporal variations in ecosystem response to monsoon precipitation variability in southwestern North America. J. Geophys. Res. Biogeosci. 2014, 119, 1999–2017. [Google Scholar] [CrossRef] [Scilit]
- Arriaga-Ramírez, S.; Cavazos, T. Regional trends of daily precipitation indices in northwest Mexico and southwest United States. J. Geophys. Res. Atmos. 2010, 115, D14111. [Google Scholar] [CrossRef] [Scilit]
- Colorado-Ruiz, G.; Cavazos, T. Trends of daily extreme and non-extreme rainfall indices and intercomparison with different gridded data sets over Mexico and the southern United States. Int. J. Climatol. 2021, 41, 5406–5430. [Google Scholar] [CrossRef] [Scilit]
- Luna-Niño, R.; Cavazos, T.; Torres-Alavez, J.A.; Giorgi, F.; Coppola, E. Interannual variability of the boreal winter subtropical jet stream and teleconnections over the CORDEX-CAM domain during 1980–2010. Clim. Dyn. 2021, 57, 1571–1594. [Google Scholar] [CrossRef] [Scilit]
- Turrent, C.; Cavazos, T. Role of the land-sea thermal contrast in the interannual modulation of the North American Monsoon. Geophys. Res. Lett. 2009, 36, L02808. [Google Scholar] [CrossRef] [Scilit]
- Instituto Nacional de Estadística y Geografía. Aspectos Geográficos de Sinaloa: Compendio. 2022. Available online: https://www.inegi.org.mx/app/biblioteca/ficha.html?upc=889463913306 (accessed on 10 May 2026).
- Instituto Nacional de Estadística y Geografía (INEGI). Carta de Uso del Suelo y Vegetación Escala 1:250 000 Serie I y II. Escala 1:250,000. 2018. Available online: https://www.inegi.org.mx/temas/usosuelo/ (accessed on 15 June 2025).
- Funk, C.; Peterson, P.; Landsfeld, M.; Pedreros, D.; Verdin, J.; Shukla, S.; Husak, G.; Rowland, J.; Harrison, L.; Hoell, A.; et al. The climate hazards infrared precipitation with stations—A new environmental record for monitoring extremes. Sci. Data 2015, 2, 150066. [Google Scholar] [CrossRef] [Scilit] [PubMed]
- Hersbach, H.; Bell, B.; Berrisford, P.; Hirahara, S.; Horányi, A.; Muñoz-Sabater, J.; Nicolas, J.; Peubey, C.; Radu, R.; Schepers, D.; et al. The ERA5 global reanalysis. Q. J. R. Meteorol. Soc. 2020, 146, 1999–2049. [Google Scholar] [CrossRef] [Scilit]
- Robinson, N.P.; Allred, B.W.; Jones, M.O.; Moreno, A.; Kimball, J.S.; Naugle, D.E.; Erickson, T.A.; Richardson, A.A. A dynamic Landsat derived normalized difference vegetation index (NDVI) product for the conterminous United States. Remote Sens. 2017, 9, 863. [Google Scholar] [CrossRef] [Scilit]
- Huntington, J.L.; Hegewisch, K.C.; Daudert, B.; Morton, C.G.; Abatzoglou, J.T.; McEvoy, D.J.; Erickson, T. Climate engine: Cloud computing and visualization of climate and remote sensing data for advanced natural resource monitoring and process understanding. Bull. Am. Meteorol. Soc. 2017, 98, 2397–2409. [Google Scholar] [CrossRef] [Scilit]
- Gorelick, N.; Hancher, M.; Dixon, M.; Ilyushchenko, S.; Thau, D.; Moore, R. Google Earth Engine: Planetary-scale geospatial analysis for everyone. Remote Sens. Environ. 2017, 202, 18–27. [Google Scholar] [CrossRef] [Scilit]
- Sen, P. Estimates of the regression coefficient based on Kendall’s tau. J. Am. Stat. Assoc. 1968, 63, 1379–1389. [Google Scholar] [CrossRef]
- Kendall, M.G. Rank Correlation Methods; CharlesGriffin: London, UK, 1975. [Google Scholar]
- WMO. Standardized Precipitation Index User Guide; WMO-No.1090; World Meteorological Organization: Geneva, Switzerland, 2012. [Google Scholar]
- Guenang, G.M.; Kamga, F.M. Computation of the standardized precipitation index (SPI) and its use to assess drought occurrences in Cameroon over recent decades. J. Appl. Meteorol. Climatol. 2014, 53, 2310–2324. [Google Scholar] [CrossRef] [Scilit]
- Steinemann, A. Drought indicators and triggers: A stochastic approach to evaluation 1. JAWRA J. Am. Water Resour. Assoc. 2003, 39, 1217–1233. [Google Scholar] [CrossRef] [Scilit]
- McKee, T.B.; Doesken, N.J.; Kleist, J. The relationship of drought frequency and duration to time scales. In Proceedings of the 8th Conference on Applied Climatology, Anaheim, CA, USA, 17–22 January 1993; pp. 179–184. [Google Scholar]
- Torres-Alavez, A.; Cavazos, T.; Turrent, C. Land-sea thermal contrast and intensity of the North American monsoon under climate change conditions. J. Clim. 2014, 27, 4566–4580. [Google Scholar] [CrossRef] [Scilit]
- Servicio Meteorológico Nacional (SMN). Información Estadística Climatológica. 2026. Available online: https://smn.conagua.gob.mx/es/climatologia/informacion-climatologica/informacion-estadistica-climatologica (accessed on 12 June 2026).
- Bojórquez, A.; Álvarez-Yépiz, J.C.; Búrquez, A.; Martínez-Yrízar, A. Understanding and predicting frost-induced tropical tree mortality patterns. Glob. Change Biol. 2019, 25, 3817–3828. [Google Scholar] [CrossRef] [Scilit] [PubMed]
- Verdugo, L.; Bojórquez, A.; Galaz, O.; Romo-León, J.R.; Sánchez-Mejía, Z.M.; Yépez, E.A.; Álvarez-Yépiz, J.C. Assessing two decades of landscape greenness in relation to temperature and precipitation in a tropical dry forest of Northwestern Mexico. Ecol. Indic. 2024, 166, 112369. [Google Scholar] [CrossRef] [Scilit]
- Méndez-Barroso, L.A.; Vivoni, E.R.; Watts, C.J.; Rodríguez, J.C. Seasonal and interannual relations between precipitation, surface soil moisture and vegetation dynamics in the North American monsoon region. J. Hydrol. 2009, 377, 59–70. [Google Scholar] [CrossRef] [Scilit]
- Revilla, U.S.; Bongers, F.; Enríquez, M.; Muñoz, R.; Peña-Claros, M.; Meave, J.A. The regulating role of Mimosa acantholoba var. eurycarpa in tropical dry forest succession: Stem twisting as a successional accelerating mechanism. For. Ecol. Manag. 2023, 548, 121410. [Google Scholar] [CrossRef] [Scilit]
- Quesada, M.; Álvarez-Añorve, M.; Ávila-Cabadilla, L.; Castillo, A.; Lopezaraiza-Mikel, M.; Martén-Rodríguez, S.; Rosas-Guerrero, V.; Sáyago, R.; Sánchez-Montoya, G.; Contreras-Sánchez, J.M.; et al. Tropical Dry Forest Ecological Succession in Mexico: Synthesis of a Long-Term Study. In Tropical Dry Forests in the Americas: Ecology, Conservation, and Management; CRC Press: Boca Raton, FL, USA, 2013; pp. 17–33. [Google Scholar] [CrossRef] [Scilit]
- Stan, K.D.; Sanchez-Azofeifa, A.; Duran, S.M.; Guzman, Q.; JA; Hesketh, M.; Laakso, K.; Portillo-Quintero, C.; Rankine, C.; Doetterl, S. Tropical dry forest resilience and water use efficiency: An analysis of productivity under climate change. Environ. Res. Lett. 2021, 16, 054027. [Google Scholar] [CrossRef] [Scilit]
- Cerezo-Mota, R.; Cavazos, T.; Arritt, R.; Torres-Alavez, A.; Sieck, K.; Nikulin, G.; Moufouma-Okia, W.; Salinas-Prieto, J.A. CORDEX-NA: Factors inducing dry/wet years on the North American Monsoon region. Int. J. Climatol. 2016, 36, 824–836. [Google Scholar] [CrossRef] [Scilit]
- Zhu, Z.; Piao, S.; Myneni, R.B.; Huang, M.; Zeng, Z.; Canadell, J.G.; Ciais, P.; Sitch, S.; Friedlingstein, P.; Arneth, A.; et al. Greening of the Earth and its drivers. Nat. Clim. Change 2016, 6, 791–795. [Google Scholar] [CrossRef] [Scilit]
- Cavazos, T.; Luna-Niño, R.; Cerezo-Mota, R.; Fuentes-Franco, R.; Méndez, M.; Pineda Martínez, L.F.; Valenzuela, E. Climatic trends and regional climate models intercomparison over the CORDEX-CAM (Central America, Caribbean, and Mexico) domain. Int. J. Climatol. 2019, 40, 1396–1420. [Google Scholar] [CrossRef] [Scilit]
- Cook, B.I.; Seager, R. The response of the North American Monsoon to increased greenhouse gas forcing. J. Geophys. Res. Atmos. 2013, 118, 1690–1699. [Google Scholar] [CrossRef] [Scilit]
- Wang, B.; Biasutti, M.; Byrne, M.P.; Castro, C.; Chang, C.P.; Cook, K.; Fu, R.; Grimm, A.M.; Ha, K.J.; Hendon, H.; et al. Monsoons climate change assessment. Bull. Am. Meteorol. Soc. 2021, 102, E1–E19. [Google Scholar] [CrossRef] [Scilit]
- Cavazos, T.; Turrent, C.; Lettenmaier, D.P. Extreme precipitation trends associated with tropical cyclones in the core of the North American monsoon. Geophys. Res. Lett. 2008, 35, L21703. [Google Scholar] [CrossRef] [Scilit]
- Colorado-Ruiz, G.; Cavazos, T.; Salinas, J.A.; De Grau, P.; Ayala, R. Climate change projections from Coupled Model Intercomparison Project phase 5 multi-model weighted ensembles for Mexico, the North American monsoon, and the mid-summer drought region. Int. J. Climatol. 2018, 38, 5699–5716. [Google Scholar] [CrossRef] [Scilit]
- Nazarian, R.H.; Brizuela, N.G.; Matijevic, B.J.; Vizzard, J.V.; Agostino, C.P.; Lutsko, N.J. Projected Changes in Mean and Extreme Precipitation over Northern Mexico. J. Clim. 2024, 37, 2405–2422. [Google Scholar] [CrossRef] [Scilit]
- Castro, S.M.; Sanchez-Azofeifa, G.A.; Sato, H. Effect of drought on productivity in a Costa Rican tropical dry forest. Environ. Res. Lett. 2018, 13, 045001. [Google Scholar] [CrossRef] [Scilit]
- Zeng, F.W.; Collatz, G.J.; Pinzon, J.E.; Ivanoff, A. Evaluating and quantifying the climate-driven interannual variability in Global Inventory Modeling and Mapping Studies (GIMMS) Normalized Difference Vegetation Index (NDVI3g) at global scales. Remote Sens. 2013, 5, 3918–3950. [Google Scholar] [CrossRef] [Scilit]
- Vicente-Serrano, S.M.; Cabello, D.; Tomás-Burguera, M.; Martín-Hernández, N.; Beguería, S.; Azorin-Molina, C.; El Kenawy, A. Drought variability and land degradation in semiarid regions: Assessment using remote sensing data and drought indices (1982–2011). Remote Sens. 2015, 7, 4391–4423. [Google Scholar] [CrossRef] [Scilit]
- Hein, L.; De Ridder, N.; Hiernaux, P.; Leemans, R.; De Wit, A.; Schaepman, M. Desertification in the Sahel: Towards better accounting for ecosystem dynamics in the interpretation of remote sensing images. J. Arid. Environ. 2011, 75, 1164–1172. [Google Scholar] [CrossRef] [Scilit]
- Maldonado-Enríquez, D.; Ortega-Rubio, A.; Cámara, A.M.B.S.; Díaz-Castro, S.C.; Sosa-Ramírez, J.; Martínez-Rincón, R.O. Trend and variability of NDVI of the main vegetation types in the Cape Region of Baja California Sur. Rev. Mex. Biodivers. 2020, 91, e913213. [Google Scholar] [CrossRef] [Scilit]
- Wen, R.; Jiang, P.; Qin, M.; Jia, Q.; Cong, N.; Wang, X.; Meng, Y.; Yang, F.; Liu, B.; Zhu, M.; et al. Regulation of NDVI and ET negative responses to increased atmospheric vapor pressure deficit by water availability in global drylands. Front. For. Glob. Change 2023, 6, 1164347. [Google Scholar] [CrossRef] [Scilit]
- Meyer, J.D.D.; Jin, J. The response of future projections of the North American monsoon when combining dynamical downscaling and bias correction of CCSM4 output. Clim. Dyn. 2017, 49, 433–447. [Google Scholar] [CrossRef] [Scilit]
- Pascale, S.; Carvalho, L.M.V.; Adams, D.K.; Castro, C.L.; Cavalcanti, I.F.A. Current and Future Variations of the Monsoons of the Americas in a Warming Climate. Curr. Clim. Change Rep. 2019, 5, 125–144. [Google Scholar] [CrossRef] [Scilit]
- Diem, J.E.; Brown, D.P.; Mccann, J. Multi-decadal changes in the North American monsoon anticyclone. Int. J. Climatol. 2013, 33, 2274–2279. [Google Scholar] [CrossRef] [Scilit]
- Pascale, S.; Boos, W.R.; Bordoni, S.; Delworth, T.L.; Kapnick, S.B.; Murakami, H.; Vecchi, G.A.; Zhang, W. Weakening of the North American monsoon with global warming. Nat. Clim. Change 2017, 7, 806–812. [Google Scholar] [CrossRef] [Scilit]

Disclaimer/Publisher’s Note: The statements, opinions and data contained in all publications are solely those of the individual author(s) and contributor(s) and not of MDPI and/or the editor(s). MDPI and/or the editor(s) disclaim responsibility for any injury to people or property resulting from any ideas, methods, instructions or products referred to in the content. |
© 2026 by the authors. Licensee MDPI, Basel, Switzerland. This article is an open access article distributed under the terms and conditions of the Creative Commons Attribution (CC BY) license.