


Abstract
This study investigates changes in local groundwater carrying status and regional differences under the background of reductions in total groundwater abstraction, using Jiuquan, Jiayuguan, Zhangye, Jinchang, and Wuwei in the Hexi Corridor as study areas. The analysis was conducted from three dimensions: resource base, development pressure, and groundwater-level–storage change. The groundwater abstraction pressure index and net abstraction excess were jointly used to distinguish relative development intensity from the absolute volume exceeding allowable abstraction. Regional differences were further identified using groundwater-depth changes at 515 monitoring stations and shallow groundwater-storage changes. Residual correlations after controlling for month effects and linear trends, together with robustness tests, were used to examine the associations of precipitation, river runoff, and groundwater abstraction with groundwater depth. Results showed that total groundwater abstraction in the five cities decreased by 23.8% from 2018 to 2025, whereas the abstraction pressure index in key overexploitation areas remained between 1.12 and 2.08 in 2024, indicating that regional abstraction reduction and local overexploitation coexisted. Jinchang had the highest relative abstraction pressure, whereas Wuwei had the largest net abstraction excess, demonstrating that relative development intensity and excess abstraction volume correspond to different management priorities. During the study period, groundwater levels declined at 404 monitoring stations, and the cumulative shallow groundwater-storage change was −69.14 × 10⁸ m3. Storage losses were concentrated mainly in Zhangye and Jiuquan and did not correspond to the regional ranking of development pressure, highlighting differences between current development intensity and cumulative storage change. After month effects and linear trends were controlled, the absolute values of 14 of the 15 correlations decreased, and 11 correlations changed from positive to negative, indicating that common seasonal cycles and long-term trends substantially affected the raw contemporaneous associations. By combining diagnosis of relative intensity and water-volume excess, comparison of groundwater-level and storage changes, and temporal-structure adjustment, this study refines regional identification of groundwater carrying status and provides a basis for spatially differentiated abstraction reduction and coordinated surface-water–groundwater management.
1. Introduction
The Hexi Corridor is a typical arid region of northwestern China and an important oasis-agriculture area. Inland river basins such as the Shiyang, Heihe, and Shule Rivers support regional oasis development and socioeconomic growth [1]. Because precipitation is scarce and water resources are unevenly distributed in space and time, groundwater is an important source for agricultural irrigation and urban and rural water supply [2], and groundwater-level decline and storage depletion caused by sustained development have received extensive attention. Groundwater resource carrying status depends not only on abstraction volume but also on resource conditions, recharge–discharge processes, and long-term cumulative consumption [3,4]. Previous groundwater monitoring in the Hexi Corridor has revealed regional differences in water-level change [5], while GRACE-based regional storage estimates have also shown pronounced spatiotemporal variations in groundwater [6], indicating that changes in regional totals cannot fully represent local groundwater conditions. Long-term studies in the Shiyang River Basin further demonstrate the combined influence of natural conditions and human activities on groundwater change [7]. Therefore, under the background of reducing total groundwater abstraction, identifying local development pressure and groundwater-level–storage changes and clarifying the main characteristics of carrying status in different areas are important for evaluating governance effectiveness and formulating differentiated management measures.
Existing studies have examined groundwater resource carrying status mainly through comprehensive evaluation, groundwater-dynamic identification, and hydrological-process analysis. Groundwater-level monitoring has documented widespread declines and localized recovery in aquifers globally [8], whereas groundwater-sustainability studies emphasize linkages among development intensity, groundwater-system response, and management measures [9,10]. Monitoring and remote-sensing studies have used groundwater-level observations, gravimetric satellites, and downscaling methods to characterize the spatiotemporal patterns of groundwater dynamics and storage change [11]. Recent groundwater-storage studies have also examined climatic influences and the effects of human activities, including changes in land use and surface-water availability [12,13]. Hydrological-process studies examine groundwater–surface-water exchanges and their implications for water-resource management [14]. Hydrological studies in the Heihe River Basin have revealed close relationships between multi-source water transformation and regional water-resource management [15], while oasis land-use studies in the Shiyang River Basin have shown links between agricultural development and groundwater change. In addition, uncertainty in aquifer parameters such as specific yield must be considered when interpreting water-level and storage changes [16]. These studies provide a basis for carrying-capacity assessment, but two issues remain to be clarified for regional differences in the Hexi Corridor under abstraction reduction. First, it is unclear whether relative development intensity, the volume exceeding allowable abstraction, and cumulative storage depletion identify the same priority areas and whether management priorities derived from a single indicator are consistent. Second, precipitation, runoff, abstraction, and groundwater depth all show seasonal and interannual variations; whether contemporaneous relationships in raw monthly series persist after common seasonal cycles and long-term trends are removed, and whether their direction and magnitude depend on particular years, remain uncertain [17]. These issues directly affect regional diagnosis of development pressure and reasonable interpretation of influencing factors.
To address these issues, this study combines a dual-indicator diagnosis of development pressure, comparison of groundwater-level and storage changes, and time-adjusted association analysis. The abstraction pressure index represents the deviation of actual abstraction from allowable abstraction, whereas net abstraction excess represents the volume exceeding allowable abstraction. Their joint use distinguishes areas with high relative intensity from those with large excess volumes. Comparison with mean groundwater depth in overexploitation areas, station-level depth changes, and storage changes in assessment areas further identifies regional differences between current development pressure and cumulative groundwater change. For influencing-factor analysis, raw correlations are compared with residual correlations after controlling for month effects and linear trends to examine the influence of common temporal patterns, and rank correlations and leave-one-year-out tests are used to assess stability. The contribution of this study is to refine development-pressure diagnosis from the perspectives of both relative intensity and water volume and to distinguish the stability of associations between groundwater depth and hydrological and abstraction factors through comparison before and after temporal adjustment, thereby providing more specific empirical evidence on regional carrying status and its influencing factors.
Jiuquan, Jiayuguan, Zhangye, Jinchang, and Wuwei were selected as the study areas. City-level groundwater abstraction data for 2018–2025, development and utilization data for key overexploitation areas in 2024, year-end groundwater depth in overexploitation areas for 2020–2024, contemporaneous depth changes at 515 monitoring stations, and shallow groundwater-storage changes were used to analyze the resource base, development pressure, and groundwater-level–storage changes. Paired monthly series for 2018–2023 were used to analyze associations with influencing factors. The study addresses three questions: how relative development pressure and the magnitude of excess abstraction differ among key overexploitation areas under total abstraction reduction; what regional characteristics of groundwater-level and storage changes are indicated by overexploitation-area, monitoring-station, and assessment-area data and whether their rankings are consistent with development pressure; and how associations of precipitation, runoff, and abstraction with groundwater depth change after controlling for month effects and linear trends, including whether their directions are stable. The aim is to identify regional differences in groundwater development pressure and dynamic change in the Hexi Corridor and provide a basis for differentiated abstraction reduction and coordinated surface-water–groundwater management.
2. Study Area and Data
2.1. Study Area
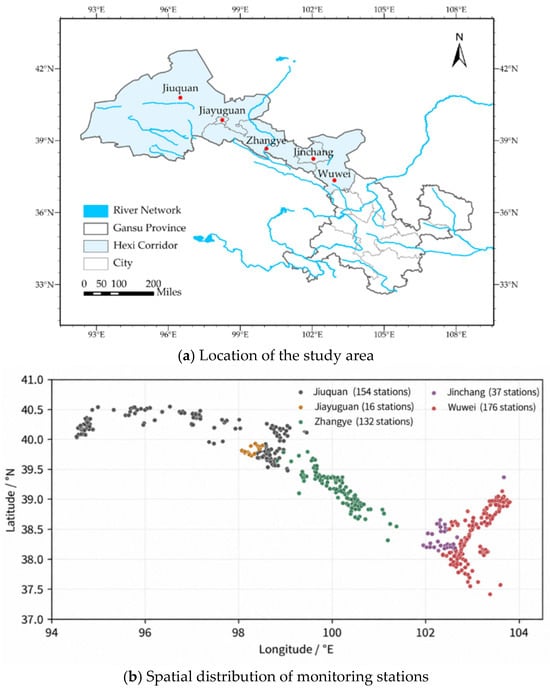
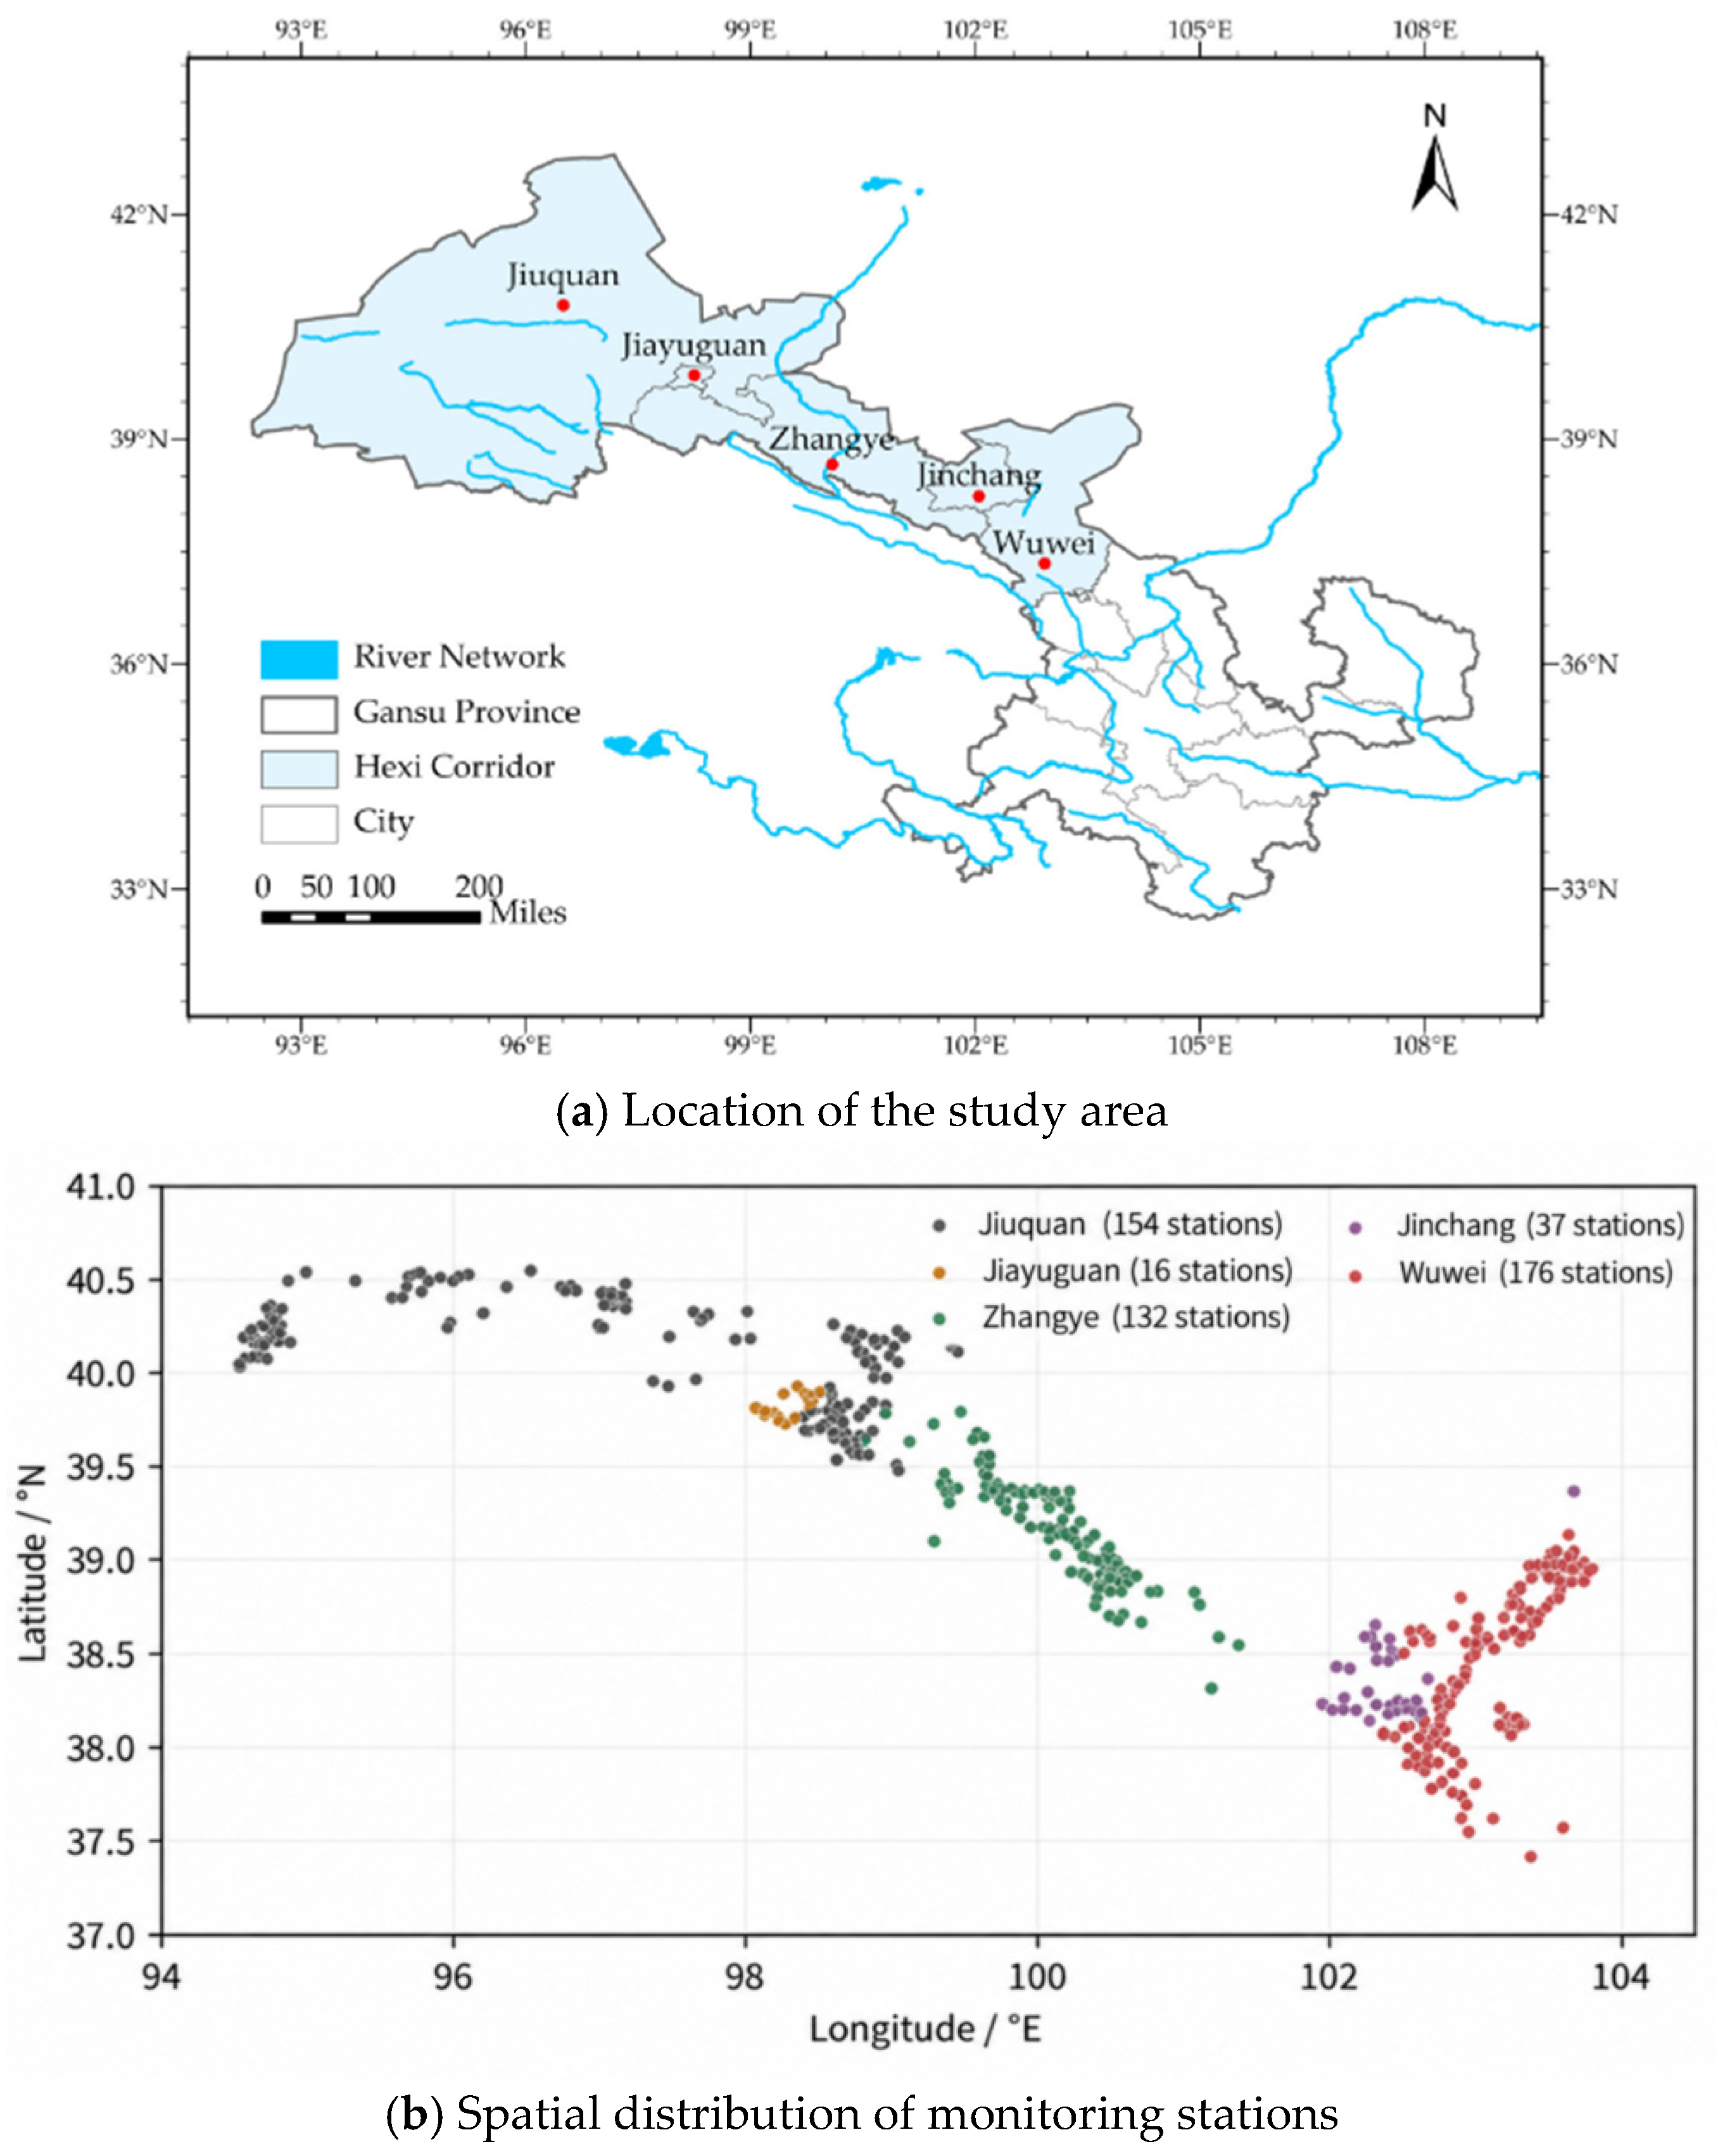
The Hexi Corridor is located in northwestern Gansu Province, with the Qilian Mountains to the south and the Tengger and Badain Jaran deserts to the north. Inland river systems, including the Shiyang, Heihe, and Shule Rivers, are distributed from east to west. The study covers Jiuquan, Jiayuguan, Zhangye, Jinchang, and Wuwei. Regional landforms transition from mountain areas to piedmont alluvial–proluvial plains, oases, and deserts. Runoff generated in the Qilian Mountains participates in the groundwater cycle of the plains through river transport, irrigation-district diversion and allocation, and infiltration [15,18]. The groundwater monitoring stations used for spatial analysis are shown in Figure 1.
Figure 1.
Location of the study area and spatial distribution of groundwater monitoring stations: (a) Location of the study area; (b) Spatial distribution of monitoring stations. Note: Station coordinates were obtained from groundwater monitoring data provided by the water authorities. A total of 515 stations were included; colors indicate the city to which each station belongs.
Groundwater in the plains of the study area is dominated by pore water in Quaternary unconsolidated deposits and occurs mainly in southern basins such as Wuwei, Zhangye–Jiuquan, and Yumen–Tashi, as well as northern basins including Minqin–Changning, Jinta–Huahai, and Guazhou–Dunhuang. In the piedmont zone, aquifer media are dominated by coarse gravel and cobble deposits and groundwater is mainly unconfined; toward basin interiors and northern fine-soil plains, the system gradually transitions to an unconfined–confined aquifer structure. Differences in geomorphology and aquifer structure affect groundwater occurrence and recharge–discharge conditions, and groundwater depth therefore also exhibits spatial differences [19].
2.2. Data Sources and Preprocessing
The datasets include resource assessment, groundwater development and utilization, groundwater-dynamic monitoring, and hydrometeorological time series; their sources and applications are summarized in Table 1. Groundwater resource assessment data for the plains of the five cities, development and utilization data for key overexploitation areas, and year-end groundwater-depth data were obtained from technical datasets provided by the water authorities. These datasets include plain-area calculation areas and groundwater resources, actual and allowable groundwater abstraction, sectoral water use in 2024, and year-end mean groundwater depth for the overexploitation areas under each city from 2020 to 2024.
Table 1.
Data sources and main applications.
Groundwater monitoring data provided by the water authorities include monitoring-station codes, coordinates, and monthly groundwater-depth observations. The monthly datasets also contain corresponding precipitation, runoff, and groundwater-abstraction series, which were used to analyze the relationships between groundwater depth and the relevant influencing factors. City-level annual groundwater abstraction data were also obtained from the corresponding statistical datasets. The time periods, statistical units, and applications of all datasets are listed in Table 1.
Plain-area resource assessment data were used to characterize the regional resource base; city-level annual statistics were used to describe changes in total abstraction; data from key overexploitation areas were used to calculate development pressure; monitoring in overexploitation areas and at individual stations was used to analyze groundwater-level changes; and paired monthly series were used for association analysis. Each dataset was analyzed within its own statistical spatial scope; city totals, overexploitation-area means, assessment-area storage changes, and station observations were not merged into a single spatial sample.
3. Methods
3.1. Analytical Framework
Groundwater resource carrying status was operationalized into three observable dimensions: resource base, development pressure, and groundwater-level–storage response. The resource base reflects groundwater resources and resource endowment per unit area in the plains. Development pressure reflects the deviation of actual groundwater abstraction from allowable abstraction within key overexploitation areas in the same assessment year. Groundwater-level–storage response reflects actual changes in water level, groundwater depth, and shallow groundwater storage at the scales of overexploitation areas, assessment areas, and monitoring stations. These three dimensions characterize resource endowment, development intensity, and system response, respectively, and are not combined into a composite index so as to avoid subjectivity in weight selection [20]. The resource base was represented directly by the multi-year mean groundwater resource assessment data provided by the water authorities, using groundwater resources and groundwater resources per unit area.
Development pressure was diagnosed from actual and allowable abstraction within the same spatial scope. Their ratio was used to identify relative intensity, whereas their difference was used to identify the volume exceeding allowable abstraction; because the two rankings may differ, both were considered jointly. Groundwater-level–storage response was characterized using year-end mean groundwater depth in overexploitation areas, station-level groundwater-depth differences, and shallow groundwater-storage change. Regional mean changes, distributions of rising and declining levels among stations, and storage depletion were compared to test whether changes in city-level total abstraction reflect local conditions.
Influencing-factor analysis first used multi-year monthly means to describe seasonal correspondence and then calculated raw correlations from complete monthly series. Correlations were recalculated after controlling for month effects and linear trends, and the two sets of results were compared to identify the influence of common temporal patterns. Rank correlations and leave-one-year-out tests were used to evaluate sensitivity to the correlation measure and sample years. Because synchronized observations of soil water–salt conditions and vegetation were unavailable, ecological constraints were not included in the quantitative evaluation and are discussed only in terms of their implications.
3.2. Development Pressure Indicators
The groundwater abstraction pressure index R was used to represent the deviation of actual groundwater abstraction from allowable abstraction and was calculated as follows:
where Qa and Qe are, respectively, actual and allowable groundwater abstraction within the same statistical scope and assessment year, in 108 m3 (1 × 10⁸ m3 is approximately 104 ha·m). R is dimensionless. R > 1 indicates that actual abstraction exceeds allowable abstraction, and larger values indicate greater relative abstraction pressure. The R values for key overexploitation areas under the five cities in 2024 were calculated using actual and allowable groundwater abstraction data provided by the water authorities.Net abstraction excess, Qa − Qe, and its proportion of actual abstraction, (Qa − Qe)/Qa × 100%, were also calculated to represent the absolute volume exceeding allowable abstraction and its magnitude relative to current abstraction, respectively. The ratio and difference were used jointly to distinguish relative development intensity from absolute water-volume excess.
R = Qa/Qe
3.3. Groundwater-Level Change and Station Statistics
Groundwater depth is the vertical distance from the land surface to the groundwater table; an increase in groundwater depth indicates a decline in groundwater level [21]. The groundwater-depth difference between two time points was used to characterize water-level change:
where H0 and Ht are groundwater depths at the beginning and end of the analysis period, respectively, in m. ΔH > 0 indicates groundwater-level decline, ΔH < 0 indicates groundwater-level rise, and ΔH = 0 indicates no change.Interannual analysis of overexploitation areas used the arithmetic mean year-end groundwater depths for 2020–2024 obtained from groundwater-depth statistics provided by the water authorities. The cumulative depth difference was calculated as the 2024 year-end value minus the 2020 year-end value, and the mean annual water-level change rate was calculated as −ΔH/4, in m/a.
ΔH = Ht − H0
Station-level analysis used groundwater monitoring data provided by the water authorities. Records were screened to include stations located in the five study cities, with unique station codes, coordinates, and groundwater-depth observations for December 2018 and December 2025, yielding 515 stations. The contemporaneous change at each station was calculated as the December 2025 monthly mean depth minus the December 2018 monthly mean depth, and the original coordinates were used to map the spatial distribution of stations with rising and declining groundwater levels.
For each city, the median ΔH, the 25th percentile (P25), and the 75th percentile (P75) were calculated, together with the numbers of stations showing groundwater-level decline, rise, or no change. The median represents the central tendency of station-level changes, while P25–P75 represents the middle 50% of the groundwater-depth-difference distribution. Percentiles were calculated by linear interpolation between adjacent positions in the ordered sample. All stations were equally weighted, and station-count proportions do not represent area proportions of the corresponding change classes.
3.4. Seasonal Variation Statistics
Groundwater depth was matched by year and month with precipitation, river runoff, and groundwater abstraction. Arithmetic means for the same calendar month across different years were calculated to obtain a 12-month multi-year mean seasonal cycle. Seasonal correspondence among water-source conditions, abstraction, and groundwater depth was described by comparing high-value months, variation ranges, and the sequence of peak months. Both city-level series and the “Hexi Corridor” regional series provided in the datasets were analyzed; runoff and abstraction were converted uniformly to 108 m3.
Seasonal analysis of precipitation, runoff, and groundwater depth used data for 2018–2025 (96 months for each series), whereas abstraction and groundwater depth used data for 2018–2023 (72 months), with complete monthly records over the corresponding periods. Monthly abstraction data for 2024 and 2025 were generated by allocating annual totals according to the monthly proportions in 2022; therefore, these two years were included only in annual abstraction analysis and excluded from monthly seasonal comparisons and correlation analysis.Multi-year monthly means were used to describe seasonal processes, while correlation coefficients were calculated from the complete 72-month paired series described in the following section.
3.5. Raw and Time-Adjusted Correlation Analysis
Correlation analysis used monthly data from January 2018 to December 2023. Groundwater depth H, precipitation P, river runoff Q, and groundwater abstraction A were matched by city, year, and month, yielding 72 complete observations for each city. Groundwater-depth records were consistent across the three source tables. Pearson correlation coefficients r were calculated between H and each influencing factor using the complete monthly series, yielding 15 contemporaneous correlations across the five cities. Positive and negative values of r indicate same-direction and inverse associations, respectively, while |r| represents the strength of the contemporaneous linear association. An increase in H corresponds to a decline in groundwater level.
To account for shared seasonal patterns and linear trends, H, P, Q, and A were each fitted separately within each city using ordinary least squares regression with an intercept, 11 calendar-month dummy variables, and a linear time trend. January was the reference month. The month effects represented recurring seasonal differences, while the trend term described linear change over the study period. The time variable t was defined as the number of months elapsed since January 2018 divided by 12, ranging from 0 to 71/12. The model was:
where zt is the observed value of the analyzed variable at time t; Mt is the calendar month; I equals 1 when Mt = m and 0 otherwise; and α, β, and γm are the intercept, linear-trend coefficient, and month-effect coefficients, respectively. The residual εt represents the deviation from the fitted seasonal and linear-trend components. Pearson correlations were then calculated between groundwater-depth residuals and the residuals of each influencing factor for matching months and denoted ra. Accordingly, ra characterizes contemporaneous covariation after adjustment for calendar-month effects and linear trends. All residual pairs retained their original monthly alignment; this adjustment therefore distinguishes associations beyond the modeled temporal patterns rather than estimating a recharge–response lag.
Two approaches were used to examine the stability of the association results. First, Spearman rank correlation coefficients ρa were calculated for the same residual pairs to compare the directions of linear and rank associations. Second, one complete year from 2018–2023 was removed in turn; Equation (3) was refitted using the remaining 60 months while retaining the original time coordinates, and ra was recalculated. The minimum and maximum of the six resulting coefficients were retained. This range reflects sensitivity to the sampled years and is not a confidence interval.
To examine delayed associations with precipitation, groundwater depth in month t was paired with precipitation in month t − k, where k ranged from 0 to 6 months. Antecedent precipitation was additionally represented by the cumulative precipitation over the preceding three and six months, excluding the current month. These windows were selected to examine monthly to half-year associations. All comparisons used the same groundwater-depth observation period, July 2018–December 2023, yielding 66 paired observations per city. For each pairing, groundwater depth and the corresponding precipitation variable were separately regressed on calendar-month effects and a linear trend using Equation (3), with temporal predictors indexed to the groundwater-depth observation month. Pearson correlations were then calculated between the residuals. The contemporaneous correlation was recalculated over the same 66 months to provide a consistent reference. Sensitivity of the antecedent-precipitation correlations was assessed by omitting each calendar year in turn and refitting the temporal-adjustment models.
3.6. Estimation of Shallow Groundwater-Storage Change
Shallow groundwater-storage changes were obtained from groundwater-storage assessment data provided by the water authorities, which were based on the water-table fluctuation method. The relationship between storage change, assessment area, specific yield, and water-level change is expressed as follows [22]:
where ΔW is groundwater-storage change in 108 m3; μ is specific yield (dimensionless); A is the calculated assessment area in km2; and Δh is water-level change in m, positive for water-level rise and negative for water-level decline, with Δh = −ΔH. In the order Jiuquan, Jiayuguan, Zhangye, Jinchang, and Wuwei, the source table lists A as 14,143, 430, 11,648, 2901, and 5846 km2 and μ as 0.12, 0.17, 0.11, 0.23, and 0.12, respectively. The storage-change estimates reported in the source table were retained for regional comparison. The five-city total, regional shares, and losses per unit area were calculated from these source values, with storage changes presented to two decimal places in units of 108 m3.
ΔW = 0.01 μAΔh
4. Results
4.1. Groundwater Resource Base and Development Characteristics
4.1.1. Groundwater Resource Base in the Plains
Total groundwater resources in the plains of the five cities were 4.255 billion m3, corresponding to a calculated assessment area of 32,021.09 km2 (Table 2). Groundwater resources were concentrated mainly in Jiuquan and Zhangye, followed by Wuwei, with lower values in Jinchang and Jiayuguan.
Table 2.
Groundwater resources and assessment areas in the plains of the five cities.
Groundwater resources in the plains of Jiuquan and Zhangye were 1.642 and 1.472 billion m3, respectively, together accounting for 73.2% of the total for the five cities, demonstrating strong regional differences in the plain-area resource base.
Calculated as the ratio of multi-year mean annual groundwater resources to assessment area, groundwater resources per unit area ranged from 9.1 to 27.2 × 10⁴ m3/(km2·a). Jiayuguan had the highest value (27.2), followed by Wuwei (14.8), Zhangye (13.3), and Jiuquan (13.2), while Jinchang had the lowest value (9.1). Jinchang had the lowest groundwater resources per unit area but the highest abstraction pressure index in 2024 (Section 4.2.1), indicating that mismatch between resource conditions and development intensity is an important basis for its relatively high carrying pressure.
4.1.2. Changes in Groundwater Development and Utilization
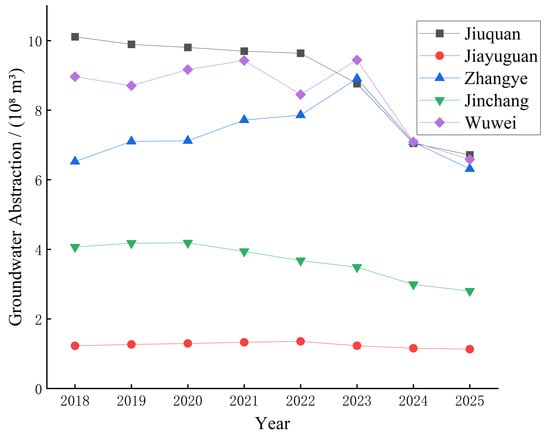
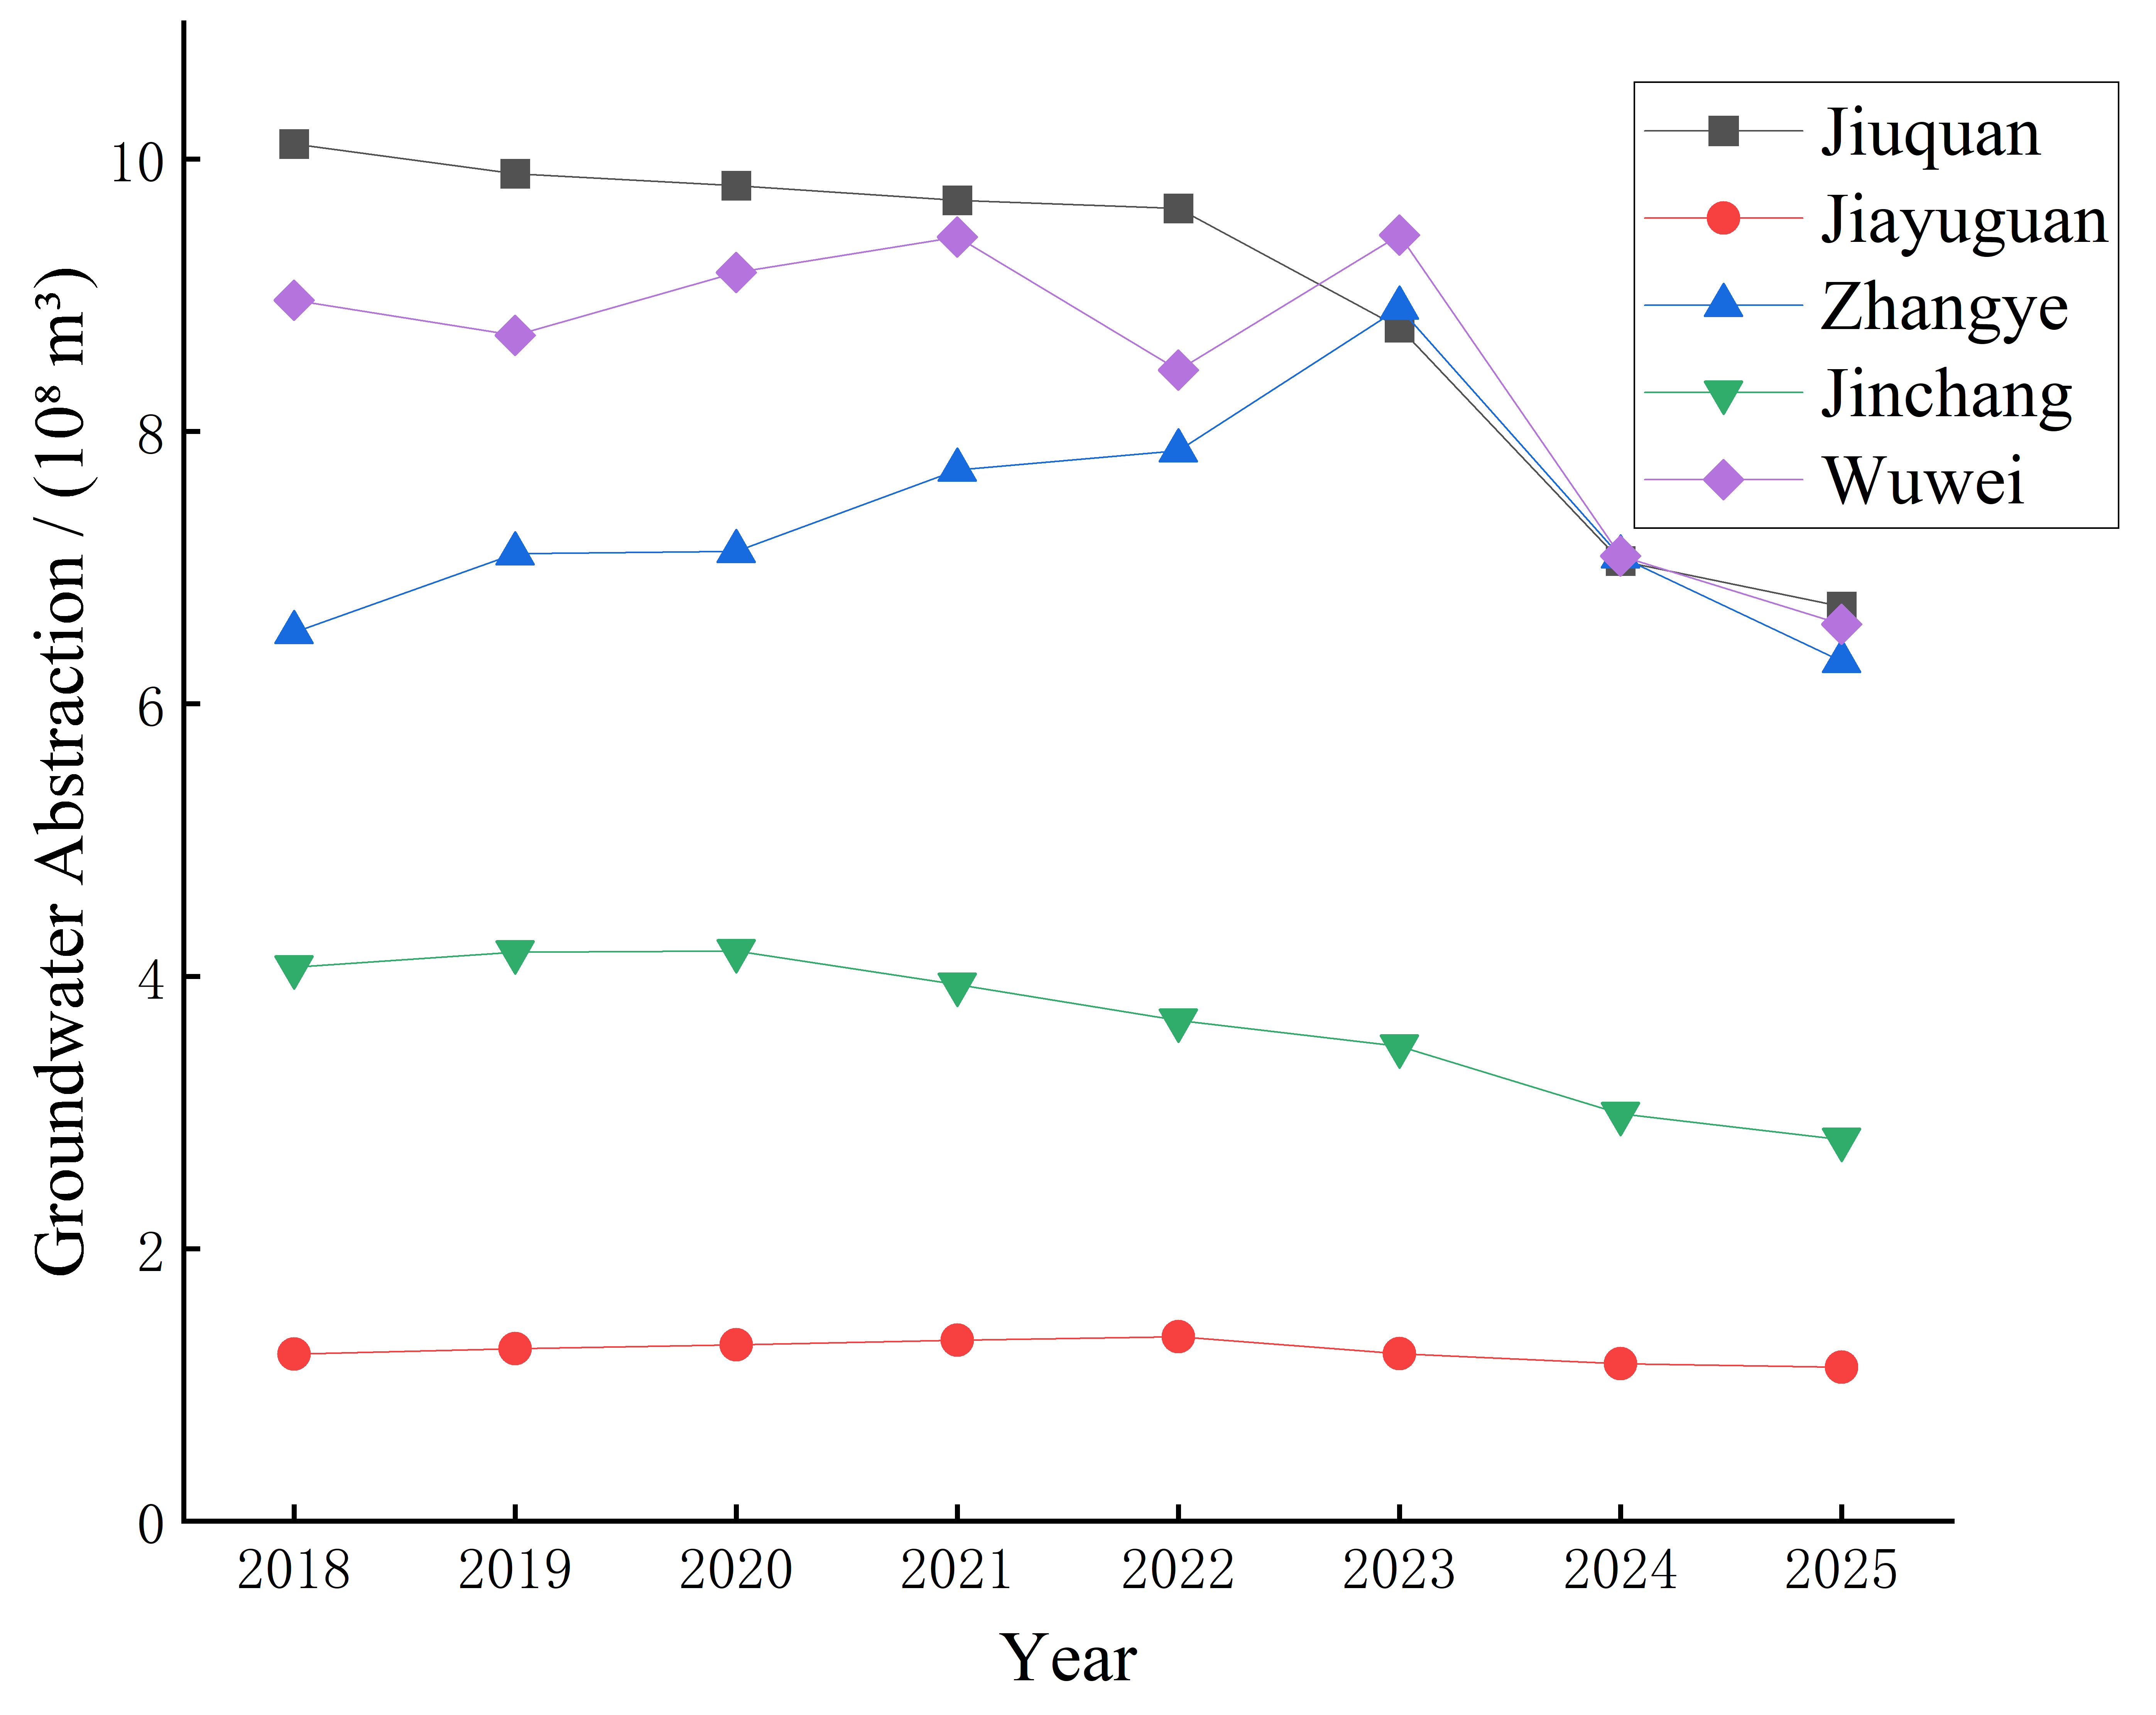
From 2018 to 2025, total groundwater abstraction in the five cities showed a fluctuating downward trend (Figure 2). Total abstraction increased from 3.089 billion m3 in 2018 to 3.211 billion m3 in 2021, was 3.098 and 3.183 billion m3 in 2022 and 2023, respectively, and then declined to 2.536 and 2.354 billion m3 in 2024 and 2025. Compared with 2018, abstraction in 2025 decreased by 0.735 billion m3, or 23.8%; compared with 2021, it decreased by 26.7%.
Figure 2.
Changes in groundwater abstraction in key areas of the Hexi Corridor from 2018 to 2025 (city-level records).
The magnitude of change differed among the cities. From 2018 to 2025, groundwater abstraction decreased by 33.6%, 31.1%, and 26.5% in Jiuquan, Jinchang, and Wuwei, respectively, and by 7.8% in Jiayuguan. Zhangye showed larger interannual fluctuations: abstraction increased from 0.652 billion m3 in 2018 to 0.891 billion m3 in 2023 and then declined to 0.631 billion m3 in 2025. Abstraction at the end of the study period was lower than at the beginning in all five cities, although the trajectories and magnitudes of decline differed regionally.
4.1.3. Groundwater-Use Structure and Development Characteristics
Groundwater-use structure in the key overexploitation areas exhibited two distinct patterns in 2024 (Table 3). Agricultural water use dominated in Jiuquan, Zhangye, Jinchang, and Wuwei, accounting for 93.0%, 96.9%, 92.9%, and 90.8%, respectively, and exceeding 90% in all four areas.
Table 3.
Groundwater-use composition in key overexploitation areas in 2024 (%).
In contrast, industrial and domestic use dominated in Jiayuguan, accounting for 67.3% and 32.7%, respectively; agricultural and ecological water use were both zero within this statistical scope. Thus, the principal groundwater-use sectors differed markedly among the key overexploitation areas of the five cities.
4.2. Regional Differences in Development Pressure and Groundwater-Level Change
4.2.1. Relative Abstraction Pressure and Net Abstraction Excess
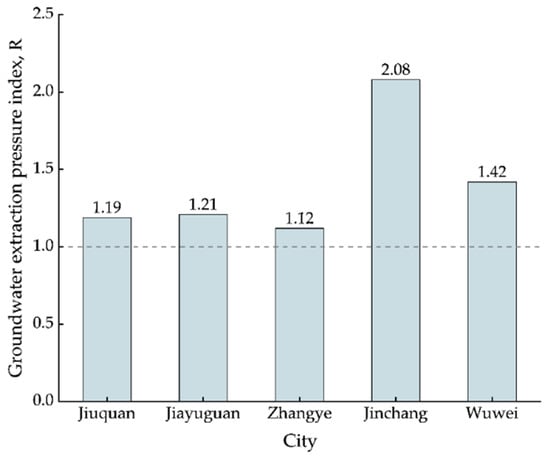
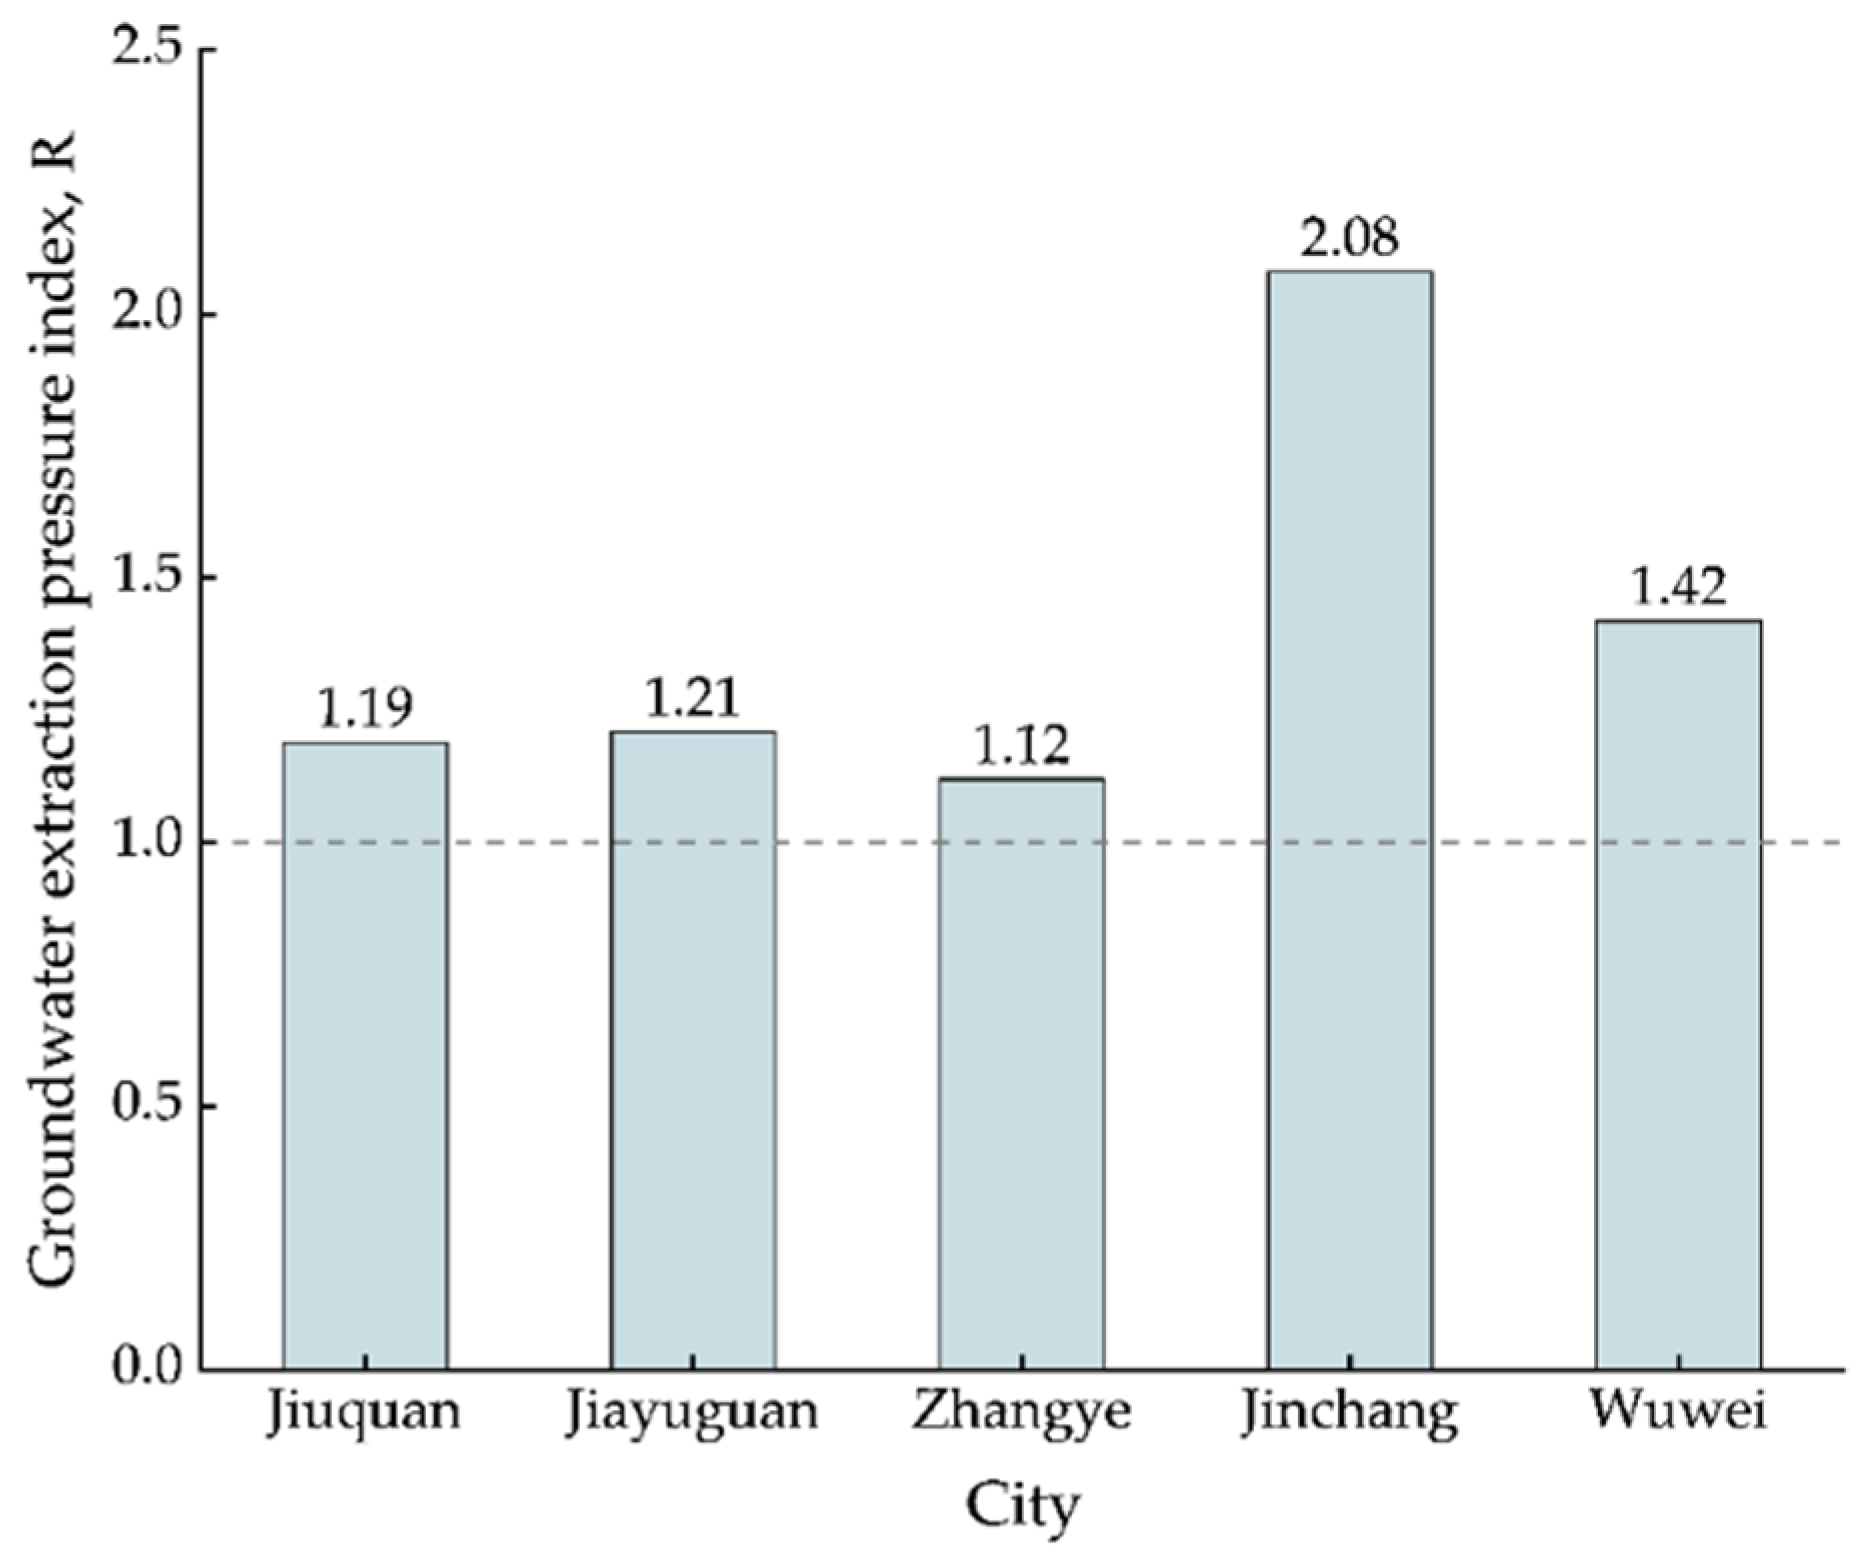
The groundwater abstraction pressure index R was greater than 1 in the key overexploitation areas of all five cities in 2024 (Table 4; Figure 3). Jinchang had the highest value (2.08), followed by Wuwei (1.42); Jiayuguan, Jiuquan, and Zhangye had values of 1.21, 1.19, and 1.12, respectively. Actual abstraction exceeded allowable abstraction in all key overexploitation areas, with the strongest relative development pressure in Jinchang.
Table 4.
Groundwater abstraction pressure and net abstraction excess in key overexploitation areas of the Hexi Corridor in 2024.
Figure 3.
City-level comparison of the groundwater abstraction pressure index in key overexploitation areas of the Hexi Corridor in 2024. Note: The dashed horizontal line indicates the reference threshold of R = 1; values above this line indicate that groundwater abstraction exceeds the allowable level.
The regional ranking of net abstraction excess differed from that of R. Wuwei had the largest net excess (0.209 billion m3), which was greater than Jinchang’s (0.155 billion m3). Net excess accounted for 51.8% and 29.7% of actual abstraction in Jinchang and Wuwei, respectively. Thus, Jinchang was characterized by higher relative abstraction intensity, whereas Wuwei was characterized by a larger absolute excess-abstraction volume. Values for the other three cities are provided in Table 4.
4.2.2. Mean Groundwater Depth in Overexploitation Areas and Station-Level Water-Level Change
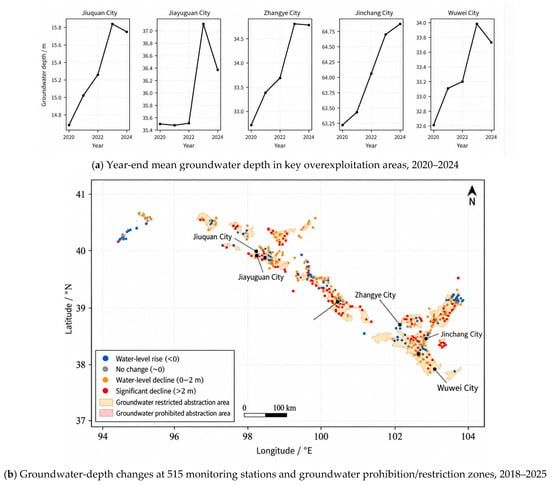
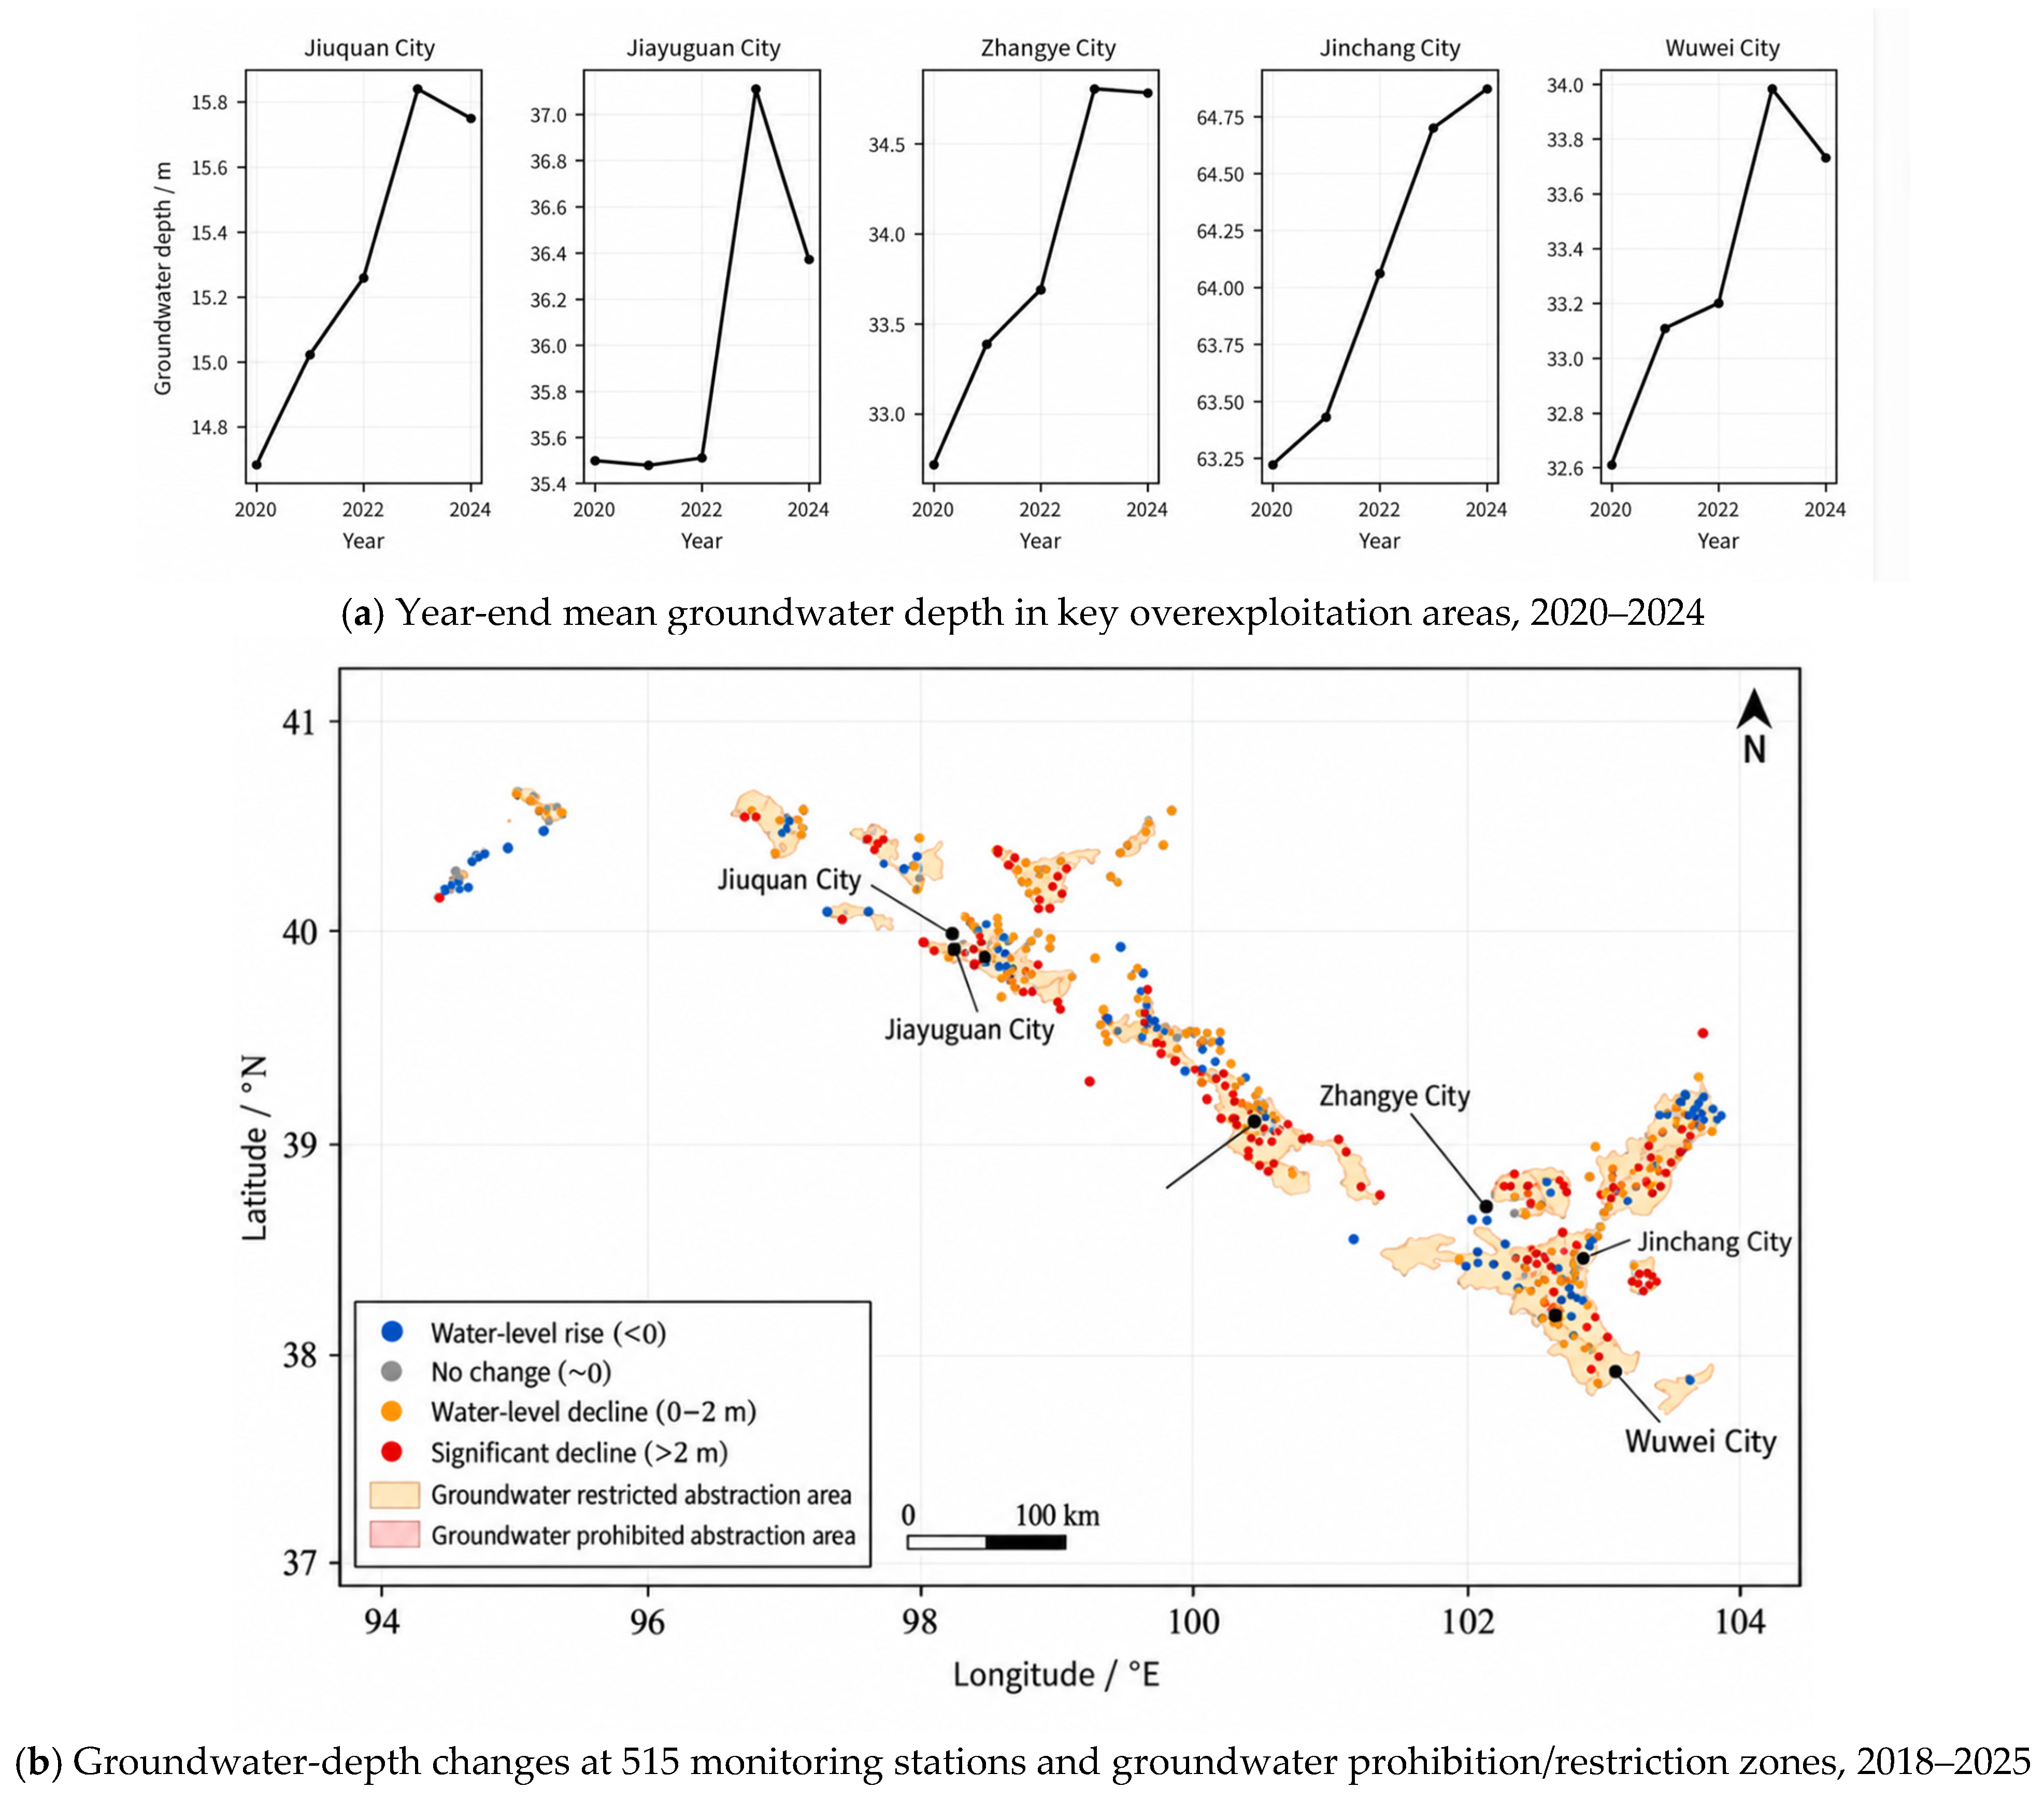
Year-end mean groundwater depth increased in the overexploitation areas under all five cities from 2020 to 2024, with cumulative increases of 0.87–2.06 m (Figure 4a). Zhangye and Jinchang increased by 2.06 and 1.65 m, respectively, representing the largest increases; Jiuquan, Jiayuguan, and Wuwei increased by 1.07, 0.87, and 1.12 m, respectively.
Figure 4.
Interannual groundwater depth in overexploitation areas and spatial distribution of station-level groundwater-depth changes. Note: (a) Arithmetic mean year-end groundwater depth in overexploitation areas; y-axes are independent among panels. (b) Difference between December 2025 and December 2018 monthly mean groundwater depth (ΔH), classified into four levels using 0 and 2 m as thresholds (2 m is approximately equivalent to 0.29 m/a).
The interannual trajectories combined persistent decline with episodic recovery. Year-end mean groundwater depth increased continuously in Jinchang. Jiuquan, Zhangye, and Wuwei increased from 2020 to 2023 and decreased slightly in 2024. Jiayuguan changed little from 2020 to 2022, increased in 2023, and declined in 2024. In the order Jiuquan, Jiayuguan, Zhangye, Jinchang, and Wuwei, mean annual groundwater-level change rates were −0.27, −0.22, −0.52, −0.41, and −0.28 m/a, respectively.
Station-level observations also showed pronounced spatial differences. From December 2018 to December 2025, groundwater levels declined at 404 of the 515 stations, rose at 109 stations, and remained unchanged at 2 stations; groundwater-depth differences ranged from −22.42 to 12.95 m (Figure 4b). Stations with declining levels predominated, while local recovery also occurred.
City-level statistics showed positive median groundwater-depth differences in all five cities (Table 5): 0.78 m in Jiuquan, 2.14 m in Jiayuguan, 1.22 m in Zhangye, 1.49 m in Jinchang, and 0.80 m in Wuwei. In Jinchang, P25–P75 ranged from −0.12 to 3.99 m, indicating a relatively wide distribution for the middle 50% of stations. Jiayuguan had a relatively large median but only 16 monitoring stations. Both declining and rising groundwater levels occurred in every city, indicating local differences beyond regional mean changes.
Table 5.
City-level summaries of station groundwater-depth changes from 2018 to 2025.
On an area basis, the proportions of areas with groundwater-level decline in 2025 relative to 2018 were 83.7% in Jiuquan, 96.0% in Jiayuguan, 81.7% in Zhangye, 49.0% in Jinchang, and 81.0% in Wuwei. Compared with station proportions, differences were no more than 7 percentage points in Jiuquan (82.5%), Jiayuguan (93.8%), Zhangye (79.5%), and Wuwei (74.4%). In Jinchang, however, 70.3% of stations showed decline whereas the declining-area proportion was only 49.0%, a difference of 21.3 percentage points, indicating that monitoring stations were preferentially concentrated in declining areas. Station proportions therefore reflect changes under monitoring-network coverage, whereas area proportions reflect regional conditions; the two cannot substitute for each other.
4.2.3. Shallow Groundwater-Storage Change
Shallow groundwater-storage changes were negative in all five cities from 2018 to 2025, with a combined change of −69.14 × 10⁸ m3 (Table 6). Storage losses were 31.91 × 10⁸ m3 in Zhangye, 21.92 × 10⁸ m3 in Jiuquan, and 10.27 × 10⁸ m3 in Wuwei, accounting for 46.2%, 31.7%, and 14.9% of the total loss, respectively. Jinchang and Jiayuguan recorded smaller losses of 3.68 × 10⁸ and 1.36 × 10⁸ m3, respectively.
Table 6.
Shallow groundwater-storage change in the five cities, 2018–2025.
Spatial differences in storage change during 2018–2025 were jointly determined by water-level change, assessment area, and specific yield. Zhangye had the largest groundwater-level decline (2.46 m) and the largest storage loss, consistent in both measures. Jiuquan’s water-level decline was 1.29 m, only 52% of that in Zhangye, but its assessment area (14,143 km2) was approximately 1.2 times that of Zhangye, so its storage loss still ranked second. Per unit area, Jiayuguan’s storage loss was 31.7 × 10⁴ m3/km2, higher than Zhangye (27.4), Wuwei (17.6), Jiuquan (15.5), and Jinchang (12.7), reflecting strong water-level decline despite its small assessment area. Jinchang had the smallest groundwater-level decline (0.55 m) and a storage change of −3.68 × 10⁸ m3, despite its relatively high specific yield (0.23).
Comparison with groundwater-level results shows that storage changes were negative in all five cities, consistent in direction with groundwater-level decline; however, their magnitude rankings did not fully correspond, indicating that a single-station water level or a single groundwater-depth indicator cannot substitute for storage assessment.
4.3. Associations of Precipitation, Runoff, and Abstraction with Groundwater Depth
4.3.1. Interannual Changes in Precipitation and River Runoff
Precipitation and river runoff in the Hexi Corridor showed interannual fluctuations from 2018 to 2025. Annual precipitation was 133.6 mm in 2020, increased to 309.4 mm in 2024, and was 284.2 mm in 2025. River runoff declined from 5.738 billion m3 in 2020 to 4.777 billion m3 in 2023, then increased to 6.147 billion m3 in 2024 and was 5.997 billion m3 in 2025. Both water-source indicators increased in 2024 and decreased somewhat in 2025.
4.3.2. Seasonal Correspondence of Groundwater Depth with Precipitation and Runoff
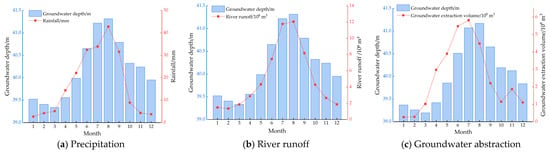
During 2018–2025, the regional multi-year mean precipitation for the same calendar month was relatively high from July to September and reached 42.78 mm in August (Figure 5a). Over the same period, mean groundwater depth gradually increased from spring, with a minimum of 39.34 m in March and a maximum of 41.31 m in August, and then decreased. The high-precipitation period therefore overlapped seasonally with the period of increasing groundwater depth.
Figure 5.
Seasonal variations in groundwater depth, precipitation, river runoff, and groundwater abstraction in the Hexi Corridor. Note: (a,b) are arithmetic means for the same calendar month over 2018–2025 (96 months each); (c) is the corresponding mean for 2018–2023 (72 months). The left axis is groundwater depth; the right axes represent precipitation, runoff, and abstraction, respectively. Mean groundwater depth was calculated separately for the two different time ranges.
Runoff also showed clear seasonal concentration, with the regional multi-year monthly mean reaching 1.205 billion m3 in August (Figure 5b). Runoff peaked in August in Jiuquan and Wuwei, July in Jiayuguan and Zhangye, and September in Jinchang. Interannual comparison showed that both precipitation and runoff increased in 2024 relative to 2023, whereas regional mean groundwater depth increased from 40.71 to 41.18 m, indicating that increased water-source indicators were not synchronized with groundwater-level recovery.
4.3.3. Seasonal Correspondence of Groundwater Depth with Abstraction
During 2018–2023, the regional multi-year mean monthly groundwater abstraction peaked at 0.598 billion m3 in July, whereas mean groundwater depth was lowest in March (39.00 m) and highest in August (40.96 m) (Figure 5c). The period of high abstraction generally overlapped with the period of increasing groundwater depth, and the abstraction peak preceded the groundwater-depth peak by one calendar month.
Peak abstraction months differed among cities: July in Jiuquan, Zhangye, and Wuwei; June in Jiayuguan; and May in Jinchang. The multi-year mean groundwater depth in all five cities reached its maximum in August. Compared with the other four cities, seasonal fluctuations in groundwater abstraction were relatively small in Jiayuguan.
4.3.4. Differences in Association Before and After Temporal-Structure Adjustment
All 15 raw correlation coefficients between groundwater depth and precipitation, runoff, and abstraction in the five cities were positive during 2018–2023 (Table 7). Correlations between runoff and groundwater depth ranged from 0.473 to 0.700, and those between abstraction and groundwater depth ranged from 0.388 to 0.586, indicating synchronous variation in the raw monthly series. After month effects and linear trends were controlled, the absolute values of 14 correlations decreased and 11 changed from positive to negative, showing that raw contemporaneous associations were sensitive to temporal adjustment.
Table 7.
Raw and time-adjusted associations between groundwater depth and influencing factors, 2018–2023.
All time-adjusted Pearson correlations between abstraction and groundwater depth were negative (−0.309 to −0.038), and the corresponding Spearman rank correlations were also negative. In leave-one-year-out tests, coefficients remained negative in Jiuquan, Zhangye, and Wuwei but crossed zero in Jiayuguan and Jinchang. Adjusted associations of precipitation and runoff varied among cities; the leave-one-year-out ranges crossed zero for precipitation in Jiayuguan and for both precipitation and runoff in Jinchang. These results indicate that the direction and year-to-year stability of associations should be interpreted separately by city and variable.
Two adjusted associations showed opposite signs for Pearson and Spearman coefficients: precipitation in Jiayuguan (−0.067 versus 0.038) and precipitation in Jinchang (0.048 versus −0.015). All four coefficients had absolute values below 0.07, indicating weak relationships whose directions were sensitive to individual months or outliers; they should therefore not be interpreted as robust positive or negative associations.
4.3.5. Lagged and Antecedent Precipitation Associations with Groundwater Depth
Time-adjusted precipitation–depth correlations varied among cities and lag intervals (Table 8). In Jiuquan, the correlation changed from −0.151 at zero lag to −0.361 at a one-month lag, whereas in Zhangye it changed from −0.040 at zero lag to −0.180 at a three-month lag. Jinchang exhibited its most negative coefficient at a four-month lag (−0.243). In Jiayuguan and Wuwei, all lagged coefficients had absolute values below 0.11. These patterns indicate regional differences in the temporal association between precipitation and groundwater depth.
Table 8.
Time-adjusted correlations of groundwater depth with lagged and antecedent precipitation.
Correlations with precipitation accumulated over the preceding three months were −0.352 in Jiuquan and −0.231 in Zhangye, compared with −0.158 and −0.075, respectively, for the preceding six months. In the other three cities, the absolute values of the cumulative-precipitation correlations did not exceed 0.130. Leave-one-year-out analysis showed that the three-month cumulative-precipitation correlation in Zhangye remained negative, ranging from −0.562 to −0.006, whereas the ranges for the other nine city–window combinations crossed zero. Thus, the associations with antecedent precipitation differed in both magnitude and sensitivity to the sampled years.
5. Discussion
5.1. Persistence of Local Groundwater Pressure Under Abstraction Reduction
Reduced groundwater abstraction and recovery of the groundwater system represent different processes. Declining abstraction implies some alleviation of anthropogenic withdrawal pressure, whereas recovery of groundwater levels and storage depends on the balance between recharge and discharge. Groundwater abstraction in the five cities fluctuated during 2018–2023, with the more pronounced reductions concentrated in 2024–2025. Consequently, the decline in abstraction at the end of the study period is not inconsistent with the net storage loss over the full period. Actual abstraction in the key overexploitation areas still exceeded allowable abstraction in 2024, further indicating that development pressure persisted in some areas after reductions in regional totals. Evaluation of abstraction-control effectiveness should therefore consider both changes in withdrawal volume and groundwater-level changes and their duration within the same spatial area [4,7].
Previous monitoring studies show that groundwater decline and recovery coexist in the Hexi Corridor. Using April monitoring data from 2019–2023, Cao et al. [5] found that stations with increasing and decreasing groundwater depth each accounted for 50% in the Shiyang River Basin, while the corresponding proportions in the Shule River Basin were 52% and 48%. In the present study, 78.4% of the 515 monitoring stations showed groundwater-level decline, a higher proportion. The difference may reflect differences in spatial coverage, observation dates, and statistical periods: the earlier study covered parts of the plains in the Shiyang and Shule River basins, whereas the present study covers five cities and compares groundwater depths in December 2018 and December 2025. Both studies indicate coexistence of local recovery and continued decline, and differences in station proportions alone cannot be used to conclude that regional groundwater conditions have further deteriorated.
Persistence of local pressure may also be related to spatial differences in withdrawal distribution and recharge conditions. A decline in city-level total abstraction does not mean that all irrigation districts or withdrawal-concentration areas reduce abstraction by the same proportion. Likewise, the same change in abstraction may produce different water-level responses under different aquifer and recharge conditions. Studies of the Shiyang River Basin emphasize the importance of water transformation processes in coordinating irrigation demand, surface-water supply, and groundwater use. The coexistence of increased mean groundwater depth in overexploitation areas and water-level recovery at some monitoring stations in this study indicates diverse local processes beyond regional averages.
5.2. Seasonal Recharge–Discharge Processes and Groundwater Association Characteristics
Raw correlations of precipitation, runoff, and abstraction with groundwater depth were all positive, which is related to the concentration of seasonal high values of several variables during the warm season. Multi-year monthly means showed that regional abstraction peaked in July, groundwater depth reached its maximum in August, and high precipitation and runoff were also concentrated during this period. Thus, increased precipitation or runoff and increased groundwater depth can occur simultaneously in raw series and do not imply that increased natural water supply causes groundwater-level decline. After controlling for month effects and linear trends, the absolute values of 14 of the 15 correlations decreased, indicating that raw associations depend substantially on common temporal patterns. In Jinchang, for example, the runoff–depth correlation declined from 0.700 to 0.041, clearly illustrating the influence of seasonal and trend adjustment on interpretation.
All time-adjusted abstraction–depth correlations were negative and represent contemporaneous relationships between deviations from each variable’s average seasonal pattern and linear trend. Possible explanations include substitution between surface-water supply and groundwater abstraction, continuation of earlier recharge–discharge effects, and differences in water-use scheduling among regions. For example, groundwater abstraction may increase in months with relatively low surface-water supply, while groundwater depth in the same month may still reflect previous recharge conditions; such temporal mismatch can change the direction of contemporaneous correlations. This interpretation is consistent with the understanding that surface water, groundwater, and return flow jointly participate in irrigation-district water cycles [18], but the specific mechanisms require further testing using surface-water supply data and lagged variables.
Precipitation and river runoff differ in their pathways to groundwater recharge. Precipitation is affected by evapotranspiration, soil-water storage, and infiltration, whereas runoff is modified by diversion, riverbed leakage, and upstream–downstream transport. Consequently, contemporaneous correlations capture only part of the temporal association between water inputs and groundwater depth. The lagged analysis identified more negative precipitation–depth correlations at a one-month lag in Jiuquan, a three-month lag in Zhangye, and a four-month lag in Jinchang than at zero lag (Table 8). These differences indicate that the precipitation–depth association varies with the lag interval and among cities; the corresponding intervals do not directly measure the travel time of precipitation-derived recharge. Temporal offsets among rainfall, terrestrial water storage, and groundwater variations have also been reported in southern Spain [23]. In the Iğdır Basin, lagged groundwater-storage anomalies were important predictors in GRACE-based machine-learning models, providing further evidence of temporal dependence in groundwater variability [24].
Antecedent precipitation provided additional information on these temporal relationships. In Jiuquan and Zhangye, correlations with precipitation accumulated over the preceding three months were more negative than the corresponding contemporaneous correlations, whereas extending the accumulation window to six months reduced their absolute magnitudes. However, the three-month association in Jiuquan changed sign in the leave-one-year-out analysis, while that in Zhangye remained negative. The results therefore indicate a city-specific association with antecedent precipitation rather than a uniform cumulative response across the Hexi Corridor. Interpretation of recharge timing should distinguish these statistical associations from the physical transport of recharge water and account for concurrent abstraction and other recharge–discharge processes.
Leave-one-year-out results further demonstrate regional differences in association stability. Residual abstraction–depth correlations remained negative in all tests for Jiuquan, Zhangye, and Wuwei, whereas the ranges crossed zero in Jiayuguan and Jinchang, indicating stronger dependence on the sampled years in the latter two cities. Small or directionally unstable correlations may indicate weak contemporaneous linear relationships or may result from response lags, nonlinearities, and superposition of multiple recharge–discharge processes. The results therefore support city-specific interpretation of associations rather than a single correlation-based ranking of influencing-factor importance across all five cities.
5.3. Regional Differences Between Groundwater-Level and Storage Changes
Regional rankings of groundwater-level decline intensity and storage-loss magnitude differed mainly because storage change is jointly affected by assessment area, specific yield, and water-level change. In the water-table fluctuation method, storage change varies with all three parameters [16]. Zhangye had a relatively large groundwater-level decline and a broad assessment area, resulting in the largest storage loss. Although the water-level decline in Jiuquan was smaller than that in Zhangye, its larger assessment area resulted in the second-largest storage loss. Storage loss per unit area in Jiayuguan was approximately 31.7 × 10⁴ m3/km2, higher than in the other four cities, but its small assessment area meant that it accounted for only 2.0% of the total five-city loss. These differences indicate that groundwater-level indicators emphasize local change intensity, whereas storage change provides complementary information on regional water-volume magnitude.
The direction of net storage depletion in this study is consistent with previous regional remote-sensing studies. Lei et al. [12], using downscaling methods, found an overall decline in groundwater storage in the Heihe River Basin from 1990 to 2019, indicating that cumulative groundwater consumption is not limited to the period examined here. However, GRACE estimates and the water-table fluctuation method used in this study differ in spatial resolution, aquifer coverage, and storage-separation methods [25]; existing results are suitable for comparing change direction but are insufficient to determine whether the depletion rate estimated here is relatively high or low. The additional contribution of the present study is the side-by-side comparison of shallow groundwater-storage change and current abstraction pressure in the five cities, showing that areas with large cumulative depletion do not necessarily have the highest current relative pressure.
Zhangye accounted for 46.2% of the five-city storage loss but had an abstraction pressure index of 1.12 in 2024; Jinchang had an index of 2.08 but accounted for only 5.3% of storage loss. This difference reflects both the timescale contrast between current development intensity and multi-year cumulative change and the influence of assessment scope and aquifer parameters [16]. Therefore, relatively low current pressure does not directly indicate that historical depletion has been restored, and a relatively small storage loss does not imply low relative development pressure. In addition, because storage change in this study was estimated from water-level change and related parameters, agreement in the direction of water-level and storage changes is partly inherent in the calculation. The primary role of storage change is to quantify water-volume magnitude rather than to provide an independent validation of groundwater-level decline.
The ecological significance of groundwater-level change also depends on local groundwater–soil–vegetation relationships. Liu et al. [26] comprehensively evaluated groundwater ecological functions in the Shiyang River Basin. Cao et al. [27] examined groundwater–soil–vegetation relationships in the oasis–desert transition zone of the Shiyang River Basin and showed that groundwater depth is an important factor affecting vegetation and soil conditions. Groundwater management should therefore identify ecologically sensitive areas and appropriate groundwater-level conditions in addition to focusing on resource depletion.
5.4. Management Implications of Regional Differences
Relative development intensity, excess abstraction volume, and cumulative storage depletion correspond to different management priorities. Jinchang had the highest abstraction pressure index and should focus on the deviation between current abstraction and allowable abstraction. Wuwei had the largest net abstraction excess and should focus on demand reduction and water-source allocation under a relatively large water-volume deficit. Zhangye and Jiuquan had large cumulative storage losses and should strengthen continuous groundwater-level tracking to determine whether depletion slows after abstraction adjustments. These indicators are suitable for jointly identifying priority areas, while specific abstraction-reduction targets should also account for local water-supply conditions, water-use sectors, and ecological demands [28,29].
Water-use structure determines the principal targets of management measures. Agriculture accounted for more than 90% of groundwater use in the key overexploitation areas of Jiuquan, Zhangye, Jinchang, and Wuwei; groundwater regulation in these areas should therefore be coordinated with crop distribution, irrigation demand, and surface-water supply. In Jiayuguan, industrial and domestic use dominated, and management should emphasize industrial water-use efficiency, reuse, and supply-source allocation. Research in the Shiyang River Basin has similarly emphasized coordinating groundwater balance, agricultural benefits, and ecological water requirements, consistent with the differentiated management direction identified here [28].
Seasonal results indicate that periods of high irrigation demand are critical for coordinating surface-water supply and groundwater abstraction. Management can combine incoming-water processes, irrigation schedules, and groundwater dynamics to reduce concentrated abstraction caused by temporal mismatch in water supply [18] and track water-level recovery after the irrigation season. The one-calendar-month interval between the multi-year mean abstraction peak and groundwater-depth peak indicates the sequence of seasonal processes but cannot be used directly to prescribe a uniform lead time for water allocation; scheduling in different regions still requires continuous monitoring and process analysis.
Evaluation of regulation effectiveness should record both withdrawal changes and groundwater responses. City-level totals reflect overall progress in abstraction reduction; abstraction pressure and groundwater levels within fixed spatial scopes identify local changes; and repeated storage assessments determine whether cumulative depletion is being alleviated. In areas where decline and recovery coexist, persistently declining stations and surrounding withdrawal conditions should be further identified to avoid local problems being masked by improved regional averages. Compared with applying a uniform threshold based on a single indicator, such spatially differentiated and continuous evaluation better corresponds to the regional differences revealed in this study.
5.5. Limitations and Future Research
Differences in spatial coverage and observation periods define the scope of comparison among the datasets. City-level annual abstraction describes regional withdrawal trends, whereas the 2024 abstraction-pressure indicators refer specifically to key overexploitation areas. Storage changes represent groundwater-dynamic assessment areas over December 2018–December 2025. These datasets were analyzed within their respective spatial and temporal boundaries rather than combined into a closed groundwater balance. Monthly abstraction values for 2024–2025 were derived from annual totals using the monthly proportions in 2022 and were therefore excluded from monthly association analyses. Consequently, the results support comparisons of development pressure and groundwater change but do not quantify the contribution of abstraction reductions to storage recovery.
Storage estimates are subject to uncertainty associated with specific yield, spatial aggregation, and monitoring-network coverage. Direct substitution of the city-level parameters displayed in the source table into Equation (4) does not exactly reproduce its reported storage changes. The reported estimates were retained consistently, and the discrepancy identifies a reproducibility limitation of the available summary data. Regional storage-loss magnitudes should therefore be interpreted as assessment estimates rather than independently verified water-balance quantities. Refinement of spatially distributed aquifer parameters and sensitivity analysis would strengthen their quantitative interpretation [30].
The precipitation analysis examined contemporaneous associations, lags of up to six months, and antecedent accumulation over three and six months. These results characterize temporal associations at the monthly city scale rather than recharge travel times or independent causal effects. Their sensitivity to the sampled years further emphasizes the importance of temporal coverage. Integrating surface-water deliveries, irrigation return flow, evapotranspiration, and spatially resolved groundwater observations within a coupled modeling framework would help distinguish the processes underlying the observed associations. Such modeling should account for uncertainty in climatic, land-use, and soil inputs, which can affect groundwater-recharge estimates in arid regions [31]. Coordinated observations of groundwater, soil conditions, and vegetation would also improve assessment of the ecological implications of groundwater change.
6. Conclusions
This study evaluated groundwater resource carrying status in five cities of the Hexi Corridor by combining development pressure, groundwater-level and storage changes, and association analysis adjusted for temporal structure. The main conclusions are as follows:
- (1)
- Regional reductions in total groundwater abstraction coexisted with persistent local groundwater pressure, and improvement in carrying status must be judged jointly from development pressure and groundwater dynamics. Total abstraction in the five cities decreased by 23.8% from 2018 to 2025, yet actual abstraction still exceeded allowable abstraction in key overexploitation areas, while groundwater-level decline and net storage depletion remained widespread during the study period. Thus, reduction in abstraction scale and recovery of the groundwater system are not the same process, and changes in regional totals alone are insufficient to fully represent local carrying status.
- (2)
- Relative development intensity, excess abstraction volume, and cumulative storage depletion identified different priority areas and therefore provide complementary evaluation information. Jinchang had the highest relative abstraction pressure, Wuwei had the largest volume exceeding allowable abstraction, and Zhangye and Jiuquan were the main areas of storage depletion. These differences show that current development pressure and multi-year cumulative consumption reflect different aspects of groundwater carrying status. Joint use of intensity, water-volume, and dynamic-change indicators helps distinguish regional pressure characteristics and identify spatially differentiated management priorities.
- (3)
- Common seasonal cycles and long-term trends substantially affected contemporaneous associations of groundwater depth with hydrological and abstraction factors, so interpretation of influencing factors should consider temporal structure and regional differences. After month effects and linear trends were controlled, the absolute values of 14 of the 15 correlations decreased, 11 changed direction, and some associations were sensitive to the sampled years. Synchronous variation in raw series therefore cannot be directly interpreted as an independent effect. Temporal adjustment and stability tests can further distinguish seasonal synchrony from residual variation and provide a basis for interpreting groundwater dynamics and subsequent process analysis.
Author Contributions
Conceptualization, W.X. and W.Z.; methodology, W.X.; formal analysis, Z.L.; investigation, J.C.; resources, W.X. and J.C.; data curation, J.C.; writing—original draft preparation, W.X. and Z.L.; writing—review and editing, W.X., J.C., and W.Z.; visualization, Z.L.; supervision, W.Z.; project administration, W.X. All authors have read and agreed to the published version of the manuscript.
Funding
This research was supported by the Gansu Provincial Water Conservancy Scientific Experimental Research and Technology Extension Project (Grant Nos. 24GSLK066, 24GSLK067, 25GSLK024, 26GSLK040, 26GSLK042, and 26GSLK050).
Data Availability Statement
The data supporting the findings of this study are available from the corresponding author upon reasonable request.
Conflicts of Interest
The authors declare no conflicts of interest.
References
- Wang, L.; Nie, Z.; Yuan, Q.; Liu, M.; Cao, L.; Zhu, P.; Lu, H.; Feng, B. Spatiotemporal Oasis Land Use/Cover Changes and Impacts on Groundwater Resources in the Central Plain of the Shiyang River Basin. Water 2023, 15, 457. [Google Scholar] [CrossRef] [Scilit]
- Wang, S.; Liu, H.; Yu, Y.; Zhao, W.; Yang, Q.; Liu, J. Evaluation of groundwater sustainability in the arid Hexi Corridor of Northwestern China, using GRACE, GLDAS and measured groundwater data products. Sci. Total Environ. 2020, 705, 135829. [Google Scholar] [CrossRef] [Scilit] [PubMed]
- Zhao, H.; Ma, J.; Zhang, L.; Zeng, H.; Huang, Q. Human activities have exacerbated groundwater depletion in arid regions: A case study of the Hexi Corridor, China. J. Hydrol. Reg. Stud. 2025, 61, 102649. [Google Scholar] [CrossRef] [Scilit]
- Liu, X.; Hu, L.; Sun, K.; Yang, Z.; Sun, J.; Yin, W. Improved Understanding of Groundwater Storage Changes under the Influence of River Basin Governance in Northwestern China Using GRACE Data. Remote Sens. 2021, 13, 2672. [Google Scholar] [CrossRef] [Scilit]
- Cao, L.; Liu, X.; Zhu, P.; Wang, L. The Distribution and Evolution of Groundwater Level Depths and Groundwater Sustainability in the Hexi Corridor over the Last Five Years. Sustainability 2024, 16, 2527. [Google Scholar] [CrossRef] [Scilit]
- Meng, G.; Zhu, G.; Liu, J.; Zhao, K.; Lu, S.; Li, R.; Qiu, D.; Jiao, Y.; Chen, L.; Sun, N. GRACE Data Quantify Water Storage Changes in the Shiyang River Basin, an Inland River in the Arid Zone. Remote Sens. 2023, 15, 3209. [Google Scholar] [CrossRef] [Scilit]
- Liu, M.; Nie, Z.; Liu, X.; Wang, L.; Cao, L. Change in groundwater table depth caused by natural change and human activities during the past 40 years in the Shiyang River Basin, northwest China. Sci. Total Environ. 2024, 906, 167722. [Google Scholar] [CrossRef] [Scilit] [PubMed]
- Jasechko, S.; Seybold, H.; Perrone, D.; Fan, Y.; Shamsudduha, M.; Taylor, R.G.; Fallatah, O.; Kirchner, J.W. Rapid groundwater decline and some cases of recovery in aquifers globally. Nature 2024, 625, 715–721. [Google Scholar] [CrossRef] [Scilit] [PubMed]
- Gleeson, T.; Cuthbert, M.; Ferguson, G.; Perrone, D. Global Groundwater Sustainability, Resources, and Systems in the Anthropocene. Annu. Rev. Earth Planet. Sci. 2020, 48, 431–463. [Google Scholar] [CrossRef] [Scilit]
- Elshall, A.S.; Arik, A.D.; El-Kadi, A.I.; Pierce, S.; Ye, M.; Burnett, K.M.; Wada, C.A.; Bremer, L.L.; Chun, G. Groundwater sustainability: A review of the interactions between science and policy. Environ. Res. Lett. 2020, 15, 093004. [Google Scholar] [CrossRef] [Scilit]
- Al Nadabi, M.S.; El-Diasty, M.; Etri, T.; Nikoo, M.R. GRACE Downscaling and Machine Learning Models for Groundwater Prediction: A Systematic Review. Hydrology 2026, 13, 135. [Google Scholar] [CrossRef] [Scilit]
- Lei, Y.; Jiang, X.; Fan, S.; Nie, T.; He, M. Coupled Human–Climate drivers of groundwater storage decline in an arid inland river basin. Int. J. Appl. Earth Obs. Geoinf. 2026, 150, 105370. [Google Scholar] [CrossRef] [Scilit]
- Aghaei Chaleshtori, S.; Ghaffari Aliabad, O.; Fallatah, A.; Faisal, K.; Shirali, M.; Saei, M.; Lacava, T. Monitoring the Impacts of Human Activities on Groundwater Storage Changes Using an Integrated Approach of Remote Sensing and Google Earth Engine. Hydrology 2025, 12, 165. [Google Scholar] [CrossRef] [Scilit]
- Irvine, D.J.; Singha, K.; Kurylyk, B.L.; Briggs, M.A.; Sebastian, Y.; Tait, D.R.; Helton, A.M. Groundwater-Surface water interactions research: Past trends and future directions. J. Hydrol. 2024, 644, 132061. [Google Scholar] [CrossRef] [Scilit]
- Zhang, H.; Chen, Z.-Y.; Tang, C.-Y. Quantifying groundwater recharge and discharge for the middle reach of Heihe River of China using isotope mass balance method. J. Groundw. Sci. Eng. 2021, 9, 225–232. [Google Scholar] [CrossRef]
- Lv, M.; Xu, Z.; Yang, Z.-L.; Lu, H.; Lv, M. A Comprehensive Review of Specific Yield in Land Surface and Groundwater Studies. J. Adv. Model. Earth Syst. 2021, 13, e2020MS002270. [Google Scholar] [CrossRef] [Scilit]
- Jiao, D.; Liu, S.; Xu, Z.; Song, L.; Li, Y.; Liu, R.; Wei, J.; He, X.; Wu, D.; Xu, T.; et al. Spatio-temporal variations and multi-scale correlations of climate, water, land, and vegetation resources over the past four decades in the Heihe River Basin. J. Hydrol. Reg. Stud. 2024, 55, 101941. [Google Scholar] [CrossRef] [Scilit]
- Hu, X.; Su, X.; Zhu, X.; Chu, J.; Zhang, T.; Wu, H. Suitable irrigation scale of inland river basin in arid areas considering water transformation process. Trans. Chin. Soc. Agric. Eng. 2024, 40, 228–236, (In Chinese with English abstract). [Google Scholar] [CrossRef]
- Xie, C.; Liu, H.; Li, X.; Zhao, H.; Dong, X.; Ma, K.; Wang, N.; Zhao, L. Spatial characteristics of hydrochemistry and stable isotopes in river and groundwater, and runoff components in the Shule River Basin, Northeastern of Tibet Plateau. J. Environ. Manag. 2024, 349, 119512. [Google Scholar] [CrossRef] [Scilit] [PubMed]
- Akbar, H.; Nilsalab, P.; Silalertruksa, T.; Gheewala, S.H. Comprehensive review of groundwater scarcity, stress and sustainability index-based assessment. Groundw. Sustain. Dev. 2022, 18, 100782. [Google Scholar] [CrossRef] [Scilit]
- Baird, A.J.; Low, R.G. The water table: Its conceptual basis, its measurement and its usefulness as a hydrological variable. Hydrol. Process. 2022, 36, e14622. [Google Scholar] [CrossRef] [Scilit]
- Crosbie, R.S.; Doble, R.C.; Turnadge, C.; Taylor, A.R. Constraining the Magnitude and Uncertainty of Specific Yield for Use in the Water Table Fluctuation Method of Estimating Recharge. Water Resour. Res. 2019, 55, 7343–7361. [Google Scholar] [CrossRef] [Scilit]
- Pardo-Igúzquiza, E.; Montillet, J.-P.; Sánchez-Morales, J.; Dowd, P.A.; Luque-Espinar, J.A.; Darbeheshti, N.; Rodríguez-Tovar, F.J. Assessing Terrestrial Water Storage Variations in Southern Spain Using Rainfall Estimates and GRACE Data. Hydrology 2023, 10, 187. [Google Scholar] [CrossRef] [Scilit]
- Çelik, M.A.; Bilik, A.; Paşa, Y. Understanding Long-Term Groundwater Storage Variability Using GRACE Data and Explainable Machine Learning. Hydrology 2026, 13, 224. [Google Scholar] [CrossRef] [Scilit]
- Tangdamrongsub, N.; Hwang, C.; Borak, J.S.; Prabnakorn, S.; Han, J. Optimizing GRACE/GRACE-FO data and a priori hydrological knowledge for improved global terrestrial water storage component estimates. J. Hydrol. 2021, 598, 126463. [Google Scholar] [CrossRef] [Scilit]
- Liu, M.; Nie, Z.-L.; Cao, L.; Wang, L.-F.; Lu, H.-X.; Wang, Z.; Zhu, P.-C. Comprehensive evaluation on the ecological function of groundwater in the Shiyang River watershed. J. Groundw. Sci. Eng. 2021, 9, 326–340. [Google Scholar] [CrossRef]
- Cao, L.; Nie, Z.; Liu, M.; Wang, L.; Wang, J.; Wang, Q. The Ecological Relationship of Groundwater–Soil–Vegetation in the Oasis–Desert Transition Zone of the Shiyang River Basin. Water 2021, 13, 1642. [Google Scholar] [CrossRef] [Scilit]
- Zhu, X.; Su, X.; Hu, X.; Chu, J.; Jia, D.; Wu, H.; Zhang, T. Optimal allocation of multiple water sources in arid areas based on water-agriculture-ecology coordinated regulation. Trans. Chin. Soc. Agric. Eng. 2024, 40, 239–248, (In Chinese with English abstract). [Google Scholar] [CrossRef]
- Chen, K.; Chen, H.; Wang, T.; Hu, G.; Tian, K.; Jin, T. Optimal allocation of water resources subject to the total consistents in Daman Irrigation District in the middle reaches of the Heihe River in China. Trans. Chin. Soc. Agric. Eng. 2025, 41, 133–141, (In Chinese with English abstract). [Google Scholar] [CrossRef]
- Liu, G.; Wilson, B.B.; Bohling, G.C.; Whittemore, D.O.; Butler, J.J. Estimation of Specific Yield for Regional Groundwater Models: Pitfalls, Ramifications, and a Promising Path Forward. Water Resour. Res. 2022, 58, e2021WR030761. [Google Scholar] [CrossRef] [Scilit]
- Ajjur, S.B.; Di Lorenzo, E. Sensitivity of Groundwater Recharge Assessment to Input Data in Arid Areas. Hydrology 2024, 11, 28. [Google Scholar] [CrossRef] [Scilit]

Disclaimer/Publisher’s Note: The statements, opinions and data contained in all publications are solely those of the individual author(s) and contributor(s) and not of MDPI and/or the editor(s). MDPI and/or the editor(s) disclaim responsibility for any injury to people or property resulting from any ideas, methods, instructions or products referred to in the content. |
© 2026 by the authors. Licensee MDPI, Basel, Switzerland. This article is an open access article distributed under the terms and conditions of the Creative Commons Attribution (CC BY) license.