


Abstract
This study presents a hydrogeochemical assessment of oilfield formation waters from the Karazhanbas, Zhetybay, and Uzen oil fields in the Mangystau Region of Kazakhstan, with the aim of elucidating lithium distribution, identifying the geochemical factors controlling its accumulation, and providing a preliminary resource-oriented evaluation. The study investigated pH, total dissolved solids (TDS), ionic–salt composition, lithium (Li) concentration, and the relationships between Li, TDS, major cations, and geochemical ratios, including Ca/Li and Mg/Li. Major ions were determined using standard hydrochemical methods, while Li was analyzed by inductively coupled plasma optical emission spectrometry (ICP-OES). The investigated waters were predominantly classified as chloride–calcium type according to their hydrochemical composition. In terms of TDS, the waters follow the sequence Uzen > Zhetybay > Karazhanbas, whereas Li concentrations follow the sequence Zhetybay > Uzen > Karazhanbas. The highest Li concentrations were detected in Zhetybay waters (1.40–1.85 mg/dm3); in Uzen waters, Li reached 1.51 mg/dm3; and in Karazhanbas waters, it ranged from 0.30 to 0.70 mg/dm3. The highest Mg/Li and (Na+ + K+)/Li ratios were characteristic of Uzen waters, indicating a more complex salt matrix. Compared with internationally reported lithium-enriched brines, the Mangystau formation waters contain relatively low Li concentrations and cannot currently be considered a commercially viable lithium source. The scientific significance of this study lies in establishing a regional hydrogeochemical baseline for oilfield formation waters and demonstrating that maximum mineralization does not necessarily correspond to the highest Li concentration.
1. Introduction
Lithium has become one of the most strategically important critical elements due to its essential role in modern energy technologies. Its primary application is associated with the production of lithium-ion batteries, which are widely used in electric vehicles, portable electronics, and renewable energy storage systems. The increasing global demand for lithium is driven by the transition toward a low-carbon economy, the rapid expansion of the electric vehicle market, and the growing need for efficient energy storage from renewable sources such as solar and wind power. Consequently, the search for new lithium sources has become an important scientific and technological priority for geology, chemistry, energy production, industrial development, and environmental policy [1,2].
Traditionally, lithium is produced from two main types of raw materials: hard-rock deposits, mainly pegmatites, and natural brines from closed salt-lake basins. In recent years, increasing attention has been given to unconventional aqueous lithium sources, including geothermal waters, oilfield formation waters, and produced waters from oil and gas operations [3,4,5,6,7]. These waters are of particular interest because they are already brought to the surface during oil and gas production. Therefore, with the development of efficient processing technologies, they may be reconsidered not only as waste streams requiring treatment or disposal, but also as potential secondary hydromineral resources [3,4,5,6].
Historically, formation and produced waters have mainly been regarded as complex by-products of oil extraction that require treatment, disposal, or reinjection into reservoirs. However, recent studies have shown that highly mineralized waters from oil- and gas-bearing basins may contain not only major salts of sodium, calcium, and magnesium, but also valuable trace components such as lithium, strontium, barium, and bromine [3,4,5,8,9]. Liu et al. emphasized that the feasibility of lithium recovery from oil and gas produced waters depends not only on lithium concentration, but also on produced water volume, total salinity, the composition of coexisting ions, and the availability of suitable processing technologies [4]. Similarly, Gerardo and Song showed that the viability of produced waters as lithium sources is strongly controlled by regional conditions, production volumes, brine quality, and the proximity of target sites to processing infrastructure [5].
Lithium accumulation in formation waters is controlled by a combination of geological and geochemical factors. These include the lithological composition of host rocks, temperature, pH, total mineralization, residence time of water–rock interaction, dissolution of evaporite minerals, evaporative concentration, and ion-exchange processes [9,10,11,12]. Lithium may enter solution through the interaction of brines with clay-rich, volcanic, sedimentary, or evaporitic formations. Therefore, its distribution in natural and oilfield waters is usually related not to a single factor, but to the long-term geochemical evolution of the aqueous system. For example, Yu et al. demonstrated that lithium enrichment in oilfield brines of the Jianghan Basin is associated with brine evolution, interaction with Li-bearing minerals in sedimentary rocks, and the hydrochemical and isotopic characteristics of formation waters [10,11].
In parallel with geochemical investigations, direct lithium extraction (DLE) technologies from brines are developing rapidly. These include selective adsorption, ion-exchange materials, membrane-based processes, solvent extraction, electrochemical methods, and integrated pre-treatment schemes [3,4,6,7,12,13,14,15,16,17]. Compared with conventional evaporative approaches, DLE technologies may provide faster lithium recovery and require smaller land areas. However, their efficiency strongly depends on the specific composition of the water, including total mineralization, the Li/Mg ratio, Ca2+ and Mg2+ concentrations, organic matter content, and other competing components [3,4,6,7,13,15,16,17]. Wang et al. emphasized that the composition of oil and gas produced waters significantly affects the efficiency of DLE, highlighting the need for an individual geochemical and technological assessment of each aqueous system [13].
The Mangystau region of Kazakhstan is of particular interest for studying lithium in oilfield waters. This region is located in the western part of the country along the Caspian Sea coast and is characterized by an arid climate, limited freshwater resources, complex geological structures, and significant oil and gas reserves [18]. Sedimentary, carbonate, and evaporitic formations are widespread in this region, together with major oil fields. Although available data indicate the presence of saline and highly mineralized waters that may contain lithium and other strategically important elements, the hydrogeochemical characteristics of these waters, especially with respect to lithium distribution, remain insufficiently studied.
For Kazakhstan, the study of lithium in formation and produced waters associated with oil production has both scientific and practical significance. From a scientific perspective, such investigations contribute to understanding the processes that control lithium accumulation in highly mineralized waters of arid oil- and gas-bearing regions. From a practical perspective, they provide a basis for assessing oilfield waters as a possible secondary source of critical elements. This is especially relevant for Mangystau, where developed oil and gas infrastructure, freshwater scarcity, and the need for environmentally sustainable management of industrial water streams coexist.
The objective of the present study is to conduct a comprehensive hydrogeochemical assessment of oilfield formation waters in the Mangystau region, with a focus on lithium content, major-ion composition, Li distribution patterns, and the preliminary evaluation of lithium recovery potential. The results of this study are intended to provide a scientific basis for further investigations of the lithium potential of Kazakhstan’s formation waters and for the development of environmentally sound approaches to the management and possible processing of highly mineralized oilfield waters.
2. Materials and Methods
2.1. Study Area and Objects
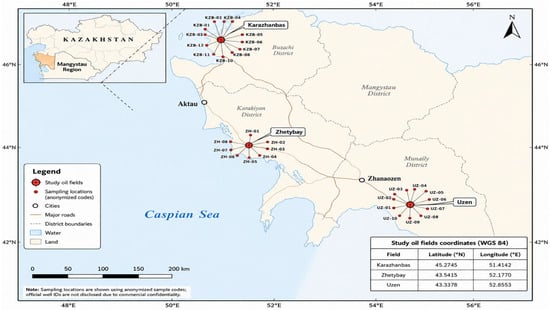
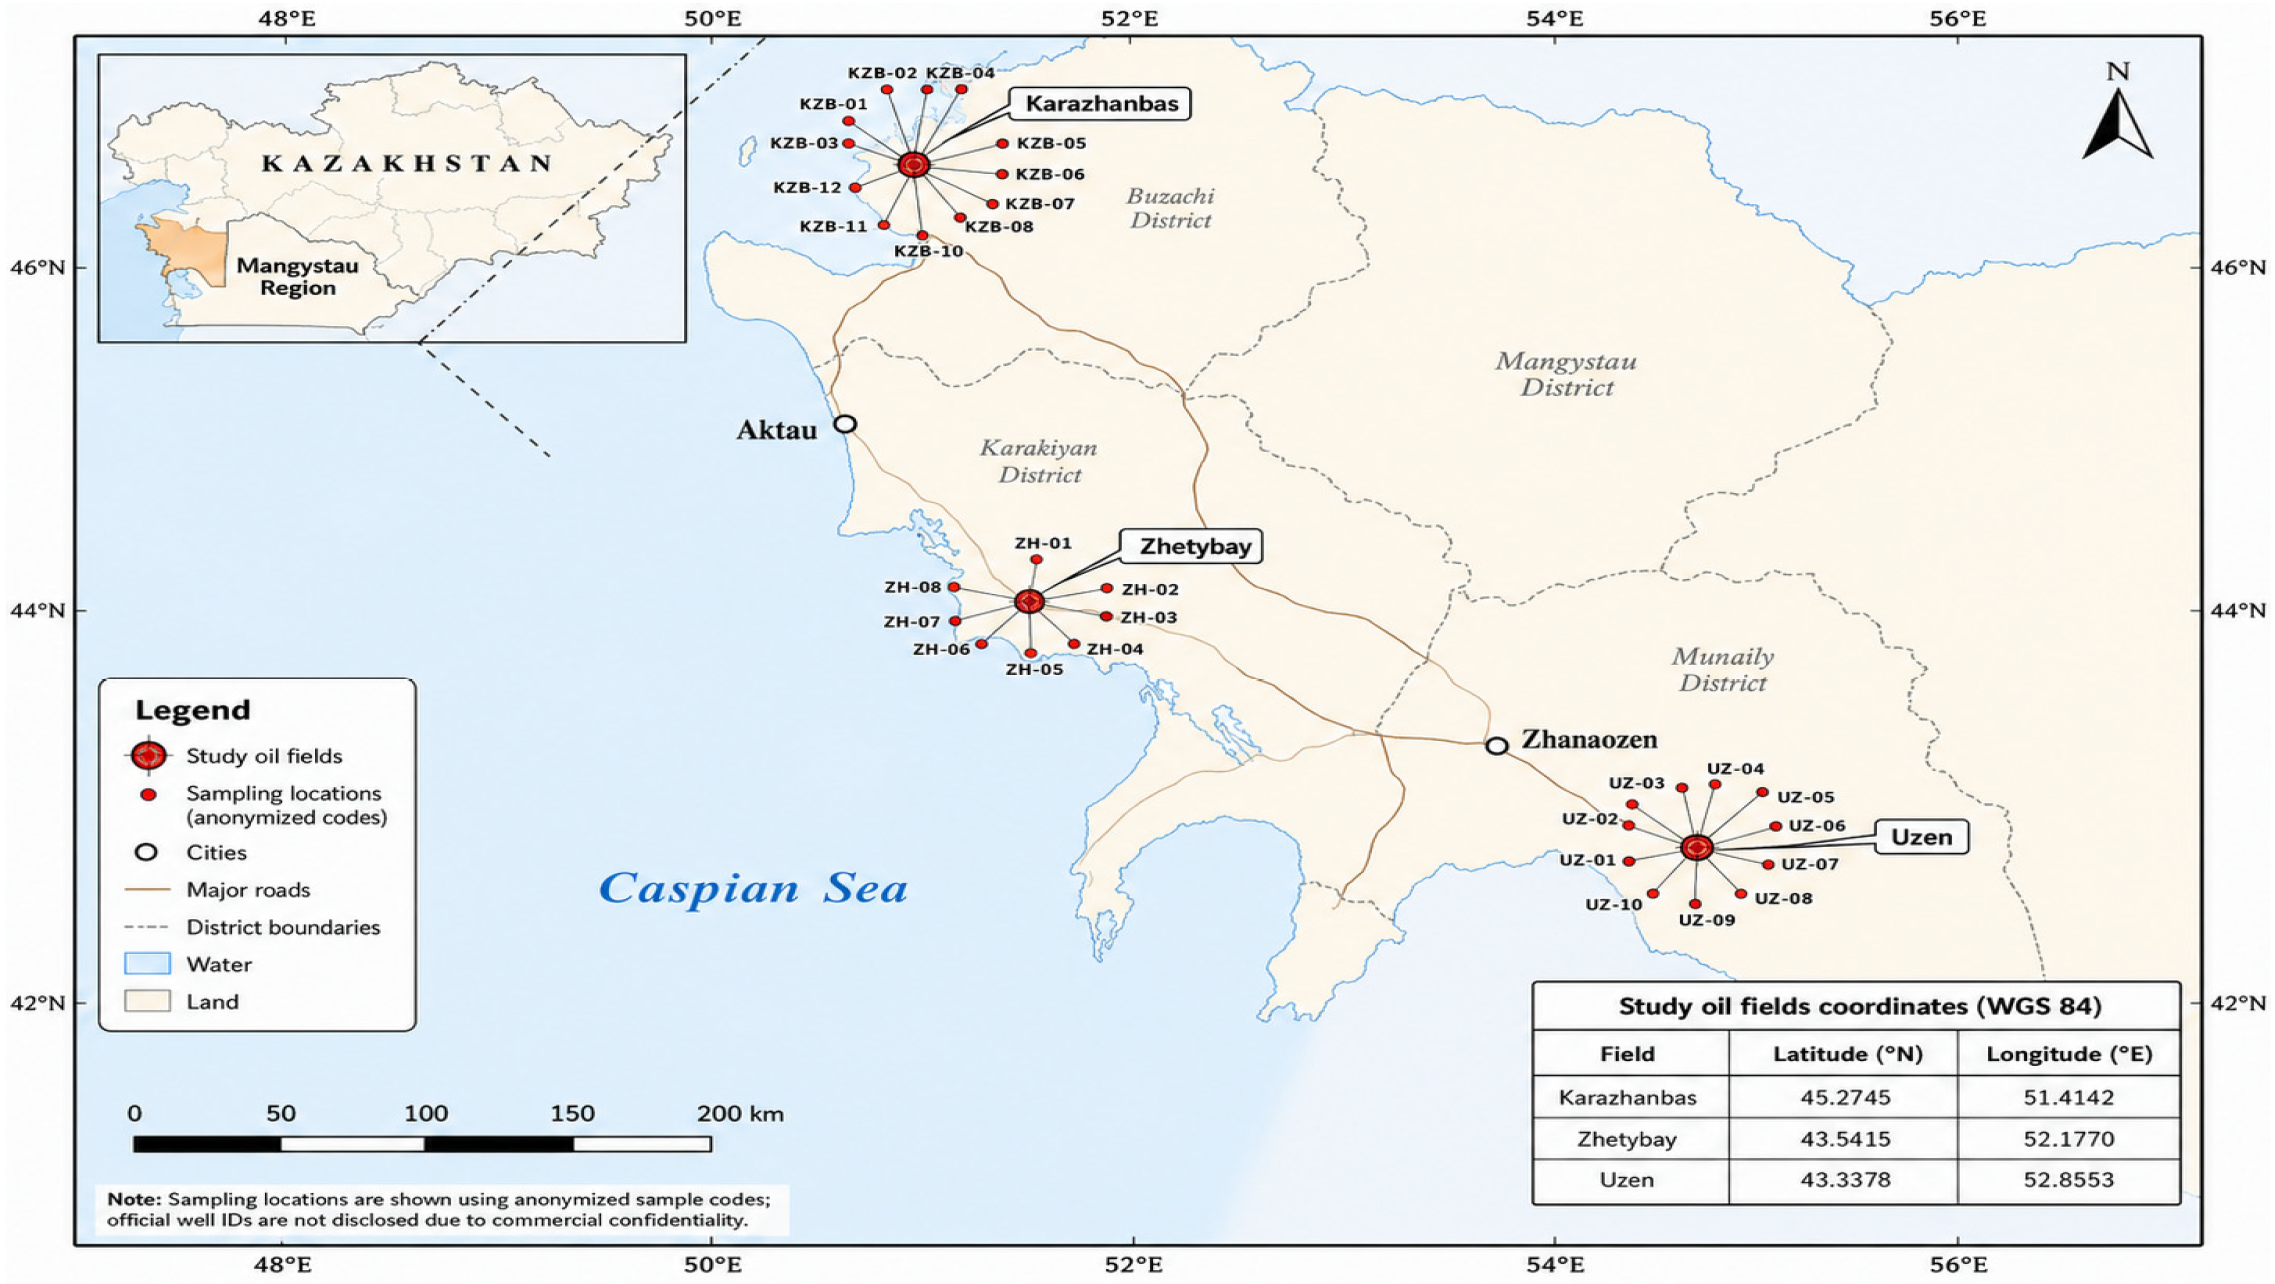
The objects of this study were the formation waters from the Karazhanbas, Zhetybay, and Uzen oil fields, all situated within the Mangystau region of the Republic of Kazakhstan. These fields represent some of the largest oil and gas deposits in the region, located within the Mangystau oil and gas basin. This basin is characterized by arid climatic conditions, extensive sedimentary rock formations, and high mineralization of both groundwater and formation waters. The geographical locations of the studied sites within the Mangystau region are depicted in Figure 1.
Figure 1.
Location of the Karazhanbas, Zhetybay, and Uzen oil fields and anonymized formation water sampling points in the Mangystau region, Kazakhstan.
The Karazhanbas field, located on the Buzachi in the northwestern part of the Mangystau region, is recognized for its highly mineralized formation waters. These waters are formed under conditions of intense interaction between water and saline sequences within the sedimentary complex. The Zhetybay field is situated in the southern part of the Mangystau region and is a major oil and gas asset of the South Mangyshlak oil and gas province. The Uzen field, located near the city of Zhanaozen, is also among the most significant oil fields in the region, distinguished by its complex geological structure and the widespread occurrence of highly mineralized formation waters.
The coordinates of the sampling points are presented in Table 1, while the individual field parameters and hydrogeochemical characteristics of the formation water samples are summarized in Table 2.
Table 1.
Coordinates of the studied oil fields.
Table 2.
Individual field parameters and lithium concentrations of oilfield formation water samples from the Mangystau region.
2.2. Sample Collection and Preservation
In this study, the term “formation water” refers to water naturally associated with oil-bearing reservoir formations and preserved within the pore space of sedimentary rocks. The term “produced water” has a broader meaning and refers to water brought to the surface during oil production; it may include formation water, injected water, condensed water, or operational fluids. Since the samples analyzed in this study were collected from oilfield wells and interpreted as waters associated with productive formations, the term “oilfield formation water” is used consistently throughout the manuscript. The term “produced water” is retained only when discussing previous studies and technological approaches reported in the literature.
Formation water sampling was carried out in accordance with GOST 31861–2012, Water. General requirements for sampling [19], with additional consideration of internationally recognized principles for the preservation, handling, transport, and storage of water samples described in ISO 5667-3:2024 [20]. These procedures were applied to ensure that the collected samples were representative and suitable for subsequent physicochemical and hydrochemical analyses.
To minimize contamination and preserve the original chemical composition of the samples, standardized procedures for sampling, filtration, preservation, and transportation were applied. Such procedures are essential in hydrochemical studies, as sample integrity directly affects the reliability of major ion and dissolved element analyses [19,20,21].
In total, 31 wells were investigated within the three studied oil fields. The sampling dataset included 13 wells from the Karazhanbas oil field, 8 wells from the Zhetybay oil field, and 10 wells from the Uzen oil field. One formation water sample was collected from each well; therefore, the main analytical dataset consisted of 31 single samples. For confidentiality reasons, the official well identification numbers are not disclosed. Instead, individual sample values are presented using anonymized sample codes, which allow analytical traceability while preserving the commercial confidentiality of the operating oil companies. These anonymized sample codes are used consistently in the tables, figures, and investigation area map.
Sampling was conducted in May 2025, during the spring season. The selected wells were spatially distributed within the investigated oil fields to provide a preliminary inter-field comparison of hydrochemical composition and lithium distribution in formation waters of the Mangystau oil-producing region. However, the sampling campaign was conducted only once; therefore, the obtained results do not reflect seasonal or long-term temporal variability. Information on well depths was not available for all sampling points; therefore, depth-dependent variations in lithium concentration and ionic composition were not evaluated in the present study.
Before sample collection, the production line was purged by allowing continuous flow until stabilization of the main in situ field parameters, including temperature, pH, and total dissolved solids (TDS). This step was performed to remove stagnant water from the sampling system and to obtain formation water representative of the producing horizon. Stabilization was considered achieved when repeated field readings showed no substantial change during continuous flow.
At each sampling point, in situ field parameters, including temperature, pH, and total dissolved solids (TDS), were measured immediately during sampling after stabilization of the instrument readings. Temperature was measured using a testo 905-T1 digital penetration thermometer (Testo SE & Co. KGaA, Titisee-Neustadt, Germany), pH was measured using a portable pH 315i pH meter (WTW, Weilheim, Germany), and TDS was measured using a TDS-3 handheld TDS meter (HM Digital, Inc., Signal Hill, CA, USA). Individual field temperature, pH, TDS, and lithium concentration values are presented in Table 2 together with the corresponding anonymized sample codes. These measurements were included to improve the transparency of the sampling procedure and to provide field-level hydrochemical context for the interpretation of lithium distribution.
All samples were collected in pre-cleaned, acid-washed high-density polyethylene (HDPE) or perfluoroalkoxy alkane (PFA) bottles using pre-rinsed tubing and contact surfaces. Samples were collected directly from the sampling outlet into the containers without intermediate transfer. This approach minimized contact with the atmosphere and reduced the risk of secondary contamination or alteration of the original hydrochemical composition. Where appropriate, sample containers were filled completely to minimize headspace, immediately sealed, labeled with anonymized sample codes, and prepared for preservation and transportation.
Field metadata included sampling coordinates, sampling time, anonymized sample code, field temperature, pH, TDS, instrument settings, stabilization criteria, and quality assurance/quality control (QA/QC) information. The coordinates of the sampling points and related field metadata were entered into a GIS-linked database to ensure traceability and support spatial interpretation of the hydrochemical data.
The GIS database was used to georeference the investigated sampling points, organize sampling information, and compare lithium concentrations among the Karazhanbas, Zhetybay, and Uzen oil fields. A location map showing the studied oil fields and all anonymized sampling points was added to the revised manuscript to illustrate the geographical coverage of the dataset. Detailed spatial interpolation models of lithium distribution were not developed in the present study because the dataset includes 31 single samples collected during one sampling campaign in May 2025, and the sampling points are unevenly distributed among the three studied oil fields. Therefore, the obtained results should be interpreted as a preliminary inter-field hydrogeochemical assessment rather than a complete spatial model of lithium distribution across the Mangystau region. Future studies should include a larger number of sampling points, repeated seasonal sampling, and spatial interpolation methods such as inverse distance weighting (IDW) or kriging to construct more detailed maps of lithium distribution in oilfield formation waters.
For chemical analysis, each sample was divided into separate aliquots for major ion determination and dissolved lithium analysis. Where applicable, selected auxiliary components such as barium and strontium were also determined to support the hydrochemical characterization of the samples. Aliquots intended for dissolved element analysis were filtered in the field through 0.45 µm membrane filters (MF-Millipore™, Merck KGaA, Darmstadt, Germany). This filtration threshold is consistent with US EPA Method 200.7, in which dissolved analytes are defined as components passing through a 0.45 µm membrane filter prior to acidification [22]. Aliquots for lithium and selected dissolved element analysis were acidified with ultrapure nitric acid (Merck KGaA, Darmstadt, Germany) to pH < 2, whereas samples intended for major ion analysis were stored without acidification. Acidification with nitric acid to pH < 2 is recommended for dissolved element analysis because it stabilizes dissolved metal species and minimizes analytical losses during sample storage [22,23].
All samples were stored in insulated containers at 4 ± 2 °C and transported to the laboratory within 48 h. Chain-of-custody documentation accompanied all stages from field collection to laboratory analysis. Quality control procedures included transportation blanks, field blanks, equipment blanks, and blind duplicate samples. Duplicate samples were collected only for QA/QC purposes and were not treated as independent repeated samples in the main dataset. These procedures were used to control potential contamination during sampling, filtration, transportation, and laboratory preparation, thereby improving the reliability and reproducibility of the analytical results [19,20,21,22,23].
2.3. Analytical Methods
In the laboratory, the fundamental physicochemical parameters of the samples were determined, including temperature, pH, density, total dissolved solids (TDS), total mineralization, and total hardness. pH values were measured potentiometrically using a pre-calibrated pH-meter. Density and total mineralization were determined in accordance with standard hydrochemical procedures applicable to the analysis of natural, groundwater, and highly mineralized water samples [21]. The in situ field temperature of the sampled formation waters was measured during sampling and ranged from 25 to 31 °C. Field pH and TDS were also measured at the sampling sites, while laboratory measurements were performed to verify the hydrochemical parameters under controlled analytical conditions.
The concentrations of major ions, including Ca2+, Mg2+, Na+ + K+, Cl−, SO42−, CO32−, and HCO3−, were analyzed using titrimetric methods. Chloride ions were determined by argentometric titration with a silver nitrate solution. Bicarbonate and carbonate ions were quantified by acid-base titration with a standard acid solution, employing appropriate indicators. Calcium and magnesium concentrations were ascertained by complexometric titration with EDTA, and total hardness was calculated from the sum of Ca2+ and Mg2+ concentrations. Sulfate ions were determined titrimetrically following precipitation as a sparingly soluble barium compound. The sum of sodium and potassium ions was calculated through the ionic balance, considering the measured concentrations of cations and anions, as well as the total mineralization of each sample. The use of the major ion balance is a common approach in hydrochemical interpretation of natural and oilfield waters, as it allows assessment of the consistency of analytical results and the main features of the saline composition of water [12,21].
The hydrochemical type of the investigated waters was interpreted according to Sulin’s classification, which is widely applied in petroleum hydrogeology to determine the genetic type and evolutionary stage of formation waters. This classification is useful for assessing the relationship between water chemistry and hydrocarbon-bearing sedimentary basins, water–rock interaction processes, dissolution of evaporite deposits, and the long-term geochemical transformation of reservoir fluids [12].
Lithium concentration was determined by inductively coupled plasma optical emission spectrometry (ICP-OES) using a Shimadzu ICPE-9000 spectrometer (Shimadzu, Kyoto, Japan). Major advantages of ICP-OES for the analysis of natural and highly mineralized waters include high sensitivity and a wide linear dynamic range [22,23].
Prior to analysis, water samples were filtered through 0.45 μm membrane filters to obtain the dissolved fraction. Samples intended for lithium determination were acidified with ultrapure nitric acid (HNO3) to pH < 2 to preserve dissolved species and minimize adsorption onto container walls during storage. Sample preparation was performed in accordance with internationally accepted procedures for dissolved metal analysis in water samples, including US EPA Methods 200.7 and 200.8 [22,23], as well as general recommendations for sampling, laboratory analysis, and analytical reliability in groundwater and water-quality studies [24].
Due to the high mineralization of the formation waters, selected samples were diluted with deionized water before analysis to reduce matrix effects and ensure that analyte concentrations remained within the calibration range of the instrument. Particular attention was paid to minimizing spectral and non-spectral interferences associated with elevated concentrations of dissolved salts [22,23]. For samples in which lithium concentrations exceeded the upper limit of the calibration range, preliminary dilution was performed. The samples were diluted with deionized water at a ratio of 1:1, corresponding to a dilution factor of 2. Dilution was required for the Zhetybay and Uzen samples, where lithium concentrations in the original formation waters ranged from 1.40 to 1.85 mg/dm3 and from 1.25 to 1.51 mg/dm3, respectively. After applying the dilution factor of 2, the measured lithium concentrations were within the calibration range: 0.70–0.925 mg/dm3 for Zhetybay and 0.625–0.755 mg/dm3 for Uzen. The Karazhanbas samples, with lithium concentrations of 0.30–0.70 mg/dm3, were already within the calibration range and did not require dilution for lithium determination. After dilution, the highest measured lithium concentration was 0.925 mg/dm3, which was within the calibration range of 0.03125–1.00 mg/dm3. The final lithium concentrations reported in the manuscript were recalculated using the corresponding dilution factor [23].
Lithium analysis was performed according to the validated method “Determination of metals in drinking, mineral, natural, wastewater and atmospheric precipitation by inductively coupled plasma atomic emission spectrometry using the ICPE-9000 spectrometer”. Measurements were performed using high-purity argon as the plasma, auxiliary, and carrier gas. The radio-frequency generator power was 1.20 kW; the plasma gas flow rate was 10.0 L/min, the auxiliary gas flow rate was 0.60 L/min, and the carrier gas flow rate was 0.70 L/min. The exposure time was 30 s. Measurements were carried out in axial plasma observation mode.
Lithium was quantified at the analytical wavelength of 670,784 nm using an external calibration approach. Calibration standards covered the concentration range of 0.03125–1.00 mg/dm3, yielding a coefficient of determination (R2) of 0.99967. The limit of detection (LOD), calculated as 3σ/s, was 0.001 mg/dm3. The instrumental limit of quantification (LOQ), calculated as 10σ/s, was 0.003 mg/dm3; however, for quantitative reporting in the present study, a practical LOQ of 0.03125 mg/dm3 was adopted, corresponding to the lowest point of the calibration curve. Therefore, the calibration range used for quantitative reporting started from the practical LOQ. All quantitatively reported lithium values were above the practical LOQ and, after appropriate sample dilution, within the validated calibration range.
Analytical quality assurance and quality control (QA/QC) for lithium determination included procedural blanks, replicate measurements, initial calibration verification, continuing calibration verification, and continuous monitoring of instrumental stability. Initial calibration verification was performed using an independent quality control sample (IQC) prepared from a second-source certified lithium standard. Continuing calibration control was performed using a continuing calibration blank (CCB) and a continuing calibration verification (CCV) solution.
The IQC was analyzed after the initial calibration, with an acceptance criterion of ±20% from the nominal value. The CCB, consisting of 0.1 N nitric acid, and the CCV, prepared as a mid-range calibration verification solution, were analyzed at the beginning and at the end of each analytical sequence. The acceptance criterion for the CCB was a concentration below the method detection limit (MDL), whereas the acceptance criterion for the CCV was a deviation from the nominal value not exceeding ±15%. If any of these criteria were not met, the cause was corrected, the instrument was recalibrated, and the analytical sequence was reanalyzed.
In the present study, the CCV solution with a nominal lithium concentration of 0.0625 mg/dm3 gave measured values of 0.0644 mg/dm3 at the beginning of the analytical sequence and 0.0687 mg/dm3 at the end of the sequence, corresponding to 103.0% and 109.9% agreement with the nominal value, respectively. The IQC solution with a nominal lithium concentration of 0.125 mg/dm3 gave a measured value of 0.135 mg/dm3, corresponding to 108.0% agreement with the nominal value. These results were within the accepted quality-control criteria.
Analytical precision was evaluated using replicate measurements of the investigated formation water samples. The relative standard deviation (RSD) values ranged from 0.24% to 3.16%, confirming acceptable repeatability of lithium determination by ICP-OES. Matrix spike/recovery tests were not performed within the present study; therefore, unsupported matrix spike recovery values were not introduced into the manuscript. The accuracy and stability of lithium determination were instead controlled using the second-source certified lithium standard/IQC, CCB, CCV, and replicate measurements in accordance with the laboratory QA/QC procedure.
Lithium concentrations in the investigated formation waters ranged from 0.30 to 1.85 mg/dm3, substantially exceeding the practical LOQ. Specifically, lithium concentrations ranged from 0.30 to 0.70 mg/dm3 in Karazhanbas, from 1.40 to 1.85 mg/dm3 in Zhetybai, and from 1.25 to 1.51 mg/dm3 in Uzen. The applied QA/QC procedures support the reliability of lithium determination in highly mineralized formation waters [22,23] and are consistent with recent recommendations for improving the robustness, reproducibility, and comparability of analytical results in water and groundwater studies [24].
3. Results and Discussion
3.1. General Hydrochemical Characteristics of the Studied Waters
The results of this investigation reveal significant variations in the overall mineralization and ionic-salt composition of formation waters from the Karazhanbas, Zhetybay, and Uzen oil fields. Across all analyzed samples, the predominant components are chloride ions, the sum of sodium and potassium ions, and calcium and magnesium. This composition signifies a pronounced chloride character of the waters, indicating their association with deep-seated reservoir systems within hydrocarbon-bearing sedimentary basins. According to Sulin’s classification, the sampled waters predominantly fall into the chloride-calcium (Cl–Ca) type. This classification is typical for highly mineralized formation waters that evolve under prolonged interaction with sedimentary and evaporitic rock sequences. Raw data pertaining to the ionic composition of waters from Uzen, Karazhanbas, and Zhetybay are presented in Table 3 and Table 4.
Table 3.
Ionic composition of formation waters from the Uzen oil field.
Table 4.
Ionic composition of formation waters from the Karazhanbas and Zhetybay oil fields.
The highest mineralization was observed in the formation waters of the Uzen field. The total dissolved solids (TDS) range from 130,387.4 to 163,107.1 mg/dm3, with an average value of approximately 151,305.6 mg/dm3. Formation waters from Uzen are characterized by exceptionally high concentrations of chloride ions and the sum of sodium and potassium ions. The average Cl− concentration was 93,931.45 mg/dm3, with a range of 81,035.9–101,294.8 mg/dm3, while the average Na+ + K+ concentration was 44,307.9 mg/dm3. Calcium and magnesium were also present in elevated concentrations, with average values of 10,410.8 and 2505.0 mg/dm3, respectively. Sulfate and carbonate ions were not detected in the analyzed samples, whereas bicarbonate content was relatively low, varying between 81.3 and 345.7 mg/dm3.
Formation waters from the Karazhanbas field exhibit moderate mineralization, with average concentrations of Cl− at 12,827.45 mg/dm3 and Na+ + K+ at 6980.3 mg/dm3. Bicarbonate content is comparatively elevated, averaging 557.45 mg/dm3. In contrast, Zhetybay formation waters demonstrate significantly higher mineralization, characterized by average Cl− concentrations reaching 81,403.7 mg/dm3 and Na+ + K+ at 38,218.7 mg/dm3, indicating a more pronounced degree of geochemical evolution.
Thus, in terms of overall mineralization, the investigated waters can be ranked as follows: Uzen > Zhetybay > Karazhanbas.
This progression suggests that waters from Uzen and Zhetybay are at a more advanced stage of salt concentration and geochemical evolution, whereas Karazhanbas waters possess a less mineralized and more variable composition. High concentrations of Cl− and Na+ + K+ can be attributed to the dissolution of highly soluble salts, the accumulation of dissolved components in closed formation systems, and prolonged water–rock interaction within sedimentary strata. Conversely, elevated concentrations of Ca2+ and Mg2+ may be associated with water–rock interaction processes, ion exchange, and mineral transformation within hydrocarbon-bearing horizons.
These findings align with international research on oilfield brines. For instance, Yu et al. [10,11] demonstrated that brines from the Jianghan Basin are characterized by high mineralization, a predominance of chloride ions, and complex geochemical evolution linked to evaporite dissolution, ion exchange, and prolonged interaction with sedimentary rocks. Similar characteristics are observed in the formation waters of the Mangystau region, confirming their classification as deep, highly mineralized waters typical of hydrocarbon-bearing sedimentary basins.
3.2. Distribution of Lithium in Formation Waters
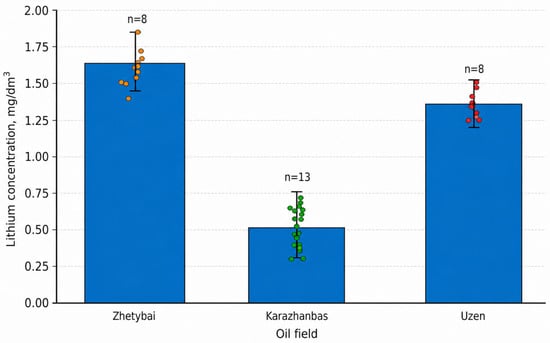
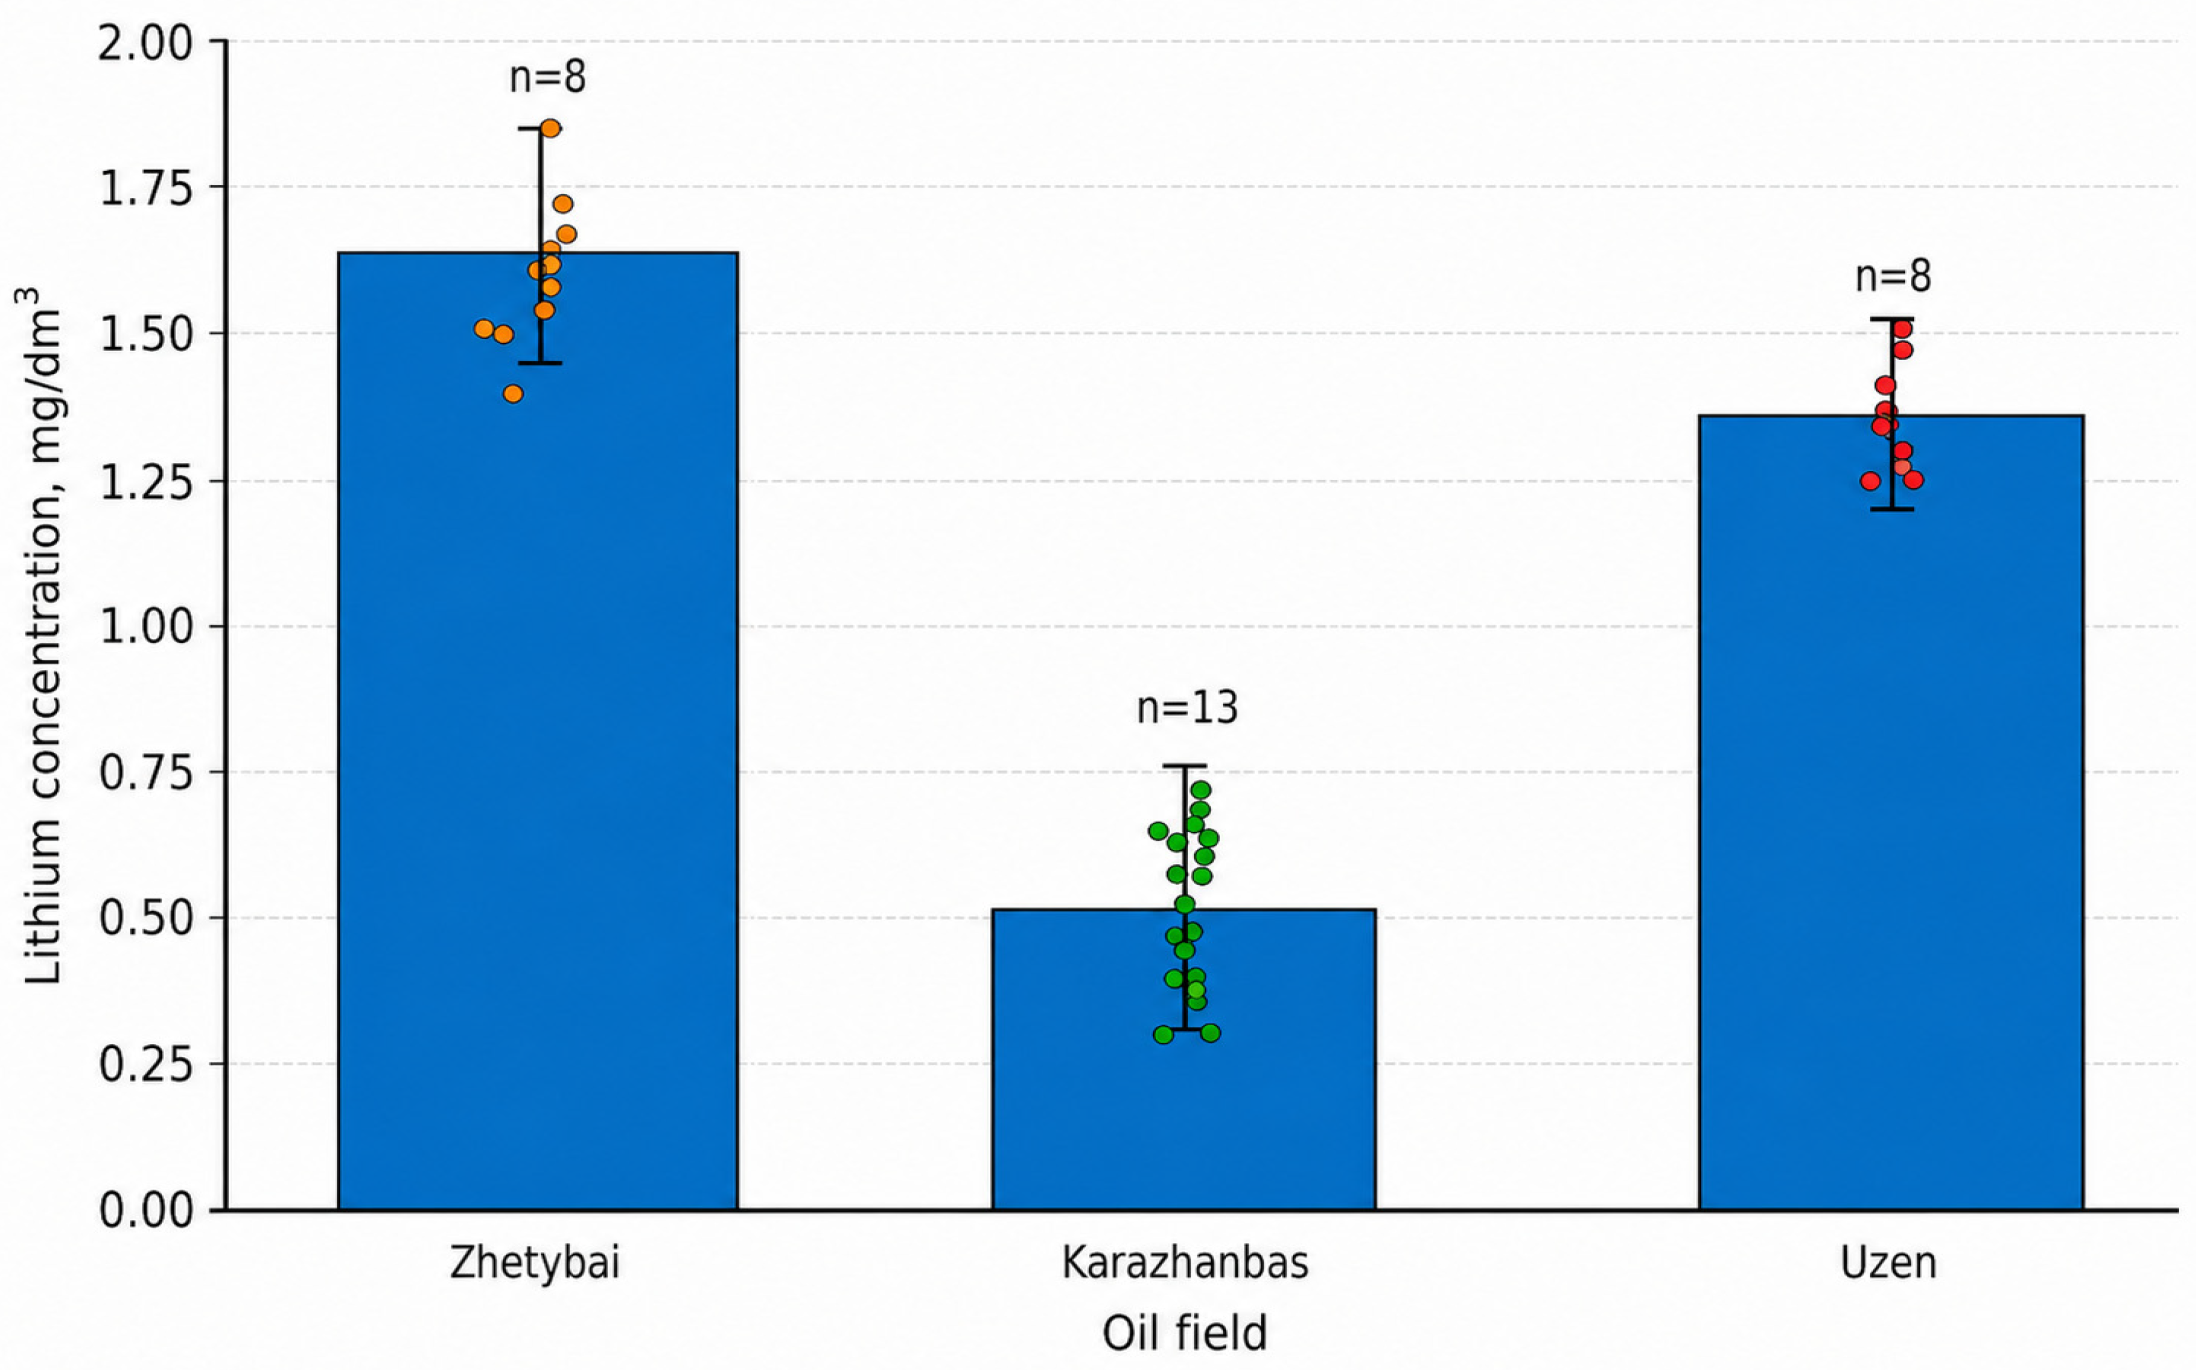
The lithium content in the investigated formation waters varies depending on the field. Minimum concentrations (0.30–0.70 mg/dm3) were observed in Karazhanbas waters. In Uzen waters, lithium content reaches up to 1.51 mg/dm3, while maximum values (1.40–1.85 mg/dm3) were detected in Zhetybay waters. Based on lithium content, the studied fields rank as follows: Zhetybay > Uzen > Karazhanbas (Figure 2).
Figure 2.
Lithium concentration in formation waters of the studied oil fields.
As depicted in Figure 1, the mean lithium concentrations (considering standard deviation) support this trend: the highest values are characteristic of Zhetybay, intermediate for Uzen, and minimal for Karazhanbas. This finding represents one of the most significant results of this study. It indicates that the distribution of lithium does not directly mirror the overall mineralization trend. Although the most highly mineralized waters were found in Uzen, the maximum lithium concentrations are characteristic of Zhetybay. Consequently, lithium accumulation is not solely governed by the total dissolved solids content.
Higher lithium content in Zhetybay waters may be attributed to several factors including the lithological composition of productive horizons, the presence of argillaceous or evaporitic components, reservoir depth, temperature, duration of water–rock interaction, and the degree of closure of the formation system. This suggests that lithium should be considered not merely an indicator of water salinity but also an element sensitive to the geological and geochemical conditions governing formation water evolution [9,10,11].
This conclusion is consistent with findings by Yu et al., which demonstrate that lithium distribution in oilfield brines is influenced not only by mineralization but also by Li input sources, isotopic composition, water–rock interaction, and the stage of geochemical evolution of the brine system [10,11].
3.3. Relationship Between Lithium Content and TDS
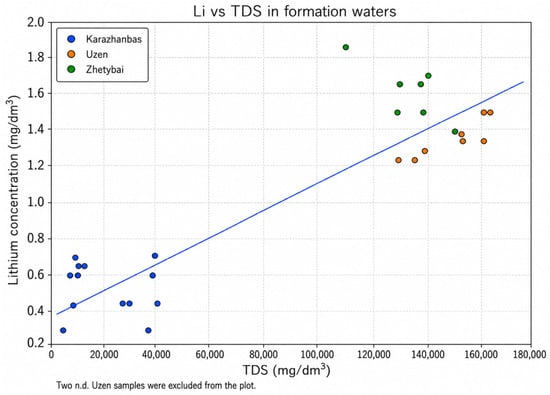
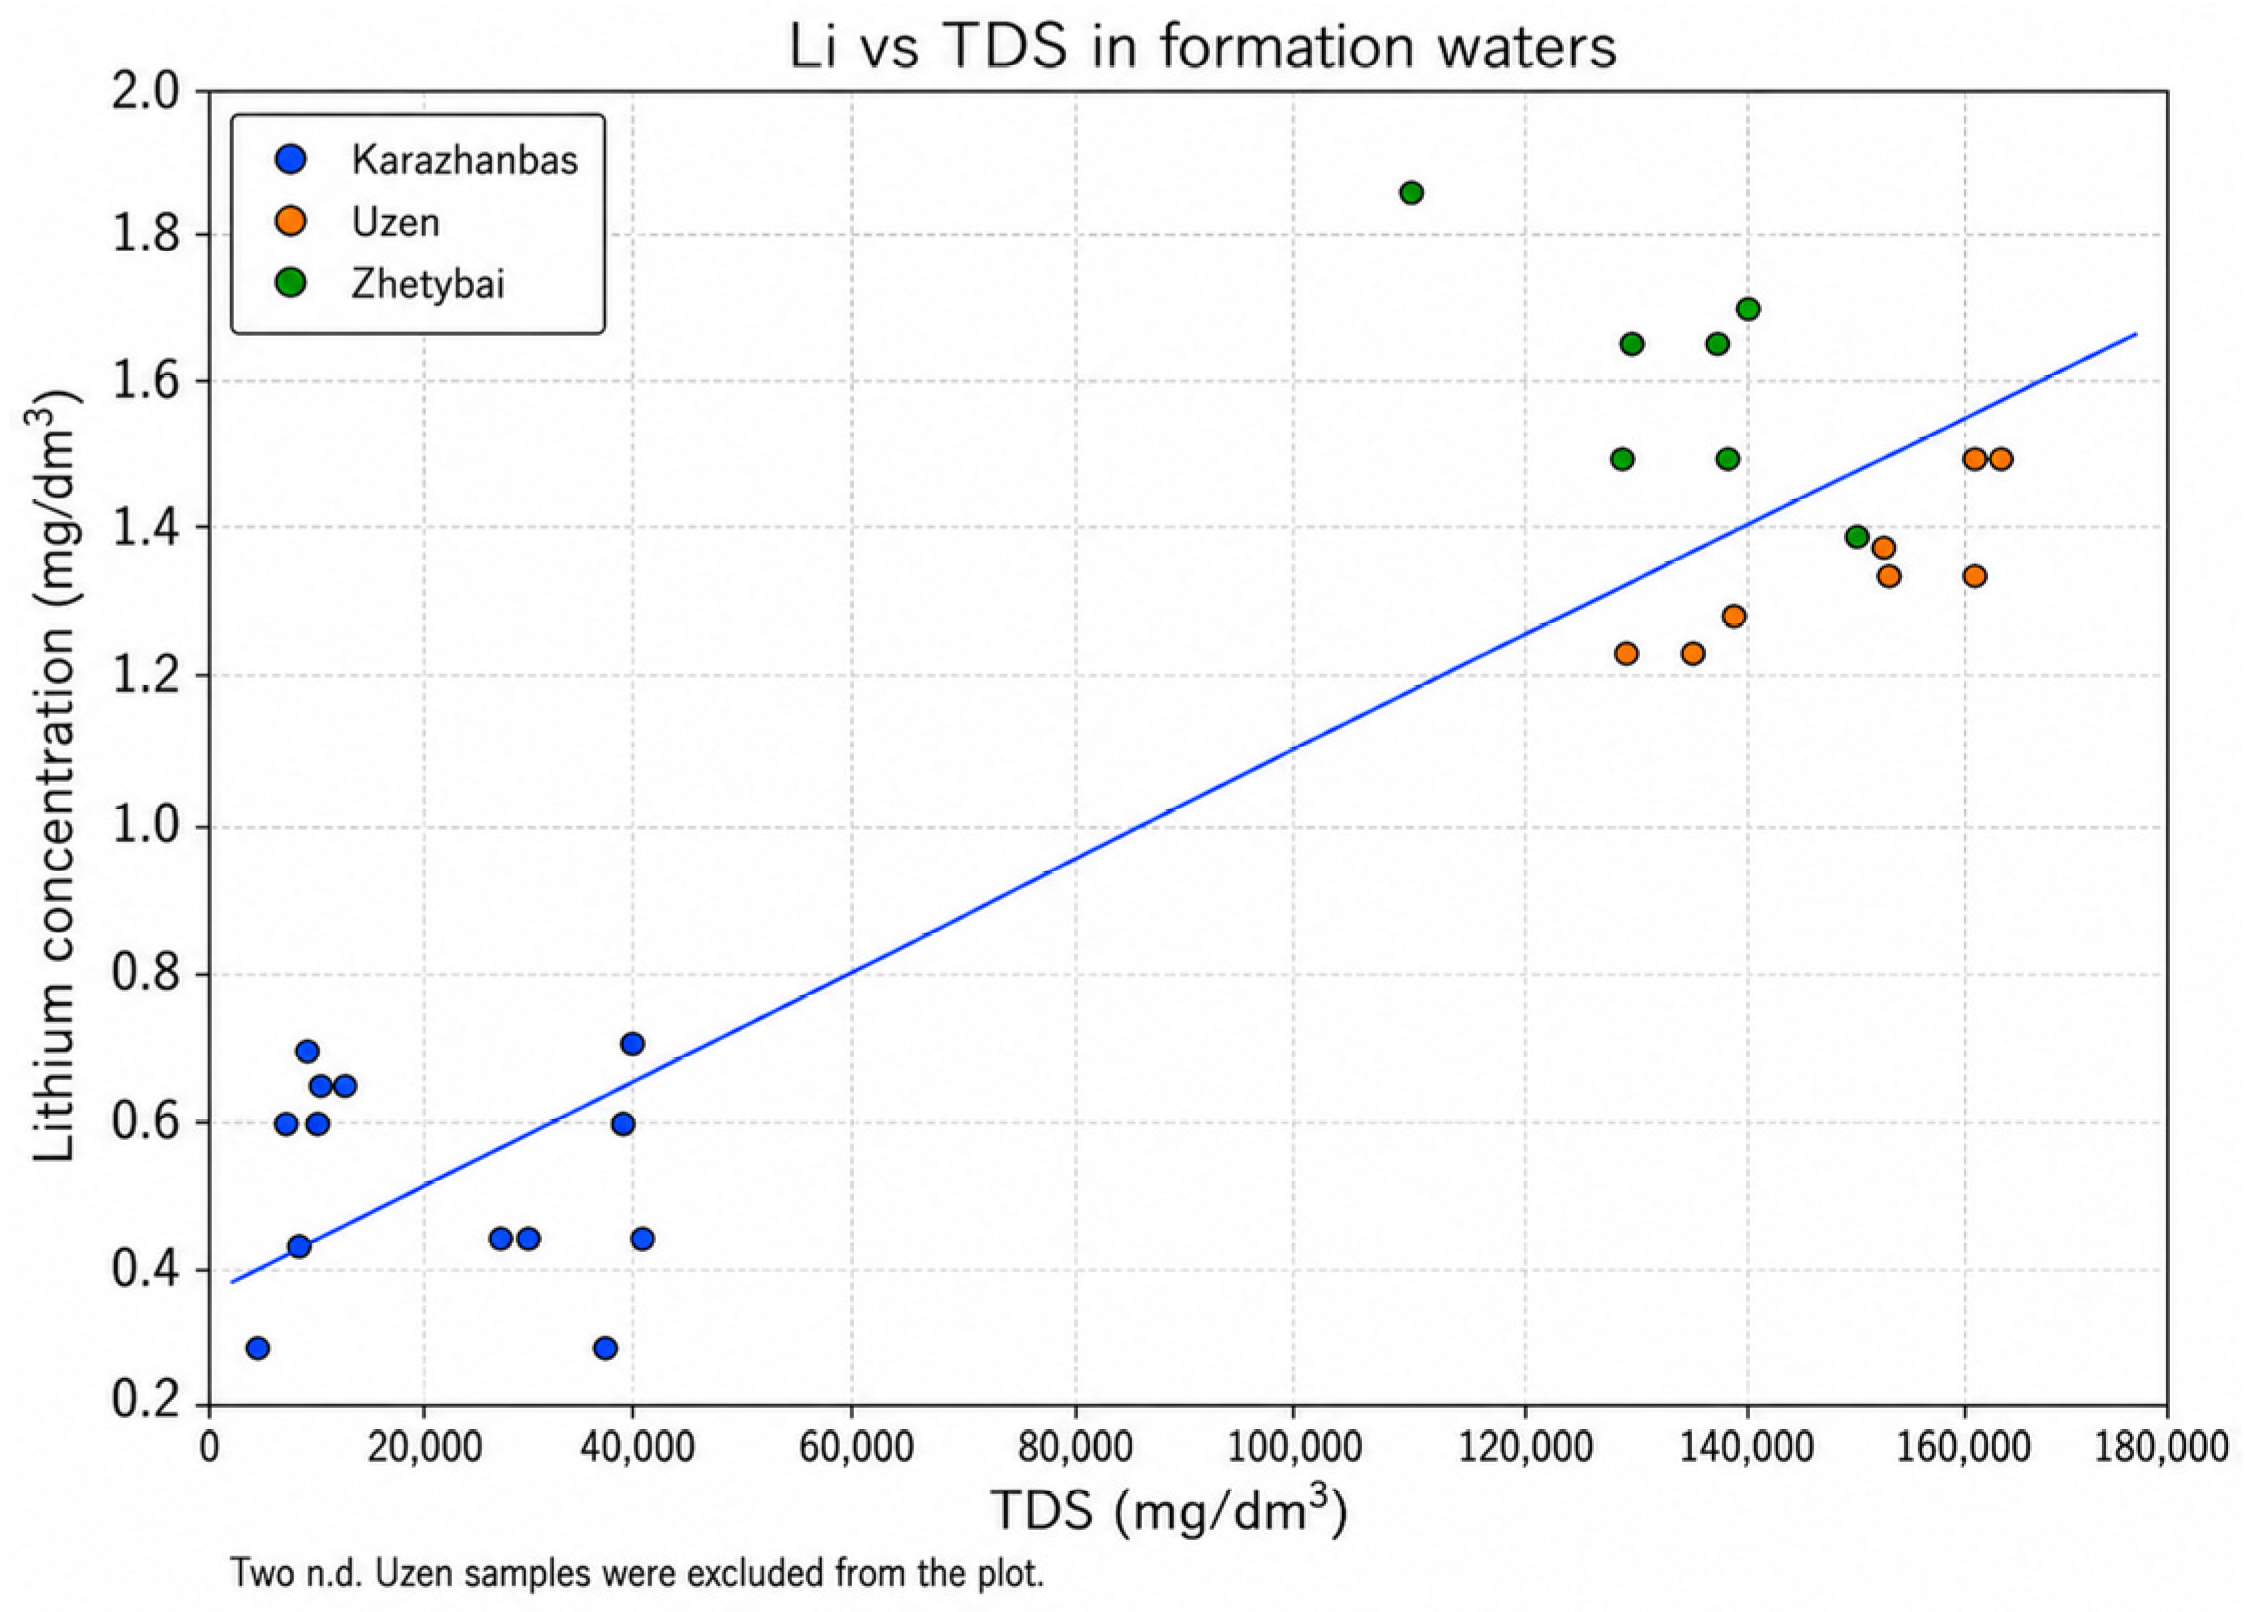
Figure 3 shows the relationship between lithium concentration and total dissolved solids (TDS) in formation waters from the Karazhanbas, Uzen, and Zhetybay oil fields.
Figure 3.
Relationship between lithium concentration and total dissolved solids (TDS) in formation waters of the Karazhanbas, Uzen and Zhetybay oil fields (Mangystau region, Kazakhstan).
The results indicate that the less mineralized formation waters of Karazhanbas are characterized by relatively low Li concentrations. In contrast, waters from Uzen and Zhetybay exhibit substantially higher TDS values and elevated Li contents. This pattern suggests that TDS can be used as a general indicator of the degree of salinity enrichment in formation waters.
However, the relationship between Li concentration and TDS is not strictly linear. If lithium enrichment were controlled solely by mineralization, the highest Li concentrations would be expected in Uzen waters. In practice, the maximum Li concentrations were recorded in Zhetybay. This discrepancy indicates that, although TDS is an important factor, it is not the only control on lithium enrichment; lithology, major ion composition, water–rock interaction, and the geochemical evolution of formation waters should also be considered [9,10,11].
From a scientific perspective, this finding highlights the need for an integrated approach to assessing the lithium potential of formation waters. Evaluation based only on total mineralization may lead to incomplete interpretation. Therefore, further assessment should include geochemical ratios such as Li/Cl, Mg/Li, and Na/Cl, together with the lithology of the producing horizons and the history of water–rock interaction.
3.4. Dependence of Lithium Content on Major Cations
To further identify the factors controlling lithium distribution in formation waters, the relationships between Li and the major cations Ca2+, Mg2+, and Na+ + K+ were examined. In the original analytical dataset, sodium and potassium were reported as a combined parameter (Na+ + K+); therefore, separate Li–Na and Li–K relationships were not calculated.
Correlation analysis was performed using Pearson’s correlation coefficient, which is widely used to assess the strength and direction of a linear relationship between two continuous quantitative variables [25]. For each parameter pair, including Li–Ca2+, Li–Mg2+, and Li–Na+ + K+, the correlation coefficient was calculated using the following Equation (1):
where (xi) represents the lithium concentration in an individual sample, (yi) represents the concentration of the corresponding cation, () and (ȳ) are the mean values of Li and the corresponding cation, respectively, and (n) is the number of paired observations. Only samples with quantifiable lithium concentrations were included in the calculations; samples in which Li was not detected were excluded from the correlation analysis. This approach is consistent with the standard application of Pearson’s correlation coefficient for assessing linear relationships between quantitative geochemical variables [25]. Pearson’s correlation coefficient ranges from −1 to +1: positive values indicate a simultaneous increase in both variables, whereas negative values indicate an inverse relationship. The mean concentrations of lithium and major cations, as well as the calculated cation-to-lithium ratios for each studied oil field, are summarized in Table 5.
Table 5.
Relationship between lithium and major cations in formation waters of the studied oil fields.
Correlation analysis revealed a positive relationship between lithium concentration and the major cations in the studied formation waters (Table 6). The strongest correlation was observed between Li and Ca2+, with a Pearson correlation coefficient of r = 0.906. Strong positive correlations were also identified for Li–Na+ + K+ (r = 0.878) and Li–Mg2+ (r = 0.845). These results indicate that increasing Li concentrations are generally accompanied by higher concentrations of major cations, suggesting that lithium enrichment is associated with the overall ionic composition and geochemical evolution of the formation waters.
Table 6.
Correlation between lithium and major cations.
The observed relationships indicate that Li concentration is associated with the overall salinity and geochemical evolution of the formation waters. Elevated concentrations of Ca2+, Mg2+, and Na+ + K+ may reflect prolonged interaction between formation waters and sedimentary or evaporitic rocks, as well as ion-exchange processes. In this context, the positive relationships between Li and the major cations suggest that lithium accumulation does not occur independently, but rather together with other components of the brine system [9,10,11,12].
The observed positive correlations between Li and major cations likely reflect the common geochemical evolution of deep formation brines rather than a simple concentration effect. Elevated concentrations of Ca2+ and Mg2+ may result from carbonate dissolution, dedolomitization, ion-exchange processes, and feldspar weathering during prolonged water–rock interaction. The alteration of feldspars and other aluminosilicate minerals contributes to the release of Ca2+ and alkali elements into solution, whereas lithium enrichment is commonly associated with interactions between brines and clay minerals, Li-bearing aluminosilicates, and evaporitic deposits. In confined reservoir systems, these processes may operate concurrently, leading to the co-enrichment of Li, Ca2+, Mg2+, and Na+ + K+. Consequently, the observed Li–Ca2+ and Li–Mg2+ relationships should be interpreted as indicators of advanced water–rock interaction and progressive brine evolution rather than evidence of a single controlling source of lithium [9,10,11,12].
For a more comprehensive geochemical interpretation, Ca/Li, Mg/Li, and (Na+ + K+)/Li ratios were used. Such ionic ratios are widely applied in studies of lithium-bearing brines because they allow evaluation not only of absolute Li concentration, but also of the position of lithium within the overall salt matrix [9,10,11]. For example, Yu et al. used hydrochemical ratios, including Mg/Li, Na/Cl, and Cl/Br, to interpret halite dissolution, water–rock interaction, and lithium enrichment processes in oilfield brines of the Qianjiang Formation [10,11].
The comparison of Mg/Li and (Na+ + K+)/Li ratios is particularly important because these parameters have both geochemical and technological significance. High Mg/Li values indicate a complex salt matrix, as Mg2+ is one of the main competing cations during selective lithium recovery. Previous studies have shown that a high Mg/Li ratio complicates the separation of Li+ from Mg2+ in brines due to their competitive behavior in sorption, ion exchange, membrane separation, and extraction processes [3,4,15,16,17].
Uzen waters are characterized by the highest Mg/Li and (Na+ + K+)/Li ratios, indicating a higher proportion of competing ions relative to lithium. In contrast, Zhetybay waters, despite their high mineralization, have a higher mean Li concentration and a more favorable Mg/Li ratio compared with Uzen. Therefore, among the three studied oil fields, Zhetybay can be considered the most promising target for further lithium-oriented geochemical and technological investigations.
However, it should be noted that the identified correlations were calculated using a combined dataset from three oil fields. Therefore, they reflect both intra-field relationships and inter-field differences. For more robust statistical interpretation, future studies should include a larger number of samples and separate correlation analyses for each individual oil field.
Overall, the analysis of the relationships between Li and Ca2+, Mg2+, and Na+ + K+ confirms that lithium distribution is controlled by a combination of factors, including total mineralization, major ion composition, water–rock interaction, and the lithological characteristics of the productive horizons. These results demonstrate that Li accumulation in formation waters is associated not only with salinity, but also with the ratios and distribution of major cations within the brine system.
3.5. Relationship Between Lithium Content and pH
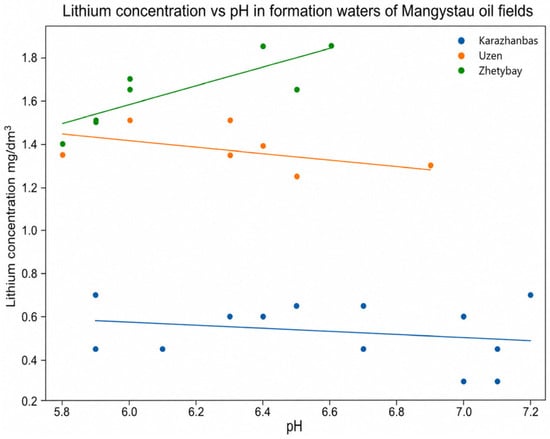
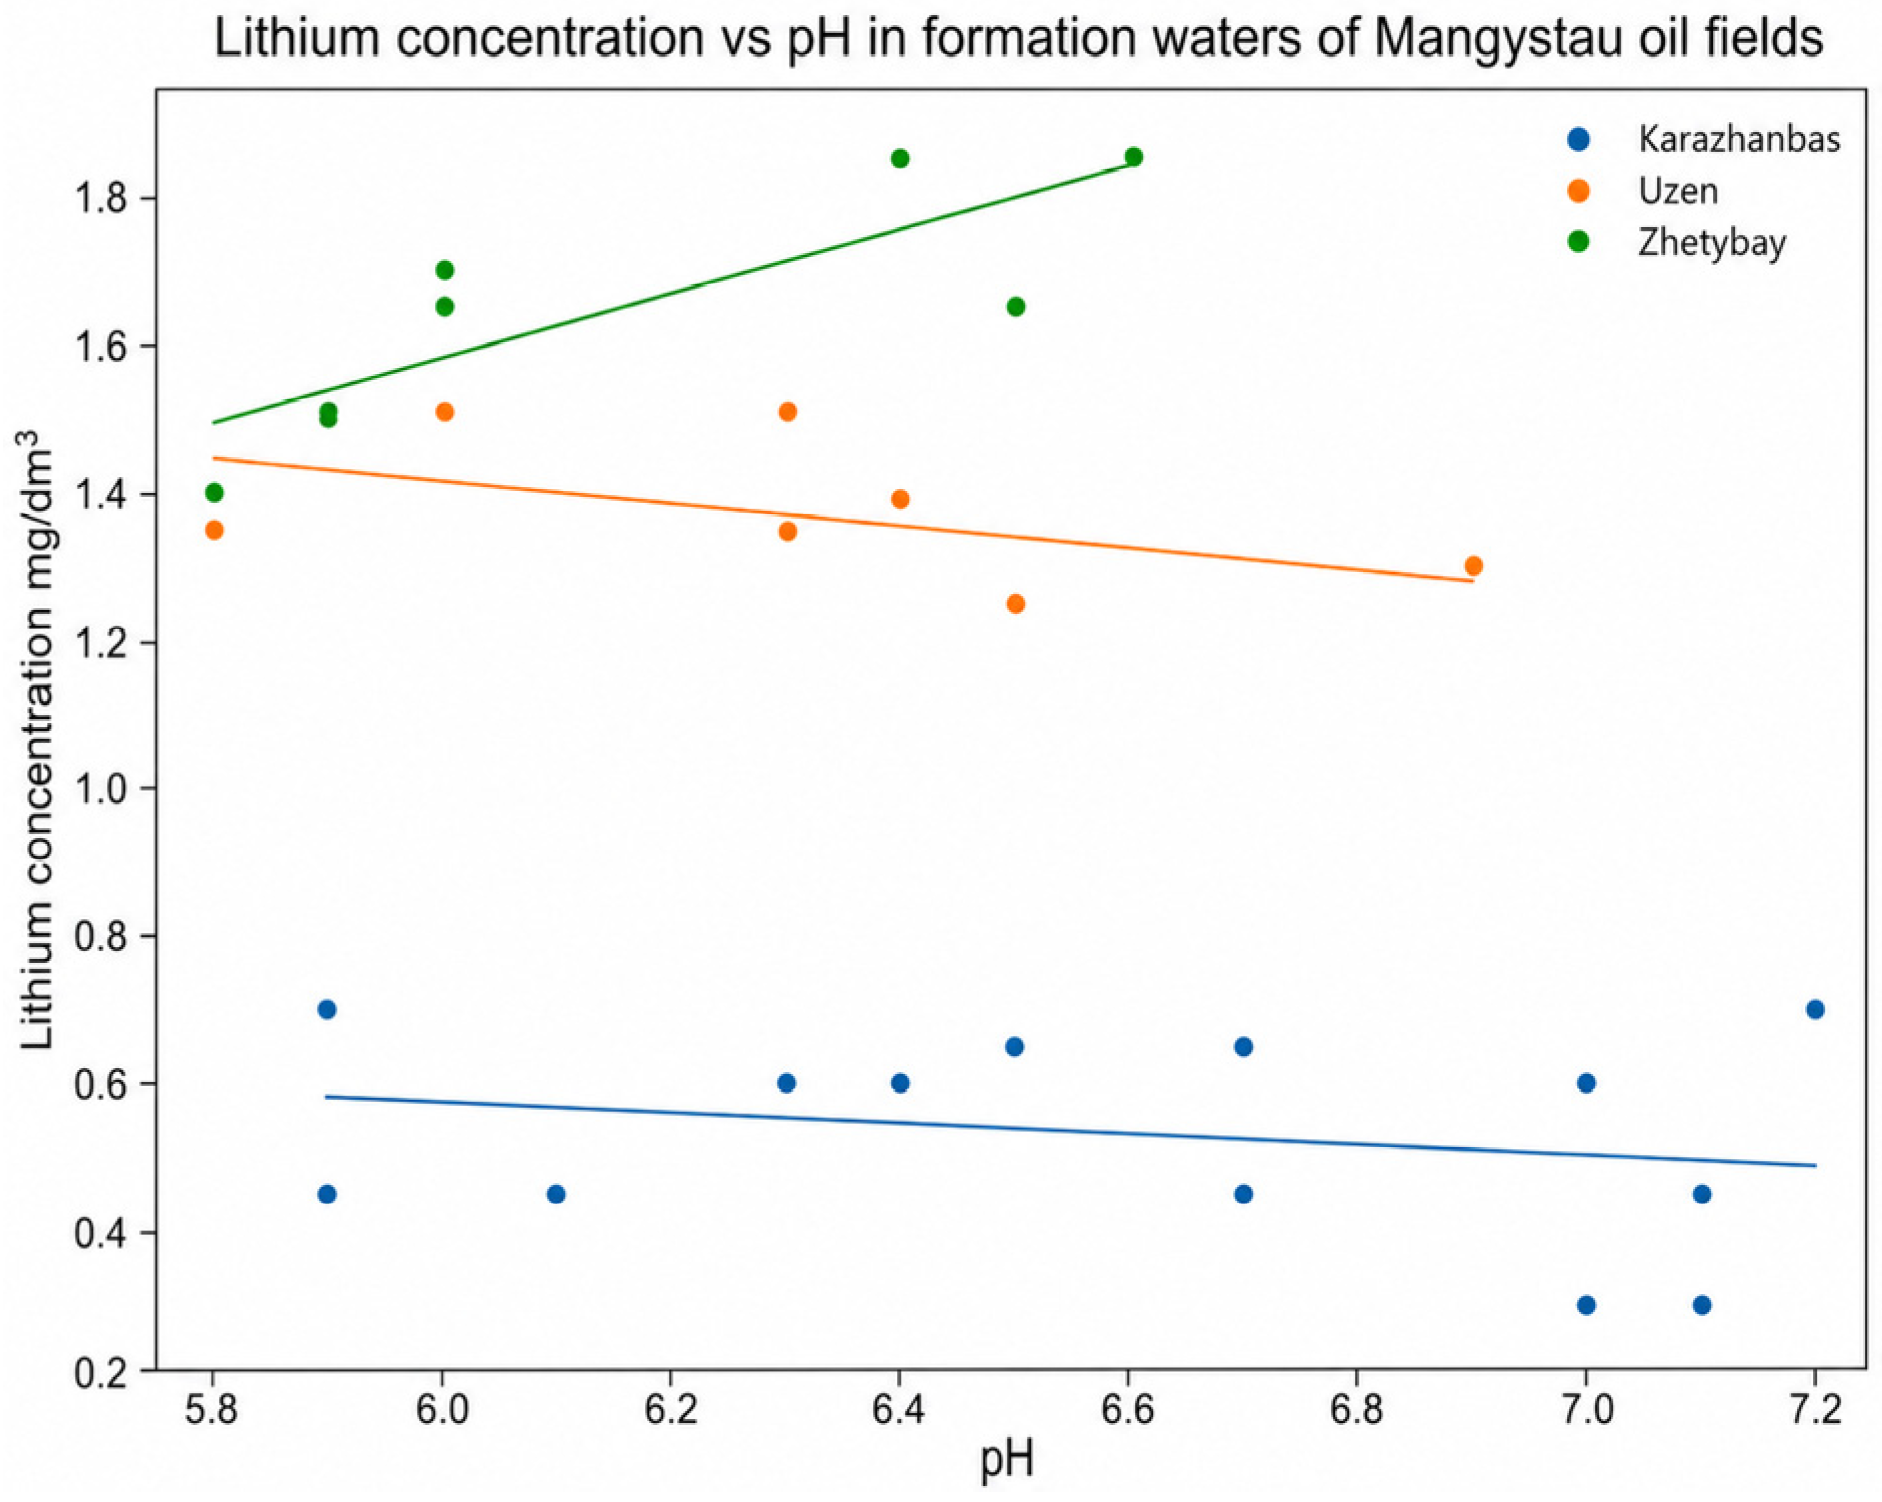
Figure 4 shows the relationship between lithium concentration and pH in the formation waters of the studied oil fields. The pH values of the analyzed waters generally fall within a slightly acidic to near-neutral range. In Karazhanbas waters, pH varies from 5.9 to 7.2; in Zhetybay waters, from 5.8 to 6.6; and in Uzen waters, from 5.8 to 6.9. The highest Li concentrations were recorded in Zhetybay waters within a relatively narrow pH interval of 5.8–6.6. However, Karazhanbas waters, despite having partially overlapping pH values, contain substantially lower Li concentrations. This indicates that, within the studied pH range, pH is not the primary factor controlling lithium accumulation. Instead, Li distribution is more likely governed by a combination of factors, including total mineralization, major ion composition, lithological characteristics of the productive horizons, and long-term water–rock interaction.
Figure 4.
Relationship between lithium concentration and pH in formation waters of the Karazhanbas, Uzen and Zhetybay oil fields (Mangystau region, Kazakhstan).
The role of pH may primarily be related to maintaining lithium in its dissolved form under the studied hydrochemical conditions. However, the differences observed among the oil fields are more likely controlled by total mineralization, major ion composition, lithological characteristics of the productive horizons, and the duration of water–rock interaction, rather than by pH alone.
3.6. General Interpretation of Results and Comparison with International Studies
Overall, the results demonstrate that the formation waters of the Karazhanbas, Zhetybay, and Uzen oil fields are highly mineralized chloride-type waters formed under conditions of prolonged interaction with sedimentary and evaporitic rocks. The dominant ionic components are Cl−, Na+ + K+, Ca2+, and Mg2+, which is typical of formation waters in hydrocarbon-bearing sedimentary basins. In terms of total mineralization, the studied waters follow the sequence Uzen > Zhetybay > Karazhanbas. This indicates that Uzen and Zhetybay waters have undergone a more advanced stage of salt concentration and geochemical evolution, whereas Karazhanbas waters are characterized by lower mineralization and a more variable composition [9,10,12].
The obtained data are consistent with the findings of Yu et al. [10], who investigated lithium and brine geochemistry in the Qianjiang Formation of the Jianghan Basin, China. Their study showed that oilfield brines may be characterized by a pronounced chloride composition, high mineralization, and formation under the influence of evaporite dissolution, water–rock interaction, and long-term brine evolution. Similarly, the present study identified the predominance of Cl−, Na+ + K+, Ca2+, and Mg2+ in the investigated formation waters, indicating a comparable hydrogeochemical type. However, an important difference is that Li concentrations in the Mangystau waters are considerably lower than those reported for lithium-enriched brines of the Jianghan Basin.
In a subsequent study, Yu et al. [11] showed that the origin of lithium in oilfield brines is controlled not only by total mineralization, but also by Li and Sr isotopic characteristics, the lithology of water-bearing rocks, and prolonged water–rock interaction. The results of the present study support this interpretation. Although the highest mineralization was observed in Uzen waters, the highest lithium concentrations were recorded in Zhetybay waters. Therefore, lithium in Mangystau formation waters should not be interpreted as a simple salinity-related indicator, but rather as a component controlled by more complex geological and geochemical processes [9,10,11].
Comparison with the work of Liu et al. [4], which focused on lithium recovery from oil and gas produced waters, shows that the Mangystau formation waters contain lower Li concentrations than several international oil- and gas-bearing basins. Liu et al. emphasized that the suitability of produced waters as a lithium source depends not only on Li concentration, but also on total salinity, the composition of coexisting ions, produced water volume, and the availability of appropriate processing technologies. This is directly relevant to the present study, as Zhetybay and Uzen waters contain measurable Li concentrations but are also characterized by a complex and highly mineralized salt matrix, which may complicate selective lithium recovery.
Marza et al. [9], in their study of sedimentary basin brines in North America, emphasized that the lithium potential of formation waters is controlled not only by Li concentration, but also by basin-scale geological conditions, water productivity, and potential sources of lithium enrichment. This interpretation is consistent with the present results, as different oil fields within the Mangystau region show distinct Li levels despite belonging to the same hydrocarbon-bearing region. Thus, even within a single regional geological setting, lithium distribution may depend strongly on local lithology, reservoir depth, duration of water–rock interaction, and the geochemical evolution of the formation water system.
The analysis of Mg/Li, Ca/Li, and (Na+ + K+)/Li ratios is particularly important for both geochemical interpretation and technological assessment. In international studies, these ratios are used to evaluate the origin of brines and the position of lithium within the salt matrix [9,10,11], as well as the technological complexity of lithium extraction [15,16,17]. A high Mg/Li ratio is generally considered an unfavorable factor for lithium recovery because Mg2+ competes with Li+ during sorption, ion exchange, membrane separation, and extraction processes. Knapik et al. [3] and Liu et al. [4] noted that highly mineralized oilfield brines often require pretreatment, as elevated concentrations of Mg2+, Ca2+, and Na+ may reduce the efficiency of direct lithium extraction technologies [3,4,15,16,17]. In the present study, the highest Mg/Li and (Na+ + K+)/Li ratios were observed in Uzen waters, indicating a more complex salt matrix. In contrast, Zhetybay waters are characterized by a higher mean Li concentration and a more favorable Mg/Li ratio compared with Uzen, making this field a more relevant target for further lithium-oriented investigations.
Compared with highly enriched international brines, the formation waters of the Mangystau region cannot currently be considered a commercially viable lithium resource, as Li concentrations do not exceed 1.85 mg/dm3. Nevertheless, the scientific value of this study extends beyond the direct assessment of industrial potential. Its main contribution lies in establishing a systematic regional dataset on Li content and ionic composition of formation waters from major oil fields in the Mangystau region. Unlike many international studies focused on already identified lithium-enriched brines, the present work provides baseline information on lithium occurrence in a less-studied region of Central Asia [9,10,11].
Therefore, the findings of this study have both scientific and practical significance. From a scientific perspective, they demonstrate that lithium accumulation in formation waters is controlled not only by mineralization, but also by major cation ratios, lithological characteristics of productive horizons, and water–rock interaction. From a practical perspective, Zhetybay can be identified as the most promising target for further investigation, Uzen as a highly mineralized system with a complex salt matrix, and Karazhanbas as a lower-lithium, but important, comparative system. The key conclusion is that maximum mineralization does not necessarily correspond to maximum lithium concentration. Consequently, the evaluation of lithium potential in formation waters should be based on an integrated analysis of Li, TDS, pH, major ions, and relevant geochemical ratios [3,4,9,10,11,15,16,17].
3.7. Preliminary Resource Evaluation of Lithium in Oilfield Formation Waters of the Mangystau Region
The obtained results provide a preliminary assessment of formation waters from the Karazhanbas, Zhetybay, and Uzen oil fields in terms of lithium content and their potential for further resource evaluation. However, it should be emphasized that the measured lithium concentrations do not reach levels typical of highly enriched industrial lithium brines. The maximum lithium concentration in the studied samples was 1.85 mg/dm3, which is significantly lower than values reported for lithium-rich oilfield, sedimentary basin, and geothermal brines considered as potential lithium resources [3,4,6,8,9,10,11,13]. Therefore, at the current stage, the formation waters of the Mangystau region cannot be regarded as a commercially viable source of lithium.
The scientific significance of this study lies not in proposing an extraction technology or a universal genetic model of lithium enrichment, but in establishing a regional hydrogeochemical database on lithium content and ionic composition of formation waters from major oil fields in Western Kazakhstan. The obtained dataset provides a baseline for lithium distribution in this poorly studied region and demonstrates that maximum mineralization does not necessarily correspond to maximum lithium concentration. In particular, the most mineralized waters were identified in the Uzen field, whereas the highest lithium concentrations were observed in the Zhetybay field. This indicates that lithium accumulation is controlled not only by total salinity, but also by major ion composition, host rock lithology, water–rock interaction processes, and the geochemical evolution of formation waters [9,10,11].
From a technological perspective, the feasibility of lithium recovery from formation waters depends not only on absolute lithium concentration, but also on the composition of the salt matrix. Elevated concentrations of Na+, Ca2+, and particularly Mg2+ may significantly hinder selective lithium recovery due to competitive effects in sorption, ion-exchange, membrane separation, and solvent extraction processes [3,4,15,16,17]. The Mg/Li ratio is especially important: higher values indicate more challenging separation conditions. Among the studied waters, the highest Mg/Li ratios were characteristic of the Uzen field, suggesting a more complex and less favorable processing matrix. In contrast, Zhetybay waters exhibit higher lithium concentrations and comparatively lower Mg/Li ratios, making them more promising for subsequent laboratory-scale investigations.
From a process engineering perspective, direct lithium recovery from Mangystau formation waters is feasible only through highly selective separation methods. The most promising approaches include selective adsorption, ion-exchange materials, membrane-based technologies, electrochemical recovery, and hybrid pre-concentration schemes [3,4,6,7,13,14,15,16,17,26]. However, prior to selecting an appropriate technology, experiments on real formation water samples are required, as high salinity and the presence of competing ions can substantially reduce process efficiency [3,4,15,16,17].
Environmental considerations are also critical. The Mangystau region is characterized by an arid climate, limited freshwater resources, and significant anthropogenic pressure. Therefore, any potential lithium recovery strategy should prioritize minimization of waste generation, water reuse, implementation of closed-loop systems, and integration with existing produced water treatment or disposal infrastructure [3,4,6,7,17]. In this context, lithium recovery should be viewed not only as a resource utilization problem but also as part of sustainable oilfield water management.
Overall, the practical potential of the studied formation waters should be interpreted with caution. At the present stage, they cannot be classified as high-grade lithium brines; however, they represent a relevant object for further investigation. Future work should focus on detailed studies of Zhetybay and Uzen waters, calculation of geochemical ratios (Li/Cl, Mg/Li, Ca/Sr, Na/Cl), expansion of the sampling dataset, seasonal monitoring, determination of additional trace elements and isotopic composition, and laboratory-scale tests of lithium pre-concentration and selective recovery. The main conclusion is that formation waters of the Mangystau region may be considered a potential secondary hydromineral resource only at a preliminary assessment stage, while their industrial utilization requires further geochemical, technological, and environmental validation [3,4,9,10,11,15,16,17].
3.8. Limitations of the Study
Several limitations of the present study should be acknowledged. First, the dataset is based on 31 single formation water samples collected from three oil fields during one sampling campaign in May 2025. Therefore, the results provide a preliminary inter-field hydrogeochemical assessment of lithium distribution in oilfield formation waters of the Mangystau region, but they do not reflect seasonal or long-term temporal variability.
Second, the sampling points were unevenly distributed among the investigated oil fields, with 13 wells from Karazhanbas, 8 wells from Zhetybay, and 10 wells from Uzen. Although this dataset is sufficient for a preliminary comparison among the three fields, it does not allow the construction of detailed spatial interpolation models of lithium distribution. For this reason, IDW, kriging, or other spatial interpolation maps were not developed in the present study.
Third, information on well depths was not available for all sampling points. As a result, depth-dependent variations in lithium concentration, total mineralization, and ionic composition could not be evaluated. Future studies should include depth-resolved sampling data in order to better understand the vertical distribution of lithium and the role of reservoir conditions in controlling its accumulation.
Fourth, the present study provides a preliminary resource-oriented evaluation rather than a full technological or industrial assessment of lithium recovery. The conclusions regarding lithium recovery prospects are based on Li concentration, total dissolved solids, major ion composition, and geochemical ratios such as Ca/Li, Mg/Li, and (Na+ + K+)/Li. However, laboratory-scale experiments on lithium pre-concentration and selective recovery were not performed. Therefore, the industrial applicability of the studied waters remains uncertain and requires further technological validation.
Finally, isotopic analyses and extended trace-element characterization were beyond the scope of this study. Future research should include repeated seasonal sampling, a larger number of wells, additional trace elements, Li and Sr isotopic data, and laboratory testing of selective lithium recovery methods. These additional data would allow a more comprehensive assessment of the geological controls, spatial distribution, and practical significance of lithium in oilfield formation waters of the Mangystau region.
4. Conclusions
The results of this study demonstrate that formation waters from the Karazhanbas, Zhetybay, and Uzen oil fields are characterized by a chloride–calcium hydrochemical type, high mineralization, and a predominance of major ions, including Cl−, Na+ + K+, Ca2+, and Mg2+. In terms of total mineralization, the studied waters follow the sequence Uzen > Zhetybay > Karazhanbas, reflecting differences in salinity levels and the degree of geochemical evolution of formation waters across the investigated oil fields.
Lithium concentrations vary significantly among the studied fields. The lowest values were recorded in the Karazhanbas formation waters 0.30–0.70 mg/dm3, while Uzen waters reached 1.25–1.51 mg/dm3. The highest lithium concentrations were observed in Zhetybay waters 1.40–1.85 mg/dm3. Accordingly, the oil fields follow the sequence Zhetybay > Uzen > Karazhanbas in terms of lithium content.
A key finding of this study is that maximum mineralization does not correspond to maximum lithium enrichment. The most highly mineralized waters were identified in the Uzen field, whereas the highest lithium concentrations occurred in the Zhetybay field. This suggests that lithium distribution is controlled not only by total dissolved solids (TDS), but also by major ion chemistry, geochemical ratios (Ca/Li, Mg/Li, and (Na+ + K+)/Li), lithological features of productive horizons, water–rock interaction processes, and the overall geochemical evolution of formation waters.
Analysis of Ca/Li, Mg/Li, and (Na+ + K+)/Li ratios indicates that Uzen waters are characterized by a more complex salinity matrix and a higher proportion of competing cations relative to lithium. In contrast, Zhetybay waters exhibit higher mean lithium concentrations and a more favorable Mg/Li ratio compared with Uzen. Therefore, Zhetybay appears to be the most promising target for further lithium-focused investigations among the three studied oil fields.
Compared with lithium-rich brines reported globally, formation waters of the Mangystau region exhibit relatively low lithium concentrations and, at this stage, cannot be considered a commercially viable lithium resource. Their primary significance lies in establishing a regional hydrogeochemical database, defining baseline lithium levels in oilfield formation waters of Western Kazakhstan, and identifying prospective targets for further assessment.
Future research should focus on expanding the sampling dataset, conducting seasonal monitoring, determining additional trace elements and isotopic composition, calculating key geochemical ratios (Li/Cl, Mg/Li, Ca/Sr, Na/Cl), and performing laboratory-scale experiments on lithium pre-concentration and selective recovery. These efforts will enable a more robust evaluation of the resource potential of Mangystau formation waters and their possible role as a secondary hydromineral resource.
Author Contributions
Conceptualization, A.B.; methodology, A.B.; validation, A.B. and A.S.; formal analysis, A.B. and A.S.; investigation, A.B.; resources, A.S.; data curation, A.S.; writing—original draft preparation, A.B.; writing—review and editing, A.B. and A.S.; visualization, A.B.; supervision, A.S.; project administration, A.B.; funding acquisition, A.B. All authors have read and agreed to the published version of the manuscript.
Funding
This study has been funded by the Science Committee of the Ministry of Science and Higher Education of the Republic of Kazakhstan (grant No. AP22686075, “Investigation of the ion-salt composition of lithium-containing natural and wastewater of the Mangystau region and identification of industrial lithium sources”).
Data Availability Statement
The original contributions presented in this study are included in the article. Further inquiries can be directed to the corresponding author.
Conflicts of Interest
The authors declare no conflicts of interest.
References
- U.S. Geological Survey. Lithium. Mineral Commodity Summaries 2025; U.S. Geological Survey: Reston, VA, USA, 2025.
- International Energy Agency. Global Critical Minerals Outlook 2024; International Energy Agency: Paris, France, 2024. [Google Scholar]
- Knapik, E.; Rotko, G.; Marszałek, M. Recovery of lithium from oilfield brines—Current achievements and future perspectives: A mini review. Energies 2023, 16, 6628. [Google Scholar] [CrossRef] [Scilit]
- Liu, Q.; Yang, P.; Tu, W.; Sun, H.; Li, S.; Zhang, Y. Lithium recovery from oil and gas produced water: Opportunities, challenges, and future outlook. J. Water Process Eng. 2023, 55, 104148. [Google Scholar] [CrossRef] [Scilit]
- Gerardo, S.; Song, W. Lithium recovery from U.S. oil and gas produced waters: Resource quality and siting considerations. Environ. Sci. Water Res. Technol. 2025, 11, 536–541. [Google Scholar] [CrossRef] [Scilit]
- Jakaria, M.; Ling, K.; Pu, H.; Crowell, J.J. Lithium and salt extraction from the Bakken produced water. J. Pet. Explor. Prod. Technol. 2025, 15, 167. [Google Scholar] [CrossRef] [Scilit]
- Zegeye, R.B.; Tufa, R.A.; Santoro, S.; Inzillo, B.M.; Aquino, M.; Politano, G.G.; Embaye, A.S.; Argurio, P.; De Bartolo, L.; Curcio, E. Sustainable lithium recovery from geothermal brine via integrated membrane distillation–selective electrodialysis. Green Chem. 2025, 27, 4205–4221. [Google Scholar] [CrossRef] [Scilit]
- Kölbel, L.; Herrmann, L.; Kölbel, T.; Schneider, J. Lithium extraction from geothermal brines: Adsorption–desorption studies on 226Ra (228Ra) and 210Pb on lithium-titanium-oxides (LTO). Appl. Geochem. 2024, 162, 105913. [Google Scholar] [CrossRef] [Scilit]
- Marza, M.; Ferguson, G.; Thorson, J.; Barton, I.; Kim, J.-H.; Ma, L.; McIntosh, J. Geological controls on lithium production from basinal brines across North America. J. Geochem. Explor. 2024, 257, 107383. [Google Scholar] [CrossRef] [Scilit]
- Yu, X.; Wang, C.; Huang, H.; Yan, K. Origin of lithium in oilfield brines in continental petroliferous basin: Insights from Li and Sr isotopes in the Jianghan Basin, central China. Mar. Pet. Geol. 2024, 160, 106576. [Google Scholar] [CrossRef] [Scilit]
- Yu, X.; Huang, H.; Wang, C.; Wang, J.; Yan, K. Lithium and brine geochemistry in the Qianjiang Formation of the Jianghan Basin, central China. Sci. Rep. 2023, 13, 4445. [Google Scholar] [CrossRef] [Scilit] [PubMed]
- Collins, A.G. Geochemistry of Oilfield Waters; Elsevier Scientific Publishing Company: Amsterdam, The Netherlands, 1975. [Google Scholar]
- Wang, X.; Numedahl, N.; Jiang, C. Direct lithium extraction from Canadian oil and gas produced water using functional ionic liquids—A preliminary study. Appl. Geochem. 2024, 172, 106126. [Google Scholar] [CrossRef] [Scilit]
- International Lithium Association. Direct Lithium Extraction (DLE): An Introduction; International Lithium Association: London, UK, 2024. [Google Scholar]
- Zhang, Y.; Xu, R.; Wang, L.; Sun, W. Separation of magnesium from lithium in salt-lake brine through struvite precipitation. Miner. Eng. 2022, 180, 107468. [Google Scholar] [CrossRef] [Scilit]
- Khalil, A.; Mohammed, S.; Hashaikeh, R.; Hilal, N. Lithium recovery from brine: Recent developments and challenges. Desalination 2022, 528, 115611. [Google Scholar] [CrossRef] [Scilit]
- Murphy, O.; Haji, M.N. A review of technologies for direct lithium extraction from low Li+ concentration aqueous solutions. Front. Chem. Eng. 2022, 4, 1008680. [Google Scholar] [CrossRef] [Scilit]
- Barthel, R.; Banzhaf, S. Groundwater and climate change: No longer a hidden resource. Hydrogeol. J. 2016, 24, 1931–1934. [Google Scholar]
- GOST 31861–2012; Water. General Requirements for Sampling. Interstate Standard: Moscow, Russia, 2013.
- ISO 5667-3:2024; Water quality—Sampling—Part 3: Preservation and Handling of Water Samples. International Organization for Standardization: Geneva, Switzerland, 2024.
- Lipps, W.C.; Braun-Howland, E.B.; Baxter, T.E. (Eds.) Standard Methods for the Examination of Water and Wastewater, 24th ed.; APHA Press: Washington, DC, USA, 2023. [Google Scholar]
- U.S. Environmental Protection Agency. Method 200.7: Determination of Metals and Trace Elements in Water and Wastes by Inductively Coupled Plasma-Atomic Emission Spectrometry; Revision 4.4; U.S. Environmental Protection Agency: Cincinnati, OH, USA, 1994.
- U.S. Environmental Protection Agency. Method 200.8: Determination of Trace Elements in Waters and Wastes by Inductively Coupled Plasma-Mass Spectrometry; Revision 5.4; U.S. Environmental Protection Agency: Cincinnati, OH, USA, 1994.
- Vesković, J.; Onjia, A. Exposure and Toxicity Factors in Health Risk Assessment of Heavy Metal(loid)s in Water. Water 2025, 17, 2901. [Google Scholar] [CrossRef] [Scilit]
- Schober, P.; Boer, C.; Schwarte, L.A. Correlation coefficients: Appropriate use and interpretation. Anesth. Analg. 2018, 126, 1763–1768. [Google Scholar] [CrossRef] [Scilit] [PubMed]
- Kiemde, A.F.; Díaz Nieto, C.H.; Marin, J.; Flexer, V.; Chagnes, A. Direct lithium extraction from natural brines with co-valorization of boron, magnesium and sodium by combining solvent extraction and electrodialysis operations. Sustain. Mater. Technol. 2025, 46, e01749. [Google Scholar] [CrossRef] [Scilit]

Disclaimer/Publisher’s Note: The statements, opinions and data contained in all publications are solely those of the individual author(s) and contributor(s) and not of MDPI and/or the editor(s). MDPI and/or the editor(s) disclaim responsibility for any injury to people or property resulting from any ideas, methods, instructions or products referred to in the content. |
© 2026 by the authors. Licensee MDPI, Basel, Switzerland. This article is an open access article distributed under the terms and conditions of the Creative Commons Attribution (CC BY) license.