


Abstract
Pressure swing adsorption (PSA) is a viable method for separating hydrogen from gas mixtures, an important aspect of long-term hydrogen storage in depleted gas fields. This study explores optimizing a 12-step PSA process for recovering high-purity hydrogen from varying compositions of hydrogen–methane mixtures, simulating the conditions likely encountered during hydrogen storage and recovery. Step-time optimization was performed on four different hydrogen–methane mixtures using the toPSAil simulation package—an open-source dynamic PSA simulator developed by researchers at the Georgia Institute of Technology—integrated with a particle swarm optimization (PSO) algorithm. The goal was to develop an optimization framework that can reliably identify PSA step times for different operating scenarios and satisfy specified purity and recovery constraints under fluctuating wellhead feed conditions. The optimization converged within 25–30 iterations, even in high-contaminant, low-pressure scenarios, where PSA performance is traditionally weak. The product purity in the optimized cycles was above 99.1% with more than 80% recovery for all cases, while fuel cell quality (99.7%) hydrogen was achieved in two out of the four scenarios. The purge-to-feed ratio of the best-performing cycles was between 0.07 and 0.32. These findings show the potential of the proposed approach in overcoming the difficulty of designing PSA cycles for non-constant gas compositions and achieving a hydrogen purification process suitable for variable feed conditions. The workflow generates a large synthetic dataset that can support surrogate or hybrid modeling. The results can help advance research in other gas separation areas with non-constant conditions, like flue gas or biogas purification.
1. Introduction
Interest in hydrogen as a versatile energy carrier is growing, primarily because it can be produced from renewable energy sources and utilized across various applications such as fuel cells, heating, and chemical processes. The RepowerEU plan emphasizes hydrogen as a key element to reduce dependency on fossil fuels, targeting up to 10 million tonnes of domestic renewable hydrogen production and 10 million tonnes of imported hydrogen by 2030, which corresponds to substantial storage needs. Despite this ambitious target, storage remains a significant challenge for scaling up the hydrogen economy.
Hydrogen’s small molecular size poses a challenge for safe and leak-free storage, while its low density necessitates high pressure for effective storage solutions. Underground hydrogen storage (UHS) in deep geological formations is emerging as a promising solution for large-scale, long-duration energy storage, particularly for balancing seasonal variations in renewable energy production.
Over the last decade, multiple demonstration programs and assessments have investigated the technical feasibility, geochemical interactions, and economic potential of underground hydrogen storage (UHS) across storage types such as depleted gas fields, aquifers, and salt caverns [1,2,3,4,5,6,7]. Collectively, these studies highlight the scale of the opportunity and the importance of site-specific effects (e.g., residual gases and mixing) that can influence the composition of the produced gas and, thereby, the requirements for downstream purification.
Salt caverns offer the highest efficiency and security for hydrogen storage, but suitable geological locations are limited compared to depleted gas fields. While aquifers provide the largest storage capacity, they require the most cushion gas and present the highest risk for leakage, thereby reducing storage efficiency. Depleted gas fields, on the other hand, offer advantages such as well-understood geological characteristics and established infrastructure, which can facilitate hydrogen injection and withdrawal operations, leading to the lowest cost of storage [8,9].
Cushion gas is injected prior to hydrogen storage, serving as an unextracted volume and acting as a buffer during cyclic operations. It is crucial for maintaining reservoir pressure and facilitating the withdrawal of stored hydrogen, as it significantly impacts both recovery rates and purity levels [1]. For salt caverns, the amount of cushion gas typically ranges between 22 and 33%, while for aquifers and hydrocarbon reservoirs, it ranges between 50 and 80% of the total injected gas [9]. However, in depleted gas fields, native gas can act as cushion gas, significantly reducing the need for additional injection [10]. Typical gases considered for this purpose are carbon dioxide, nitrogen, and methane (natural gas). Hydrogen itself can also serve as cushion gas, which reduces contamination but significantly decreases recovery.
The effects of subsurface mixing and the role of the chosen cushion gas have been extensively studied through numerical simulations. Gas mixing in the reservoir can be attributed to several factors, including diffusion, pressure-driven flow during injection and production, density-driven flow induced by differences between H2 and cushion gas densities, and heterogeneities in the porous media that can further enhance mixing during storage [11,12,13].
Reservoir simulations consistently indicate that the produced gas composition at the wellhead can vary substantially during withdrawal, with hydrogen fractions reported to decrease from near-pure values to much lower levels depending on the site, cushion gas choice, and operating strategy [14,15,16]. Reported outcomes include cases where hydrogen remains near-pure only for an initial period and then declines over the withdrawal phase, in some scenarios reaching ∼20–50% by the end of production [14,15]. This transient behavior motivates purification solutions that can tolerate a wide range of inlet pressures and impurity levels without requiring extensive upstream conditioning.
It is important to note that current equations of state (EOS) may be inaccurate in representing the flow of multicomponent gases in the reservoir [17]. Although the properties of the retrieved gas are highly site- and operation-specific, studies indicate the transient nature of the retrieved gas during the withdrawal period and from cycle to cycle. This variability necessitates the development of flexible hydrogen purification systems that can achieve the desired hydrogen quality from a wide range of mixtures while minimizing losses and energy requirements for separation.
The most common technologies for hydrogen purification on a scale relevant to underground hydrogen storage are pressure swing adsorption (PSA) and membrane separation. PSA systems are favored for their ability to handle large gas volumes and achieve high purity levels, often exceeding 99.99%. Membrane technology, while less common for large-scale purification, is gaining traction due to lower energy requirements and continuous operation capabilities. Both technologies can be tailored to address the varying compositions of retrieved gas from underground storage, with PSA offering more flexibility in dealing with fluctuating impurity levels [18,19,20,21]. Recent reviews highlight continued progress in industrial hydrogen PSA (e.g., cycle configurations, multi-bed/polybed concepts, and process integration) as well as ongoing development of hydrogen separation membranes—including inorganic, polymeric, and Pd-based membranes—with improving selectivity, permeability, and durability [22,23,24,25]. Because PSA performance depends strongly on cycle configuration and step scheduling, it is typically evaluated using dynamic column models that resolve stepwise transients and cyclic steady state behavior, which provides a basis for systematic tuning of operating parameters under changing feed conditions [22,26]. In the present work, we focus on the UHS wellhead context and use dynamic simulation to evaluate step-time optimization under a variable pressure–composition envelope.
Optimization of a PSA process is a complex challenge with a multitude of factors. Tagliabue et al. explored the optimization of an existing hydrogen purification system using PSA technology. By modifying operative parameters such as feed temperature and implementing cryogenic exchange equipment, they increased the unit’s processing capacity by 25% and improved hydrogen recovery by 2.5%. The study highlights practical improvements for PSA systems without significant changes in pressure [27]. Jiang et al. developed a Newton-based method for optimizing PSA systems that improves the efficiency of reaching cyclic steady state (CSS) by eliminating the need for iterative convergence. Using reduced-space successive quadratic programming (rSQP), they successfully optimized non-isothermal PSA systems, reducing computation time by up to 90% [28]. In their work, Saberimoghaddam and Nozari developed an experimental and statistical model using the central composite design (CCD) method for optimizing PSA performance in hydrogen purification. They found that increasing the purge-to-feed ratio improved hydrogen purity but reduced recovery and productivity. Their model accurately predicted the process outcomes, offering a reliable approach to optimizing PSA systems [29]. Nogueira et al. applied a particle swarm optimization (PSO)-based solution to the optimization of a PSA unit for syngas purification, demonstrating that population-based approaches can efficiently explore the nonconvex optimization landscape of cyclic adsorption processes. Beyond identifying optimal operating conditions, their work highlighted the added value of PSO in generating large datasets that enable data recycling and training of hybrid models [30]. In a parametric study, Zhang et al. optimized a hydrogen PSA process using the Box–Behnken design (BBD) method. They developed a layered bed PSA model to investigate the effects of key parameters such as adsorption time, pressure equalization time, and purge-to-feed ratio [31].
While a significant number of articles discuss optimization strategies for PSA, studies that explicitly address variability in feed pressure and composition in a unified optimization workflow remain limited. In this study, we perform step-time optimization on a four-bed PSA system to maximize high-purity hydrogen production from an underground hydrogen storage (UHS) wellhead. The contribution of this work is the integration of a particle swarm optimization (PSO) routine with the open-source dynamic PSA simulator toPSAil and a demonstration of the resulting workflow on variable feed conditions representative of UHS recovery. Four hydrogen–methane feed scenarios were selected to span the expected wellhead pressure–composition envelope during retrieval from depleted gas fields. We evaluate the ability of PSO to identify suitable step times under these conditions and report convergence behavior and computational performance. In addition, the intermediate simulation points generated during the optimization can be reused as training data for surrogate models (e.g., neural networks), which could enable faster retuning in future studies. The results provide a transparent baseline for PSA step-time optimization under fluctuating feed conditions relevant to UHS.
Recent work on hydrogen purification highlights continued advances in PSA cycle design and integration as well as growing interest in membrane-based separations, with the practical technology choice depending on the required purity, recovery, scale, and feed composition [22,23,24,25]. From a process-systems perspective, PSA performance is strongly cycle-dependent and is typically assessed using dynamic column models that resolve stepwise transients and cyclic steady state behavior, which enables systematic evaluation of purity–recovery trade-offs under different operating conditions [22,26]. In the present work, we focus on the UHS wellhead context and use dynamic simulation to evaluate candidate cycle step times under a variable pressure–composition envelope.
2. Methodology
In this section, we describe the mathematical model used for the PSA process, the process description, the particle swarm optimization algorithm, and the production wellhead case study.
2.1. Mathematical Model and Simulation Workflow
The pressure swing adsorption (PSA) unit consists of four fixed-bed adsorption columns, each sequentially serving a different function in each process step. The simulations are performed in MATLAB® 2025a using the Totally Open Pressure Swing Adsorption Intensification Laboratory (toPSAil) simulation code developed at the Georgia Institute of Technology. toPSAil is an open-source framework for dynamic simulation of PSA processes. In this work, each adsorption column is represented by a one-dimensional CSTRs-in-series (CIS) formulation, where the bed is discretized axially into a finite number of ideally mixed control volumes. For each control volume, the model solves coupled mass, momentum, and energy balances for the gas and solid phases, together with adsorption equilibrium and mass-transfer kinetics. The resulting differential-algebraic equation (DAE) system is integrated using built-in MATLAB® solvers. The full mathematical formulation and implementation details (balance equations, constitutive relations, and numerical solution strategy) are provided in the original toPSAil publication [26].
The model used in this study is based on the following assumptions:
- –
- Ideal gas behavior in the gas phase.
- –
- Mass, heat, and velocity gradients in the radial direction are neglected (1D simulation).
- –
- Axially dispersed plug flow in the adsorber with constant axial dispersion coefficient.
- –
- External heat transfer expressed with a film model using constant coefficients.
- –
- Constant bed porosity.
- –
- Pressure drop described by the Ergun equation.
- –
- Adsorption equilibrium described by the Langmuir isotherm.
- –
- Adsorption kinetics described by the linear driving force (LDF) approximation.
Although Langmuir equilibrium and LDF kinetics are simplifications, they are widely used as baseline closures in dynamic PSA modeling because they provide a computationally tractable description of adsorption equilibria and rate limitations suitable for repeated cyclic simulations. In this work, the objective is to compare cycle performance and optimizer behavior across variable feed conditions using a consistent model structure; therefore, the same equilibrium and kinetic closures are applied across all stages. Nevertheless, deviations from Langmuir behavior (e.g., site heterogeneity and competitive adsorption effects) and limitations of the LDF approximation may affect the quantitative prediction of breakthrough dynamics and thus shift the predicted optimal step times and achievable purity–recovery trade-offs, particularly at elevated pressures. Incorporating more detailed equilibrium and transport models, as well as real-gas nonideality, is identified as a direction for future work within the toPSAil framework. At the investigated pressures (35–60 bar), real-gas effects may influence densities and fugacities; the ideal-gas assumption adopted here may therefore introduce additional quantitative deviations in adsorption loading and pressure-drop predictions.
For each simulated cycle, toPSAil produces time-resolved profiles of relevant process variables (e.g., pressure, flow rates, and outlet gas compositions) and writes selected performance results to output files. In this work, the optimizer uses the product-stream purity and recovery calculated over a full PSA cycle. These KPIs are obtained from the simulator outputs by numerical integration of the corresponding molar flow rates during the relevant steps.
The hydrogen purity is defined as the mole fraction of hydrogen in the product stream integrated over a full PSA cycle:
The hydrogen recovery is defined as the total number of moles of hydrogen recovered in the product stream divided by the total number of moles of hydrogen fed into the system:
The goal of the optimization is to maximize both purity and recovery while maintaining minimum specifications for purity (and a minimum acceptable recovery), enforced via a penalty formulation (see Section 2.5). The optimization is performed by adjusting the step times in the PSA cycle to achieve the desired separation performance.
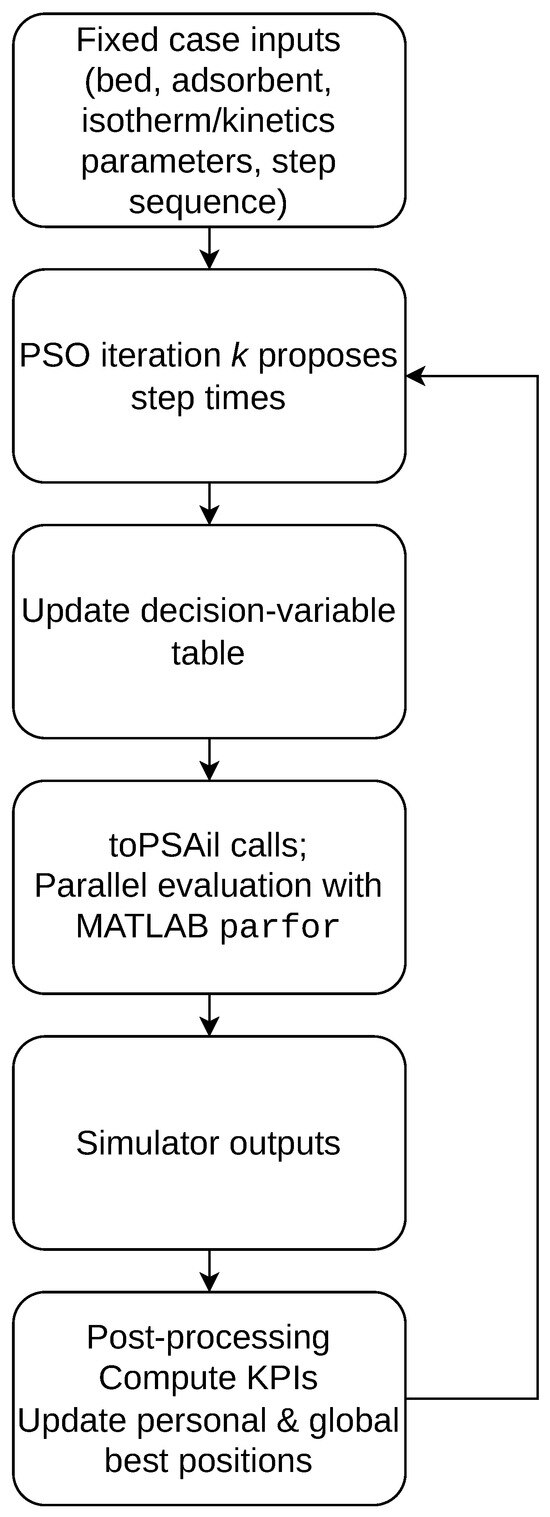
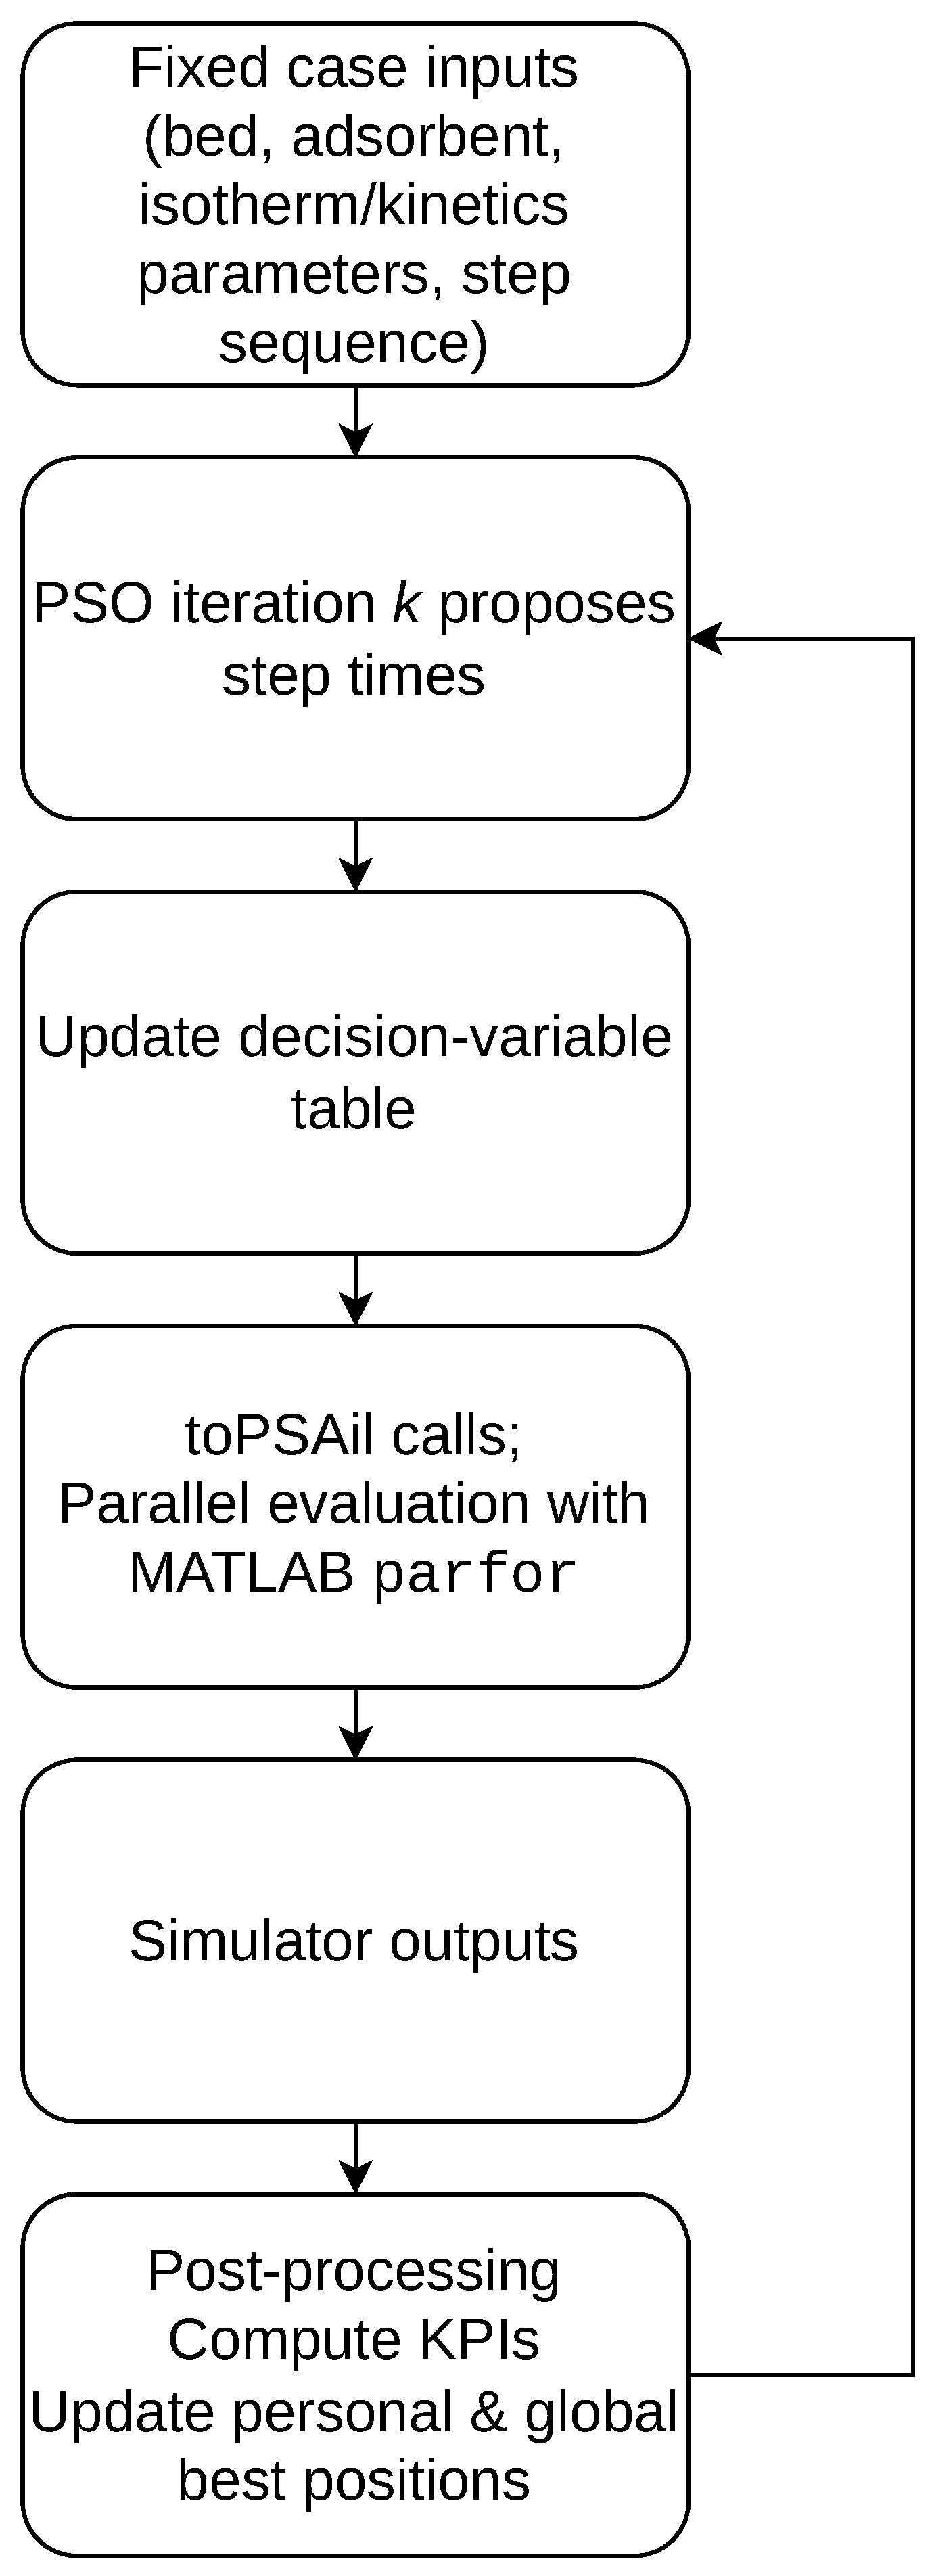
A schematic overview of the data flow between PSO and toPSAil is provided in Figure 1. The particle swarm optimization (PSO) algorithm evaluates candidate decision-variable vectors (step times) by calling toPSAil as a black-box simulator. At each PSO iteration, a decision-variable table is updated to contain one row per particle. The particle evaluations are then executed in parallel (using parfor), where each worker runs one independent toPSAil simulation and reads the row corresponding to its particle index. After all simulations finish, the KPIs are extracted and used to compute the objective value and constraint-violation penalties. The swarm is subsequently updated and the next iteration begins.
Figure 1.
Workflow for coupling PSO and toPSAil. At each iteration, the PSO updates the decision-variable table and evaluates all particles in parallel using parfor. Each simulation returns KPI outputs which are post-processed to compute the objective value and constraint-violation penalties before updating the swarm.
2.2. Process Description
In this work, we consider a 4-bed PSA system where each bed goes through three phases (feed–pressure recovery–bed regeneration) and nine elementary steps, shown in Table 1. The cycle includes two pressure equalization steps to improve efficiency. The elementary steps are the following: high-pressure adsorption (Ad), equalization (coEq), provide co-current purge gas (coPu), counter-current depressurization (ccBd), counter-current purge (ccPu), equalization up (ccEq), pressurization with feed (coPr).
Table 1.
Elementary step sequence.
Although the PSA cycle consists of nine distinct elementary steps in terms of valve configurations, the cycle duration is parameterized using three independent step-time variables. These three time variables are combined to form a 12-step time sequence, as certain elementary steps are repeated with identical durations across the cycle. The resulting process times for feed, depressurization, regeneration, and purge are defined as:
2.3. Purge-to-FeedRatio Calculation
The purge-to-feed () ratio was calculated to quantify hydrogen loss during the PSA cycle. For each optimized PSA cycle, the hydrogen mole fraction in the first CSTR (during feed steps) and in the last CSTR (during purge steps) was extracted from the simulation outputs for all four columns. These values were multiplied by the corresponding volumetric flow rates at each time step to approximate the hydrogen molar flow. The total hydrogen fed and purged was obtained by integrating these molar flows over time using the recorded simulation time. The ratio was defined as:
where is the gas-phase mole fraction of hydrogen in the relevant CSTR at time t, and is the corresponding volumetric flow rate. Step-wise indices were assigned based on the scheduling table and time intervals from the simulation. The integration was performed numerically using the trapezoidal rule.
The reported here is a simulator-derived KPI intended for consistent comparison of cycle designs within this study. Industrial P/F values may be reported using different conventions (e.g., plant-level instrumentation, standardized conditions, or alternative definitions of step boundaries). Because the CIS formulation represents the bed using a finite number of CSTR elements, predicted flow profiles (and therefore ) can, in principle, vary with the chosen CSTR resolution. A systematic discretization-sensitivity analysis is beyond the scope of this work; however, the same discretization settings are used for all stages, making the reported values suitable for comparative analysis across the investigated scenarios.
2.4. Particle Swarm Optimization
Particle swarm optimization is a metaheuristic approach to global search optimization with straightforward implementation and relatively low computational cost [30]. It is inspired by the social behavior of animal groups, such as bird flocks or fish schools. It is widely used to solve complex optimization problems. In PSO, a swarm of particles, each representing a potential solution, moves through the search space. The movement of each particle is influenced by its own best-known position and the best-known positions of its neighbors, effectively balancing exploration (global search) and exploitation (local search). At each iteration, particles update their velocity and position based on a combination of their personal best position and the global best position found by any particle in the swarm.
where k notes the iteration number, i the particle number, is the global best position, and are random numbers between 0 and 1. The inertia weight factor, w, and the acceleration coefficients, and , are used to tune the algorithm. There are numerous ways to constructs the inertia weight factor and the acceleration coefficients. In this work, we use a time-varying alteration from Ratnaweera et al. [32] to transition from the early stage space exploration to the global minimum at the later stage:
where the subscript i denotes the initial value and f the final value. The numerical properties of the algorithm are listed in Table 2. This search strategy is highly adaptable and can be easily hybridized with other techniques to further enhance convergence speed and solution quality. The population-based approach also allows for effective parallelization, making it suitable for large-scale problems.
Table 2.
PSO hyperparameters used in this work. For time-varying parameters (w, , ), the values are specified as initial → final and updated at each iteration according to Equations (10)–(12).
The search space comprises the step times within the PSA cycle, where “step time” refers to the duration assigned to each individual step in the 4-bed, 12-step PSA process. These step times control how long each phase—such as adsorption, depressurization, or regeneration—lasts within a single cycle. Each particle in the PSO algorithm represents a candidate set of step times applied to a previously established toPSAil simulation base case. The optimization minimizes a scalar objective composed of purity and recovery terms:
Minimum product purity is treated as a process specification and enforced using a penalty added to the objective. Infeasible solutions (below the purity threshold, and below a minimum acceptable recovery) are assigned an additional constraint-violation penalty, which is added to the original objective to yield the final cost function:
where is a non-negative penalty based on violations of the specifications such that for and , and otherwise, increasing with the magnitude of any violation. In the present work, the specifications and penalty weight were defined as , , and . This formulation biases the search toward feasible high-purity solutions as infeasible particles receive larger objective values, which prevents them from becoming personal/global best solutions and steers the swarm toward feasible regions in subsequent updates. Because and are dimensionless and bounded in , equal weights provide a simple normalized baseline without introducing scale bias. We note that purity and recovery form a natural multiobjective trade-off; a formal multiobjective formulation is a natural extension, but is outside the scope of the present study, which uses a scalar objective with explicit constraint handling to obtain one best-performing solution per scenario.
The optimization process is executed in parallel, allowing efficient evaluation of particle simulations. The algorithm was run on a desktop computer with 10 cores; the parallel implementation is described in the next subsection. The number of particles was set equal to the available cores. The optimization was run for 30 iterations; convergence behavior is evaluated and discussed in Section 3. The algorithm properties are shown in Table 2. Time-varying PSO parameters are updated each iteration using Equations (10)–(12); the table reports the initial and final values defining these schedules.
2.5. Parallel Implementation
A parallel pool is opened with 10 workers using MATLAB’s Parallel Computing Toolbox. At the start of each PSO iteration k, a table of decision variables is updated to contain one row per particle. A parfor loop evaluates particles ; each worker calls toPSAil once, reading row i of the input table and writing the results to a unique output folder. After a parfor loop is completed, objective values and constraint violations are read from the output folders and used to update the particle’s personal best and the global best. The next iteration then begins with an updated table of decision variables, which is again evaluated in parallel.
2.6. Production Wellhead Case Study
In the literature, it has been observed that hydrogen concentration at the production wellhead can decrease to as low as 25%. In our case study, the depleted gas field originally contained methane as native gas and was subsequently filled with pure hydrogen up to a pressure of 60 bar. The hydrogen content of the recovered gas varies between 100% and 70%, while the production wellhead pressure ranges from 60 to 35 bar. Four distinct cases were selected within these ranges, whose properties are listed in Table 3. These cases are intended as representative snapshots spanning the expected pressure–composition envelope during withdrawal (high-pressure/low-contamination to lower-pressure/higher-contamination) rather than a time-resolved description of the full production trajectory. We consider a binary H2–CH4 feed because methane is typically the dominant native component of depleted natural-gas reservoirs, and CH4 is expected to be a primary contaminant during hydrogen withdrawal. Each case requires an independent optimization run; therefore, four scenarios were chosen as a practical trade-off between covering qualitatively different operating conditions and limiting computational effort. A finer discretization into additional stages is straightforward within the same workflow and can be pursued when site-specific production profiles are available.
Table 3.
Production Wellhead Case.
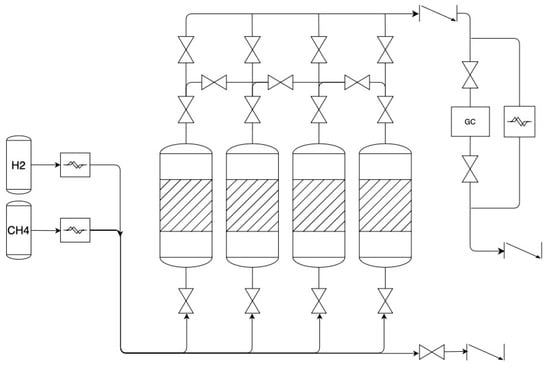
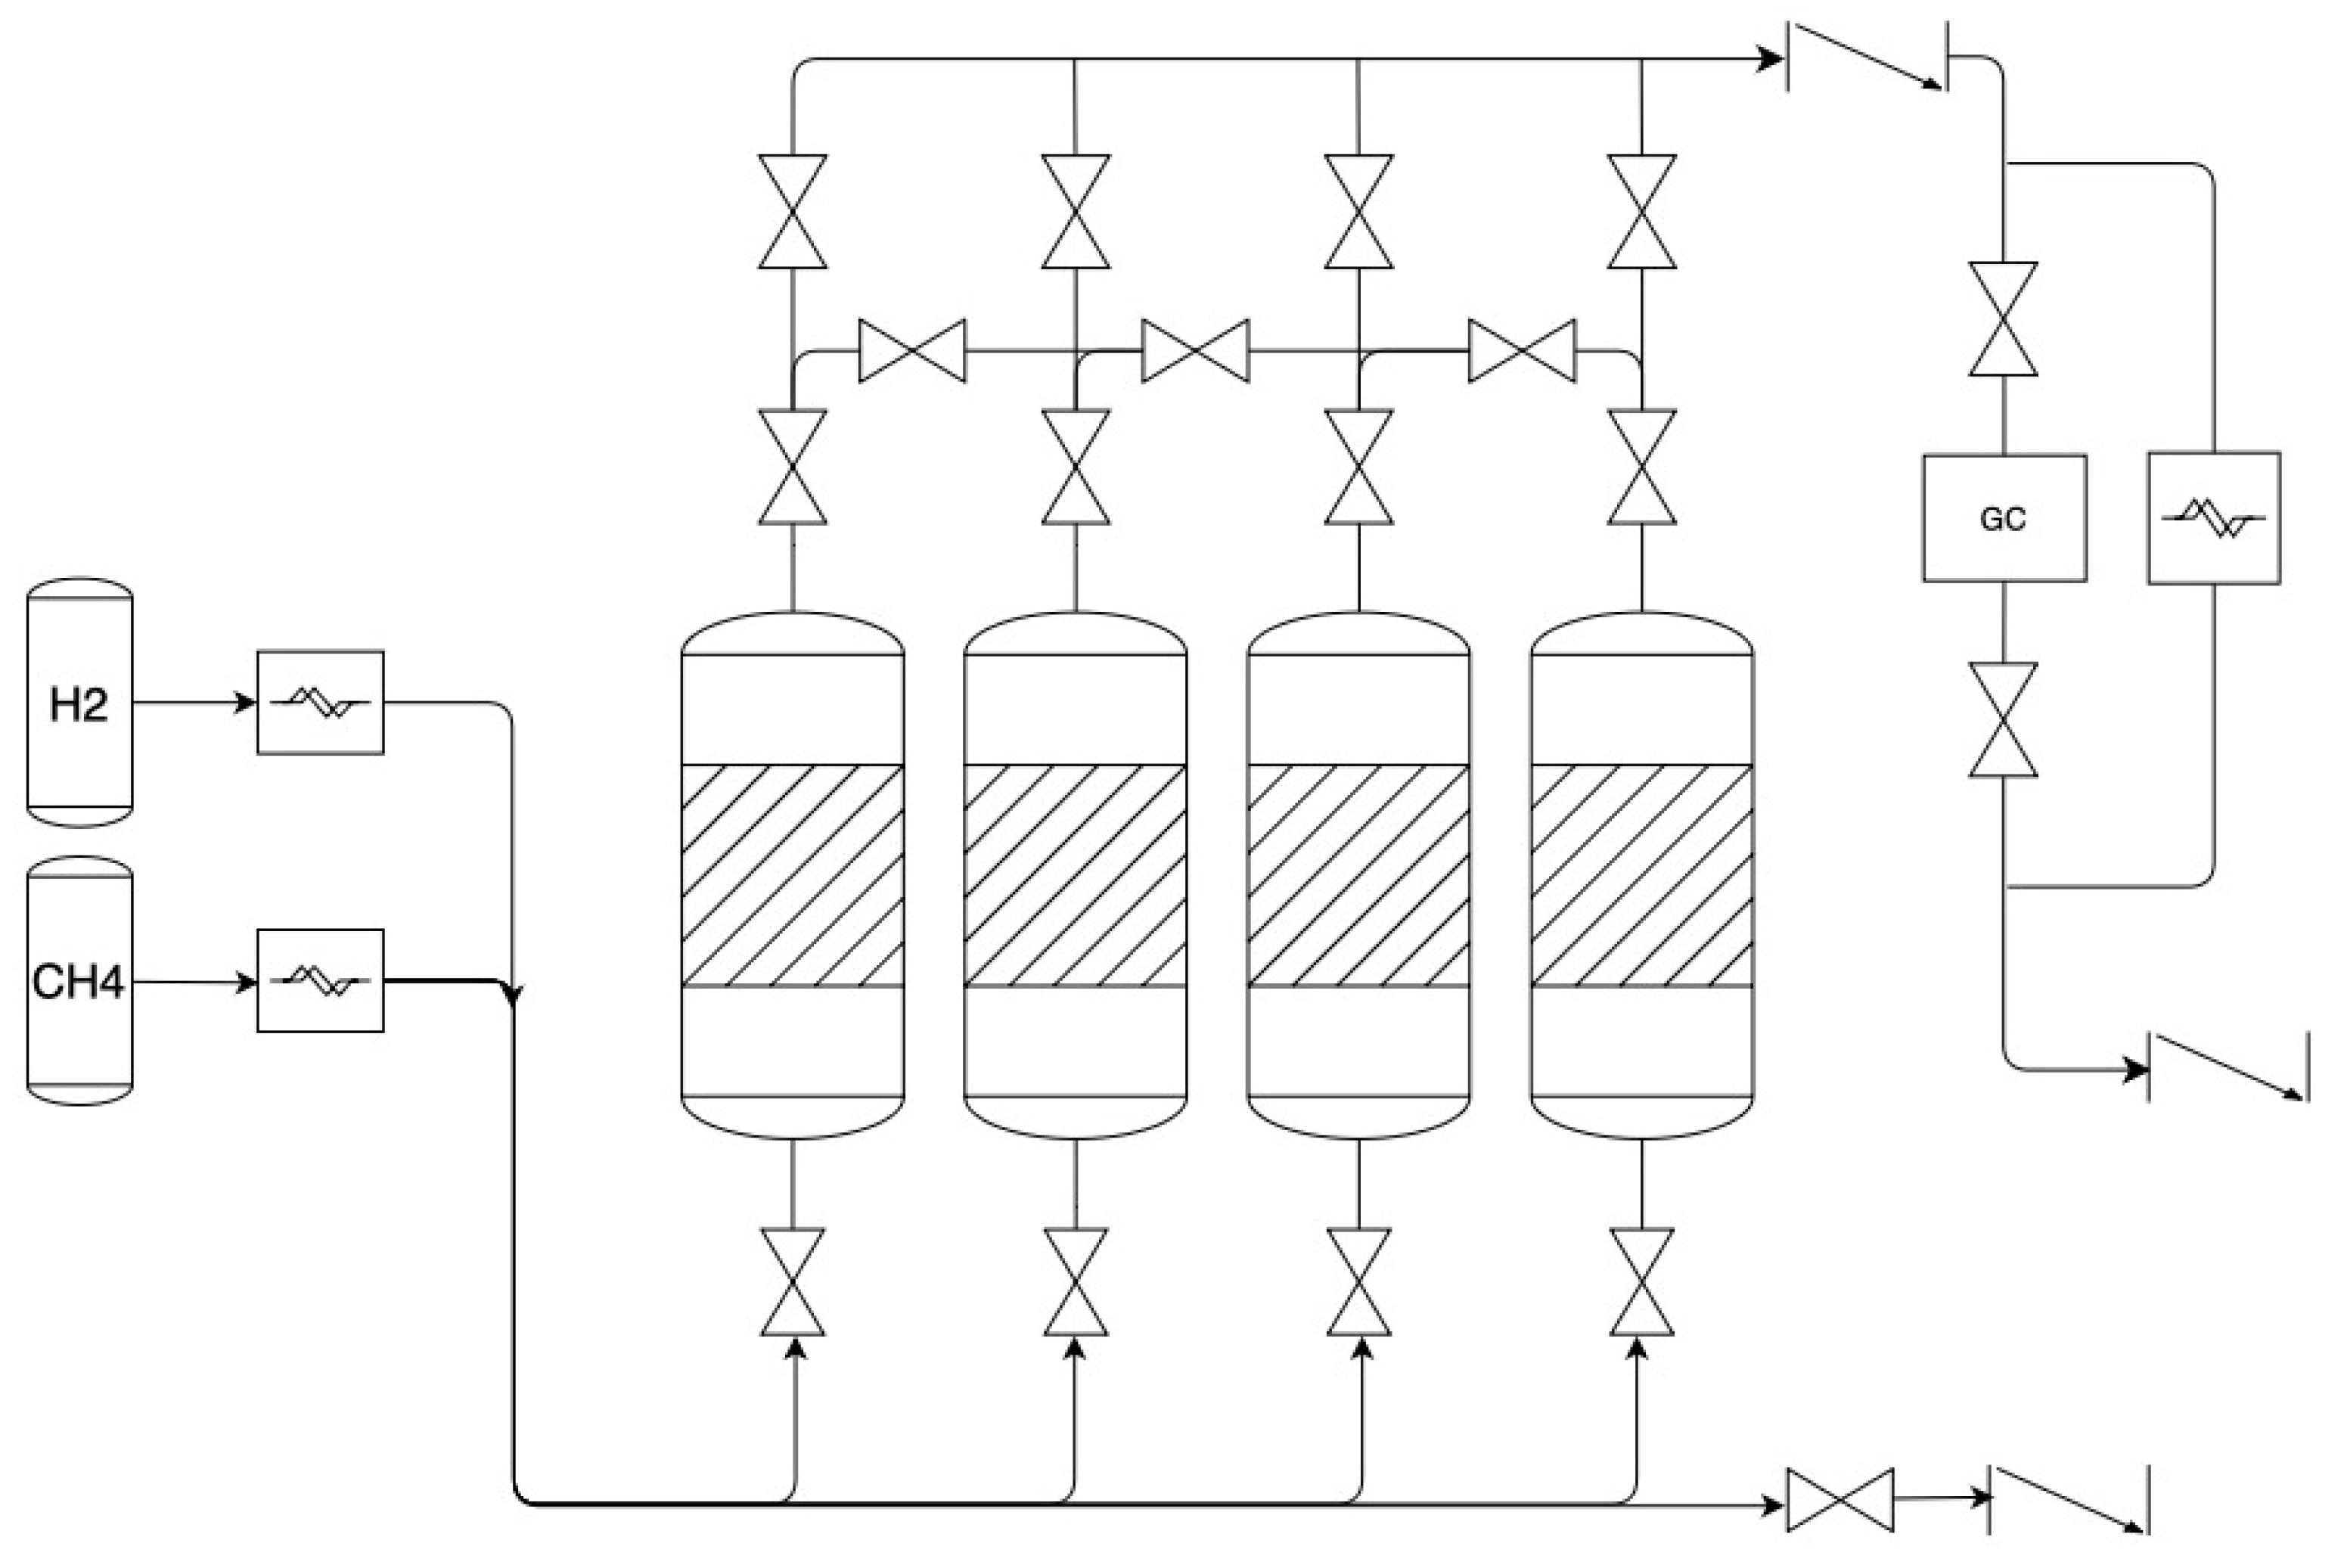
The optimization results are reliant on the quality of the underlying simulation model and simulation settings. In this work, the simulation model was previously validated against experimental data from a laboratory-scale H2–CH4 PSA unit [33,34]. In particular, the toPSAil model was benchmarked using breakthrough experiments across the four feed stages, and methane breakthrough times (defined at 0.1% CH4 at the column outlet) showed close agreement between experiments and simulations: Stage 1 (1175 s vs. 1106 s), Stage 2 (723 s vs. 733 s), Stage 3 (521 s vs. 510 s), and Stage 4 (495 s vs. 489 s) [34]. The step-time optimization presented in this manuscript is performed using this validated model configuration. The PSA system contains four beds, filled with activated carbon and the adsorption isotherm was described by the Langmuir model. The bed and adsorbent properties are listed in Table 4. The illustration of the lab unit, used for validation, is shown in Figure 2.
Table 4.
Bed and Adsorbent Properties.
Figure 2.
Illustration of the laboratory-scale PSA unit used for model validation. The system consists of four packed-bed columns (hatched regions indicate the adsorbent beds), instrumentation for pressure and flow control, and automated valves to implement the 12-step cycle. The square symbols with the zig-zag line denote mass flow controllers on the feed and product lines. The validated experimental setup provided the basis for simulation tuning and step-time optimization.
The bed geometry and adsorbent properties in Table 4 correspond to the laboratory-scale four-bed PSA setup used in our prior experimental and model benchmarking studies [33,34]. Activated carbon was selected as a practical baseline adsorbent for H2 purification in the presence of light hydrocarbons, consistent with common PSA practice [35].
3. Results
In this section, we evaluate the performance of the optimization process in terms of computational cost, convergence behavior, solution quality, and robustness of the PSO algorithm. The decision variables (step times) were bounded between 0.5 and 90 min, selected based on preliminary sensitivity analyses and prior knowledge of PSA process dynamics. Although valve coefficients were allowed to vary during algorithm development to maintain stable boundary-condition enforcement, they serve as internal flow-control parameters within toPSAil and do not constitute independent physical decision variables. As such, valve coefficients (Cv) cannot be uniquely interpreted as physical valve-sizing coefficients without additional assumptions (e.g., absolute upstream pressure, valve law, and choked-flow criteria). The reported optimization results are therefore restricted to step-time decision variables to ensure physical interpretability and reproducibility.
3.1. Computational Cost and Bottlenecks
The computational cost of the proposed PSO–toPSAil workflow is dominated by the dynamic PSA simulations executed for particle evaluations. All optimizations were run in MATLAB using parfor on a 10-core desktop, with the swarm size set equal to the number of available workers (). In this setup, one PSO iteration consists of independent toPSAil simulations executed in parallel, followed by a lightweight swarm update.
To quantify practical runtime, wall-clock timings were recorded for the most challenging case (Stage 4). The median per-particle simulation time (excluding output writing) was approximately 1474 s (24.6 min), with a range of 502–4204 s (8.4–70.1 min) across particles and iterations. The time required to write simulation outputs was negligible in comparison (median ≈ 1.8 s per particle, range 1.2–3.1 s), corresponding to ∼0.1% of the total particle evaluation time. As a result, the overall iteration wall-clock time is governed by the slowest particle evaluation in each iteration, yielding iteration times of 2219–4208 s (37.0–70.1 min). The total runtime of the 30-iteration optimization run was ∼26.7 h for Stage 4. Because the slowest particle evaluation determines the wall-clock time of each iteration, the final runtime can vary, but it remains on the same order of magnitude for a 30-iteration run on the same hardware.
These results indicate that the primary computational bottleneck is the solution of the large DAE system arising from the CIS/CSTR column discretization and cycle simulation. Because particle evaluations are independent, additional compute resources (more workers) can reduce wall-clock time per iteration, while overall performance remains limited by the slowest particle evaluation.
3.2. Optimization Convergence
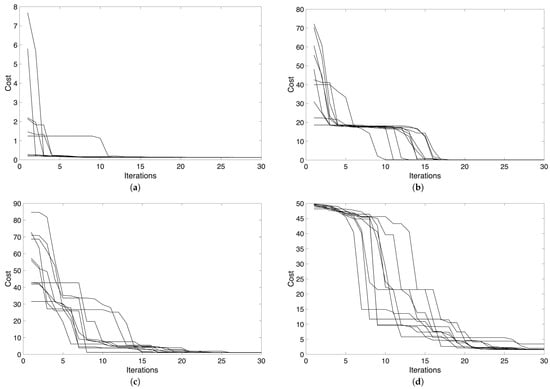
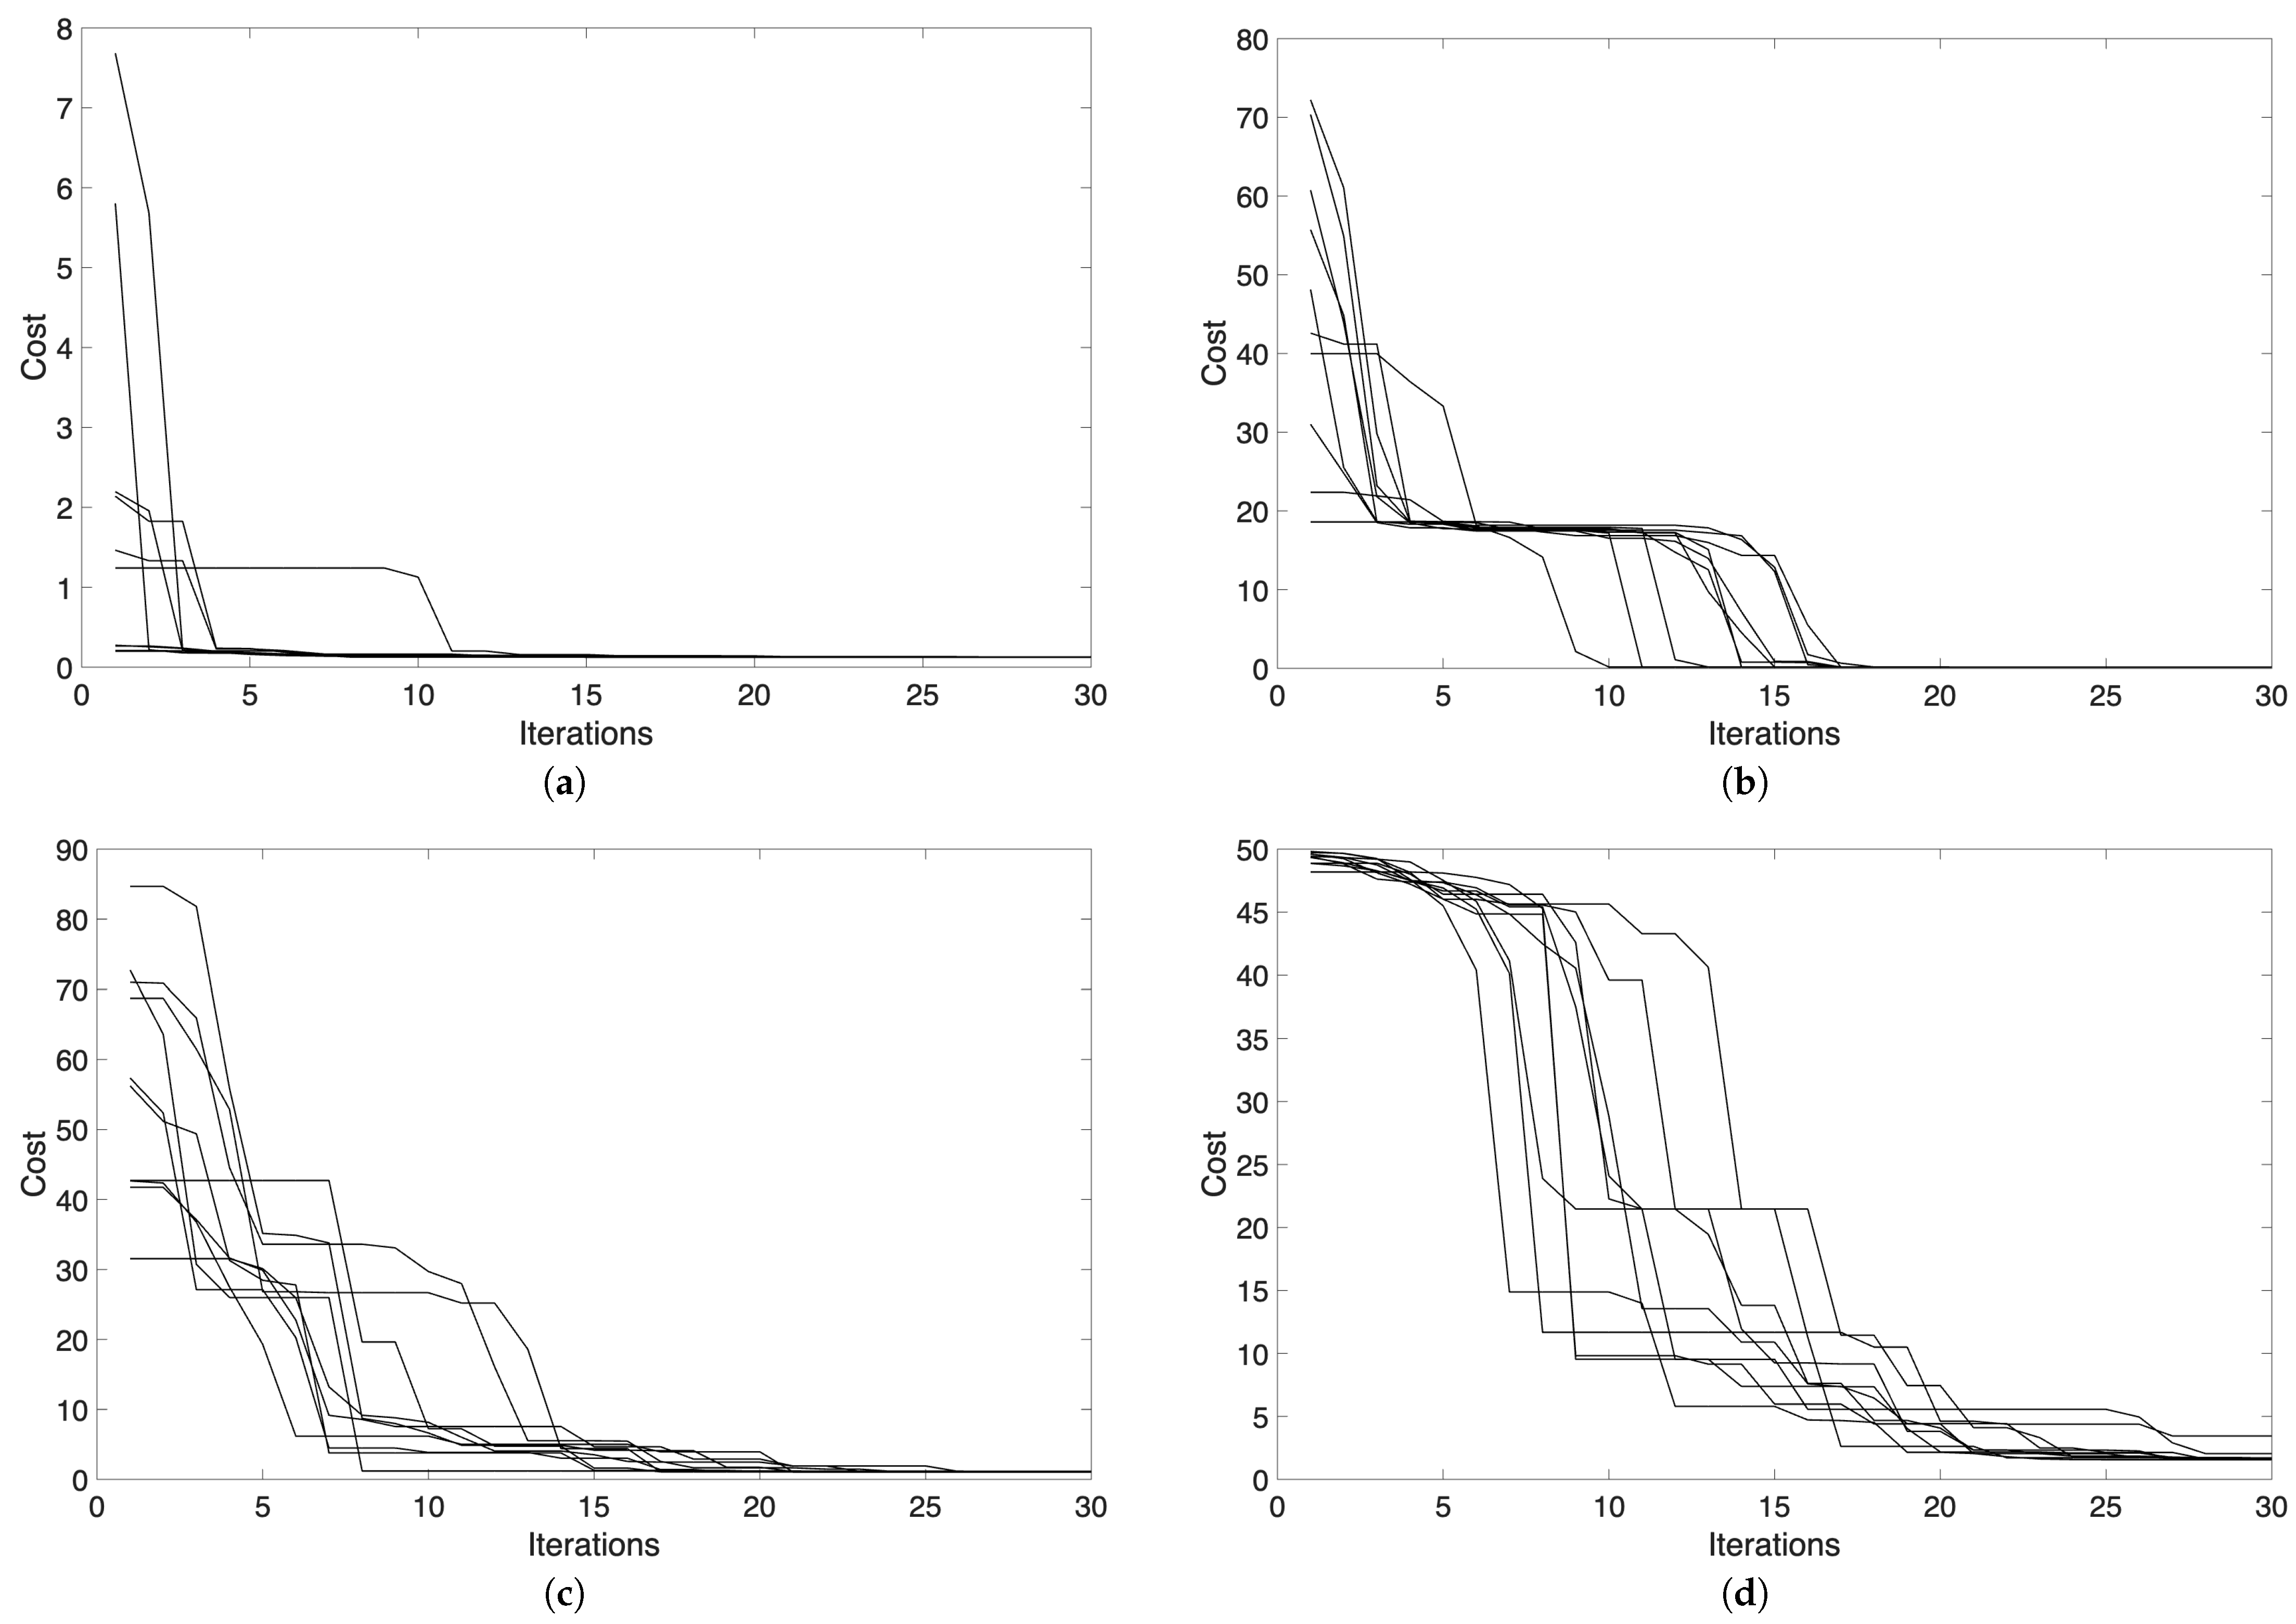
The convergence behavior of the PSO algorithm was evaluated based on the progression of the cost function over 30 iterations for each feed composition. The choice of 30 iterations is used here as a practical stopping criterion given the computational cost of repeated dynamic PSA simulations; a statistically rigorous convergence assessment for metaheuristics would require a larger ensemble of independent runs with different initializations and is therefore left for future work. As discussed in the Sensitivity and Robustness subsection, convergence depends on initialization and bounds; the trajectories shown here should be interpreted in that context. Figure 3 shows the evolution of the cost function values for all particles during the optimization process. In these runs, the global best typically stabilized before reaching the maximum number of iterations. A common pattern is observed: a steep drop in cost during the first 5–10 iterations, followed by a plateau or slower improvement phase. This reflects the typical two-phase behavior of PSO: rapid global search followed by local refinement. The spread between particles narrows over time, indicating swarm convergence.
Figure 3.
Objective value (dimensionless) versus iteration number for all particles over 30 PSO iterations. Each curve corresponds to one particle and illustrates the convergence behavior and diversity within the swarm during the optimization. Lower Cost values indicate better separation performance. Subfigures (a–d) correspond to Stage 1 through Stage 4. The curves visualize swarm-wide convergence behavior and the overall trend across iterations.
In Stage 1 (Figure 3a), initial costs were already relatively low, and convergence was rapid and uniform. Most particles reached similar cost values within ca. 8 iterations. The trajectories are smooth and monotonic, suggesting a well-defined optimum and a favorable optimization environment. The initial spread in cost was wider in Stage 2 (Figure 3b), and a plateau is visible between iterations 3 and 15. This likely reflects temporary convergence to a local minimum. However, a second sharp decrease occurs after iteration 15, with particles converging toward a better global solution. This highlights PSO’s ability to escape suboptimal regions by balancing exploration and exploitation. Stage 3 (Figure 3c) follows a similar pattern but with higher initial costs and a broader spread throughout. Convergence is more gradual, and the swarm requires nearly the full 30 iterations to stabilize. A small residual spread remains at the end, indicating greater difficulty in finding a globally consistent solution under more challenging separation conditions. The most complex convergence was experienced in Stage 4 (Figure 3d). The initial costs are the highest, and it takes 6–10 iterations before any significant improvement occurs. The swarm continues to improve beyond iteration 25, and final costs vary more widely across particles than in other stages. This is consistent with the higher methane content in the feed, indicating a more difficult separation task and reducing the likelihood of sampling a good initial guess.
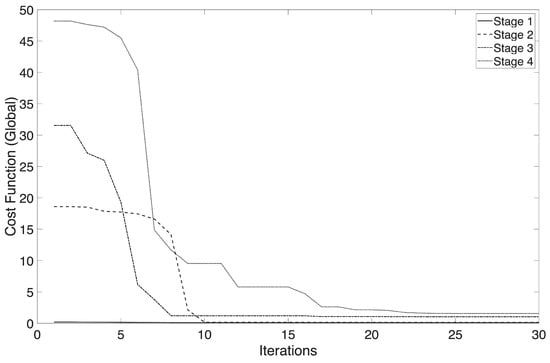
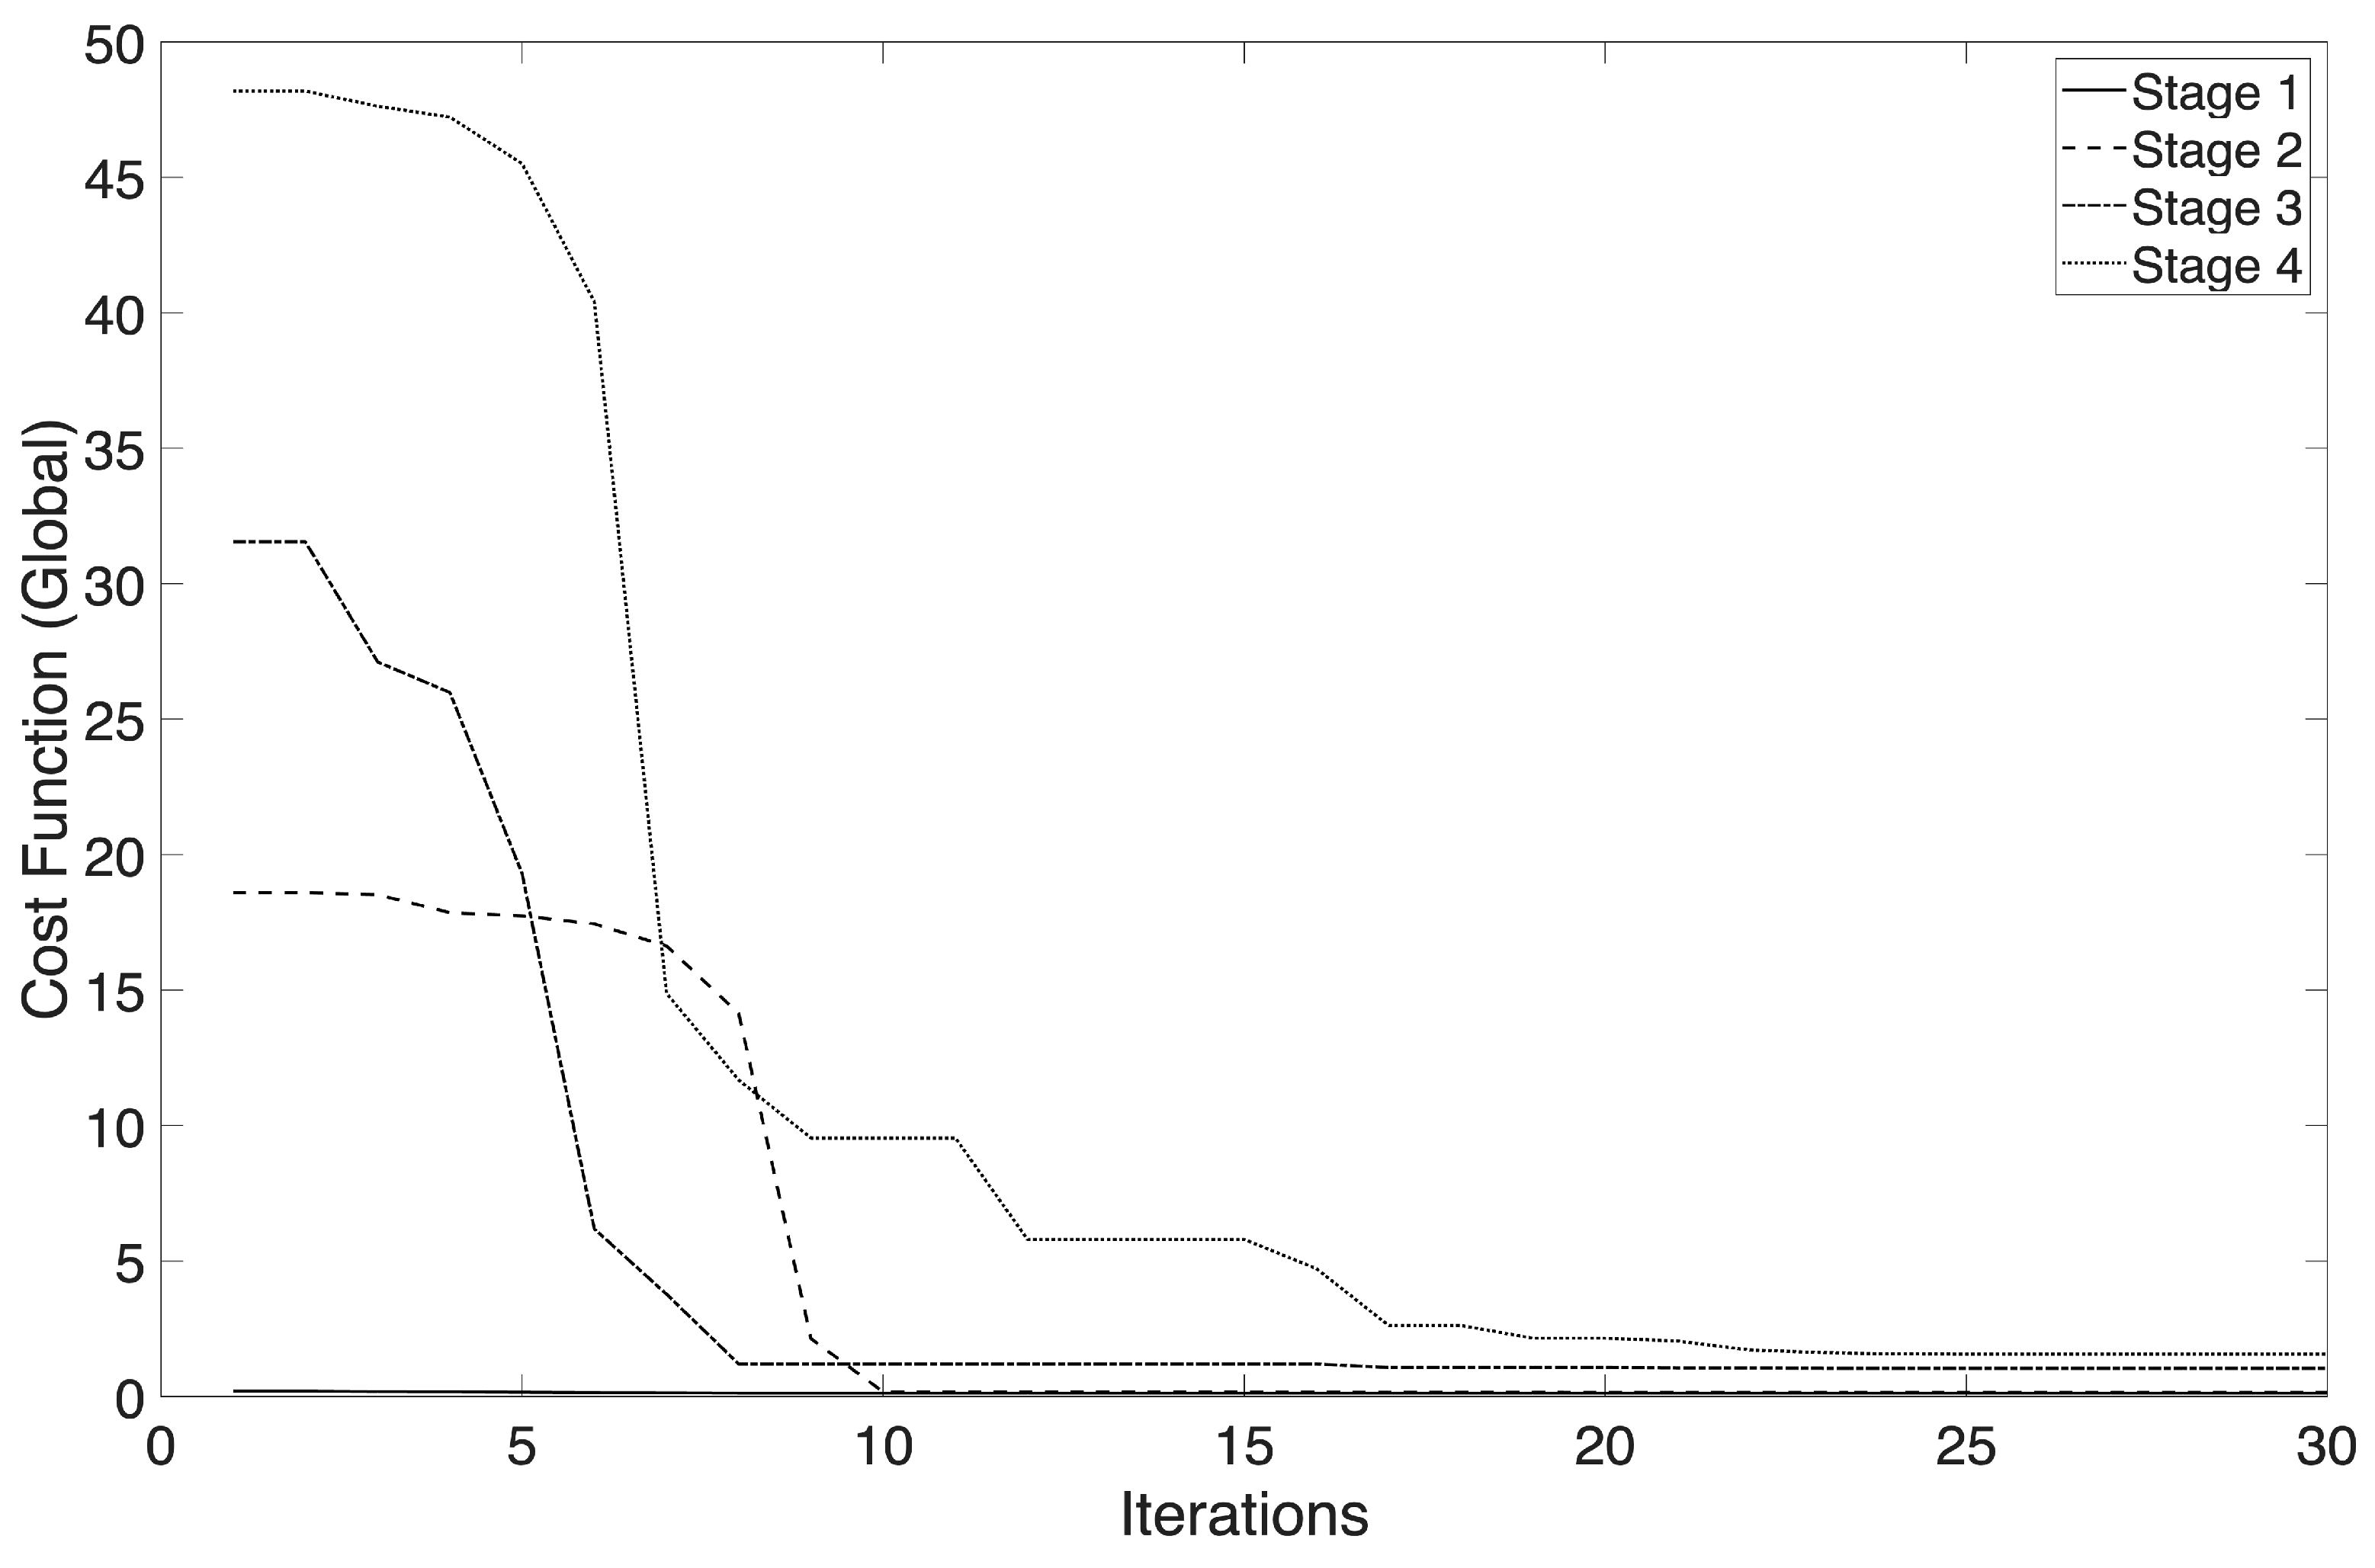
In summary, as methane content in the feed increases, the optimization landscape becomes more complex, as reflected by both the slower convergence and the higher variance in final particle performance—particularly in Stages 3 and 4. This trend is further illustrated in Figure 4, which shows the evolution of the global best cost function value over 30 iterations for each feed composition. While Stage 1 reaches a minimum cost rapidly, Stages 3 and 4 converge more slowly and plateau at higher residual cost values, highlighting the increased difficulty of optimizing PSA performance under challenging feed conditions.
Figure 4.
Global best cost function value over 30 iterations for each feed composition. The curves represent the best solution found by the swarm at each iteration, showing clear convergence trends. Rapid early improvement is followed by fine-tuning, with convergence slowing after 15–20 iterations. Stage 1 converges fastest and to the lowest cost, while Stages 3 and 4 exhibit slower convergence and higher residual cost values, reflecting increased separation difficulty at higher methane content.
3.3. Purity vs. Recovery Trade-Off
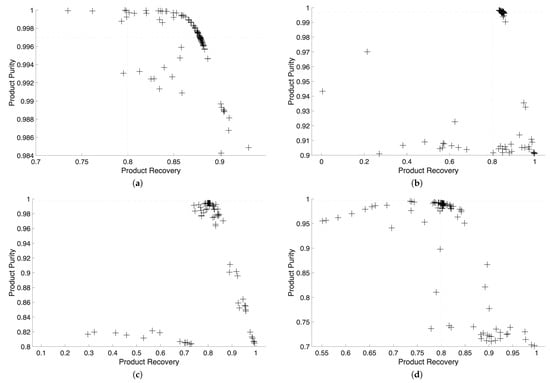
The PSA optimization results for all four feed compositions are shown in Figure 5. Each subfigure plots the achieved hydrogen purity against the corresponding recovery for all particle evaluations during the optimization. These plots illustrate the trade-offs between purity and recovery, and the spread of candidate solutions explored by the PSO algorithm.
Figure 5.
Hydrogen recovery versus hydrogen purity for all evaluated particles across four feed compositions. The x-axis shows product hydrogen recovery (%), and the y-axis shows hydrogen purity (%). Each ‘+’ marker corresponds to one PSA cycle simulation for a specific set of step times. The minimum purity specification used in this work is 99.7% (); points below this threshold are infeasible with respect to the purity constraint. Subfigures (a–d) correspond to Stage 1 through Stage 4.
In Stage 1 (Figure 5a), the feed contains 98% hydrogen and the adsorption pressure is highest. This represents a trace methane removal case under favorable conditions: low impurity and high bed capacity. As expected, the majority of points cluster tightly around 99.7% purity and 85–90% recovery. The tight clustering indicates a minimal purity-recovery trade-off, meaning that high-purity, high-recovery operation is readily achievable. Stage 2 (Figure 5b) introduces 10% methane and reduced adsorption pressure, increasing the separation challenge. Recovery values spread between 70% and 88%, but most solutions still exceed the 99.7% purity threshold. A more distinct trade-off scenario appears, as higher recovery is now achieved at a modest purity compromise. In Stage 3 (Figure 5c), the feed contains 20% methane. The optimization space becomes broader, and the trade-off more pronounced. Several solutions fall below the purity constraint at higher recovery levels, while those maintaining high purity are more conservative in terms of recovery. The points cluster around 99.5%. The separation task becomes more delicate, and the PSO algorithm compensates by navigating a wider feasible space. Stage 4 (Figure 5d) represents the most difficult case with 30% methane and the lowest adsorption pressure. All solutions fall below the 99.7% purity target, though most remain above 99%. The strongest trade-off is observed in this stage, confirming that high impurity feed conditions significantly constrain the optimization. Despite this, viable solutions are found near the acceptable purity boundary.
These results show that increasing methane content tightens the optimization space and amplifies the purity-recovery trade-off. Nonetheless, PSO identifies cycle configurations with balanced performance across all stages within the chosen decision-variable bounds. Table 5 summarizes the best solutions for each case. Stage 1 is characterized by extremely long cycle times; this outcome is a consequence of the present objective formulation, which targets purity and recovery but does not include an explicit productivity or cycle-time penalty. Under easy feed conditions, long step times are not penalized, and broad bounds were used to demonstrate the framework without imposing application-specific operational constraints. In contrast, the cycle times of Stages 2–4 are comparable. As impurity increases, the optimal cycles shift toward shorter feed steps and longer regeneration times. This behavior is consistent with both the reduced bed capacity at lower adsorption pressures and the need for more aggressive regeneration. The purge-to-feed ratios further support this trend. While Stages 1 and 2 remain well below commonly cited target ranges, Stages 3 and 4 approach higher values. These values highlight how maintaining high purity under high impurity conditions can lead to increased hydrogen loss, reinforcing the need for careful trade-off management in PSA design.
Table 5.
Best Positions for each feed composition.
3.4. Sensitivity and Robustness
During testing, it was observed that the performance of the PSO algorithm can be sensitive to the defined search-space limits and the initial guesses for the step times. Due to computational cost, this sensitivity analysis was performed for one representative and challenging case (Stage 3) to illustrate the dependence of convergence on initialization and bounds; a systematic assessment across all stages is left for future work.
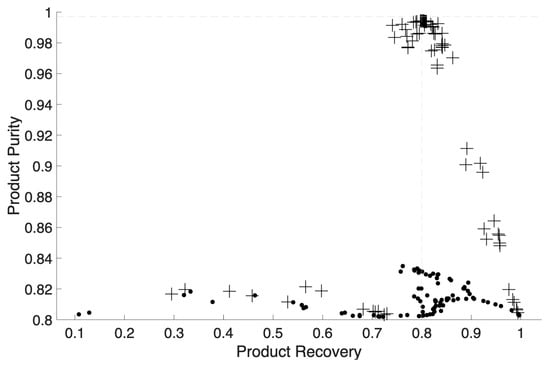
Figure 6 shows the purity and recovery outcomes from multiple optimization runs for the Stage 3 case (80% H2, 20% CH4) under different initial guesses and search-space limits. The variation in outcomes highlights the sensitivity of PSO to initialization conditions. In one run (shown with dots), the swarm did not locate the feasible high-purity region of the search space; the highest achieved purity remains around 84%, well below the target purity constraint. In contrast, other runs converged to feasible solutions and exhibit a clear purity–recovery trade-off.
Figure 6.
Results of multiple PSO optimization runs for Stage 3 (80% H2, 20% CH4) with different initial guesses and search-space limits. Points show final purity and recovery values of each particle. One run (filled dots) failed to locate feasible high-purity solutions, while other runs (‘+’ markers) produced clear purity–recovery trade-off trends.
The absence of a feasible trade-off trend in the unsuccessful run suggests premature convergence or trapping in a suboptimal region under the tested initialization. Increasing the number of iterations or swarm size may improve global exploration, but at the cost of additional computationally expensive simulations. Future work may therefore benefit from more structured initialization strategies (e.g., space-filling designs such as Latin hypercube sampling) and/or hybrid approaches that combine PSO with local refinement to improve convergence robustness, particularly for more challenging feed conditions.
4. Discussion
The results of this study show that particle swarm optimization is a viable method for tuning PSA step times under varying hydrogen–methane feed compositions. In most cases, the algorithm identified high-performing cycles with purity levels exceeding 99% and recoveries above 80%, including high impurity and low-pressure conditions where PSA performance typically declines.
When comparing our findings to previous PSA optimization studies, a key distinction lies in the variable nature of the feed conditions we considered. Most prior work, such as Taglibue et al. [27] or Saberimoghaddam and Nozari [29], focus on tuning parameters under fixed feed compositions. In contrast, we optimized for four distinct stages simulating the retrieval phase of underground hydrogen storage (UHS), where feed purity varies significantly due to cushion gas mixing. This scenario is more representative of real-world UHS applications and therefore adds practical relevance to the results.
The trade-off between purity and recovery became more pronounced as the feed methane content increased. Stages 1 and 2 showed wide operating windows and readily achievable performance targets. In contrast, Stages 3 and 4 required more delicate cycle balancing, with increased regeneration times and tighter convergence behavior. The distribution of feasible solutions in the purity–recovery plane illustrates how increasing CH4 content tightens the feasible solution space and increases the likelihood of hydrogen losses. This trend is also reflected in the purge-to-feed ratio metric: while Stage 1 remains comfortably below commonly cited target ranges, Stages 3 and 4 approach higher values, indicating the increased regeneration effort required to maintain product specifications. These observations are consistent with prior studies reporting that stronger regeneration can improve purity at the expense of recovery [29].
5. Future Work
The PSO algorithm showed fast convergence for most cases, with optimal or near-optimal solutions found within 25 iterations. However, the sensitivity analysis revealed that the algorithm’s performance is affected by the choice of initial conditions and search space limits. In one Stage 3 test run, the swarm failed to locate any feasible high-purity solution, reinforcing the need for careful setup. This limitation is typical of population-based optimizers but can be mitigated through better initialization strategies (e.g., orthogonal sampling) or hybrid methods that combine PSO with local refiners. Although such methods would increase complexity, they offer a clear pathway for improving robustness in future studies. A statistically rigorous convergence assessment would require many independent runs; this is left for future work due to computational cost.
A notable advantage of the proposed framework is that the evaluated points generated during optimization can be retained and repurposed as synthetic training data for surrogate models. This opens up future directions in building data-driven emulators (e.g., artificial neural networks or Gaussian processes) and applying real-time optimization frameworks such as model predictive control. In particular, an adaptive controller based on a physics-informed surrogate could enable adaptive tuning of PSA step times based on real-time gas composition measurements at the production wellhead—a critical capability for hydrogen recovery operations from underground storage, where transient feed behavior is unavoidable.
While the present study is limited to binary H2–CH4 mixtures (motivated by methane being the dominant native gas component in depleted natural-gas reservoirs), extension to multicomponent wellhead gas compositions is conceptually straightforward within the same workflow. Such extensions require appropriate multicomponent adsorption equilibrium and kinetic descriptions (competitive adsorption) and updated KPI/product specifications for additional impurities (e.g., CO2, N2, H2S, and H2O), but do not change the optimization procedure itself.
Author Contributions
Conceptualization, V.K.; methodology, V.K.; software, V.K.; validation, V.K.; formal analysis, V.K.; writing—original draft preparation, V.K.; writing—review and editing, V.K. and M.H.; visualization, V.K.; supervision, M.H.; project administration, M.H.; funding acquisition, M.H. All authors have read and agreed to the published version of the manuscript.
Funding
This research was funded by the Austrian Research Funding Association (FFG) within the research project “Underground Sun Storage 2030 (USS2030)” (FFG Project # 840705).
Data Availability Statement
The raw data supporting the conclusions of this article will be made available by the authors on request.
Use of Artificial Intelligence
During the preparation of this manuscript, the authors used ChatGPT-4o for the purposes of language editing and grammar. The authors have reviewed and edited the output and take full responsibility for the content of this publication.
Acknowledgments
Selected materials and equipment used in this research were kindly provided by Donau Carbon GmbH (Frankfurt am Main, Germany) and Axiom Prozesstechnik GmbH (Ebreichsdorf, Austria). The authors acknowledge TU Wien Bibliothek for financial support through its Open Access Funding Programme.
Conflicts of Interest
The authors declare no conflicts of interest.
Abbreviations
The following abbreviations are used in this manuscript:
| PSA | Pressure Swing Adsorption |
| PSO | Particle Swarm Optimization |
| UHS | Underground Hydrogen Storage |
| EOS | Equations of State |
| CIS | Continuously Stirred Tank Reactors in Series |
| CSTR | Continuously Stirred Tank Reactor |
| Purge-to-Feed ratio |
References
- Diamantakis, N.; Peecock, A.; Shahrokhi, O.; Pitcaimuthu, S. A review of analogue case studies relevant to large-scale underground hydrogen storage. Energy Rep. 2024, 11, 2374–2400. [Google Scholar] [CrossRef] [Scilit]
- Henkel, S.; Pudlo, D.; Gaupp, R. Research Sites of the H2STORE Project and the Relevance of Lithological Variations for Hydrogen Storage at Depths. Energy Procedia 2013, 40, 25–33. [Google Scholar] [CrossRef] [Scilit]
- Pudlo, D.; Ganzer, L.; Henkel, S.; Kühn, M.; Liebscher, A.; De Lucia, M.; Panfilov, M.; Pilz, P.; Reitenbach, V.; Albrecht, D.; et al. The H2STORE Project: Hydrogen Underground Storage—A Feasible Way in Storing Electrical Power in Geological Media? In Proceedings of the Clean Energy Systems in the Subsurface: Production, Storage and Conversion; Hou, M.Z., Xie, H., Were, P., Eds.; Springer: Berlin/Heidelberg, Germany, 2013; pp. 395–412. [Google Scholar] [CrossRef] [Scilit]
- Simon, J.; Ferriz, A.; Correas, L. HyUnder—Hydrogen Underground Storage at Large Scale: Case Study Spain. Energy Procedia 2015, 73, 136–144. [Google Scholar] [CrossRef] [Scilit]
- Bauer, S.; Dahmke, A.; Kolditz, O. Subsurface energy storage: Geological storage of renewable energy—capacities, induced effects and implications. Environ. Earth Sci. 2017, 76, 695. [Google Scholar] [CrossRef] [Scilit]
- Pichler, M. Underground Sun Storage Results and Outlook. In Proceedings of the EAGE/DGMK Joint Workshop on Underground Storage of Hydrogen; European Association of Geoscientists & Engineers: Houten, The Netherlands, 2019; Volume 2019, pp. 1–4. [Google Scholar] [CrossRef] [Scilit]
- Le Gallo, Y. Assessment of hydrogen storage capacity in porous media at the European scale. Int. J. Hydrogen Energy 2024, 58, 400–408. [Google Scholar] [CrossRef] [Scilit]
- Tarkowski, R.; Uliasz-Misiak, B.; Tarkowski, P. Storage of hydrogen, natural gas, and carbon dioxide—Geological and legal conditions. Int. J. Hydrogen Energy 2021, 5, 20010–20022. [Google Scholar] [CrossRef] [Scilit]
- Tarkowski, R. Underground hydrogen storage: Characteristics and prospects. Renew. Sustain. Energy Rev. 2019, 105, 86–94. [Google Scholar] [CrossRef] [Scilit]
- Zivar, D.; Kumar, S.; Foroozesh, J. Underground hydrogen storage: A comprehensive review. Int. J. Hydrogen Energy 2021, 46, 23436–23462. [Google Scholar] [CrossRef] [Scilit]
- Tartakovsky, D.; Dentz, M. Diffusion in Porous Media: Phenomena and Mechanisms. Transp. Porous Media 2019, 130, 105–127. [Google Scholar] [CrossRef] [Scilit]
- Wang, S.; Cheng, Z.; Jiang, L.; Song, Y.; Liu, Y. Quantitative study of density-driven convection mass transfer in porous media by MRI. J. Hydrol. 2021, 594, 125941. [Google Scholar] [CrossRef] [Scilit]
- Bonazzi, A.; Dentz, M.; de Barros, F. Mixing in Multidimensional Porous Media: A Numerical Study of the Effects of Source Configuration and Heterogeneity. Transp. Porous Media 2022, 146, 369–393. [Google Scholar] [CrossRef] [Scilit]
- Ghaedi, M.; Østebø Andersen, P.; Gholami, R. Mixing dynamics and recovery factor during hydrogen storage in depleted gas reservoirs. Gas Sci. Eng. 2024, 128, 205382. [Google Scholar] [CrossRef] [Scilit]
- Huang, T.; Moridis, G.J.; Blasingame, T.A.; Abdulkader, A.M.; Yan, B. Compositional reservoir simulation of underground hydrogen storage in depleted gas reservoirs. Int. J. Hydrogen Energy 2023, 48, 36035–36050. [Google Scholar] [CrossRef] [Scilit]
- Salmachi, A.; Seyfaee, A.; Robert, R.J.; Hosseini, T.; Nathan, G.; Ashman, P.; Roberts, A.; Jafarian, M.; Simon, C. Underground hydrogen storage: Integrated surface facilities and fluid flow modelling for depleted gas reservoirs. Int. J. Hydrogen Energy 2024, 50, 1055–1069. [Google Scholar] [CrossRef] [Scilit]
- Zeng, L.; Sander, R.; Chen, Y.; Xie, Q. Hydrogen Storage Performance During Underground Hydrogen Storage in Depleted Gas Reservoirs: A Review. Engineering 2024, 40, 211–225. [Google Scholar] [CrossRef] [Scilit]
- Panu, M.; Zhang, C.; El-Halwagi, M.M.; Davies, M.; Moore, M. Integration of Excess Renewable Energy with Natural Gas Infrastructure for the Production of Hydrogen and Chemicals. Process. Integr. Optim. Sustain. 2021, 5, 487–504. [Google Scholar] [CrossRef] [Scilit]
- Lu, H.T.; Li, W.; Miandoab, E.S.; Kanehashi, S.; Hu, G. The opportunity of membrane technology for hydrogen purification in the power to hydrogen (P2H) roadmap: A review. Front. Chem. Sci. Eng. 2021, 15, 464–482. [Google Scholar] [CrossRef] [Scilit]
- Król, A.; Gajec, M.; Holewa-Rataj, J.; Kukulska-Zając, E.; Rataj, M. Hydrogen Purification Technologies in the Context of Its Utilization. Energies 2024, 17, 3794. [Google Scholar] [CrossRef] [Scilit]
- Yousefi, H. Design Consideration for Developing an Underground Hydrogen Storage Facility in Porous Reservoirs. Ph.D. Thesis, University of Twente, Department of Thermal and Fluid Engineering, Enschede, The Netherlands, 2021. [Google Scholar]
- Luberti, M.; Ahn, H. Review of Polybed pressure swing adsorption for hydrogen purification. Int. J. Hydrogen Energy 2022, 47, 10911–10933. [Google Scholar] [CrossRef] [Scilit]
- Shabbani, H.J.K.; Othman, M.R.; Al-Janabi, S.; Barron, A.; Helwani, Z. H2 purification employing pressure swing adsorption process: Parametric and bibliometric review. Int. J. Hydrogen Energy 2024, 50, 674–699. [Google Scholar] [CrossRef] [Scilit]
- Liu, C.; Zhang, X.; Zhai, J.; Li, X.; Guo, X.; He, G. Research progress and prospects on hydrogen separation membranes. Clean Energy 2023, 7, 217–241. [Google Scholar] [CrossRef] [Scilit]
- Cerone, N.; Zito, G.D.; Florio, C.; Fabbiano, L.; Zimbardi, F. Recent Advancements in Pd-Based Membranes for Hydrogen Separation. Energies 2024, 17, 4095. [Google Scholar] [CrossRef] [Scilit]
- Kim, T.; Scott, J.K. Dynamic modeling and simulation of pressure swing adsorption processes using toPSAil. Comput. Chem. Eng. 2023, 176, 108309. [Google Scholar] [CrossRef] [Scilit]
- Tagliabue, M.; Delnero, G. Optimization of a hydrogen purification system. Int. J. Hydrogen Energy 2008, 33, 3496–3498. [Google Scholar] [CrossRef] [Scilit]
- Jiang, L.; Biegler, L.T.; Fox, V.G. Simulation and optimization of pressure-swing adsorption systems for air separation. AIChE J. 2003, 49, 1140–1157. [Google Scholar] [CrossRef] [Scilit]
- Saberimoghaddam, A.; Nozari, A. An experimental and statistical model of a cyclic pressure swing adsorption column for hydrogen purification. Korean J. Chem. Eng. 2017, 34, 822–828. [Google Scholar] [CrossRef] [Scilit]
- Nogueira, I.B.R.; Martins, M.A.F.; Regufe, M.J.; Rodrigues, A.E.; Loureiro, J.M.; Ribeiro, A.M. Big Data-Based Optimization of a Pressure Swing Adsorption Unit for Syngas Purification: On Mapping Uncertainties from a Metaheuristic Technique. Ind. Eng. Chem. Res. 2020, 59, 14037–14047. [Google Scholar] [CrossRef] [Scilit]
- Zhang, N.; Bénard, P.; Chahine, R.; Yang, T.; Xiao, J. Optimization of pressure swing adsorption for hydrogen purification based on Box-Behnken design method. Int. J. Hydrogen Energy 2021, 46, 5403–5417. [Google Scholar] [CrossRef] [Scilit]
- Ratnaweera, A.; Halgamuge, S.; Watson, H. Self-Organizing Hierarchical Particle Swarm Optimizer With Time-Varying Acceleration Coefficients. Evol. Comput. IEEE Trans. Evol. Comput. 2004, 8, 240–255. [Google Scholar] [CrossRef] [Scilit]
- Kalman, V.; Voigt, J.; Jordan, C.; Harasek, M. Hydrogen Purification by Pressure Swing Adsorption: High-Pressure PSA Performance in Recovery from Seasonal Storage. Sustainability 2022, 14, 14037. [Google Scholar] [CrossRef] [Scilit]
- Kalman, V.; Makaruk, A.; Engin, E.; Balla, A.; Harasek, M. Simulation of Hydrogen-Methane Separation with Pressure Swing Adsorption. In Proceedings of the 34th European Symposium on Computer Aided Process Engineering/15th International Symposium on Process Systems Engineering (ESCAPE34/PSE24), Florence, Italy, 2–6 June 2024; Manenti, F., Reklaitis, G.V., Eds.; Elsevier: Amsterdam, The Netherlands, 2024. [Google Scholar]
- Lopes, F.V.S.; Grande, C.A.; Rodrigues, A.E. Activated carbon for hydrogen purification by pressure swing adsorption: Multicomponent breakthrough curves and PSA performance. Chem. Eng. Sci. 2011, 66, 303–317. [Google Scholar] [CrossRef] [Scilit]

Disclaimer/Publisher’s Note: The statements, opinions and data contained in all publications are solely those of the individual author(s) and contributor(s) and not of MDPI and/or the editor(s). MDPI and/or the editor(s) disclaim responsibility for any injury to people or property resulting from any ideas, methods, instructions or products referred to in the content. |
© 2026 by the authors. Licensee MDPI, Basel, Switzerland. This article is an open access article distributed under the terms and conditions of the Creative Commons Attribution (CC BY) license.