


Abstract
This study evaluates the association between feedstock sulfur content and atmospheric distillation performance for 19 Ukrainian gas condensates and light crude oils processed under comparable industrial conditions in the Ukrainian Industrial Atmospheric Distillation Unit (UIADU). The feedstocks covered a total sulfur range of 7–4467 ppm. Product-specific analyses used 18 feed–light gasoline (LG) pairs, eight feed–kerosene–diesel (KD) pairs, and seven simultaneous LG–KD pairs. LG sulfur was significantly but weakly associated with feed sulfur (R2 = 0.3069, p = 0.0171). At the same time, KD sulfur showed a significantly stronger association with feed sulfur (R2 = 0.685, p = 0.011). The four-point grouped LG-yield model showed a strong descriptive association (R2 = 0.9525, p = 0.024) but was treated as exploratory because it was based on only four aggregated observations, whereas the grouped KD-yield model was not statistically significant despite a high R2 (R2 = 0.9569, p = 0.1331). In all seven complete paired observations, KD sulfur exceeded LG sulfur. The contribution of the study is the comparative, industrial-scale evaluation of sulfur partitioning and fraction-yield behavior across a compositionally heterogeneous feedstock set, rather than rediscovering preferential sulfur enrichment in higher-boiling fractions. The results support total feed sulfur as a preliminary engineering screening indicator, but not as a standalone causal predictor or a substitute for complete feedstock characterization.
1. Introduction
The processing of gas condensates and light crude oil remains a strategically important part of the oil refining industry, especially in areas with high field production variability and depleted fields due to various factors (military operations and long-term production). Atmospheric fractional distillation serves as the primary separation process for converting these raw hydrocarbon feedstocks into commercially useful light and middle distillate fractions. While classical thermodynamic principles of vapor–liquid equilibrium explain separation performance in terms of relative volatility, real industrial feeds do not behave ideally due to their complex compositions and contamination by heteroatomic species such as sulfur, nitrogen, and oxygen [1,2]. Gas condensates exhibit greater compositional variability than conventional crude oils [3], with widely varying levels of light paraffins, naphthenes, aromatics, and trace heteroatoms that depend on reservoir origins and stabilization methods [4,5,6,7]. This variability directly affects vapor–liquid equilibrium behavior, fraction yield distributions, and the quality specifications of subsequent products [4,5,8,9]. Consequently, detailed compositional profiling before industrial separation is highly recommended [5,10].
During atmospheric distillation, sulfur does not distribute evenly across the generated fractions. Low-boiling gasoline cuts tend to maintain lower levels of sulfur, whereas middle and heavy distillates preferentially accumulate larger quantities of sulfur-bearing species. Fundamental differences in boiling points, molecular polarity, and thermal stability among sulfur-containing hydrocarbons regulate this redistribution. The specific chemistry of sulfur-containing petroleum fractions has been extensively studied, particularly the speciation of thiols, sulfides, thiophenes, and benzothiophenes across various boiling ranges [3,11,12,13,14,15]. Experimental data demonstrate that lighter fractions contain fewer complex sulfur structures, while higher-boiling cuts contain larger proportions of condensed and aromatic sulfur species [13,14,15]. These studies support the established chemical basis of sulfur partitioning, but they also show that much of the available evidence is derived from molecular characterization or laboratory-scale fractionation rather than from multi-feed industrial datasets [11,12,13,14,15,16,17,18].
Although the behavior of sulfur has been extensively investigated during distillation, most prior research relies on small-scale laboratory experiments or simulation-based modeling. While laboratory fractionations confirm that sulfur partitioning follows predictable boiling-range trends, industrial operating conditions such as reflux, pressure, heat input, and feed variability can materially affect product composition and cut behavior [17,19]. Recent process-simulation and data-driven CDU studies provide increasingly powerful predictive tools, but their reliability remains dependent on representative feed characterization, appropriate variable selection, and adequate data coverage [19,20,21,22,23,24,25,26,27]. Hybrid modeling studies further show that when industrial datasets are limited, combining process knowledge with data-driven methods can improve model robustness, while the resulting relationships still require validation within their calibration domain [28].
Despite extensive molecular, laboratory, and modeling studies of petroleum fractionation and sulfur chemistry, comparative industrial evidence from multiple gas condensates and light crude oils processed in the same atmospheric-distillation unit under comparable operating conditions remains limited [4,5,11,12,13,14,15,16,17,18,19,20,21,25,26,27,28]. Consequently, an applied research gap remains concerning whether a simple feed sulfur measurement can provide useful screening information across compositionally heterogeneous industrial streams.
To address this gap, the present study compares 19 Ukrainian feedstocks, spanning a total sulfur range of 7–4467 ppm, under a common industrial atmospheric distillation configuration. The novelty lies in the cross-feed evaluation of both fraction-yield behavior and sulfur partitioning using product-specific experimental subsets, rather than in establishing the already known preferential occurrence of sulfur in higher-boiling fractions. The analysis also explicitly evaluates the statistical limitations and domain of applicability of the resulting relationships.
In this manuscript, bulk feed sulfur and feed sulfur refer to the same quantity: the total sulfur concentration measured in the initial feedstock before atmospheric distillation. This parameter is evaluated only as a preliminary engineering screening indicator. Because sulfur content may covary with density, SARA composition, aromaticity, boiling-range distribution, and heavy-end content [3,4,5,6,7,8,17], the observed relationships are interpreted as engineering associations rather than evidence that sulfur independently governs distillation performance.
2. Materials and Methods
2.1. Materials
Prior to atmospheric distillation, all investigated gas condensates and crude-derived streams underwent initial compositional characterization. The primary parameter selected for baseline comparison was total sulfur concentration, expressed in ppm. It was chosen as a key indicator due to its technological relevance for downstream fraction quality, corrosion potential, and environmental compliance during further processing.
Authors’ experimental measurements from the initial feedstock characterization prior to atmospheric distillation were used as the data source. The study investigated 19 raw feedstocks, including gas condensates (HK, transliterated Ukrainian abbreviation for gas condensate): HK Semerinkivske, HK Seleshchyna, HK Sarske field, HK Lutsenky, HK Staryi Merchyk, HK Zhuravlyna, HK Mostpanove, HK Karaykozivske, Skorobahatky, Yefremivske, Sakhalinka HK, Tymofiivka, Kolomatske, Pereshchepyne HK, Sakhalinka, and crude oils: Riznykivske oil, Oil (separate stream), Pereshchepyne oil, Dolyna oil.
The sulfur content of the investigated feedstocks demonstrates significant variability, ranging from ultra-low values below 10 ppm (e.g., Skorobahatky) to highly sulfur-rich crude-derived streams exceeding 4000 ppm (Dolyna oil). Such heterogeneity in initial sulfur concentration directly influences fraction behavior during atmospheric distillation and necessitates separate evaluation of distillation products.
2.2. Industrial Distillation Unit Description
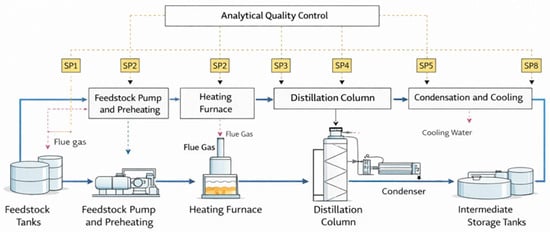
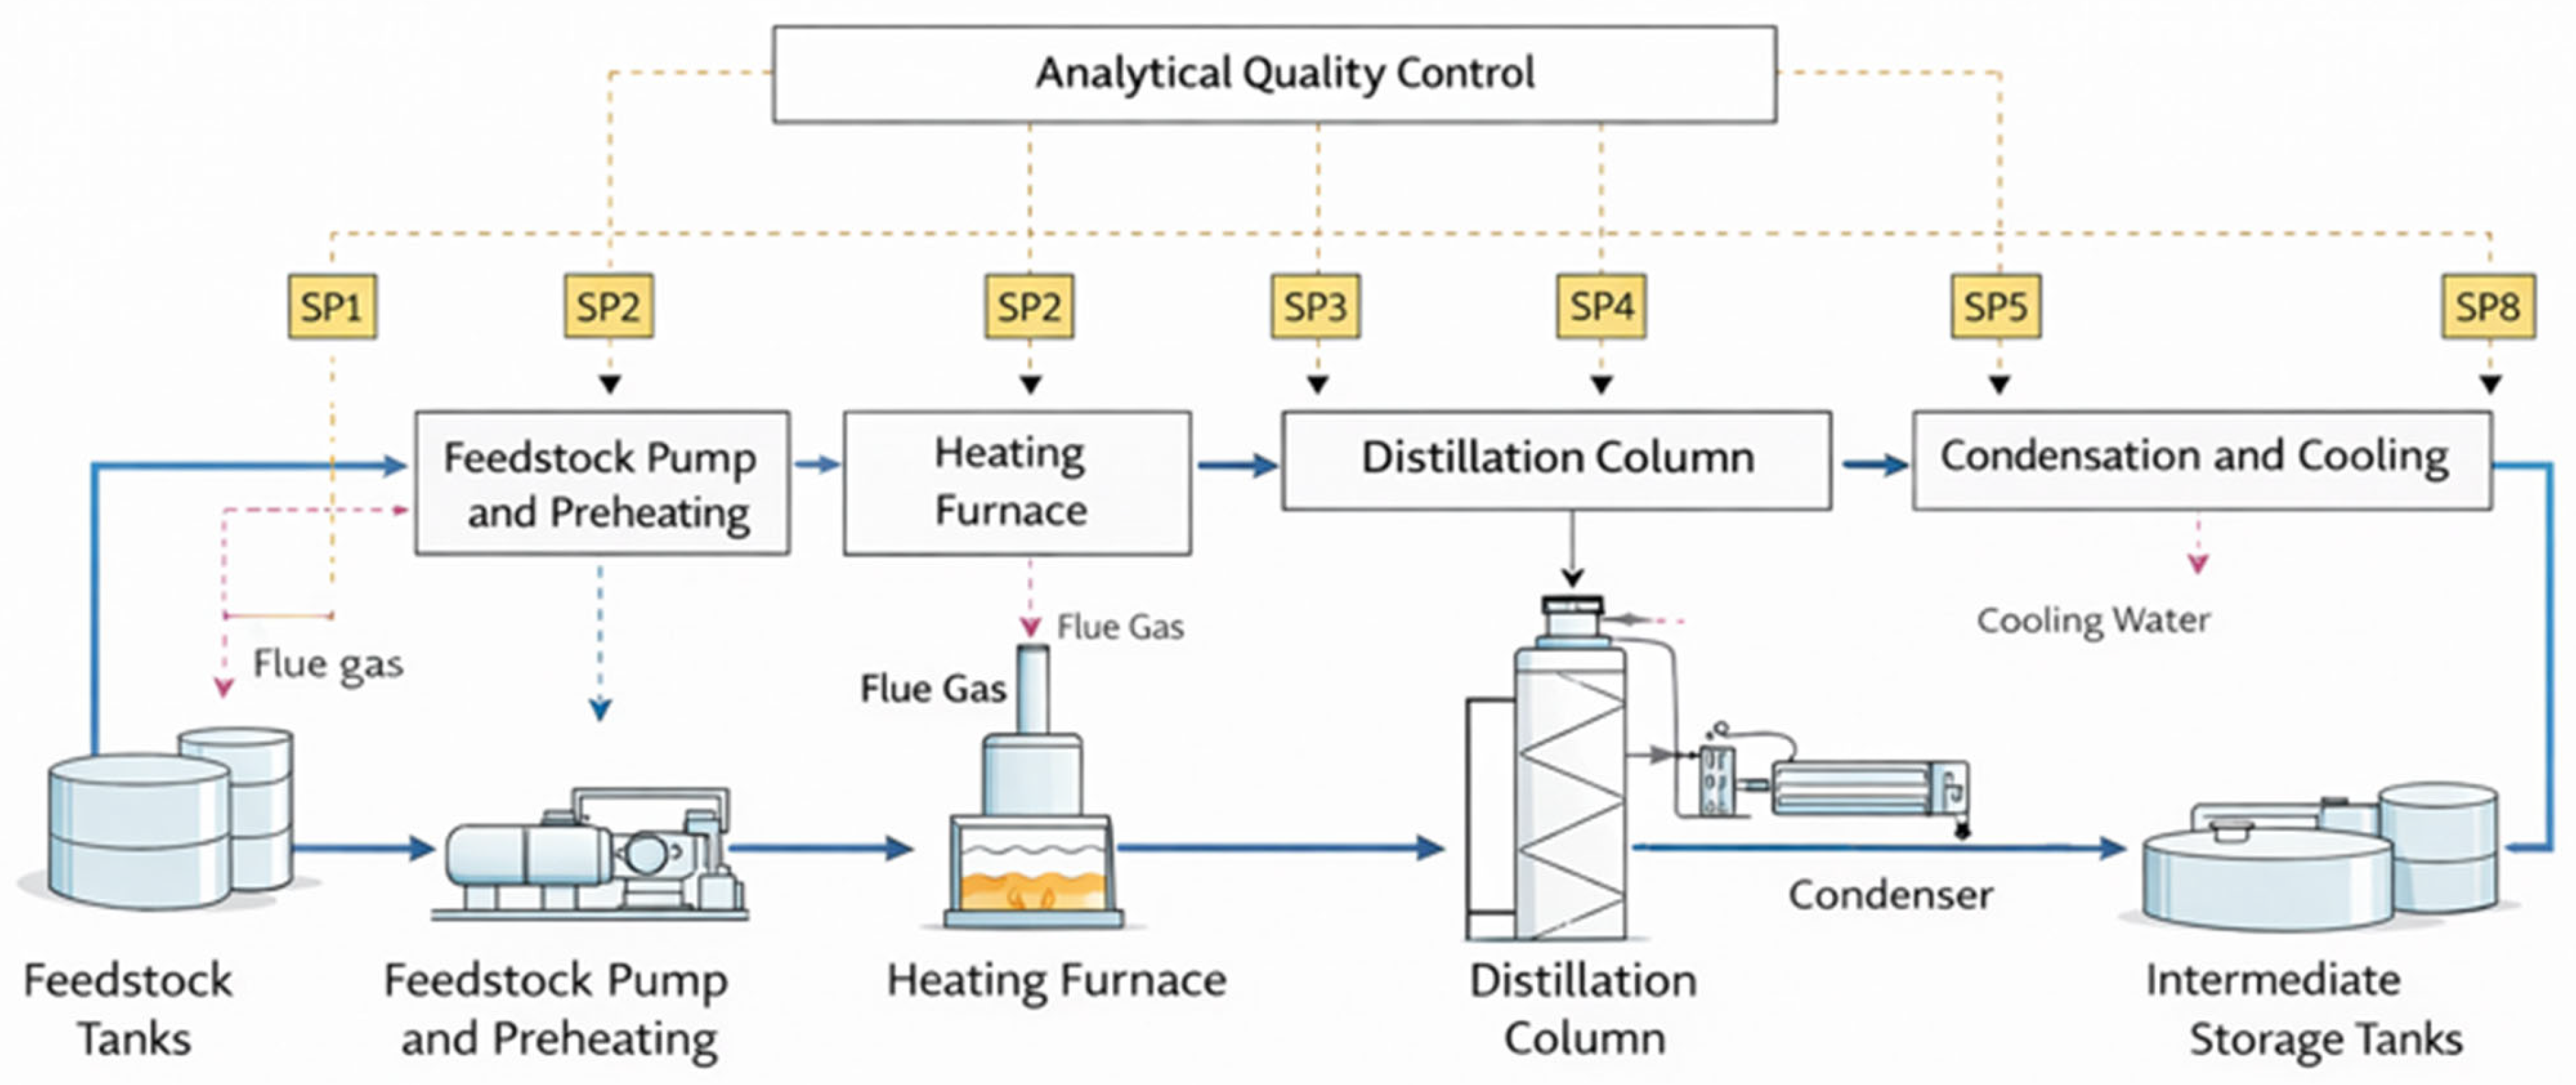
All experiments were conducted at the UIADU (see Figure 1 for the process flow diagram), designed for the continuous processing of gas condensates and light crude oils. Atmospheric distillation experiments were performed using the UIADU (Ukrainian Industrial Atmospheric Distillation Unit, nominal capacity 30 t h−1), a continuous industrial-scale atmospheric distillation system designed for the primary separation of gas condensates and light crude oils into light gasoline (LG), kerosene–diesel (KD), and atmospheric residue fractions. The unit operates under steady-state refinery conditions with controlled feed rate, temperature profile, and operating pressure, thereby providing reproducible industrial processing conditions for comparative evaluation of different feedstocks.
Figure 1.
Process flow diagram of the UIADU.
The unit operates as a continuous separation system that fractionates a multicomponent hydrocarbon feedstock into cuts with defined boiling ranges while maintaining stable hydraulic and thermal conditions.
The feedstock is fed from the storage tanks to a pumping system, where a controlled flow rate is set to ensure steady-state operation. The stream then passes through a preheating section that utilizes heat recovery from the process streams, improving overall thermal efficiency and reducing furnace load [29]. The preheated hydrocarbons are then directed to a reheating furnace where the temperature is raised to promote partial vaporization before entering the distillation column. The vapors (column overhead) are condensed to produce a light gasoline fraction (LG, <125 °C). The heavier components are withdrawn from the column as a side branch (kerosene–diesel fraction, KD, 125–360 °C). The residue was removed from the bottom (if available) (fr. > 360 °C).
For the present study, analytical sampling was performed at the feedstock pump discharge (SP1), the KD side draw from the distillation column (SP4), the LG overhead condenser outlet (SP5), and the atmospheric residue outlet at the column bottom. The described configuration supports reliable fractionation under industrial conditions and provides the process stability necessary to evaluate the impact of feed sulfur variability on separation performance.
The use of industrial-scale equipment significantly increases the practical relevance of the results, since the observed sulfur distribution and fraction yields reflect real processing conditions typical of modern gas condensate and/or light oil separation plants, rather than simplified laboratory conditions.
Stable operating parameters are essential for maintaining stable distillation performance and ensuring reproducibility of analytical results; industrial CDU studies likewise show that temperature and pressure disturbances can measurably affect unit behavior [19]. Table 1 presents the primary operating parameters of the distillation process.
Table 1.
Operating parameters of the UIADU.
Maintaining the feed temperature within the range of 90–120 °C before furnace entry promotes efficient heat transfer and reduces viscosity, thereby improving hydraulic behavior throughout the system.
An outlet temperature of 320–360 °C from the furnace ensures the virtually complete vaporization of distillate fractions at the column’s operating pressure. In light crude oil and gas condensate, fractions boiling above 360 °C are essentially absent (for some types of feedstock, no bottom residue is formed); therefore, incomplete vaporization of the feed at the furnace outlet does not significantly affect the yield of fractions or the distribution of sulfur. This temperature range is critical for establishing the vapor–liquid equilibrium required for efficient fractionation, without triggering undesirable cracking reactions that could alter the product composition.
2.3. Methods
2.3.1. Sampling and Sample Preparation
Feedstock and product samples were collected at fixed sampling points of the UIADU: the feedstock at the feedstock pump discharge (SP1), the kerosene–diesel fraction (KD) at the side draw from the distillation column (SP4), the light gasoline fraction (LG) at the overhead condenser outlet (SP5), and atmospheric residue at the column bottom. A 500 mL sample was collected for each feedstock or product fraction in an amber glass bottle fitted with a PTFE-lined cap. Samples were stored in the dark at +4 °C under a nitrogen atmosphere. The LG samples were analyzed within 24 h after collection, whereas the feedstock and KD samples were analyzed within 72 h. Before analysis, feedstock samples were heated to 40 °C when required and manually shaken for 2 min to ensure homogenization. Product fractions were equilibrated to 20 °C and homogenized by 20 consecutive inversions of the sealed bottle.
2.3.2. Analytical Methods
Total sulfur content was determined by energy-dispersive X-ray fluorescence spectroscopy using a Rigaku NEX CG spectrometer (Applied Rigaku Technologies, Austin, TX, USA) in accordance with ASTM D4294 [30]. Approximately 10 mL of sample was transferred to an XRF sample cup fitted with Mylar film. The instrument was calibrated over a sulfur concentration range of 0–5000 ppm using matrix-matched certified reference standards. The instrument-specific limit of detection was 0.5 ppm S (3σ), and the limit of quantification was 2.0 ppm S; the low-concentration performance was verified using matrix-matched standards. Each sample was analyzed in duplicate, and the arithmetic mean was reported. The relative deviation between duplicate measurements was below 3% for sulfur concentrations above 20 ppm and below 8% for concentrations below 20 ppm. The expanded measurement uncertainty was U = 5% (k = 2) for sulfur concentrations above 20 ppm and U = 12% (k = 2) for sulfur concentrations below 20 ppm.
Benzene and aromatic hydrocarbons were quantified using an Agilent 7890B gas chromatograph (Agilent Technologies, Santa Clara, CA, USA) equipped with a flame ionization detector (FID). An Agilent J&W DB-1 capillary column (60 m × 0.25 mm × 0.25 µm; Agilent Technologies, Santa Clara, CA, USA) was used for benzene and aromatic hydrocarbon determination. The benzene/aromatics assay used an in-house-validated capillary GC–FID method on the Agilent 7890B with a DB-1 column; ASTM D3606 [31] and ASTM D5580 [32] were not used for this assay. The DB-1 column was installed in the GC oven and followed the oven temperature program (no independent column-temperature setpoint): 50 °C for 3 min, followed by heating at 5 °C min−1 to 125 °C and then at 45 °C min−1 to 240 °C, with a final hold at 240 °C for 5 min. The injector temperature was 250 °C, and the flame ionization detector temperature was 300 °C. Helium served as the carrier gas at a constant flow of 1.0 mL min−1. Samples (1.0 µL) were injected in split mode (50:1). An extended validated calibration range of 0.10–10.0 vol.% for benzene and 0.50–30.0 vol.% for total aromatic hydrocarbons was used; samples were analyzed without dilution. The measured benzene concentration of 7.32 vol.% fell within the validated calibration range. The DB-1 temperature program was used only for the benzene/aromatics analysis; the Petrocol DH column was operated separately for PIONA characterization according to ASTM D6730 [33]. Detailed PIONA characterization was performed by multidimensional gas chromatography using a Petrocol DH column (100 m × 0.25 mm × 0.5 µm; Supelco, Bellefonte, PA, USA). The GC injection volume was 1 µL. Calibration was performed using certified reference mixtures for PIONA components, benzene, and aromatic hydrocarbons. Each determination was performed in duplicate, and the arithmetic mean was reported. An RSD below 3% characterized the repeatability of the GC measurements, while the expanded measurement uncertainty was U = 4% (k = 2).
Antiknock performance of the LG fraction was evaluated by determination of the Research Octane Number (RON) and Motor Octane Number (MON) in accordance with ASTM D2699 [34] and ASTM D2700 [35], respectively. These parameters provide a direct indication of the combustion quality of the light gasoline fraction and are essential for assessing its suitability as a motor fuel blending component.
The density of the LG fraction at +15 °C was measured using digital oscillating U-tube densitometry in accordance with ASTM D4052 [36]. Reid Vapor Pressure (RVP) was determined in accordance with ASTM D323 [37], providing information on the volatility characteristics and handling safety of the resulting gasoline fraction. Detailed hydrocarbon group composition of the LG fraction, including paraffins, isoparaffins, olefins, naphthenes, and aromatics (PIONA), was determined by multidimensional gas chromatography in accordance with ASTM D6730. Individual light hydrocarbons were quantified as volume percentages; C3 denotes propane, whereas C4 represents the sum of i-butane and n-butane. To verify analytical consistency, each sample was analyzed in duplicate, and the arithmetic mean was reported. Total aromatics comprised benzene, toluene, ethylbenzene, m-/p-xylene, o-xylene, and C9+ aromatic hydrocarbons. Benzene was additionally reported separately because of its specific relevance to gasoline quality assessment.
The present study quantified total sulfur concentration by X-ray fluorescence spectroscopy only. Individual sulfur species were not identified; therefore, the discussion of thiophenes, benzothiophenes, and related organosulfur compounds is based on previously published petroleum chemistry studies rather than on direct molecular characterization of the investigated samples.
2.3.3. Engineering Calculations
In this study, distillation performance was evaluated using fraction yield and sulfur partitioning rather than thermodynamic or tray efficiency.
Engineering calculations were applied to quantify distillation performance and evaluate sulfur redistribution across fractions. The primary indicator of separation behavior, the yield of each distillation fraction, is calculated according to Equation (1):
where Yi is the yield of the fraction i, wt%; mi is the mass of a fraction i, kg; mf is the mass of feedstock, kg. This parameter allows comparison of product recovery across feedstocks with differing sulfur levels.
To evaluate sulfur partitioning during distillation, a distribution coefficient was introduced according to Equation (2):
where KS is the sulfur distribution coefficient; Sfraction sulfur concentration in the fraction; Sfeed is sulfur concentration in the feedstock.
A complete sulfur mass balance was not calculated because sulfur concentration and yield data were not available for all outlet streams in every processing campaign; therefore, the reported analysis was limited to experimentally measured feed–LG and feed–KD relationships. Full D86/D2887 distillation curves and feed API gravity were not available for all industrial campaigns and were therefore not used as comparative performance metrics.
2.4. Statistical Analysis
Statistical analysis was performed separately for the available datasets. The relationship between the feed sulfur group and LG recovery was evaluated using ordinary least-squares regression applied to the four group-level observations. The sulfur-content groups (<50, 50–200, 200–700, and >700 ppm) were defined from natural gaps in the observed feed sulfur distribution, occurring at approximately 37–55, 184–240, and 500–740 ppm. Such grouping also ensures that each group contains at least three feedstocks. For each group, the geometric mean feed sulfur concentration and the arithmetic mean of the available individual LG yields were calculated. Missing values were not imputed, replaced by group averages, or treated as zero. Each statistical model included only observations containing all variables required for the corresponding analysis.
Individual feed-to-LG and feed-to-KD sulfur relationships were evaluated by ordinary least-squares regression. Because feed sulfur covered almost three orders of magnitude, the LG sulfur partition index was additionally regressed against logarithmically transformed feed sulfur:
where PLG is the concentration-based LG sulfur partition index; CS,LG is the sulfur concentration in the LG fraction, ppm; and CS,feed is the sulfur concentration in the initial feedstock, ppm.
For the individual sulfur regressions, fitted equations, coefficients of determination (R2), and two-sided p-values were reported. Statistical significance was assessed at α = 0.05. Because the primary LG-yield model used four aggregated sulfur-group observations, it was interpreted as a group-level association. In contrast, regressions involving sulfur concentrations were performed using individual experimentally measured observations.
Spearman rank correlation was applied exploratorily to the six LG samples with complete sulfur and hydrocarbon-composition data to assess monotonic associations between LG sulfur content and each hydrocarbon component.
3. Results
3.1. Fractional Composition and Distillation Characteristics of the Feedstocks
Atmospheric distillation was performed on 19 gas condensates and light crude oils; however, product sulfur coverage varied across the processing campaigns. Feed sulfur was measured for all 19 feedstocks, feed–LG sulfur pairs were available for 18 feedstocks, and feed–KD sulfur pairs for eight feedstocks. Seven feedstocks contained simultaneous LG and KD sulfur measurements. Accordingly, the feedstock inventory and the two product-specific datasets were analyzed separately, and no KD-related conclusion was extended to samples without an experimental KD sulfur result. Product-specific sulfur analyses were performed using separate complete experimental subsets. Table 2 subsection (a) presents the 18 feedstocks with available feed and LG sulfur measurements, whereas Table 2 subsection (b) presents the eight feedstocks with available feed and KD sulfur measurements.
Table 2.
Experimentally measured feed-to-product sulfur datasets used in the analysis. (a) Feed–LG sulfur dataset. (b) Feed–KD sulfur dataset.
Because complete outlet-yield data, including atmospheric residue, were not available for all processing campaigns, the LG and KD yields reported in Table 2a,b do not constitute a closed material balance and should not be summed to infer total liquid recovery. For Skorobahatky and Tymofiivka, the average LG sulfur concentration exceeded the corresponding average feed value (18.4 vs. 7.0 ppm and 24.1 vs. 14.9 ppm, respectively). These low-concentration results should be interpreted cautiously because analytical uncertainty increases below 20 ppm, and the reported feed and product values represent campaign averages rather than strictly time-synchronized samples; therefore, these cases were not interpreted as evidence of a general LG sulfur-enrichment trend.
Seven feedstocks had simultaneous sulfur measurements in both product fractions. In every paired observation, KD sulfur was higher than LG sulfur: 20 versus 11.4 ppm for HK Semerinkivske, 111 versus 3.8 ppm for HK Sarske field, 33.7 versus 3.5 ppm for HK Lutsenky, 850 versus 8.0 ppm for Riznykivske oil, 110 versus 12.0 ppm for HK Zhuravlyna, 91 versus 28.0 ppm for HK Mostpanove, and 205 versus 38.8 ppm for HK Seleshchyna. Thus, higher sulfur concentration in KD was consistently observed across the complete paired subset, whereas no corresponding conclusion could be drawn for feedstocks without simultaneous product measurements.
To quantitatively evaluate separation performance under industrial conditions, fraction yields were calculated using Equation (1). The yield of each fraction was determined as the ratio of the obtained fraction to the total processed feed mass.
Table 3 summarizes the average yields of the light gasoline fraction (LG, <125 °C) and the kerosene–diesel fraction (KD, 125–360 °C) for representative feedstocks covering the entire sulfur concentration range.
Table 3.
Fraction yields during atmospheric distillation of investigated feedstocks.
The data analysis indicates a clear shift in fraction distribution with increasing feedstock sulfur content. Low-sulfur gas condensates (<50 ppm) exhibit higher recovery of the light gasoline fraction (up to 67.25 wt%), reflecting a higher proportion of low-boiling hydrocarbons in the feed.
Across the grouped data, mean LG yield decreased with increasing feed sulfur class. KD yield was available only for the first three sulfur classes; therefore, no KD-yield conclusion was drawn for the >700 ppm group.
This trend suggests that sulfur-rich feedstocks contain a higher proportion of heavier hydrocarbons and sulfur-bearing compounds with elevated boiling points, which preferentially remain in middle and heavy fractions during atmospheric distillation [13,15]. The observed redistribution is consistent with thermodynamic expectations, as organosulfur compounds (thiophenes, sulfides, and polyaromatic sulfur species) exhibit greater molecular stability and higher boiling points than paraffinic components.
The 50–200 ppm sulfur group exhibited substantial within-group variability in LG yield (5.0–91.0 wt%), indicating that sulfur content alone does not explain individual yield differences; the grouped values were therefore interpreted only as exploratory descriptive summaries.
3.2. Statistical Relationships Between Feed Sulfur and Distillation Responses
Statistical analysis was applied to distinguish the group-level association with LG yield from the individual feed-to-product sulfur relationships. The fitted models, coefficients of determination, and significance levels are summarized in Table 4.
Table 4.
Statistical relationships between feed sulfur concentration and distillation responses.
The grouped LG-yield model showed a strong descriptive association between the group geometric mean of feed sulfur and average LG yield (R2 = 0.9525, p = 0.024). The grouped KD-yield model also showed a high R2 (0.9569) but was not statistically significant (p = 0.1331) because only three group-level observations were available. Because the LG model was based on only four aggregated observations, it was interpreted as an exploratory group-level association rather than as an independently validated predictive model. The grouped LG-yield equation is applicable only within the range represented by the four group geometric means (14.2–1346 ppm) and should not be extrapolated to individual high-sulfur feedstocks. No hold-out validation was performed because only four group-level observations were available. The individual KD-yield regression was not statistically significant with p = 0.0852.
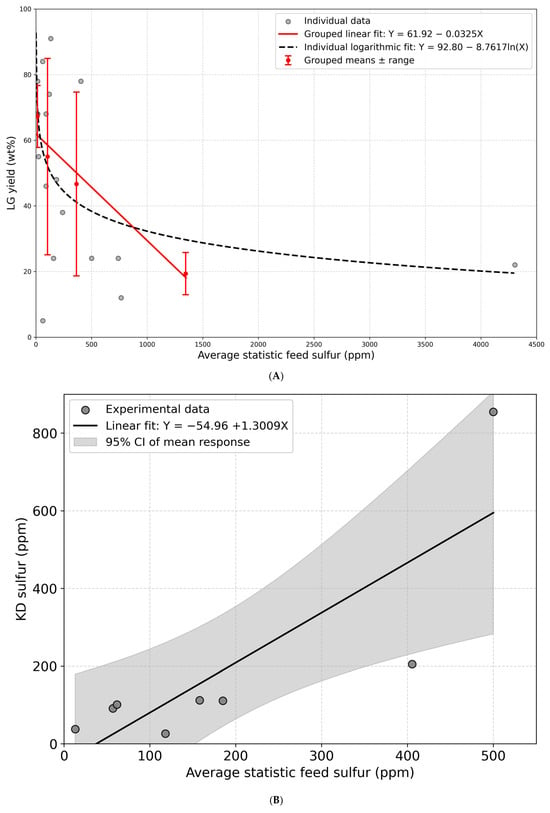
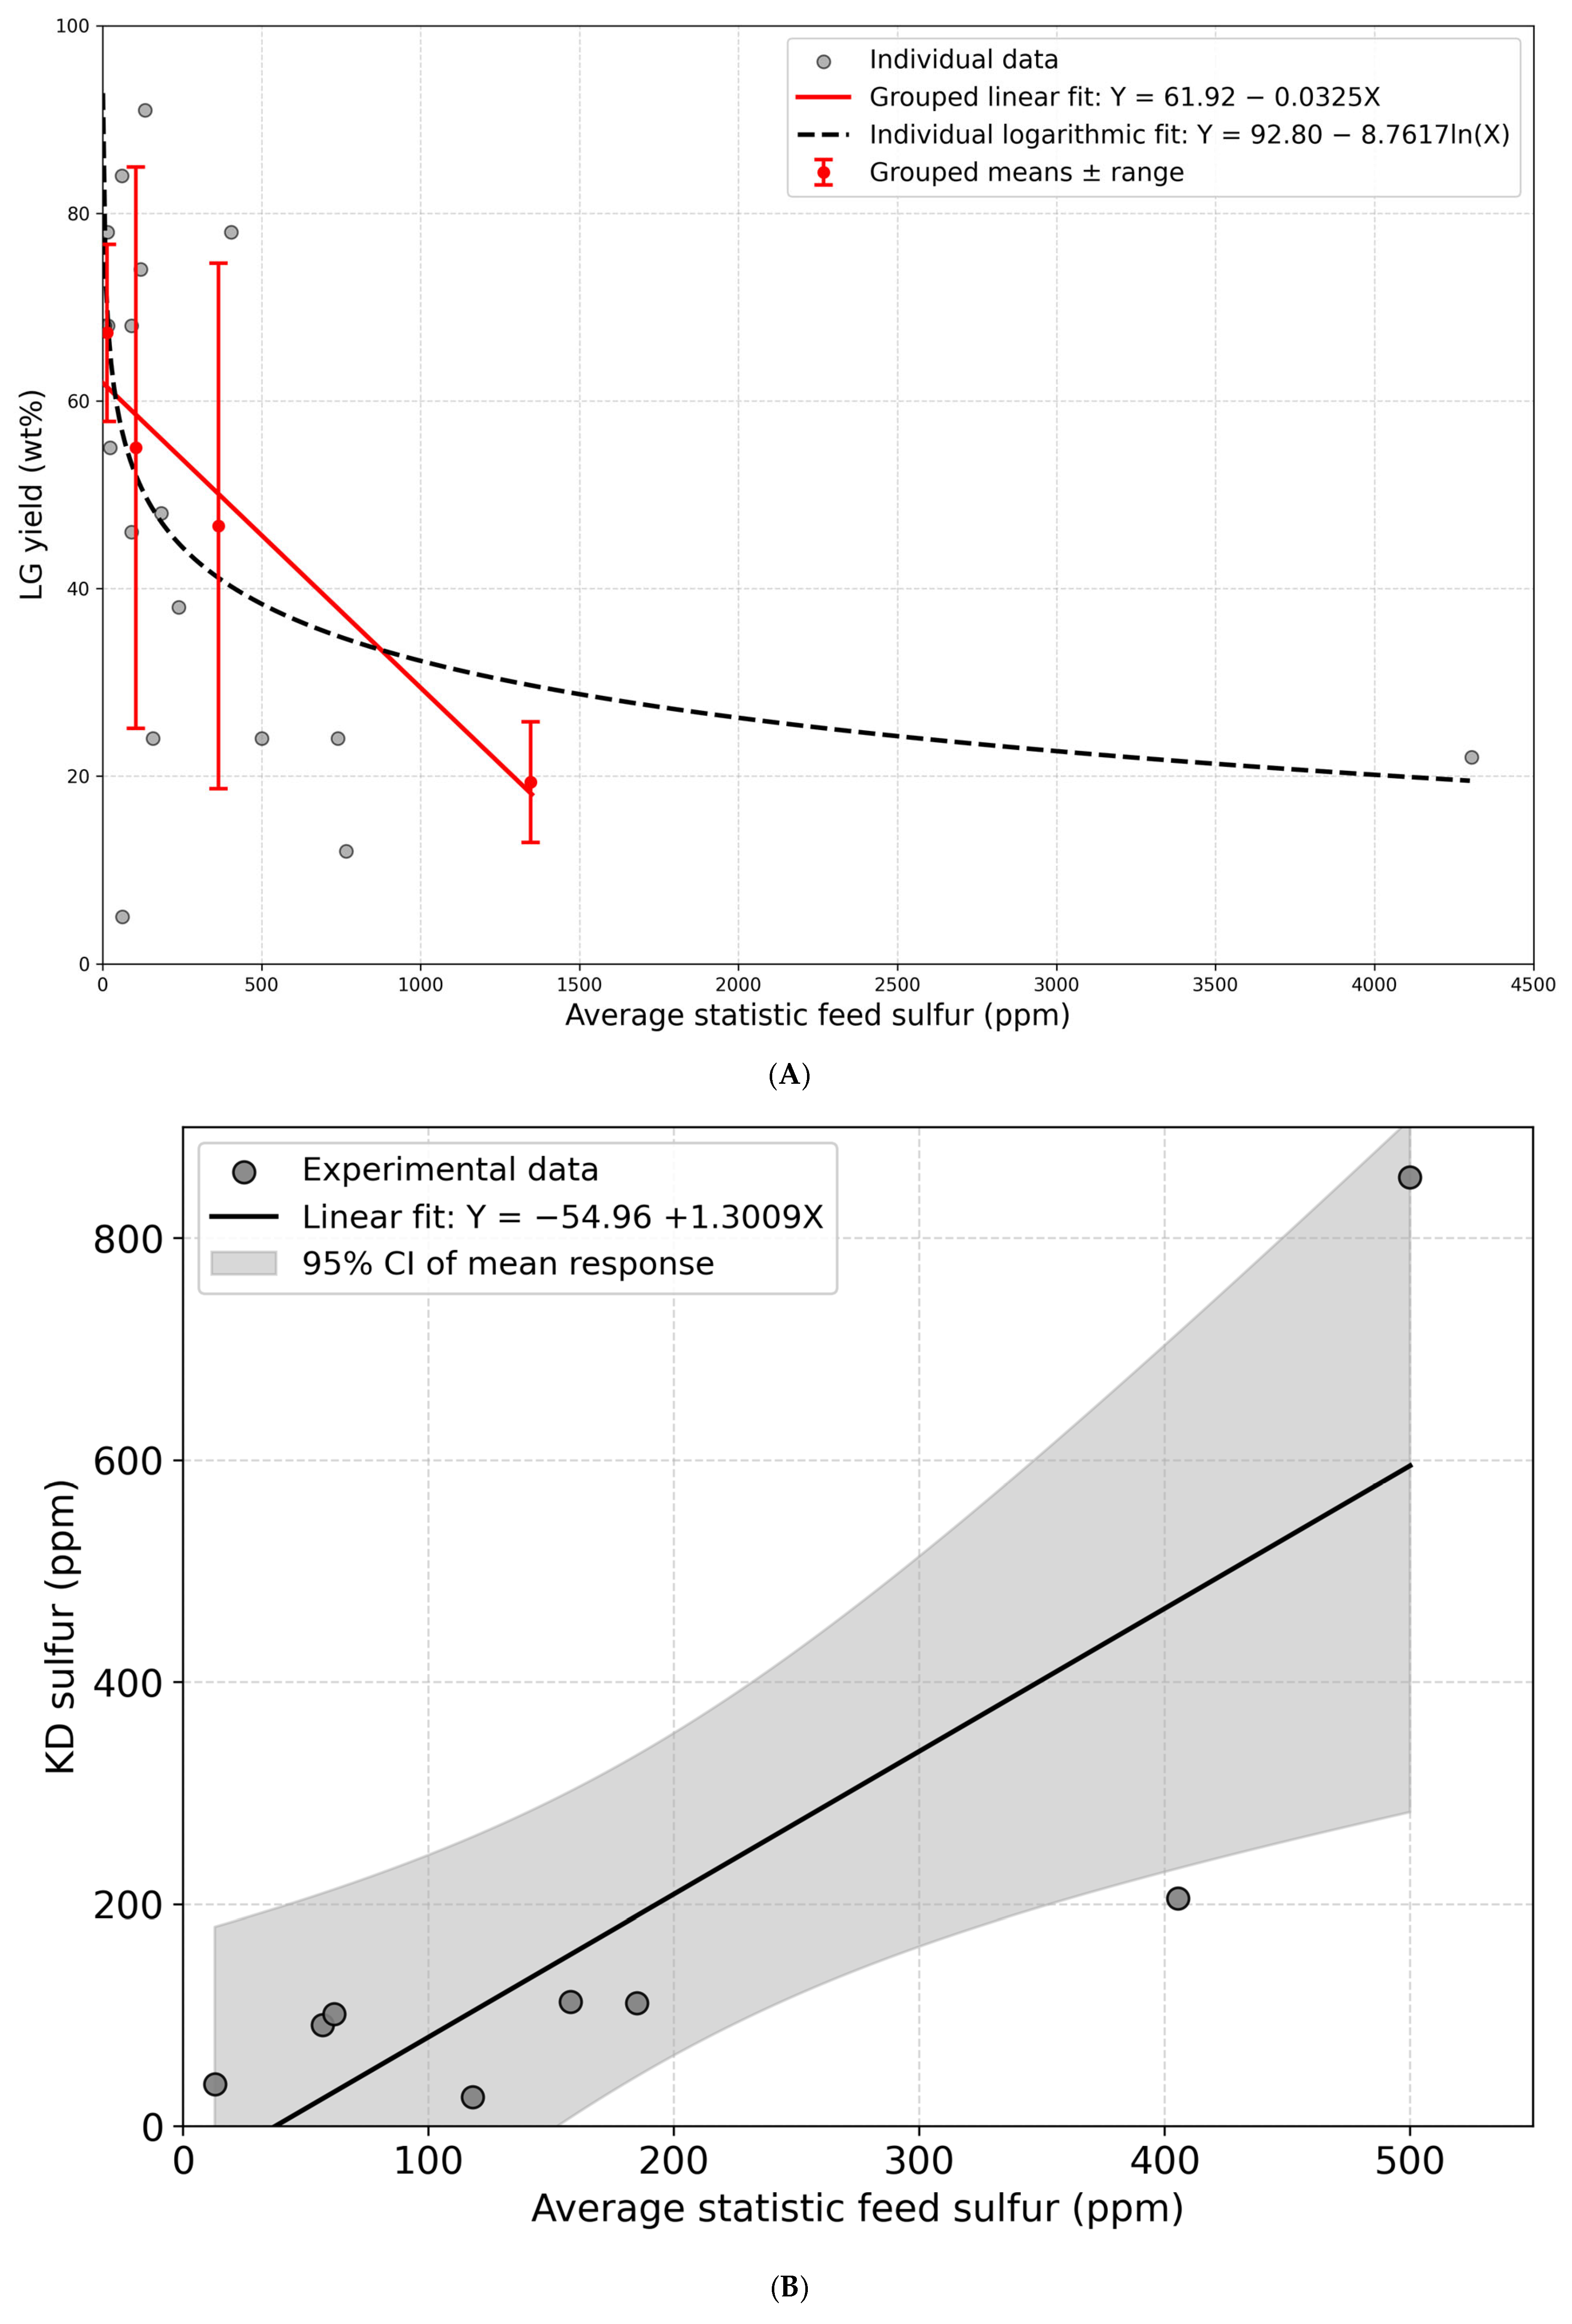
Figure 2A presents the relationship between LG yield and feed sulfur content using both individual observations and grouped sulfur classes. The grey points represent the raw individual data, while the red markers show the grouped mean LG yields with range bars reflecting the within-group variability. The solid red line corresponds to the grouped linear regression YLG = 61.92 − 0.0325 CS,g, whereas the dashed black curve shows the logarithmic fit for the individual observations YLG = 92.8 − 8.7617ln(CS,feed). The grouped representation provides a clearer descriptive trend than the individual-point regression; however, because only four group-level observations were available, it should not be interpreted as an independently validated forecasting model.
Figure 2.
(A). Statistical relationship between LG yield and feed sulfur content, showing individual data, grouped mean values with range bars, the grouped linear regression, and the individual logarithmic regression. (B). Statistical relationship between KD sulfur content and feed sulfur content, showing experimental data, the linear regression model, and the 95% confidence interval of the mean response.
Conversely, predicting the direct sulfur content in the resulting fractions from the raw individual data yielded mixed results. The linear regression between LG sulfur and feed sulfur was statistically significant (R2 = 0.3069, p = 0.0171), although its predictive power was low. The KD sulfur model showed a moderate fit and was statistically significant (R2 = 0.685, p = 0.011). However, its predictive use is limited by the small sample size and influential observations.
Figure 2B illustrates the linear relationship between KD sulfur content and feed sulfur content for the eight available feed–KD observations. The grey points represent the experimental measurements, the solid black line corresponds to the fitted regression model CS,KD= −54.96 + 1.3009 CS,feed, and the shaded region indicates the 95% confidence interval of the mean response. The figure visualizes the statistically significant positive association between feed sulfur and KD sulfur, while also showing the broad uncertainty range and the limited applicability of the model at very low feed sulfur concentrations.
For the KD sulfur regression, the slope was 1.3009 (95% CI: 0.4213–2.1805). Accordingly, the linear KD sulfur model should be treated as an empirical screening relationship rather than as a general predictive equation. Although the model was fitted over the observed feed sulfur range of 16.9–500 ppm, its negative intercept produces physically invalid predictions below approximately 42.3 ppm; practical use should therefore be restricted to interpolation above this threshold within the observed range. A sensitivity analysis excluding Riznykivske reduced the slope to 0.3910 (95% CI: 0.0913–0.6907; R2 = 0.692; p = 0.020), confirming that this observation strongly influences the magnitude of the fitted slope. Nonlinear and multivariable models were considered but were not retained because only eight matched feed–KD observations were available and complete density and aromatic-composition data were not available for all corresponding feedstocks. Under these conditions, adding further model parameters would substantially increase the risk of overfitting.
The sulfur distribution coefficient for the KD fraction, KS,KD = CS,KD/CS,feed, ranged from 0.167 to 1.994 across the eight feed–KD observations. For the LG fraction, PLG is equivalent to KS,LG and ranged from 0.010 to 2.629 across the 18 feed–LG observations. The regression of the LG sulfur partition index on log-transformed feed sulfur gave PLG = 1.6569 − 0.2729ln(CS,feed) (R2 = 0.410, p = 0.0042; slope 95% CI: −0.4463 to −0.0994). Spearman rank analysis confirmed a significant inverse association (ρ = −0.794, p < 0.001).
Although statistically significant associations were identified between feed sulfur and several distillation responses, sulfur concentration should not be interpreted as the sole physicochemical factor governing light gasoline recovery. Petroleum feedstocks with elevated sulfur commonly contain larger proportions of high-boiling hydrocarbons, aromatic structures, and heavier molecular components that may simultaneously influence fraction yields. Therefore, the observed statistical relationships should be interpreted as engineering indicators describing integrated feedstock behavior rather than direct proof that sulfur itself independently controls atmospheric distillation performance.
3.3. Physicochemical and Hydrocarbon Composition of the LG Fraction
To characterize the light gasoline fraction obtained from selected low-sulfur gas condensate feedstocks, physicochemical parameters and detailed hydrocarbon group composition of the LG fraction were determined for six production fields.
The data in Table 5 show that the LG fractions obtained from the investigated feedstocks exhibit considerable variability in antiknock performance. RON values range from 64.4 (Yefremivske) to 73.0 (Sakhalinka), demonstrating substantial variation in antiknock performance among the investigated LG fractions. Density values fall within a narrow range of 736–752 kg/m3 for the investigated LG fractions (<125 °C). Reid Vapor Pressure ranges from 31 to 51.5 kPa, with Seleshchyna yielding the most volatile fraction. Sulfur content in all LG fractions from this subgroup remains below 90 mg/kg, consistent with the low-sulfur character of the selected feedstocks and the redistribution trends.
Table 5.
Physicochemical properties of the LG fraction obtained from selected gas condensate feedstocks.
The hydrocarbon group composition presented in Table 6 reveals substantial differences among the investigated LG fractions. Karaykozivske had the highest total aromatic content (22.57 vol.%) and benzene concentration (7.32 vol.%), whereas Sakhalinka exhibited the highest RON (73.0) despite a lower total aromatic content (17.64 vol.%). Conversely, Yefremivske and Seleshchyna had the highest isoparaffin contents (33.68 and 32.49 vol.%, respectively) but the lowest RON values (64.4 and 64.9). Thus, within this six-sample subset, RON did not vary monotonically with either total aromatics or isoparaffins, and no single hydrocarbon group was interpreted as independently controlling antiknock performance.
Table 6.
Hydrocarbon group and light component composition of the LG fraction (<125 °C), %.
Olefin content varies substantially, ranging from 2.90% (Semerinkivske) to 12.08% (Sakhalinka), which has implications for oxidation stability and downstream processing compatibility. The combined C3–C4 content was highest for Seleshchyna (1.70 vol.%), followed by Kolomatske (1.54 vol.%) and Yefremivske (1.44 vol.%). Seleshchyna also exhibited the highest RVP (51.5 kPa), although its propane content was only 0.10 vol.%; therefore, the observed vapor pressure was not attributed to propane alone but to the overall volatile hydrocarbon composition. The predominance of isoparaffins and naphthenes across all samples is consistent with the paraffinic–naphthenic nature of Ukrainian gas condensates reported in the literature.
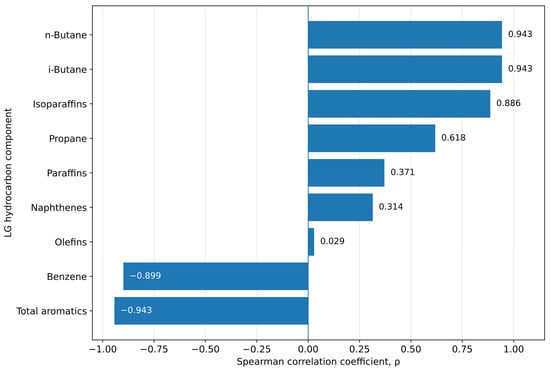
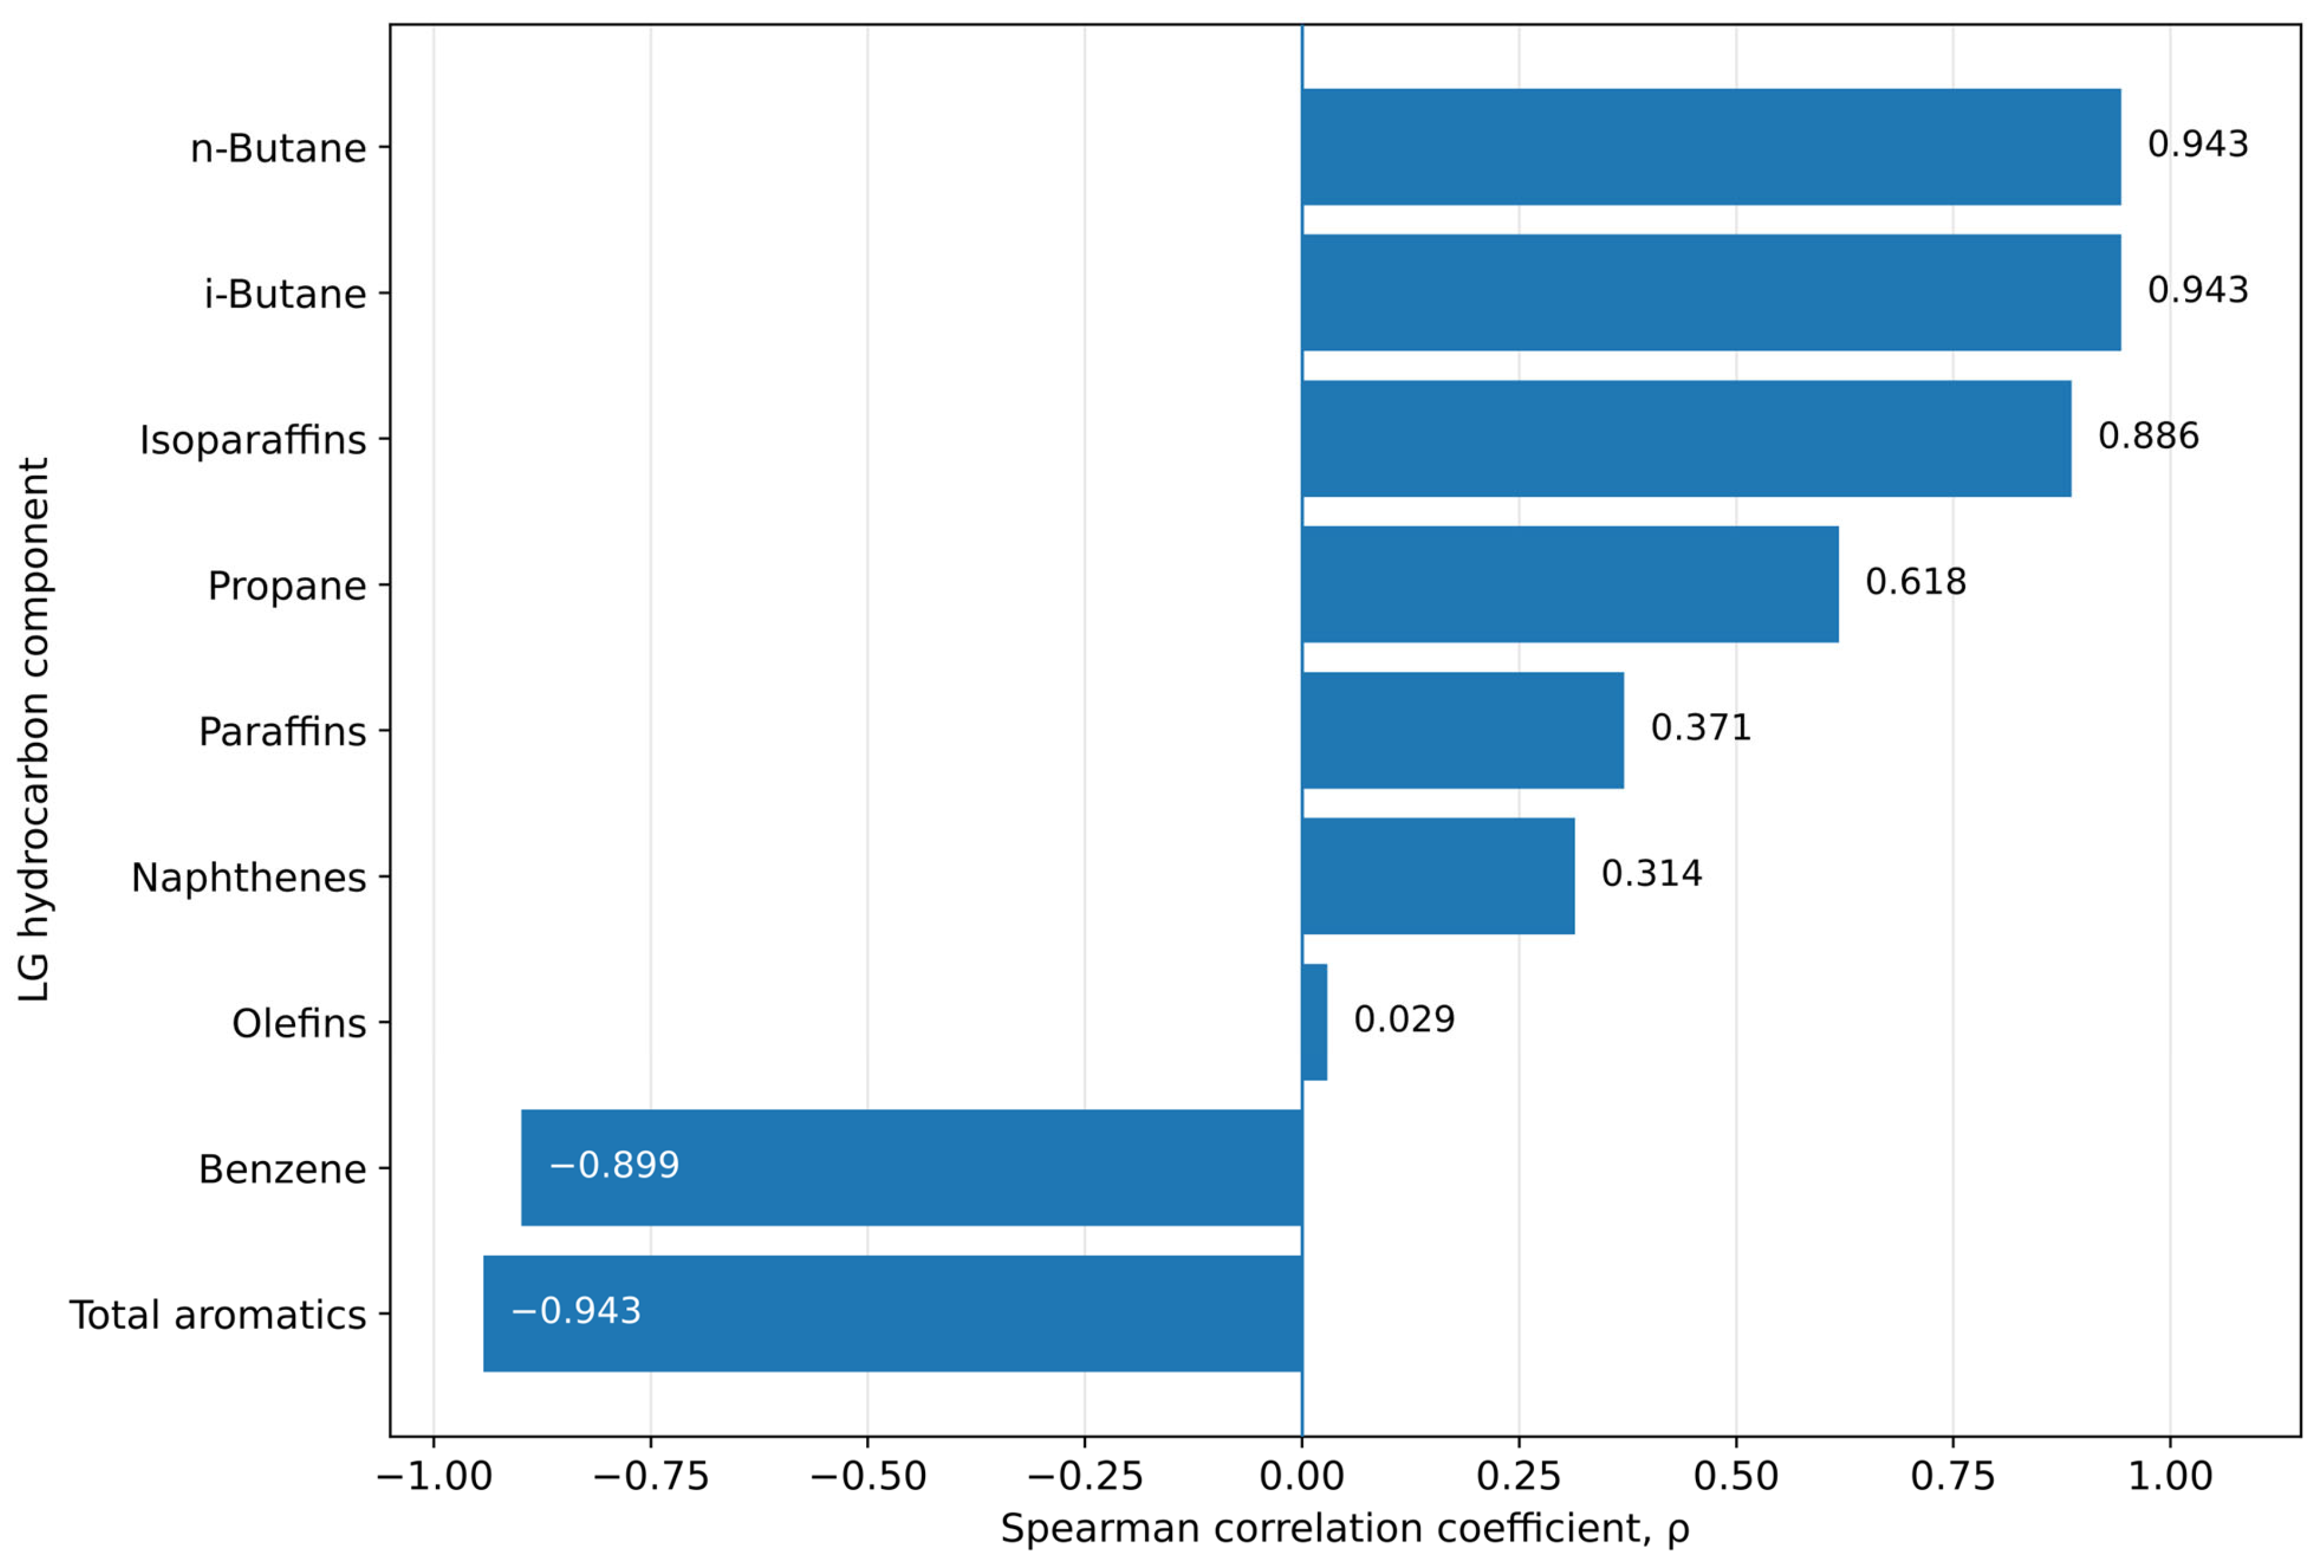
To examine the relationship between sulfur content and hydrocarbon composition within this six-sample LG subset, Spearman rank correlations were calculated between the LG sulfur values reported in Table 5 and each hydrocarbon component reported in Table 6.
Figure 3 shows that LG sulfur content was strongly negatively associated with total aromatics (ρ = −0.943, p = 0.0048) and benzene (ρ = −0.899, p = 0.0149), while strong positive associations were observed for isoparaffins (ρ = 0.886, p = 0.0188), i-butane (ρ = 0.943, p = 0.0048), and n-butane (ρ = 0.943, p = 0.0048). Weaker and statistically non-significant associations were observed for propane (ρ = 0.618, p = 0.191), paraffins (ρ = 0.371, p = 0.468), and naphthenes (ρ = 0.314, p = 0.544), whereas olefins showed essentially no monotonic association (ρ = 0.029, p = 0.957). Because only six LG samples had complete paired data on sulfur and hydrocarbon composition, these correlations are exploratory and should not be interpreted as evidence of causal relationships.
Figure 3.
Spearman correlations between sulfur content and hydrocarbon-component contents in the six investigated LG fractions.
Collectively, the data in Table 5 and Table 6 demonstrate that feedstock origin significantly influences not only sulfur redistribution behavior, but also the qualitative composition of the recovered LG fraction. These findings provide a more complete picture of industrial distillation performance and support the practical relevance of field-specific feedstock characterization in refinery planning.
3.4. Integrated Evaluation of Distillation Performance
The results consistently demonstrate that increasing the sulfur concentration in the feedstock correlates with a systematic shift in the mass distribution toward the middle and heavy fractions. This redistribution is quantitatively supported by decreased LG yield and changes in sulfur partitioning between the experimentally characterized fractions.
Because complete outlet-yield data were unavailable, overall liquid recovery and material-balance stability were not evaluated. The observed yield differences were therefore interpreted only within the experimentally measured LG and KD datasets.
Thus, the integrated evaluation shows that sulfur concentration serves as both a compositional and process-related indicator of distillation behavior, linking feedstock chemistry with industrial distillation performance under real operating conditions.
4. Discussion
Molecular-level studies have already established that sulfur-containing compounds are distributed unevenly across petroleum boiling ranges and that structurally complex sulfur species are preferentially associated with middle and heavy fractions [13,15]. Research has also extensively addressed the downstream removal of these compounds through different desulfurization technologies [38,39]. However, publicly available comparative data on numerous gas condensates and light crude oils processed under comparable industrial atmospheric distillation conditions remain limited. Therefore, the novelty of the present work is not the observation of sulfur enrichment in higher-boiling fractions itself, but the comparative industrial evaluation of this behavior for 19 feedstocks covering a total sulfur range of 7–4467 ppm. The study examines whether bulk feed sulfur can serve as a preliminary screening indicator of fractionation behavior and identifies the limitations to consider when applying this parameter to compositionally heterogeneous industrial streams.
The observed relationships should therefore be interpreted within the broader compositional context of petroleum feedstocks. Total sulfur concentration may covary with density, SARA composition, aromaticity, boiling-range distribution, and heavy-end content [4,5,6,7]. Because these variables were not independently varied in the present industrial dataset, the analysis cannot attribute the observed reduction in LG yield exclusively to sulfur concentration. Instead, sulfur should be regarded as an integrated compositional indicator reflecting overall feedstock quality rather than an isolated causal variable. Accordingly, bulk feed sulfur should be used only as a preliminary screening indicator and should not be used to substitute for complete feedstock compositional characterization.
A multivariable LG-yield model was not developed because complete density, aromatic composition, and detailed boiling-range data were unavailable for all feedstocks. In addition, the grouped LG-yield analysis contained only four aggregated observations, making the inclusion of multiple predictors statistically underdetermined and highly susceptible to overfitting. The grouped regression was therefore retained only as an exploratory descriptive relationship.
The industrial data obtained in this study confirm that sulfur concentration in hydrocarbon feedstocks is not merely a compositional parameter but also a practical indicator of distillation behavior under steady-state atmospheric operation. The observed systematic decrease in light gasoline fraction (LG) recovery with increasing sulfur content suggests that higher-sulfur streams are generally associated with heavier boiling-range distributions and a greater presence of thermally stable organosulfur compounds. This trend aligns with established knowledge that sulfur-containing species, particularly aromatic thiophenic structures, preferentially concentrate in higher boiling fractions during primary separation [15].
The enrichment of sulfur in the kerosene–diesel (KD) fraction observed across the investigated feedstocks is consistent with previously reported partitioning patterns in atmospheric distillation. Previous studies in petroleum chemistry have demonstrated that thiophenes, benzothiophenes, and related condensed aromatic sulfur compounds preferentially partition into higher-boiling fractions owing to their molecular structure and boiling points [13,15]. Because the present work quantified only total sulfur concentration by XRF, these compounds are discussed solely as a literature-supported mechanistic explanation for the experimentally observed sulfur redistribution rather than as directly identified molecular species.
Statistical analysis refined the interpretation of the observed relationships. Group-level regression demonstrated a significant inverse association between group geometric-mean feed sulfur and average LG yield (R2 = 0.9525, p = 0.024). However, because the model was based on only four group-level observations, each representing the arithmetic mean of the available individual LG yields, this result does not demonstrate that sulfur independently caused the variation in the recovery of individual fractions. At the product level, feed sulfur was significantly associated with both LG sulfur (n = 18, R2 = 0.3069, p = 0.0171) and KD sulfur (n = 8, R2 = 0.685, p = 0.011), although the LG relationship showed substantially lower predictive strength. The significant inverse relationship of the LG sulfur partition index (PLG, Equation (3)) with log-transformed feed sulfur indicates that feed sulfur is more informative for relative sulfur partitioning than for predicting absolute LG sulfur concentration.
The available product data were insufficient for a complete sulfur mass-balance closure; therefore, the analytical repeatability of the XRF measurements should not be interpreted as a process mass-balance deviation.
The practical significance of these results is directly related to refinery planning and feedstock management. Understanding sulfur redistribution and fraction-yield behavior can support preliminary planning of gasoline and middle-distillate production. Because sulfur-rich middle fractions generally require downstream desulfurization, early characterization of sulfur partitioning may assist coordination with hydrotreating operations [17,38,39,40].
While regulatory limits typically focus on final product sulfur content, distribution-based analysis provides additional insight into how primary separation influences the burden placed on downstream treatment. For example, Directive 98/70/EC specifies a maximum sulfur content of 10 mg/kg for marketable petrol and automotive diesel in the European Union (Annexes I and II) [41]. These limits apply to finished fuels rather than the intermediate light gasoline (LG) and kerosene–diesel (KD) fractions investigated here. Nevertheless, the sulfur concentrations measured in such intermediate streams are relevant to estimating the downstream desulfurization requirements, including hydrotreating, needed to produce finished fuels meeting applicable specifications.
The industrial-scale scope of the present investigation, encompassing nineteen feedstocks processed under comparable steady-state conditions, strengthens the practical relevance of the dataset, although the product-specific subsets remain statistically limited. Recent CDU studies likewise emphasize careful model selection, validation, and domain restrictions when operational datasets are limited, heterogeneous, or strongly dependent on feed composition [19,20,21,22,23,24,25,26,27,28]. Differences in analytical coverage were addressed by separating the feed–LG (n = 18), feed–KD (n = 8), and paired LG–KD (n = 7) datasets, excluding unavailable measurements from the calculations, and restricting each product-specific conclusion to its corresponding experimental subset.
Although the experimental dataset was obtained from Ukrainian gas condensates and light crude oils, the proposed analytical approach is not restricted to a single region. The specific regression coefficients should be regarded as dataset-dependent because they reflect the composition of the investigated feedstocks and the operating conditions of the UIADU; recent crude-assay and compatibility studies similarly demonstrate strong composition dependence across petroleum datasets [4,5,6,7]. However, the complete-case statistical framework, paired LG–KD comparison, and interpretation of bulk sulfur as a preliminary screening indicator can be applied to other gas condensate and light crude oil datasets processed under comparable atmospheric-distillation conditions. Therefore, the findings have regional experimental grounding but broader methodological applicability.
Sulfur concentration can therefore be regarded as a compositional marker associated with broader boiling-range characteristics and fraction-recovery patterns. The combined yield and sulfur-partitioning results support its use as a preliminary screening variable. At the same time, the numerical relationships remain dataset-dependent and require validation for other feedstocks and processing units. The proposed complete-case statistical framework can nevertheless be applied to comparable industrial datasets in which product-specific analytical coverage is incomplete.
5. Conclusions
This study provides a comparative industrial assessment of sulfur partitioning and fraction-yield behavior for 19 gas condensate and light crude oil feedstocks covering 7–4467 ppm sulfur. Feed sulfur was significantly but weakly associated with LG sulfur (n = 18, R2 = 0.3069, p = 0.0171) and showed a stronger significant association with KD sulfur (n = 8, R2 = 0.685, p = 0.011). The grouped LG-yield model showed a strong descriptive association (R2 = 0.9525, p = 0.024) but remains exploratory because it is based on only four aggregated observations; the grouped KD-yield model was not statistically significant despite its high R2 (R2 = 0.9569, p = 0.1331).
Within the seven complete paired observations, KD sulfur exceeded LG sulfur in every case. However, incomplete outlet-yield and sulfur data prevented a closed material or sulfur balance, and the reported regression coefficients are dataset-dependent. Total feed sulfur should therefore be used as a preliminary screening indicator of selected distillation responses rather than as a standalone causal determinant or a substitute for complete feedstock characterization.
From an industrial perspective, combining feed sulfur characterization with fraction yield and product sulfur data can support preliminary feedstock screening and coordination with downstream hydrotreating. Future work should expand the matched industrial dataset, include density, boiling range, and aromatic composition covariates, characterize individual sulfur species, and validate the statistical relationships across additional atmospheric distillation units.
Author Contributions
Conceptualization, D.M., S.S. and V.R.; methodology, S.P., V.R., and D.K.; software, V.R.; validation, S.P. and D.M.; formal analysis, D.M., M.S., and L.L.; investigation, V.R. and D.K.; resources, V.R. and D.K.; data curation, S.P. and K.R.; writing—original draft preparation, D.M., V.R. and S.S.; writing—review and editing, S.P., M.S., and, K.R.; visualization, S.S. and L.L.; supervision, S.P. and D.M. All authors have read and agreed to the published version of the manuscript.
Funding
This research received no external funding.
Data Availability Statement
Data is contained within the article.
Conflicts of Interest
The authors declare no conflicts of interest.
Abbreviations
| LG | Light gasoline |
| KD | Kerosen—Diesel |
| GC | Gas chromatography |
| HK | Gas condensate (transliterated Ukrainian abbreviation) |
| UIADU | Ukrainian Industrial Atmospheric Distillation Unit |
| MON | Motor octane number |
| RON | Research octane number |
| RVP | Reid vapor pressure |
References
- Monroy-Loperena, R. Statistical Moment Method for Gamma-Distributed Continuous Thermodynamics in Vapor–Liquid Equilibrium. Chem. Thermodyn. Therm. Anal. 2026, 22, 100288. [Google Scholar] [CrossRef] [Scilit]
- Tapiero, D.; Tzabar, N. Vapor-liquid equilibrium of light hydrocarbon multicomponent systems by solving the Rachford-Rice equation. Cryogenics 2023, 129, 103600. [Google Scholar] [CrossRef] [Scilit]
- Miroshnichenko, D.; Chemerinskiy, M.; Bilushchak, H.; Pyshyev, S.; Rohovyi, Y.; Bogoyavlenska, O. Forecasting the characteristics of crude oil from the Druzhelyubivske oil and gas condensate field. Min. Miner. Depos. 2025, 19, 81–90. [Google Scholar] [CrossRef] [Scilit]
- Shiskova, I.; Stratiev, D.; Sotirov, S.; Sotirova, E.; Dinkov, R.; Kolev, I.; Stratiev, D.D.; Nenov, S.; Ribagin, S.; Atanassov, K.; et al. Predicting Petroleum SARA Composition from Density, Sulfur Content, Flash Point, and Simulated Distillation Data Using Regression and Artificial Neural Network Techniques. Processes 2024, 12, 1755. [Google Scholar] [CrossRef] [Scilit]
- Vasilev, S.; Stratiev, D.; Shishkova, I.; Dinkov, R.; Yordanov, D.; Abdellatief, T.M.M.; Sotirov, S.; Sotirova, E.; Dimitrov, A.; Georgieva, V.; et al. Oil Characterization, Molecular Modeling and Process Simulation in Petroleum Research and Industry, Opportunities, Challenges and Perspectives. Molecules 2026, 31, 1645. [Google Scholar] [CrossRef] [Scilit]
- Stratiev, D.; Shishkova, I.; Georgiev, G.; Dinkov, R.; Nedelchev, A.; Nikolova, R.; Veli, A.; Bureva, V.; Atanassov, K.; van den Berg, F.; et al. The Incompatibility Pitfall in Refining Opportunity Crude Oils. Processes 2025, 13, 593. [Google Scholar] [CrossRef] [Scilit]
- Shiskova, I.; Stratiev, D.; Tavlieva, M.; Nedelchev, A.; Dinkov, R.; Kolev, I.; van den Berg, F.; Ribagin, S.; Sotirov, S.; Nikolova, R.; et al. Application of Intercriteria and Regression Analyses and Artificial Neural Network to Investigate the Relation of Crude Oil Assay Data to Oil Compatibility. Processes 2024, 12, 780. [Google Scholar] [CrossRef] [Scilit]
- Kutuzov, I.; Xiao, Q.; Cai, C.; Amrani, A. Formation of volatile organic sulfur compounds by low thermal maturation of source rocks: A geochemical proxy for natural gas. Mar. Pet. Geol. 2023, 158, 106531. [Google Scholar] [CrossRef] [Scilit]
- Kutuzov, I.; Said-Ahmad, W.; Turich, C.; Jiang, C.; Luu, N.; Jacksier, T.; Amrani, A. The molecular and sulfur isotope distribution of volatile compounds in natural gases and condensates from Alberta, Canada. Org. Geochem. 2021, 151, 104129. [Google Scholar] [CrossRef] [Scilit]
- Wylde, J.; Majid, A. Multi-component waxy model oil design to mimic rheologically complex gas condensate liquids. Geoenergy Sci. Eng. 2025, 245, 213516. [Google Scholar] [CrossRef] [Scilit]
- Pyshyev, S.; Korchak, B.; Miroshnichenko, D.; Vytrykush, N. Influence of water on noncatalytic oxidative desulfurization of high-sulfur straight-run oil fractions. ACS Omega 2022, 7, 26495–26503. [Google Scholar] [CrossRef] [Scilit]
- Paniv, P.M.; Pysh’ev, S.V.; Gaivanovich, V.I.; Lazorko, O.I. Noncatalytic oxidation desulfurization of the kerosene cut. Chem. Technol. Fuels Oils 2006, 42, 159–166. [Google Scholar] [CrossRef] [Scilit]
- Ávila, B.; Pereira, V.; Gomes, A.; Azevedo, D. Speciation of organic sulfur compounds using comprehensive two-dimensional gas chromatography coupled to time-of-flight mass spectrometry: A powerful tool for petroleum refining. Fuel 2014, 126, 188–193. [Google Scholar] [CrossRef] [Scilit]
- Al-Rabiah, H.; Al-Ostad, L.; Al-Shamary, T.; Al-Hendi, A.; Al-Henayyan, H.; Khazemi, R. Sulfur speciation of Kuwaiti crude oils fractions using two-dimensional gas chromatography. Arab. J. Chem. 2020, 13, 3615–3623. [Google Scholar] [CrossRef] [Scilit]
- Wu, J.; Ma, C.; Zhang, W.; Chang, W.; Zhang, Y.; Shi, Q. Molecular characterization of non-polar sulfur compounds in the full boiling range crude oil fractions. Fuel 2023, 338, 127323. [Google Scholar] [CrossRef] [Scilit]
- Oliveira, L.; Miranda, F.; Sampaio, F.; Amaral, D.; Garcia, K.; Queiroz, A.; Benvenutti, E.; Machado, M. Silica decorated with palladium nanoparticles applied in a miniaturized method to separation and quantification of sulfur-containing compounds in fuel samples. Fuel 2025, 401, 135842. [Google Scholar] [CrossRef] [Scilit]
- Wang, Y.; Hu, Y.; Wu, J.; Shen, H.; Wang, S.; Zhang, L.; Shi, Q.; Chen, Z. Hydrodesulfurization of characteristic sulfur-containing fractions isolated from vacuum gas oil: Apparent and intrinsic kinetics. Fuel 2026, 416, 138619. [Google Scholar] [CrossRef] [Scilit]
- Muller, H.; Alawani, N.A.; Naqvi, I.A.; Al-Shammari, M.M.; Al-Bakor, R.Y.; Adam, F.M. Boiling point modeling for petroleum speciation data. Fuel 2024, 358, 130066. [Google Scholar] [CrossRef] [Scilit]
- Qasim, A.; Malik, T.; Addai, G.; Hatem, S.; Alwan, H. Hot-season rise of reflux drum temperature in an atmospheric crude distillation unit: Field impacts on overhead corrosion, flare loading, and loss prevention. S. Afr. J. Chem. Eng. 2026, 56, 100836. [Google Scholar] [CrossRef] [Scilit]
- Zhu, J.; Fan, C.; Yang, M.; Qian, F.; Mahalec, V. Data-driven models of crude distillation units for production planning and for operations monitoring. Comput. Chem. Eng. 2023, 177, 108322. [Google Scholar] [CrossRef] [Scilit]
- Zhu, J.; Fan, C.; Yang, M.; Qian, F.; Mahalec, V. Semi-supervised learning for predicting multivariate attributes of process units from small labeled and large unlabeled data sets with application to detect properties of crude feed distillation unit. Chem. Eng. Sci. 2024, 298, 120324. [Google Scholar] [CrossRef] [Scilit]
- Shahzad, J.; Ahmad, I.; Ahsan, M.; Ahmad, F.; Saghir, H.; Kano, M.; Caliskan, H.; Hong, H. Grey-box modelling for estimation of optimum cut point temperature of crude distillation column. CAAI Trans. Intell. Technol. 2025, 10, 160–174. [Google Scholar] [CrossRef] [Scilit]
- Seo, D.; Kim, D.; Son, H.; Kim, Y. Implementation of reinforcement learning for enhanced pressure control in a 190,000-barrel crude distillation unit: The first full-scale commercial deployment. Eng. Appl. Artif. Intell. 2025, 156, 110907. [Google Scholar] [CrossRef] [Scilit]
- Abubakar, A.N.; Khaldi, M.K.; Aldhaifallah, M.; Patwardhan, R.; Salloum, H. Identification of Crude Distillation Unit: A Comparison between Neural Network and Koopman Operator. Algorithms 2024, 17, 368. [Google Scholar] [CrossRef] [Scilit]
- Liu, W.; Ye, H.; Dong, H. Molecular reconstruction of crude oil and simulation of distillation processes: An approach based on predefined molecules. Chem. Eng. Sci. 2024, 295, 120141. [Google Scholar] [CrossRef] [Scilit]
- Domingos, A.P.; Bispo, H.; da Costa, T.V.; da Silva Neiro, S.M. Data-driven simulation of crude distillation using Aspen HYSYS and comparative machine learning models. Can. J. Chem. Eng. 2026, 104, 4079–4100. [Google Scholar] [CrossRef] [Scilit]
- Liu, W.; Cui, X.; Ye, H.; Dong, H. Construction of molecular model-driven hybrid model for atmospheric distillation separation of crude oil and dynamic prediction study of product composition distribution. Chem. Eng. Sci. 2026, 320, 122654. [Google Scholar] [CrossRef] [Scilit]
- Son, M.; Kim, J. Digital transformation of rotary hearth furnace for process automation and CO2 reduction: Hybrid model under limited operational data utilization. J. Manuf. Process. 2023, 101, 784–794. [Google Scholar] [CrossRef] [Scilit]
- Nadar, K.; Mullayousef, N.; Meqwar, S. A comprehensive review on heat exchangers in crude oil refineries: Classification, degradation mechanisms, and performance optimization strategies. Next Energy 2025, 9, 100443. [Google Scholar] [CrossRef] [Scilit]
- ASTM D4294-24; Standard Test Method for Sulfur in Petroleum and Petroleum Products by Energy Dispersive X-Ray Fluorescence Spectrometry. ASTM International: West Conshohocken, PA, USA, 2024.
- ASTM D3606-26; Standard Test Method for Determination of Benzene and Toluene in Spark Ignition Fuels by Gas Chromatography. ASTM International: West Conshohocken, PA, USA, 2026.
- ASTM D5580-26; Standard Test Method for Determination of Benzene, Toluene, Ethylbenzene, p/m-Xylene, o-Xylene, C9 and Heavier Aromatics, and Total Aromatics in Finished Gasoline by Gas Chromatography. ASTM International: West Conshohocken, PA, USA, 2026.
- ASTM D6730-26; Standard Test Method for Determination of Individual Components in Spark Ignition Engine Fuels by 100-Metre Capillary (with Precolumn) High-Resolution Gas Chromatography. ASTM International: West Conshohocken, PA, USA, 2026.
- ASTM D2699-26; Standard Test Method for Research Octane Number of Spark-Ignition Engine Fuel. ASTM International: West Conshohocken, PA, USA, 2026.
- ASTM D2700-26b; Standard Test Method for Motor Octane Number of Spark-Ignition Engine Fuel. ASTM International: West Conshohocken, PA, USA, 2026.
- ASTM D4052-22; Standard Test Method for Density, Relative Density, and API Gravity of Liquids by Digital Density Meter. ASTM International: West Conshohocken, PA, USA, 2022.
- ASTM D323-26; Standard Test Method for Vapor Pressure of Petroleum Products (Reid Method). ASTM International: West Conshohocken, PA, USA, 2026.
- Khalid, A.; Khalid, R.A.; Farhan, A.; Arooj, Y.; Zahid, M.; Qamar, M.; Rostek, E.; Serafin, J.; Boczkaj, G. Emerging desulfurization technologies and cutting-edge solvents for sulfur compounds removal from liquid fuels—A comprehensive review. Sep. Purif. Technol. 2025, 379, 134782. [Google Scholar] [CrossRef] [Scilit]
- Wu, P.; Ma, S.; Zhu, W. Green pathways to low-sulfur diesel: Advances and challenges in desulfurization technologies. Green Chem. 2026, 28, 37–95. [Google Scholar] [CrossRef] [Scilit]
- Qin, X.; Ji, Y.; Cai, G.; Wang, T.; Du, Y.; Mu, G.; Zhang, J.; Duan, X.; Pu, X.; Han, X.; et al. Molecular level simulation and analysis of removal of sulfur, nitrogen and carbon residue in residual oil hydrotreating process. Chem. Eng. J. 2025, 508, 161176. [Google Scholar] [CrossRef] [Scilit]
- European Parliament; Council of the European Union. Directive 98/70/EC of 13 October 1998 relating to the quality of petrol and diesel fuels and amending Council Directive 93/12/EEC, consolidated version of 20 November 2023. Off. J. Eur. Communities 1998, L350, 58–68. [Google Scholar]

Disclaimer/Publisher’s Note: The statements, opinions and data contained in all publications are solely those of the individual author(s) and contributor(s) and not of MDPI and/or the editor(s). MDPI and/or the editor(s) disclaim responsibility for any injury to people or property resulting from any ideas, methods, instructions or products referred to in the content. |
© 2026 by the authors. Licensee MDPI, Basel, Switzerland. This article is an open access article distributed under the terms and conditions of the Creative Commons Attribution (CC BY) license.