


Highlights
What are the main findings?
- First study on O3 exposure and GDM by different clinical classifications.
- O3 exposure can increase the risks of GDMA1 and GDMA2 during pregnancy.
- DLNMs identified weekly specific windows of O3 exposure on GDMA1 and GDMA2.
- High temperatures appeared to strengthen the observed association between preconception O3 exposure and GDMA1.
Abstract
Background: Previous studies have explored the association between ambient ozone (O3) exposure and gestational diabetes mellitus (GDM). However, little is known about the association of O3 with different GDM clinical classifications—diet-controlled GDM (GDMA1) and insulin-treated GDM (GDMA2), and whether temperature modifies the associations. Methods: We conducted a retrospective cohort study including 11,491 pregnant women between 2017 and 2023 in Tianjin, China. O3 exposure levels for each participant were assessed using the Tracking Air Pollution in China dataset. Logistic regression models were employed to analyze the associations of trimester-specific O3 exposure with GDMA1 and GDMA2. Distributed lag nonlinear model (DLNM) was used to identify potential critical gestational weeks of O3 exposure. Ambient temperature was categorized using the 10th and 90th percentiles to evaluate the effect modification of extreme temperatures on these associations. Results: No statistically significant association was observed in the fully adjusted trimester-specific models. In the weekly-specific DLNM analyses, we observed 5–12 weeks before pregnancy and 26–28 gestational weeks as sensitive windows where O3 exposure was weakly associated with elevated GDMA1 risk, and 11–25 gestational weeks for GDMA2. Each 10 μg/m3 increase in O3 during pregnancy was associated with small increases in the odds of GDMA1 (28 weeks: OR = 1.019, 95% CI: 1.002, 1.035) and GDMA2 (25 weeks: OR = 1.018, 95% CI: 1.002, 1.035). High temperatures appeared to strengthen the observed association between preconception O3 exposure and GDMA1. Additionally, O3 exposure during pregnancy may increase the risk of GDMA1 among women aged <35 years, preconception obesity, gestational hypertension, and family history of diabetes. Conclusions: This study suggests possible weak weekly-specific associations between O3 exposure and GDM classifications and indicates that ambient high temperature may modify the O3-GDM association. These findings should be interpreted cautiously and require confirmation in future studies.
1. Introduction
Gestational diabetes mellitus (GDM) is defined as the first onset of glucose intolerance during pregnancy. As a common pregnancy complication, it has been recognized as a major public health concern worldwide [1]. The global prevalence of GDM is estimated at 14.0% according to the International Association of the Diabetes and Pregnancy Study Groups (IADPSG) criteria, with a notably rising trend observed in low-income countries, particularly in the Middle East and Southeast Asia [2]. Clinically, most GDM patients can achieve blood glucose control through a balanced diet and are classified as diet-controlled GDM (GDMA1). However, pharmacologic intervention (e.g., insulin) is required for patients whose blood glucose fails to meet targets, and these patients are termed insulin-treated GDM (GDMA2) [3]. Regardless of glycemic control, GDM elevates the risk of adverse health outcomes for both the mother and infant [4,5]. Short-term complications include adverse perinatal outcomes such as macrosomia, preeclampsia, and birth trauma [6]. Long-term risks are characterized by an increased susceptibility to metabolic disorders and cardiovascular diseases in both mothers and children [7,8]. Notably, GDMA2 is associated with a higher risk of adverse perinatal outcomes compared to GDMA1 [9]. Given the substantial health and economic burden imposed by GDM, identifying modifiable risk factors and elucidating their differential effects on GDMA1 and GDMA2 are crucial for developing targeted prevention strategies.
Beyond well-established GDM risk factors (e.g., advanced maternal age, preconception obesity, family history of diabetes), ambient air pollution—ozone (O3), especially, has been identified as a potential environmental risk factor for GDM [1,10]. The 2019 Global Burden of Disease (GBD) Study reported that O3 exposure contributed to approximately 365,000 premature deaths globally [11]. Additionally, ambient O3 concentrations have continued to rise in recent years, a trend particularly pronounced in China [11,12]. Although several studies have explored the association between O3 exposure and GDM, the findings remain inconsistent [10,13,14,15,16,17,18,19]. Some cohort studies have reported that preconception or prenatal O3 exposure is associated with an increased risk of GDM [10,17,18,19], potentially mediated through β-cell dysfunction, systemic inflammation, oxidative stress, neurohormonal dysregulation, and insulin resistance [20]. However, other studies have found no significant association or even suggested a protective effect [15,16]. These discrepancies may be attributed to variations in exposure assessment methods, definitions of exposure windows, and differences in geographical and population characteristics. Moreover, most previous studies predominantly focus on long-term exposure estimates, lacking refined temporal analyses needed to identify high-risk sensitive windows for the O3-GDM association. Meanwhile, existing studies have generally treated GDM as a homogeneous outcome without distinguishing between its clinical classification, thereby limiting insights into whether O3 exposure affects GDM severity differentially.
O3 is a typical photochemical oxidant formed primarily through reactions between nitrogen oxides and volatile organic compounds under sunlight and high temperature conditions [21]. Intense solar radiation and high temperatures can further increase O3 concentrations during extreme heat events. Compared with the independent effects of individual factors, the interaction between high temperature and high O3 concentrations may jointly affect human health [22]. Previous studies have indicated that prenatal high temperature exposure is associated with an elevated risk of GDM [23,24,25]. However, temperature was mostly adjusted as a confounder in the association between O3 exposure and GDM [13,17,19]. Only limited studies have explored the effect modification of temperature on the association between O3 exposure and health outcomes, including adverse pregnancy outcomes [26,27], and cardiovascular hospitalizations and mortality [28,29]. Therefore, clarifying whether temperature modifies the association between O3 exposure and GDM may help improve prevention and control strategies for pregnancy health risks.
To address these research gaps, this study investigated the associations between O3 exposure and different GDM classifications (GDMA1 and GDMA2) among 11,491 pregnant women from a birth cohort in Tianjin, China. Additionally, we evaluated the effect modification of ambient temperature on these associations and further identified sensitive windows and vulnerable populations.
2. Materials and Methods
2.1. Study Design and Population
This study recruited participants at Tianjin Medical University General Hospital from 2017 to 2023. All participants were permanent residents of the 16 districts in Tianjin and were followed up until delivery. Professional medical staff collected information including demographic characteristics, lifestyle, medication use during pregnancy, and clinical examination data through standardized assessments. Exclusion criteria included: maternal age < 18 years, missing address information or non-permanent residence in Tianjin, gestational age outside the 24–42 week range, non-singleton live births, a history of chronic hypertension, heart disease, diabetes, hepatic/renal disease, epilepsy, or infectious diseases [30], and those who could not be diagnosed with any classification of GDM. Finally, a total of 11,491 pregnant women were included in the analysis (Figure S1). This study was approved by the Ethics Committee of Tianjin Medical University General Hospital (Approval No: IRB2024-YX-101-01). All participants signed a written informed consent form after fully understanding the purpose and procedures of the study.
2.2. Outcome Assessment
All pregnant women underwent a 75 g oral glucose tolerance test (OGTT) between 24 and 28 weeks of gestation. GDM was diagnosed according to the IADPSG criteria [31]. Diagnosis required meeting at least one of the following conditions: (1) fasting blood glucose ≥ 5.1 mmol/L; (2) 1 h blood glucose ≥ 10.0 mmol/L after oral administration of 75 g of glucose; (3) 2 h blood glucose ≥ 8.5 mmol/L after oral administration of 75 g of glucose. According to the method of blood glucose control, GDM was further classified into GDMA1 and GDMA2 [3]. Specifically, GDMA1 was defined as GDM adequately controlled through diet alone (without medication), while GDMA2 referred to GDM requiring insulin therapy during pregnancy to maintain blood glucose control [32,33].
2.3. Exposure Assessment
Daily maximum 8 h average (MDA8) O3 concentration data for the study period (2017–2023) were obtained from the Tracking Air Pollution (TAP) dataset in China (http://tapdata.org.cn/). This dataset provides near-real-time gridded data with a spatial resolution of 10 km × 10 km, which is generated by fusing ground observations, Community Multiscale Air Quality (CMAQ) simulations, Ozone Monitoring Instrument (OMI) satellite O3 profiles, Modern-Era Retrospective analysis for Research and Applications, Version 2 (MERRA-2) meteorological parameters, Moderate Resolution Imaging Spectroradiometer (MODIS) Normalized Difference Vegetation Index (NDVI), and National Centers for Environmental Information (NCEI) annual night light data [34,35]. A 5-fold cross-validation was conducted to evaluate the performance of O3 concentration calculation, and the results showed that the cross-validation coefficient of determination (R2) was 0.84 [34], indicating high prediction accuracy. Daily average temperature and dew point data were acquired from Tianjin monitoring stations through the China Meteorological Data Service Center (http://data.cma.cn/). Details of the exposure assessment for such meteorological data have been described in previous studies [36].
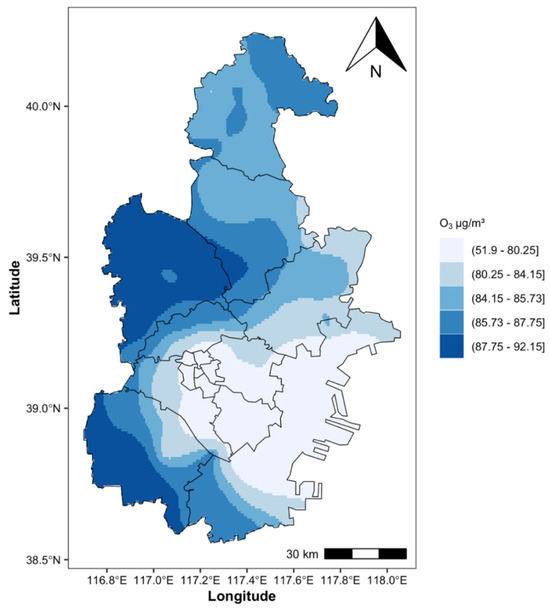
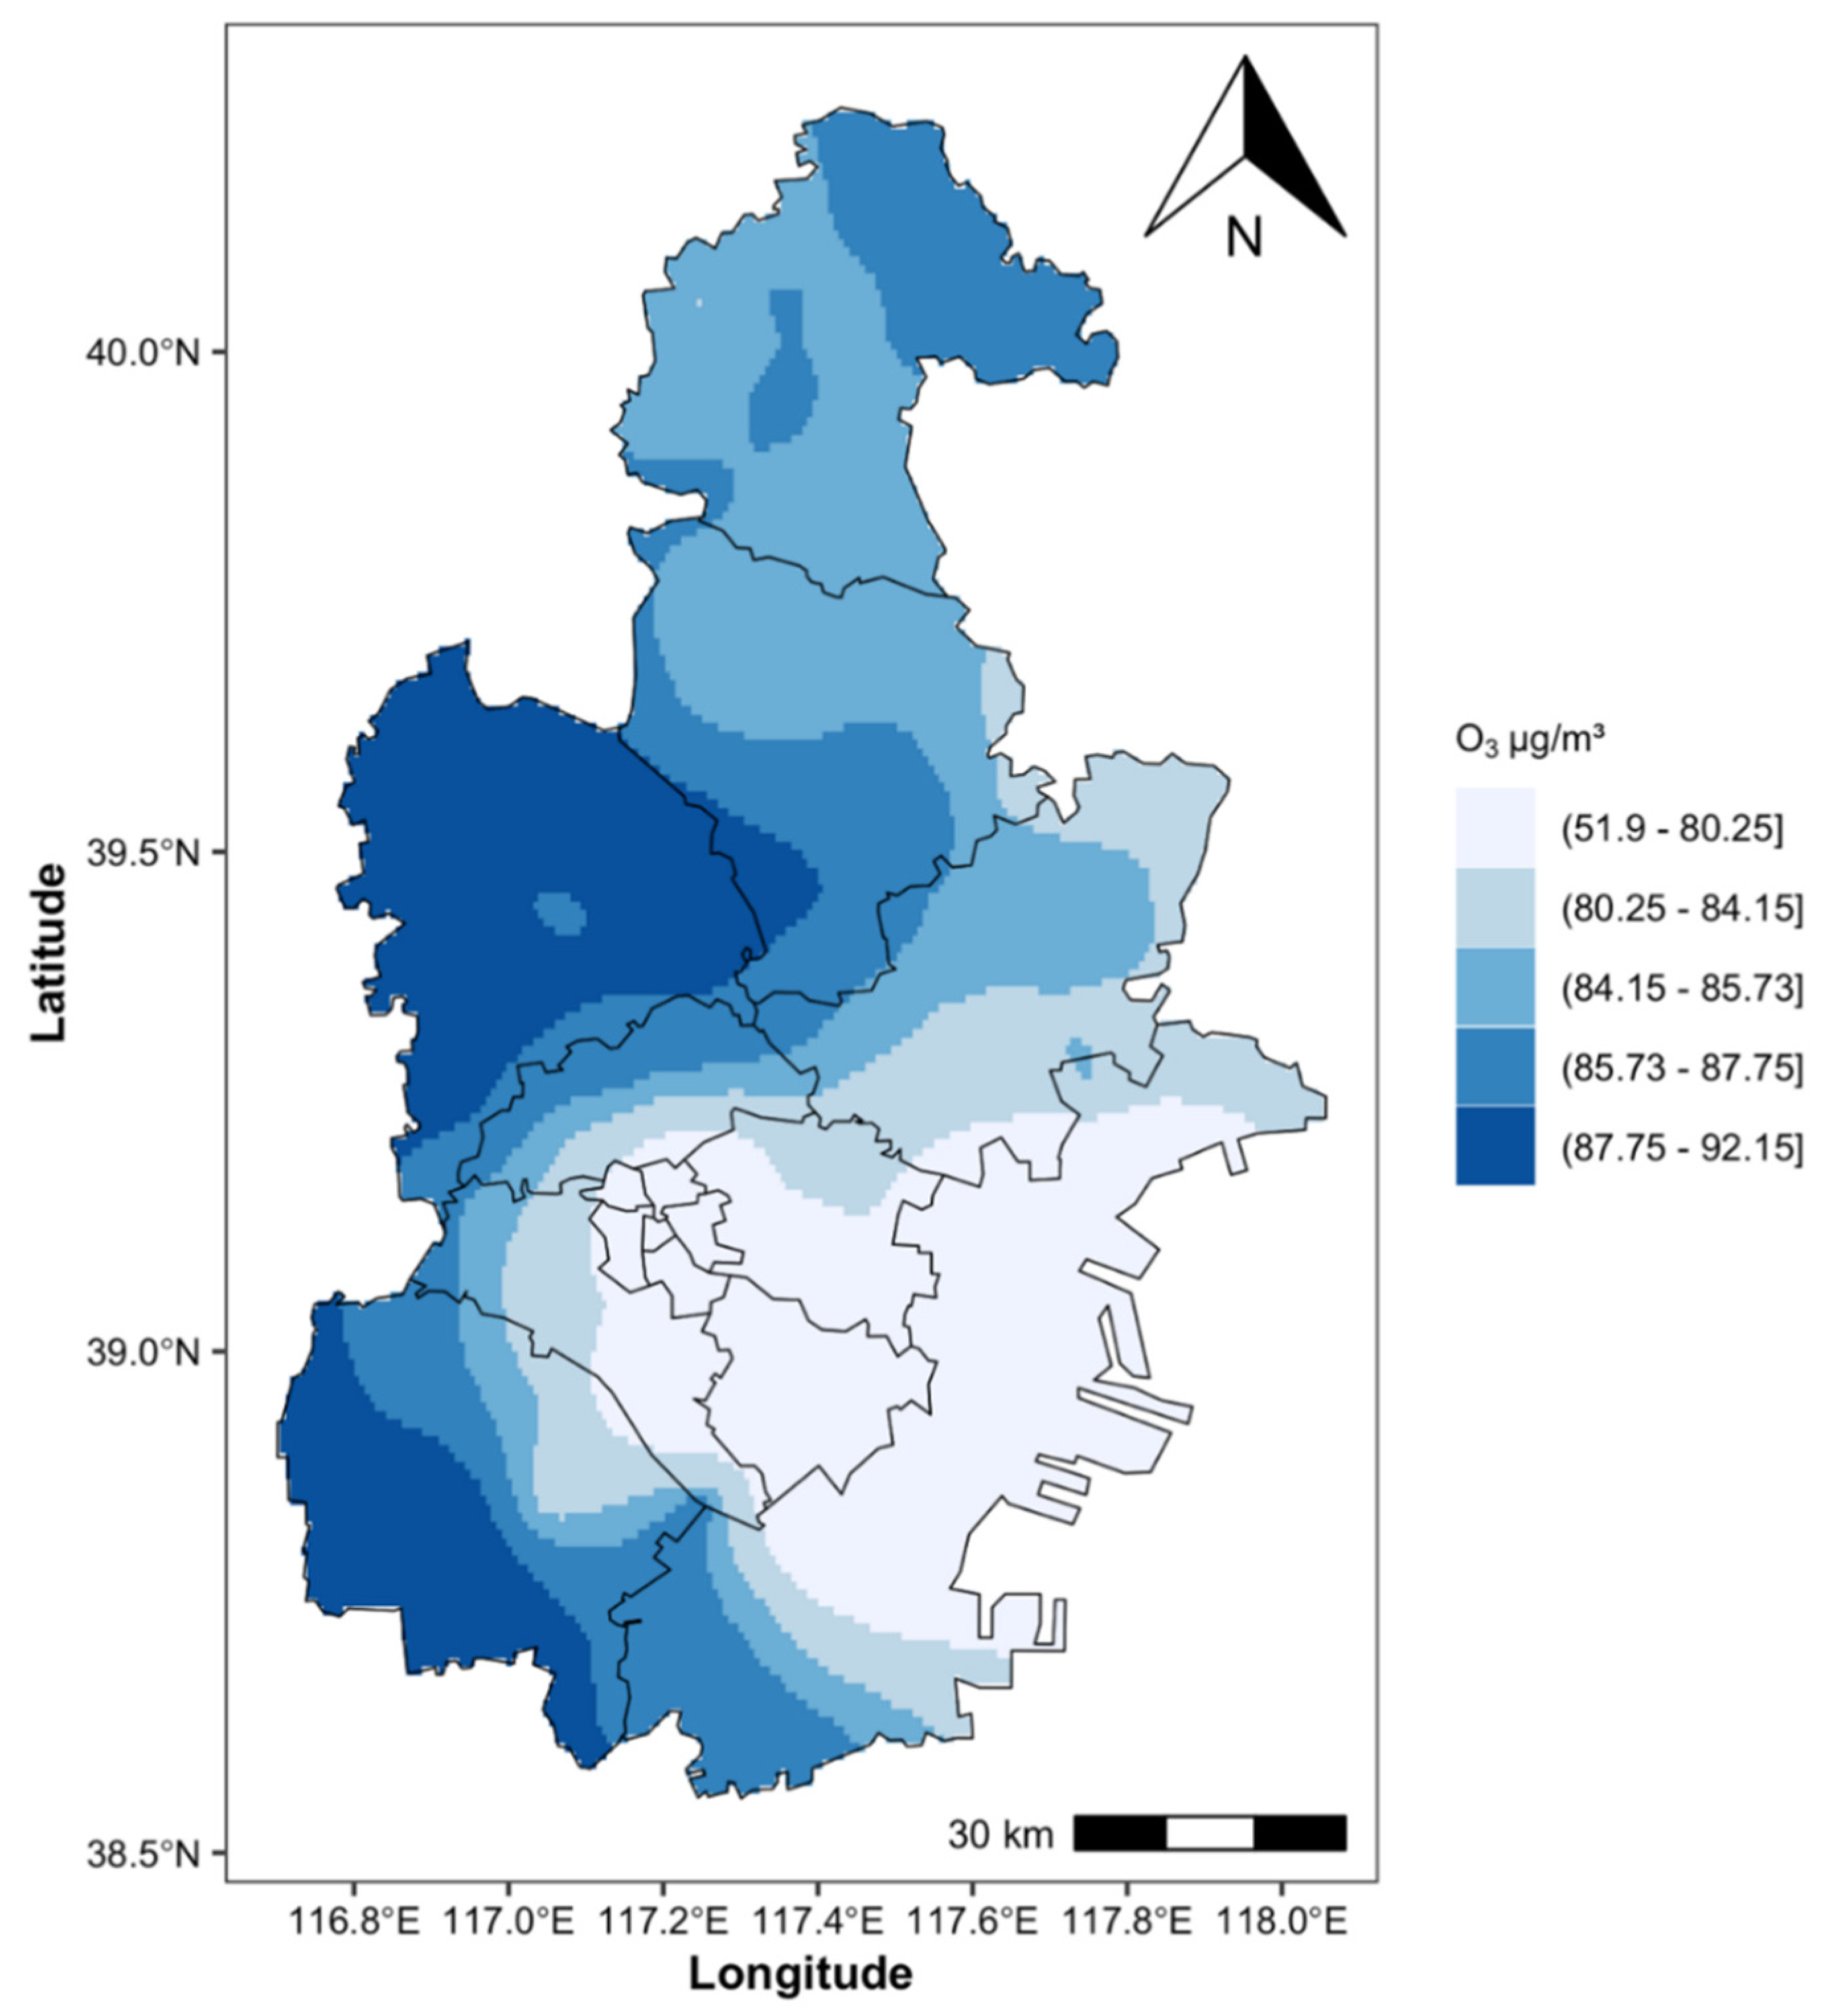
Participants’ residential addresses were geocoded into latitude and longitude coordinates using the Baidu Maps API (http://lbsyun.baidu.com), and the k-nearest neighbor algorithm was then used to map these geocoded addresses to the corresponding grids in the TAP dataset. We calculated the weekly-specific and trimester-specific average levels of O3, temperature, and dew point from 12 weeks before pregnancy to 28 weeks. The average exposure levels of O3 during the study period (2017–2023) are shown in Figure 1.
Figure 1.
Average O3 concentrate study period (2017–2023) in Tianjin, China.
2.4. Statistical Analysis
Continuous variables were presented as mean ± standard deviation (SD), and categorical variables were expressed as frequencies and percentages (%). Independent sample t-tests were used to evaluate differences in continuous variables across GDM and non-GDM groups, and chi-squared tests were performed for categorical variables. Spearman correlation analysis was used to assess the correlations among O3, temperature, and dew point. Based on previous literature [30,36,37], covariates adjusted for in the models included: maternal age (years, continuous), preconception body mass index (BMI; <18.50, 18.50–23.99, ≥24.0 kg/m2), occupation (manual labor, non-manual labor and unemployed), education level (less than high school, high school, more than high school), gravidity (nulligravida, multigravida), parity (nullipara, multipara), conception season (spring: March to May, summer: June to August, autumn: September to November, winter: December to February), gestational hypertension (yes, no), and infant sex (female, male). A natural cubic spline function with 3 degrees of freedom was used to model the potential non-linear relationships of temperature and dew point with GDM.
First, logistic regression models were used to analyze the associations between average trimester-specific O3 exposure and GDMA1 and GDMA2. Odds ratios (ORs) and 95% confidence interval were estimated for each 10 μg/m3 increase in O3. Subsequently, distributed lag nonlinear models (DLNMs) with logistic regression model were applied to investigate the nonlinear and lagged associations between O3 exposures and GDMA1 and GDMA2 [38,39]. Given that our preliminary analyses confirmed significant non-linear associations between O3 exposure and both GDMA1 and GDMA2, the exposure–response dimension of the cross-basis function in DLNMs was modeled using natural splines, with the optimal degrees of freedom selected based on the Akaike Information Criterion (AIC). The lag-response dimension was modeled using a natural cubic spline with 5 degrees of freedom [40]. The maximum lag was set at 40 weeks (from 12 weeks before pregnancy to 28 weeks) to estimate the lagged effects of O3 exposure during this period and to identify potential sensitive windows. The Class II concentration limits (160 μg/m3) of the National Environmental Quality Standard (GB3095-2012) were used as O3 reference value in DLNMs [41].
To explore the effect of temperature on the association between O3 and GDMA1 and GDMA2, a multiplicative interaction term of temperature and O3 was incorporated into the models. To investigate the health impacts of extreme temperature events (e.g., heatwaves), weekly average temperature was divided into three levels using the 10th and 90th percentiles as cut-off (specific cut-offs values are provided in Table S1), consistent with previous epidemiological studies evaluating extreme temperature effects [27,42,43]. Percentile-based thresholds were used because they account for local climatic conditions and population adaptation to temperature, rather than relying on fixed absolute temperature values. Subgroup analyses were performed to identify susceptible populations based on maternal age (<35/≥35 years), preconception overweight, gravidity, parity, family history of diabetes, and gestational hypertension. Differences between strata were assessed using the likelihood ratio test [36,44].
To evaluate the robustness of the results, the following sensitivity analyses were conducted: (1) the O3 reference concentration in the DLNMs was changed in the models to the Class I concentration limit (100 μg/m3); (2) maternal smoking and drinking were additionally adjusted for in the models; (3) two-pollutant models was constructed to assess the potential confounding effect of PM2.5; (4) different percentile cut-offs (25th and 75th percentile; 5th and 95th percentile) were used to define temperature levels when analyzing the effect modification of temperature; (5) investigate the effects of O3 exposure on GDMA1 and GDMA2 between the pre-pandemic period (2017–2019) and the pandemic period (2020–2023) in Tianjin, China. All statistical analyses were performed with R software (version 4.2.0) and two-sided p values < 0.05 were considered statistically significant.
3. Results
3.1. Characteristics of Participants
Table 1 presents the baseline characteristics of participants in this study. Among the 11,491 pregnant women included, 2323 (20.22%) were diagnosed with GDM, comprising 1984 (17.27%) with GDMA1 and 339 (2.95%) with GDMA2. Women with GDM were older than those without GDM, with mean ages of 32.6 years in the GDMA1 group, 33.2 years in the GDMA2 group, and 31.6 years in the non-GDM group. Women with GDM had higher rates of preconception overweight or obesity (BMI ≥ 24), gestational hypertension, and large for gestational age (LGA) compared to women without GDM. Women residing in rural areas had a higher proportion of GDM (both GDMA1 and GDMA2) than those in urban areas, and conception in summer or autumn was more common among GDM cases compared with non-GDM women.
Table 1.
Descriptive characteristics of the study population.
3.2. Distribution and Correlations of O3 Concentration and Meteorological Factors
Table S2 shows the distribution and correlation of O3 concentration and meteorological factors for trimester-specific exposure windows. The average O3 concentration and temperature in the preconception were slightly higher than those in other trimesters. Specifically, the average O3 concentrations were 105.55 μg/m3 (preconception), 102.93 μg/m3 (first trimester), 100.25 μg/m3 (second trimester), and 101.52 μg/m3 (from last menstrual period to 28 weeks of gestation), respectively. While average temperatures during the corresponding periods were 15.02 °C, 14.53 °C, 13.43 °C, and 13.95 °C. Spearman’s correlation analysis indicated a strong association between O3 and temperature within each trimester-specific exposure windows (r = 0.93), with a corresponding variance inflation factor of 7.4, which is moderately above the conventional threshold of 5 but well below 10. Given our primary interest in temperature as an effect modifier and the biological plausibility of their interaction, we retained both variables in the main models and further performed stratified analyses by temperature to evaluate the modification effects.
3.3. Associations of O3 Exposure with GDMA1 and GDMA2
Associations of trimester-specific O3 exposure with the risk of GDMA1 and GDMA2 are shown in Table 2. Without any adjustment, logistic regression analysis showed that preconception O3 exposure was associated with a small increase in GDMA1 risk. For each 10 μg/m3 increase in O3 concentration, the risk of GDMA1 increased by 1.7% (OR = 1.017, 95% CI: 1.006, 1.029). However, after adjusting for all covariates, O3 exposure showed no statistically significant association with GDMA1 and GDMA2 across any trimester-specific exposure windows.
Table 2.
Associations of trimester-specific O3 exposure with the risk of GDMA1 and GDMA2.
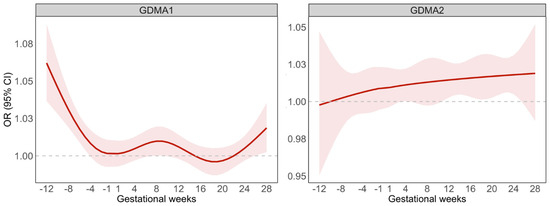
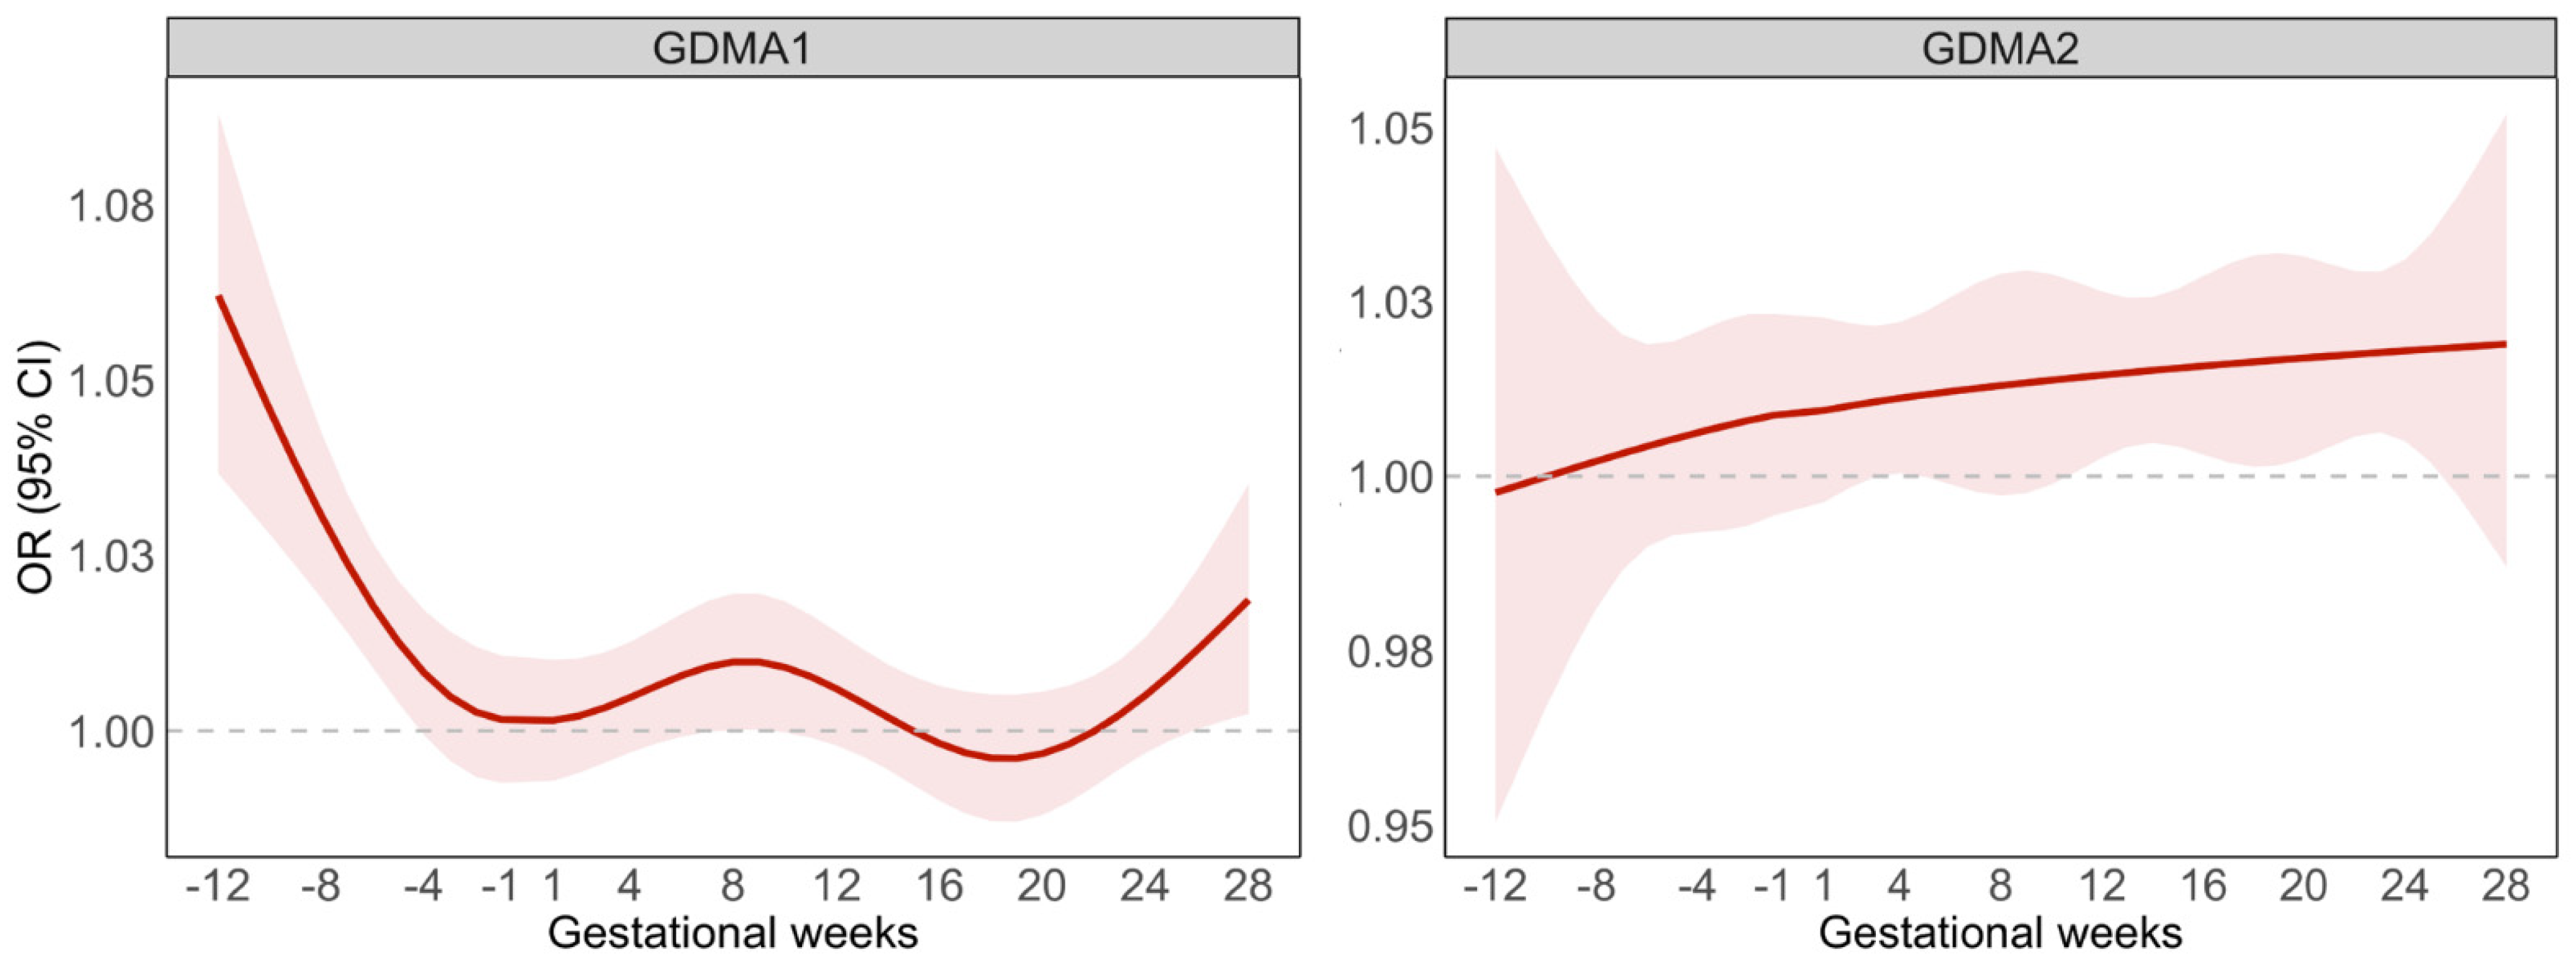
To further identify the sensitive exposure gestational weeks, we applied DLNMs to examine the weekly-specific associations of O3 exposure with GDMA1 and GDMA2 from 12 weeks before pregnancy to 28 weeks of gestation. The results are shown in Figure 2. For each 10 μg/m3 increase in O3 was statistically associated with a small increase in GDMA1 risk during 5–12 weeks before pregnancy and 26–28 weeks of gestation, with the largest effects observed at 12 weeks before pregnancy (OR = 1.062, 95% CI: 1.037, 1.088) and 28 weeks of gestation (OR = 1.019, 95% CI: 1.002, 1.035) (Table S3). The association gradually weakened as the exposure window moved closer to conception. In contrast, weak associations with GDMA2 were observed during 11–25 weeks of gestation, with the largest estimate at 25th weeks of gestation (OR = 1.018, 95% CI: 1.002, 1.035) (Table S3).
Figure 2.
Associations of week-specific O3 exposure with the risk of GDMA1 and GDMA2 during preconception 12 weeks to 28 weeks of gestation. Abbreviations: GDM, gestational diabetes mellitus; GDMA1, diet-controlled GDM; GDMA2, insulin-treated GDM; OR, odds ratio; 95% CI, 95% confidence interval. Note: Distributed lag non-linear models (DLNMs) incorporated with logistic regression was used to calculate adjusted ORs (95% CIs) each 10 μg/m3 increment in the concentrations of O3 at a weekly level over the preconception period and pregnancy. All models adjusted for maternal age, preconception BMI, educational level, occupation, gravidity, parity, conception season, gestational hypertension, newborn gender, and natural cubic splines with 3 degrees of freedom for ambient temperature and dew point. The red shadow indicate 95% confidence intervals.
3.4. Modification Effect of Ambient Temperature in O3 Exposure with GDMA1 and GDMA2
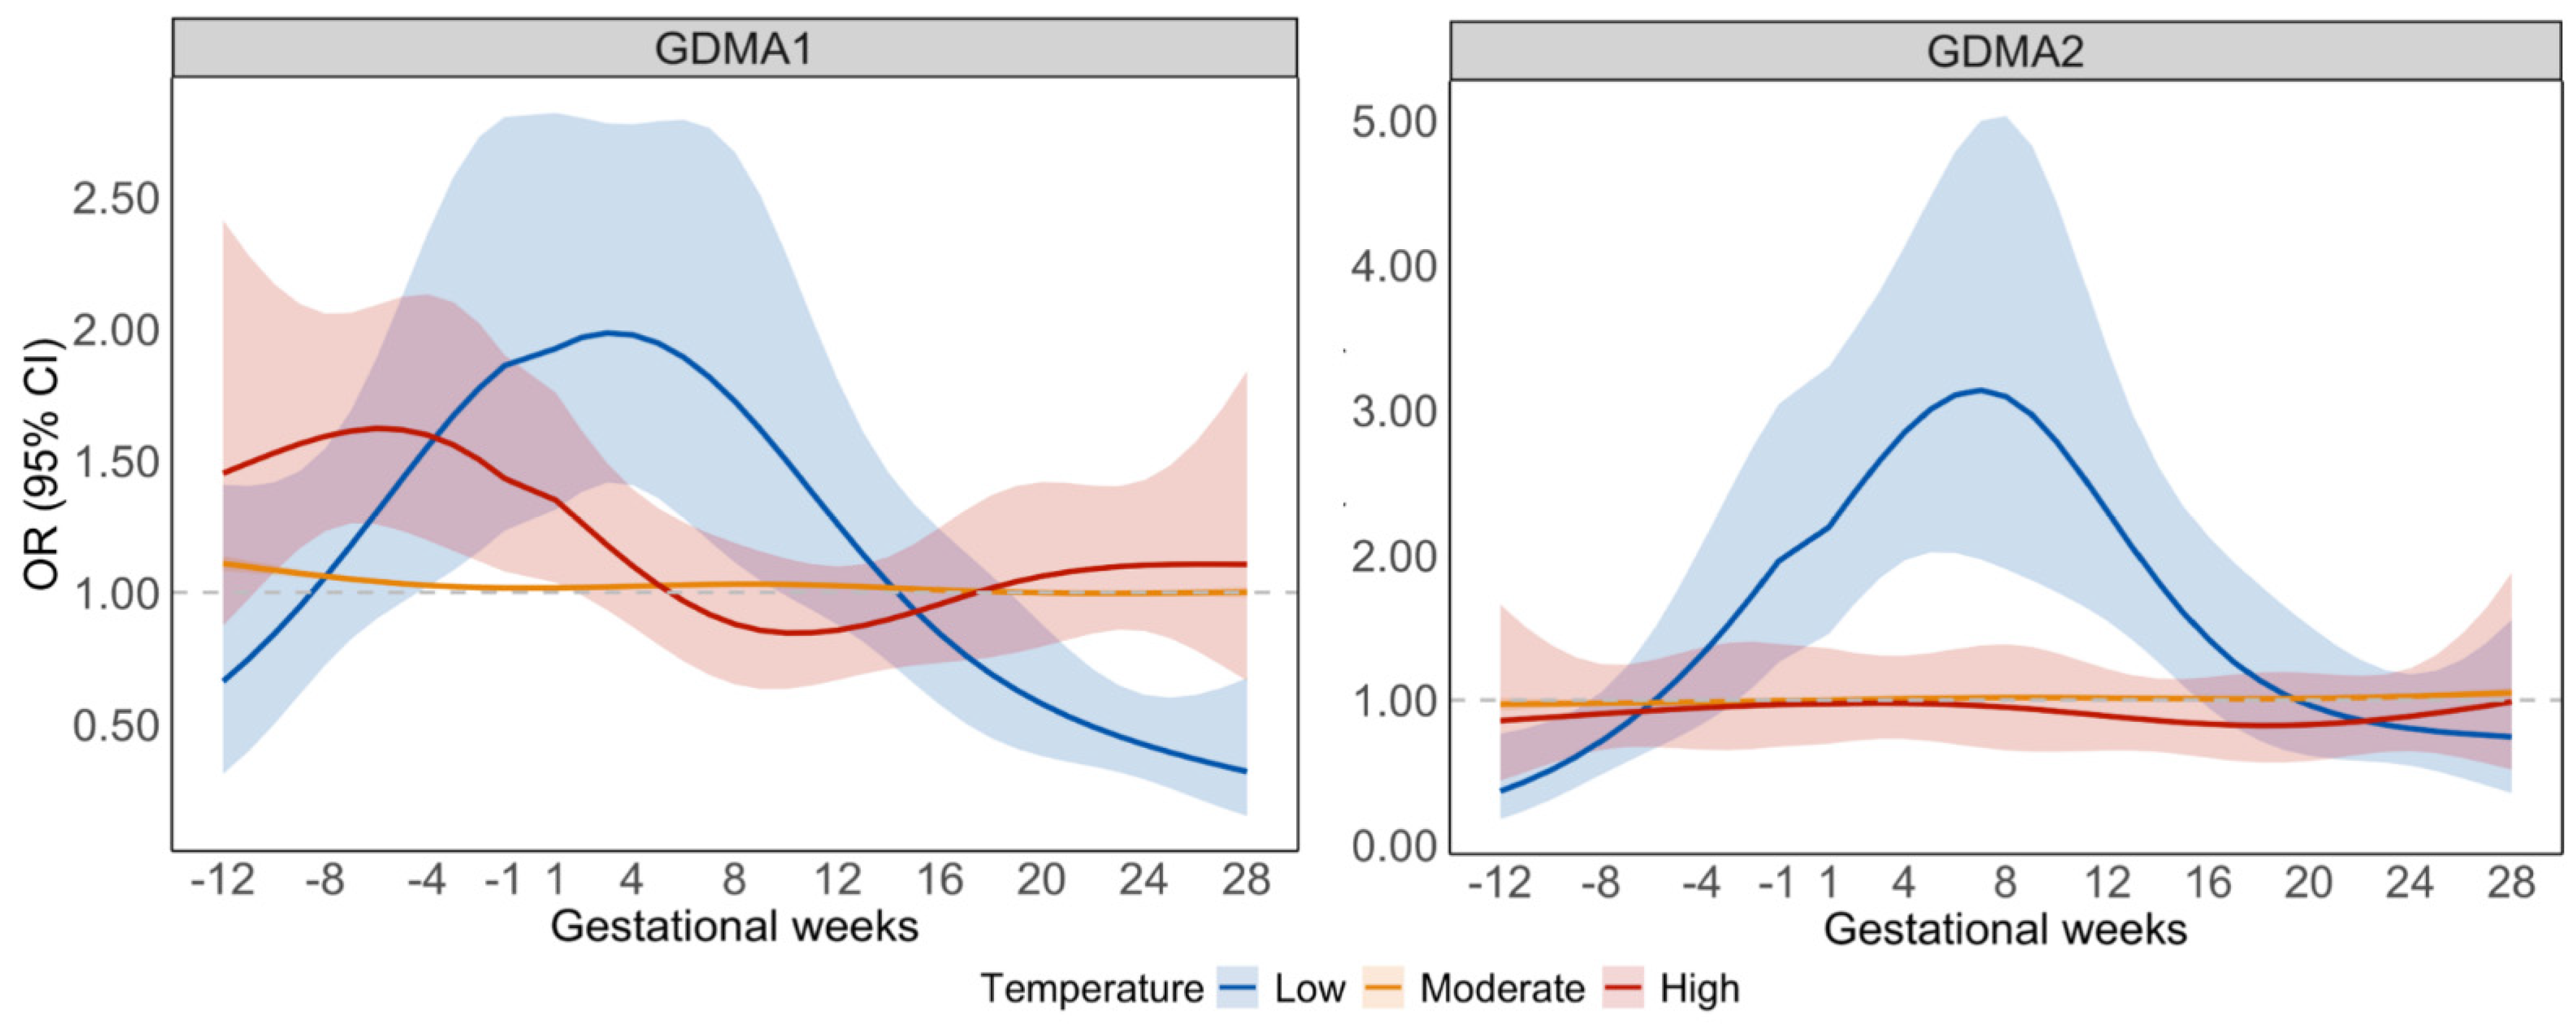
Figure 3 presents the modification effect of ambient temperature in O3 exposure with GDMA1 and GDMA2. The observed association of O3 on GDMA1 increased with rising temperature in 1–9 weeks before pregnancy (p for interaction < 0.05), with the largest effect modification observed at 6 weeks before pregnancy (Table S4). Specifically, under high temperature conditions (>90th percentiles), for every 10 μg/m3 increase in O3 concentration at 6 weeks before pregnancy, the risk of GDMA1 increased by 62.2% (OR = 1.622, 95% CI: 1.259, 2.091) (Table S4). Conversely, O3 exposure during the 1–15 weeks of pregnancy was positively associated with GDMA2 under low temperature conditions (<10th percentiles) (p for interaction < 0.05).
Figure 3.
Modification effect of ambient temperature on the association of O3 exposure with the risk of GDMA1 and GDMA2. Abbreviations: GDM, gestational diabetes mellitus; GDMA1, diet-controlled GDM; GDMA2, insulin-treated GDM; OR, odds ratio; 95% CI, 95% confidence interval. Note: Weekly average temperature was divided into three levels using the 10th and 90th percentiles. Distributed lag non-linear models (DLNMs) incorporated with logistic regression was used to calculate adjusted ORs (95% CIs) each 10 μg/m3 increment in the concentrations of O3 at a weekly level over the preconception period and pregnancy. All models adjusted for maternal age, preconception BMI, educational level, occupation, gravidity, parity, conception season, gestational hypertension, newborn gender, and natural cubic splines with 3 degrees of freedom for dew point.
3.5. Subgroup Analysis
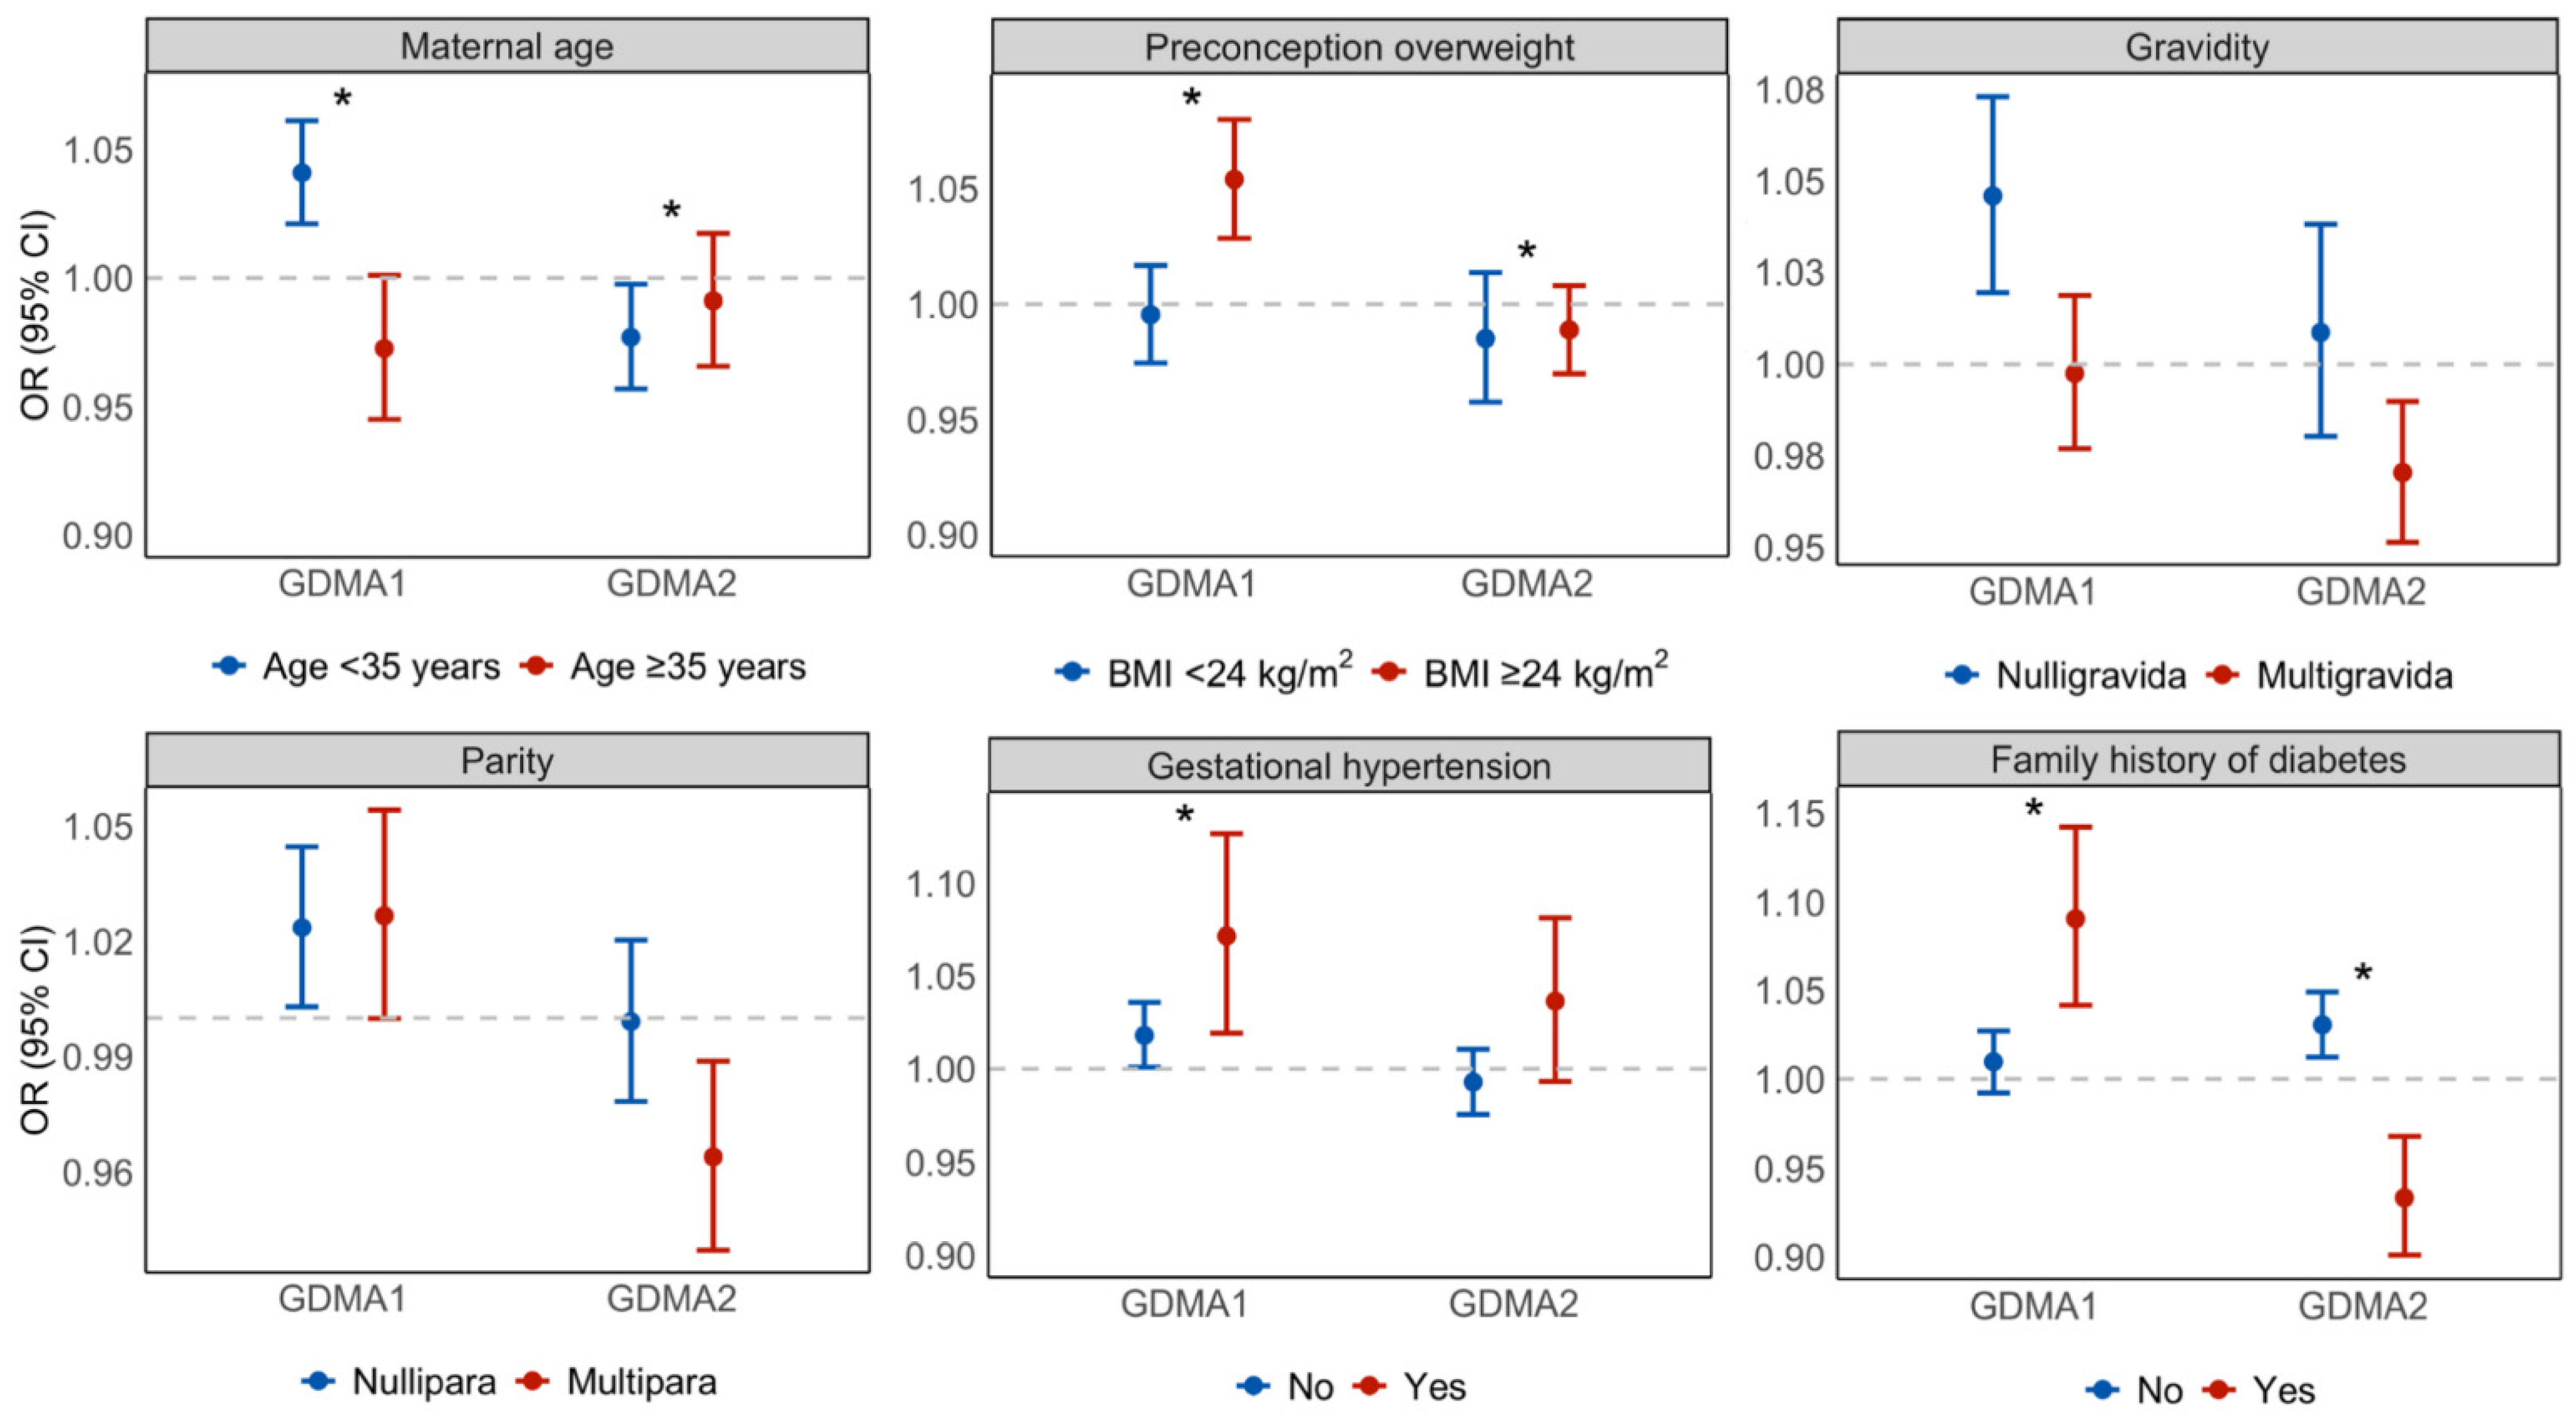
Subgroup analysis for the association of O3 exposure with the risk of GDMA1 and GDMA2 within the most sensitive windows are shown in Figure 4. The results indicated that maternal age, preconception obesity, gestational hypertension, and family history of diabetes may modify the association between preconception and gestational O3 and GDMA1 (p for interaction < 0.05) (Table S5). Specifically, each 10 μg/m3 increase in O3 at 28 weeks after pregnancy was associated with small increases in the odds of GDMA1 among women aged <35 years (OR = 1.041, 95% CI: 1.021, 1.061), those with preconception overweight (OR = 1.054, 95% CI: 1.029, 1.080), those with gestational hypertension (OR = 1.071, 95% CI: 1.019, 1.126), and those with family history of diabetes (OR = 1.091, 95% CI: 1.042, 1.142) (Table S5). Conversely, each 10 μg/m3 increase in O3 at 25 weeks of gestation was associated with an increased risk of GDMA2 in women without family history of diabetes (OR = 1.031, 95% CI: 1.012, 1.049) (Table S5).
Figure 4.
Subgroup analysis for the association of O3 exposure with the risk of GDMA1 and GDMA2. Abbreviations: GDM, gestational diabetes mellitus; GDMA1, diet-controlled GDM; GDMA2, insulin-treated GDM; OR, odds ratio; 95% CI, 95% confidence interval. Note: Results at the most sensitive (with the highest effect estimates) windows of O3 exposure for GDMA1 (28th week after pregnancy) and GDMA2 (25th week after pregnancy) were selected for result presentation. All models adjusted for maternal age, preconception BMI, educational level, occupation, gravidity, parity, conception season, gestational hypertension, newborn gender, and natural cubic splines with 3 degrees of freedom for ambient temperature and dew point (except for the stratification variables). * p for interaction < 0.05. The dashed line is the reference line at OR = 1.
3.6. Sensitivity Analysis
Sensitivity analyses indicated that the main findings were generally robust (Tables S6–S10). After adjusting the reference concentration of O3 in the DLNMs to the primary concentration limit (100 μg/m3), the association between O3 exposure and GDMA1 weakened during few gestational weeks, while its effect on GDMA2 remained broadly consistent (Table S6). When additionally adjusting for maternal smoking and drinking or including PM2.5 to construct a two-pollutant model, the associations of preconception and gestational O3 exposure with GDMA1 and GDMA2 remained consistent, with the most sensitive gestational weeks aligning with the main results (Tables S7 and S8). When temperature was categorized using different percentile cut-offs, with 25th and 75th percentile as the cut-off, the adverse effect of O3 on GDMA1 was only observed to increase with rising temperature during gestation but not preconception (Table S9). With 5th and 95th percentile as the cut-off, the modification effect of ambient temperature on the association between O3 exposure and the risk of GDMA1 remained generally consistent with the main results (Table S10). Compared with the pre-COVID-19 pandemic period, ambient O3 concentrations decreased during the pandemic. The effect estimates of O3 exposure on GDMA1 and GDMA2 were attenuated in the pandemic period. No statistically significant association was found between O3 exposure and GDMA1, whereas weak but statistically significant associations remained for GDMA2 during the 11–25 weeks of gestation window (Table S11).
4. Discussion
In this retrospective cohort study of 11,491 Chinese pregnant women, we evaluated the associations between preconception and gestational ambient O3 exposure and different clinical classifications of GDM and explored the effect modification by ambient temperature. We observed 5–12 weeks before pregnancy and 26–28 gestational weeks as sensitive windows where O3 exposure was weakly and statistically associated with small increases in GDMA1 risk, and 11–25 gestational weeks for GDMA2. However, no statistical association was observed between trimester-specific O3 exposure and GDMA1 or GDMA2. Furthermore, ambient temperature appeared to modify the association between O3 exposure and GDMA1, with high temperatures strengthening the observed association between preconception O3 exposure on GDMA1. Additionally, we found that gestational O3 exposure was associated with a higher risk of GDMA1 among women under 35 years of age, preconception obesity, gestational hypertension, and family history of diabetes.
Our results showed that preconception O3 exposure was associated with an increased risk of GDMA1 when the model was unadjusted. However, no statistical associations were observed for any trimester-specific after full adjustment for covariates. Currently, several studies have investigated the relationship between O3 exposure and GDM, but their results and identified sensitive windows are inconsistent. For instance, two cohort studies conducted in China reported that the preconception and first-trimester were sensitive windows associated with GDM [17,19], while Zhang et al. reported increased GDM risk associated with O3 exposure during the first two trimesters [10]. Evidence from large US cohort studies has also been inconsistent. One electronic medical record-based cohort study reported that O3 exposure appeared to increase GDM risk in association with second trimester exposure, but not during preconception or earlier pregnancy windows [14]. In contrast, another large US cohort study reported inverse associations between preconception and first trimester O3 exposure and GDM risk [15]. However, a cohort study by Yan et al. in China reported no significant statistical association between O3 exposure and GDM across different trimester-specific periods in the single-pollutant model [45], which is consistent with our trimester-specific findings. Although that study also reported significant associations in two-pollutant models involving PM2.5 and gaseous pollutants, suggesting that the air pollution–GDM relationship may be influenced by multipollutant exposure patterns and model specifications. The discrepant findings between our study and previous research may be related to two key factors. First, unlike most studies that treat GDM as a homogeneous disease outcome, our investigation distinguished between clinical classifications (GDMA1 and GDMA2), suggesting potential differential effects of O3 exposure according to GDM severity. Second, although our study included 11,491 pregnant women, the statistical power remained limited when analyzing GDM classifications, particularly for the less prevalent GDMA2 group (2.95%). Future studies with larger sample sizes and refined disease classifications are therefore warranted to obtain more robust and precise estimates.
We further employed DLNM combined with logistic regression to identify susceptible gestational weeks to O3 exposure in pregnant women. DLNM suggested 5–12 weeks preconception and 26–28 gestational weeks as sensitive windows for increased GDMA1 risk, and 11–25 gestational weeks for GDMA2. Compared with conventional logistic regression, DLNMs more accurately captured exposure response relationships and yielded distinct results, likely because traditional models fail to account for the complex lag patterns of O3 effects and are susceptible to multicollinearity in exposure data [38]. Studies applying DLNMs to investigate sensitive windows for O3 exposure and GDM remain limited [10,18,46]. A Canadian cohort study reported that O3 exposure during 1–10 weeks preconception and 9–28 gestational weeks was associated with increased GDM risk [46], which aligns closely with our findings. Given these findings, future studies should adopt DLNMs to further validate weekly-specific associations between O3 exposure and GDM classifications. Targeted interventions during identified sensitive windows and development of staged, personalized O3 protection strategies for susceptible populations are warranted. Furthermore, although the observed ORs per 10 μg/m3 increase in O3 exposure were statistically significant, their magnitudes were small. Therefore, these findings should be interpreted cautiously, as they may be susceptible to statistical noise, residual confounding, and exposure measurement error. Rather than indicating a strong individual-level effect, these results suggest a weak association that requires confirmation in future studies.
The precise mechanisms underlying the association between O3 exposure and the development of GDM have not been elucidated. Current evidence suggests that O3 may contribute to the disease process through multiple pathways. As a potent oxidizing pollutant, O3 may induce the generation of substantial reactive oxygen species (ROS) in the lungs, thereby potentially triggering oxidative stress and contributing to hepatic insulin resistance [47,48]. Experimental evidence suggests that O3 exposure may impair glucose metabolism by inducing oxidative stress and endoplasmic reticulum stress in skeletal muscle, followed by activation of c-Jun N-terminal kinase (JNK). This pathway may disrupt insulin signaling and contribute to insulin resistance [10,48]. This pathological cascade may provide a possible biological explanation for GDMA1, characterized predominantly by insulin resistance with preserved pancreatic β-cell function [49]. The persistence of this state may further compromise β-cell function through systemic inflammation and oxidative stress, potentially limiting insulin secretion and thereby contributing to inadequate compensation for the rising insulin demands of pregnancy, which may promote progression to the insulin-requiring GDMA2 [9,50]. Therefore, further molecular and cellular studies are urgently needed to validate these hypothesized mechanisms and elucidate the impact of O3 exposure on different GDM classifications.
Notably, our study suggests that ambient temperature, especially high temperature may modify the association between O3 exposure and the risk of GDMA1. For a given level of O3 exposure, higher preconception temperature was associated with a significantly increased risk of GDMA1. Consistently, a cohort study conducted in China reported that O3 exposure during the preconception and first trimester was associated with an elevated risk of GDM in warm seasons but not in cold seasons. Although that study adjusted for temperature only as a confounder without evaluating its potential effect modification [19]. Several biological pathways may underlie the joint effects of O3 and high temperature. Pregnancy is especially susceptible to O3-induced inflammatory responses, given its reliance on immune tolerance, vascular adaptation, and placental function [51,52]. High temperatures may enhance the uptake and tissue penetration of O3 by increasing respiratory rate, promoting vasodilation, and altering blood flow velocity [53]. And heat stress itself may act synergistically with O3-induced oxidative stress, potentially exacerbating insulin resistance [54,55]. Ambient O3-related and temperature-modified adverse reproductive and pregnancy outcomes may differ by exposure window because the vulnerable biological systems change across reproductive stages. Biologically, the preconception period represents a critical window for oocyte maturation and embryo implantation. O3-induced oxidative stress and systemic inflammation may impair gamete quality or disrupt early epigenetic programming, thereby contributing to subsequent metabolic dysfunction during pregnancy [56,57]. During the second trimester, elevated maternal basal metabolic rate and accelerated fetal growth exacerbate glucose metabolic disorders and insulin resistance, potentially enhancing susceptibility to environmental exposures [58]. This timing-specific pattern is consistent with our finding that temperature modification was most pronounced for preconception O3 exposure and GDMA1, rather than uniformly across all gestational windows or GDM classifications.
Global climate change is expected to increase the frequency, intensity and duration of extreme weather events (such as heatwaves), rising temperatures may intensify the adverse health effects of O3 exposure [26]. This potential synergistic effect between high temperature and O3 suggests that more stringent air quality standards may be necessary in warmer climates or during warm seasons to ensure adequate public health protection. Furthermore, pregnant women should be reducing outdoor activities during periods of concurrently high temperature and O3 concentration to lower exposure risks and related adverse health outcomes.
Our analysis identified that pregnant women under 35 years of age, with preconception obesity, gestational hypertension, and family history of diabetes appeared more susceptible to increased risk of GDMA1 when exposed to O3. Contrary to the conventional understanding that advanced maternal age represents an independent risk factor for GDM, we observed that younger women (<35 years) showed a higher susceptibility to O3-associated GDMA1 than older individuals. Age-related heterogeneity in the association between air pollution and GDM has been reported in previous study. For example, a Massachusetts cohort study found that second trimester PM2.5 exposure was associated with GDM only in the youngest maternal age stratum [59]. Our finding may reflect potential age-related susceptibility or differences in baseline metabolic risk, although the underlying mechanism remains uncertain and should be further examined in studies with detailed behavioral and biological data. O3 may act synergistically with pre-existing chronic low-grade inflammation and elevated adipokines to promote insulin resistance in women with preconception obesity [60]. Among those with gestational hypertension, O3-induced oxidative stress could exacerbate endothelial dysfunction, thereby potentially impairing insulin signaling and glucose homeostasis [61,62]. Furthermore, pregnant women with family history of diabetes may carry genetic susceptibility genes and may have potential defects such as insufficient pancreatic β-cell function reserve or reduced insulin sensitivity [4,63]. O3 may act as an environmental stressor that could accelerate the transition from prediabetes to GDM. Inversely, we observed a negative association between O3 exposure and GDMA2 in pregnant women with a family history of diabetes. This sign reversal lacks a clear biological explanation and may reflect unstable subgroup estimates, residual confounding, exposure measurement error, or unmeasured differences in clinical management. Women with GDMA2 generally may require pharmacotherapy because glycemic targets are not achieved with lifestyle management, and more intensive antenatal surveillance [3,64]. However, information on glycemic management intensity, antenatal visit frequency, and post-diagnosis behavioral changes was unavailable in our dataset. Future studies should integrate ambient pollution monitoring with lifestyle data to develop targeted O3 protective guidelines for high-risk pregnant women.
This study has several notable strengths. First, to our knowledge, it is the first to examine the associations between preconception and gestational O3 exposure and distinct clinical classifications of GDM. Second, we investigated the modifying effect of ambient temperature on the O3–GDM classifications associations, suggesting that high temperatures may amplify the adverse effect of preconception O3 exposure on GDMA1 risk. Third, we used DLNMs to assess week-specific O3 effects on GDMA1 and GDMA2, thereby identifying non-linear exposure response relationships and critical windows. Finally, we identified subgroups that were particularly susceptible to O3 exposure, including woman under 35 years of age, those with preconception obesity, gestational hypertension, and family history of diabetes, underscoring the necessity of targeted interventions for vulnerable populations.
Several limitations of this study should also be mentioned. First, the relatively low incidence of GDMA2 limited the statistical power, particularly in subgroup analyses. In addition, because multiple weekly-specific and stratified estimates were examined, and no formal multiple comparison correction was applied, some statistically significant findings may have occurred by chance and should be interpreted cautiously. Second, as a single-center study, the generalizability of our findings to other regions or countries may be limited, as environmental conditions (e.g., O3 levels and climate patterns), healthcare practices, and GDM screening/management protocols may differ substantially across populations. Third, the spatial resolution of O3 exposure (10 km) may not adequately capture finer-scale concentration variations, and the lack of indoor O3 measurements or individual activity patterns (such as commuting behavior and time spent indoors) further limited the precision of individual exposure assessment. Finally, several potentially important factors, including genetic susceptibility, dietary habits, and geographical variations, may influence the risk of GDM and potentially modify the association between ozone exposure and GDM. However, due to the lack of detailed individual-level genetic and dietary information, as well as limited geographical data, we were unable to further assess these factors in the present study. Future studies with more comprehensive individual and contextual information are warranted to clarify their potential roles.
5. Conclusions
In summary, this study did not find statistically significant associations in the fully adjusted trimester-specific models, but the weekly-specific DLNM analyses suggested weak associations between maternal O3 exposure and GDMA1 and GDMA2 during several potential sensitive windows. High temperatures appeared to strengthen the observed association between preconception O3 exposure and GDMA1. Given the small effect sizes in several weekly specific estimates, these findings should be interpreted cautiously and validated in future studies. These results suggest that O3 exposure protection may need to consider different clinical classifications and potential sensitive windows, while the modifying role of ambient temperature may be considered in health risk assessments of O3-related GDM.
Supplementary Materials
The following supporting information can be downloaded at: https://www.mdpi.com/article/10.3390/toxics14070622/s1, Figure S1: The inclusion and exclusion process of the study population; Table S1: Weekly ambient temperature cutoffs from 12 weeks before pregnancy to 28 weeks of gestation; Table S2: Distribution and correlations of O3 and meteorological variables at different exposure windows; Table S3: Associations of week-specific O3 exposure with the risk of GDMA1 and GDMA2 from 12 weeks before pregnancy to 28 weeks of gestation; Table S4: Modification effect of ambient temperature on the association of O3 exposure with the risk of GDMA1 and GDMA2; Table S5: Subgroup analysis for the association of O3 exposure with the risk of GDMA1 and GDMA2 within the most sensitive preconception and pregnancy exposure windows; Table S6: Sensitivity analysis of the association of O3 exposure with the risk of GDMA1 and GDMA2 using the Class I concentration limits (100 μg/m3) of GB3095-2012 as the reference in DLNM models; Table S7: Sensitivity analysis of the association of O3 exposure with the risk of GDMA1 and GDMA2, with further adjustments of maternal smoking and drinking covariates; Table S8: Sensitivity analysis of the association of O3 exposure with the risk of GDMA1 and GDMA2 in two-pollutant models; Table S9: Sensitivity analysis of modification effect of ambient temperature (stratified by the 25th and 75th percentiles) on the association of O3 exposure with the risk of GDMA1 and GDMA2; Table S10: Sensitivity analysis of modification effect of ambient temperature (stratified by the 5th and 95th percentiles) on the association of O3 exposure with the risk of GDMA1 and GDMA2; Table S11: Sensitivity analysis of effects of O3 exposure on GDMA1 and GDMA2 between the pre-pandemic period (2017–2019) and the pandemic period (2020–2023).
Author Contributions
Y.Y. and S.H. conceptualized the study, conducted analyses, created visualizations, and drafted and revised the manuscript. Y.L., Y.W., Q.Z. and S.N. contributed to data curation and investigation. Q.L. contributed to visualization. C.L. contributed to validation. L.G. and C.H. supervised the project, contributed to funding acquisition, and revised the manuscript. All authors have read and agreed to the published version of the manuscript.
Funding
This work was supported by the Beijing–Tianjin–Hebei Basic Research Collaboration Project (22JCZXJC00160), the Tianjin public health science and technology major special project (24ZXGZSY00070), the Natural Science Foundation of Zhejiang Province (LTGY24H040004), and the National Natural Science Foundation of China (82103965, 82304268).
Institutional Review Board Statement
This study was approved by the Ethics Committee of Tianjin Medical University General Hospital (Approval No: IRB2024-YX-101-01, 28 March 2024).
Informed Consent Statement
Informed consent was obtained from all subjects involved in the study.
Data Availability Statement
The raw data supporting the conclusions of this article will be made available by the authors on request.
Conflicts of Interest
The authors declare no conflicts of interest.
References
- Sweeting, A.; Hannah, W.; Backman, H.; Catalano, P.; Feghali, M.; Herman, W.H.; Hivert, M.F.; Immanuel, J.; Meek, C.; Oppermann, M.L.; et al. Epidemiology and management of gestational diabetes. Lancet 2024, 404, 175–192. [Google Scholar] [CrossRef] [Scilit] [PubMed]
- Wang, H.; Li, N.; Chivese, T.; Werfalli, M.; Sun, H.; Yuen, L.; Hoegfeldt, C.A.; Elise Powe, C.; Immanuel, J.; Karuranga, S.; et al. IDF Diabetes Atlas: Estimation of Global and Regional Gestational Diabetes Mellitus Prevalence for 2021 by International Association of Diabetes in Pregnancy Study Group’s Criteria. Diabetes Res. Clin. Pract. 2022, 183, 109050. [Google Scholar] [CrossRef] [Scilit] [PubMed]
- Barrozo, E.R.; Racusin, D.A.; Jochum, M.D.; Garcia, B.T.; Suter, M.A.; Delbeccaro, M.; Shope, C.; Antony, K.; Aagaard, K.M. Discrete placental gene expression signatures accompany diabetic disease classifications during pregnancy. Am. J. Obstet. Gynecol. 2025, 232, 326.e1–326.e15. [Google Scholar] [CrossRef] [Scilit] [PubMed]
- Gu, Y.; Zheng, H.; Wang, P.; Liu, Y.; Guo, X.; Wei, Y.; Yang, Z.; Cheng, S.; Chen, Y.; Hu, L.; et al. Genetic architecture and risk prediction of gestational diabetes mellitus in Chinese pregnancies. Nat. Commun. 2025, 16, 4178. [Google Scholar] [CrossRef] [Scilit] [PubMed]
- Jung, E.; Romero, R.; Yeo, L.; Gomez-Lopez, N.; Chaemsaithong, P.; Jaovisidha, A.; Gotsch, F.; Erez, O. The etiology of preeclampsia. Am. J. Obstet. Gynecol. 2022, 226, S844–S866. [Google Scholar] [CrossRef] [Scilit] [PubMed]
- Ye, W.; Luo, C.; Huang, J.; Li, C.; Liu, Z.; Liu, F. Gestational diabetes mellitus and adverse pregnancy outcomes: Systematic review and meta-analysis. BMJ 2022, 377, e067946. [Google Scholar] [CrossRef] [Scilit] [PubMed]
- Hildén, K.; Magnuson, A.; Montgomery, S.; Schwarcz, E.; Hanson, U.; Simmons, D.; Backman, H. Previous pre-eclampsia, gestational diabetes mellitus and the risk of cardiovascular disease: A nested case-control study in Sweden. BJOG 2023, 130, 1209–1216. [Google Scholar] [CrossRef] [Scilit] [PubMed]
- Lowe, W.L., Jr.; Lowe, L.P.; Kuang, A.; Catalano, P.M.; Nodzenski, M.; Talbot, O.; Tam, W.H.; Sacks, D.A.; McCance, D.; Linder, B.; et al. Maternal glucose levels during pregnancy and childhood adiposity in the Hyperglycemia and Adverse Pregnancy Outcome Follow-Up Study. Diabetologia 2019, 62, 598–610. [Google Scholar] [CrossRef] [Scilit] [PubMed]
- Zygula, A.; Kosinski, P.; Zwierzchowska, A.; Sochacka, M.; Wroczynski, P.; Makarewicz-Wujec, M.; Pietrzak, B.; Wielgos, M.; Rzentala, M.; Giebultowicz, J. Oxidative stress markers in saliva and plasma differ between diet-controlled and insulin-controlled gestational diabetes mellitus. Diabetes Res. Clin. Pract. 2019, 148, 72–80. [Google Scholar] [CrossRef] [Scilit] [PubMed]
- Zhang, L.; Wang, P.; Zhou, Y.; Cheng, Y.; Li, J.; Xiao, X.; Yin, C.; Li, J.; Meng, X.; Zhang, Y. Associations of ozone exposure with gestational diabetes mellitus and glucose homeostasis: Evidence from a birth cohort in Shanghai, China. Sci. Total Environ. 2023, 857, 159184. [Google Scholar] [CrossRef] [Scilit] [PubMed]
- Murray, C.J.; Aravkin, A.Y.; Zheng, P.; Abbafati, C.; Abbas, K.M.; Abbasi-Kangevari, M.; Abd-Allah, F.; Abdelalim, A.; Abdollahi, M.; Abdollahpour, I.; et al. Global burden of 87 risk factors in 204 countries and territories, 1990-2019: A systematic analysis for the Global Burden of Disease Study 2019. Lancet 2020, 396, 1223–1249. [Google Scholar] [CrossRef] [Scilit]
- Huang, J.; Pan, X.; Guo, X.; Li, G. Health impact of China’s Air Pollution Prevention and Control Action Plan: An analysis of national air quality monitoring and mortality data. Lancet Planet. Health 2018, 2, e313–e323. [Google Scholar] [CrossRef] [Scilit] [PubMed]
- Gong, Z.; Yue, H.; Li, Z.; Bai, S.; Cheng, Z.; He, J.; Wang, H.; Li, G.; Sang, N. Association between maternal exposure to air pollution and gestational diabetes mellitus in Taiyuan, North China. Sci. Total Environ. 2023, 875, 162515. [Google Scholar] [CrossRef] [Scilit] [PubMed]
- Robledo, C.A.; Mendola, P.; Yeung, E.; Männistö, T.; Sundaram, R.; Liu, D.; Ying, Q.; Sherman, S.; Grantz, K.L. Preconception and early pregnancy air pollution exposures and risk of gestational diabetes mellitus. Environ. Res. 2015, 137, 316–322. [Google Scholar] [CrossRef] [Scilit] [PubMed]
- Jo, H.; Eckel, S.P.; Chen, J.C.; Cockburn, M.; Martinez, M.P.; Chow, T.; Lurmann, F.; Funk, W.E.; McConnell, R.; Xiang, A.H. Associations of gestational diabetes mellitus with residential air pollution exposure in a large Southern California pregnancy cohort. Environ. Int. 2019, 130, 104933. [Google Scholar] [CrossRef] [Scilit] [PubMed]
- Lin, Q.; Zhang, S.; Liang, Y.; Wang, C.; Wang, C.; Wu, X.; Luo, C.; Ruan, Z.; Acharya, B.K.; Lin, H.; et al. Ambient air pollution exposure associated with glucose homeostasis during pregnancy and gestational diabetes mellitus. Environ. Res. 2020, 190, 109990. [Google Scholar] [CrossRef] [Scilit] [PubMed]
- Yao, M.; Liu, Y.; Jin, D.; Yin, W.; Ma, S.; Tao, R.; Tao, F.; Zhu, P. Relationship between temporal distribution of air pollution exposure and glucose homeostasis during pregnancy. Environ. Res. 2020, 185, 109456. [Google Scholar] [CrossRef] [Scilit] [PubMed]
- Niu, Z.; Habre, R.; Yang, T.; Grubbs, B.H.; Eckel, S.P.; Toledo-Corral, C.M.; Johnston, J.; Dunton, G.F.; Lurvey, N.; Al-Marayati, L.; et al. Preconceptional and prenatal exposure to air pollutants and risk of gestational diabetes in the MADRES prospective pregnancy cohort study. Lancet Reg. Health Am. 2023, 25, 100575. [Google Scholar] [CrossRef] [Scilit] [PubMed]
- Liu, W.Y.; Lu, J.H.; He, J.R.; Zhang, L.F.; Wei, D.M.; Wang, C.R.; Xiao, X.; Xia, H.M.; Qiu, X. Combined effects of air pollutants on gestational diabetes mellitus: A prospective cohort study. Environ. Res. 2022, 204, 112393. [Google Scholar] [CrossRef] [Scilit] [PubMed]
- Zhang, H.; Wang, Q.; He, S.; Wu, K.; Ren, M.; Dong, H.; Di, J.; Yu, Z.; Huang, C. Ambient air pollution and gestational diabetes mellitus: A review of evidence from biological mechanisms to population epidemiology. Sci. Total Environ. 2020, 719, 137349. [Google Scholar] [CrossRef] [Scilit] [PubMed]
- Zhu, Y.; Ma, Y.; Tang, L.; Li, H.; Miao, C.; Cao, H.; Tian, Y. The adverse impact of maternal ozone exposure on fetal growth in utero and the interaction with residential greenness. J. Hazard. Mater. 2024, 461, 132562. [Google Scholar] [CrossRef] [Scilit] [PubMed]
- Hu, X.; Han, W.; Wang, Y.; Aunan, K.; Pan, X.; Huang, J.; Li, G. Does air pollution modify temperature-related mortality? A systematic review and meta-analysis. Environ. Res. 2022, 210, 112898. [Google Scholar] [CrossRef] [Scilit] [PubMed]
- Qian, N.; Xu, R.; Wei, Y.; Li, Z.; Wang, Z.; Guo, C.; Zhu, X.; Peng, J.; Qian, Y. Influence of temperature on the risk of gestational diabetes mellitus and hypertension in different pregnancy trimesters. Sci. Total Environ. 2023, 899, 165713. [Google Scholar] [CrossRef] [Scilit] [PubMed]
- Molina-Vega, M.; Gutiérrez-Repiso, C.; Muñoz-Garach, A.; Lima-Rubio, F.; Morcillo, S.; Tinahones, F.J.; Picón-César, M.J. Relationship between environmental temperature and the diagnosis and treatment of gestational diabetes mellitus: An observational retrospective study. Sci. Total Environ. 2020, 744, 140994. [Google Scholar] [CrossRef] [Scilit] [PubMed]
- Teyton, A.; Sun, Y.; Molitor, J.; Chen, J.C.; Sacks, D.; Avila, C.; Chiu, V.; Slezak, J.; Getahun, D.; Wu, J.; et al. Examining the Relationship Between Extreme Temperature, Microclimate Indicators, and Gestational Diabetes Mellitus in Pregnant Women Living in Southern California. Environ. Epidemiol. 2023, 7, e252. [Google Scholar] [CrossRef] [Scilit] [PubMed]
- Tong, M.; Wang, M.; Li, P.; Gong, J.; Zhu, T.; Xue, T. The short-term effect of ozone on pregnancy loss modified by temperature: Findings from a nationwide epidemiological study in the contiguous United States. Sci. Total Environ. 2023, 902, 166088. [Google Scholar] [CrossRef] [Scilit] [PubMed]
- Wu, B.; Wang, T.; Zhang, Y.; Li, Y.; Kong, C.; Jiang, Y.; Song, X.; Chen, X.; Xie, Z.; Ye, H.; et al. Association of ambient ozone with time to pregnancy and the modifying effect of ambient temperature: A population-based cohort study. Environ. Pollut. 2025, 374, 126269. [Google Scholar] [CrossRef] [Scilit] [PubMed]
- Klompmaker, J.O.; Hart, J.E.; James, P.; Sabath, M.B.; Wu, X.; Zanobetti, A.; Dominici, F.; Laden, F. Air pollution and cardiovascular disease hospitalization—Are associations modified by greenness, temperature and humidity? Environ. Int. 2021, 156, 106715. [Google Scholar] [CrossRef] [Scilit] [PubMed]
- Chen, K.; Wolf, K.; Breitner, S.; Gasparrini, A.; Stafoggia, M.; Samoli, E.; Andersen, Z.J.; Bero-Bedada, G.; Bellander, T.; Hennig, F.; et al. Two-way effect modifications of air pollution and air temperature on total natural and cardiovascular mortality in eight European urban areas. Environ. Int. 2018, 116, 186–196. [Google Scholar] [CrossRef] [Scilit] [PubMed]
- Yu, Y.; Fan, W.; Ni, J.; Gao, X.; Li, W.; Zheng, J.; Zhang, H.; Chen, J.; Liu, Q.; Lin, Z.; et al. Maternal placental growth factor mediates the association between PM2.5 and its constituents with adverse pregnancy outcomes. J. Hazard. Mater. 2025, 497, 139598. [Google Scholar] [CrossRef] [Scilit] [PubMed]
- Metzger, B.E.; Gabbe, S.G.; Persson, B.; Buchanan, T.A.; Catalano, P.A.; Damm, P.; Dyer, A.R.; Leiva, A.; Hod, M.; Kitzmiler, J.L.; et al. International association of diabetes and pregnancy study groups recommendations on the diagnosis and classification of hyperglycemia in pregnancy. Diabetes Care 2010, 33, 676–682. [Google Scholar] [CrossRef] [Scilit] [PubMed]
- Zhou, X.; Zhang, R.; Jiang, S.; Cheng, D.; Wu, H. Analysis glycemic variability in pregnant women with various type of hyperglycemia. BMC Pregnancy Childbirth 2025, 25, 454. [Google Scholar] [CrossRef] [Scilit] [PubMed]
- Abokaf, H.; Shoham-Vardi, I.; Sergienko, R.; Landau, D.; Sheiner, E. In utero exposure to gestational diabetes mellitus and long term endocrine morbidity of the offspring. Diabetes Res. Clin. Pract. 2018, 144, 231–235. [Google Scholar] [CrossRef] [Scilit] [PubMed]
- Xiao, Q.; Geng, G.; Xue, T.; Liu, S.; Cai, C.; He, K.; Zhang, Q. Tracking PM2.5 and O3 Pollution and the Related Health Burden in China 2013–2020. Environ. Sci. Technol. 2022, 56, 6922–6932. [Google Scholar] [PubMed]
- Xue, T.; Zheng, Y.; Geng, G.; Xiao, Q.; Meng, X.; Wang, M.; Li, X.; Wu, N.; Zhang, Q.; Zhu, T. Estimating Spatiotemporal Variation in Ambient Ozone Exposure during 2013–2017 Using a Data-Fusion Model. Environ. Sci. Technol. 2020, 54, 14877–14888. [Google Scholar] [CrossRef] [Scilit] [PubMed]
- Chen, J.; Guo, L.; Liu, H.; Jin, L.; Meng, W.; Fang, J.; Zhao, L.; Zeng, X.W.; Yang, B.Y.; Wang, Q.; et al. Modification effects of ambient temperature on associations of ambient ozone exposure before and during pregnancy with adverse birth outcomes: A multicity study in China. Environ. Int. 2023, 172, 107791. [Google Scholar] [CrossRef] [Scilit] [PubMed]
- Guo, L.; Lin, H.; Li, H.; Jin, X.; Zhao, L.; Li, P.; Xu, N.; Xu, S.; Fang, J.; Wu, S.; et al. Exposure of ambient PM2.5 during gametogenesis period affects the birth outcome: Results from the project ELEFANT. Environ. Res. 2023, 220, 115204. [Google Scholar] [CrossRef] [Scilit] [PubMed]
- Liu, R.; Zhang, J.; Chu, L.; Zhang, J.; Guo, Y.; Qiao, L.; Niu, Z.; Wang, M.; Farhat, Z.; Grippo, A.; et al. Association of ambient fine particulate matter exposure with gestational diabetes mellitus and blood glucose levels during pregnancy. Environ. Res. 2022, 214, 114008. [Google Scholar] [CrossRef] [Scilit] [PubMed]
- Xu, Q.; Guan, Q.; Lu, Y.; Xu, J.; Deng, S.; Dong, C.; Zhang, X.; Li, W.; Xia, Y. Effect of short-term ambient air pollution exposure on early miscarriage and pregnancy hormones with critical window identification. J. Hazard. Mater. 2023, 460, 132328. [Google Scholar] [CrossRef] [Scilit] [PubMed]
- Neven, K.Y.; Wang, C.; Janssen, B.G.; Roels, H.A.; Vanpoucke, C.; Ruttens, A.; Nawrot, T.S. Ambient air pollution exposure during the late gestational period is linked with lower placental iodine load in a Belgian birth cohort. Environ. Int. 2021, 147, 106334. [Google Scholar] [CrossRef] [Scilit] [PubMed]
- Chen, Y.; Schleicher, N.; Fricker, M.; Cen, K.; Liu, X.L.; Kaminski, U.; Yu, Y.; Wu, X.F.; Norra, S. Long-term variation of black carbon and PM2.5 in Beijing, China with respect to meteorological conditions and governmental measures. Environ. Pollut. 2016, 212, 269–278. [Google Scholar] [CrossRef] [Scilit] [PubMed]
- Zhang, C.; Wang, X.; Sun, D.; Li, Y.; Feng, Y.; Zhang, R.; Zheng, Y.; Kou, Z.; Liu, Y. Modification effects of long-term air pollution levels on the relationship between short-term exposure to meteorological factors and hand, foot, and mouth disease: A distributed lag non-linear model-based study in Shandong Province, China. Ecotoxicol. Environ. Saf. 2024, 272, 116060. [Google Scholar] [CrossRef] [Scilit] [PubMed]
- Wang, J.; Li, W.; Huang, W.; Gao, Y.; Liu, Y.; Teng, Q.H.; Zhao, Q.; Chen, M.; Guo, Y.; Ma, W. The associations of ambient fine particles with tuberculosis incidence and the modification effects of ambient temperature: A nationwide time-series study in China. J. Hazard. Mater. 2023, 460, 132448. [Google Scholar] [CrossRef] [Scilit] [PubMed]
- Yang, T.; Gu, T.; Xu, Z.; He, T.; Li, G.; Huang, J. Associations of residential green space with incident type 2 diabetes and the role of air pollution: A prospective analysis in UK Biobank. Sci. Total Environ. 2023, 866, 161396. [Google Scholar] [CrossRef] [Scilit] [PubMed]
- Yan, Y.H.; Chien, C.C.; Wang, P.; Lu, M.C.; Wei, Y.C.; Wang, J.S.; Wang, J.S. Association of exposure to air pollutants with gestational diabetes mellitus in Chiayi City, Taiwan. Front. Endocrinol. 2022, 13, 1097270. [Google Scholar]
- Miron-Celis, M.; Talarico, R.; Villeneuve, P.J.; Crighton, E.; Stieb, D.M.; Stanescu, C.; Lavigne, É. Critical windows of exposure to air pollution and gestational diabetes: Assessing effect modification by maternal pre-existing conditions and environmental factors. Environ. Health 2023, 22, 26. [Google Scholar] [CrossRef] [Scilit] [PubMed]
- Lappas, M.; Hiden, U.; Desoye, G.; Froehlich, J.; Hauguel-de Mouzon, S.; Jawerbaum, A. The role of oxidative stress in the pathophysiology of gestational diabetes mellitus. Antioxid. Redox Signal. 2011, 15, 3061–3100. [Google Scholar] [CrossRef] [Scilit] [PubMed]
- Vella, R.E.; Pillon, N.J.; Zarrouki, B.; Croze, M.L.; Koppe, L.; Guichardant, M.; Pesenti, S.; Chauvin, M.A.; Rieusset, J.; Géloën, A.; et al. Ozone exposure triggers insulin resistance through muscle c-Jun N-terminal kinase activation. Diabetes 2015, 64, 1011–1024. [Google Scholar] [CrossRef] [Scilit] [PubMed]
- Souvannavong-Vilivong, X.; Sitticharoon, C.; Klinjampa, R.; Keadkraichaiwat, I.; Sripong, C.; Chatree, S.; Sririwichitchai, R.; Lertbunnaphong, T. Placental expressions and serum levels of adiponectin, visfatin, and omentin in GDM. Acta Diabetol. 2019, 56, 1121–1131. [Google Scholar] [CrossRef] [Scilit] [PubMed]
- Li, Q.; Chen, A.; Zhao, C.; Zhang, Y.; Li, M.; Gu, Y.; Pang, Y.; Yu, P.; Yue, C. Association of metabolic score for insulin resistance with gestational diabetes mellitus: A multicenter cohort study. Front. Nutr. 2025, 12, 1661119. [Google Scholar] [CrossRef] [Scilit] [PubMed]
- Nagiah, S.; Phulukdaree, A.; Naidoo, D.; Ramcharan, K.; Naidoo, R.N.; Moodley, D.; Chuturgoon, A. Oxidative stress and air pollution exposure during pregnancy: A molecular assessment. Hum. Exp. Toxicol. 2015, 34, 838–847. [Google Scholar] [PubMed]
- Zhang, C.X.W.; Candia, A.A.; Sferruzzi-Perri, A.N. Placental inflammation, oxidative stress, and fetal outcomes in maternal obesity. Trends Endocrinol. Metab. 2024, 35, 638–647. [Google Scholar] [CrossRef] [Scilit] [PubMed]
- Li, Z.; Jiang, L.; Yu, H.; Wang, J. The hidden risk in high-temperature urban environments: Assessment of metal elements and human health risks of particulate matter at street. J. Hazard. Mater. 2025, 488, 137475. [Google Scholar] [CrossRef] [Scilit] [PubMed]
- Tan, Q.; Wang, B.; Ye, Z.; Mu, G.; Liu, W.; Nie, X.; Yu, L.; Zhou, M.; Chen, W. Cross-sectional and longitudinal relationships between ozone exposure and glucose homeostasis: Exploring the role of systemic inflammation and oxidative stress in a general Chinese urban population. Environ. Pollut. 2023, 329, 121711. [Google Scholar] [CrossRef] [Scilit] [PubMed]
- Zhang, Z.; Luan, C.; Wang, C.; Li, T.; Wu, Y.; Huang, X.; Jin, B.; Zhang, E.; Gong, Q.; Zhou, X.; et al. Insulin resistance and its relationship with long-term exposure to ozone: Data based on a national population cohort. J. Hazard. Mater. 2024, 472, 134504. [Google Scholar] [CrossRef] [Scilit] [PubMed]
- Deng, L.; Chen, G.; Duan, T.; Xie, J.; Huang, G.; Li, X.; Huang, S.; Zhang, J.; Luo, Z.; Liu, C.; et al. Mixed effects of ambient air pollutants on oocyte-related outcomes: A novel insight from women undergoing assisted reproductive technology. Ecotoxicol. Environ. Saf. 2024, 280, 116525. [Google Scholar] [CrossRef] [Scilit] [PubMed]
- Lapehn, S.; Paquette, A.G. The Placental Epigenome as a Molecular Link Between Prenatal Exposures and Fetal Health Outcomes Through the DOHaD Hypothesis. Curr. Environ. Health Rep. 2022, 9, 490–501. [Google Scholar] [CrossRef] [Scilit] [PubMed]
- Abu Samra, N.; Jelinek, H.F.; Alsafar, H.; Asghar, F.; Seoud, M.; Hussein, S.M.; Mubarak, H.M.; Anwar, S.; Memon, M.; Afify, N.; et al. Genomics and Epigenomics of Gestational Diabetes Mellitus: Understanding the Molecular Pathways of the Disease Pathogenesis. Int. J. Mol. Sci. 2022, 23, 3514. [Google Scholar] [CrossRef] [Scilit] [PubMed]
- Fleisch, A.F.; Kloog, I.; Luttmann-Gibson, H.; Gold, D.R.; Oken, E.; Schwartz, J.D. Air pollution exposure and gestational diabetes mellitus among pregnant women in Massachusetts: A cohort study. Environ. Health 2016, 15, 40. [Google Scholar] [CrossRef] [Scilit] [PubMed]
- Jackson, E.; Shoemaker, R.; Larian, N.; Cassis, L. Adipose Tissue as a Site of Toxin Accumulation. Compr. Physiol. 2017, 7, 1085–1135. [Google Scholar] [CrossRef] [Scilit] [PubMed]
- Lanzinger, S.; Breitner, S.; Neas, L.; Cascio, W.; Diaz-Sanchez, D.; Hinderliter, A.; Peters, A.; Devlin, R.B.; Schneider, A. The impact of decreases in air temperature and increases in ozone on markers of endothelial function in individuals having type-2 diabetes. Environ. Res. 2014, 134, 331–338. [Google Scholar] [CrossRef] [Scilit] [PubMed]
- Lin, X.; Zhou, L.; Si, S.; Cheng, H.; Alifu, X.; Qiu, Y.; Zhuang, Y.; Huang, Y.; Zhang, L.; Ainiwan, D.; et al. Association of the comorbidity of gestational diabetes mellitus and hypertension disorders of pregnancy with birth outcomes. Front. Endocrinol. 2024, 15, 1468820. [Google Scholar] [CrossRef] [Scilit]
- Lee, H.; Choi, J.; Kim, J.I.; Watanabe, R.M.; Cho, N.H.; Park, K.S.; Kwak, S.H. Higher Genetic Risk for Type 2 Diabetes Is Associated With a Faster Decline of β-Cell Function in an East Asian Population. Diabetes Care 2024, 47, 1386–1394. [Google Scholar] [CrossRef] [Scilit] [PubMed]
- Gordon, H.G.; Shub, A.; Walker, S.P.; Hiscock, R.J.; Atkinson, J.; Tong, S.; Hastie, R.M.; Lindquist, A.C.; Pritchard, N.L. Maternal Diabetes, Fetal Growth, and Stillbirth Risk: A Population-Wide Retrospective Cohort Study From Victoria, Australia. Diabetes Care 2025, 48, 1896–1903. [Google Scholar] [CrossRef] [Scilit] [PubMed]

Disclaimer/Publisher’s Note: The statements, opinions and data contained in all publications are solely those of the individual author(s) and contributor(s) and not of MDPI and/or the editor(s). MDPI and/or the editor(s) disclaim responsibility for any injury to people or property resulting from any ideas, methods, instructions or products referred to in the content. |
© 2026 by the authors. Licensee MDPI, Basel, Switzerland. This article is an open access article distributed under the terms and conditions of the Creative Commons Attribution (CC BY) license.