


Highlights
What are the main findings?
- This study identifies the key formation pathways governing atmospheric oxidation capacity (AOC).
- It reveals and elucidates the distinct spatial distribution patterns of AOC across urban, suburban, and rural environments.
- The work underscores the necessity for enhancing multi-scale observational networks and optimizing related models in future research.
- The scoping review synthesizes recent knowledge regarding AOC, enabling the readers to acquire a profound understanding of the intricate nature of air pollution.
- Direct scientific evidence for formulating targeted spatial strategies to mitigate complex air pollution is provided.
Abstract
The ability of the atmosphere to convert primary pollutants into secondary pollutants through atmospheric oxidants is referred to as the atmospheric oxidizing capacity (AOC). This study systematically reviews the generation mechanisms, influencing factors, and quantitative characterization methods of major oxidants, along with advances in chemical mechanisms and modeling. We provide a comparative analysis of AOCs across diverse environments, including urban, suburban, and rural regions, highlighting the distinct impacts of anthropogenic and biogenic emissions on oxidation regimes. Despite advancements in chemical transport models and machine learning, limitations such as sparse observations, imperfect parameterizations, and unresolved chemical mechanisms lead to significant underestimations of the AOC. Future research must prioritize multi-scale observational networks and the elucidation of key chemical processes to refine model accuracy and improve the effectiveness of pollution control strategies.
1. Introduction
The atmospheric oxidizing capacity (AOC), defined as the integrated capability of the atmosphere to transform primary pollutants into secondary species via oxidants, serves as the fundamental driver of PM2.5-O3 co-pollution [1]. The formation processes of secondary particulate matter (PM) and ozone (O3) share common chemical pathways, both of which are critically dependent on radical-initiated oxidation of primary pollutants [2]. Accelerated urbanization and industrialization have increased anthropogenic emissions of volatile organic compounds (VOCs) and nitrogen oxides (NOx) substantially, thereby enhancing the AOC and consequently exacerbating secondary organic aerosol (SOA) formation and surface-level O3 pollution [2]. Chronic exposure to elevated O3 and PM2.5 (wherein SOA constitutes a major component) is robustly associated with increased risks of respiratory diseases and cardiovascular mortality [3]. Moreover, SOA significantly influences regional climate through solar radiation scattering and absorption [4]. Consequently, understanding the spatiotemporal evolution and regulatory mechanisms of AOC is paramount for both air quality improvement and climate change mitigation.
Significant advances have recently been made in elucidating oxidant production mechanisms, characterizing regional AOC variations, and refining modeling techniques. A notable divergence exists in global trends: while global nighttime AOC has generally declined, in China, it exhibits a significant enhancement [5]. The accelerated NO3-mediated nocturnal oxidation within China shortens the lifetime of NOx, promotes nitrate aerosol formation, and intensifies PM2.5-O3 co-pollution. Although the implementation of China’s clean air initiatives (e.g., the Air Pollution Prevention and Control Action Plan, initiated in 2013) has substantially reduced anthropogenic emissions (PM2.5, NOx, SO2), VOC levels have remained largely unchanged. This unbalanced emission reduction has paradoxically enhanced the AOC, elevating concentrations of key oxidants and radicals (O3 and ROx [=OH+HO2+RO2]) [6]. Consequently, while secondary inorganic aerosols (e.g., sulfate, nitrate) have decreased, SOA’s contribution to PM2.5 has increased [7]. This is particularly evident during autumn haze events in Beijing, where observed O3 enhancement correlates strongly with elevated SOA contributions [8].
Importantly, the AOC exhibits a threshold effect governing secondary aerosol formation: secondary aerosol production dominates when the maximum daily 8 h average ozone concentration (MDA8 O3) ≤ 100 μg m−3, whereas primary emissions prevail at concentrations >160 μg m−3 [9]. This phenomenon highlights the limitations of conventional primary pollution control strategies and underscores the imperative for synergistic approaches targeting AOC modulation through coordinated NOx-VOC control. This review systematically synthesizes recent advances in AOC research, focusing on (1) key chemical processes and influencing factors, (2) spatiotemporal patterns across diverse environments (urban, suburban, rural), and (3) progress in chemical mechanisms and model optimization. By identifying critical knowledge gaps and proposing targeted recommendations, this work provides theoretical support for developing “AOC-specific” pollution control strategies.
2. Characterization of Atmospheric Oxidizing Capacity and Its Key Chemical Processes
2.1. Characterization
Photolysis of O3, a key oxidant, generates highly reactive O(1D) atoms that initiate VOC oxidation chains. Meanwhile, hydroxyl (OH) and nitrate (NO3) radicals dominate daytime and nighttime oxidation processes, respectively [10,11]. The AOC serves as a fundamental driver for the formation of secondary pollutants such as O3 and SOA in the troposphere [1,2,12]. It is most typically quantified by the concentration of oxidants (Ox = O3 + NO2) or the aggregate rate of oxidation reactions [13], and most studies solely take OH oxidation into account when computing OH reactivity, which represents the overall rate of oxidation reactions [14]. The total OH reactivity (kOH) characterizes the number of molecules that are consumed by OH radicals per unit time and per unit volume, i.e., the instantaneous net rate of loss of OH radicals, with the dimension of s−1 [15,16]. By definition, OH reactivity is limited to a subset of oxidation pathways. Its measurement is technically demanding, and its values can fluctuate sharply near pollution sources owing to the influence of short-lived VOCs and CO. These characteristics diminish its reliability for assessing regional background levels or long-term trends. Ox specifically refers to the sum of O3 and NO2, which is a concentration metric under photochemical steady-state conditions that is capable of eliminating the influence of NO-O3 titration and more stably reflecting the total amount of oxidants that are generated by atmospheric photochemistry [17,18]. However, it does not encompass other critical atmospheric oxidants such as OH, RO2, and NO3, which may lead to an underestimation of the total oxidative capacity under certain conditions.
To address the challenge of quantifying the AOC, Liu et al. innovatively proposed a dual-index framework: the Apparent Oxidative Index (AOIe) evaluates oxidation from a product perspective, while the Atmospheric Oxidative Potential Index (AOIp) quantifies the consumption rates of primary precursors by oxidants [19]. The study established mathematical formulations and closure methods for both indices, achieving for the first time a normalized quantitative characterization of AOC in complex urban environments. Application of this method to the Beijing and Xianghe regions revealed that current mainstream atmospheric chemical mechanisms systematically underestimate the actual AOC [19,20].
The theoretical foundation is rooted in the electron transfer processes during oxidation of primary pollutants (NOx, SO2, VOCs) to secondary species (NO3−, SO42−, oxygenated organic compounds) by atmospheric oxidants (OH, O3, NO3). AOIe and AOIp quantify the AOC from thermodynamic and kinetic perspectives, respectively.
Apparent Oxidative Index (electron-transfer-based metric):
where fe1–fe5 represents molar electron transfer during oxidation processes (e.g., fe4 = 2 × [NO2]).
The SOA contribution (fe3) is calculated as follows:
Oxidative Potential Index (reaction-kinetics-based metric):
where [Cj] denotes the concentration of precursors (including VOCs, CO, NOx, and SO2), [Xi] represents the concentrations of oxidants (OH, O3, NO3), and kij is the bimolecular rate constant for reactions between Cj and Xi.
AOIe and AOIp are novel metrics designed to quantify the AOC. AOIe is strongly dependent on the concentrations of long-lived secondary pollutants that are generated via local transformation and regional transport, making it more indicative of regional-scale AOC than local AOC. However, AOIe may underestimate the AOC by neglecting heterogeneous oxidation pathways in SOA formation, while the inter-regional transport and background accumulation of secondary pollutants can lead to its overestimation. The calculation of AOIp relies on the accuracy of reaction rate constants and the concentrations of radicals (such as OH and NO3). If the reaction rate constants are inaccurate, the results for AOIp will also be affected. These radical concentrations are typically estimated through parameterization methods, which carry a certain degree of uncertainty. The calculation of AOIp only considers gas-phase reactions, neglecting the contributions of liquid-phase reactions and heterogeneous reactions to the AOC. This can lead to an underestimation of the AOC, especially in regions where liquid-phase and heterogeneous reactions play significant roles. By incorporating model-simulated OVOC reactions and heterogeneous oxidation processes into the AOIp calculation, the underestimation of the AOC by AOIp is significantly improved.
2.2. Key Processes
Photochemical oxidation processes play the vital role in shaping AOC during the warm seasons. This is clearly reflected in Beijing, where AOIe-based calculations show that gas-phase oxidation products (O3 and NO2) contribute over 80% to the total AOC in summer. Even in winter, when particle-phase products play an enhanced role, gas-phase products maintain their dominance, constituting about 70% of the AOC [19]. Friedlander and Seinfeld [21] first proposed the theoretical framework for photochemical smog formation (Table 1). The formation of tropospheric O3 involves a series of photochemical reactions, with VOCs and NOx serving as key precursors, exhibiting complex nonlinear relationships with O3 concentrations [22,23]. As shown in Figure 1, beyond participating in O3 formation through reactions with NOx under solar radiation, VOCs undergo oxidation by OH, O3, and NO3 radicals to form SOA, yielding various products, including peroxy radicals (RO2, HO2), carbonyl compounds (aldehydes, ketones), and organic peroxides. The fundamental steps of O3 photochemical production involve the following:
Table 1.
Seven fundamental equations for photochemical smog formation.
Figure 1.
Schematic diagram of key reaction mechanisms governing atmospheric oxidizing capacity (the gray reaction numbers correspond to equations in text).
OH, the most reactive atmospheric oxidant, originates primarily from the following:
NO3, a dominant nighttime atmospheric oxidant, forms as follows:
OH, as the most reactive atmospheric oxidant, plays a central role in oxidizing most major atmospheric pollutants [24,25,26]. For instance, it reacts with carbon monoxide (CO) to form hydroperoxyl radicals (HO2) (Reactions 9–10) and with VOCs to generate organic peroxy radicals (RO2) (Reactions 11, 14, 21, 15, 18, 22, 25). Subsequently, RO2 reacts with nitric oxide (NO) to form alkoxy radicals (RO) and nitrogen dioxide (NO2) (Reactions 12, 16, 19, 23, 26, 28). The unstable RO radicals undergo hydrogen abstraction and further react with oxygen (O2) to produce HO2 (Reactions 13 and 27). HO2 can then react with NO, regenerating OH and NO2 (Reaction 29). This cyclic interconversion among OH, HO2, and RO2 drives the continuous conversion of NO to NO2, ultimately leading to net O3 production [27].
OH to HO2 conversion:
Alkane (CnH2n+2) oxidation:
Alkene (CnH2n) oxidation:
Aldehyde (R-CHO) oxidation:
These peroxy radicals subsequently participate in chain-propagating reactions, sustaining the NO-to-NO2 conversion cycle that drives net O3 production:
VOCs, encompassing both biogenic and anthropogenic sources (e.g., industrial emissions, vehicle exhaust, and solvent use), are crucial components in tropospheric chemistry, as they are primary precursors for both O3 and SOA formation [28,29,30]. As crucial intermediates in atmospheric oxidation reactions, RO2 radicals play a pivotal role in the process of PM2.5-O3 compound pollution. The complex reaction networks involving RO2, NOx, and HOx directly regulate the production levels of O3 and SOA. The formation of SOA is significantly influenced by NOx concentration through its modulation of RO2 radical reaction pathways. Under high-NOx conditions, the reaction pathway of RO2 with NOx is dominant. This not only suppresses the RO2 autoxidation process but also tends to yield more volatile products, leading to a reduction in SOA yield [31]. In contrast, under low-NOx conditions, RO2 primarily reacts with HO2 or other RO2 radicals, favoring the production of low-volatility products and thereby increasing SOA yield [32]. Upon initiation by atmospheric oxidants such as OH radicals, VOCs undergo a sequence of radical-chain oxidation steps. In this process, the radical center propagates through RO2- or RO-mediated isomerization, occasionally accompanied by R rearrangement, until chain termination occurs, yielding closed-shell products [33]. Concurrently, the resulting RO2 radicals can rapidly form highly oxygenated organic molecules (HOMs) via intramolecular H-shift and subsequent O2 addition, a pathway recognized as RO2 autoxidation, which substantially promotes SOA formation [34]. Since the reaction mechanisms of RO2 radicals are intrinsically linked to their specific structure (e.g., isomeric form), this structure-reactivity relationship has motivated sustained efforts to develop analytical methods for the real-time, isomer-specific detection of these transient species, which is inherently difficult due to the vast diversity and structural complexity in the RO2 family [35]. Studies were conducted to identify the isomers and rotamers of propyl peroxy radical [35] and ethyl peroxy radical [36] utilizing the technique of vacuum ultraviolet (VUV) synchrotron radiation spectroscopy combined accurate theoretical computations. Li et al. [37] investigated the atmospheric oxidation mechanism of cyclohexene, focusing on RO2 formation and transformation. Using proton transfer reaction mass spectrometry for direct measurement of RO2 and closed-shell products, combined with box model simulations, their work revealed the limitations in current mechanisms regarding RO2 autoxidation and OH-initiated oxidation pathways.
In recent decades, various atmospheric chemistry mechanisms have been developed to formalize complex atmospheric chemical processes through mathematical modeling, enabling quantitative simulation and objective description of the transformation of primary pollutants into secondary pollutants [38]. A thorough understanding of these mechanisms is crucial for elucidating pollution formation and developing effective control strategies.
Atmospheric chemistry mechanisms can be classified into detailed and lumped mechanisms [39]. Both types describe the chemistry of VOCs and inorganic species (Ox, HOx, NOx, and SOx). The Master Chemical Mechanism (MCM) is a widely used detailed gas-phase mechanism that explicitly describes the reaction pathways of individual VOC species without lumping simplifications [38,40]. It is suitable for assessing O3 formation potential and VOC transformation, SOA precursor analysis, and cloud chemistry studies, helping reveal variations in atmospheric oxidizing capacity under different conditions. However, its high computational cost limits its integration with regional models.
In contrast, lumped mechanisms such as the Carbon Bond Mechanism (CBM), Statewide Air Pollution Research Center (SAPRC) mechanism, Regional Acid Deposition Model (RADM), and Regional Atmospheric Chemistry Mechanism (RACM) employ VOC classification and lumping techniques. The CBM, SAPRC, and RADM are often applied in regional air quality models [38], while the MCM and RACM are primarily used in box model studies [40]. These mechanisms have been validated through smog chamber experiments and are advantageous for simulating the characteristics of VOC pollution, estimating O3 production rates, and studying SOA formation. The CBM excels in simulating regional pollution with simplified organic chemistry, the SAPRC accurately represents real-world VOC pollution, and the RACM details the photochemical generation and radical chemistry of O3.
2.3. Key Influencing Factors Other than Anthropogenic VOCs
Substantial previous research has confirmed that anthropogenic volatile organic compounds (AVOCs) represent a major factor influencing the intensity of the AOC [41,42,43]. Herein, we summarize several other key factors beyond AVOCs, including meteorological parameters, aerosol effects, and biogenic volatile organic compound (BVOC) emissions. Meteorological parameters such as solar radiation critically regulate the pathways and rates of atmospheric photochemical reactions, directly influencing oxidant concentrations and the kinetics of oxidation processes. Atmospheric aerosols can significantly modify the AOC and influence SOA formation through direct and indirect radiative effects. BVOCs contribute significantly to the formation of atmospheric oxidants (e.g., O3) and exhibit substantial Secondary Organic Aerosol Formation Potential (SOAFP).
2.3.1. Meteorological Influences
Photolysis reactions account for 58% to 86% of primary radical sources during daytime [14]. Solar radiation, as the primary driver of photochemical reactions, plays a pivotal role in modulating atmospheric pollutants and oxidants. In China, between 2013 and 2017, variations in meteorological factors (including temperature and radiation) drove changes exceeding 20% in MDA8 O3 levels under temperature fluctuations within 1 °C [44]. Bei et al. employed the WRF-Chem model to investigate aerosol–radiation interaction (ARI) under varying synoptic conditions during winter in the Guanzhong Basin [45]. Their results demonstrated that ARI reduces the solar radiation intensity and surface temperature while suppressing boundary layer development, contributing to 15–25% of near-surface PM2.5 concentrations. Temperature and circulation accounted for approximately 37% of the increase in O3 levels in China between 2013 and 2017 [46].
Stagnant wind conditions hinder the transport, dilution, and dispersion of air pollutants. Such pollution episodes are often associated with valley-basin topography under the influence of large-scale high-pressure ridges [9,47]. Wind speed serves as a critical meteorological factor governing regional pollutant dispersion and transport, typically exhibiting a strong negative correlation with aerosol concentrations. Humidity plays a key role in heterogeneous nucleation of aerosols and hygroscopic growth processes, particularly in the aqueous-phase oxidation of SO2. When the relative humidity (RH) exceeds 70%, the probability of high-concentration pollution events involving submicron particulate matter (PM1) increases significantly. The boundary layer height (BLH) represents another crucial factor affecting the dispersion or accumulation of tropospheric pollutants. A shallow boundary layer restricts vertical and horizontal aerosol diffusion, leading to pollutant accumulation and exacerbating air pollution [48].
2.3.2. Aerosol Effects
Atmospheric aerosols influence the AOC through three primary mechanisms: First, their direct radiative effects often lead to negative radiative forcing (the “umbrella effect”) via the absorption and scattering of solar radiation, which modifies temperature, humidity, and wind patterns, ultimately influencing photochemical reaction rates. Second, aerosols interact with clouds by serving as cloud condensation nuclei (CCN) and ice nuclei (IN), indirectly altering atmospheric oxidizability through changes in cloud microphysics and precipitation processes. Third, they facilitate heterogeneous chemistry by providing reactive surfaces that drive the production and consumption of key oxidants. Together, these mechanisms highlight the complex and multifaceted role of aerosols in shaping atmospheric chemical reactivity. Case studies in the Yangtze River Delta reveal that black carbon (BC) reduces surface O3 concentrations by 8–12% through light absorption, with the magnitude depending on the BC mixing state and size distribution [49]. These effects can substantially modify Empirical Kinetic Modeling Approach (EKMA) curves, potentially shifting O3 production regimes.
2.3.3. Biogenic VOC Emissions
In addition to anthropogenic sources, biogenic emissions also constitute a significant contributor to VOCs in atmosphere [29,50]. During summer in Los Angeles, BVOC emissions account for approximately 60% of the hydroxyl reactivity (OHR) and SOAFP, with this contribution rate increasing significantly with rising temperatures [51]. The annual total BVOC emissions in the Beijing–Tianjin–Hebei (BTH) region in 2018 were estimated via two emission inventory methods, the biomass-based method and the Model of Emissions of Gases and Aerosols from Nature (MEGAN), yielding values of 734.6 Gg y−1 and 777.3 Gg y−1, respectively. Regarding the compositional profile of BVOC emissions in this region, the average contribution ratios of isoprene, monoterpenes, and other VOCs were 36.86%, 28.52%, and 34.62%, respectively. Spatially, the areas with high BVOC emissions were primarily concentrated in the central and northern mountains of the BTH region. The ozone formation potential (OFP) and SOA formation potential (SOAFP) were calculated to quantify the role of BVOCs in driving O3 and SOA formation. Simulation results indicated that BVOC emissions contributed an average of 23.73% to the surface O3 concentrations and 37.99% to the SOA concentrations in July across 13 cities in the BTH region [30]. This significant impact is primarily due to the surge in BVOC emissions (especially highly reactive isoprene and monoterpenes) under high summer temperatures, which affects downwind cities under the influence of regional transport. Among the O3 that is generated by BVOCs, crops contribute the most, accounting for 46.3%; deciduous forests are the second largest contributor, at 27.34%; and the vegetation type with the smallest contribution is fruiters, at only 4.98%. Of the SOA that is generated by BVOCs, crops are again the largest contributor, reaching as high as 56.63%; deciduous forests contribute 17.73%; and evergreen forests and shrubs and grasslands make relatively smaller contributions, both below 10%. BVOC emissions from different vegetation types exhibit varying contributions to O3 and SOA formation. BVOCs that are emitted by crops contain a higher proportion of highly reactive isoprene and monoterpenes, which can produce more O3 and SOA per unit mass. Coniferous forests typically emit higher proportions of monoterpenes, whereas broadleaf forests release more isoprene. Deciduous forests exhibit greater influence on O3 concentrations than evergreen forests, with distinct contribution patterns for SOA concentrations. The contribution of deciduous forests to BVOCs-O3 (27.34%) is significantly higher than their contribution to BSOA (17.73%), which is consistent with their characteristic of primarily emitting isoprene. In the Beijing–Tianjin–Hebei region, deciduous species such as poplar and Quercus contribute most significantly to O3 concentrations, while Pinus tabuliformis and Quercus play dominant roles in SOA formation [30]. It should be noted that these conclusions are based on simulations in summer. BVOC emissions are highly dependent on temperature and light, with summer being the peak emission period. Therefore, these contribution rates only represent summer levels and may not be applicable to O3 pollution events in autumn or winter.
3. The Regional Characteristics of the AOC
Driven by solar radiation, the AOC exhibits pronounced diurnal variations, with the daytime intensity generally surpassing nighttime levels. Under illuminated conditions, photochemical reactions dominate the production of oxidants such as O3 and facilitate the conversion of primary organic aerosols (POA) to SOA. O3, OH, and NOx constitute three key atmospheric oxidants, which are ubiquitously present in urban, suburban, and rural environments (Table S1). In urban and suburban areas dominated by traffic and industrial emissions, as well as in rural regions with significant biogenic emissions, OH serves as the primary daytime atmospheric oxidant. During nighttime, the contributions of O3 and NOx become more prominent. O3 production is nonlinearly regulated by its precursors, VOCs and NOx, which lead to two distinct control regimes: the NOx-limited regime and the VOC-limited regime. In the NOx-limited regime, O3 formation is primarily governed by NOx concentrations, where NOx reduction effectively lowers O3 levels, while changes in VOC concentrations exhibit minimal impact. The opposite holds true for the VOC-limited regime. The Beijing–Tianjin–Hebei urban agglomeration and its surrounding suburbs predominantly fall within the VOC-limited regime. In the low-VOC-concentration scenario, the reaction system is within the VOC-limited regime. As NOx decreases and the VOC/NOx ratio increases, the system transitions from the VOC-limited regime to the NOx-limited regime, with the O3 concentration first rising and then declining. Correspondingly, the yields of SOA and the concentration of OH also increase initially before decreasing [52]. In the NOx-limited regime under high VOC concentrations, reducing NOx simultaneously suppresses the formation of O3 and SOA, which is related to the decline in the system’s oxidation capacity: decreased NOx leads to reduced OH concentrations, thereby inhibiting the production of low-volatility oxygenated/nitrogenated oxidation products [52,53].
Through the synthesis of atmospheric oxidant and pollutant concentration data across different environments, distinct disparities emerge in pollution characteristics and oxidative properties among urban, suburban, and rural areas. Urban regions, characterized by high-density traffic and residential activities, exhibit elevated pollutant and atmospheric oxidant concentrations. Suburban areas, influenced by urban expansion, experience a combination of transported and locally emitted pollution, resulting in intermediate air pollution levels and atmospheric oxidant concentrations between those of urban and rural settings. In contrast, rural areas generally feature lower pollution levels, although agricultural activities and seasonal factors may still induce localized pollution, primarily driven by primary emissions (e.g., fossil fuel and biomass burning). Emissions of BVOCs from vegetation significantly contribute to the formation of SOA in rural areas. With ongoing urban expansion, rising concentrations of NOx in some rural regions are increasingly participating in the atmospheric oxidation processes that form secondary pollutants. This phenomenon leads to elevated ozone levels in rural environments and enhances SOA formation.
This section highlights the spatial and temporal heterogeneity of the AOC, emphasizing the need for region-specific pollution control strategies to mitigate oxidative pollution effectively. The AOC patterns elucidated in this study capture oxidative chemistry across diverse atmospheric settings, including both densely populated urban areas that are influenced strongly by anthropogenic emissions and regions characterized by mixed anthropogenic and biogenic sources. Consequently, direct extrapolation of these AOC patterns to other geographical or climatic contexts should be approached with caution, as the AOC’s magnitude and sensitivity are modulated by factors that vary substantially across spaces and seasons, such as VOC speciation, NOx regimes, background aerosol composition, and actinic flux. Therefore, while the AOC regimes and responses characterized here are representative of environments with similar emission profiles and chemical conditions, the underlying chemical mechanisms identified—notably key RO2 isomerization pathways and NOx-VOC coupling—offer transferable insights that can inform model development.
In this study, the identification of VOC-limited or NOx-limited regimes is primarily based on the EKMA from specific observation periods and existing regional modeling results. It should be noted that such classifications are strongly influenced by the accuracy of VOC/NOx input data, the adopted chemical reaction mechanisms, and the actual meteorological conditions. Therefore, they should be regarded as preliminary diagnoses of the dominant regime in a given period or region, rather than definitive conclusions. Moreover, the findings of this study reflect more on the potential spatial patterns of the AOC and its macro-scale influencing factors, whereas precise quantification of absolute inter-regional differences would require the establishment of a unified, long-term, high-resolution, and vertically resolved observational network in the future.
3.1. Urban Areas
Elevated concentrations of NOx and VOCs in urban areas enhance the O3 formation potential substantially. The photochemical production of O3 exhibits a complex nonlinear response to its precursors [27]. Based on WRF-Chem simulations and EKMA analysis, the Beijing urban area is identified as a VOC-limited regime in summer, characterized by the following key features: (1) VOC reduction leads to a pronounced decrease in O3 concentrations; (2) concurrent VOC increase and NOx reduction synergistically elevate O3 levels; (3) NOx increase suppresses O3 production by consuming OH; and (4) vertically, the O3 concentration gradient weakens with altitude, accompanied by a reduction in the VOC-limited regime and enhanced NOx sensitivity [54].
Previous studies have quantified atmospheric oxidative capacity in Chinese urban areas and highlighted the dominant role of specific oxidants across different times of day and pollution conditions. For instance, Shao et al. [55] quantified the AOC in the urban area of Taiyuan during summer using the AOIp. The results indicated that OH radicals dominated daytime oxidation under both clean and polluted conditions, contributing 97.7–97.8% of the total AOC. The AOC level during the daytime was dozens of times higher than that at night. Similarly, Jia et al. [12] employed a comprehensive reaction rate index, which considers oxidants such as OH, O3, and NO3 and precursors including VOCs, CO, and CH4 to assess AOC in Beijing during autumn. The study showed that OH was the dominant oxidant during daytime, whereas O3, and NO3 jointly controlled the oxidation process at night. Specifically, during an O3 episode, the contributions of OH, O3, and NO3 to the total AOC were 87%, 10%, and 3% during the daytime, and 29%, 61%, and 10% at night, respectively; during a PM2.5 episode, the corresponding contributions were 86%, 6%, and 7% in the daytime, and 29%, 10%, and 61% at night. As demonstrated, OH was the dominant oxidant during the daytime in both episodes, accounting for approximately 90% of the total AOC. NO3 is an important nocturnal oxidant, and NO3 oxidation contributes an average of 10–20% to SOA formation. During the period from 2014 to 2019, China experienced a significant increase in the nitrate radical production rate (PNO3), with an average annual growth rate of 5.8%. This rise in PNO3 was primarily driven by the increase in nocturnal O3 concentrations. Regions exhibiting high nocturnal PNO3 were predominantly concentrated in the urban clusters of eastern China, such as the North China Plain and the Yangtze River Delta [5].
Based on intensive observations conducted in four major Chinese cities—Beijing (July), Shanghai (August), Guangzhou (October), and Chongqing (August)—the study by Tan et al. [14] systematically measured ozone, nitrogen oxides, CO, VOCs, photolysis frequencies, and meteorological parameters. It employed a box model with the RACM2 chemical mechanism, constrained by observations, to simulate the concentrations of OH, HO2, and RO2 radicals. Based on this foundation, a systematic analysis of the radical budget and quantitative calculations of the ozone formation potential were carried out. The findings reveal significant urban differences in OH reactivity, with Guangzhou exhibiting the highest levels (20–30 s−1) and Shanghai the lowest (<15 s−1). Over 50% of OH reactivity across these cities stems from inorganic compounds (CO and NOx). Simulated OH concentrations show a strong correlation with photolysis frequencies, peaking at approximately 7 × 106 cm−3 in Beijing and Shanghai, followed by 4 × 106 cm−3 in Chongqing, and the lowest at 2 × 106 cm−3 in Guangzhou. In contrast, peroxyl radical concentrations reach their highest in Chongqing, with HO2 peaking at 5 × 108 cm−3 and RO2 at 7 × 108 cm−3, primarily attributed to its elevated VOC/NOx ratio. Radical budget analysis identifies the photolysis of HONO, O3, and HCHO as the primary sources of radicals, with the decomposition of alkenes by ozone standing out in Guangzhou, contributing 43% to daytime primary sources. Regarding the formation mechanisms of secondary pollutants, the study reveals that the local ozone production rate is highest in Beijing (with a daily cumulative production of 136 ppbv) and lowest in Guangzhou (40 ppbv). All observed cities are in VOC-limited regimes. Relative incremental reactivity analysis further confirms that AVOCs are the most sensitive precursors for ozone formation. Concurrently, the study indicates that photochemically produced HNO3 serves as a crucial precursor for particulate nitrate under ammonia-rich conditions, highlighting the reduction in photochemical nitric acid formation as a key strategy for controlling summertime nitrate pollution. Overall, Beijing exhibits the strongest daytime OH oxidation rate (peaking at approximately 10 ppbv h−1), signifying its highest atmospheric oxidation capacity. This strong oxidizing capacity directly drives the formation of secondary pollutants such as ozone and nitrate. Nevertheless, this study has limitations in terms of the generalizability of its conclusions and mechanistic understanding. Firstly, the seasonal scope is restricted—observations were limited to a single month of peak photochemical pollution in each city—and the study is thus unable to capture seasonal variations in atmospheric oxidation mechanisms. For example, the potential shift from VOC-limited to NOx-limited ozone formation under winter conditions (low temperature, weak radiation) remains unverified. Secondly, uncertainties exist in characterizing key precursors: HONO concentrations were derived from a fixed ratio (2%) of NO2 rather than direct measurements, ignoring potential biases from spatiotemporal heterogeneity in HONO sources and sinks, despite limited sensitivity in model outputs (when HONO halves, OH changes <10%). Thirdly, inherent model deficiencies may affect its quantitative accuracy: under high-NOx conditions, current mechanisms tend to underestimate HO2 and RO2 concentrations, leading to underestimated ozone production rates. Finally, the study’s spatial representativeness is limited, as conclusions are based on urban center measurements without fully addressing regional-scale pollutant transport and chemical evolution.
Based on a PM2.5-O3 compound pollution episode observed at an urban station in Beijing from 13 to 23 May 2017, Cui et al. conducted sensitivity experiments using the WRF-Chem model and EKMA curves. Compared with the scenario of increasing or decreasing VOCs or NOx by 25% individually, their results demonstrate that simultaneous 25% reductions in VOCs and NOx yield the most significant decrease in peak O3 concentrations of 43.3 μg/m3. However, a strategy of ~50% VOC reduction in urban areas was proposed to achieve compliance with the O3-1 h air quality standard [54]. In this case study, the ambient atmospheric condition (represented by 100% NOx and 100% VOCs) is plotted within the VOC-limited quadrant of the EKMA isopleth diagram. This demonstrates that, given the prevailing NOx/VOC ratio, the O3 formation regime exhibits greater sensitivity to variations in VOC concentrations. Specifically, holding NOx levels constant while increasing VOCs leads to a pronounced enhancement in O3 production; conversely, a reduction in VOCs results in a significant suppression of O3. Notably, the −25% NOx perturbation scenario yields an O3 decrease of 29.4 μg m−3, a response magnitude that is comparable to the 32.9 μg m−3 reduction achieved under the −25% VOC scenario in the urban area. These comparable sensitivity indices suggest that the urban photochemical regime resides near the boundary between the VOC-limited and transitional regimes. Nevertheless, the overall O3 formation mechanism remains predominantly governed by the availability of VOCs, as indicated by the EKMA analysis. This conclusion is based on a specific process in May 2017 and may not apply to other seasons or years due to the strong nonlinearity of O3 generation. It should be noted that the model simulations contain inherent inaccuracies, for instance, the model results show a systematic underestimation of urban O3 concentrations, with a mean bias of −43.38 µg m−3 (NMB = −32.71%). Meanwhile, VOCs are simplified as a homogeneous component, without distinguishing the significant differences in reactivity among different species, which may affect the accurate quantification of the effects and thresholds of VOC emission reduction.
Kang et al. combined MAX-DOAS tower-based vertical observations with TROPOMI satellite vertical column density (VCD) data to retrieve the diurnal variation and vertical profile of NO2 concentrations in Beijing during spring 2019. Their results indicate that surface NO2 peaks in the early morning, reaches its minimum between 14:00 and 15:00 local time, and is strongly correlated with traffic emissions. Enhanced daytime turbulence facilitates NO2 transport from the boundary layer (BL) to the free troposphere (FT). In the evening, the BL height decreases, trapping free-tropospheric NO2 in the residual layer (RL). Morning planetary boundary layer (PBL) development triggers RL pollutant entrainment, resulting in higher NO2 concentrations in the RL than in the BL at 06:00 [56]. This study confirms that NO2 in Beijing’s urban atmosphere is predominantly derived from local emissions, and its concentration distribution is significantly constrained by the vertical structure of the PBL. A typical localized pollution pattern is observed, characterized by enrichment within the boundary layer and a sharp decline above it. This conclusion is supported by the strong correlations (with R values mostly exceeding 0.87) between MAX-DOAS observations and data from tower and satellite measurements, further emphasizing the dominant role of urban-scale anthropogenic emissions in shaping the near-surface spatial distribution of NO2.
3.2. Suburban Areas
Regarding vertical VOC distributions, Liu et al. collected atmospheric samples at altitudes of 50–400 m using drone-deployed stainless-steel canisters in Jinshan, a suburban area of Shanghai, during 8–9th September 2016. Fifty-two VOCs were quantified via gas chromatography–mass spectrometry (GC-MS), and their vertical profiles were investigated using principal component analysis (PCA). Vertically, the daily mean VOC concentrations increased from 50 to 100 m (peak concentration: 36.1 ppbv), remained elevated at 100–200 m (±5% variability), and decreased markedly above 200 m (21.2% lower at 400 m than at 100 m). With increasing altitudes, the fractions of alkanes and aromatics rose by 2.1% and 2.5%, respectively, while that of alkenes decreased by 4.8%. PCA identified the petrochemical industry, liquefied petroleum gas (LPG), and vehicular emissions as dominant VOC sources. Toluene and m/p-xylene were identified as key species for controlling near-surface O3 and SOA formation based on SOAFP and OFP calculations [22]. This study was the first to use drone technology to collect vertical distribution data of VOCs in the Yangtze River Delta region, revealing the concentration, composition, and chemical changes in VOCs at different heights, as well as their relationship with O3 and SOA formation. However, the study area is concentrated near petrochemical industrial and motor vehicle exhaust emission sources and does not consider the chemical reactions (e.g., oxidation) of VOCs during atmospheric transport. Thus, future research should consider integrating chemical reaction models to more comprehensively simulate the vertical distribution of VOCs.
In terms of radical chemistry and O3 formation mechanisms, Xue et al. analyzed radical budgets and O3 production using observations and the Master Chemical Mechanism (MCM) box model in Xianghe, a suburban site on the North China Plain (NCP), during summer 2018. The VOC composition was dominated by alkanes (62.2% of total VOCs), followed by equal contributions from alkenes and aromatics (17.3% each), with isoprene accounting for only 3.2%. Diurnal variations in NOx, CO, and AVOCs showed morning peaks synchronized with rush-hour traffic emissions, afternoon dilution due to BL elevation (>1.5 km), and nocturnal accumulation under shallow nighttime BL (<300 m). Isoprene peaked at ~1.8 ppbv (15:00 local time), decoupled from AVOCs, confirming its biogenic origin. O3 concentrations substantially exceeded standards, exhibiting a typical photochemical pollution pattern with afternoon maxima. HONO concentrations correlated positively with NO2, and box model results indicated that HONO photolysis contributed 41% to daytime ROx production, while the reaction of NO2 with OH was the dominant radical termination pathway (accounting for 41%). Meanwhile, a cycle exists among ROx radicals: OH acts as an atmospheric oxidant to promote the formation of HO2 and RO2, and the reactions of HO2 and RO2 with NO achieve rapid regeneration of OH. Sensitivity tests show that HONO is responsible for 42% of the O3 production in the simulations, as the cycling of ROx radicals is linked to the production and depletion of O3. O3-NO2-VOC sensitivity analysis confirmed VOC-limited O3 production in Xianghe. When the absorption of aerosols on trace gases and radicals is taken into account, O3 generation is still in the VOC-controlled region, although it exhibits a trend of shifting towards NOx sensitivity. This indicates that controlling VOCs is the optimal approach for alleviating O3 pollution in suburban NCP. Aerosol uptake of HO2 accounted for 11% of ROx loss; neglecting this process would lead to O3 overestimation [27].
To sum up, future research should combine more advanced measurement technologies and models to comprehensively evaluate the characteristics of VOCs and photochemical smog in suburban areas and develop more effective pollution control strategies.
3.3. Rural Areas
During severe air pollution episodes on the NCP, organic aerosol (OA) constitutes a major pollutant. Biomass burning during wheat harvest periods has been identified as a primary source [57]. Organic nitrates (ONs), which are important SOA components [58], form via daytime OH oxidation of hydrocarbons in the presence of NOx and nighttime NO3-initiated alkene oxidation. In rural NCP, particle-phase ONs are mainly associated with primary emissions, likely from biomass burning.
Despite severe aerosol pollution on the NCP, rural studies remain limited. Zhu et al. conducted offline PM1 measurements using thermal desorption–aerosol mass spectrometry (TD-AMS) in rural NCP. Positive matrix factorization (PMF) resolved four OA factors, hydrocarbon-like OA (HOA), biomass burning OA (BBOA), less-oxidized oxygenated OA (LO-OOA), and more-oxidized oxygenated OA (MO-OOA), with decreasing volatility (HOA > BBOA > LO-OOA > MO-OOA) and increasing O:C ratios. BBOA is an important component of OA, with an average contribution rate of 29.4%—second to LO-OOA (30.8%) and significantly higher than OA emitted from traffic sources (HOA, 18.4%) [57].
Ma et al. [59] reported that total BVOC emissions in low-altitude regions of Nanling were approximately double those at high-altitude sites, yet biogenic SOA (BSOA) concentrations were significantly higher at elevated locations. This suggests that environmental factors beyond BVOC precursors play critical roles in BSOA formation. At mountain summits, daytime SOA and O3 co-formation was driven by OH oxidation, while nocturnal SOA correlated with O3 oxidation of VOCs. In contrast, valley SOA levels correlated with NO2. BSOA tracers at both sites exhibited positive correlations with anthropogenic markers (NO2, SO2), indicating combined influences from biogenic and anthropogenic emissions. Similar findings in the Yangtze River Delta highlighted sulfate-enhanced BSOA formation [60].
In rural areas with minimal industrial influence (e.g., farmlands, forests), amines warrant attention. A concentration of ON ranging from 1.48 to 3.39 μg m−3 (8.1–19% of OA mass) exhibited strong correlations (r ≈ 0.7) with primary BBOA and black carbon from biomass burning (BC_bb), and its diurnal variation pattern was highly consistent with biomass burning activities, providing strong evidence that particulate-phase ON is primarily associated with the initial emissions from biomass burning [57]. In rural areas of the Yangtze River Delta (YRD), amines show a significant positive correlation with levoglucosan, which indicates biomass burning, suggesting that biomass burning is an important source of SOA precursors such as amines. Gas-phase amines, oxidized by O3 and OH, play key roles in aerosol formation and transformation processes. Particle-phase amines enhance aerosol stability via acid–base reactions or contribute to SOA through heterogeneous pathways [61].
Primary emissions from biomass burning are the dominant sources of OA and ON (contributing approximately 30%), whose SOA formation is highly sensitive to biomass burning events in rural NCP. In contrast, in the rural forests of YRD (Nanling), BSOA formation is more sensitive to anthro-biogenic source interactions, with BSOA concentrations being abnormally high (~150 ng m−3). Assessments indicate that controlling biomass burning alone may be insufficient to mitigate SOA pollution in rural areas, particularly when transboundary migration of anthropogenic pollutants (SO2, NOx, etc.) occurs. Developing differentiated precursor control strategies that are tailored to the characteristics of different rural environments (e.g., biomass burning-dominated regions versus regions influenced by anthropogenic pollution) is crucial for effectively alleviating SOA pollution. For example, to achieve coordinated regulation and control of SO2/NOx and NH3, future models and observational studies should more precisely quantify the sensitivity coefficients of these rural characteristic parameters to key assumptions.
4. Modeling Studies on Atmospheric Oxidizing Capacity
4.1. Chemical Transport Models (CTMs): Core Tools for Research
4.1.1. Key Features of WRF-Chem and CMAQ
Chemical transport models (CTMs) such as the Weather Research Forecasting Model with Chemistry (WRF-Chem) and Community Multiscale Air Quality model (CMAQ) are widely used to study atmospheric oxidizing capacity and SOA [62]. These models simulate the transport, diffusion, and chemical transformation of atmospheric aerosols and their precursors (e.g., O3, NOx, and PM2.5) while assessing the environmental effects of different emission control scenarios. Figure 2 shows the key features of CTMs.
Figure 2.
Principal operational process of online and offline CTMs.
Both WRF-Chem and CMAQ are typical regional-scale models, but they differ in their coupling frameworks, leading to distinct application scenarios. WRF-Chem, jointly developed by the U.S. National Oceanic and Atmospheric Administration (NOAA) and the National Center for Atmospheric Research (NCAR), employs an online-coupled framework, where meteorological processes and chemical reactions are solved simultaneously within a unified model core. This tight coupling minimizes temporal and spatial discontinuities, enabling accurate simulations of feedback mechanisms between meteorology and chemistry. WRF-Chem has demonstrated robust performance in simulating air pollutants and aerosols and is applicable to the study of aerosol–meteorology feedback and climate change driven by variations in chemical emissions [45,54]. Developed by the U.S. Environmental Protection Agency (USEPA), CMAQ focuses on simulating complex processes of secondary pollutants (e.g., O3, SOA). The offline modeling approach neglects the feedback mechanisms of atmospheric pollutants on meteorological processes, potentially introducing systematic biases into forecast outcomes. It operates offline, relying on external meteorological models (e.g., WRF) to drive chemical simulations [63].
4.1.2. Case Studies: Applications of CTMs in Oxidation and SOA Research
Feng et al. [8] employed a modified WRF-Chem model to study autumn pollution events in Beijing, with configurations including a flexible gas-phase chemistry module and the CMAQ aerosol module [64]. Wet deposition followed the CMAQ scheme, dry deposition adopted the Wesely [65] parameterization, and photolysis rates were computed via the Fast-J module [66,67], accounting for cloud and aerosol effects. Inorganic aerosols were simulated using ISORROPIA v1.7 [68], which thermodynamically equilibrates NH3/NH4+, SO42-, NO3-, Cl-, Na+, Ca2+, K+, Mg2+, and H2O, while SOA formation was modeled with the volatility basis set (VBS) approach [30,69,70]. Cai et al. used WRF-driven CMAQ to simulate July 2018 conditions, evaluating BVOCs’ impacts on O3 and SOA [69,70]. Validated against observations, the model showed acceptable statistical performance metrics. In numerical simulations of atmospheric environments, commonly used statistical test indicators for evaluating the accuracy of simulation results include the correlation coefficient (R), coefficient of determination (R2), normalized mean bias (NMB), normalized mean error (NME), mean bias (MB), mean absolute error (MAE), and root mean square error (RMSE) [62,71].
In a case study simulating the atmospheric pollution conditions in October 2014, the simulation of OH reactivity using the SAPRC07 mechanism yields the best results, with the simulated values being closest to the observed values (R2 = 0.83); the SAPRC99 mechanism follows, with an R2 value of 0.81. However, the SAPRC07 mechanism significantly underestimates the OH concentration on sunny days. Regarding the ozone production rate (PO3), RACM2 is closest to the observations during pollution periods, while MCMv3.2 and SAPRC99 perform well during clean periods [40].
Inherent uncertainties in numerical simulations of atmospheric processes predominantly originate from two aspects: the construction of input datasets and the characterization parameterization schemes within models. Specific sources encompass inaccuracies in meteorological field input datasets and pollutant emission inventories, uncertainties associated with VOC speciation, and limitations of physical parameterization schemes and chemical mechanisms (e.g., gas-phase chemical reactions, photolysis rate computations, and dry/wet deposition processes) [45]. These uncertain factors exert a significant impact on the simulation of meteorological conditions, the characterization of aerosol–radiation interactions, and the accuracy of assessments regarding the concentration and composition of particulate matter.
4.2. Machine Learning Models
Physicochemical models often face computational inefficiency, while purely data-driven models lack interpretability. Hybrid approaches combining both can improve pollution control strategies. Dong et al. [72] developed a correlation–ML-SHAP framework to analyze O3 drivers: correlation screening identified key factors, machine learning (XGBoost outperformed others) modeled relationships, and SHAP quantified factor contributions. Temperature (32.1%), solar radiation (21.3%), humidity (16.5%), and precursor emissions (15.6%) were dominant, with nonlinear interactions. This demonstrates machine learning’s utility in handling complex, nonlinear data. Future studies could integrate field/lab data for parameterization optimization. However, machine learning requires large datasets, and embedding physicochemical principles remains challenging. Although Dong et al.’s study quantified the driving effects of factors such as temperature and solar radiation on ozone, the machine learning model may have learned spurious correlations among environmental variables rather than true causal mechanisms. The lack of transparency or interpretability raises concerns about the reliability of model predictions when applied to extreme weather events or emission scenarios outside the training data distribution and makes it difficult to diagnose the physical causes of prediction errors. Traditional numerical models, despite their slowness, provide a self-consistent, physically consistent evolution of three-dimensional fields. In pursuit of inference speed, deep learning often employs simplified network architectures or down-scaled input features, which may lead to the model losing the ability to capture key microphysical processes.
Deep learning excels at processing complex data. Wang et al. [73] replaced the CBM-Z gas-phase mechanism in GNAQPMS with a ResNet model to predict radical concentrations. The model matched CBM-Z’s accuracy (mean R2 = 0.95) for OH, O3, and NOx while being 300–750 times faster. Qiu et al. [74] combined numerical weather prediction (NWP) and deep learning in the PPN (PM2.5 Prediction Network) model for high-efficiency PM2.5 forecasting. PPN’s encoder–decoder architecture used historical PM2.5 and NWP fields to construct an initial state (analogous to CTM spin-up), with separate network layers for local (chemistry/turbulence) and nonlocal (transport) processes. A weighted loss function improved extreme PM2.5 event predictions. Applied to Beijing–Tianjin–Hebei (9 km resolution) in January 2022, the PPN achieved sub-second forecasts for 3-day predictions, outperforming WRF-Chem in accuracy and speed. However, the superior performance of the PPN model in the Beijing–Tianjin–Hebei region may be partly attributable to the dense monitoring network and long-term historical data accumulation in this area. If the same model were directly transferred to regions with sparse monitoring or entirely different climatic characteristics (such as oceanic or remote mountainous areas), its performance could degrade significantly. While deep learning models (e.g., ResNet and PPN) demonstrate superior computational efficiency and predictive accuracy compared with traditional numerical models (e.g., CBM-Z and WRF-Chem), this performance advantage often comes at the cost of model interpretability.
5. Limitations of Current Studies
5.1. Insufficient Observational Data and Uncertainties in Model Simulations
Current observations primarily focus on conventional species such as O3, NOx, and VOCs, while direct measurements of key atmospheric oxidants like OH, HO2, and RO2 remain relatively limited. Notably, the spatial distribution of existing monitoring sites exhibits significant heterogeneity: over 80% of these sites are concentrated in urban areas, while observational data from suburban regions, rural areas, and ecologically sensitive zones (e.g., forest ecosystems, coastal regions) are severely lacking, with the monitoring station density in these latter areas being less than 0.1 per 1000 km2.
Accurately assessing long-term trends in atmospheric oxidation capacity hinges on sustained and continuous observational datasets, which serve as robust constraints for numerical models. However, prevailing measurement techniques still face challenges in the accurate quantification of certain critical atmospheric oxidants and short-lived intermediates—particularly highly reactive, low-concentration radicals. Current direct measurement techniques for ROx radicals remain immature. This limitation might be a significant factor constraining the performance of CTM simulations. For instance, measurements of RO2 are constrained by inherent limitations in instrumental sensitivity and selectivity issues; this technical bottleneck directly restricts our mechanistic understanding of key atmospheric oxidation processes. Addressing this gap would require sustained, in-depth scientific research to effectively bridge actual observations with model simulations. First, coordinated enhanced observations, such as comprehensive field campaigns, should be conducted to provide critical constraints for direct ROx measurements, while advancing comparative studies of emerging measurement techniques. Second, a tiered validation framework is recommended for evaluating RO2 isomerization and POA oxidation mechanisms: mechanisms should first be validated using photochemical box model simulations with specific VOCs/POA and subsequently integrated into three-dimensional chemical transport models to examine their regional impacts. Finally, high-resolution or process-oriented modeling approaches should be applied to quantify the uncertainties in climate and air quality predictions resulting from aerosol–cloud–radiation interactions, thereby guiding the prioritization of parameterization improvements. Together, these steps will significantly enhance both the mechanistic realism and predictive reliability of chemical transport models. Furthermore, the precision of several oxidation-related indicators requires further refinement, and their temporal and spatial resolution remains insufficient to capture fine-scale environmental variations. The paucity of high-frequency, continuous observations hinders the detection of rapid short-term variations (e.g., NO3 burst events) and fine-scale spatial distribution patterns, as well as long-term (decadal or longer) trend analysis, undermining the reliability of future projections of atmospheric oxidation capacity [2]. A representative illustration of such technical constraints is the underestimation of organic amines’ contribution to SOA formation in rural North China: conventional analytical techniques (e.g., aerosol mass spectrometry) lack the capability to effectively distinguish organic amines from inorganic sulfates, leading to biases in source attribution and process quantification [75].
The atmospheric oxidation capacity is subject to non-negligible biases and uncertainties in numerical simulations. A typical example is the inaccurate simulation of tropospheric O3 formation in complex urban environments—a key limitation that undermines the model’s utility for urban air quality management. This bias is primarily attributed to the incomplete representation of critical atmospheric oxidation pathways in current chemical mechanisms. For instance, the omission of isomerization reactions involving RO2 has been identified as a major contributor: such reactions modulate the efficiency of NOx-dependent O3 formation, and their exclusion directly leads to systematic deviations between simulated and observed O3 concentrations.
Beyond gas-phase processes, the intricate reaction pathways between atmospheric oxidants (e.g., OH, O3, NO3) and POA remain insufficiently characterized. The lack of quantitative understanding of POA oxidation kinetics—including the formation of secondary organic aerosols (SOAs) and the evolution of aerosol chemical composition—hinders the seamless integration of these processes into numerical models, further amplifying uncertainties in the simulation of oxidation capacity.
Current models also exhibit notable deficiencies in parameterizing aerosol–cloud–radiation (ACR) interactions. Aerosols act as both participants and modulators of photochemical reactions: by scattering and absorbing solar radiation, they alter the photolysis rates of key precursors (e.g., NO2, H2O2) that drive oxidation reactions. Clouds introduce even greater complexity, as they not only scavenge aerosols and trace gases but also create aqueous-phase reaction environments (e.g., cloud droplets) that compete with or supplement gas-phase oxidation pathways. Under climate change and carbon neutrality strategies, the feedback between radiative forcing changes and atmospheric oxidation capacity has emerged as an urgent research priority. Alterations in temperature, solar radiation, and atmospheric circulation driven by climate change are expected to perturb the sources, sinks, and reaction rates of atmospheric oxidants, yet the magnitude and direction of these impacts remain poorly constrained by existing models, requiring targeted observational and modeling efforts. Moreover, the accuracy of oxidation capacity simulations is strongly limited by input datasets, particularly emission inventories and meteorological fields. Anthropogenic emission inventories covering key sectors such as industry, transportation, power generation, residential combustion, and agriculture exhibit significant uncertainties in both spatial distribution and emission intensity, stemming from incomplete activity data and uncertain emission factors. Biogenic emissions are equally uncertain, as they are highly sensitive to environmental conditions (e.g., temperature, solar radiation) that are themselves challenging to parameterize accurately in meteorological models.
5.2. Imperfect Chemical Mechanisms
SOA derived from photochemical oxidation of VOCs constitutes a major fraction of fine particulate matter in the troposphere, with profound implications for air quality and climate. However, the extreme complexity of photochemical reactions leaves many pathways and mechanisms unresolved, while the scarcity of kinetic data introduces uncertainties in SOA formation mechanisms. Multicomponent VOC mixtures under varying oxidation conditions can exhibit nonlinear SOA yields, where observed values significantly deviate from linear predictions based on individual precursors [76]. Current models systematically underestimate global SOA production. Small α-dicarbonyls (e.g., glyoxal and methylglyoxal), which are ubiquitous in the atmosphere and derived from aromatic VOC oxidation and biogenic isoprene, demonstrate conflicting experimental and theoretical contributions to SOA, particularly for methylglyoxal [77]. Wang et al. investigated methacrolein (MACR) photooxidation in Fe(III)–oxalate systems, revealing that oxalate markedly enhances MACR oxidation rates, modulated by Fe(III) concentration, initial MACR levels, and pH. The reaction yields low-volatility organic acids and high-molecular-weight oligomers, promoting SOA formation. Dynamic changes in solution absorbance further suggest potential impacts on aerosol’s optical properties and radiative forcing [78]. While SO2 generally promotes SOA via H2SO4-driven new particle formation (NPF) and acid-catalyzed carbonyl reactions, it may suppress SOA under specific conditions. For example, SO2 can scavenge OH and stabilized Criegee intermediates (sCIs), thus offsetting its oxidative role [7]. Direct SO2–peroxide interactions or other unexplored mechanisms may also exist. For instance, during particulate pollution episodes in the Beijing–Tianjin–Hebei region, NO2-catalyzed oxidation of SO2 represents the dominant sulfate formation pathway. Critically, Wang et al. [79] demonstrated that anion accumulation at aerosol gas–liquid interfaces significantly enhances NO2 uptake, accelerating SO2 oxidation and sulfate production while simultaneously generating gaseous HONO, which is a crucial OH precursor [80]. The current models significantly underestimate HONO concentrations (e.g., the NCAR Master Mechanism shows an underestimation of approximately 90%) due to the absence of key heterogeneous reactions in the chemical mechanism. Given that HONO is crucial for daytime ROx and O3 production (contributing 55% and 42%, respectively) [27], this limitation leads directly to biases in the simulation of related photochemical processes. Such interface-enhanced oxidation effects should be incorporated into fundamental atmospheric chemical mechanisms and models. NH3 enhances SOA, primarily through gas-to-particle conversion of organic acids, although its efficiency depends on the BVOC precursors and oxidant types. Excess NH3 may decompose nascent SOA, while NH3–sCI reactions inhibit alternative SOA pathways. Acid-catalyzed NH3–carbonyl reactions in particles facilitate nitrogen-containing organic compounds (NOCs) and may enhance light absorption. Amine reactions with biogenic epoxides/carbonyls could modify the composition of SOA, although these processes require further study [7]. Systematic observations of amines across seasons and environmental conditions (e.g., O3, RH) remain lacking, obscuring their pollution levels, size distributions, and key drivers [61].
In summary, atmospheric oxidation involves highly complex chemistry. Despite progress, critical gaps persist, relating to questions such as competing pathways and transient intermediates in multi-step organic oxidations. Current mechanisms, often derived from idealized laboratory conditions, may not capture real-world complexity (e.g., high humidity/pollution). Future work must prioritize realistic environmental factors to resolve mechanisms of SOA formation and their relative contributions.
5.3. Key Knowledge Gaps
The lack of free radical measurements (especially RO2) and the imperfection of multiphase chemical mechanisms are the two most prominent bottlenecks leading to biases in AOC simulations. Despite significant progress in atmospheric chemistry research, several key knowledge gaps remain to be addressed. The current limitations in radical measurements stem from inadequate RO2 detection methods and insufficient vertical profiling capabilities. Our understanding of multiphase chemistry is hampered by incomplete parameterizations of critical aerosol–surface reactions, including SO2 uptake and NH3–organic acid partitioning processes. Model deficiencies persist in accurately representing RO2 isomerization, aerosol–radiation coupling, and emission uncertainties. Furthermore, the field requires that more mechanistic studies are conducted under realistic atmospheric conditions, particularly involving high-humidity and high-pollution scenarios. To overcome these challenges, future research should adopt an integrated approach combining advanced observational techniques (e.g., quantum cascade lasers for radical detection), controlled laboratory experiments, and machine learning-enhanced modeling frameworks. This multifaceted strategy will be essential for advancing our understanding of complex atmospheric processes.
6. Conclusions and Recommendations
The synergistic pollution of PM2.5 and ozone, driven by the AOC, remains a complex scientific and regulatory challenge. Despite advances through multi-platform observations and modeling, critical knowledge gaps hinder accurate prediction and effective control. These gaps are rooted in three interconnected limitations: persistent observational constraints, incomplete chemical mechanisms, and deficiencies in model representation.
To bridge these gaps, future research must adopt an integrated approach that systematically connects enhanced observations, refined mechanisms, and improved models. Within this framework, developing advanced methodologies to quantify key atmospheric processes emerges as an immediate priority. Specifically, the development of in situ free radical observation techniques is essential to overcome the current scarcity of direct radical measurements, which is a fundamental observational blind spot that limits our understanding of oxidation chemistry. Concurrently, improving the parameterization of gas–particle interface reactions is critical to resolve uncertainties in heterogeneous chemical pathways and to accurately represent aerosol–meteorology feedback in models, thereby reducing simulation biases for secondary aerosols.
These targeted efforts should be coordinated with broader initiatives to strengthen multidimensional monitoring networks, advance fundamental studies on VOC oxidation and multiphase chemistry, and refine regional emission control strategies. Ultimately, the convergence of these research streams with a focused investment in radical detection and interfacial process parameterization is vital to build robust predictive capabilities and support precision air quality management under carbon neutrality goals.
Supplementary Materials
The following supporting information can be downloaded at: https://www.mdpi.com/article/10.3390/toxics14020159/s1, Table S1: Key characteristics and parameters of atmospheric oxidation under different environmental (urban, suburban, rural) atmospheric pollutant emission backgrounds [81,82,83,84,85,86,87,88,89,90,91,92,93,94,95,96,97,98].
Author Contributions
Writing—original draft preparation, P.L.; writing—review and editing, Y.R., F.B., F.L., J.L., H.Z., H.L. and Z.W.; visualization, P.L. and Y.R.; supervision, Y.R.; project administration, Y.R. and H.L.; funding acquisition, Y.R. All authors have read and agreed to the published version of the manuscript.
Funding
This research was funded by the Jing-Jin-Ji Regional Integrated Environmental Improvement-National Science and Technology Major Project (Grant No. 2025ZD1201605), Key Technologies Research and Development Program (Grant No. 2023YFC3706105), and National Natural Science Foundation of China (Grant No. 41907197).
Institutional Review Board Statement
Not applicable.
Informed Consent Statement
Not applicable.
Data Availability Statement
No new data were created or analyzed in this study. Data sharing is not applicable to this article.
Conflicts of Interest
The authors declare no conflicts of interest.
References
- Seinfeld, J.H.; Pandis, S.N. Atmospheric Chemistry and Physics: From Air Pollution to Climate Change, 3rd ed.; Wiley: Hoboken, NJ, USA, 2016. [Google Scholar]
- Lu, K.; Guo, S.; Tan, Z.; Wang, H.; Shang, D.; Liu, Y.; Li, X.; Wu, Z.; Hu, M.; Zhang, Y. Exploring atmospheric free-radical chemistry in China: The self-cleansing capacity and the formation of secondary air pollution. Natl. Sci. Rev. 2019, 6, 579–594. [Google Scholar] [CrossRef] [Scilit] [PubMed]
- World Health Organization. WHO Global Air Quality Guidelines: Particulate Matter (PM2.5 and PM10), Ozone, Nitrogen Dioxide, Sulfur Dioxide and Carbon Monoxide: Executive Summary. Available online: https://iris.who.int/handle/10665/345334 (accessed on 22 September 2021).
- Hallquist, M.; Wenger, J.C.; Baltensperger, U.; Rudich, Y.; Simpson, D.; Claeys, M.; Dommen, J.; Donahue, N.M.; George, C.; Goldstein, A.H.; et al. The formation, properties and impact of secondary organic aerosol: Current and emerging issues. Atmos. Chem. Phys. 2009, 9, 5155–5236. [Google Scholar] [CrossRef] [Scilit]
- Wang, H.; Wang, H.; Lu, X.; Lu, K.; Zhang, L.; Tham, Y.J.; Shi, Z.; Aikin, K.; Fan, S.; Brown, S.S.; et al. Increased night-time oxidation over China despite widespread decrease across the globe. Nat. Geosci. 2023, 16, 217–223. [Google Scholar] [CrossRef] [Scilit]
- Luo, Y.; Zhao, T.; Meng, K.; Zhang, L.; Wu, M.; Bai, Y.; Kumar, K.R.; Cheng, X.; Yang, Q.; Liang, D. Distinct responses of urban and rural O3 pollution with secondary particle changes to anthropogenic emission reductions: Insights from a case study over North China. Sci. Total Environ. 2024, 950, 175340. [Google Scholar] [CrossRef] [Scilit]
- Xu, L.; Du, L.; Tsona, N.T.; Ge, M. Anthropogenic Effects on Biogenic Secondary Organic Aerosol Formation. Adv. Atmos. Sci. 2021, 38, 1053–1084. [Google Scholar] [CrossRef] [Scilit]
- Feng, T.; Zhao, S.; Bei, N.; Liu, S.; Li, G. Increasing atmospheric oxidizing capacity weakens emission mitigation effort in Beijing during autumn haze events. Chemosphere 2021, 281, 130855. [Google Scholar] [CrossRef] [Scilit]
- Zhou, X.; Gao, X.; Chang, Y.; Zhao, S.; Li, Y. Influence of atmospheric oxidation capacity on atmospheric particulate matters concentration in Lanzhou. Sci. Total Environ. 2024, 914, 169664. [Google Scholar] [CrossRef] [Scilit]
- Monks, P. Gas-Phase Radical Chemistry in the Troposphere. Chem. Soc. Rev. 2005, 34, 376–395. [Google Scholar] [CrossRef] [Scilit]
- Wang, G.; Iradukunda, Y.; Shi, G.; Sanga, P.; Niu, X.; Wu, Z. Hydroxyl, hydroperoxyl free radicals determination methods in atmosphere and troposphere. J. Environ. Sci. 2021, 99, 324–335. [Google Scholar] [CrossRef] [Scilit] [PubMed]
- Jia, C.; Tong, S.; Zhang, X.; Li, F.; Zhang, W.; Li, W.; Wang, Z.; Zhang, G.; Tang, G.; Liu, Z.; et al. Atmospheric oxidizing capacity in autumn Beijing: Analysis of the O3 and PM2.5 episodes based on observation-based model. J. Environ. Sci. 2023, 124, 557–569. [Google Scholar] [CrossRef] [Scilit] [PubMed]
- He, L.; Duan, Y.; Zhang, Y.; Yu, Q.; Huo, J.; Chen, J.; Cui, H.; Li, Y.; Ma, W. Effects of VOC emissions from chemical industrial parks on regional O3-PM2.5 compound pollution in the Yangtze River Delta. Sci. Total Environ. 2024, 906, 167503. [Google Scholar] [CrossRef] [Scilit]
- Tan, Z.; Lu, K.; Jiang, M.; Su, R.; Wang, H.; Lou, S.; Fu, Q.; Zhai, C.; Tan, Q.; Yue, D.; et al. Daytime atmospheric oxidation capacity in four Chinese megacities during the photochemically polluted season: A case study based on box model simulation. Atmos. Chem. Phys. 2019, 19, 3493–3513. [Google Scholar] [CrossRef] [Scilit]
- Kovacs, T.A.; Brune, W.H. Total OH Loss Rate Measurement. J. Atmos. Chem. 2001, 39, 105–122. [Google Scholar] [CrossRef] [Scilit]
- Yang, X. A Review of the Direct Measurement of Total OH Reactivity: Ambient Air and Vehicular Emission. Sustainability 2023, 15, 16246. [Google Scholar] [CrossRef] [Scilit]
- Taheri, A.; Khorsandi, B.; Alavi Moghaddam, M.R. Analysis of local and regional contributions of oxidant (OX = O3 + NO2) levels based on monitoring data, a review. Int. J. Environ. Sci. Technol. 2024, 21, 8211–8230. [Google Scholar] [CrossRef] [Scilit]
- Taheri, A.; Khorsandi, B.; Alavi Moghaddam, M.R. A long-term analysis of oxidant (OX = O3 + NO2) and its local and regional levels in Tehran, Iran, a high NOx-saturated condition. Sci. Rep. 2025, 15, 2521. [Google Scholar] [CrossRef] [Scilit]
- Liu, Z.; Wang, Y.; Hu, B.; Lu, K.; Tang, G.; Ji, D.; Yang, X.; Gao, W.; Xie, Y.; Liu, J.; et al. Elucidating the quantitative characterization of atmospheric oxidation capacity in Beijing, China. Sci. Total Environ. 2021, 771, 145306. [Google Scholar] [CrossRef] [Scilit]
- Yang, Y.; Wang, Y.; Huang, W.; Yao, D.; Zhao, S.; Wang, Y.; Ji, D.; Zhang, R.; Wang, Y. Parameterized atmospheric oxidation capacity and speciated OH reactivity over a suburban site in the North China Plain: A comparative study between summer and winter. Sci. Total Environ. 2021, 773, 145264. [Google Scholar] [CrossRef] [Scilit]
- Friedlander, S.K.; Seinfeld, J.H. Dynamic model of photochemical smog. Environ. Sci. Technol. 1969, 3, 1175–1181. [Google Scholar] [CrossRef] [Scilit]
- Liu, Y.; Wang, H.; Jing, S.; Zhou, M.; Lou, S.; Qu, K.; Qiu, W.; Wang, Q.; Li, S.; Gao, Y.; et al. Vertical Profiles of Volatile Organic Compounds in Suburban Shanghai. Adv. Atmos. Sci. 2021, 38, 1177–1187. [Google Scholar] [CrossRef] [Scilit]
- Wang, P.; Zhu, S.; Vrekoussis, M.; Brasseur, G.P.; Wang, S.; Zhang, H. Is atmospheric oxidation capacity better in indicating tropospheric O3 formation? Front. Environ. Sci. Eng. 2022, 16, 65. [Google Scholar] [CrossRef] [Scilit] [PubMed]
- Yang, X.; Li, Y.; Ma, X.; Tan, Z.; Lu, K.; Zhang, Y. Unclassical Radical Generation Mechanisms in the Troposphere: A Review. Environ. Sci. Technol. 2024, 58, 15888–15909. [Google Scholar] [CrossRef] [Scilit] [PubMed]
- Wang, G.; Jia, S.; Li, R.; Ma, S.; Chen, X.; Wu, Z.; Shi, G.; Niu, X. Seasonal variation characteristics of hydroxyl radical pollution and its potential formation mechanism during the daytime in Lanzhou. J. Environ. Sci. 2020, 95, 58–64. [Google Scholar] [CrossRef] [Scilit] [PubMed]
- Yang, X.; Lu, K.; Ma, X.; Liu, Y.; Wang, H.; Hu, R.; Li, X.; Lou, S.; Chen, S.; Dong, H.; et al. Observations and modeling of OH and HO2 radicals in Chengdu, China in summer 2019. Sci. Total Environ. 2021, 772, 144829. [Google Scholar] [CrossRef] [Scilit]
- Xue, M.; Ma, J.; Tang, G.; Tong, S.; Hu, B.; Zhang, X.; Li, X.; Wang, Y. ROx Budgets and O3 Formation during Summertime at Xianghe Suburban Site in the North China Plain. Adv. Atmos. Sci. 2021, 38, 1209–1222. [Google Scholar] [CrossRef] [Scilit]
- Wang, F.; Du, W.; Lv, S.; Ding, Z.; Wang, G. Spatial and Temporal Distributions and Sources of Anthropogenic NMVOCs in the Atmosphere of China: A Review. Adv. Atmos. Sci. 2021, 38, 1085–1100. [Google Scholar] [CrossRef] [Scilit]
- Atkinson, R.; Arey, J. Atmospheric Degradation of Volatile Organic Compounds. Chem. Rev. 2003, 103, 4605–4638. [Google Scholar] [CrossRef] [Scilit]
- Cai, B.; Cheng, H.; Kang, T. Establishing the emission inventory of biogenic volatile organic compounds and quantifying their contributions to O3 and PM2.5 in the Beijing-Tianjin-Hebei region. Atmos. Environ. 2024, 318, 120206. [Google Scholar] [CrossRef] [Scilit]
- Bianchi, F.; Kurtén, T.; Riva, M.; Mohr, C.; Rissanen, M.P.; Roldin, P.; Berndt, T.; Crounse, J.D.; Wennberg, P.O.; Mentel, T.F.; et al. Highly Oxygenated Organic Molecules (HOM) from Gas-Phase Autoxidation Involving Peroxy Radicals: A Key Contributor to Atmospheric Aerosol. Chem. Rev. 2019, 119, 3472–3509. [Google Scholar] [CrossRef] [Scilit]
- Li, J.; Chen, T.; Zhang, H.; Jia, Y.; Chu, Y.; Yan, Y.; Zhang, H.; Ren, Y.; Li, H.; Hu, J.; et al. Nonlinear effect of NOx concentration decrease on secondary aerosol formation in the Beijing-Tianjin-Hebei region: Evidence from smog chamber experiments and field observations. Sci. Total Environ. 2024, 912, 168333. [Google Scholar] [CrossRef] [Scilit]
- Fu, Z.; Guo, S.; Xie, H.-B.; Zhou, P.; Boy, M.; Yao, M.; Hu, M. A Near-Explicit Reaction Mechanism of Chlorine-Initiated Limonene: Implications for Health Risks Associated with the Concurrent Use of Cleaning Agents and Disinfectants. Environ. Sci. Technol. 2024, 58, 19762–19773. [Google Scholar] [CrossRef] [Scilit]
- Xiao, M.; Wang, M.; Mentler, B.; Garmash, O.; Lamkaddam, H.; Molteni, U.; Simon, M.; Ahonen, L.; Amorim, A.; Baccarini, A.; et al. Anthropogenic organic aerosol in Europe produced mainly through second-generation oxidation. Nat. Geosci. 2025, 18, 239–245. [Google Scholar] [CrossRef] [Scilit] [PubMed]
- Tang, X.; Lin, X.; Garcia, G.A.; Loison, J.-C.; Gouid, Z.; Abdallah, H.H.; Fittschen, C.; Hochlaf, M.; Gu, X.; Zhang, W.; et al. Identifying isomers of peroxy radicals in the gas phase: 1-C3H7O2 vs. 2-C3H7O2. Chem. Commun. 2020, 56, 15525–15528. [Google Scholar] [CrossRef] [Scilit] [PubMed]
- Wen, Z.; Lin, X.; Tang, X.; Long, B.; Wang, C.; Zhang, C.; Fittschen, C.; Yang, J.; Gu, X.; Zhang, W. Vacuum ultraviolet photochemistry of the conformers of the ethyl peroxy radical. Phys. Chem. Chem. Phys. 2021, 23, 22096–22102. [Google Scholar] [CrossRef] [Scilit] [PubMed]
- Li, Y.; Ma, X.; Lu, K.; Gao, Y.; Xu, W.; Yang, X.; Zhang, Y. Investigation of the Cyclohexene Oxidation Mechanism Through the Direct Measurement of Organic Peroxy Radicals. Environ. Sci. Technol. 2024, 58, 19807–19817. [Google Scholar] [CrossRef] [Scilit]
- Shi, Y.; Xu, Y.; Jia, L. Development and Application of Atmospheric Chemical Mechanisms. Clim. Environ. Res. 2012, 17, 112–124. (In Chinese) [Google Scholar]
- Jimenez, P.; Baldasano, J.M.; Dabdub, D. Comparison of photochemical mechanisms for air quality modeling. Atmos. Environ. 2003, 37, 4179–4194. [Google Scholar] [CrossRef] [Scilit]
- Liu, Y.; Li, J.; Ma, Y.; Zhou, M.; Tan, Z.; Zeng, L.; Lu, K.; Zhang, Y. A review of gas-phase chemical mechanisms commonly used in atmospheric chemistry modelling. J. Environ. Sci. 2023, 123, 522–534. [Google Scholar] [CrossRef] [Scilit]
- Xue, L.; Gu, R.; Wang, T.; Wang, X.; Saunders, S.; Blake, D.; Louie, P.K.K.; Luk, C.W.Y.; Simpson, I.; Xu, Z.; et al. Oxidative capacity and radical chemistry in the polluted atmosphere of Hong Kong and Pearl River Delta region: Analysis of a severe photochemical smog episode. Atmos. Chem. Phys. 2016, 16, 9891–9903. [Google Scholar] [CrossRef] [Scilit]
- Xu, Z.; Huang, X.; Nie, W.; Chi, X.; Xu, Z.; Zheng, L.; Sun, P.; Ding, A. Influence of synoptic condition and holiday effects on VOCs and ozone production in the Yangtze River Delta region, China. Atmos. Environ. 2017, 168, 112–124. [Google Scholar] [CrossRef] [Scilit]
- He, H.; Li, Z.; Dickerson, R.R. Ozone Pollution in the North China Plain during the 2016 Air Chemistry Research in Asia (ARIAs) Campaign: Observations and a Modeling Study. Air 2024, 2, 178–208. [Google Scholar] [CrossRef] [Scilit]
- Ding, D.; Xing, J.; Wang, S.; Chang, X.; Hao, J. Impacts of emissions and meteorological changes on China’s ozone pollution in the warm seasons of 2013 and 2017. Front. Environ. Sci. Eng. 2019, 13, 76. [Google Scholar] [CrossRef] [Scilit]
- Bei, N.; Li, X.; Wang, Q.; Liu, S.; Wu, J.; Liang, J.; Liu, L.; Wang, R.; Li, G. Impacts of Aerosol-Radiation Interactions on the Wintertime Particulate Pollution under Different Synoptic Patterns in the Guanzhong Basin, China. Adv. Atmos. Sci. 2021, 38, 1141–1152. [Google Scholar] [CrossRef] [Scilit]
- Li, K.; Jacob, D.J.; Shen, L.; Lu, X.; De Smedt, I.; Liao, H. Increases in surface ozone pollution in China from 2013 to 2019: Anthropogenic and meteorological influences. Atmos. Chem. Phys. 2020, 20, 11423–11433. [Google Scholar] [CrossRef] [Scilit]
- Zhou, X.; Gao, X.; Chang, Y.; Zhao, S.; Li, P. The pattern and mechanism of an unhealthy air pollution event in Lanzhou, China. Urban Clim. 2023, 48, 101409. [Google Scholar] [CrossRef] [Scilit]
- Bai, K.; Wu, C.; Li, J.; Li, K.; Guo, J.; Wang, G. Characteristics of Chemical Speciation in PM1 in Six Representative Regions in China. Adv. Atmos. Sci. 2021, 38, 1101–1114. [Google Scholar] [CrossRef] [Scilit]
- An, J.; Lv, H.; Xue, M.; Zhang, Z.; Hu, B.; Wang, J.; Zhu, B. Analysis of the Effect of Optical Properties of Black Carbon on Ozone in an Urban Environment at the Yangtze River Delta, China. Adv. Atmos. Sci. 2021, 38, 1153–1164. [Google Scholar] [CrossRef] [Scilit]
- Lyu, X.; Li, H.; Lee, S.-C.; Xiong, E.; Guo, H.; Wang, T.; de Gouw, J. Significant Biogenic Source of Oxygenated Volatile Organic Compounds and the Impacts on Photochemistry at a Regional Background Site in South China. Environ. Sci. Technol. 2024, 58, 20081–20090. [Google Scholar] [CrossRef] [Scilit]
- Pfannerstill, E.Y.; Arata, C.; Zhu, Q.; Schulze, B.C.; Ward, R.; Woods, R.; Harkins, C.; Schwantes, R.H.; Seinfeld, J.H.; Bucholtz, A.; et al. Temperature-dependent emissions dominate aerosol and ozone formation in Los Angeles. Science 2024, 384, 1324–1329. [Google Scholar] [CrossRef] [Scilit]
- Chen, T.; Zhang, P.; Ma, Q.; Chu, B.; Liu, J.; Ge, Y.; He, H. Smog Chamber Study on the Role of NOx in SOA and O3 Formation from Aromatic Hydrocarbons. Environ. Sci. Technol. 2022, 56, 13654–13663. [Google Scholar] [CrossRef] [Scilit]
- Pullinen, I.; Schmitt, S.; Kang, S.; Sarrafzadeh, M.; Schlag, P.; Andres, S.; Kleist, E.; Mentel, T.F.; Rohrer, F.; Springer, M.; et al. Impact of NOx on secondary organic aerosol (SOA) formation from α-pinene and β-pinene photooxidation: The role of highly oxygenated organic nitrates. Atmos. Chem. Phys. 2020, 20, 10125–10147. [Google Scholar] [CrossRef] [Scilit]
- Cui, M.; An, X.; Xing, L.; Li, G.; Tang, G.; He, J.; Long, X.; Zhao, S. Simulated Sensitivity of Ozone Generation to Precursors in Beijing during a High O3 Episode. Adv. Atmos. Sci. 2021, 38, 1223–1237. [Google Scholar] [CrossRef] [Scilit]
- Shao, B.; Cui, Y.; He, Q.; Guo, L.; Gao, J.; Zhao, J.; Wang, X. Parameterized atmospheric oxidation capacity during summer at an urban site in Taiyuan and implications for O3 pollution control. Atmos. Pollut. Res. 2024, 15, 102181. [Google Scholar] [CrossRef] [Scilit]
- Kang, Y.; Tang, G.; Li, Q.; Liu, B.; Cao, J.; Hu, Q.; Wang, Y. Evaluation and Evolution of MAX-DOAS-observed Vertical NO2 Profiles in Urban Beijing. Adv. Atmos. Sci. 2021, 38, 1188–1196. [Google Scholar] [CrossRef] [Scilit]
- Zhu, Q.; Cao, L.-M.; Tang, M.-X.; Huang, X.-F.; Saikawa, E.; He, L.-Y. Characterization of Organic Aerosol at a Rural Site in the North China Plain Region: Sources, Volatility and Organonitrates. Adv. Atmos. Sci. 2021, 38, 1115–1127. [Google Scholar] [CrossRef] [Scilit]
- Yu, K.; Zhu, Q.; Du, K.; Huang, X.F. Characterization of nighttime formation of particulate organic nitrates based on high-resolution aerosol mass spectrometry in an urban atmosphere in China. Atmos. Chem. Phys. 2019, 19, 5235–5249. [Google Scholar] [CrossRef] [Scilit]
- Ma, F.; Wang, H.; Ding, Y.; Zhang, S.; Wu, G.; Li, Y.; Gong, D.; Ristovski, Z.; He, C.; Wang, B. Amplified Secondary Organic Aerosol Formation Induced by Anthropogenic–Biogenic Interactions in Forests Around Megacities. J. Geophys. Res. Atmos. 2024, 129, e2024JD041679. [Google Scholar] [CrossRef] [Scilit]
- Yang, C.; Hong, Z.; Chen, J.; Xu, L.; Zhuang, M.; Huang, Z. Characteristics of secondary organic aerosols tracers in PM2.5 in three central cities of the Yangtze river delta, China. Chemosphere 2022, 293, 133637. [Google Scholar] [CrossRef] [Scilit]
- Du, W.; Wang, X.; Yang, F.; Bai, K.; Wu, C.; Liu, S.; Wang, F.; Lv, S.; Chen, Y.; Wang, J.; et al. Particulate Amines in the Background Atmosphere of the Yangtze River Delta, China: Concentration, Size Distribution, and Sources. Adv. Atmos. Sci. 2021, 38, 1128–1140. [Google Scholar] [CrossRef] [Scilit]
- Gao, Z.; Zhou, X. A review of the CAMx, CMAQ, WRF-Chem and NAQPMS models: Application, evaluation and uncertainty factors. Environ. Pollut. 2024, 343, 123183. [Google Scholar] [CrossRef] [Scilit]
- da Costa, T.F.; Carvalho, J.B.B.; Pedruzzi, R.; Albuquerque, T.T.A.; Martins, E.M. A Systematic Review of Tropospheric Ozone Modeling Using Community Multiscale Air Quality Model (CMAQ). J. Braz. Chem. Soc. 2024, 35, e-20240042. [Google Scholar] [CrossRef] [Scilit]
- Binkowski, F.S.; Roselle, S.J. Models-3 Community Multiscale Air Quality (CMAQ) model aerosol component 1. Model description. J. Geophys. Res. Atmos. 2003, 108, 4183. [Google Scholar] [CrossRef] [Scilit]
- Wesely, M.L. Parameterization of surface resistances to gaseous dry deposition in regional-scale numerical models. Atmos. Environ. 1989, 23, 1293–1304. [Google Scholar] [CrossRef] [Scilit]
- Li, G.; Zhang, R.; Fan, J.; Tie, X. Impacts of black carbon aerosol on photolysis and ozone. J. Geophys. Res. Atmos. 2005, 110, D23206. [Google Scholar] [CrossRef] [Scilit]
- Tie, X.; Madronich, S.; Walters, S.; Zhang, R.; Rasch, P.; Collins, W. Effect of clouds on photolysis and oxidants in the troposphere. J. Geophys. Res. Atmos. 2003, 108, 4642. [Google Scholar] [CrossRef] [Scilit]
- Nenes, A.; Pandis, S.N.; Pilinis, C. ISORROPIA: A New Thermodynamic Equilibrium Model for Multiphase Multicomponent Inorganic Aerosols. Aquat. Geochem. 1998, 4, 123–152. [Google Scholar] [CrossRef] [Scilit]
- Donahue, N.M.; Robinson, A.L.; Stanier, C.O.; Pandis, S.N. Coupled Partitioning, Dilution, and Chemical Aging of Semivolatile Organics. Environ. Sci. Technol. 2006, 40, 2635–2643. [Google Scholar] [CrossRef] [Scilit]
- Robinson, A.L.; Donahue, N.M.; Shrivastava, M.K.; Weitkamp, E.A.; Sage, A.M.; Grieshop, A.P.; Lane, T.E.; Pierce, J.R.; Pandis, S.N. Rethinking Organic Aerosols: Semivolatile Emissions and Photochemical Aging. Science 2007, 315, 1259–1262. [Google Scholar] [CrossRef] [Scilit]
- Emery, C.; Liu, Z.; Russell, A.G.; Odman, M.T.; Yarwood, G.; Kumar, N. Recommendations on statistics and benchmarks to assess photochemical model performance. J. Air Waste Manag. Assoc. 2017, 67, 582–598. [Google Scholar] [CrossRef] [Scilit]
- Dong, J.-Q.; Hu, D.-M.; Yan, Y.-L.; Peng, L.; Zhang, P.-H.; Niu, Y.-Y.; Duan, X.-L. Revealing Driving Factors of Urban O3 Based on Explainable Machine Learning. Environ. Sci. 2023, 44, 3660–3668. (In Chinese) [Google Scholar]
- Wang, Z.; Li, J.; Wu, L.; Zhu, M.; Zhang, Y.; Ye, Z. Deep learning-based gas-phase chemical kinetics kernel emulator: Application in a global air quality simulation case. Front. Environ. Sci. 2022, 10, 955980. [Google Scholar] [CrossRef] [Scilit]
- Qiu, Y.; Feng, J.; Zhang, Z.; Zhao, X.; Li, Z.; Ma, Z.; Liu, R.; Zhu, J. Regional aerosol forecasts based on deep learning and numerical weather prediction. npj Clim. Atmos. Sci. 2023, 6, 71. [Google Scholar] [CrossRef] [Scilit]
- Chen, C.; Zhang, Z.; Wei, L.; Qiu, Y.; Xu, W.; Song, S.; Sun, J.; Li, Z.; Chen, Y.; Ma, N.; et al. The importance of hydroxymethanesulfonate (HMS) in winter haze episodes in North China Plain. Environ. Res. 2022, 211, 113093. [Google Scholar] [CrossRef] [Scilit] [PubMed]
- Takeuchi, M.; Berkemeier, T.; Eris, G.; Ng, N.L. Non-linear effects of secondary organic aerosol formation and properties in multi-precursor systems. Nat. Commun. 2022, 13, 7883. [Google Scholar] [CrossRef] [Scilit] [PubMed]
- Ji, Y.; Shi, Q.; Li, Y.; An, T.; Zheng, J.; Peng, J.; Gao, Y.; Chen, J.; Li, G.; Wang, Y.; et al. Carbenium ion-mediated oligomerization of methylglyoxal for secondary organic aerosol formation. Proc. Natl. Acad. Sci. USA 2020, 117, 13294–13299. [Google Scholar] [CrossRef] [Scilit] [PubMed]
- Wang, Y.; Zhao, J.; Liu, H.; Li, Y.; Dong, W.; Wu, Y. Photooxidation of Methacrolein in Fe(III)-Oxalate Aqueous System and Its Atmospheric Implication. Adv. Atmos. Sci. 2021, 38, 1252–1263. [Google Scholar] [CrossRef] [Scilit]
- Wang, G.; Zhang, S.; Wu, C.; Zhu, T.; Xu, X.; Ge, S.; Sun, H.; Sun, Z.; Wang, J.; Ji, Y.; et al. Atmospheric sulfate aerosol formation enhanced by interfacial anions. Proc. Natl. Acad. Sci. USA Nexus 2025, 4, pgaf058. [Google Scholar] [CrossRef] [Scilit]
- Chen, T.; Ren, Y.; Zhang, Y.; Ma, Q.; Chu, B.; Liu, P.; Zhang, P.; Zhang, C.; Ge, Y.; Mellouki, A.; et al. Additional HONO and OH Generation from Photoexcited Phenyl Organic Nitrates in the Photoreaction of Aromatics and NOx. Environ. Sci. Technol. 2024, 58, 5911–5920. [Google Scholar] [CrossRef] [Scilit]
- Wang, Y.-L.; Song, W.; Yang, W.; Sun, X.-C.; Tong, Y.-D.; Wang, X.-M.; Liu, C.-Q.; Bai, Z.-P.; Liu, X.-Y. Influences of Atmospheric Pollution on the Contributions of Major Oxidation Pathways to PM2.5 Nitrate Formation in Beijing. J. Geophys. Res. Atmos. 2019, 124, 4174–4185. [Google Scholar] [CrossRef] [Scilit]
- Guan, Q.; Cai, A.; Wang, F.; Yang, L.; Xu, C.; Liu, Z. Spatio-temporal variability of particulate matter in the key part of Gansu Province, Western China. Environ. Pollut. 2017, 230, 189–198. [Google Scholar] [CrossRef] [Scilit]
- Hu, H.; Liang, Y.; Li, T.; She, Y.; Wang, Y.; Yang, T.; Zhou, M.; Li, Z.; Li, C.; Xiao, H.; et al. Pathway-specific responses of isoprene-derived secondary organic aerosol formation to anthropogenic emission reductions in a megacity in eastern China. EGUsphere 2025, 25, 17889–17906. [Google Scholar] [CrossRef] [Scilit]
- Shi, X.; Ge, Y.; Zheng, J.; Ma, Y.; Ren, X.; Zhang, Y. Budget of nitrous acid and its impacts on atmospheric oxidative capacity at an urban site in the central Yangtze River Delta region of China. Atmos. Environ. 2020, 238, 117725. [Google Scholar] [CrossRef] [Scilit]
- Gao, L.; Yue, X.; Meng, X.; Du, L.; Lei, Y.; Tian, C.; Qiu, L. Comparison of Ozone and PM2.5 Concentrations over Urban, Suburban, and Background Sites in China. Adv. Atmos. Sci. 2020, 37, 1297–1309. [Google Scholar] [CrossRef] [Scilit]
- Zhang, X.; Tong, S.; Jia, C.; Zhang, W.; Wang, Z.; Tang, G.; Hu, B.; Liu, Z.; Wang, L.; Zhao, P.; et al. Elucidating HONO formation mechanism and its essential contribution to OH during haze events. npj Clim. Atmos. Sci. 2023, 6, 55. [Google Scholar] [CrossRef]
- Duan, J.; Huang, R.J.; Gu, Y.; Lin, C.; Zhong, H.; Xu, W.; Liu, Q.; You, Y.; Ovadnevaite, J.; Ceburnis, D.; et al. Measurement report: Large contribution of biomass burning and aqueous-phase processes to the wintertime secondary organic aerosol formation in Xi’an, Northwest China. Atmos. Chem. Phys. 2022, 22, 10139–10153. [Google Scholar] [CrossRef] [Scilit]
- Liu, T.; Hong, Y.; Li, M.; Xu, L.; Chen, J.; Bian, Y.; Yang, C.; Dan, Y.; Zhang, Y.; Xue, L.; et al. Atmospheric oxidation capacity and ozone pollution mechanism in a coastal city of southeastern China: Analysis of a typical photochemical episode by an observation-based model. Atmos. Chem. Phys. 2022, 22, 2173–2190. [Google Scholar] [CrossRef] [Scilit]
- Chen, G.; Liu, T.; Chen, J.; Xu, L.; Hu, B.; Yang, C.; Fan, X.; Li, M.; Hong, Y.; Ji, X.; et al. Atmospheric oxidation capacity and O3 formation in a coastal city of southeast China: Results from simulation based on four-season observation. J. Environ. Sci. 2024, 136, 68–80. [Google Scholar] [CrossRef] [Scilit]
- Zhu, J.; Wang, S.; Wang, H.; Jing, S.; Lou, S.; Saiz-Lopez, A.; Zhou, B. Observationally constrained modeling of atmospheric oxidation capacity and photochemical reactivity in Shanghai, China. Atmos. Chem. Phys. 2020, 20, 1217–1232. [Google Scholar] [CrossRef] [Scilit]
- Dawidowski, L.; Gelman Constantin, J.; Herrera Murillo, J.; Gómez-Marín, M.; Nogueira, T.; Blanco Jiménez, S.; Díaz-Suárez, V.; Baraldo Victorica, F.; Lichtig, P.; Díaz Resquin, M.; et al. Carbonaceous fraction in PM2.5 of six Latin American cities: Seasonal variations, sources and secondary organic carbon contribution. Sci. Total Environ. 2024, 948, 174630. [Google Scholar] [CrossRef] [Scilit]
- Ma, S.; Wang, N.; Zhang, J.; Ye, D.; Wang, L. Ammonia chemistry and oxidation dynamics as dual driving factors of PM2.5 nitrate pollution: Insights from the spatiotemporal disparities in central China. J. Environ. Manag. 2025, 392, 126594. [Google Scholar] [CrossRef] [Scilit]
- Azmi, S.; Sharma, M. Global PM2.5 and secondary organic aerosols (SOA) levels with sectorial contribution to anthropogenic and biogenic SOA formation. Chemosphere 2023, 336, 139195. [Google Scholar] [CrossRef] [Scilit]
- Ge, Y.; Shi, X.; Ma, Y.; Zhang, W.; Ren, X.; Zheng, J.; Zhang, Y. Seasonality of nitrous acid near an industry zone in the Yangtze River Delta region of China: Formation mechanisms and contribution to the atmospheric oxidation capacity. Atmos. Environ. 2021, 254, 118420. [Google Scholar] [CrossRef] [Scilit]
- Wang, R.; Wang, L.; Yang, Y.; Zhan, J.; Ji, D.; Hu, B.; Ling, Z.; Xue, M.; Zhao, S.; Yao, D.; et al. Comparative analysis for the impacts of VOC subgroups and atmospheric oxidation capacity on O3 based on different observation-based methods at a suburban site in the North China Plain. Environ. Res. 2024, 248, 118250. [Google Scholar] [CrossRef] [Scilit]
- Hong, Y.; Xu, X.; Liao, D.; Liu, T.; Ji, X.; Xu, K.; Liao, C.; Wang, T.; Lin, C.; Chen, J. Measurement report: Effects of anthropogenic emissions and environmental factors on the formation of biogenic secondary organic aerosol (BSOA) in a coastal city of southeastern China. Atmos. Chem. Phys. 2022, 22, 7827–7841. [Google Scholar] [CrossRef] [Scilit]
- Elshorbany, Y.; Zhu, Y.; Wang, Y.; Zhou, X.; Sanderfield, S.; Ye, C.; Hayden, M.; Peters, A.J. Seasonal dependency of the atmospheric oxidizing capacity of the marine boundary layer of Bermuda. Atmos. Environ. 2022, 289, 119326. [Google Scholar] [CrossRef] [Scilit]
- Kang, S.; Hong, S.; Lee, Y.; Park, G.; Park, T.; Ban, J.; Kim, K.; Kim, Y.; Choi, Y.; Park, J.; et al. Seasonal chemical characteristics and formation of potential secondary aerosols of a remote area in South Korea using an oxidation flow reactor. Atmos. Environ. 2025, 355, 121216. [Google Scholar] [CrossRef] [Scilit]
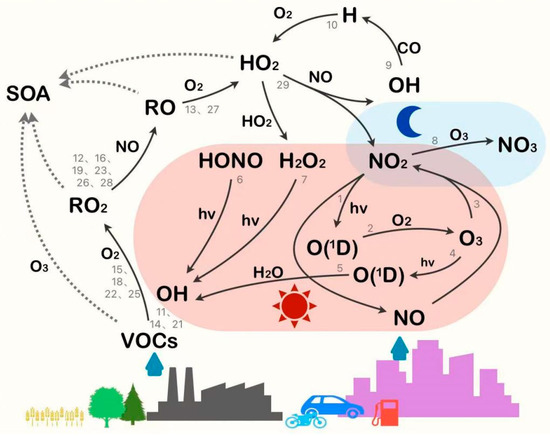
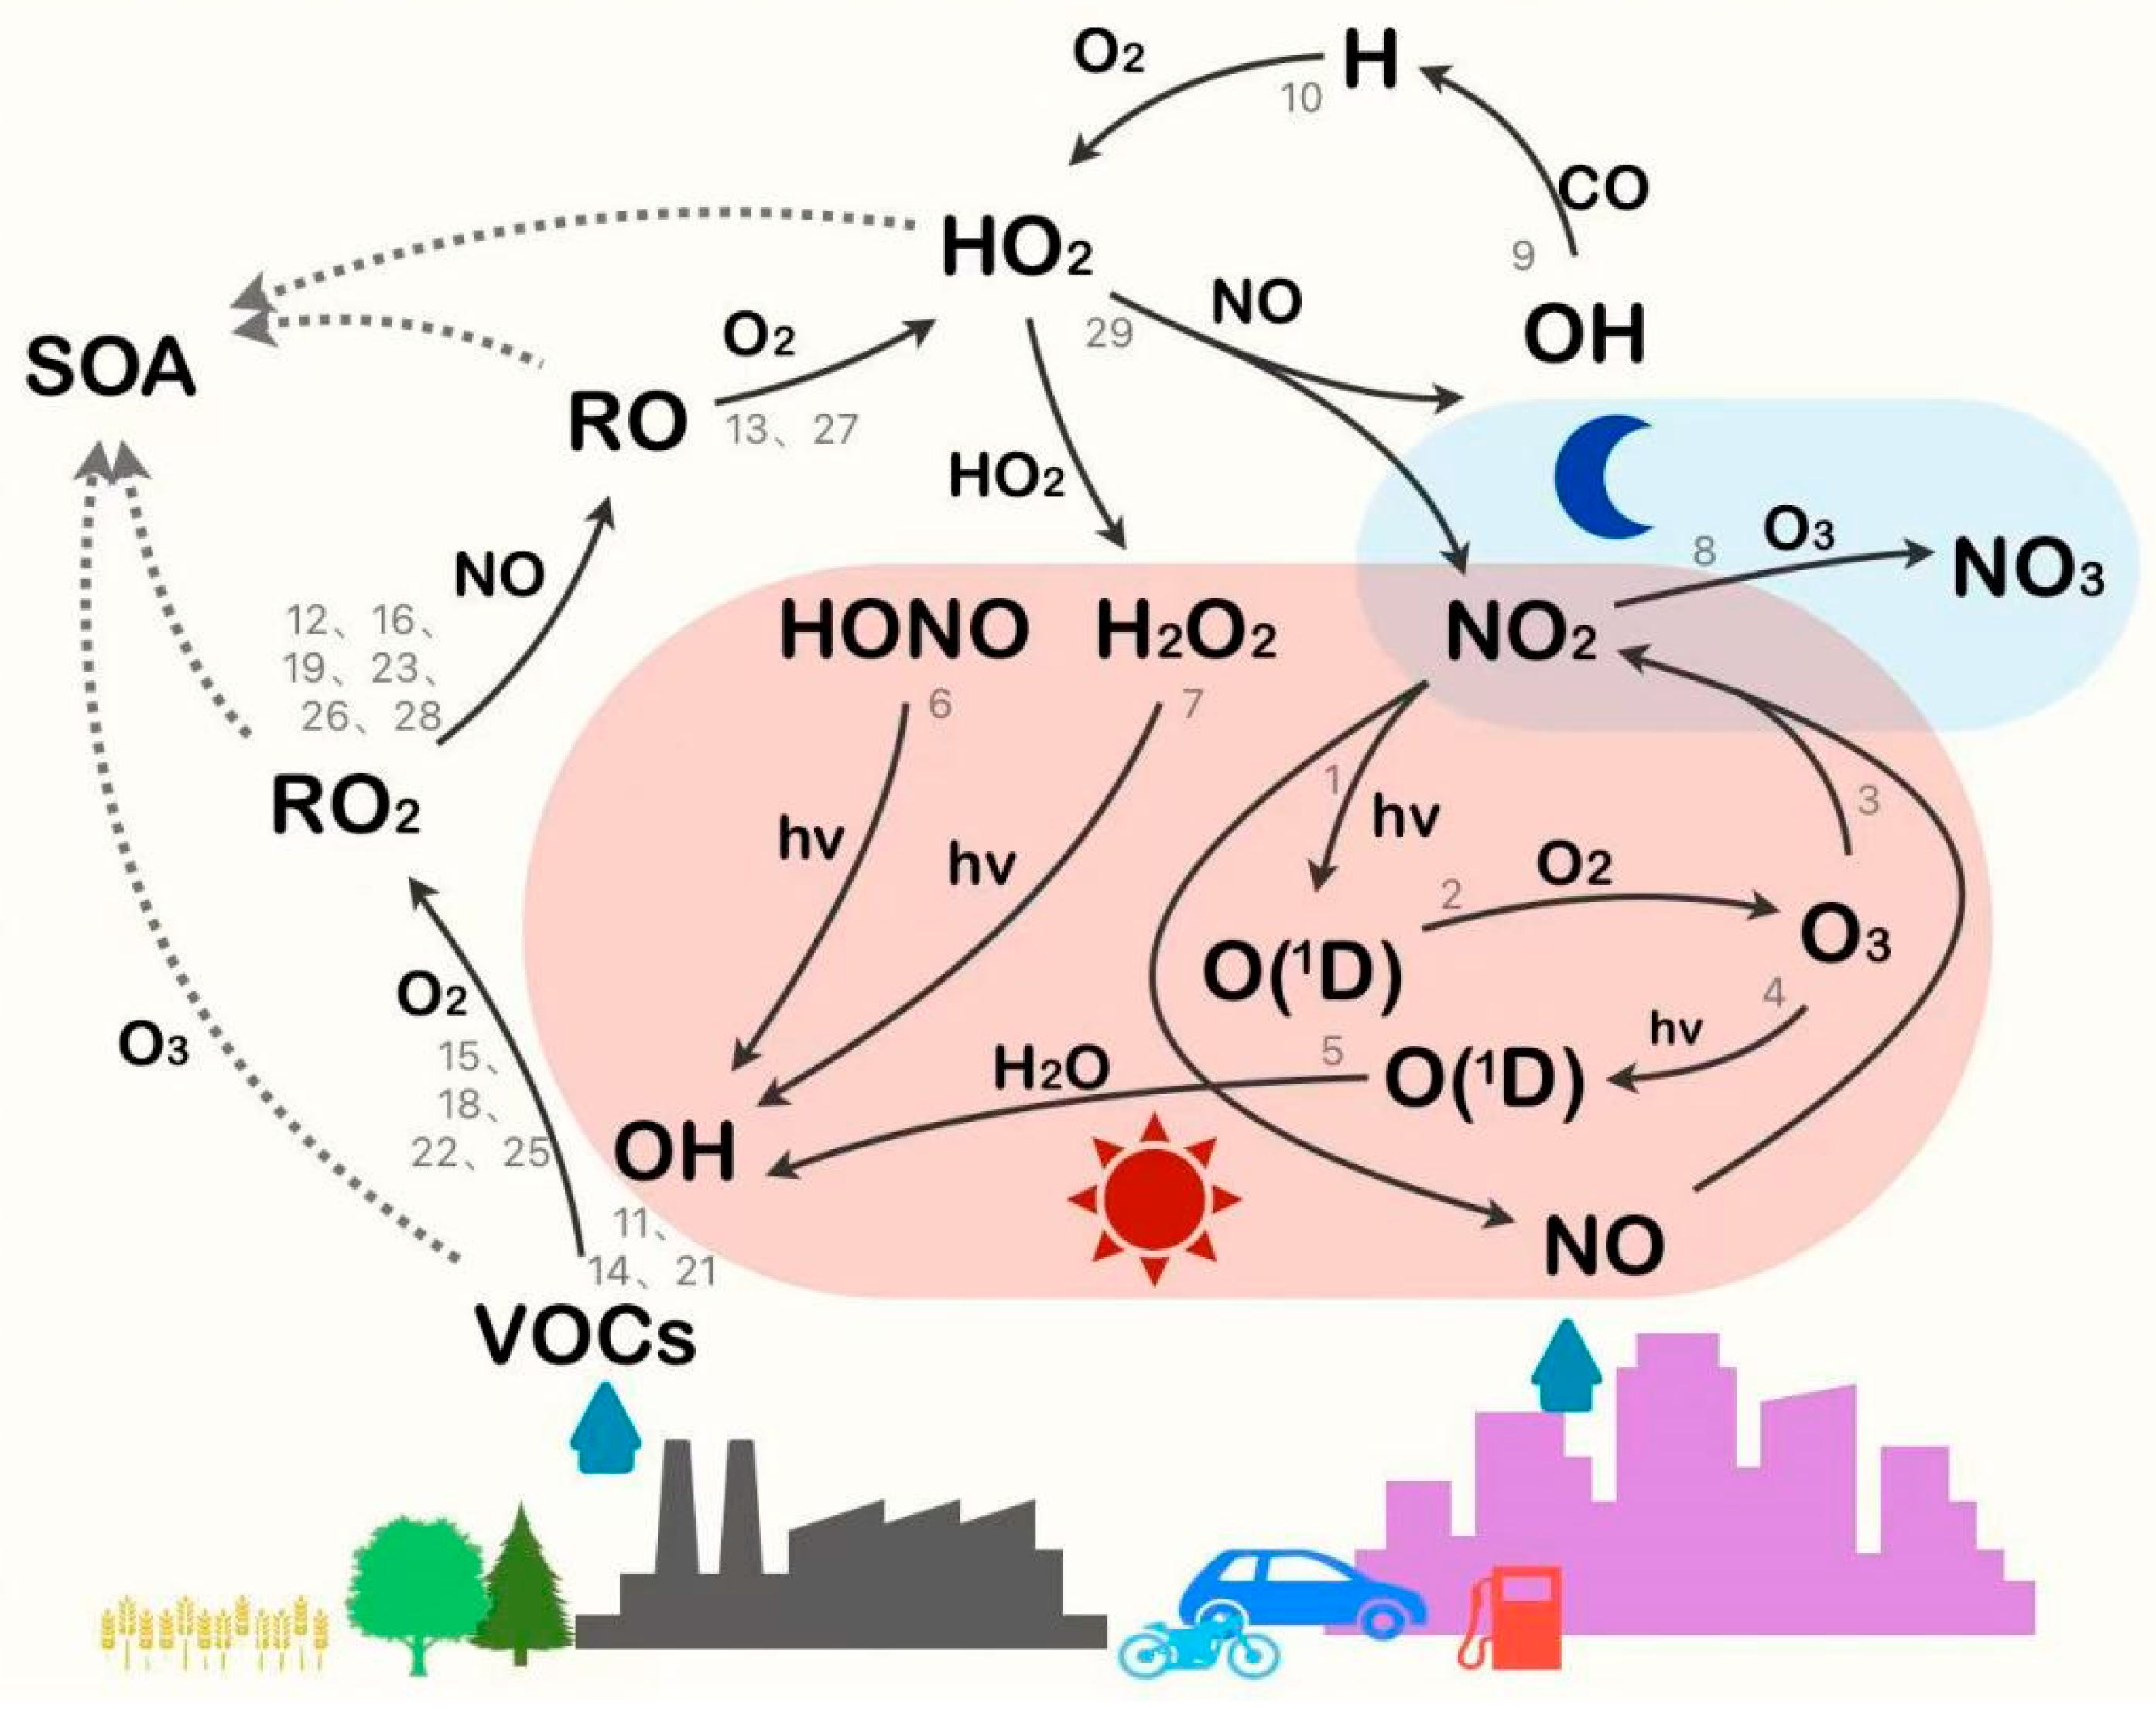
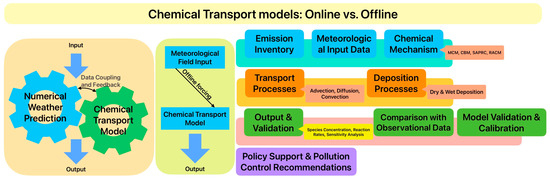
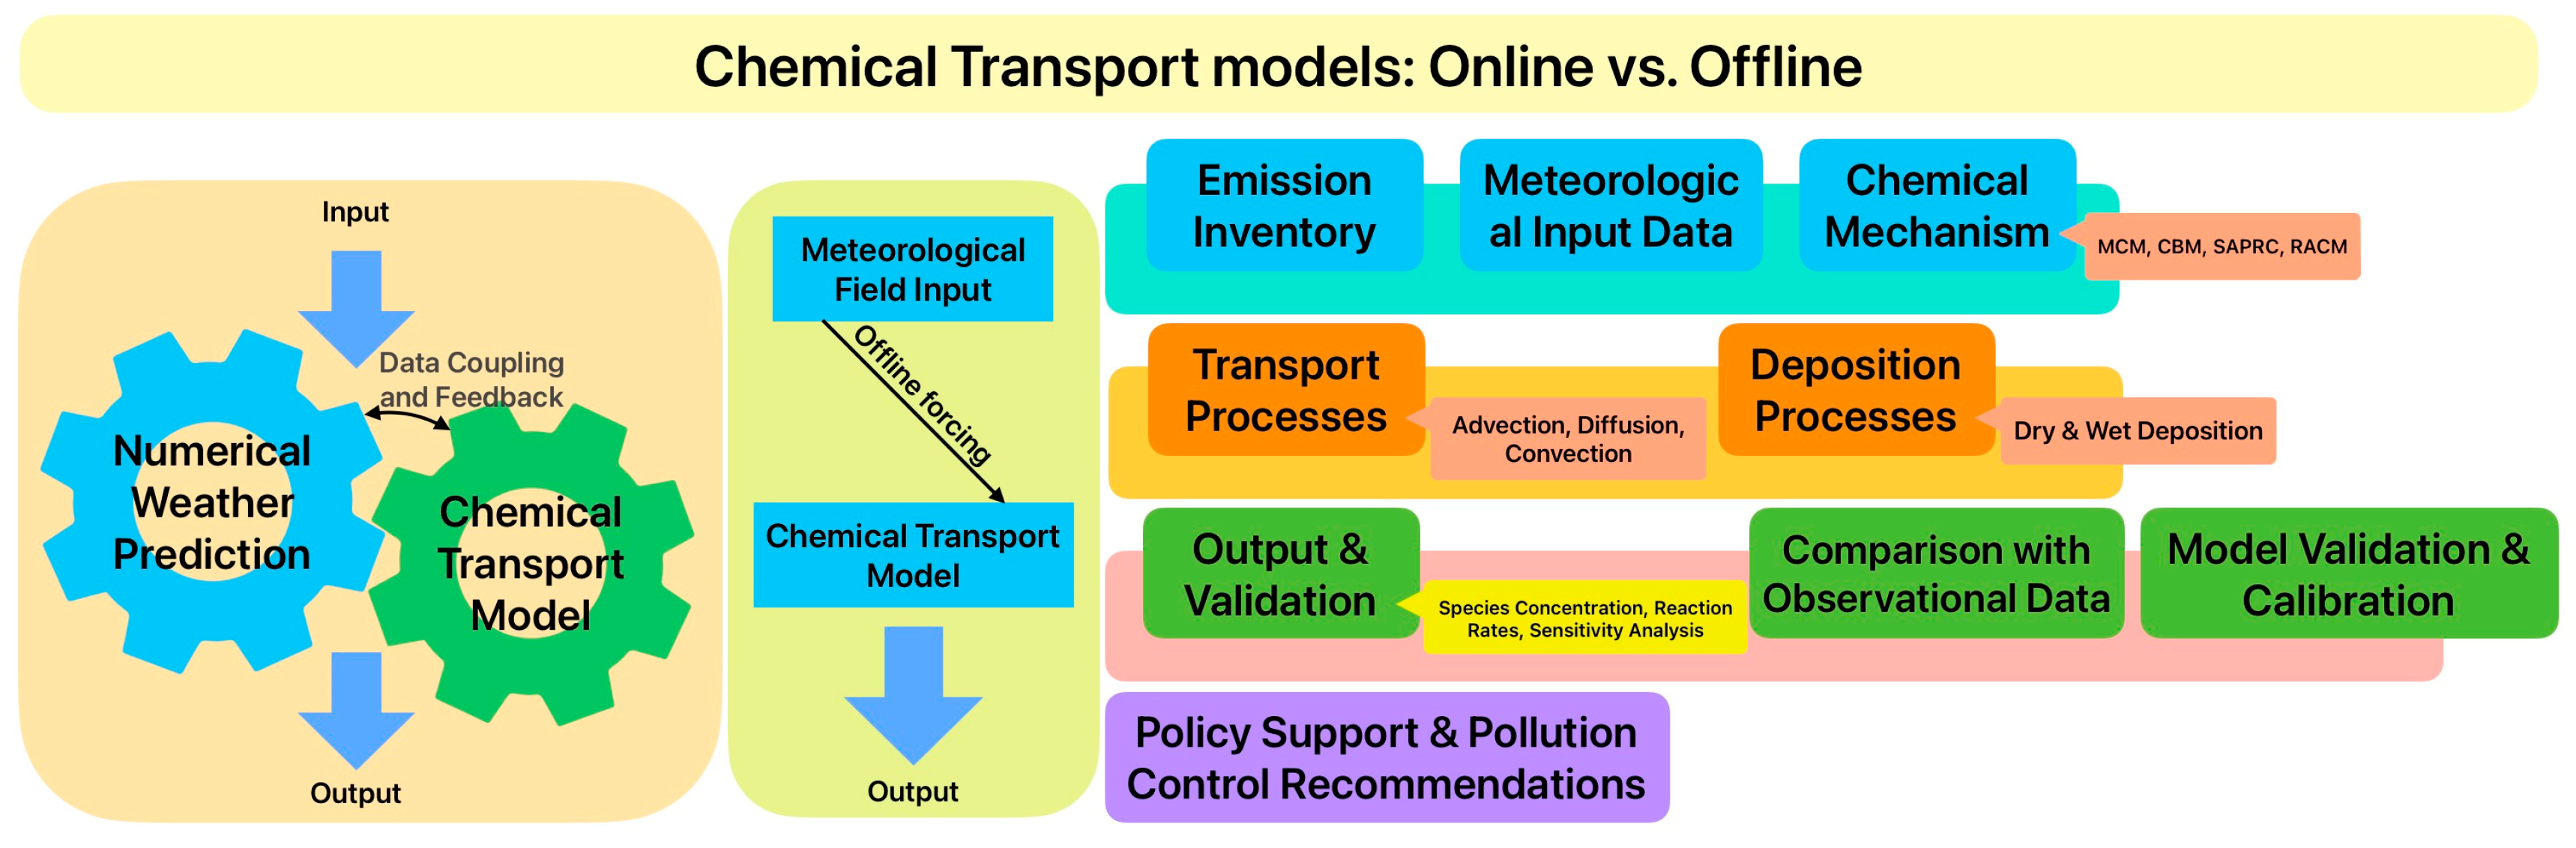

Disclaimer/Publisher’s Note: The statements, opinions and data contained in all publications are solely those of the individual author(s) and contributor(s) and not of MDPI and/or the editor(s). MDPI and/or the editor(s) disclaim responsibility for any injury to people or property resulting from any ideas, methods, instructions or products referred to in the content. |
© 2026 by the authors. Licensee MDPI, Basel, Switzerland. This article is an open access article distributed under the terms and conditions of the Creative Commons Attribution (CC BY) license.