


Abstract
Background/Objectives: UK ports are central to maritime decarbonisation, but comparable evidence on implementation remains limited. This study examines documented practices at 16 major UK ports represented by 17 analytical cases. Methods: A documentary multiple-case design classified 408 case indicator assessments across six dimensions and 24 indicators. Five ordered categories described documented implementation maturity, and results were compared using category frequencies and distributions. Results: Solar generation, efficient infrastructure, equipment electrification, rail connectivity, and industry partnerships were more extensively documented. Wind, hydrogen, green corridors, and just-in-time operations were largely absent from the public record or at planning and pilot stages. Patterns also varied by port type and ownership. Conclusions: The study identifies transferable implementation patterns while distinguishing documented activity from verified emissions effectiveness. Greater disclosure, coordinated infrastructure planning, and sustained cross-sector partnerships are needed to support wider implementation.
1. Introduction
Maritime transportation plays a vital role in the economy and international trade of the United Kingdom, with about 95% of all goods transported by sea [1]. The maritime sector contributes approximately £17 billion to the UK economy and directly provides about 220,000 jobs [2]. As an island nation, the UK relies on maritime transport for international and domestic logistics. Ferry services, coastal shipping, and inland ports are also important components of freight and passenger mobility. The UK port network includes commercial, fishing, and leisure facilities, of which 51 are designated as major ports by the Department for Transport [3].
Despite their economic significance, ports and maritime transport also contribute to greenhouse gas (GHG) emissions. According to the UK Department for Transport [1], domestic shipping and port activities accounted for around five per cent of UK transport emissions in 2022, equivalent to about 5.5 million tonnes of carbon dioxide (CO2). This combined economic and environmental role makes ports an important focus of national decarbonisation policy.
Previous research has mainly taken a global perspective on maritime decarbonisation, identifying broad measures but paying less attention to how such initiatives unfold in specific national contexts. Yet, the ownership structure, typological diversity, geographical distribution, and economic roles of UK ports indicate the need for a more localised and comparative analysis. Prior studies have shown that variations in ownership and governance models strongly influence investment capacity, regulatory responsiveness, and the adoption of environmental measures [4,5]. Similarly, recent analyses highlight that sustainability initiatives in port systems are shaped by contextual factors such as cargo type, hinterland connectivity, regional policy frameworks, and supply chain perspectives [6,7,8]. Such diversity underscores the importance of a comparative approach for understanding how decarbonisation strategies are adopted, implemented, and scaled across complex, asset-intensive operations.
In response to the growing urgency of maritime decarbonisation, the UK Government has introduced strategic frameworks to guide the sector’s transition. Maritime 2050 and the Clean Maritime Plan [9] established long-term ambitions and near-term actions. The Maritime Decarbonisation Strategy [10] subsequently set milestones for reducing maritime GHG emissions by 2030 and 2040 and achieving net zero by 2050. These policies provide a common national context in which port-level implementation can be compared.
The UK port system is highly heterogeneous. Approximately 70% of cargo throughput is handled by privately owned and operated ports, while several trust ports and a smaller number of municipally owned ports operate under different governance models. This mix leads to considerable diversity in port size, financial capacity, operational focus, and investment priorities. Indeed, a government-sponsored report notes that “ports in the UK come in different shapes, sizes, ownership models, business and revenue models, and vary in the goods they handle and services they offer” [11]. Such variability has been shown to influence the adoption of environmental measures and complicates efforts to generalise findings from single-port studies. Most prior research either examines global trends or focuses on individual ports, leaving a gap in understanding how decarbonisation practices vary across a national system.
This study addresses these gaps through an exploratory comparison of 16 major UK ports represented by 17 analytical cases. The cases differ in port type, ownership and regional location. Publicly available documents are used to classify initiatives across six operational dimensions and to describe their documented implementation stage, from planning and trials to more established deployment.
The contribution is threefold. First, the study provides a national comparison across heterogeneous UK ports. Second, it applies a transparent, evidence-linked framework for assessing documented implementation maturity. Third, it examines how the distribution of documented practices varies by operational dimension, port type, ownership, and region. The study does not estimate causal emissions reductions, cost-effectiveness, or long-term performance.
The study is exploratory and comparative; therefore, it is guided by research questions rather than confirmatory hypotheses:
RQ1: What practices of energy management and decarbonisation have been initiated or implemented in major UK ports?
RQ2: To what extent do these practices vary across different operational dimensions?
RQ3: How do patterns of decarbonisation implementation differ across ports with respect to ownership model, port type, and regional context?
To answer these questions, we adopt a multiple-case study design informed by a targeted synthesis of recent review papers published between 2017 and 2024 on port decarbonisation, rather than a full systematic review. We compile implementation evidence by extracting publicly available documentation of decarbonisation initiatives, including sustainability reports, port authority publications, regulatory filings, and official announcements, for sixteen major UK ports. These initiatives are grouped into six operational dimensions, namely energy supply and management, infrastructure and equipment, operational efficiency, transport connectivity, policy and regulation, and stakeholder partnerships, and are assessed according to their observed stage of implementation.
This structured approach supports cross-case comparison despite the absence of consistent emissions and investment data. It is suited to the heterogeneous UK port sector, where ownership, governance, and hinterland connections influence implementation. The analysis identifies recurring documented patterns, relative gaps, and transferable lessons without treating public disclosure as verified environmental performance.
The research is intended to inform port authorities, operators, policymakers, and other stakeholders seeking to advance port decarbonisation. It also contributes to the operations management literature by showing how technological, operational, regulatory, and collaborative initiatives are combined within complex, asset-intensive settings.
The rest of the paper is organised as follows. Section 2 reviews port decarbonisation research and the UK policy context. Section 3 explains the case selection, documentary evidence, and coding procedure. Section 4 presents the cases by port type. Section 5 compares documented implementation patterns. Section 6 develops managerial and policy recommendations. Section 7 concludes and outlines limitations and future research.
2. Literature Review
The transition towards sustainable maritime operations has made seaport decarbonisation a central research theme. Numerous studies have examined technological innovations, policy instruments, and operational measures to reduce emissions. However, most of this work has either focused on global trends or on single-port case studies, offering limited insight into how decarbonisation practices vary across ports within a single national system.
The UK port governance model is distinctive compared with many other countries. Around 70% of UK cargo throughput is handled by privately owned and operated ports, where investment decisions are largely market-driven. In addition, the UK has several trust ports, such as London and Dover, which are independent statutory bodies that operate on a “no dividend” basis and reinvest surpluses into port development. A smaller number of municipality-owned ports remain, typically at the regional or local scale. Unlike state- or municipality-owned ports in countries such as Belgium or China, where governments directly fund and operate facilities, the UK government’s role is primarily indirect, shaping outcomes through strategies, regulations, and targeted funding programmes, such as the Clean Maritime Demonstration Competition.
This governance structure creates both opportunities and challenges for decarbonisation. On the one hand, it provides flexibility and the ability to mobilise private capital. On the other hand, it leads to coordination difficulties, uneven investment capacity, and limited disclosure of information. These factors make the UK an important setting for studying how sustainability measures are implemented under diverse ownership and operational arrangements.
The literature review has three purposes. It critically synthesises recent work on technological, operational, and policy measures; explains the UK policy context; and identifies the gap addressed by the comparative case analysis. It is a targeted synthesis that supports the analytical framework, not a separate systematic review.
2.1. Literature Review Articles on Seaport Decarbonisation
Over the past decade, a growing body of review papers has addressed the decarbonisation of maritime activities, reflecting the increasing urgency of transitioning to sustainable operations. These reviews approach the subject from a variety of angles, including technological solutions, policy frameworks, operational strategies, and sustainability assessment methods. Collectively, they provide valuable insights into the global state of knowledge, while also revealing important gaps that motivate the present study.
Styhre et al. [12] compared GHG emissions across major ports and found that at-berth activities contributed 60 to 88 percent of total emissions, varying with vessel mix and call frequency. The study highlighted the potential importance of onshore power supply and operational efficiency measures, stressing the need for port-specific strategies tailored to infrastructure and traffic patterns. Bjerkan and Seter [7] reviewed sustainability assessment tools and decision support frameworks relevant to ports, linking environmental performance improvements to policy and digital compliance mechanisms, but giving limited attention to organisational adoption challenges. Iris and Lam [13] synthesised energy efficiency practices, categorising them into operational, technological, renewable, and smart energy management solutions. They highlighted the potential of onshore power supply (OPS), electrification, AI-assisted optimisation, and smart grids, while noting that these approaches remained underdeveloped and underfunded. Lim et al. [14] reviewed port sustainability frameworks, mapping environmental, social, and economic dimensions and confirming air quality and CO2 reduction as dominant drivers, though they placed less emphasis on specific decarbonisation pathways.
From 2020 onwards, review studies became more systematic, broadening the technological scope and increasingly integrating policy perspectives. Azarkamand et al. [15] analysed methodologies for CO2 reduction at ports, categorising them into carbon footprinting, operational efficiency, regulatory frameworks, and disclosure practices. Their work highlighted the lack of standardised reporting tools, which continue to hinder benchmarking across ports. In the same year, Alamoush et al. [16] surveyed technical and operational measures to reduce port-related GHG emissions, including electrification, hybrid fuels, digital optimisation, and policy interventions. While comprehensive, their review was primarily descriptive and provided limited insight into adoption and scaling across governance models. In 2021, Alzahrani et al. [17] focused on renewable energy integration and digital technologies, emphasising innovations such as AI-driven smart grids, virtual power plants, and microgrid systems. They argued that regulatory incentives play a critical role in accelerating uptake but did not assess variation in implementation across ports. Similarly, Sadiq et al. [18] reviewed green port infrastructure and energy efficiency initiatives, identifying onshore power, microgrids, and AI-based energy management as key drivers of sustainability. However, their review remained technology-oriented, paying little attention to organisational or financial barriers.
By 2022, reviews increasingly explored the interplay between technology, incentives, and regulatory frameworks. Hoang et al. [19] studied port-to-ship energy transitions, focusing on cold ironing, AI-enabled smart grid management, and policy harmonisation. Their review reinforced the need for integrated approaches that combine infrastructure investment with regulation. Alamoush et al. [20] analysed port-centred incentives for decarbonisation, identifying carbon pricing, virtual arrival, and harmonised frameworks as effective mechanisms, but noting that inconsistent enforcement limited adoption. Masodzadeh et al. [21] examined barriers to shipping and port decarbonisation, proposing a framework that combined carbon pricing, digital monitoring, and market-based mechanisms. While centred on shipping, their findings showed how economic and policy barriers also slowed adoption at ports. In 2023, Issa Zadeh et al. [22] reviewed carbon footprint reduction practices, stressing electrification and AI-driven energy management as effective strategies, while highlighting persistent regional inconsistencies in regulation. In the same year, Wang et al. [23] conducted a regulatory-focused review, classifying port-related emissions under Scopes 1, 2, and 3, and distinguishing between stationary and mobile sources. They concluded that shore power and electrification remain the most impactful measures, with the EU Emissions Trading System (ETS) and International Maritime Organisation (IMO) regulations playing a decisive role in driving adoption.
The most recent reviews from 2024 reflect a shift towards structured roadmaps, systematic frameworks, and large-scale synthesis. Song [24] proposed a roadmap to net zero, classifying measures into six groups: practical, technical, fuels and energy, infrastructure, digitalisation, and policy. His review stressed the interdependence of policy enforcement, digitalisation, and alternative fuels, while calling for empirical validation in port settings. Holder et al. [25] focused on hydrogen, introducing a Port Energy Map and Port Energy System Taxonomy to outline technological pathways and regulatory barriers. Their findings underscored hydrogen’s potential in cargo handling, transport, and refuelling, but also pointed to high costs and infrastructure gaps. Karagkouni and Boile [26] examined 380 global port projects, identifying electrification, green supply chains, and digital energy management as the most widespread practices. While their large sample highlighted adoption trends, it offered limited depth on context-specific challenges. Alamoush [27] provided a critical perspective, cautioning against fragmentation in decarbonisation research and urging closer integration of technological and governance perspectives. Finally, Fadiga et al. [28] conducted a systematic review of 124 articles, using cluster analysis to identify three dominant themes: energy systems, emissions management, and clean energy innovation. They concluded that future research must address implementation challenges more directly and explore how to coordinate stakeholders in scaling up innovations effectively.
A concise summary of these review contributions is presented in Table 1, which synthesises their main scopes, key insights, and limitations. As the table indicates, although the literature has advanced substantially in mapping technological and policy measures, it remains fragmented in terms of comparative perspectives, attention to implementation stages, and discussion of operational adoption challenges. These limitations provide the context for the present study’s comparative examination of decarbonisation practices across UK ports.
Table 1.
Summary of key literature review papers on port decarbonisation.
Four analytical implications arise from this literature. First, maturity frameworks are useful only when they distinguish announced, piloted, and embedded measures through observable evidence; otherwise, numerical scores can imply unjustified precision. Second, benchmarking requires comparable system boundaries, reporting periods, and outcome measures. In their absence, comparisons should be interpreted as differences in documented implementation rather than in environmental performance [7,14,15]. Third, governance determines who controls assets, bears investment risk, and coordinates action across landlords, terminal operators, shipping lines, and public agencies [4,5,6]. Fourth, implementation barriers are interdependent. Capital costs, grid capacity, fuel availability, demand uncertainty, technical standards, and fragmented responsibilities can delay deployment even when technologies are available [20,21,25,27,28]. These considerations directly inform the evidence-linked ordinal framework used in this study.
A single-country comparison reduces, but does not eliminate, contextual variation because the cases operate within the same national policy setting. Differences in ownership, cargo mix, asset control, grid conditions, and hinterland connections nevertheless remain important. The analysis therefore uses the common UK policy context as a comparative frame while interpreting variation by port type, ownership, and region cautiously. This approach also offers insights beyond the UK by showing how governance and delivery capacity shape documented implementation.
2.2. UK Port Decarbonisation
Decarbonising UK ports is central to the Net Zero by 2050 goal, as they remain significant sources of transport-related GHG emissions. The Maritime Decarbonisation Strategy [10] sets interim targets of a 30% reduction by 2030 and an 80% reduction by 2040, requiring up to £1.6 billion investment and delivering 2.3 MtCO2e savings. Alongside the Net Zero Ports Call for Evidence [10], these frameworks combine regulation, emissions pricing, funding, and partnerships, positioning the UK as a leader in port decarbonisation.
The Maritime 2050 Strategy [9] set out the UK’s long-term vision for a sustainable maritime sector, emphasising shore power, renewable integration, and digitalisation for energy efficiency. Its decarbonisation agenda has since been strengthened by the Maritime Decarbonisation Strategy [10], which sets interim goals of a 30% GHG reduction by 2030, 80% by 2040, and full decarbonisation by 2050 (relative to 2008 levels). The 2025 strategy identifies three core levers: (i) fuel regulation to accelerate low- and zero-emission fuels, (ii) emissions pricing, through expansion of the UK ETS to domestic maritime from 2026 and UK advocacy for a global IMO levy from 2027, and (iii) decarbonisation at berth, with measures to reduce emissions while vessels are berthed. Compared with the original vision, the updated strategy provides clearer milestones, market-based mechanisms, and stronger compliance pathways, positioning ports as central enablers of the UK’s net-zero transition.
The Clean Maritime Plan (CMP), launched in 2019, is the delivery framework of Maritime 2050. It prioritises alternative fuels (hydrogen, ammonia, battery), investment in zero-emission port operations and shore power, and annual emissions reporting for major ports [9]. It also established funding schemes to support low-carbon innovation, encouraging private investment. While foundational, the CMP has since been reinforced by the 2025 Maritime Decarbonisation Strategy, which introduced clearer interim goals and market-based mechanisms, creating a more structured implementation framework.
The UK’s legally binding net zero target is established through the Climate Change Act 2008 (2050 Target Amendment) Order 2019, which applies economy-wide and therefore includes domestic maritime transport. For ports, this means adopting renewable energy, zero-emission vehicles, electrified cargo equipment, and stronger intermodal links to reduce freight carbon intensity. By embedding decarbonisation in law, the Act provides regulatory certainty for long-term port investments and integrates ports into the UK’s broader low-carbon transition.
The North Sea Emission Control Area under MARPOL Annex VI sets limits on sulphur oxides and nitrogen oxides from vessels in UK waters. UK air quality policy also addresses sulphur dioxide and particulate matter, particularly around urban ports [29]. These measures primarily protect local air quality. They should not automatically be treated as climate mitigation because some compliance options, including scrubbers, may not reduce GHG emissions. Shore power and electrification can contribute to both objectives where the electricity supply is sufficiently low carbon.
The UK Emissions Trading Scheme (UK ETS), introduced in 2021 after Brexit, replaced the EU scheme and applies a cap-and-trade system across industries. Ports and shipping firms must buy allowances if emissions exceed their cap, while efficient operators can sell surplus credits. From 2026 to 2028, the scheme will extend to domestic maritime, covering vessels operating between UK ports [30].
Alongside ETS pricing, several financial incentives support port decarbonisation. The Port Infrastructure Decarbonisation Fund (PIDF) supports investments in shore power, electrification, and alternative bunkering infrastructure, while the Green Shipping Corridor Fund (GSCF), initially valued at £1.5 million, aims to establish zero-emission maritime routes between the UK and partner European ports. Both initiatives are components of the broader UK Shipping Office for Reducing Emissions (UK SHORE) programme, which allocates £206 million to accelerate the decarbonisation of the maritime sector. The flagship Clean Maritime Demonstration Competition (CMDC) has launched its seventh competition and invested over £200 million in projects including hydrogen retrofits, electrified operations, digital monitoring, and autonomous vessels. Collectively, these mechanisms combine market discipline with targeted subsidies, accelerating the shift towards sustainable maritime operations.
The UK has expanded funding for research hubs and innovation schemes to accelerate maritime decarbonisation. The flagship UK National Clean Maritime Research Hub (UK-MaRes), launched in 2023 with £7.4 million, brings together 14 universities and 70+ partners to advance low-carbon fuels (hydrogen, ammonia), AI-driven logistics, and carbon capture solutions [31]. The Zero Emission Vessels and Infrastructure (ZEVI) Competition, with £77 million, supports demonstrations of hydrogen vessels, battery–electric ferries, and methanol bunkering stations [32]. The Maritime Research and Innovation UK (MarRI-UK) network fosters industry–academia collaboration on digital twins, smart port automation, and fleet decarbonisation, while the Offshore Renewable Energy Catapult is developing wind-to-hydrogen hubs to supply ports by 2030 (https://marri-uk.org). Collectively, these programmes establish the UK as a centre for maritime innovation, enabling ports to pilot and scale technologies while strengthening the international competitiveness of the UK maritime sector.
International Cooperations and Clean Maritime Partnerships
The UK actively contributes to global maritime decarbonisation, aligning domestic policy with the EU and IMO. Under the UK–EU Green Shipping Corridors Agreement, zero-emission trade routes are being developed with Rotterdam, Hamburg, and Antwerp, enabling battery–electric and hydrogen-fuelled connections to major European markets. The UK–Norway Green Corridor Fund (£10 million) is establishing ammonia-powered cargo routes in the North Sea, with the first vessels expected by 2027. Internationally, the UK is a founding member of the Global Maritime Decarbonisation Initiative, working with the IMO to harmonise clean fuel adoption and CO2 pricing frameworks. These partnerships position the UK as a leader in cross-border innovation and regulatory alignment, ensuring that port decarbonisation advances in step with global shipping transitions.
The UK is at the forefront of establishing international collaborations and knowledge sharing to not just cement its position in the maritime landscape but also to fast-track the race towards carbon-neutral shipping and port facilities.
2.3. Quantitative Shipping Studies and the Ship-Port Interface
Recent ship-focused studies complement the port literature by quantifying operational emission reduction opportunities. Voyage optimisation, deep-learning prediction, shipping network design, spatiotemporal carbon footprint analysis, and Carbon Intensity Indicator-compliant speed optimisation provide methods for estimating vessel emissions and testing operational changes [33,34,35]. Their relevance to ports lies at the ship–port interface, including arrival coordination, berth planning, charging and bunkering infrastructure, and data exchange. However, these studies do not measure how extensively such practices are implemented within port organisations. The present study therefore retains a port-centred focus while recognising the value of quantitative ship-side evidence.
2.4. Research Gaps
Although port decarbonisation has been widely discussed, comparable evidence on implementation within UK ports remains limited. National strategies provide a common policy setting, but they do not show whether measures are planned, piloted, or embedded in port operations. Public reporting also varies considerably, which creates both an evidence gap and a risk of disclosure bias.
Most existing studies use global reviews, technology-specific analyses, or individual cases. Few compare UK ports with different ownership structures, operational profiles, and regional settings through a common implementation framework. Evidence on emissions and investment is also reported with inconsistent boundaries, periods, and units, preventing reliable outcome-based comparison.
The study addresses these gaps by comparing documented implementation stages across 17 analytical cases and six dimensions. The resulting framework connects each code to public evidence, separates documentation from verified performance, and examines variation across port contexts.
3. Methodology
This study uses an exploratory documentary multiple-case design to examine decarbonisation practices across 16 major UK ports represented by 17 analytical cases. The design supports within-case description and cross-case comparison across port types, ownership models, and regions. It identifies documented implementation patterns and context-dependent differences; it does not test causal effectiveness.
The cases were developed from official port publications, annual and sustainability reports, government and regulatory documents, industry project materials, and relevant academic studies. These sources provide contextual case evidence and support a structured ordinal assessment. The unit of analysis is the port or separately managed terminal estate, the evidence unit is a documentary statement concerning an initiative, and the coding unit is a case indicator assessment.
The assessment concerns documented implementation maturity rather than environmental performance. Comparable port-level data on CO2 reduction, investment, operating cost, and long-term outcomes were not available with consistent boundaries. The coding framework therefore records the publicly documented stage and organisational extent of an initiative and avoids claims about its measured effectiveness.
Each of the 24 indicators was assigned one of five ordered categories. The numerical values are retained as category labels so that the revised results remain traceable to the submitted matrices:
- 0 = No public evidence identified within the documentary search. This does not confirm non-implementation;
- 0.2 = Publicly announced feasibility study, plan, procurement activity, or time-limited trial;
- 0.4 = Limited operational implementation in one asset, site, route, process, or formal programme;
- 0.7 = Established partial implementation across several assets, sites, routes, or organisational functions;
- 1.0 = Extensive or dominant operational implementation across the relevant port activity, or organisational scope.
The categories are ordinal. Equal intervals between 0, 0.2, 0.4, 0.7, and 1.0 are not assumed. Accordingly, the revised analysis reports category frequencies, distributions, and median categories instead of arithmetic sums or means. Where a meaningful denominator is available, the original thresholds of below 10%, 10–50% and above 50% assist the distinction between limited, partial and extensive implementation. Dimension-specific observable anchors for all six dimensions are provided in Supplementary Table S1.
For each port in this study, six core decarbonisation dimensions were identified, representing the principal sustainability measures adopted by ports of different types and sizes. These dimensions were chosen because they collectively capture the technical, operational, regulatory, and collaborative levers emphasised in both the academic literature and UK government strategies [10,24,27,28].
- Energy Supply and Management assesses a port’s integration of renewable energy sources, such as solar, wind, and hydrogen infrastructure, signalling the transition away from fossil-based supply.
- Infrastructure and Equipment covers shore power availability, electrification of cargo-handling equipment, energy-efficient infrastructure, and adoption of alternative low-emission fuels (e.g., HVO), which directly reduce on-site emissions.
- Operational Efficiency considers the use of Internet of Things (IoT)-enabled monitoring, automation, energy management systems (EMS), just-in-time (JIT) operations, and traffic optimisation to improve energy performance and reduce congestion-related emissions.
- Transport Connectivity evaluates investments in rail hinterland, inland waterways, short sea shipping, green logistics corridors, and offshore wind logistics support, extending decarbonisation impacts beyond the port gate into wider supply chains.
- Policy and Regulations examines how ports engage with net-zero commitments, comply with UK and EU regulatory frameworks, participate in carbon offset initiatives, and implement air quality strategies, reflecting the importance of governance in driving sustainability.
- Stakeholder Partnerships captures collaborations with industry actors, local authorities, national programmes, and research initiatives, recognising that multi-stakeholder engagement is essential to accelerate maritime decarbonisation.
Taken together, these six dimensions offer a comprehensive and balanced framework. They span the technical (1–3), infrastructural (2), systemic (4), regulatory (5), and collaborative (6) aspects of decarbonisation. This multi-dimensional lens allows for systematic evaluation of UK ports’ sustainability strategies, highlighting extensively documented implementation patterns while also exposing common sectoral challenges in transitioning to low-carbon operations.
This research relies exclusively on publicly available sources, including official port websites, government reports, regulatory documents, industry white papers, academic studies, and local authority publications. Because comparable emissions or investment data are often unavailable, the study adopts a process-based evaluation approach that classifies decarbonisation initiatives according to their stage and scale of implementation. By triangulating evidence across multiple sources, the methodology enhances transparency and credibility while capturing the evolving nature of decarbonisation activities across UK ports. To provide a clear overview of the methodological process, Figure 1 summarises the sequential steps of the study, illustrating how data collection, assessment, and comparative analysis are integrated within a coherent research design.
Figure 1.
Research Methodology Framework for UK Port Decarbonisation Analysis.
3.1. Port Selection Criteria
Sixteen major UK ports were purposively selected to provide analytical coverage of major cargo and passenger activities, ownership models, and regions. Selection considered cargo throughput, passenger significance, operational function, and the availability of sufficient public evidence. The sample supports comparison across heterogeneous port contexts but is not claimed to be statistically representative of all UK ports.
The sample includes private and trust ports and covers England, Scotland, Wales, and Northern Ireland. Southampton is represented twice because DP World Southampton Container Terminal and the wider ABP Southampton Estate have distinct management and asset control arrangements. The study therefore contains 16 selected ports and 17 analytical cases. Case characteristics and sources are reported in Supplementary Materials.
3.2. Comparative Implementation Assessment and Scoring Procedure
The lead author extracted the documentary evidence and assigned the 408 case indicator codes using the common framework. The evidence, coding rules, and interpretation were discussed with the co-authors during manuscript development and revision. The study did not use independent double coding of all observations or calculate inter-rater reliability; no such procedure is claimed.
Each code was checked against the corresponding port profile, comparative table, and cited source in Supplementary File S1. Where evidence was ambiguous, incomplete or limited to a general corporate statement, the lower category was used. Supplementary Tables S8–S19 provide an evidence and source map for every case and dimension, enabling readers to trace the assessments.
Secondary documentary evidence creates two limitations. First, public disclosure varies among ports, so a low code may reflect limited reporting rather than limited activity. Second, project announcements do not establish environmental effectiveness. The code 0 therefore means only that no public evidence was identified within the search. A separate source coverage table is provided in Supplementary Table S2, and the results are interpreted as documented implementation maturity.
3.3. Data Collection and Sources
The analysis uses publicly accessible sources so that the evidence can be inspected and updated. Port activity data were obtained from the Department for Transport Maritime Statistics [1]. Port-level initiatives were traced primarily to official port, operator, government, and project publications and were supplemented by regulatory, industry, and academic sources.
All coding matrices and evidence links are provided in the Supplementary Material. All tables and figures are original author-generated outputs based on the reviewed literature, study framework, and derived coding dataset.
4. Multiple-Case Studies by Port Type
This section presents the cases by port type and summarises the public evidence used in the comparative assessment. Port function, asset base, energy demand, hinterland, connections and governance influence which initiatives can be implemented. The discussion describes documented activity and does not infer measured effectiveness where outcome data are unavailable.
The 16 ports are organised into five types: global container gateways; Ro-Ro and passenger hubs; energy hubs; offshore energy and project cargo bases; and diversified multi-purpose ports. Southampton contributes two analytical cases, giving 17 cases in total. The full case profiles and sources are provided in Supplementary File S1.
Each subsection gives a concise type-level summary and directs readers to Tables S2–S6 for the supporting port evidence. Section 5 then compares the 24 indicators across the six analytical dimensions.
4.1. Global Container Gateways
Global container gateways combine high-volume container operations, large equipment fleets, substantial electricity demand, and strong rail connections. Felixstowe, London Gateway, and Southampton (DP World Container Terminal) form this group. Their public records most often describe equipment electrification, efficient infrastructure, solar generation, digital operational systems, and rail connectivity. Details and sources are provided in Supplementary Table S3.
Equipment electrification and renewable electricity are the most consistently documented measures in this group. Shore power, hydrogen, and green corridor activity are less consistently documented. These differences describe the available evidence and should not be read as a verified ranking of environmental performance.
4.2. Ro-Ro and Passenger Hubs
Ro-Ro and passenger hubs serve short sea freight and passenger routes and have close interaction with surrounding communities. Dover, Belfast, Hull, and the ABP Southampton Estate form this group. Public records describe shore-power preparation, cleaner passenger and landside transport, air quality programmes, regulatory engagement, and partnerships. Details and sources are provided in Supplementary Table S4.
Local air quality measures are particularly visible in this group because vessel calls and road traffic affect nearby communities. These measures can reduce sulphur oxides, nitrogen oxides, and particulate matter, but they are not automatically evidence of GHG reduction. Climate and air quality effects are therefore distinguished in the analysis.
Dover’s battery–hybrid ferries and related electrification plans illustrate operational transition on a specific corridor. Evidence for the other cases more often concerns infrastructure readiness, trials, and policy programmes. The coding records these different implementation stages without assuming comparable emissions outcomes.
4.3. Energy Hubs
Immingham, Milford Haven, and Grangemouth are classified as energy hubs because of their liquid bulk, gas, refinery, or pipeline functions. Public evidence covers solar and wind generation, hydrogen proposals, energy efficiency measures, environmental management, and industrial partnerships. Many alternative fuel projects remain at planning or trial stages. Details and sources are provided in Supplementary Table S5.
These ports may support new energy supply chains, but their present fossil energy role and the early stage of several low-carbon projects require cautious interpretation. The assessment therefore records documented implementation rather than treating announced projects as a completed transition.
4.4. Offshore-Energy and Project Cargo Bases
Tyne and Aberdeen are classified as offshore energy and project cargo bases. Their public records describe estate-level decarbonisation plans, offshore wind support, shore power activity, digital trials, and research or industry partnerships. Details and sources are provided in Supplementary Table S6.
Pilot projects are prominent in this group. They demonstrate technical and organisational learning, but the public evidence does not establish that each pilot has been scaled across the port estate. The coding distinguishes trials from established partial or extensive implementation.
4.5. Diversified Multi-Purpose Ports
London, Liverpool, Tilbury, Teesport, and Bristol are diversified multi-purpose ports. Their varied cargo and tenant structures are associated with portfolios of solar and wind generation, efficient infrastructure, rail links, digital systems, and collaborative projects. Details and sources are provided in Supplementary Table S7.
No single initiative dominates every case in this group. The evidence instead shows incremental combinations of energy, infrastructure, connectivity and partnership measures. Capital-intensive initiatives, including hydrogen and shore power, are less consistently documented than solar generation, efficiency upgrades, and rail connectivity.
5. Comparative Analysis of Documented Implementation Patterns and Lessons
This section compares 16 UK ports represented by 17 analytical cases. The six dimensions remain the primary structure of the analysis, followed by descriptive comparisons by port type, ownership, and region.
Because the five maturity categories are ordinal, the analysis reports the number of cases in each category rather than sums or arithmetic means. A value of 0 denotes no public evidence identified and does not prove non-implementation. Results therefore concern the distribution of documented implementation maturity, not measured environmental performance.
The complete case indicator matrices are provided in Supplementary Tables S8–S19. Supplementary Tables S8–S19 link each dimension-level assessment to the supporting evidence and source location. Figure 2 shows the distribution for all 24 indicators.
Figure 2.
Distribution of documented implementation maturity categories across 17 analytical cases for each indicator. A value of 0 means no public evidence identified within the search.
Each dimension-specific subsection identifies:
- (a)
- The distribution of documented maturity categories;
- (b)
- The most extensively documented implementation pattern;
- (c)
- Transferable lessons and recurring constraints; and
- (d)
- Contextual qualifications needed for interpretation.
These comparisons do not establish which intervention is most cost-effective or produces the greatest CO2 reduction because comparable outcome and investment data were not available.
5.1. Energy Supply and Management
Solar generation is the most extensively documented energy-supply practice: 16 of 17 cases have public evidence, and eight cases are coded 0.7 or 1.0. Wind is not publicly documented in 14 cases, while hydrogen evidence is limited to planning or trial activity in ten cases and is absent from the remaining seven. The contrast indicates wider documented operational use of solar and a much earlier stage for wind and hydrogen.
Solar installations are documented across different port types and can be deployed incrementally on available roofs or land. The evidence supports their relative maturity within this sample, but it does not provide a common measure of electricity share, financial return, or emissions reduction across all cases.
The cases indicate the value of early site assessment, coordination with tenants, and integration with wider energy management plans. Grid connection, structural suitability, and demand alignment remain important contextual constraints.
5.2. Infrastructure and Equipment
Efficient infrastructure is documented at an operational level in all 17 cases, with 16 coded 0.4 and one coded 0.7. Equipment electrification is also widespread, with 15 cases coded 0.4 or above. Shore power is mainly documented as planning or trials, and lower-emission fuel substitution is not publicly documented in 11 cases. The distribution therefore shows stronger operational evidence for efficiency upgrades and equipment electrification.
Equipment electrification is documented across container, passenger, and multi-purpose ports. Implementation can often proceed through normal asset replacement cycles, although charging capacity, grid access, duty cycles, and capital cost affect the feasible pace of deployment.
Duty cycle assessment, charging design, and workforce involvement are recurring implementation requirements. These lessons concern delivery conditions; the documentary evidence does not support a uniform estimate of emissions or cost savings.
5.3. Operational Efficiency
The operational efficiency matrix contains five indicators: Internet of Things monitoring, automation, energy management systems, just-in-time operations, and vehicle-booking systems. Internet of Things applications are documented at 0.4 or 0.7 in nine cases. Automation is mainly at the planning or trial stage. Energy management systems are documented in 16 cases, largely at 0.2. Just-in-time operations have no public evidence in ten cases, whereas vehicle-booking systems are operational at 0.4 or 0.7 in eight cases.
Digital monitoring and vehicle-booking systems provide the clearest operational evidence in this dimension. Their implementation depends on data quality, system integration, and coordination among terminal, vessel, and hinterland actors.
Common data definitions, clear operational ownership, and phased integration can support digital implementation. The available documents rarely provide comparable before-and-after emissions data, so the analysis does not attribute quantified environmental outcomes to these systems.
5.4. Transport Connectivity
The transport connectivity matrix contains rail connectivity, lower-emission hinterland transport, short sea or waterway services, green corridors, and offshore wind logistics support. Rail is operational at 0.4 or 0.7 in 12 cases and is the most consistently documented indicator. Green hinterland measures and short sea or waterway services are usually documented at planning, trial, or limited operational stages. Green corridors have no public evidence in 14 cases. Offshore wind support is concentrated in a smaller set of suitable ports.
Rail connectivity is the most extensively documented transport pattern in the sample. Its relevance depends on cargo type, terminal layout, network capacity, and demand for regular services, so it is not equally transferable to every port.
Where suitable, rail can reduce dependence on road haulage and support wider logistics decarbonisation. Comparable port-level carbon savings were not available, and no uniform reduction is claimed.
Early coordination with rail infrastructure managers, freight operators and cargo owners is important. Reliable demand, suitable terminal geometry and service frequency influence whether infrastructure becomes routinely used.
5.5. Policy and Regulations
The policy dimension separates climate and regulatory compliance, voluntary carbon programmes, and air quality strategies. UK or EU compliance is documented at 0.4 or 0.7 in all 17 cases. Voluntary carbon programmes are documented in all cases, mainly at 0.2 or 0.4. Air quality strategies show a broader distribution, including one case at 1.0. Regulatory compliance, local air quality control, and GHG mitigation are interpreted separately.
Formal compliance and climate commitments are the most consistently documented policy activities. They can create reporting and governance routines, but compliance alone does not demonstrate additional emissions reduction.
Ports can improve decision-making by connecting regulatory reporting with investment planning while keeping GHG, air quality, and compliance indicators distinct. Clear definitions and consistent reporting boundaries would improve comparability.
5.6. Stakeholder Partnerships
Partnership activity is documented across the sample. Industry partnerships are coded 0.4 or above in all 17 cases, including six cases at 0.7 or 1.0. Local government collaboration is documented mainly at 0.4, while national and research collaboration is more often recorded at planning, trial, or single-project stages. Industry collaboration is therefore the most extensively documented partnership form.
Most Extensively Documented Pattern
The evidence supports active industry partnerships involving port authorities, operators, transport firms, energy providers, and technology organisations. The formality and scope of these arrangements vary, and the documents do not consistently support claims about legally constituted charters or quantified outcomes.
Partnerships appear most useful when roles, data responsibilities, and project delivery arrangements are explicit. Alignment with local authorities, national programmes, and research organisations can help address infrastructure and knowledge constraints.
5.7. Cross-Analysis by Port Type, Ownership, and Region
The cross-analysis is descriptive and shows how category distributions vary by port function, ownership, and region. It does not establish causation because the groups are small and unequal.
By port type, global container gateways show relatively strong documented operational efficiency activity, with 80% of their operational efficiency assessments coded 0.4 or above. Ro-Ro and passenger hubs have all policy assessments and 93.8% of partnership assessments at 0.4 or above. Energy hubs show less operational efficiency evidence, while offshore energy bases have all partnership assessments at 0.4 or above. Diversified ports display a broader mixture across dimensions. These distributions reflect both operational context and public reporting. The corresponding distributions of documented maturity categories by port type are presented in Figure 3.
Figure 3.
Distribution of documented maturity categories by port type. Group sizes are shown in the figure.
The results support differentiated rather than uniform implementation strategies. They do not imply that one port type performs better environmentally, because verified outcome data are outside the scope of the study.
By ownership model, private ports show 63.6% of infrastructure assessments and 43.6% of operational efficiency assessments at 0.4 or above. Trust ports show 72.2% of policy assessments and 87.5% of partnership assessments at 0.4 or above, while 13.3% of their operational efficiency assessments reach 0.4 or above. The contrast suggests different documented emphases rather than a general ownership ranking. The corresponding distributions of documented maturity categories by ownership model are presented in Figure 4.
Figure 4.
Distribution of documented maturity categories by ownership model. Group sizes are shown in the figure.
By region, England contributes 13 cases, Scotland two, Wales one, and Northern Ireland one. The regional distributions are therefore descriptive only. They show within-sample differences in the types of publicly documented activity, but the small and unequal groups do not support general regional conclusions. The corresponding distributions of documented maturity categories by region are presented in Figure 5.
Figure 5.
Distribution of documented maturity categories by region. Group sizes are shown in the figure; Wales and Northern Ireland each contain one case.
6. Recommendations and Opportunities
The category distributions identify several practical opportunities, but recommendations must be adapted to port function, ownership, asset condition, and local infrastructure. First, ports can sequence measures according to technical readiness and asset replacement cycles. The widespread documentation of efficient infrastructure and equipment electrification supports continued attention to these areas. Shore power, hydrogen, and green corridors require more extensive coordination, grid or fuel infrastructure, and demand certainty before wider deployment.
Second, policy support should reflect differences in delivery capacity. Smaller and independent ports may benefit from simplified funding processes, shared technical standards, and access to specialist support. Larger operators may place greater value on stable long-term policy and grid investment signals.
Third, reporting should distinguish project status, organisational scope, cost, emissions boundary, and verified outcome. Consistent disclosure would allow later research to compare CO2 reductions and investment. The present evidence is not sufficiently comparable to support such a correlation.
Fourth, cross-boundary collaboration is important for shore power, alternative fuels, rail, and green corridors because delivery depends on shipping lines, energy providers, transport operators, and public authorities. The strong documentation of industry partnerships supports maintaining clear roles and shared project plans.
Finally, digital monitoring and booking systems can be introduced in stages, but their value depends on data quality and operational integration. Ports should evaluate outcomes against transparent baselines rather than assume that adoption alone produces emissions savings.
Overall, the findings support context-sensitive implementation pathways that combine technology, operations, policy, and partnership arrangements. The recommendations are derived from documented maturity patterns and should be tested against local technical and financial evidence.
Future work should combine longitudinal implementation records with verified emissions, cost, and investment data to assess effectiveness and causal relationships.
7. Conclusions
This study compares documented decarbonisation practices at 16 major UK ports represented by 17 analytical cases. The framework covers six dimensions and 24 indicators and uses ordered maturity categories linked to publicly available evidence.
For RQ1, the public record shows a broad portfolio of energy, infrastructure, operational, connectivity, policy, and partnership measures. Solar generation, efficient infrastructure, equipment electrification, rail connectivity, and industry partnerships have the most extensive operational documentation. Wind, hydrogen, green corridors, and just-in-time operations are more often absent from the public record or limited to planning and trials. These findings concern documented implementation. They do not demonstrate that one measure or port has achieved greater carbon reduction, financial return, or long-term effectiveness.
For RQ2, category distributions vary across the six dimensions. Infrastructure efficiency, equipment electrification, regulatory activity, and partnerships are widely documented. Energy alternatives, shore power, just-in-time operations and green corridors show more early-stage or absent public evidence. This unevenness reflects differences in technical readiness, infrastructure dependence, and disclosure. The comparison also shows that indicators within a dimension can follow different trajectories. Separating the 24 indicators is therefore more informative than calculating one arithmetic average for each dimension.
For RQ3, port type and ownership are associated with different documented emphases. Container gateways show stronger operational efficiency documentation; Ro-Ro and passenger hubs show strong policy and partnership activity; offshore energy bases show extensive partnership evidence; and trust ports place greater documented emphasis on policy and partnerships than on operational efficiency systems. Regional results remain tentative because the group sizes are unequal and Wales and Northern Ireland each contain one case. No general regional performance ranking is inferred.
The study relies on public documents, which vary in coverage, detail, and publication timing. Failure to identify public evidence does not establish that an initiative is absent. The coding was conducted by the lead author and was not independently double-coded in full. Project announcements also do not establish emissions reduction, cost-effectiveness, or durability. These limitations restrict causal and performance claims. Future research should use port manager interviews, independent coding checks, longitudinal project tracking, and verified GHG, cost, and investment data. These additions would allow sensitivity analysis, cost–benefit comparison and assessment of actual environmental outcomes.
The derived evidence and coding dataset contain 408 case indicator assessments and are supplied in Supplementary Files S1 and S2. The framework offers a transparent basis for updating the comparison as more complete evidence becomes available.
Supplementary Materials
The following supporting information can be downloaded at: https://www.mdpi.com/article/10.3390/logistics10090197/s1, Supplementary File S1 presents port-specific documentary evidence and sources; Supplementary File S2 presents the coding manual, case indicator matrices and evidence maps. References [36,37,38,39,40,41,42,43,44,45,46,47,48,49,50,51,52,53,54,55,56,57,58,59,60,61,62,63,64,65,66,67,68,69,70,71,72,73,74,75,76,77,78,79,80,81,82,83,84,85,86,87,88,89,90,91,92,93,94,95,96,97,98,99] are cited in the Supplementary Materials.
Author Contributions
Conceptualization, R.E. and D.-P.S.; methodology, R.E., Y.X. and D.-P.S.; formal analysis, R.E.; investigation, R.E.; data curation, R.E.; writing, original draft preparation, R.E.; writing, review and editing, R.E., Y.X. and D.-P.S.; visualization, R.E.; supervision, Y.X. and D.-P.S.; funding acquisition, Y.X. and D.-P.S. All authors have read and agreed to the published version of the manuscript.
Funding
This work was partially supported by the UK Department for Transport, as part of the UK Shipping Office for Reducing Emissions (UK SHORE) Programme and the UK Engineering and Physical Sciences Research Council (EPSRC) [Grant No: EP/Y024605/1], and a combined EPSRC and ESRC Impact Acceleration Account [Grant No: ES/X004910/1].
Institutional Review Board Statement
Not applicable.
Informed Consent Statement
Not applicable.
Data Availability Statement
The original contributions presented in this study are included in the article/Supplementary Material. Further inquiries can be directed to the corresponding author.
Acknowledgments
We thank the editors and five anonymous reviewers for their professional and constructive comments, which have helped improve the presentation of the paper significantly.
Conflicts of Interest
The authors declare no conflicts of interest.
References
- UK Department for Transport. Maritime Statistics: Interactive Dashboard. 2023. Available online: https://maps.dft.gov.uk/maritime-statistics/index.html (accessed on 21 March 2025).
- House of Commons Library. The UK’s Maritime Sector; Research Briefing CDP-2021-0147; House of Commons Library: London, UK, 2021; Available online: https://commonslibrary.parliament.uk/research-briefings/cdp-2021-0147/ (accessed on 4 August 2026).
- British Ports Association. The UK Ports Industry. 2023. Available online: https://www.britishports.org.uk/about-us/the-uk-ports-industry (accessed on 21 March 2025).
- Notteboom, T.; Haralambides, H.E. Port management and governance in a post-COVID-19 era: Quo vadis? Marit. Econ. Logist. 2020, 22, 329–352. [Google Scholar] [CrossRef] [Scilit]
- Brooks, M.R.; Cullinane, K.P.; Pallis, A.A. Revisiting port governance and port reform: A multi-country examination. Res. Transp. Bus. Manag. 2017, 22, 1–10. [Google Scholar] [CrossRef] [Scilit]
- Acciaro, M.; Vanelslander, T.; Sys, C.; Ferrari, C.; Roumboutsos, A.; Giuliano, G.; Kapros, S. Environmental sustainability in seaports: A framework for successful innovation. Marit. Policy Manag. 2014, 41, 480–500. [Google Scholar] [CrossRef] [Scilit]
- Bjerkan, K.Y.; Seter, H. Reviewing tools and technologies for sustainable ports: Does research enable decision making in ports? Transp. Res. Part D Transp. Environ. 2019, 72, 243–260. [Google Scholar] [CrossRef] [Scilit]
- Song, D.-P. Rethinking Routes: The Case for Regional Ports in a Decarbonizing World. Logistics 2025, 9, 103. [Google Scholar] [CrossRef] [Scilit]
- UK Department for Transport. Maritime 2050: Navigating the Future. 2019. Available online: https://www.gov.uk/government/publications/maritime-2050-navigating-the-future (accessed on 21 March 2025).
- UK Department for Transport. Maritime Decarbonisation Strategy. 2025. Available online: https://www.gov.uk/government/publications/maritime-decarbonisation-strategy (accessed on 6 July 2026).
- Connected Places Catapult. UK Ports of the Future: A Vision and Roadmap; UK Department for Transport: London, UK, 2021. Available online: https://share.google/dCjRuRifYgXynSN5h (accessed on 21 March 2025).
- Styhre, L.; Winnes, H.; Black, J.; Lee, J.; Le-Griffin, H. Greenhouse gas emissions from ships in ports—Case studies in four continents. Transp. Res. Part D Transp. Environ. 2017, 54, 212–224. [Google Scholar] [CrossRef] [Scilit]
- Iris, Ç.; Lam, J.S.L. A review of energy efficiency in ports: Operational strategies, technologies and energy management systems. Renew. Sustain. Energy Rev. 2019, 112, 170–182. [Google Scholar] [CrossRef] [Scilit]
- Lim, S.; Pettit, S.; Abouarghoub, W.; Beresford, A. Port sustainability and performance: A systematic literature review. Transp. Res. Part D Transp. Environ. 2019, 72, 47–64. [Google Scholar] [CrossRef] [Scilit]
- Azarkamand, S.; Wooldridge, C.; Darbra, R.M. Review of initiatives and methodologies to reduce CO2 emissions and climate-change effects in ports. Int. J. Environ. Res. Public Health 2020, 17, 3858. [Google Scholar] [CrossRef] [Scilit]
- Alamoush, A.S.; Ballini, F.; Ölçer, A.I. Ports’ technical and operational measures to reduce greenhouse gas emission and improve energy efficiency: A review. Mar. Pollut. Bull. 2020, 160, 111508. [Google Scholar] [CrossRef] [Scilit] [PubMed]
- Alzahrani, A.; Petri, I.; Rezgui, Y.; Ghoroghi, A. Decarbonisation of seaports: A review and directions for future research. Energy Strateg. Rev. 2021, 38, 100727. [Google Scholar] [CrossRef] [Scilit]
- Sadiq, M.; Ali, S.W.; Terriche, Y.; Mutarraf, M.U.; Hassan, M.A.; Hamid, K.; Ali, Z.; Sze, J.Y.; Su, C.-L.; Guerrero, J.M. Future Greener Seaports: A Review of New Infrastructure, Challenges, and Energy Efficiency Measures. IEEE Access 2021, 9, 75568–75587. [Google Scholar] [CrossRef] [Scilit]
- Hoang, A.T.; Foley, A.M.; Nižetić, S.; Huang, Z.; Ong, H.C.; Ölçer, A.I.; Pham, V.V.; Nguyen, X.P. Energy-related approach for reduction of CO2 emissions: A critical strategy on the port-to-ship pathway. J. Clean. Prod. 2022, 355, 131772. [Google Scholar] [CrossRef] [Scilit]
- Alamoush, A.S.; Ölçer, A.I.; Ballini, F. Ports’ role in shipping decarbonisation: A common port incentive scheme for shipping greenhouse gas emissions reduction. Clean. Logist. Supply Chain. 2022, 3, 100021. [Google Scholar] [CrossRef] [Scilit]
- Masodzadeh, P.G.; Ölçer, A.I.; Ballini, F.; Christodoulou, A. A review on barriers to and solutions for shipping decarbonization: What could be the best policy approach for shipping decarbonization? Mar. Pollut. Bull. 2022, 184, 114008. [Google Scholar] [CrossRef] [Scilit]
- Issa Zadeh, S.B.; López Gutiérrez, J.S.; Esteban, M.D.; Fernández-Sánchez, G.; Garay-Rondero, C.L. Scope of the literature on efforts to reduce the carbon footprint of seaports. Sustainability 2023, 15, 8558. [Google Scholar] [CrossRef] [Scilit]
- Wang, B.; Liu, Q.; Wang, L.; Chen, Y.; Wang, J. A review of the port carbon emission sources and related emission reduction technical measures. Environ. Pollut. 2023, 320, 121000. [Google Scholar] [CrossRef] [Scilit]
- Song, D.-P. A literature review of seaport decarbonisation: Solution measures and roadmap to net zero. Sustainability 2024, 16, 1620. [Google Scholar] [CrossRef] [Scilit]
- Holder, D.; Percy, S.D.; Yavari, A. A review of port decarbonisation options: Identified opportunities for deploying hydrogen technologies. Sustainability 2024, 16, 3299. [Google Scholar] [CrossRef] [Scilit]
- Karagkouni, K.; Boile, M. Classification of green practices implemented in ports: The application of green technologies, tools, and strategies. J. Mar. Sci. Eng. 2024, 12, 571. [Google Scholar] [CrossRef] [Scilit]
- Alamoush, A.S. Trends in port decarbonisation research: Are we reinventing the wheel? Curr. Opin. Environ. Sustain. 2024, 71, 101478. [Google Scholar] [CrossRef] [Scilit]
- Fadiga, A.; Ferreira, L.M.D.F.; Bigotte, J.F. Decarbonising maritime ports: A systematic review of the literature and insights for new research opportunities. J. Clean. Prod. 2024, 452, 142209. [Google Scholar] [CrossRef] [Scilit]
- Defra, UK Air Quality Limits. 2019. Available online: https://uk-air.defra.gov.uk/air-pollution/uk-limits.php (accessed on 6 July 2026).
- DESNZ. UK Emissions Trading Scheme (UK ETS): A Policy Overview, Department for Energy Security & Net Zero. 2026. Available online: https://www.gov.uk/government/publications/uk-emissions-trading-scheme-uk-ets-policy-overview/uk-emissions-trading-scheme-uk-ets-a-policy-overview (accessed on 6 July 2026).
- UK Research and Innovation (UKRI). UK National Clean Maritime Research Hub (UK-MaRes). 2023. Available online: https://gtr.ukri.org/projects?ref=EP%2FY024605%2F1 (accessed on 21 March 2025).
- UK Research and Innovation. ZEVI: Battery Electric Vessels and Charging Infrastructure. Funding Opportunity. 2023. Available online: https://www.ukri.org/opportunity/zevi-battery-electric-vessels-and-charging-infrastructure/ (accessed on 4 August 2026).
- Yu, H.; Fang, Z.; Fu, X.; Liu, J.; Chen, J. Literature review on emission control-based ship voyage optimization. Transp. Res. Part D Transp. Environ. 2021, 93, 102768. [Google Scholar] [CrossRef] [Scilit]
- Yu, H.; Fang, Q.; Fang, Z.; Xu, L.; Liu, J. Carbon footprints of global container shipping during 2015–2021: A spatiotemporal analysis with multi-source data. Mar. Pollut. Bull. 2024, 209, 117165. [Google Scholar] [CrossRef] [Scilit]
- Yan, D.; Chen, C.; Gan, W.; Sasa, K.; He, G.; Yu, H. Carbon intensity indicator (CII) compliance: Applications of ship speed optimization on each level using measurement data. Mar. Pollut. Bull. 2025, 212, 117593. [Google Scholar] [CrossRef] [Scilit]
- Port of Felixstowe. Net Zero. Available online: https://www.portoffelixstowe.co.uk/sustainability/net-zero/ (accessed on 21 March 2025).
- ScottishPower. ScottishPower Vision for Green Hydrogen Fuels Hub at Port of Felixstowe. 2022. Available online: https://www.scottishpower.com/news/pages/scottishpower_vision_for_green_hydrogen_fuels_hub_at_port_of_felixstowe.aspx (accessed on 21 March 2025).
- Port of Felixstowe Port of Felixstowe Makes Major Decarbonisation Investment. 2021. Available online: https://www.portoffelixstowe.co.uk/2021/08/11/port-of-felixstowe-makes-major-decarbonisation-investment/ (accessed on 21 March 2025).
- Freeport East. Green Corridor Developments. Available online: https://freeporteast.com/net-zero-inititatives/green-corridor-developments/ (accessed on 21 March 2025).
- Freeport East. New Study Highlights Freeport East Could Become Key Centre for Driving Transport Decarbonisation and Maritime Green Corridors. 2023. Available online: https://freeporteast.com/new-study-highlights-freeport-east-could-become-key-centre-for-driving-transport-decarbonisation-and-maritime-green-corridors/ (accessed on 21 March 2025).
- DP World. Sustainability Initiatives at London Gateway. 2023. Available online: https://www.dpworld.com/london-gateway/sustainability (accessed on 21 March 2025).
- DP World. Shore Power and Energy-Efficient Infrastructure at London Gateway. 2023. Available online: https://www.dpworld.com/london-gateway/shore-power (accessed on 21 March 2025).
- Rail Freight Group. Rail Connectivity and Decarbonisation Efforts in the UK. 2023. Available online: https://www.rfg.org.uk/rail-Decarbonisation (accessed on 21 March 2025).
- Associated British Ports (ABP). Hydrogen and Shore Power Developments at Port of Southampton. 2023. Available online: https://www.abports.co.uk/port-news/southampton-hydrogen-and-shore-power (accessed on 21 March 2025).
- DP World. Southampton Modal-Shift Programme Factsheet 2024. 2024. Available online: https://www.dpworld.com/southampton/modal-shift-factsheet (accessed on 21 March 2025).
- Kalmar. Kalmar and DP World Southampton Continue Their Joint Eco-Efficiency Journey with New Hybrid Straddle Carrier Order. 2024. Available online: https://www.kalmarglobal.com/news--insights/press_releases/2024/kalmar-and-dp-world-southampton/ (accessed on 21 March 2025).
- DP World. ESG & Sustainability Report 2024 [PDF]. 2024. Available online: https://www.dpworld.com/-/media/project/dpwg/global/shared-content/sustainability/esg/dp-world-esg-2024.pdf (accessed on 21 March 2025).
- Smart Maritime Network. DP World Southampton Completes TOS Software Upgrade. 2022. Available online: https://smartmaritimenetwork.com/2022/08/03/dp-world-southampton-completes-tos-software-upgrade/ (accessed on 21 March 2025).
- The Loadstar. DP World Offers UK Shippers £100 per Box as Modal Shift Incentive. 2022. Available online: https://theloadstar.com/dp-world-offers-uk-shippers-100-per-box-modal-shift-incentive/ (accessed on 21 March 2025).
- Sustainability Magazine. How DP World Balances Sustainability & Financial Growth. 2023. Available online: https://sustainabilitymag.com/articles/dp-world-record-revenues-record-sustainability-targets (accessed on 21 March 2025).
- DP World. DP World Southampton Is First Port in Britain to Replace Diesel with Vegetable Oil and Cuts Net Emissions by over 80 per Cent. 2022. Available online: https://www.dpworld.com/en/news/dp-world-southampton-is-first-port-in-britain-to-replace-diesel-with-vegetable-oil-and-cuts-net-emissions-by-over-80-per-cent (accessed on 17 August 2026).
- DP World Southampton Pioneers Sustainability in Ports. Sustainability Magazine, 10 June 2025. Available online: https://sustainabilitymag.com/articles/dp-world-southampton-hitting-operational-net-zero-2025 (accessed on 21 March 2025).
- Port of Dover. Sustainability Targets. Available online: https://www.doverport.co.uk/sustainability/green-energy/ (accessed on 21 March 2025).
- Port of Dover. Environment. Available online: https://www.doverport.co.uk/operations/efficiency-and-emission-reduction/ (accessed on 21 March 2025).[Green Version]
- DFDS. DFDS to Invest €1 Billion in Battery-Electric Ships for the Channel. 2024. Available online: https://www.dfds.com/en/about/media/news/dfds-to-invest-1-billion-euro-in-battery-electric-ships-for-the-channel (accessed on 21 March 2025).
- ShipPax. P&O Ferries’ Second Battery-Hybrid Double-Ender Giant P&O Liberté Enters Service. 2024. Available online: https://www.shippax.com/en/news/po-ferries-second-battery-hybrid-double-ender-giant-po-liberte-enters-service.aspx (accessed on 21 March 2025).
- Port of Dover. Newest Phase of Port of Dover’s Green Ferries Project. 2023. Available online: https://www.portofdover.com/news/port-of-dovers-green-ferries-project/ (accessed on 17 August 2026).
- Port of Dover. Corporate Social Responsibility Report 2023 [PDF]. 2024. Available online: https://www.portofdover.com/wp-content/uploads/2024/05/DHB-Corporate-Social-Responsibility-2023.pdf (accessed on 17 August 2026).
- Belfast Harbour. Environment. Available online: https://www.belfast-harbour.co.uk/community/environment/ (accessed on 21 March 2025).[Green Version]
- Belfast Harbour. Operational Efficiency and Emission Reduction Strategies at Belfast Harbour. 2023. Available online: https://www.belfast-harbour.co.uk/operations/emission-reduction (accessed on 21 March 2025).
- Northern Ireland Executive. Green Economy and Environmental Policy in Northern Ireland. 2023. Available online: https://www.northernireland.gov.uk/topics/green-economy (accessed on 21 March 2025).
- Associated British Ports (ABP). Sustainability at ABP: Environment and Decarbonisation Initiatives. 2023. Available online: https://www.abports.co.uk/sustainability/environment (accessed on 21 March 2025).
- Green Port Hull. Green Port Hull and Offshore Wind Industry Support. 2023. Available online: https://www.greenporthull.co.uk/ (accessed on 21 March 2025).
- Transport for the North. Rail Connectivity and Sustainable Transport in the North. 2023. Available online: https://www.transportforthenorth.com/rail-sustainability (accessed on 21 March 2025).
- Port Technology. Port of Immingham to Lead UK in Green Port Initiatives. Port Technol. 2022. Available online: https://www.porttechnology.org/news/immingham-leading-uk-in-green-port-initiatives/ (accessed on 21 March 2025).
- Milford Haven Port Authority. Renewable Energy and Decarbonisation Initiatives at Milford Haven. 2024. Available online: https://www.mhpa.co.uk/renewable-energy-and-Decarbonisation/ (accessed on 21 March 2025).
- Milford Haven Port Authority. Sustainability and Environmental Management. 2024. Available online: https://www.mhpa.co.uk/sustainability-and-environment/ (accessed on 21 March 2025).
- Forth Ports. Journey to Net Zero [PDF]. 2024. Available online: https://www.forthports.co.uk/wp-content/uploads/2023/11/Report-NetZero_08112023.pdf (accessed on 21 March 2025).
- Scottish Enterprise. Forth Green Freeport Hydrogen Cluster Prospectus. 2024. Available online: https://www.scottish-enterprise.com/Decarbonisation/forth-green-freeport (accessed on 21 March 2025).
- Forth Ports. Port Marine Safety Code Annual Review 2024 [PDF]. 2024. Available online: https://www.forthports.co.uk/wp-content/uploads/2025/05/PMSC-Annual-Review-2024.pdf (accessed on 21 March 2025).
- Air Products. Immingham Renewable Hydrogen Facility. Available online: https://www.airproducts.co.uk/campaigns/immingham-renewable-hydrogen-facility (accessed on 17 August 2026).
- Port of Tyne. Renewable Energy and Decarbonisation Initiatives at Port of Tyne. 2023. Available online: https://www.portoftyne.co.uk/sustainability/renewable-energy (accessed on 21 March 2025).
- North East Local Enterprise Partnership. Sustainable Transport and Decarbonisation in the North East. 2023. Available online: https://www.northeastlep.co.uk/Decarbonisation/transport-and-energy (accessed on 21 March 2025).
- Port of Tyne. 2023. Clean Tyne Project and Digital Energy Management. Available online: https://www.portoftyne.co.uk/operations/clean-tyne (accessed on 21 March 2025).
- Port of Aberdeen. Renewable Energy and Decarbonisation at Port of Aberdeen. 2023. Available online: https://www.portofaberdeen.co.uk/sustainability/renewable-energy (accessed on 21 March 2025).
- Port of Aberdeen. Shore Power and Energy Efficiency Initiatives. 2023. Available online: https://www.portofaberdeen.co.uk/operations/shore-power/ (accessed on 21 March 2025).
- Port of Aberdeen. Navigating Maritime Decarbonisation in Aberdeen. 2024. Available online: https://www.portofaberdeen.co.uk/news/navigating-maritime-decarbonisation-in-aberdeen (accessed on 17 August 2026).
- Asikainen, P. Forging Your Own Path for Digitalising Port Operations. Gisgro. 2025. Available online: https://www.gisgro.com/forging-your-own-path-for-digitalising-port-operations/ (accessed on 17 August 2026).
- Scottish Enterprise. Hydrogen and Sustainable Transport Initiatives in Aberdeen. 2023. Available online: https://www.scottish-enterprise.com/Decarbonisation/hydrogen-initiatives (accessed on 21 March 2025).
- E.ON. Peel Ports and E.ON Complete 31 MW Solar-Rooftop Project at Port of Liverpool [Press Release]. 2023. Available online: https://www.eonenergy.com/about-eon/media-centre/peel-ports-and-eon-complete-31mw-solar-rooftop-project-at-port-of-liverpool (accessed on 21 March 2025).
- Peel Ports. Sustainability: Environment and Decarbonisation Initiatives. 2024. Available online: https://www.peelports.com/sustainability/environment (accessed on 21 March 2025).
- Local Government Association. DePoLARiZE (Delivering Port of Liverpool-Associated Road freight Zero Emissions). 2023. Available online: https://www.local.gov.uk/case-studies/depolarize-delivering-port-liverpool-associated-road-freight-zero-emissions (accessed on 21 March 2025).
- Peel Ports. Renewable Energy to Power Major Project at Hunterston Parc. 2024. Available online: https://www.peelports.com/news-articles/renewable-energy-to-power-major-project-at-hunterston-parc (accessed on 21 March 2025).
- Ybnews. Shore Power Could Slash Liverpool Cruise Emissions. Liverpool Business News, 23 September 2024. Available online: https://lbndaily.co.uk/shore-power-could-slash-liverpool-cruise-emissions/ (accessed on 17 August 2026).
- Container News. Peel Ports Plans Net Zero Emissions by 2040. 2021. Available online: https://container-news.com/peel-ports-plans-net-zero-emissions-by-2040/ (accessed on 21 March 2025).
- University of Liverpool. University Part of New £21.3m UK Maritime Research Hub. 2023. Available online: https://news.liverpool.ac.uk/2023/09/18/university-part-of-new-21-3m-national-research-hub-to-decarbonise-uk-maritime-sector/ (accessed on 21 March 2025).
- Forth Ports Group. Sustainability and Renewable Energy at Port of Tilbury. 2023. Available online: https://www.forthports.co.uk/tilbury/sustainability/ (accessed on 21 March 2025).
- Forth Ports Group. Forth Ports Launches Its Commitment to Net Zero. 2023. Available online: https://www.forthports.co.uk/latest-news/forth-ports-launches-its-commitment-to-net-zero/ (accessed on 21 March 2025).
- Transport for London. Rail Connectivity and Decarbonisation Initiatives for Ports. 2023. Available online: https://tfl.gov.uk/rail-Decarbonisation (accessed on 21 March 2025).
- PD Ports. Sustainability and Decarbonisation at Tees & Hartlepool Ports. 2023. Available online: https://www.pdports.co.uk/sustainability/Decarbonisation/ (accessed on 21 March 2025).
- Tees Valley Combined Authority. Hydrogen Transport Hub and Green Initiatives in Tees Valley. 2023. Available online: https://www.teesvalley-ca.gov.uk/hydrogen-transport-hub-and-green-initiatives/ (accessed on 21 March 2025).
- PD Ports. Carbon Capture and Hydrogen Initiatives at Ports of Tees & Hartlepool. 2023. Available online: https://www.pdports.co.uk/news-and-events/ccus-hydrogen-initiatives/ (accessed on 21 March 2025).
- Port of London Authority. Net Zero River Plan. 2024. Available online: https://www.pla.co.uk/net-zero-river-plan (accessed on 21 March 2025).
- Port of London Authority. Thames Vision 2050 Priorities. 2024. Available online: https://www.pla.co.uk/thames-vision-2050-priorities (accessed on 21 March 2025).
- Ship Technology, 2023. Port of London Authority Halves Its Carbon Emissions. Ship Technol. Available online: https://www.ship-technology.com/news/port-of-london-authority-halves-its-carbon-emissions/ (accessed on 21 March 2025).
- Net Zero Professional. RightShip and Port of London Authority Partner to Support Maritime Decarbonisation. Net Zero Prof. 2023. Available online: https://netzeroprofessional.com/rightship-and-port-of-london-authority-partner-to-support-maritime-decarbonisation/ (accessed on 21 March 2025).
- The Bristol Port Company. Sustainability. Available online: https://www.bristolport.co.uk/about-us/the-environment/ (accessed on 21 March 2025).
- The Bristol Port Company. One Year of Solar Success. 2026. Available online: https://www.bristolport.co.uk/news/one-year-of-solar-success/ (accessed on 21 March 2025).
- South West Rail Partnership, 2023. Rail Connectivity and Decarbonisation Initiatives in the South West. Available online: https://www.southwestrail.co.uk/Decarbonisation/rail-initiatives (accessed on 21 March 2025).
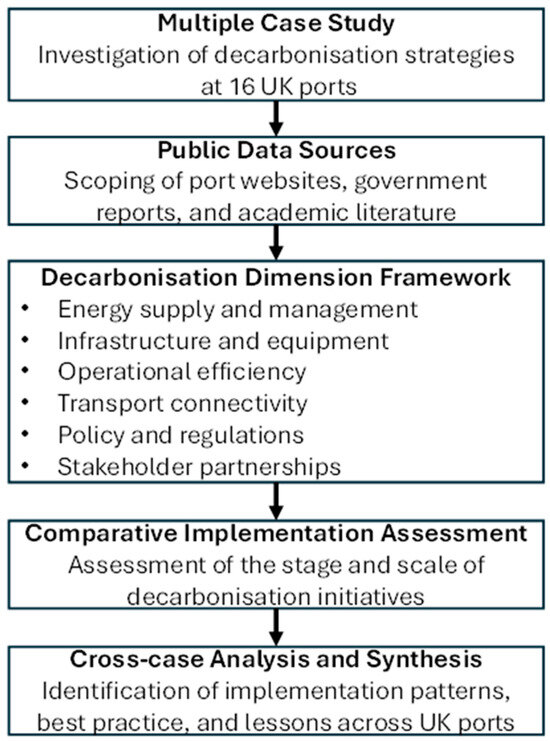
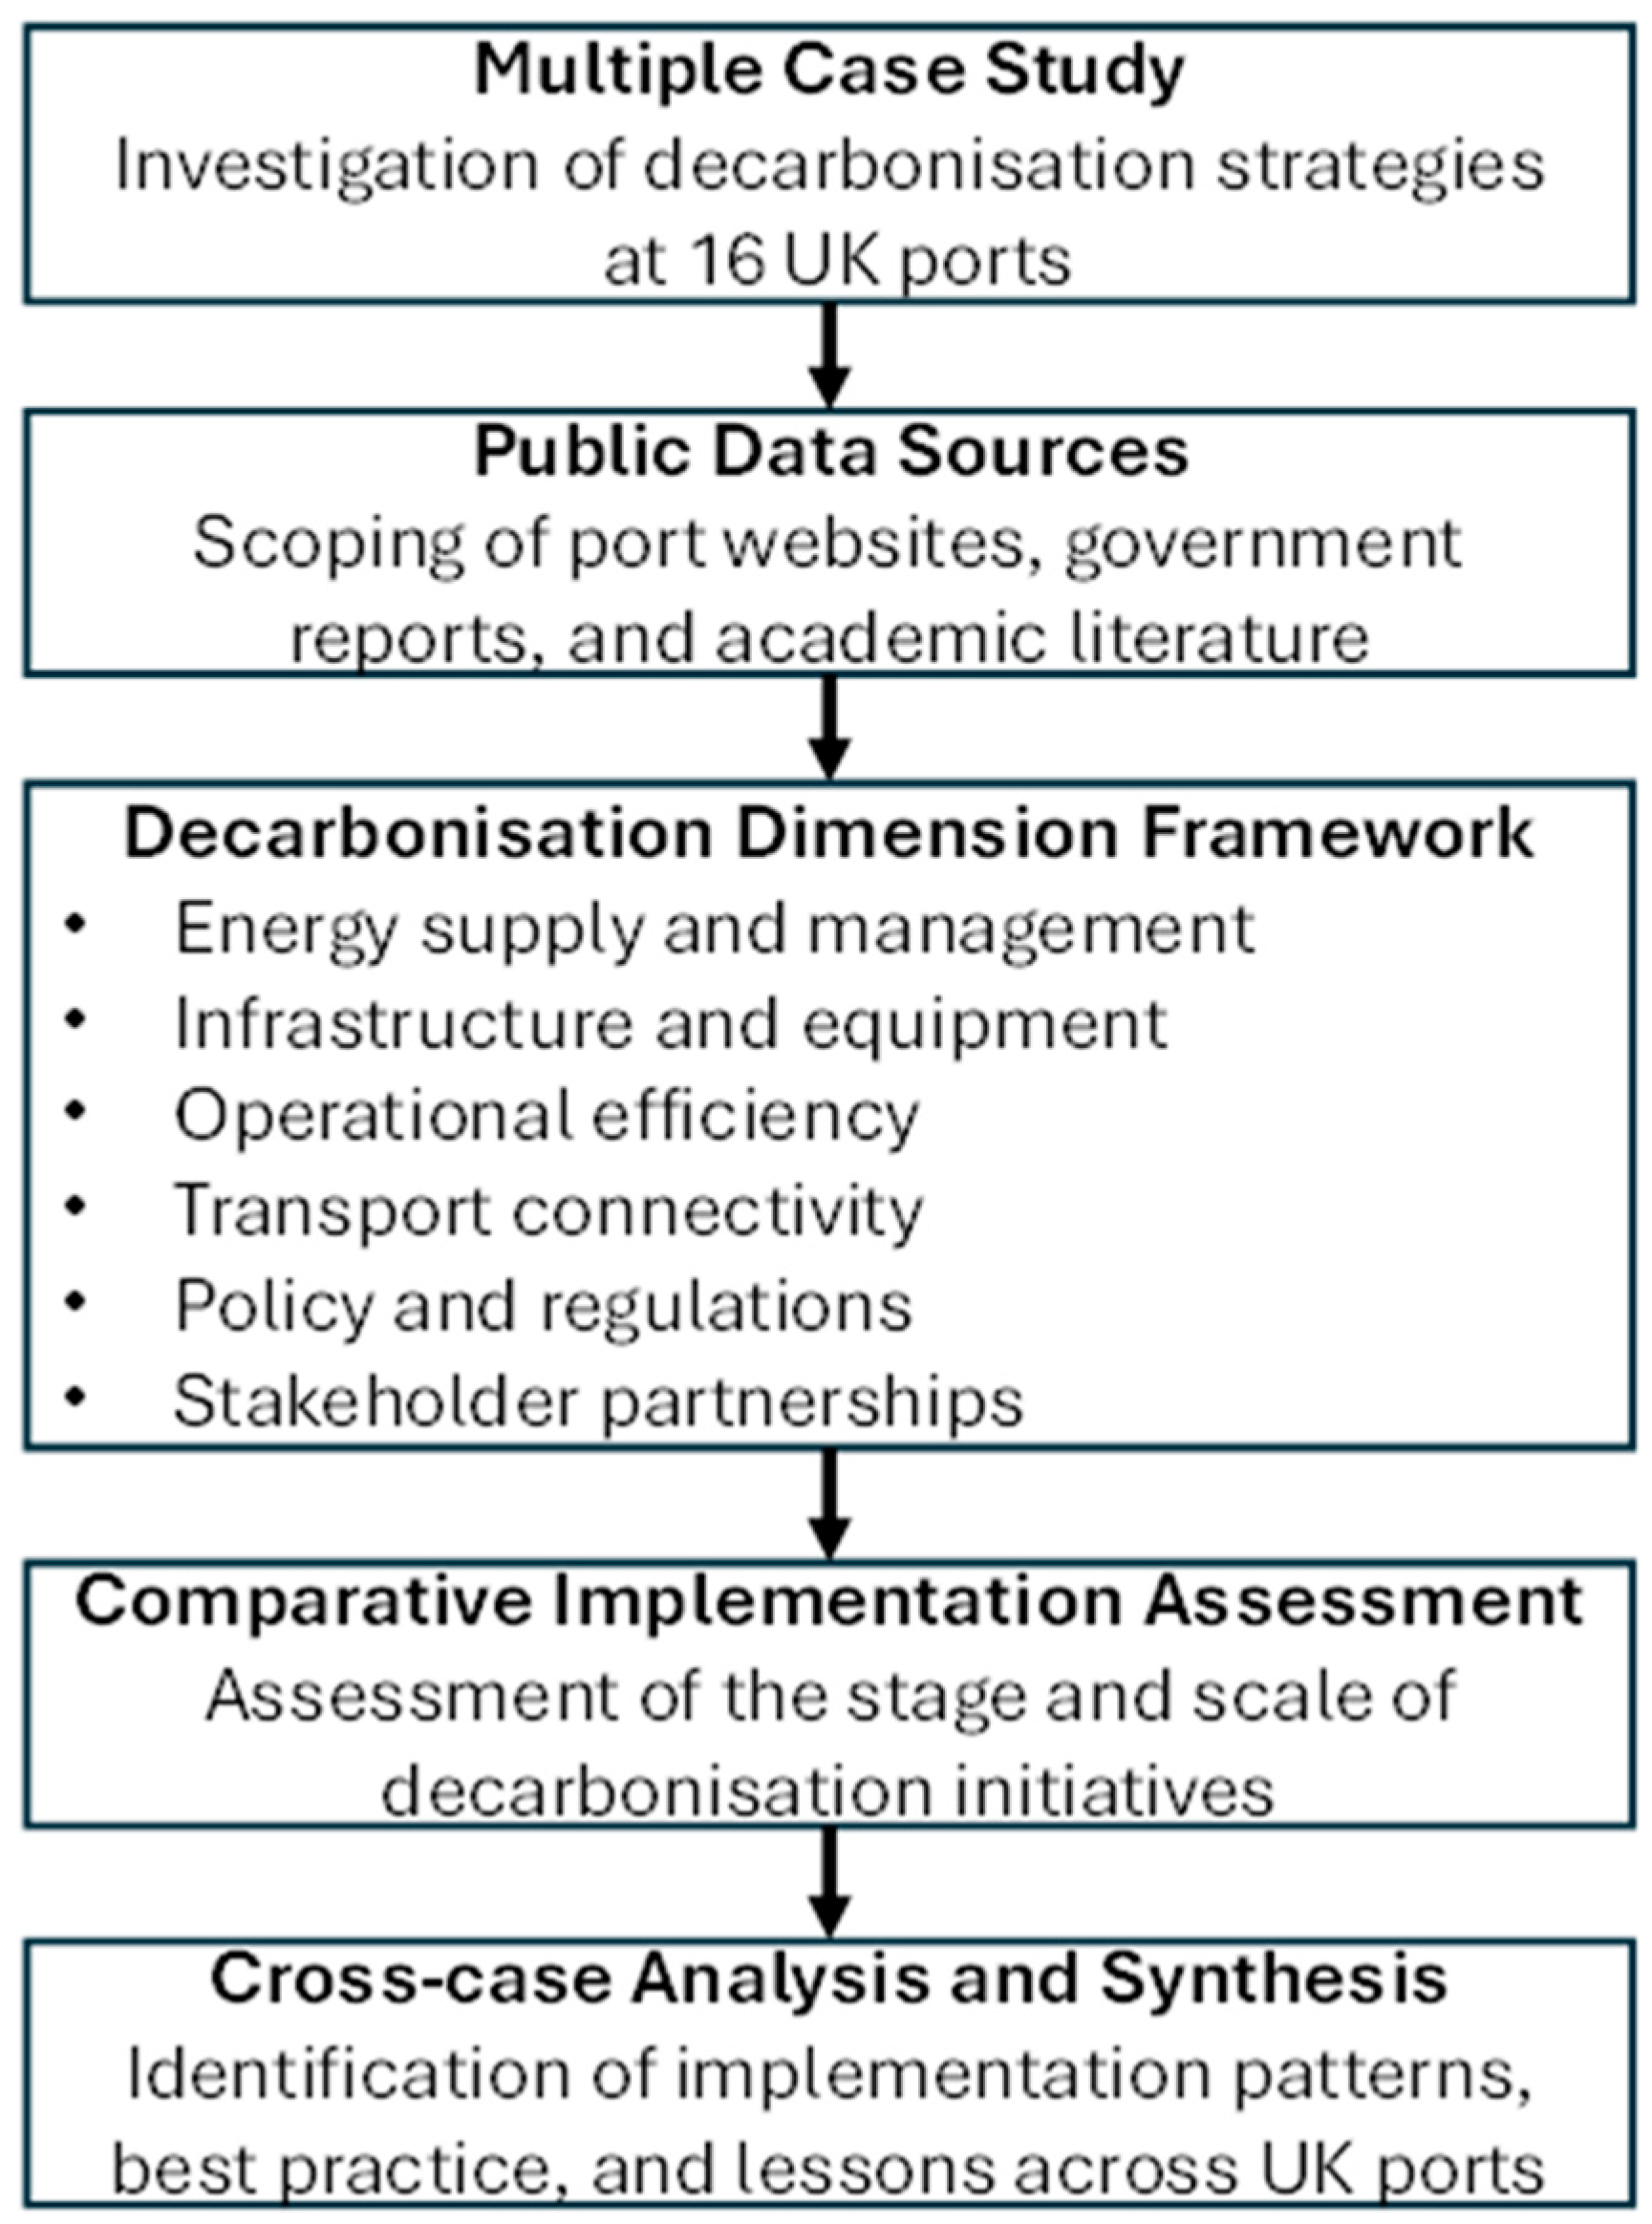
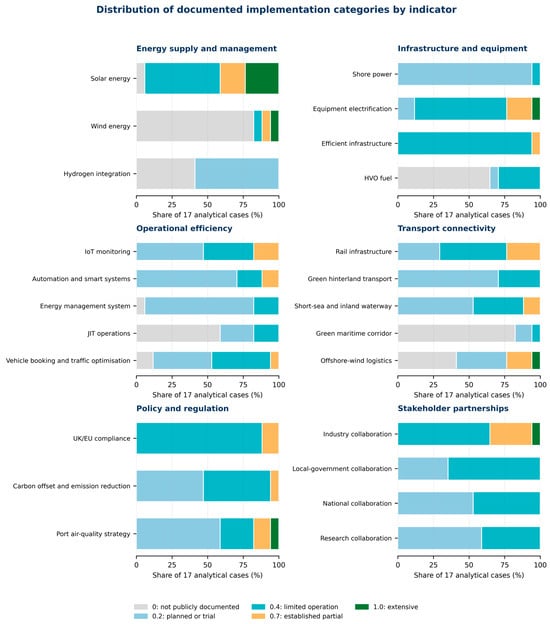
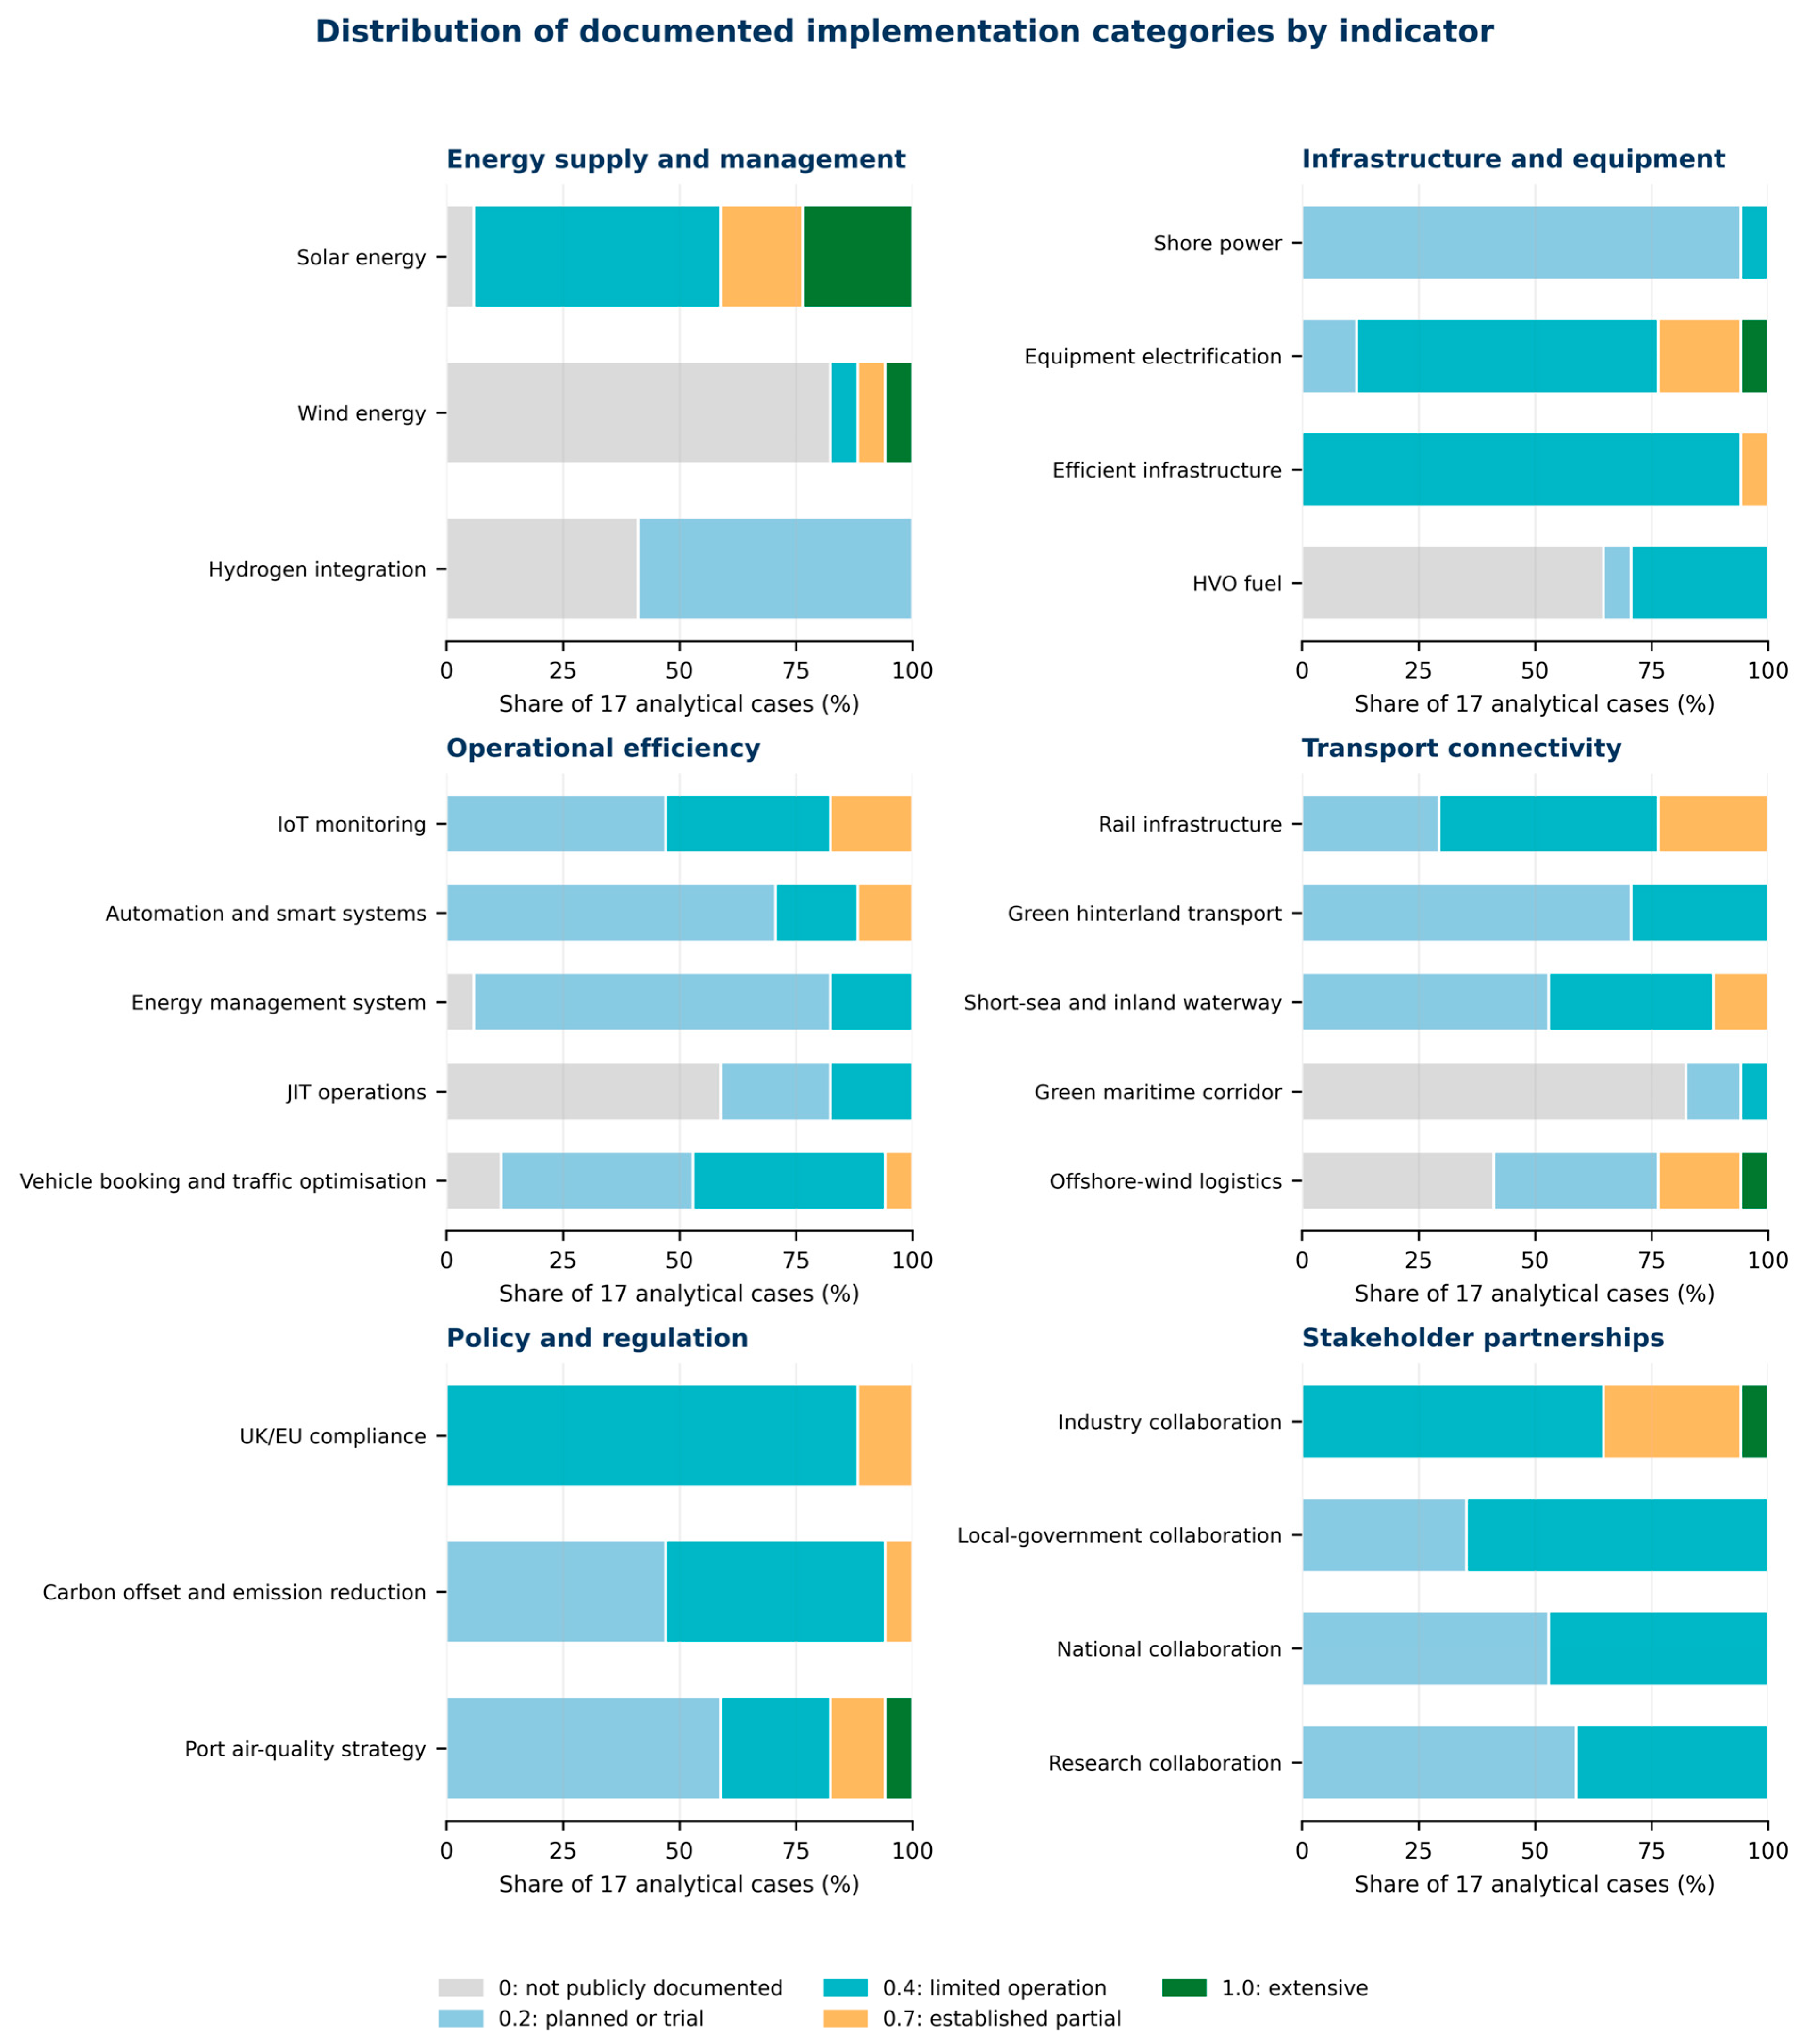
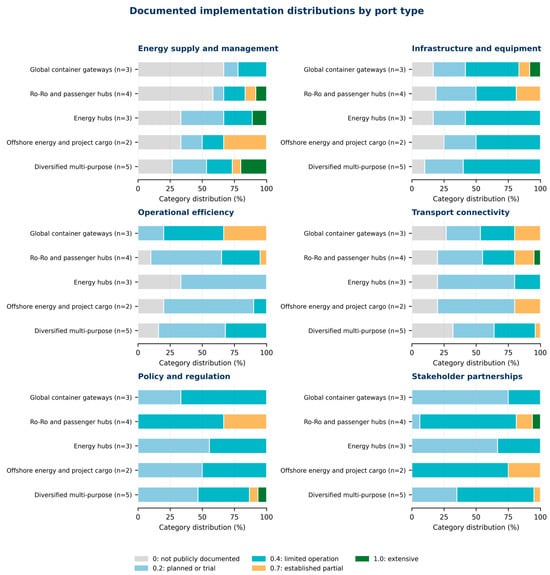
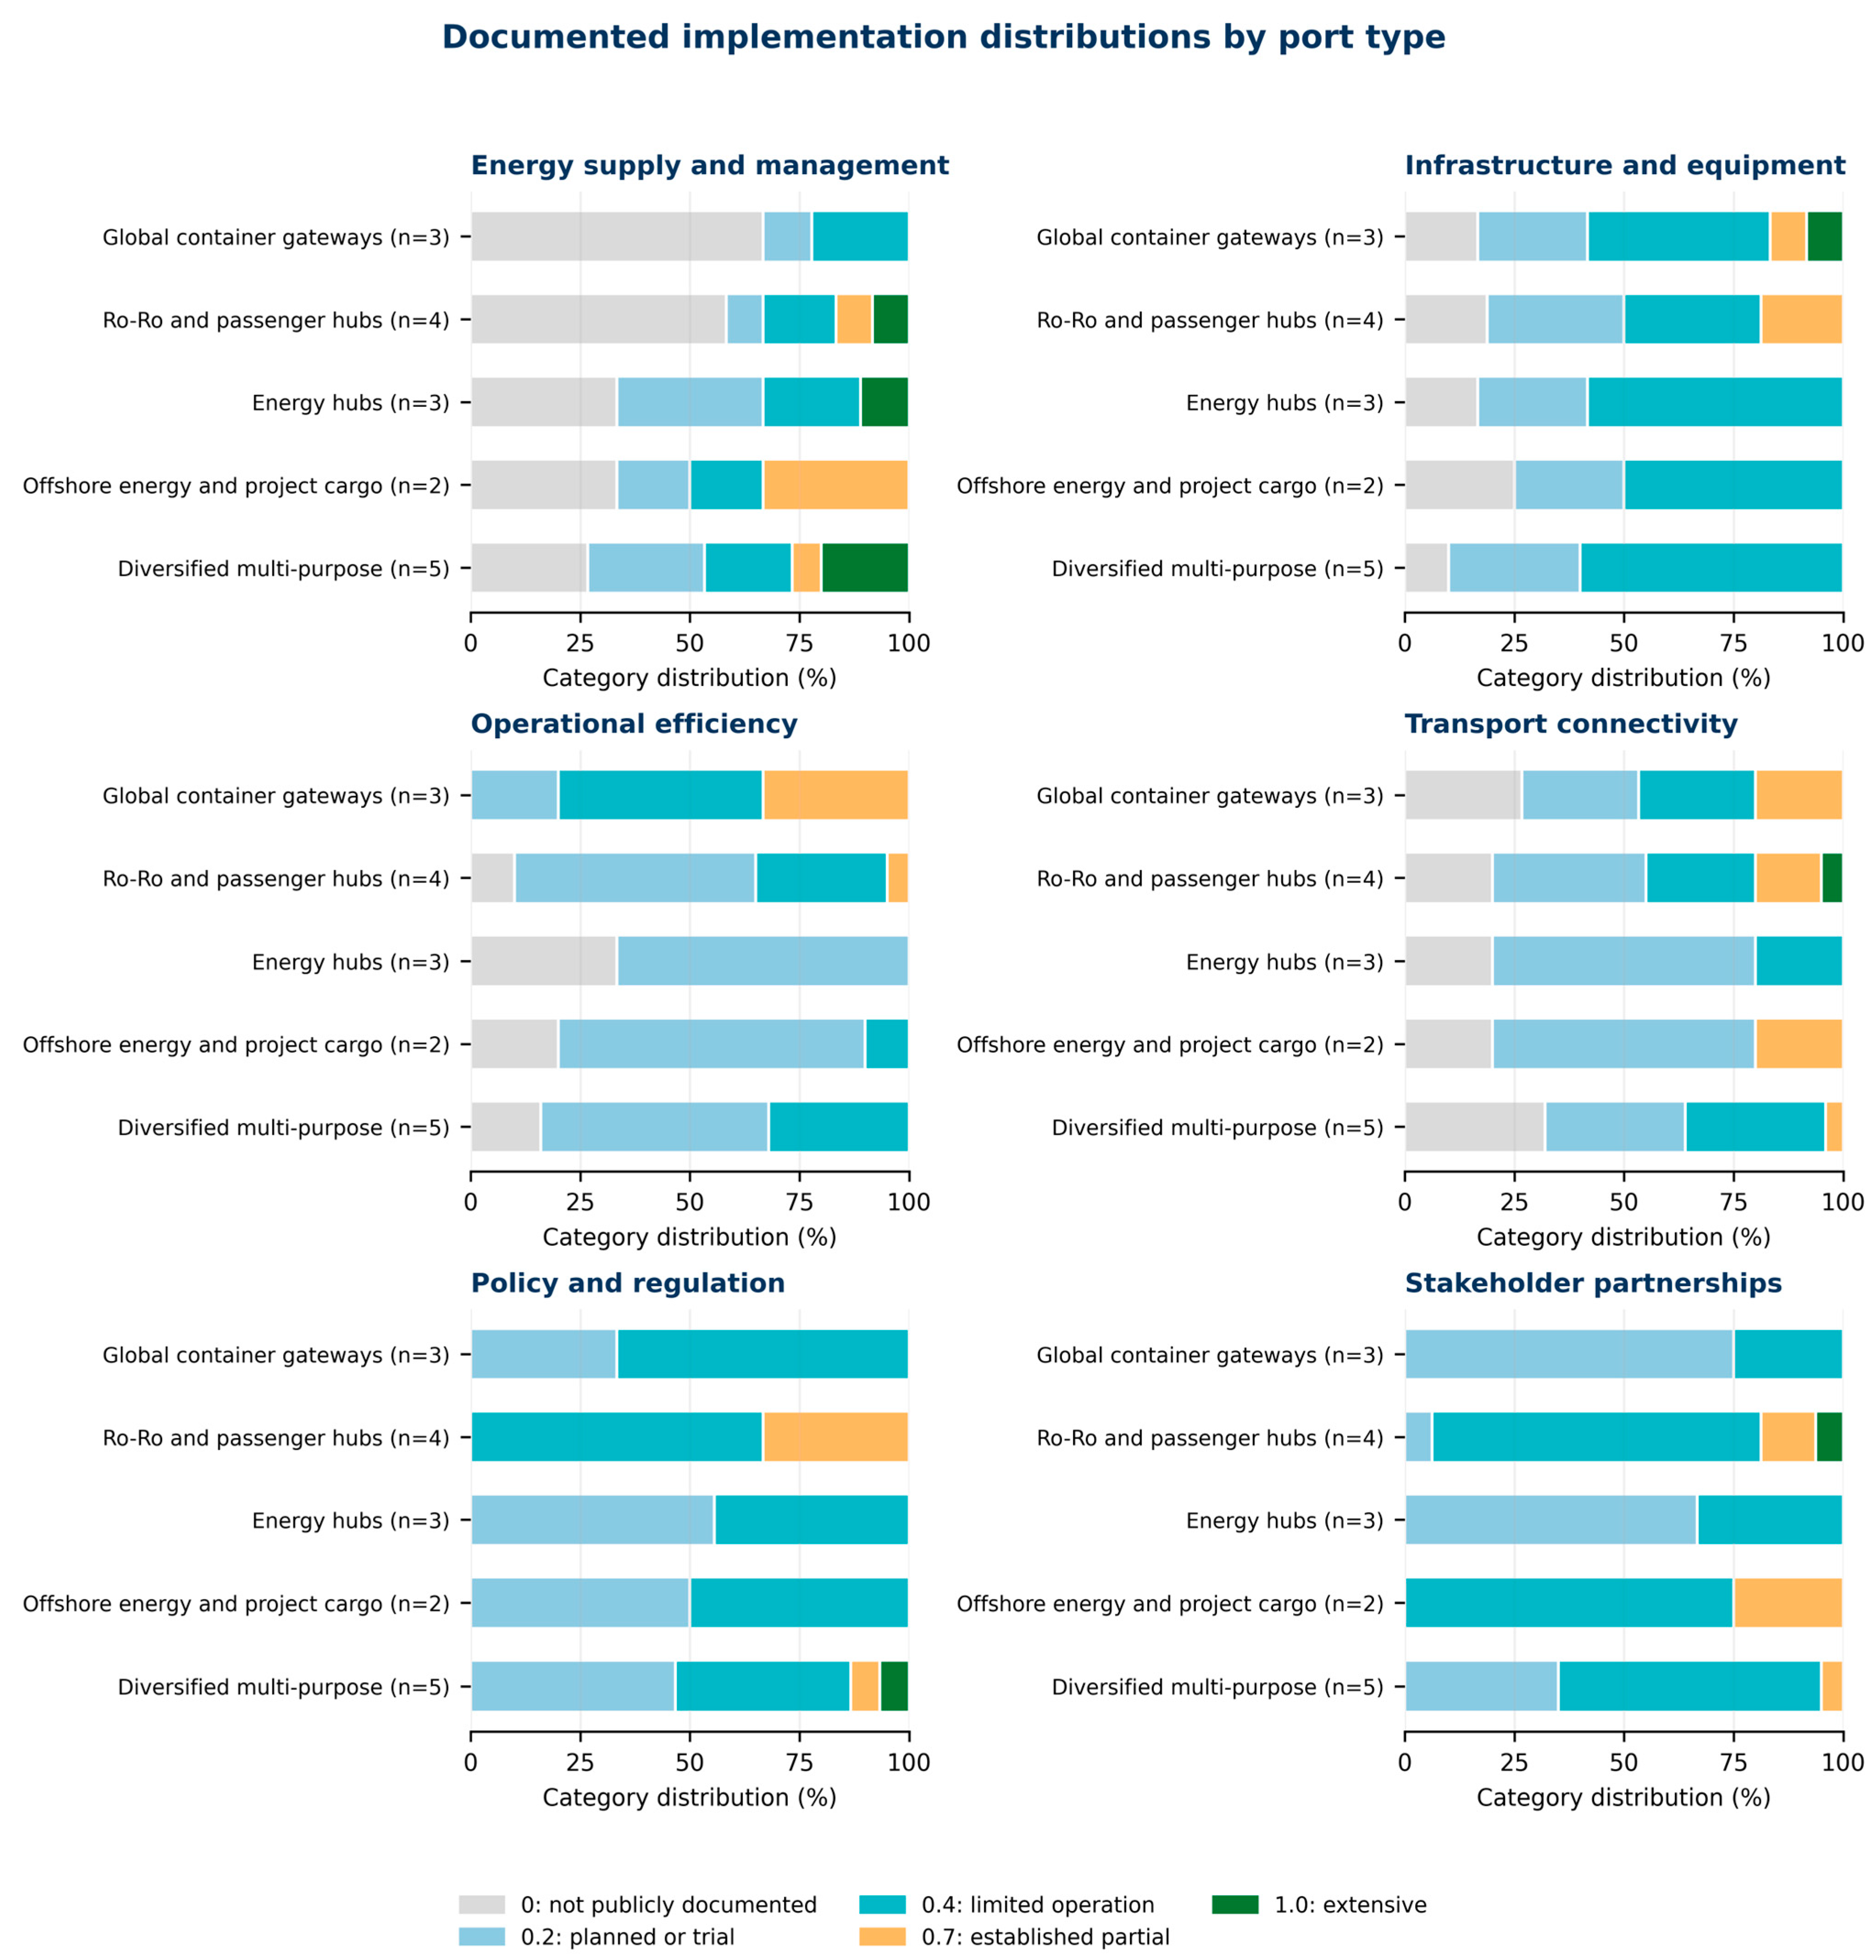
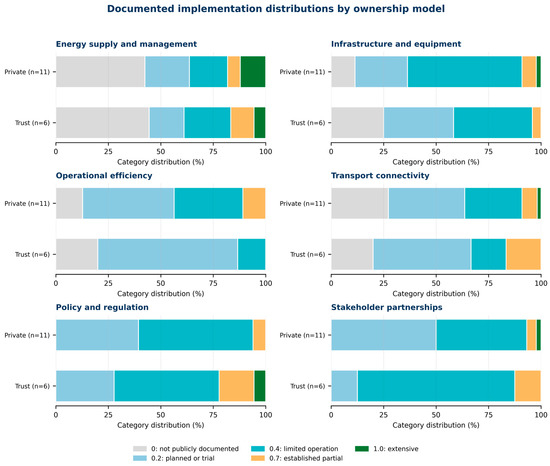
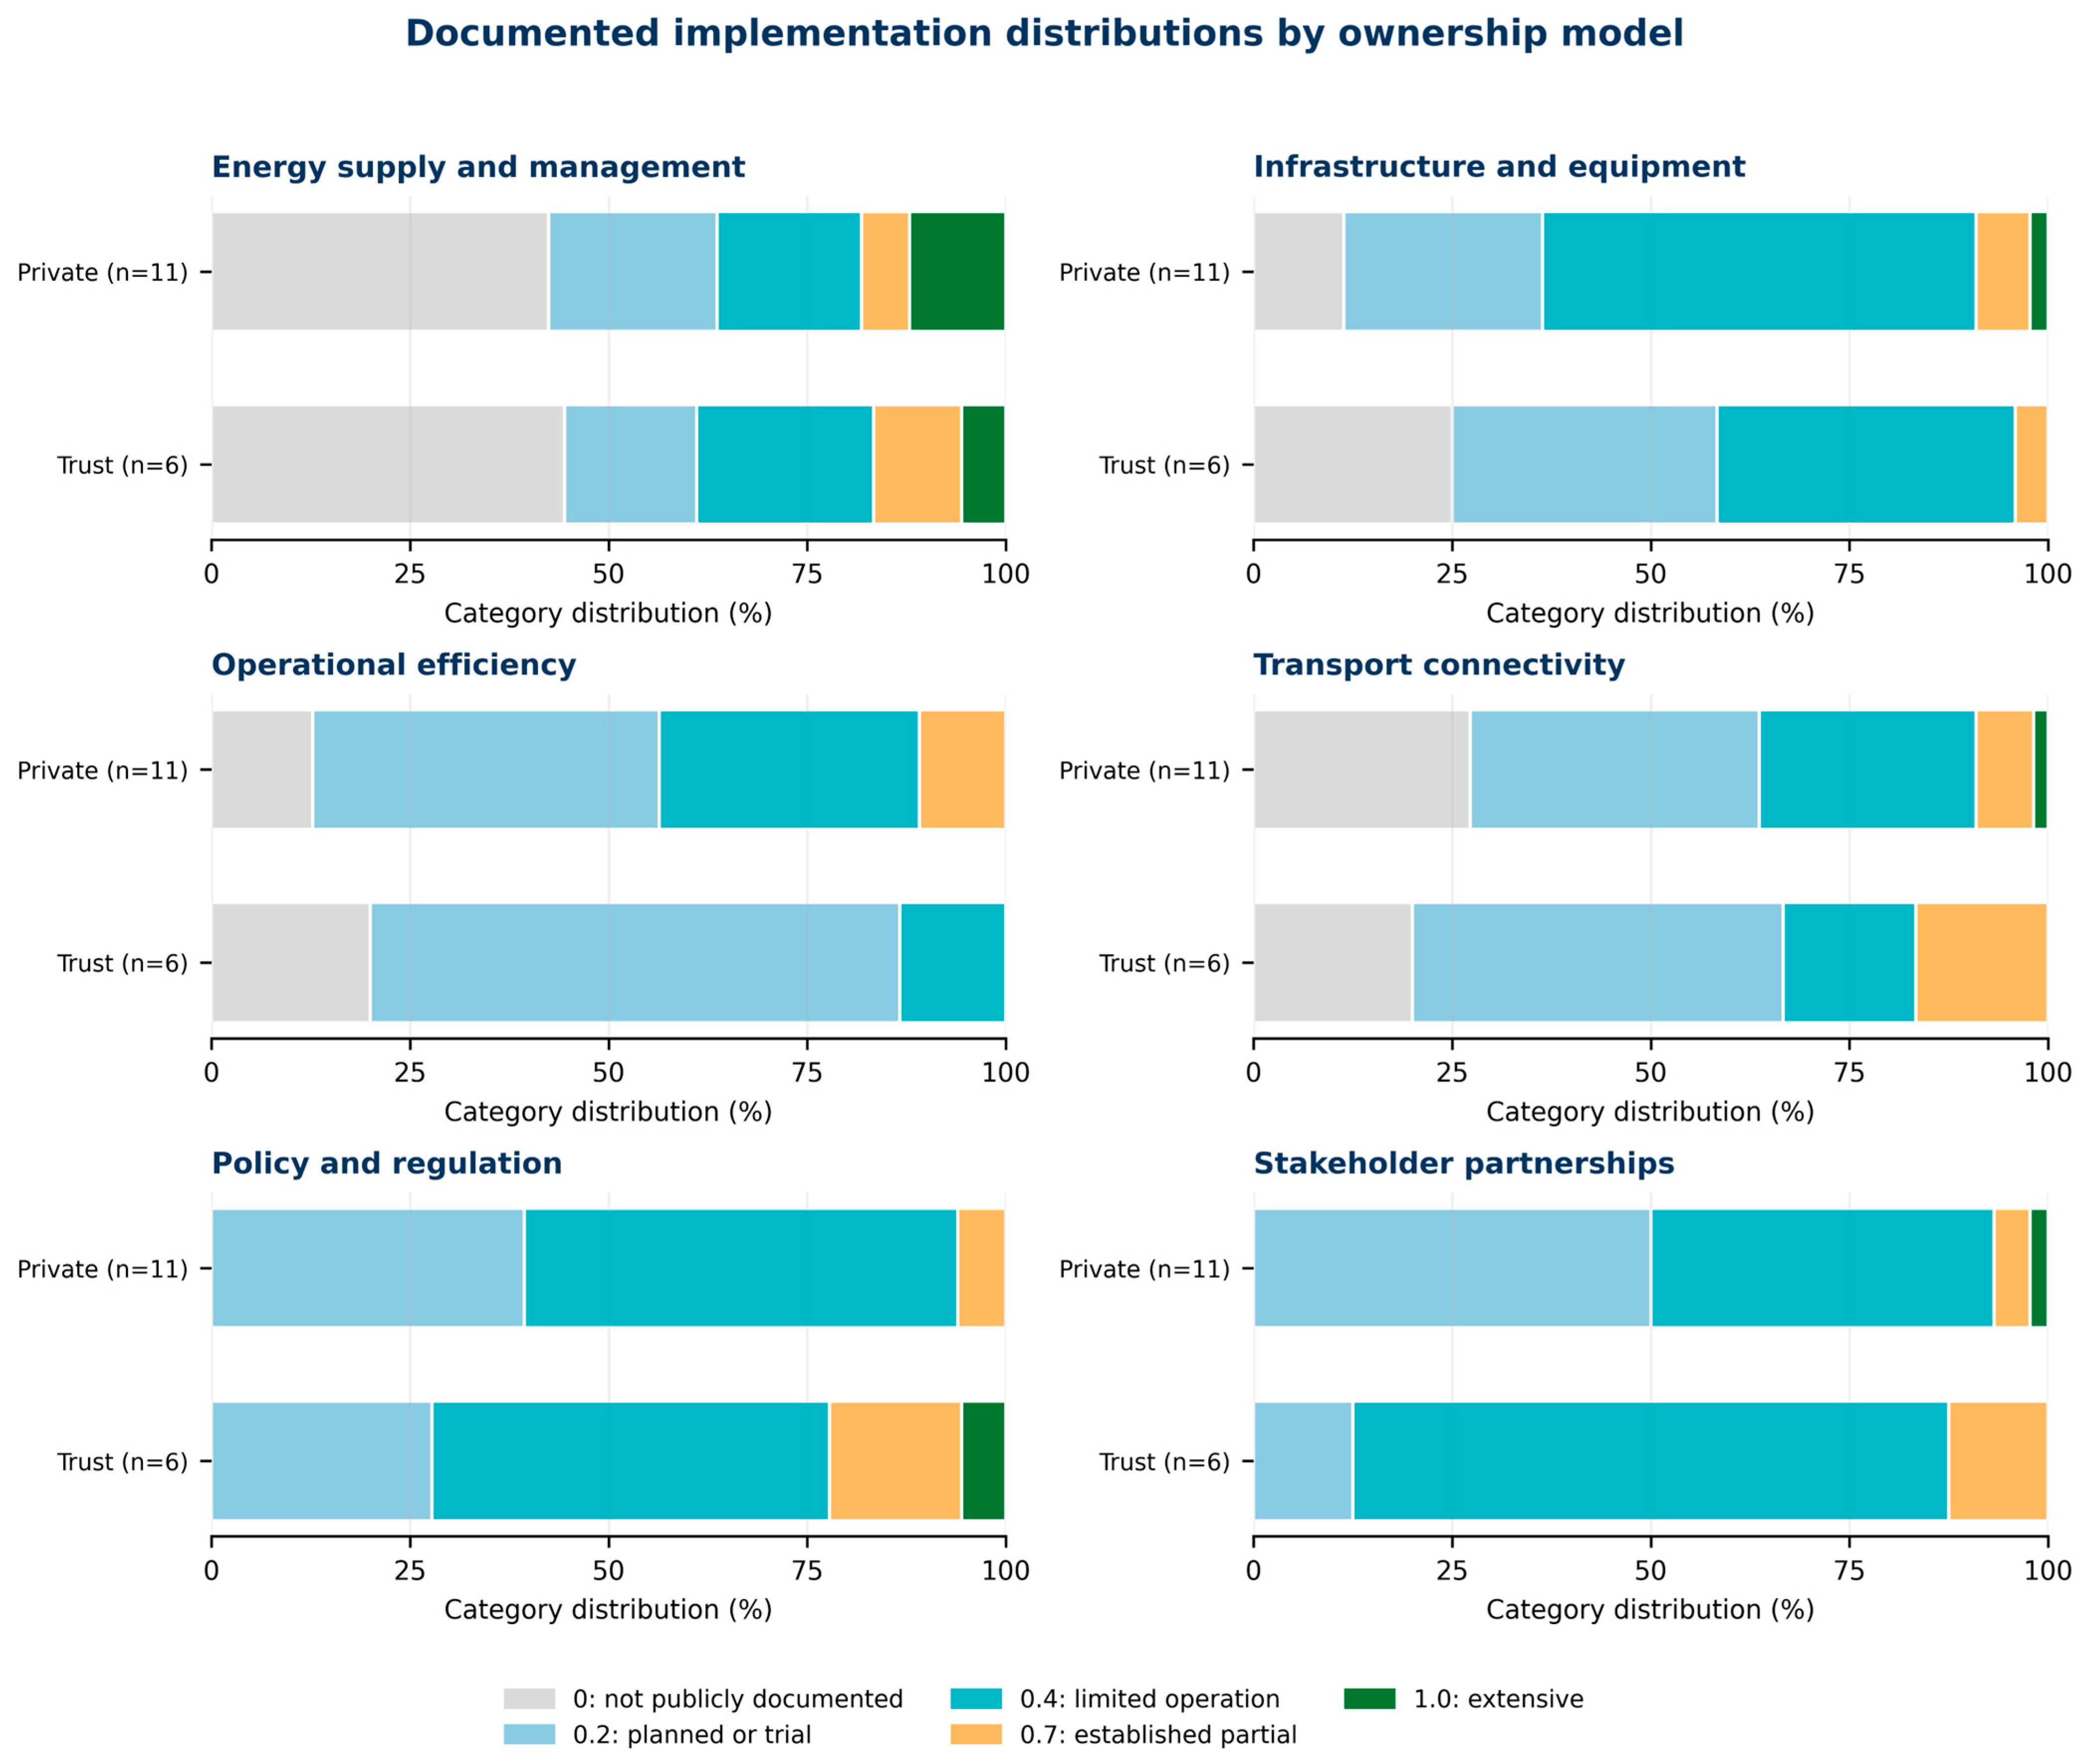
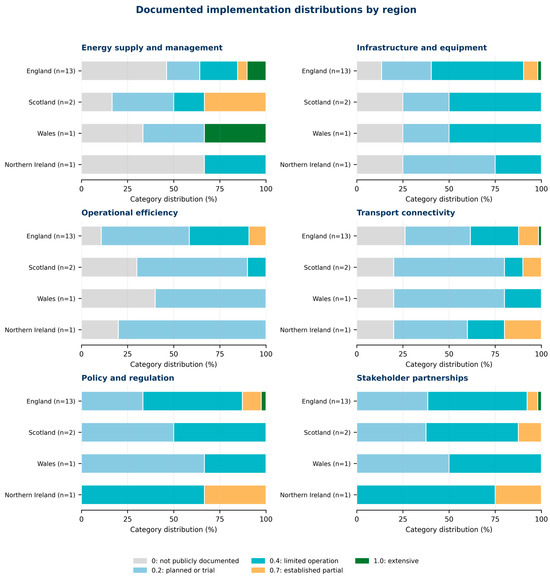
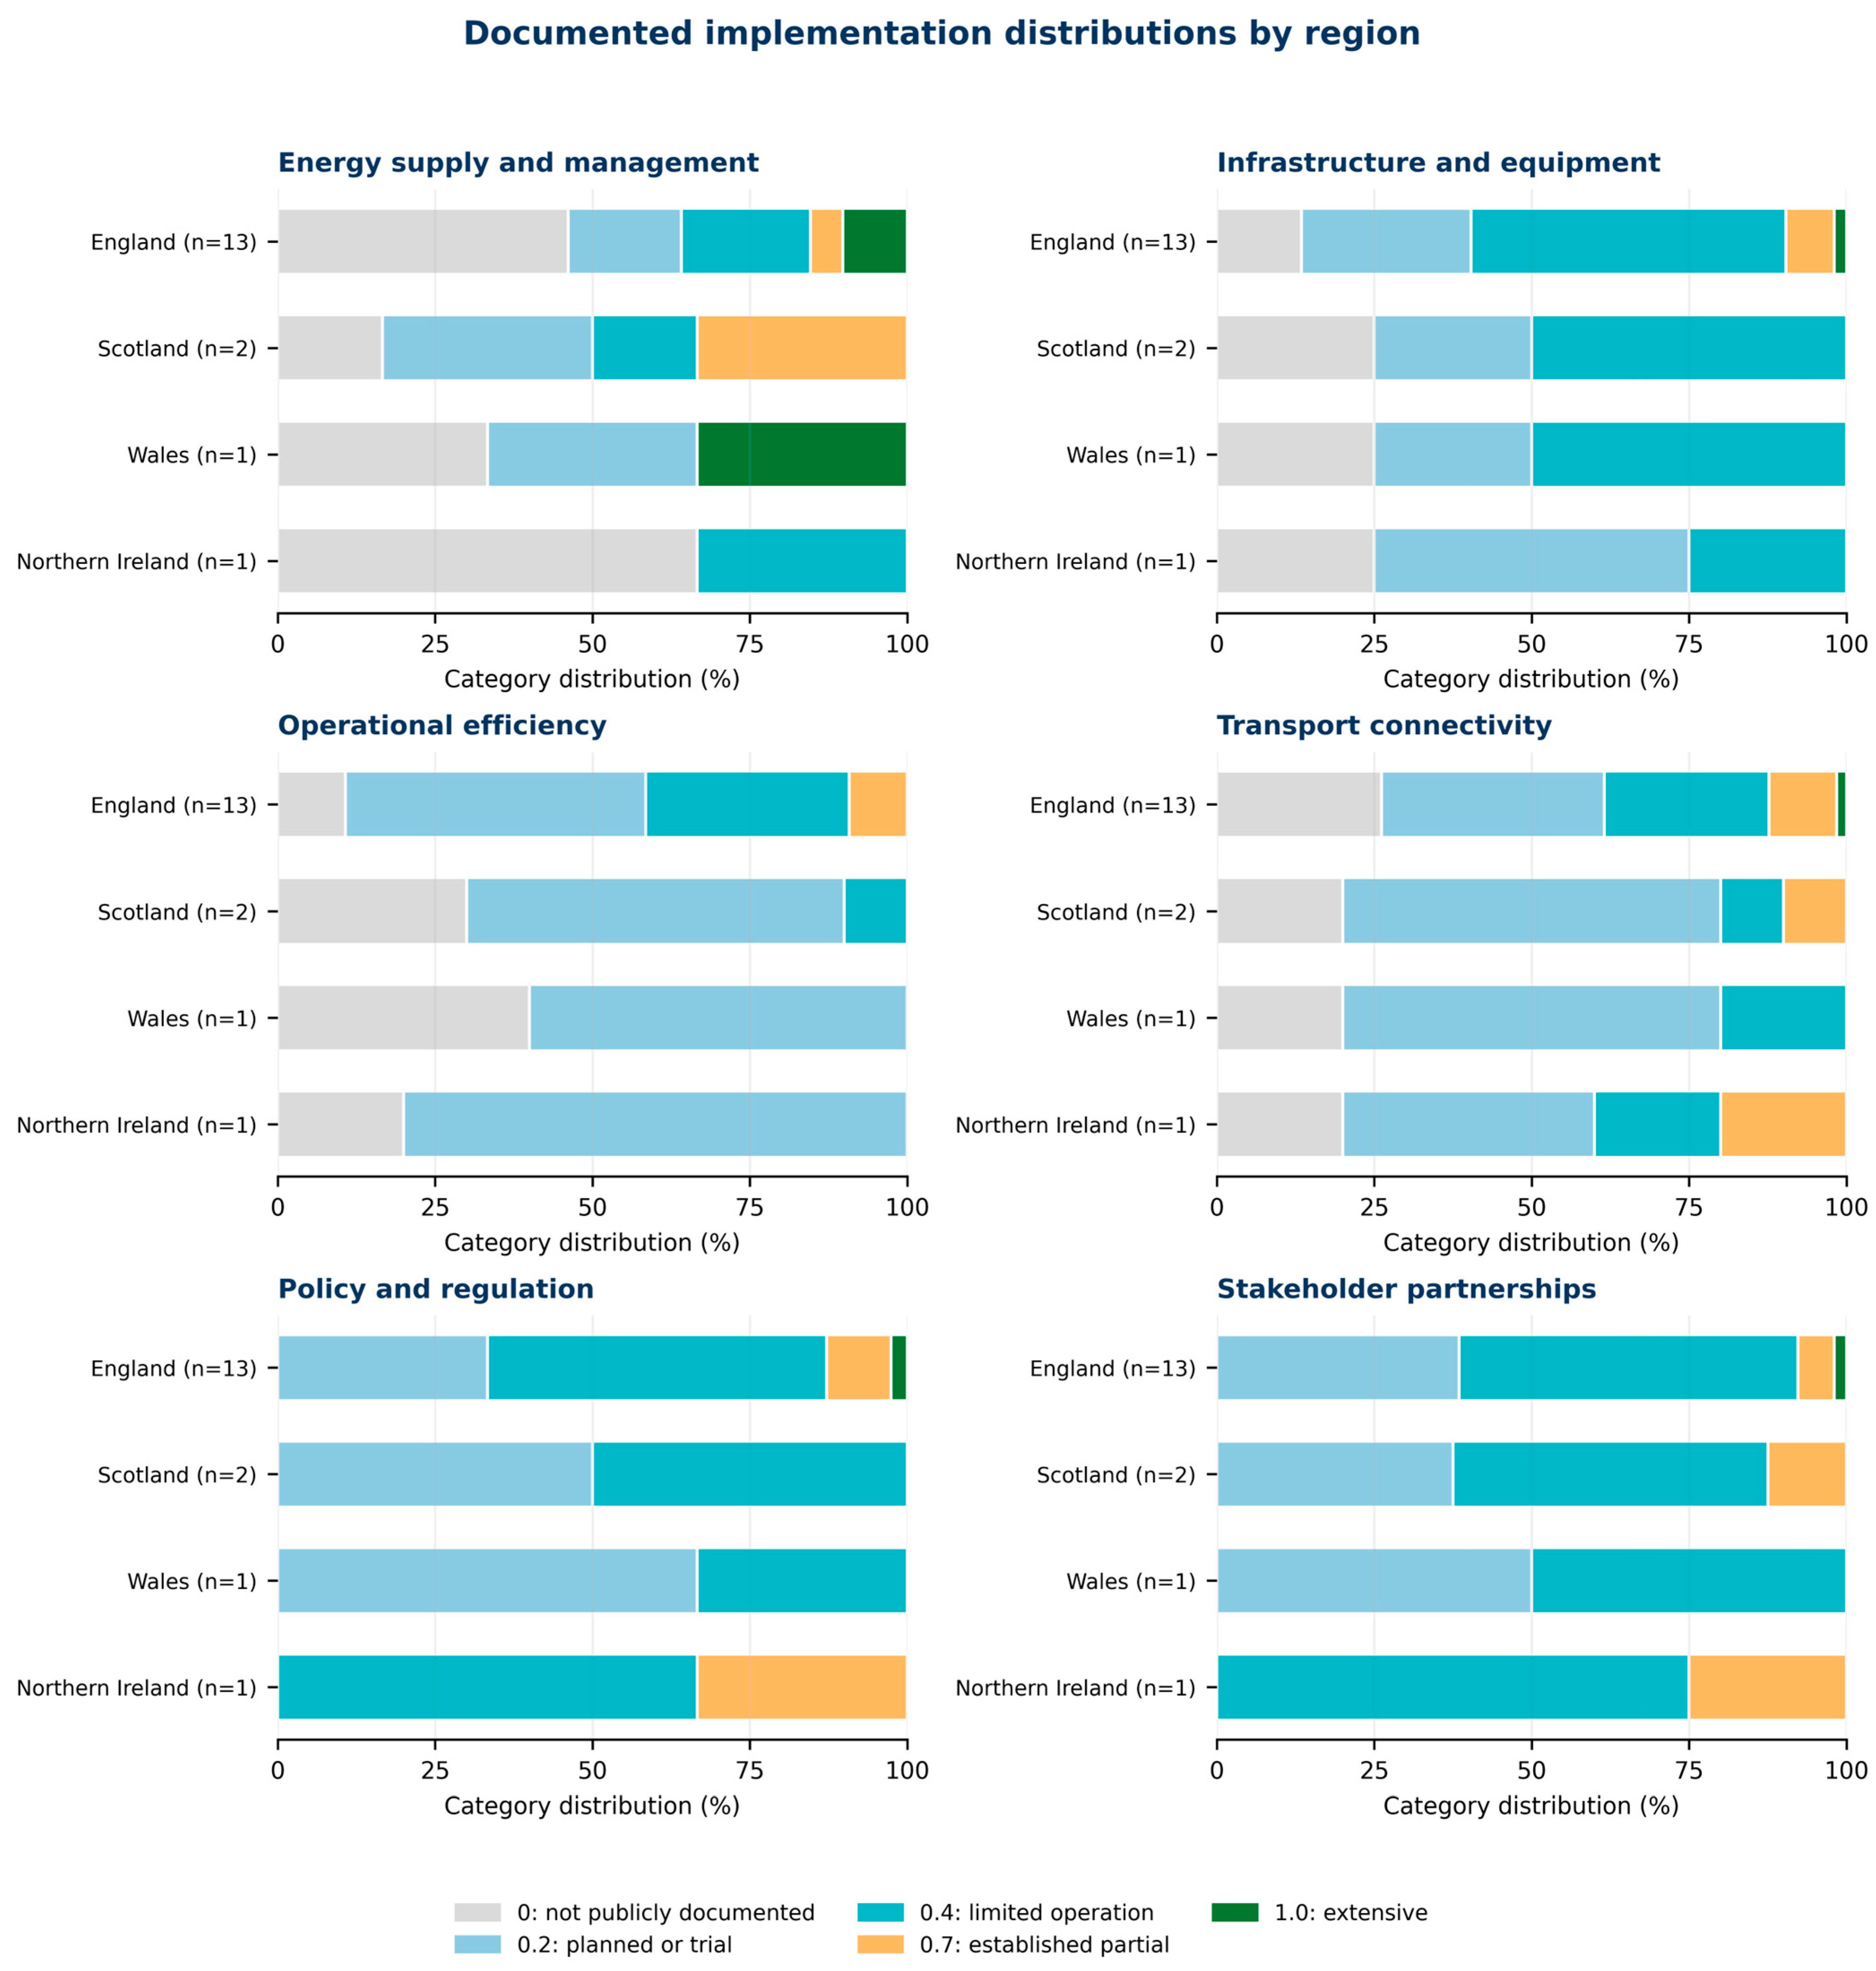

Disclaimer/Publisher’s Note: The statements, opinions and data contained in all publications are solely those of the individual author(s) and contributor(s) and not of MDPI and/or the editor(s). MDPI and/or the editor(s) disclaim responsibility for any injury to people or property resulting from any ideas, methods, instructions or products referred to in the content. |
© 2026 by the authors. Licensee MDPI, Basel, Switzerland. This article is an open access article distributed under the terms and conditions of the Creative Commons Attribution (CC BY) license.