


Abstract
Backgrounds: Ports are critical nodes in global logistics and supply chains, yet their operations generate substantial environmental and social externalities. Existing evaluation frameworks have limited capability to address uncertainty, ambiguity, and expert hesitation. Moreover, prior studies frequently examine isolated performance dimensions, overlooking the interconnected roles of port authorities as landlords, regulators, operators, and community stakeholders. Methods: This study proposes an integrated evaluation framework using the Intuitionistic Fuzzy Analytical Hierarchy Process (IF-AHP) to assess environmentally sustainable port performance under uncertain decision environments. By incorporating membership, non-membership, and hesitation degrees, the approach improves the robustness of expert judgments and applies a dual consistency check to reduce bias. Empirical data are obtained from Malaysian port management professionals, enabling the development of a comprehensive framework that includes four main functions and twenty sub-functions. Results: Results reveal that the landlord function holds the highest priority, while operational sustainability dimensions receive the greatest emphasis, with a global weight of approximately 0.105. In contrast, community engagement and social initiatives are assigned relatively lower importance. Conclusions: The IF-AHP framework offers an uncertainty-aware tool that prioritizes sustainability functions, especially environmental mitigation and energy efficiency, enabling informed resource allocation, strategic planning, and policy formulation for balanced, sustainable port overall performance.
1. Introduction
Port authorities are increasingly under pressure to fulfill their environmental and social responsibilities while maintaining high levels of operational efficiency and economic competitiveness. One of the main challenges lies in balancing environmental obligations with port productivity and financial performance. Evaluating port performance from an environmentally sustainable perspective therefore requires a systematic and structured framework capable of integrating environmental considerations into operational decision-making [1,2]. Despite extensive research in port sustainability, the development of comprehensive and robust evaluation methodologies remains limited. Many existing studies focus primarily on individual sustainability indicators or qualitative assessments rather than providing an integrated decision-support framework for port authorities [3,4]. Furthermore, several studies have relied on traditional multi-criteria decision-making approaches such as the Analytic Hierarchy Process (AHP) to prioritize port sustainability indicators [5,6]. While AHP is widely used for structuring complex decisions, it has limitations when addressing real-world decision environments that involve ambiguity, hesitation, and subjective judgment among experts.
Another limitation in the existing literature is the strong emphasis on port operator performance, particularly in relation to terminal productivity, logistics efficiency, and cargo handling operations [7,8]. Comparatively less attention has been given to the broader institutional roles of port authorities, including their landlord, regulatory, operator, and community management functions, even though these roles significantly influence sustainability governance and environmental management within port systems [9,10].
These methodological limitations are particularly relevant in the context of Malaysia, where sustainability practices and reporting standards vary among different port management entities. The absence of a consistent evaluation framework makes it difficult to systematically identify and prioritize the most critical institutional functions that contribute to environmentally sustainable port performance. Therefore, there is a clear research need to develop a robust, data-driven, and context-specific evaluation model.
Such a model must be capable of prioritizing sustainability initiatives, addressing uncertainty in decision-making, and supporting Malaysia in achieving its national policy goals such as environmental sustainability in the transport sector as a key focus, as well as international commitments, SDGs and IMO Net-Zero 2050.
To address these gaps, this study proposes the application of the Intuitionistic Fuzzy Analytical Hierarchy Process (IF-AHP) as an enhanced methodological framework for evaluating environmentally sustainable port performance. The IF-AHP approach extends the conventional AHP model by incorporating membership, non-membership, and hesitation degrees, allowing a more comprehensive representation of expert judgments under uncertainty [11]. By integrating these components into the decision-making process, the proposed framework provides a more robust mechanism for prioritizing port authority functions and sustainability initiatives in complex and uncertain operational environments. While this study highlights the application of the (Intuitionistic) Fuzzy AHP to address uncertainty and enhance the robustness of decision-making, the primary intention is not to focus solely on the mathematical formulation. Rather, methodological rigor is necessary to ensure reliable and unbiased evaluation outcomes in complex maritime development contexts.
2. Literature Review
2.1. Sustainable Port Performance Evaluation
Research into port operation sustainability has become essential because ports serve as critical nodes in worldwide logistics and environmental management systems. The environmental impact of ports remains substantial because they produce greenhouse gases while generating waste and using natural resources beyond sustainable levels. Environmental challenges require the creation of evaluation frameworks focusing on sustainability. Ref. [12] highlighted the need to shift from traditional operational models toward sustainability-focused frameworks, especially in areas with strict regulatory requirements.
The scientific community has started to acknowledge environmental issues, but there is no standard method for evaluating port sustainability across all ports. Current frameworks concentrate on particular objectives or criteria that result in fragmented approaches that do not fully represent the complex nature of sustainable port performance. The structured decision-making processes of the AHP have made it a widely used method in traditional approaches. Ref. [13] used AHP to evaluate environmental indicators in Asian ports and determined that air pollution management needs the most attention. Ref. [14] used AHP to evaluate green practices in sustainable supply chains and proved the usefulness of this method for environmental assessment. Ref. [15] used an advanced AHP method to evaluate the performance of personnel in port operations. The requirement for exact numerical data in AHP makes it ineffective for real-world scenarios that involve ambiguous and subjectively assessed information.
The AHP framework was improved through fuzzy logic integration, which led to the development of the Fuzzy AHP (FAHP) model. The FAHP model strengthens decision making through fuzzy sets by allowing evaluations of uncertain and imprecise judgments. The application of the FAHP by [16] for environmental performance regulatory compliance assessment showed its ability to handle complex and uncertain situations. The current version of the FAHP fails to handle the hesitation that occurs when experts remain uncertain about assigning specific values to criteria [17,18].
In recent years, there has been an increase in hybrid methodologies that combine AHP with other decision-making tools. Ref. [19] merged Fuzzy TOPSIS with AHP to evaluate sustainability criteria in Indian logistics operations, which effectively managed different environmental priorities. Ref. [20] employed PROMETHEE to assess regulatory environmental functions, and ref. [19] utilized the Balanced Scorecard framework to study port authority role interdependencies. Ref. [21] utilised the analytic hierarchy process (AHP) methodology to evaluate key factors influencing port competitiveness with the findings and provide actionable recommendations for policymakers, port authorities and industry stakeholders, guiding strategic investments to strengthen regional connectivity and enhance economic integration. The hybrid methods reduce some AHP and FAHP limitations; however, they do not fully integrate port authority functions, and expert evaluation hesitation remains unaddressed. These approaches fail to consider community function, which remains essential for maintaining the alignment between port sustainability initiatives and stakeholder interests.
The Delphi method is another widely used technique for evaluating port sustainability. Refs. [9,10] used Delphi studies to identify critical environmental indicators and prioritize policy-driven sustainability goals through iterative rounds of expert consultation. However, while Delphi provides valuable qualitative insights, it lacks the quantitative rigor necessary for complex decision-making processes that require precise prioritization. Similarly, entropy-based methods, as demonstrated by [22], and evidence-based knowledge scores, as used by [23], emphasize quantitative metrics, but often overlook the subjective insights needed for holistic evaluations.
2.2. Intuitionistic Fuzzy Analytical Hierarchy Process (IF-AHP)
The Intuitionistic Fuzzy Analytical Hierarchy Process (IF-AHP) is a significant advancement in multicriteria decision-making methodologies. Based on Atanassov’s intuitionistic fuzzy sets, the IF-AHP introduces three membership parameters: membership, non-membership, and hesitation. This membership parameter captures the uncertainty and ambiguity inherent in human decision making [9]. This innovation addresses the rigidity of traditional AHP and FAHP models, which require precise numerical values for their criteria. By explicitly modelling hesitation, the IF-AHP provides a more flexible and realistic framework for evaluating complex trade-offs, such as balancing environmental conservation with operational efficiency [24].
The IF-AHP method has shown its effectiveness in different fields, which proves its ability to work with various types of data. Ref. [16] used the IF-AHP to choose the best sustainable energy technologies for renewable energy planning by evaluating economic feasibility, environmental impact, and public acceptance. Ref. [25] applied the IF-AHP in the United States to assess wind energy projects by integrating life cycle assessments of environmental, economic, and social impacts, which resulted in more precise and detailed outcomes. Ref. [26] applied intuitionistic fuzzy sets with double parameters to assess multiple attributes, including land-use efficiency and infrastructure readiness, which demonstrated IF-AHP’s ability to handle different decision-making challenges.
The evaluation of sustainable port performance benefits significantly from IF-AHP compared to the traditional and hybrid methods. The evaluation system of the IF-AHP assesses multiple criteria through membership, non-membership, and hesitation degrees, which include air and water quality, operational efficiency, and stakeholder satisfaction. This method provides an effective balance between environmental conservation and throughput efficiency, which has conflicting objectives. The adaptable nature of IF-AHP enables complete port authority function integration, which creates a unified framework that includes regulatory, landlord, operator, and community perspectives.
The ability of the IF-AHP to model hesitation is particularly useful in situations where exact data are not available or where expert judgments are inherently subjective. For instance, ref. [27] showed the effectiveness of IF-AHP in reducing cognitive biases and indecisiveness in renewable energy risk assessments. By addressing these challenges, the IF-AHP improves the reliability and inclusivity of decision-making processes, making it a suitable tool for addressing the complexities of sustainable port performance.
The assessment of environmentally sustainable port performance requires evaluation methods that handle modern port management complexities, including ambiguity, subjective judgment, and diverse port authority functions. The current frameworks, including AHP, FAHP, and hybrid approaches, demonstrate major weaknesses in these areas, particularly when dealing with hesitation. The Intuitionistic Fuzzy Analytical Hierarchy Process (IF-AHP) fills these gaps through its decision-making framework, which combines quantitative precision with qualitative insights.
The IF-AHP framework provides a complete evaluation system for port authority functions, which leads to sustainable port management. The implementation of this framework in Malaysian ports can establish a global benchmark for maritime environmental sustainability through an effective tool for advancement.
3. Materials and Methods
3.1. Goals and Components of Evaluating Environmentally Sustainable Port Performance
The evaluation of environmentally sustainable port performance is an essential tool for managing the environmental effects of port operations. The main purpose of this research is to develop an advanced sustainability evaluation framework for ports through the implementation of the Intuitionistic Fuzzy Analytical Hierarchy Process (IF-AHP) to determine the factor and sub-factor weights.
The IF-AHP framework is designed to address the limitations of the traditional models, AHP and FAHP, which are unable to handle real-world complexities such as ambiguity and hesitation in expert judgment. Unlike traditional methods, IF-AHP incorporates nuanced parameters, such as membership, non-membership, and hesitation, that enable decision-makers to account for uncertainties and balance conflicting priorities effectively. Furthermore, this study focuses on the integration of the four port authority functions, thus ensuring that all environmental functions within port operations are comprehensively evaluated.
3.2. Procedure of Environmentally Sustainable Port Performance Evaluation
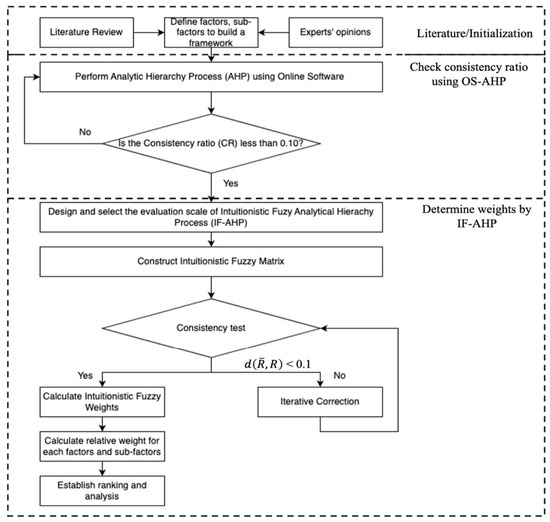
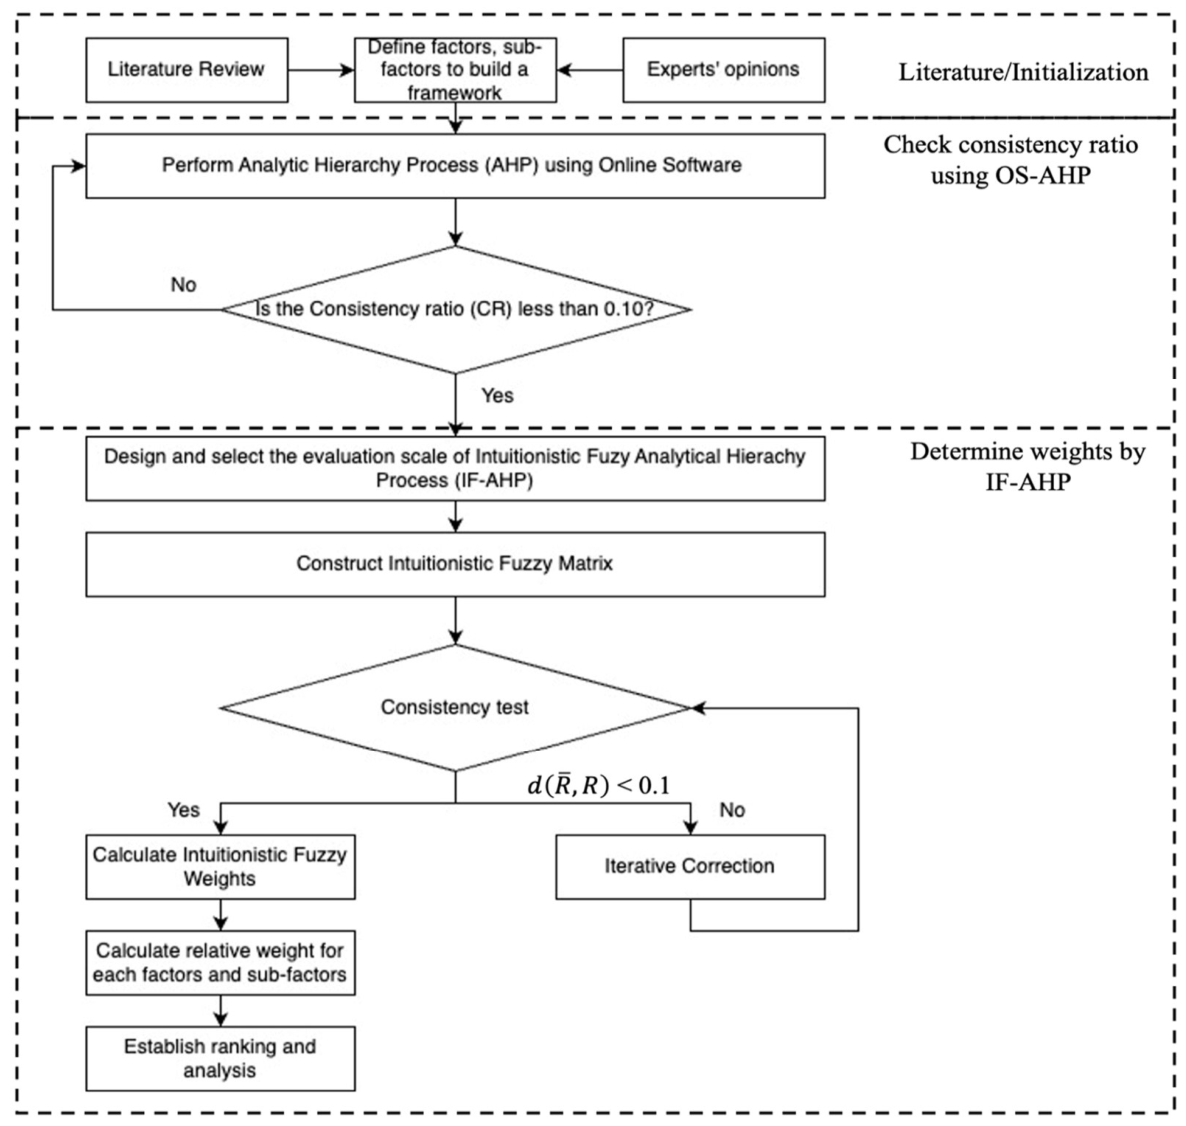
A structured evaluation procedure for port environmental performance assessment is presented in Figure 1. The evaluation framework uses the existing literature and expert opinions to build its structure while employing advanced multi-criteria decision-making methods, including IF-AHP. The main purpose of this evaluation process is to provide a systematic and consistent assessment of a port’s environmental performance.
Figure 1.
The process for evaluating the performance of an environmentally sustainable port.
The first step requires building an evaluation framework by identifying relevant factors and sub-factors that support environmentally sustainable port performance. The first step draws from a broad review of existing literature and expert knowledge in the field. The AHP method was used after framework creation to conduct an initial assessment and consistency verification through online software. The consistency ratio (CR) calculation verified the reliability of the hierarchical structure and pairwise comparison results. The framework requires adjustment by getting the respondents to clarify their input, when the CR value surpasses 0.1.
After validating the consistency ratio, the evaluation moves to the implementation of the Intuitionistic Fuzzy Analytical Hierarchy Process (IF-AHP). The evaluation scale selection process in this phase requires the implementation of intuitionistic fuzzy logic to represent the membership, non-membership, and hesitation degrees. The fuzzy matrix construction begins with criterion elements, followed by a consistency test to verify the required evaluation standards. The evaluation process requires iterative matrix corrections when the consistency measure exceeds 0.1 until the criteria are satisfied.
The Intuitionistic Fuzzy Weights are determined for each factor and subfactor after consistency is achieved. These weights represent the relative importance of each criterion within the framework, allowing for precise prioritization of environmental performance indicators. The relative weights are then used to establish a ranking of factors and sub-factors, which facilitates a comprehensive analysis of port environmental performance.
The implementation of the IF-AHP in this procedure offers several advantages over traditional AHP methods. AHP provides a structured decision-making framework; however, its requirement for precise numerical inputs restricts its use in complex scenarios with ambiguity and subjective judgments. The integration of fuzzy logic in IF-AHP enables better management of uncertain and imprecise information, while providing enhanced flexibility and robustness. Figure 1 illustrates the complete procedure, which shows how the IF-AHP advances sustainable port management through its flexible and effective approach.
3.3. Construction of the Index System for Performance Evaluation of Environmentally Sustainable Ports in Malaysia
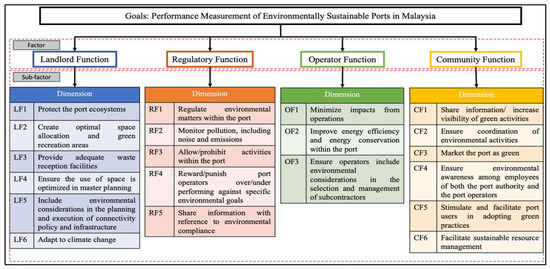
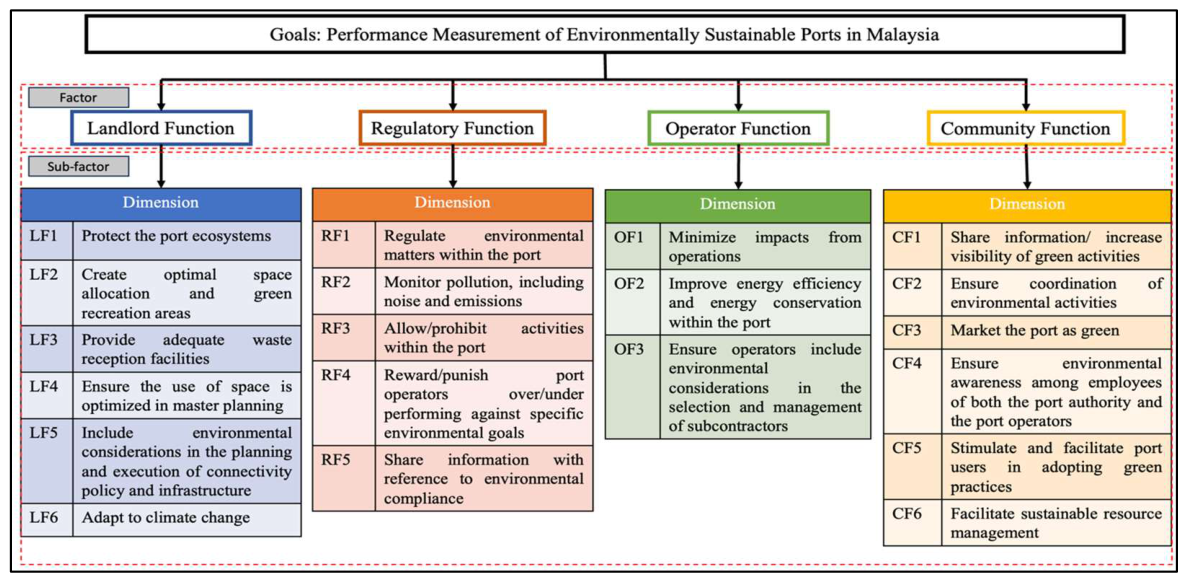
The evaluation index system for environmentally sustainable ports in Malaysia, as shown in Figure 2, is based on the four main functions of port authority proposed by [9]. These functions were adapted to the Malaysian context by mapping their respective dimensions and sub-factors against the existing Malaysian green port policies [28]. The landlord function is concerned with the management of port estates and sustainability through practices such as protecting ecosystems, optimizing space, and adapting to climate change. The regulatory function is concerned with environmental compliance, including monitoring pollution, enforcing policies, and incentivizing sustainable behaviors. The operator function is concerned with operational efficiencies and environmental impacts, such as improving energy efficiency, minimizing pollution, and ensuring that subcontractors meet sustainability standards. Finally, the community function involves stakeholders promoting green practices, sharing information, and fostering collaboration.
Figure 2.
Evaluation index system for the performance of environmentally sustainable ports in Malaysia.
The evaluation framework was validated by Malaysian port experts to maintain practicality and relevance. The experts used this process to match the theoretical concepts with actual policy implementations of hybrid cranes, solar energy projects, and waste management systems. The experts evaluated the usefulness of the sub-factors for solving local problems, including infrastructure constraints and congestion, while maintaining global sustainability standards. The final framework combines the theoretical foundations with practical elements to support a complete evaluation of port sustainability.
The framework enables Malaysian ports to measure their progress in sustainability while pinpointing specific areas that need improvement as it provides a complete structure that allows for the evaluation of environmental, operational, and community effects while maintaining international best-practice standards.
3.4. The IF-AHP for Performance Evaluation of the Environmentally Sustainable Ports in Malaysia
This study applies Intuitionistic Fuzzy (IF) theory to address uncertainty in decision-making processes, while the Analytic Hierarchy Process (AHP) is employed to compute the weights of criteria based on decision-maker evaluations. The methodology was structured into three stages.
Stage 1: Establishing a multi-objective hierarchical model.
Stage 2: Calculate the weights of the criteria using IF-AHP.
Stage 3: Analyze the results through comparison, group consensus, and sensitivity analysis.
The following steps were performed to determine the weighting of the factors associated with environmentally sustainable ports in Malaysia:
Step 1: Development of a performance evaluation index system. Figure 2 illustrates the proposed evaluation index system for environmentally sustainable ports.
Step 2: Data initially analysed using AHP Online Software (AHP-OS) developed by [29]. AHP-OS is a web-based tool to support rational decision making based on the Analytical Hierarchy Process (AHP). This method enables users to establish a hierarchy of criteria for decision-making, facilitating the calculation of priorities and the evaluation of various decision alternatives in relation to those criteria.
Step 3: Completion of a consistency check using AHP Online Software (AHP-OS). The consistency check identifies any inconsistencies in the expert evaluations. To improve consistency, the experts needed to adjust the original value by ±two points on the scale until the CR was below 10%.
Step 4: Development of intuitionistic fuzzy judgment matrix (IFJM). Let represent the total population of an intuitionistic fuzzy set. Here, denotes the degree of membership and indicates the degree of non-membership of element in fuzzy set A. It was established that . If , thus can be interpreted as the degree of hesitation of element towards [23].
The evaluation matrix for the intuitionistic fuzzy preference relationship regarding the development performance of an environmentally sustainable port is constructed by requiring decision-makers to conduct pairwise comparisons of indicators at the criterion level. These comparisons were based on the evaluation criteria presented in Table 1, which indicate the relative importance of the two indicators. This process results in a comprehensive IFJM by integrating the preference relationship matrix.
Table 1.
Linguistic variables for pairwise comparison [11].
In decision-making contexts, linguistic variables provide a structured approach to capturing subjective judgment about the relative importance of the criteria. Table 1 outlines the linguistic variables used in this study, mapped to Intuitionistic Fuzzy Numbers (IFNs) and Reciprocal Intuitionistic Fuzzy Numbers (RFINs).
The linguistic variables range from “Strongly More Important” (SMI) to “Equally Important” (EI), each associated with a triplet representing the IFNs. These triplets consist of three components: the degree of membership (), degree of non-membership (), and degree of hesitation (), where is derived as . For example, the linguistic variable “Strongly More Important (SMI)” is represented by IFN (0.90, 0.10, 0.00), indicating a high degree of confidence in its importance (), a minimal degree of non-membership (), and no hesitation () in the assessment. On the other hand, “Equally Important (EI)” is characterized by the IFN (0.50, 0.30, 0.20), reflecting moderate membership and non-membership values, as well as some level of hesitation.
The reciprocal relationship of fuzzy numbers is represented by Reciprocal Intuitionistic Fuzzy Numbers (RIFNs), which preserve consistency in pairwise comparisons. The reciprocal value of “Strongly More Important (SMI)” (0.90, 0.10, 0.00) in IFNs appears as (0.10, 0.90, 0.00) in RIFNs to show the opposite relationship between the two criteria being evaluated. The “Equally Important (EI)” value maintains its consistency between IFNs and RIFNs with (0.50, 0.30, 0.20) representation.
Linguistic variables, together with their numerical representations, create a powerful framework for decision-making because they allow human judgment while handling uncertainty and hesitation. The conversion of qualitative assessments into IFNs and RIFNs enables systematic and mathematically rigorous applications across multiple methodologies, including multi-criteria decision analysis (MCDA). The organized method improves the reliability and transparency of the evaluation process, which makes it an essential tool for situations requiring pairwise comparisons.
In this study, K decision-makers were invited as experts to assess the evaluation criteria concerning the relative importance of the two indexes through pairwise comparisons. The evaluation information of K decision makers is represented as IFJM , obtained via a preference relation matrix integration method. The degree of membership reflects the significance of the index in relation to the index, whereas the degree of non-membership denotes the significance of the index in comparison to the index. The degree of hesitation is defined as .
Let denote the IFJM supplied by the decision-maker for the assessed object, where represents the weight allocated to the decision-maker, and signifies the total number of decision-makers. Let , where the integration is classified as an intuitionistic fuzzy matrix. Among these,
Step 5: Transformation and evaluation of criteria based on decision-makers’ assessments using Intuitionistic Fuzzy Numbers (IFNs). The data from Step 2 are transformed into linguistic variables, as shown in Table 1. A pairwise comparison of each factor and subfactor was performed, and the results were presented in a preference matrix.
Step 6: Transform linguistic expressions in decision matrices into Intuitionistic Fuzzy (IF) values. These values were referenced to the scale defined in Table 2.
Table 2.
Basic Profile of Experts.
Step 7: Verify the consistency of IFJM. This study employs the intuitionistic fuzzy information established by [30] to measure distance, in contrast to Saaty’s [5] method for calculating the consistency ratio (CR) in AHP. The distance Formula (2) for assessing the consistency of the IFJM is derived accordingly.
where IFJM represents the outcome of evaluating the two indices within each layer based on their relative significance. IFJM is adjusted based on IFJM through the application of formulas (i)–(iii):
- (i)
- When let = , where
- (ii)
- When let =
- (iii)
- When let =
If , the IFJM passed the consistency test; otherwise, it did not pass the test.
Step 8: Modify the IFJM to satisfy the consistency requirements. If fails the consistency test, the iteration parameters σ must be introduced to modify by varying the values, where If then equals ; if , then equals , and the iteration experiment commences with an initial step size of −0.01. Adjusting the parameters yields the IFJM . The conversion equation is as follows:
Then Equation (7) is used to calculate the distance and repeated until
Step 9: The weights of the single-level indicators are calculated. Weights are determined for each index by employing an intuitionistic fuzzy judgement matrix that successfully passes the consistency test. Following the methodology of [31], the weights for each index pertaining to both the main factor and subfactors were calculated as follows:
Step 10: The total weights of the indicators are determined. The weight of each index layer in Figure 2, along with the corresponding indicator weights of the criterion layer, is aggregated to derive the comprehensive weights of a single evaluation indicator, as outlined in Equation (10), based on the intuitionistic fuzzy number proposed by [32] in Equation (9).
Step 11: Normalize the weights of indicators. The weight of each index derived from Step 10 remains an intuitionistic fuzzy number. The weights were calculated using Equation (11), as outlined by [33]. The weight of each index was subsequently normalized using Equation (12), resulting in the normalized weight of the indicator.
Step 12: Calculate the global weights and rankings. The global weight of each subfactor is calculated by multiplying the local weight of the subfactor by the local weight of its corresponding main factor. The global weight provides an aggregated measure of the subfactor’s importance across the entire framework, reflecting both its significance within its immediate context (the main factor) and the overall context (the entire decision-making framework).
4. Results
4.1. Performance Evaluation Process of the Environmentally Sustainable Port
Step 1: The proposed framework is based on [9], incorporating four primary factors derived from port authority functions: landlord, regulatory, operator, and community functions. Each of these port authority functions is subdivided into dimensions assigned as subfactors. Consequently, there are six subfactors under the landlord function, five under the regulatory function, three under the operator function, and six under the community function. The resulting MCDM model is illustrated in Figure 2.
Step 2: K decision makers were invited to answer the questionnaire but only three respondents who fit the criteria as experts answered the questionnaire in form of AHP analysis (pairwise structure) using Goepel’s [29] online software. These experts, who hold senior positions at important ports in Malaysia, play active roles in advancing environmentally sustainable practices in port management. They contribute innovative solutions aimed at enhancing sustainability at the port, thereby benefiting both their organization and the industry’s environmental initiatives. According to the literature, three (3) experts are sufficient to implement the IF-AHP technique [34]. Table 2 presents the basic profiles of the experts.
Step 3: The online software is programmed to automatically compute the Consistency Ratio (CR). Pairwise comparisons may produce inconsistent results (CR > 0.10) in certain scenarios. In cases where the consistency ratio (CR) exceeded the threshold of 0.10, the experts were re-engaged to review and clarify their pairwise comparison inputs. The final overall CR values for each factor and sub-factor are listed in Table 3. Note that all the CR values are lower than 0.1 and indicate consistent evaluations by the experts.
Table 3.
The consistency ratio (CR) values for all factors.
Step 4: Design and select the evaluation scale for the Intuitionistic Fuzzy Analytic Hierarchy Process (IF-AHP). The evaluation scale employed by [30] was applied for pairwise comparisons, as presented in Table 2. The foundation for developing an intuitionistic fuzzy judgment matrix involves evaluating the assessments of experts regarding environmentally sustainable ports in Malaysia. In the assessment of the relative significance of the two indexes, the experts are tasked with comparing the criteria-level indicators through pairwise comparisons. The intuitionistic fuzzy judgment matrix (IFJM) is derived from the evaluation information provided by K decision-makers using a preference relation matrix integration method. The degree of membership signifies the importance of the index in relation to the index. The degree of non-membership signifies the relevance of the index in relation to the index, whereas the degree of hesitation is defined as .
Step 5: Obtain and evaluate the criteria based on DMs assessments in the form of intuitionistic fuzzy numbers (IFNs). The results answered by experts in Step 2 for AHP-OS were transformed into Linguistic Variables, as shown in Table 1. Table 4 shows the pairwise comparisons against the criteria. Each of the factors and subfactors were compared against each other (pairwise), and the results were presented in the preference matrix. In Table 5, for example, from Decision Maker 1 (DM1), when the Landlord Function is compared to the Operator Function, the linguistic variables are Slightly Important (SI), which means that the Landlord Function is slightly important compared to the Operator Function. When the Landlord Function is compared with the Community Function, the linguistic variables are very important (VI), which means that Landlord Function is very important compared to community function.
Table 4.
Pairwise Comparison Matrix for Main Factors.
Table 5.
Pairwise comparison matrices with intuitionistic fuzzy values for main factors.
Step 6: The linguistic expressions within the decision matrices are transformed into IF values, according to the scale outlined in Table 1. Table 5 presents the converted values for the IF decision matrices listed in Table 4. In IF-AHP, when two criteria are compared, there is a reciprocal relationship between them. For example, linguistic expressions in Table 4 for Decision Maker 1, comparing the Landlord Function and Operator Function, are “Slightly Important” (SI). This expression is converted into IF values as (0.60, 0.25, 0.15) and the reciprocal for the Operator Function compared with the Landlord Function is (0.25, 0.60, 0.15).
Step 7: Perform a consistency test on expert evaluation opinions. The intuitionistic fuzzy data in IFJM for this study were derived from Step 6. This study established five (5) IFJM based on the established index system for environmentally sustainable ports within the context of port authority functions. Step 7 involves the verification and revision of the IFJM’s consistency. The modified IFJM for the first-level indicator is computed using formulas (i)–(iii), and is presented in Table 6. Taking the calculation of as an example and as the main factors, as shown in Table 6, the calculation can be expressed as follows:
Table 6.
Intuitionistic fuzzy consistency test matrix of first-level indicators.
Using Equation (1), the distance between and is calculated as = 0.1575 > 0.1, indicating that consistency is not acceptable.
For the IFJM with respect to the landlord function, the consistency was calculated as = 0.1782 > 0.1, indicating that the consistency was not acceptable. For the IFJM with respect to regulatory function, the consistency was calculated as = 0.1448 > 0.1, indicating that the consistency was not acceptable. At the same time, for the IFJM with respect to the operator function, the consistency was calculated as = 0.1434 > 0.1, indicating that the consistency was not acceptable. Similarly, for the IFJM with respect to community function, consistency was calculated as = 0.1572 > 0.1, indicating that the consistency was not acceptable.
Step 8: Adjust the IFJM to satisfy the consistency requirements. According to step 7, not all IFJM do not pass the consistency test; thus, the adjusted IFJM is calculated using Equations (5) and (6), as shown in Table 7. Taking the calculation of as an example and as the main factors, as shown in Table 7, when the calculation can be expressed as follows:
Table 7.
Adjusted intuitionistic fuzzy consistency test matrix of first-level indicators.
The distance between and was determined using Equation (7). The consistency was quantified as 0.0991, which is below the threshold of 0.1, indicating that the modified IFJM effectively met the consistency criteria.
For the adjusted intuitionistic fuzzy consistency test matrix pertaining to the Landlord function, at , the consistency was calculated as 0.0988, which was less than 0.1, indicating that the modified IFJM had successfully passed the consistency test. The adjusted intuitionistic fuzzy consistency test matrix corresponding to the regulatory function, at the was calculated as 0.0995, which was less than 0.1, also indicating that the modified IFJM successfully passed the consistency test.
At the adjusted intuitionistic fuzzy consistency test matrix corresponds to the operator function, which was calculated as 0.0992, which was less than 0.1, indicating that the modified IFJM successfully passed the consistency test. And lastly, the adjusted intuitionistic fuzzy consistency test matrix pertaining to the community function was calculated at resulted in 0.0989, which was less than 0.1, indicating that the modified IFJM passed the consistency test.
Step 9: The weight of each index is calculated using the intuitionistic fuzzy judgement matrix that has passed the consistency test.
Following the calculations in Step 8, all intuitionistic fuzzy judgment matrices demonstrate consistency in the test. To ascertain the index weight of each level, the weights of the four main port authority functions can be computed using Equation (8) along with the intuitionistic fuzzy consistency matrix presented in Table 8. The weights of the four primary functions are represented as for the Landlord Function, for the regulatory function, , and for the Operator and Community functions, respectively. Table 8 presents the index weights for each level.
Table 8.
The weight of the indicators.
Step 10: The comprehensive weights of the indicators are calculated in Table 9. Taking the calculation of as an example for Landlord function 1, the calculation can be expressed as
Table 9.
Aggregated index weights of each indicator.
Step 11: Normalize the weights of indicators. The normalized index weight assigned to each factor and sub-factor represents the local weighting of that particular factor and sub-factors within the hierarchical structure of the decision-making process. This local weighting is crucial, as it reflects the relative importance of each indicator in relation to others at the same level of the hierarchy. The sum of the local weights within each level equals one, thereby providing a consistent and comparable measure of the significance of each indicator in contributing to the overall decision outcome.
Step 12: Calculate the global weights and rankings. To illustrate the calculation of the global weights, as shown in Table 10, consider the Landlord function (LF) with a local weight of 0.298. The sub-factor Landlord function 1 (LF1) in this category had a local weight of 0.214. Therefore, the global weight for (LF1) is therefore calculated to be 0.064. This indicates that (LF1) contributed 0.064 to the overall decision-making process when considering its position within the entire framework.
Table 10.
Weightages of each sub-factor (Local and Global Weights).
This method was systematically applied to all the sub-factors for each main factor. By calculating the global weightage, decision makers can obtain a clear understanding of the relative importance of each sub-factor within the broader context of the decision. This global weighting system not only ensures consistency across different levels of the framework, but also provides a comprehensive basis for making well-informed decisions that consider all relevant factors and sub-factors.
The sub-factors have been ranked based on their calculated global weights, which reflect their overall importance in the hierarchical structure of IF-AHP. From Table 11, OF1 has the highest global weight of 0.105, making it the most significant sub-factor in the overall hierarchy. This is followed by OF2 with the global weight of 0.091, and FR1 with a weight of 0.073, indicating their substantial influence in the decision-making process.
Table 11.
Group Result Percentage for Port Authority Function.
Sub-factors with lower global weights, such as those under Community function, like CF1 (0.032), CF2 (0.030), and others with weights of 0.025 and 0.022, are ranked lower, indicating that the sub-factors have less influence on the overall decision outcome of environmentally sustainable ports. The ranking effectively prioritizes the sub-factors, guiding decision-makers in focusing on the most impactful criteria within the hierarchical structure.
This ranking is crucial as it helps identify which sub-factors contribute most to achieving environmentally sustainable ports in Malaysia, thereby enabling a more targeted and efficient decision-making process. The ranked list allows stakeholders to allocate resources and attention according to the relative importance of each sub-factor, ensuring that the most critical aspects of the decision are addressed adequately.
The calculation of global weightage for sub-factors reveals that minimizing impacts from operations (OF1) and improving energy efficiency and energy conservation within the port (OF2) have the highest global weights, despite the Operator function being ranked the third among the main factors, below the Landlord and Regulatory functions. This outcome is primarily attributed to the significantly high local weights assigned to OF1, which is 0.395 and OF2, which is 0.344, within the Operator function. Although Operator function is comparatively lower overall weight (0.265) compared to Landlord function and the Regulatory function, these sub-factors OF1 and OF2 gain prominence due to their dominant local weight, which, when multiplied by the weight of the Operator function, result in higher global weights than any if the sub-factors.
Conversely, while the Landlord function and Regulatory function possess higher factor weights, which are 0.298 and 0.281, respectively, the local weights of their sub-factors are more evenly distributed and relatively lower. This distribution indicates that the importance within these functions is spread across multiple sub-factors, thereby diluting the global impact of each individual sub-factor. This outcome highlights how the distribution of local weights among sub-factors significantly influences global weightage, making it possible for sub-factors in a lower-ranked main factor to dominate in terms of global weight.
4.2. Group Consensus Analysis
The Analytical Hierarchy Process (AHP) employs a consensus indicator to measure the degree of agreement among participants regarding their priorities. This indicator spans from 0% to 100%, where 0% signifies no consensus and 100% denotes full consensus. The consensus metric is derived using Shannon entropy, partitioned into alpha and beta components as per Goepel’s methodology [35]. Shannon entropy measures diversity, enabling the assessment of homogeneity (alpha diversity) and dissimilarity (beta diversity) within groups.
For categorizing group consensus, the following classifications can be applied based on the percentage values:
- Very low consensus: Below 50% (indicating disagreement);
- Low consensus: 50% to 67.5%;
- Moderate consensus: 67.5% to 75%;
- High consensus: 75% to 87.5%;
- Very high consensus: Above 87.5% (indicating excellent agreement).
Values under 50% indicate a lack of consensus among the group, demonstrating significant diversity in judgments. Values at or above 87.5% reflect a substantial alignment in priorities, indicating strong consensus among group members. The consensus indicator is calculated as follow:
where:
- exp ( (Gamma diversity)
- exp ( (Alpha diversity)
- adjusts for the minimum entropy in AHP
- and are Shannon entropy values for individual and group distributions, respectively.
Here, and are computed as follows:
where is the priority weight for criterion by decision-maker and is the average priority weight for across all decision-makers.
The result from online software shows that the is 82.8%, categorized as high consensus for Port Authority Function. This reflects a strong level of agreement among the experts in the analysis. The group consensus of sub-criteria can also be conducted by similar method.
Table 11 shows the aggregated group results derived from pairwise comparison by the experts. The result is obtained by combining the individual priorities of experts, which are derived from pairwise comparisons of each factor against others. The aggregated group result places the highest priority on the Landlord Function (37.0%) followed by the Regulatory Function (29.7%) and the Operator Function (27.3%). The Community Function (6.1%) was deemed the least critical. The prioritization of the Landlord Function highlights the importance of sustainable infrastructure management in achieving environmentally sustainable ports. Activities such as ecological preservation, climate adaptation, and waste management directly align with reducing the environmental impact of ports. The emphasis on the Regulatory Function underscores the necessity of compliance and enforcement to ensure sustainable practices, while the Operator Function reflects the operational adjustments required for energy efficiency and pollution reduction. The lower prioritization of the Community Function suggests that stakeholder engagement is seen as a supportive role rather than a core driver of sustainability. However, fostering environmental awareness and encouraging green practices among stakeholders remain critical for long-term sustainability efforts.
Individual decision-makers displayed distinct emphases in their evaluations. Decision-maker 1 (DM1) assigned the highest priority to the Regulatory Function (53.0%), reflecting a strong emphasis on oversight and compliance. In contrast, the Landlord Function received moderate weight (28.1%), while the Operator Function (13.6%) and Community Function (5.3%) were considered less significant. Decision-maker 2 (DM2) prioritized the Landlord Function (46.6%), highlighting its importance for infrastructure management. The Operator Function (25.5%) and Regulatory Function (22.2%) received relatively balanced weights, with the Community Function (5.7%) being minimally weighted. Decision-maker 3 (DM3), however, prioritized the Operator Function (44.5%), indicating a focus on operational efficiency. This was followed by the Landlord Function (31.6%), with the Regulatory Function (17.9%) and Community Function (5.9%) receiving lower emphasis. These variations among individual decision-makers reflect the diverse perspectives shaped by their professional roles and priorities. Nevertheless, the aggregated results, characterized by a high consensus value, illustrate that the group outcome effectively synthesizes these differences into a cohesive decision.
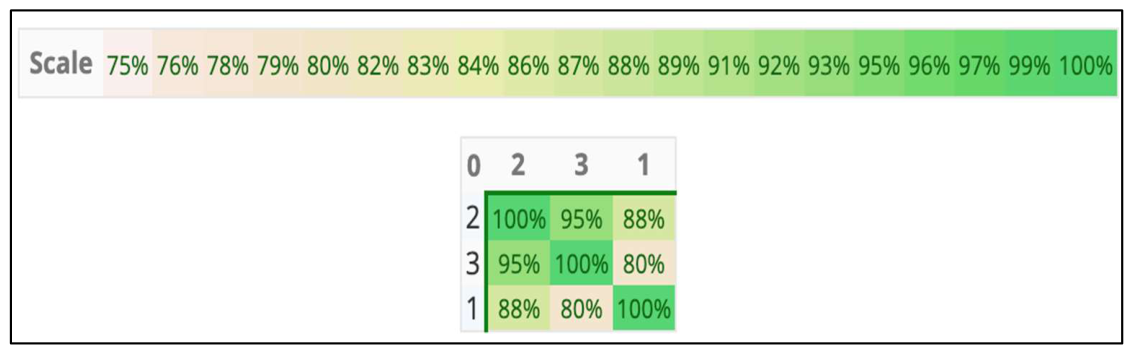
To further understand the alignment among decision-makers, pairwise similarity scores were computed and presented in a similarity matrix as shown in Figure 3. To compute the similarity metrics between decision-makers, the relative homogeneity formula is used, specifically for pairwise combinations. The similarity formula for two decision-makers is derived as follows:
where:
- exp ( (Gamma diversity)
- exp ( (Alpha diversity)
- Average Shannon entropy of individual distributions
- Shannon entropy of the group result
Figure 3 illustrates the similarity matrix, which shows the alignment of individual judgments. The similarity scores ranged from 80% to 95%, demonstrating strong consensus among the groups, with minor variations due to differences in individual perspectives. For instance, in Table 3, DM1 (indicated by 1) and DM2 (indicated by 2) exhibited an 88% similarity, while DM2 and DM3 (indicated by 3) showed the highest similarity of 95%. These differences suggest that while there is a general agreement on priorities, individual perspectives may vary slightly, possibly due to differences in personal or professional experiences.
Figure 3.
Similarity matrix for Port Authority Function.
4.3. Managerial Implication
This study applied the Intuitionistic Fuzzy Analytical Hierarchy Process (IF-AHP) as a methodological framework to measure the performance of ports in terms of environmental sustainability. Based on the results, notable variation in how different decision makers (DMs) prioritize the four core functions: Landlord, Regulatory, Operator, and Community. Overall, the Landlord function is the most emphasized, with a group average of 37.0%. This suggests a collective focus on asset ownership, infrastructure management, and lease arrangements. DM2, in particular, assigns the greatest importance to this function (46.6%), highlighting a strategic orientation toward long-term asset control and financial sustainability. In contrast, DM1 places the highest emphasis on the Regulatory function (53.0%), significantly above the group average of 29.7%. This suggests a strong focus on governance, compliance, and oversight within DM1’s decision-making framework. However, DM2 and DM3 attribute less importance to Regulatory aspects (22.2% and 17.9%, respectively), signaling differing perspectives that could lead to conflicting priorities if not carefully managed.
The Operator function shows considerable variation as well. While the group average is 27.3%, DM3 stands out with a substantial 44.5%, indicating a strong preference for operational efficiency, service delivery, and day-to-day management. This contrasts sharply with DM1’s lower emphasis (13.6%), suggesting that DM3 may be more inclined toward practical execution and internal process optimization. The Community function, by comparison, is consistently the lowest priority across the board, with the group average at just 6.1% and each DM allocating less than 6% individually. This uniform de-prioritization points to a potential oversight in stakeholder engagement or social responsibility, which could be an area for future strategic development.
These variations in functional priorities imply that managerial coordination is crucial. Differences in emphasis, particularly between Regulatory and Operator functions, may require structured dialogue and alignment efforts to ensure cohesive decision-making. Additionally, while the Landlord function appears to be a unifying strategic focus, the low prioritization of the Community function suggests a gap that may warrant further exploration, especially in contexts where public perception and community relations are increasingly important. Ultimately, the data underscores the need for integrated planning that respects the diverse perspectives of decision makers while identifying shared goals and underrepresented areas of strategic value [36].
5. Conclusions and Recommendations
This study applied the Intuitionistic Fuzzy Analytical Hierarchy Process (IF-AHP) as a methodological framework to evaluate environmentally sustainable port performance in Malaysia. The results highlight the methodological advantages of the proposed framework in addressing complex decision-making problems under uncertainty. Unlike conventional evaluation models, IF-AHP incorporates elements of ambiguity, hesitation, and expert perception into the decision-making process. This capability allows decision makers to better capture the uncertainty inherent in sustainability assessments, particularly when balancing environmental protection with operational efficiency in port management.
The study also contributes theoretically by proposing an integrated evaluation framework that combines landlord, regulatory, operator, and community-related functions of port authorities within a unified sustainability assessment structure. By integrating these operational dimensions, the model addresses the fragmented treatment often observed in earlier port sustainability studies and provides a more comprehensive representation of how institutional roles influence environmental outcomes. The findings identify operational impact reduction and improvements in energy efficiency as key drivers of environmentally sustainable port performance. In contrast, community-related initiatives received comparatively lower global weights, suggesting that while these initiatives remain relevant, their direct influence on environmental performance indicators within the evaluated framework is comparatively limited. This differentiation provides clearer guidance for strategic planning and resource allocation by highlighting areas with the strongest operational impact [36,37].
From a broader theoretical perspective, the findings support existing arguments in sustainable supply chain research that emphasize the interdependence between internal management practices and external sustainability collaboration. As ports function as critical nodes in global logistics networks, embedding sustainability principles within port governance and operations can strengthen supply chain resilience, improve resource efficiency, and contribute to long-term environmental objectives. The study, therefore, extends current discussions in sustainable supply chain management by illustrating how institutional roles within port authorities can shape sustainability performance outcomes.
Despite these contributions, several boundary conditions and methodological limitations should be acknowledged. First, the IF-AHP approach relies on expert-driven judgments to derive priority weights. Although the selected experts possess extensive industry experience, the approach may still be subject to subjective bias, as the results depend on individual perceptions and interpretations of sustainability priorities. Second, the number of available experts in highly specialized domains such as port sustainability management is inherently limited, which constrains the diversity of perspectives that can be incorporated into the weighting process. While aggregation techniques within IF-AHP help mitigate individual variability, the findings should be interpreted as reflecting informed expert perspectives rather than statistically generalizable results.
Furthermore, the applicability of the framework may be context-dependent. Institutional arrangements, governance structures, and regulatory environments differ across countries, which may influence how landlord, regulatory, and operator functions contribute to sustainability outcomes. Therefore, caution should be exercised when generalizing the findings beyond the Malaysian port system. Future research may extend this work by combining IF-AHP with other analytical techniques, such as empirical performance data analysis or multi-method decision frameworks, to reduce reliance on subjective judgments and strengthen the robustness of sustainability assessments. Expanding the pool of experts or incorporating perspectives from additional stakeholders, such as logistics providers, policymakers, and community representatives, may also enhance the comprehensiveness of future evaluations [38,39].
Author Contributions
Conceptualization, M.S.S.B. and N.Y.; Methodology, M.S.S.B. and S.S.R.S.; Software, M.S.S.B.; Validation, S.S.R.S., C.W.L. and N.F.T.; Formal analysis, M.S.S.B.; Investigation, M.S.S.B.; Resources, S.S.R.S., N.Y. and N.F.T.; Data curation, N.Y.; Writing—original draft, M.S.S.B.; Writing—review & editing, S.S.R.S., N.Y., C.W.L. and N.F.T.; Visualization, M.S.S.B., C.W.L. and N.F.T.; Supervision, S.S.R.S. and N.Y.; Project administration, S.S.R.S. and C.W.L.; Funding acquisition, S.S.R.S., C.W.L. and N.F.T. All authors have read and agreed to the published version of the manuscript.
Funding
This research received no external funding.
Institutional Review Board Statement
The study was conducted in accordance with UiTM Research Ethics Committee, and the protocol was approved by the Ethics Committee of REC/02/2024 (PG/MR/87) on 28 February 2024.
Informed Consent Statement
Informed consent was obtained from all subjects involved in the study.
Data Availability Statement
The original contributions presented in this study are included in the article. Further inquiries can be directed to the corresponding authors.
Acknowledgments
We would like to express our appreciation to Universiti Teknologi MARA for supporting this research and to the experts who helped and participated in the survey.
Conflicts of Interest
Nazry Yahya was employed by SHH Resources Holdings Berhad. The remaining authors declare that the research was conducted in the absence of any commercial or financial relationships that could be construed as a potential conflict of interest.
References
- Rodrigues, K.T.; Ensslin, S.R. Environmental performance evaluation in ports: A literature review and future research guidelines. Marit. Econ. Logist. 2024, 26, 241–260. [Google Scholar] [CrossRef] [Scilit]
- Lim, S.; Pettit, S.; Abouarghoub, W.; Beresford, A. Port sustainability and performance: A systematic literature review. Transp. Res. Part D Transp. Environ. 2019, 72, 47–64. [Google Scholar] [CrossRef] [Scilit]
- Konstantinos, K.; Nikas, A.; Daniil, V.; Kanellou, E.; Doukas, H. A multi-criteria decision support framework for assessing seaport sustainability planning: The case of Piraeus. Marit. Policy Manag. 2023, 50, 1030–1056. [Google Scholar] [CrossRef] [Scilit]
- Karnauskaitė, D.; Schernewski, G.; Støttrup, J.G.; Kataržytė, M. Indicator-based sustainability assessment tool to support coastal and marine management. Sustainability 2019, 11, 3175. [Google Scholar] [CrossRef] [Scilit]
- Saaty, T.L. Decision making with the analytic hierarchy process. Int. J. Serv. Sci. 2008, 1, 83–98. [Google Scholar] [CrossRef] [Scilit]
- Lirn, T.C.; Jim Wu, Y.C.; Chen, Y.J. Green performance criteria for sustainable ports in Asia. Int. J. Phys. Distrib. Logist. Manag. 2013, 43, 427–451. [Google Scholar] [CrossRef] [Scilit]
- Min, H.; Ahn, S.B.; Lee, H.S.; Park, H. An integrated terminal operating system for enhancing the efficiency of seaport terminal operators. Marit. Econ. Logist. 2017, 19, 428–450. [Google Scholar] [CrossRef] [Scilit]
- Gonzalez, M.; Quesada, G. Port productivity: Benchmarking analysis of strategic ports. Int. J. Product. Perform. Manag. 2024, 73, 456–475. [Google Scholar] [CrossRef] [Scilit]
- Acciaro, M.; Vanelslander, T.; Sys, C.; Ferrari, C.; Roumboutsos, A.; Giuliano, G.; Lam, J.S.L.; Kapros, S. Environmental sustainability in seaports: A framework for successful innovation. Marit. Policy Manag. 2014, 41, 480–500. [Google Scholar] [CrossRef] [Scilit]
- Chen, Z.; Pak, M. A Delphi analysis on green performance evaluation indices for ports in China. Marit. Policy Manag. 2017, 44, 537–550. [Google Scholar] [CrossRef] [Scilit]
- Sadiq, R.; Tesfamariam, S. Environmental decision-making under uncertainty using intuitionistic fuzzy analytic hierarchy process (IF-AHP). Stoch. Environ. Res. Risk Assess. 2009, 23, 75–91. [Google Scholar] [CrossRef] [Scilit]
- Xu, G.; Dadi, Z. Study on Evaluation System of Green Port Development. In E3S Web of Conferences; EDP Sciences: Les Ulis, France, 2020; Volume 194, p. 05012. [Google Scholar]
- Salleh, N.H.M.; Abd Rasidi, N.A.S.; Jeevan, J. Lean, agile, resilience and green (LARG) paradigm in supply chain operations: A trial in a seaport system. Aust. J. Marit. Ocean Aff. 2020, 12, 200–216. [Google Scholar] [CrossRef] [Scilit]
- Bahri, M.S.S.; Shariff, S.S.R.; Zolkefley, N.S.I.; Yahya, N. A tri-level AHP approach for port logistics personnel performance evaluation. In International Conference on Industrial Engineering and Operations Management; IEOM Society International: Southfield, MI, USA, 2021; pp. 2209–2220. [Google Scholar]
- Tseng, P.H.; Yip, T.L. An evaluation model of cruise ports using fuzzy analytic hierarchy process. Marit. Bus. Rev. 2021, 6, 22–48. [Google Scholar]
- Rodríguez, R.M.; Martínez-López, L.; Herrera, F. Hesitant Fuzzy Linguistic Term Sets for Decision Making. IEEE Trans. Fuzzy Syst. 2012, 20, 109–119. [Google Scholar] [CrossRef] [Scilit]
- Abdullah, L.; Najib, L. A new preference scale MCDM method based on interval-valued intuitionistic fuzzy sets and the analytic hierarchy process. Soft Comput. 2016, 20, 511–523. [Google Scholar]
- Prajapati, D.; Daultani, Y.; Cheikhrouhou, N.; Pratap, S. Identification and ranking of key factors impacting efficiency of Indian shipping logistics sector. Opsearch 2020, 57, 765–786. [Google Scholar] [CrossRef] [Scilit]
- Stanković, J.J.; Marjanović, I.; Papathanasiou, J.; Drezgić, S. Social, economic and environmental sustainability of port regions: MCDM approach in composite index creation. J. Mar. Sci. Eng. 2021, 9, 74. [Google Scholar] [CrossRef] [Scilit]
- Di Vaio, A.; Varriale, L.; Alvino, F. Key performance indicators for developing environmentally sustainable and energy efficient ports: Evidence from Italy. Energy Policy 2018, 122, 229–240. [Google Scholar] [CrossRef] [Scilit]
- Azizan, S.N.; Zulfakar, M.H.; Shariff, S.S.R.; Bahri, M.S.S. Towards a regional hub: Evaluating port competitiveness in BIMP-EAGA. Aust. J. Marit. Ocean Aff. 2025, 1–15. [Google Scholar] [CrossRef] [Scilit]
- Teerawattana, R.; Yang, Y.C. Environmental performance indicators for green port policy evaluation: Case study of Laem Chabang port. Asian J. Shipp. Logist. 2019, 35, 63–69. [Google Scholar] [CrossRef] [Scilit]
- Schipper, C.A.; Vreugdenhil, H.; De Jong, M.P.C. A sustainability assessment of ports and port-city plans: Comparing ambitions with achievements. Transp. Res. Part D Transp. Environ. 2017, 57, 84–111. [Google Scholar] [CrossRef] [Scilit]
- Karasan, A. A novel hesitant intuitionistic fuzzy linguistic AHP method and its application to prioritization of investment alternatives. Int. J. Anal. Hierarchy Process 2019, 11, 127–142. [Google Scholar] [CrossRef] [Scilit]
- Gumus, S.; Kucukvar, M.; Tatari, O. Intuitionistic fuzzy multi-criteria decision making framework based on life cycle environmental, economic and social impacts: The case of U.S. wind energy. Sustain. Prod. Consum. 2016, 8, 78–92. [Google Scholar] [CrossRef] [Scilit]
- Zhang, Z.; Yang, J.; Ye, Y.; Wang, M. Intuitionistic Fuzzy Sets with Double Parameters and Its Application to Multiple Attribute Decision Making of Urban Planning. Procedia Eng. 2011, 21, 496–502. [Google Scholar] [CrossRef] [Scilit]
- Ilbahar, E.; Kahraman, C.; Çebi, S. Risk assessment of renewable energy investments: A modified failure mode and effect analysis based on prospect theory and intuitionistic fuzzy AHP. Energy 2022, 239, 121907. [Google Scholar] [CrossRef] [Scilit]
- Bahri, M.S.S.; Shariff, S.S.R.; Yahya, N. Sustainable port operations and environmental initiatives in Malaysia: A focus on environmental sustainability. Asian J. Shipp. Logist. 2025, 41, 38–51. [Google Scholar] [CrossRef] [Scilit]
- Goepel, K.D. Implementation of an online software tool for the analytic hierarchy process (AHP-OS). Int. J. Anal. Hierarchy Process 2018, 10. 3, 469–487. [Google Scholar] [CrossRef] [Scilit]
- Xu, J.; Yu, L.; Gupta, R. Evaluating the performance of the government venture capital guiding fund using the intuitionistic fuzzy analytic hierarchy process. Sustainability 2020, 12, 6908. [Google Scholar] [CrossRef] [Scilit]
- Kacprzyk, J.; Szmidt, E. Intuitionistic fuzzy relations and measures of consensus. In Technologies for Constructing Intelligent Systems 2: Tools; Physica-Verlag HD: Heidelberg, Germany, 2002; pp. 261–274. [Google Scholar]
- Xu, Z.; Liao, H. Intuitionistic fuzzy analytic hierarchy process. IEEE Trans. Fuzzy Syst. 2013, 22, 749–761. [Google Scholar] [CrossRef] [Scilit]
- Xu, Z. Intuitionistic preference relations and their application in group decision making. Inf. Sci. 2007, 177, 2363–2379. [Google Scholar] [CrossRef] [Scilit]
- Karacan, I.; Senvar, O.; Arslan, O.; Ekmekçi, Y.; Bulkan, S. A novel approach integrating intuitionistic fuzzy analytical hierarchy process and goal programming for chickpea cultivar selection under stress conditions. Processes 2020, 8, 1288. [Google Scholar] [CrossRef] [Scilit]
- Goepel, K.D. Group Consensus Cluster Analysis Using Shannon Alpha and Beta Entropy. 2022. Available online: https://bpmsg.com/wordpress/wp-content/uploads/2022/04/Goepel-Consensus-preprint.pdf (accessed on 19 October 2024).
- Lee, C.W.; Kwak, N.K. Strategic enterprise resource planning in a health-care system using a multicriteria decision-making model. J. Med. Syst. 2011, 35, 265–275. [Google Scholar] [CrossRef] [Scilit] [PubMed]
- Liu, Y.; Eckert, C.; Earl, C. A review of fuzzy AHP methods for decision-making with subjective judgements. Expert Syst. Appl. 2020, 161, 113738. [Google Scholar] [CrossRef] [Scilit]
- Lu, C.S.; Shang, K.C.; Lin, C.C. Examining sustainability performance at ports: Port managers’ perspectives on developing sustainable supply chains. Marit. Policy Manag. 2016, 43, 909–927. [Google Scholar] [CrossRef] [Scilit]
- Hussein, K.; Song, D.W. Port supply chain integration and sustainability: A resource-based view. Int. J. Logist. Manag. 2024, 35, 504–530. [Google Scholar] [CrossRef] [Scilit]

Disclaimer/Publisher’s Note: The statements, opinions and data contained in all publications are solely those of the individual author(s) and contributor(s) and not of MDPI and/or the editor(s). MDPI and/or the editor(s) disclaim responsibility for any injury to people or property resulting from any ideas, methods, instructions or products referred to in the content. |
© 2026 by the authors. Licensee MDPI, Basel, Switzerland. This article is an open access article distributed under the terms and conditions of the Creative Commons Attribution (CC BY) license.