


Abstract
Background: To address the critical challenges of hazardous material (HAZMAT) incidents in dense urban areas, this study develops a hybrid framework for spatial emergency response optimization tailored for Intelligent Transport Systems (ITSs). Methods: Our approach integrates the Fuzzy Analytic Hierarchy Process (FAHP) with a rigorous technical benchmarking of multiple navigation APIs to improve routing decisions under volatile Bangkok traffic. By employing a normalized cost function (scale 0–1), we evaluated the performance of localized (Longdo Map) versus global (Google Maps and OpenStreetMap) platforms across day and night scenarios. Results: Experimental results, yielding normalized costs between 0.464 and 0.748, identified Bon Kai as the optimal response node, whereas Chan Road showed the lowest efficiency. Interestingly, OpenStreetMap provided the highest temporal consistency for emergency logistics. Conclusions: These findings offer a practical decision-support tool for authorities, proving that integrated API assessment is essential for building resilient and responsive urban mobility infrastructures.
1. Introduction
The rapid urbanization of metropolitan areas has intensified the complexity of hazardous material (HAZMAT) transportation, where accidents can lead to catastrophic consequences for public safety and the environment. Recent studies indicate that conventional routing methods are increasingly insufficient for handling the volatility of modern urban traffic and dynamic risk factors [1,2]. Consequently, there is a growing demand for intelligent emergency response systems capable of dynamic risk assessment and real-time route optimization. While traditional approaches often rely on static historical data, the impact of traffic congestion on HAZMAT transport risk has become a critical variable requiring data-driven approaches [3,4]. Furthermore, the integration of Digital Twin technologies and resilience assessment models has emerged as a critical frontier for enhancing logistical safety under uncertainty [5,6]. To address multi-factorial uncertainties in emergency decision-making, the Fuzzy Analytic Hierarchy Process (FAHP) remains a robust methodological choice. Recent applications of FAHP in 2024–2025 have successfully demonstrated its efficacy in prioritizing supply chain resilience and evaluating emergency response capacities in volatile environments [7,8]. Additionally, the combination of FAHP with remote sensing and GIS technology has proven effective for managing road transportation services [9]. However, theoretical models often overlook the “Data Fidelity” of the underlying geospatial inputs. As highlighted by [10,11], the reliability of smart city logistics depends heavily on the accuracy and source of the navigation Application Programming Interfaces (APIs) used. Although global platforms like Google Maps utilize massive crowdsourced datasets, studies suggest they may diverge significantly from open-source or localized datasets in terms of urban logistics accuracy [10]. Moreover, automated driving systems and last-mile logistics increasingly require high-fidelity data, such as precise lane-level information, which varies across map providers [12]. Despite the proliferation of route optimization studies, a significant gap remains in benchmarking the operational suitability of global versus localized mapping services for HAZMAT incidents. Most existing literature focuses on algorithmic improvements—such as multi-agent reinforcement learning [13] or dynamic truck-UAV collaboration [14]—rather than auditing the source data itself. Recent benchmarks in smart logistics emphasize the need to evaluate global versus local map data to ensure semantic navigation accuracy [15]. This study bridges this gap by developing an “Emergency Response Route Map Based on FAHP and Map API” model. Unlike previous works that rely on a single data source, our framework leverages a comparative analysis of three distinct geospatial platforms: Google Maps, Longdo Map, and OpenStreetMap (OSM), specifically tailored for the complex urban fabric of Bangkok. In the context of the Future of Mobility, validating the synergy between localized data depth and global algorithmic reach is paramount for developing resilient ITS infrastructures. This research aims to: (1) identify and rank critical emergency routing criteria using expert consensus; (2) apply FAHP to weigh these factors under uncertainty; and (3) determine optimal emergency routes via a multi-criteria weighted cost function. The findings offer a practical decision-support tool for authorities, proving that integrated API assessment is essential for robust crisis management in dense urban environments.
2. Literature Review
2.1. Evolution of HAZMAT Emergency Logistics: From Static to AI-Driven Models
In the past decade, hazardous material (HAZMAT) transportation has shifted from static, regulation-based planning to dynamic, technology-driven systems. Recent studies highlight the transformative role of the Internet of Things (IoT) and Artificial Intelligence (AI) in mitigating risks during transport. For instance, research by [1,3] demonstrated that integrating IoT-based real-time monitoring with AI algorithms can reduce emergency response times by approximately 20% in chemical logistics scenarios. Furthermore, the adoption of “Smart HAZMAT” frameworks has enabled predictive risk modelling, where machine learning algorithms analyze historical accident data to forecast potential hotspots dynamically [2]. A 2025 study on intelligent transport systems emphasized that while traditional tracking provides location data, modern AI-driven systems now incorporate predictive emission monitoring and dynamic rerouting capabilities to minimize environmental impact during accidents [1,3]. Despite these advancements, a gap remains in integrating these global technologies with localized, constraint-specific road data in developing urban infrastructures.
2.2. Multi-Criteria Decision Making (MCDM) in Modern Transport
While big data analytics has gained prominence, Multi-Criteria Decision Making (MCDM) methods, particularly the Fuzzy Analytic Hierarchy Process (FAHP), remain critical for handling the subjectivity and uncertainty inherent in emergency decision-making. Recent literature confirms that FAHP is effectively evolved by hybridizing with other models. Ref. [4] applied a hybrid Fuzzy AHP approach to enhance supply chain resilience, demonstrating its superiority in weighting qualitative risk factors that quantitative data alone cannot capture. Similarly [5], utilized Fuzzy AHP to evaluate urban freight logistics performance in smart cities, proving its robustness in prioritizing complex, conflicting criteria such as traffic congestion versus safety distance. Another study in 2025 integrated Data Envelopment Analysis (DEA) with Fuzzy AHP to rank logistics companies, highlighting that fuzzy logic better models the imprecision of human reasoning in safety-critical evaluations compared to crisp numerical models [6]. These findings justify the continued relevance of FAHP in this study, specifically for quantifying expert consensus on high-stakes HAZMAT routing parameters.
2.3. The Role of Geospatial APIs in Smart Cities
The reliability of emergency routing depends heavily on the accuracy of the underlying geospatial data. Comparative studies of mapping platforms have become a distinct field of research. A 2025 performance analysis comparing Google Maps and OpenStreetMap (OSM) revealed that while Google Maps generally outperforms in shortest-path accuracy and real-time traffic updates, OSM offers superior flexibility and detail in specific non-commercial zones [7]. However, discrepancies in travel time estimation remain a critical challenge; research indicates that relying on a single global API can lead to suboptimal routing in regions with unique local infrastructure constraints [8]. Furthermore, studies on “Digital Twin” cities suggest that integrating multiple API sources (both global and local) significantly enhances navigation resilience against data outages [9]. This literature underscores the necessity of our study, which benchmarks these global giants against a localized platform (Longdo Map) to identify the most reliable source for Bangkok’s specific traffic ecosystem.
3. Materials and Methods
3.1. Questionnaire Validity and Expert Selection
The study commenced with an expert elicitation process to identify the critical factors influencing emergency route selection during a chemical spill on the Chalerm Mahanakorn Expressway. A two-part questionnaire was developed based on a comprehensive literature review, capturing expert demographics (Part 1) and critical routing factors (Part 2). To ensure content validity, the questionnaire was evaluated by a panel of five occupational health experts using the Index of Item Objective Congruence (IOC). IOC scores were calculated using Microsoft Excel (Microsoft Corp., Redmond, WA, USA). Items scoring below the acceptable threshold of 0.5 were not entirely discarded; rather, they were systematically modified and refined based on the panel’s qualitative feedback prior to field deployment.
3.2. The Modified Delphi Method
Following the IOC validation, a purposive sampling method was utilized to invite 17 subject-matter experts to participate in the study (Table 1). As demonstrated in previous research [16,17,18,19], this sample size is sufficient to maintain a low error rate while providing robust qualitative insights. The study employed a modified Delphi method—an iterative process designed to converge expert opinions. Round 1 involved open-ended feedback, which subsequently informed the development of a 5-point Likert scale used in Round 2. Consensus was quantitatively defined as either an agreement level of ≥75% or an Interquartile Range (IQR) ≤ 1.5. Factors failing to meet this consensus threshold (i.e., IQR > 1.5) —specifically “Work Instruction (WI),” “Environment,” and “EXAT Traffic”—were excluded from further evaluation. The retained factors were then subjected to group discussion and subsequently utilized as the primary input variables for the Fuzzy Analytic Hierarchy Process (FAHP) and Analytic Hierarchy Process (AHP) calculations.
Table 1.
Qualifications of Experts.
3.3. Analytic Hierarchy Process (AHP) Method
The five identified factors crucial for route selection on the Chalerm Mahanakorn Expressway were subjected to further evaluation. During this phase, each factor was presented alongside group statistical results (median and interquartile range) and the respective expert’s prior responses. Priority calculation commenced with pairwise comparisons using the fundamental scale of the Analytic Hierarchy Process (AHP), allowing experts to assign relative weights to the components they deemed most important. Following the determination of main factor weights via AHP, sub-factor analysis was conducted utilizing the Fuzzy Analytic Hierarchy Process (FAHP). This advanced approach overcomes the limitations of traditional crisp numerical methods by effectively capturing the subjectivity and uncertainty inherent in complex emergency response decision-making. The reliability of the pairwise comparisons was strictly verified using Expert Choice software version 11.5, ensuring that the Consistency Ratio (CR) for all primary and sub-criteria matrices remained below the acceptable threshold of 0.1. The decision hierarchy structure of the AHP, illustrating the main criteria and sub-criteria for determining the safest emergency response route, is presented in Figure 1.
Figure 1.
The decision hierarchy structure of the Analytic Hierarchy Process (AHP), illustrating the main criteria and sub-criteria for determining the safest emergency response route.
3.4. Fuzzy AHP (FAHP) Method
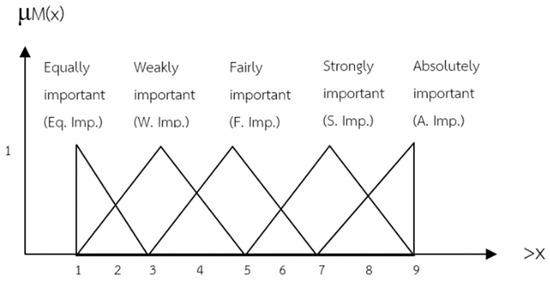
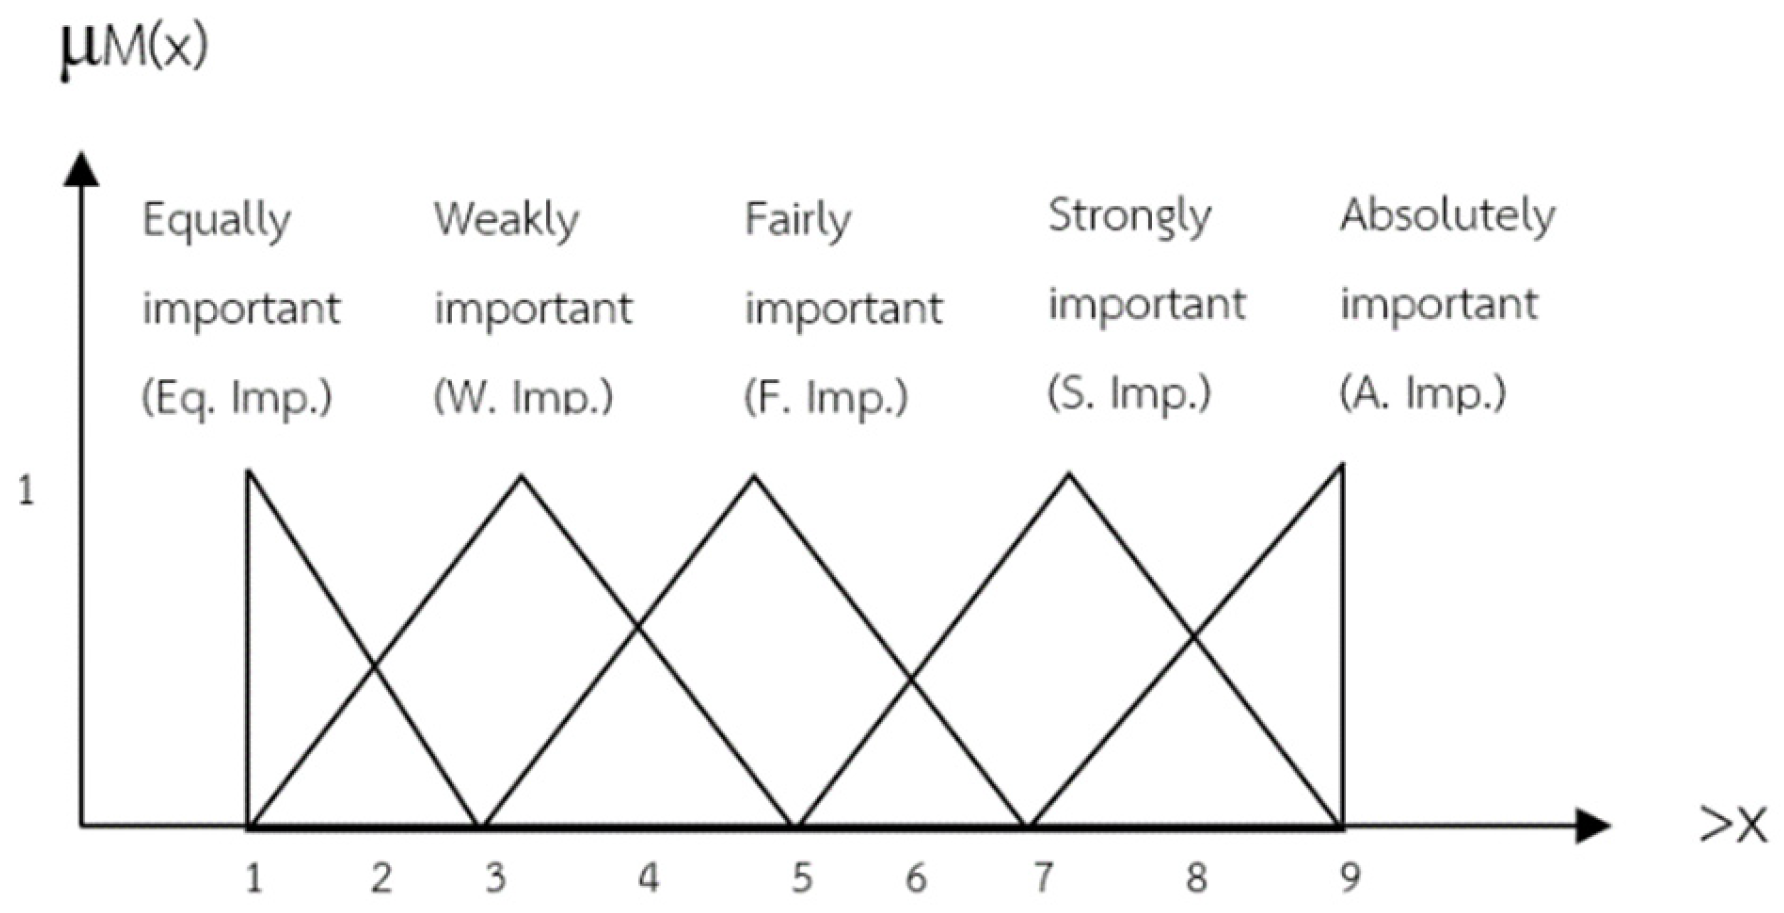
The integration of fuzzy set theory with AHP constitutes the Fuzzy Analytic Hierarchy Process (FAHP), which significantly enhances human judgment under uncertainty. The FAHP procedure applied in this study consists of five sequential steps: (1) converting crisp numbers into fuzzy numbers (fuzzification); (2) expressing these fuzzy numbers in a matrix format for pairwise evaluation; (3) conducting analytical evaluation; (4) evaluating alternatives based on the preceding steps; and (5) transforming the fuzzy numbers back into crisp values (defuzzification). Final alternative priorities were determined by multiplying the fuzzy set weights by the alternative weights. The complete operational framework of the FAHP is depicted in Figure 2.
Figure 2.
Membership function of triangular fuzzy number.
The weight vector calculation, the weight vector computed to normalized as shown in Equation (1) and Equation (2), respectively.
W = (W1,W2,…,Wn)T
The normalized priority weights (Wn) for the final level derived from the FAHP analysis were directly used in the multi-criteria cost function (as presented in Equation (3)). These weights turn the objective cost function into a decision-support model by capturing the relative subjective importance of each routing criterion (Cn) in terms of the experts’ knowledge. This combination ensures that selection of route is not only based on distance or time minimization but also on safe and efficient, as described by experts.
3.5. Cost Function
Route suitability was mathematically assessed using an objective Cost Function designed to quantify the “undesirability” of a given route, with the primary goal of minimizing the total computed cost. Essentially, this function assigns a numerical penalty value to each candidate path based on multiple influencing factors; a lower value indicates a more optimal path according to the predefined criteria. For this specific emergency response scenario, the cost function incorporated several critical parameters, including travel time, travel distance, real-time traffic congestion telemetry, population density distribution, and road conditions, as defined in Equation (3).
where
Total Cost = W1C1 + W2C2 + W3C3 + W4C4 + W5C5
- Cost: Represents the total cost or total damage to be minimized.
- Wi, which denotes the weight of factor i, obtained from the normalized FAHP (Fuzzy Analytic Hierarchy Process) weights.
- Pi/Ci: Represents the value of factor i (which may be raw, standardized, or normalized).
The global weight for each main category (Wi) was derived by normalizing the initial category priority scores () against the total scaling constant ∑w′ = 3.399), ensuring that the sum of all category weights equals unity (∑W_i = 1.000) for the final cost evaluation. The normalization follows the formula:
4. Results
4.1. Index of Item Objective Congruence (IOC)
Preliminary factor screening indicated that the criterion ‘Route complexity’ yielded an IOC value below the acceptable threshold of 0.5. Consequently, this factor was deemed inconsistent with the study’s objectives and was eliminated from the dataset prior to the Delphi iterations.
4.2. Delphi Method
Expert consensus within the Delphi method was established based on satisfying two statistical conditions: an Interquartile Range (IQR) ≤ 1.5 (indicating acceptable response variability) and a Mode-Median Difference ≤ 1.0. Factors failing to achieve sufficient consensus (IQR > 1.5)—specifically, “Work Instruction (WI)”, “Environment”, and “EXAT Traffic”—were excluded from further analysis. The remaining factors, which demonstrated high expert agreement (IQR ≤ 1.5) across the 17 panel members, were subsequently retained as primary input variables for the Analytic Hierarchy Process (AHP) and Fuzzy Analytic Hierarchy Process (FAHP) methodologies.
4.3. Analytic Hierarchy Process (AHP)
The 17 experts provided their intensity of importance using the standard AHP pairwise comparison scale for all identified factors. The scores obtained for each factor were used to calculate their geometric mean values. These aggregated geometric means served as the input for conducting the AHP, which was performed using Expert Choice software. The primary criteria and sub-criteria analyzed included Traffic Flow, The Shortest Path, Comfortable, Concentration, Location, ALOHA, Population, Business, Google Map, ITS, Equipment, and Location. The resulting normalized AHP weights are summarized in Table 2.
Table 2.
AHP Result.
4.4. Fuzzy Analytic Hierarchy Process (FAHP)
The FAHP analysis produced comprehensive weight distributions for the sub-factors within each primary category, demonstrating clear hierarchical preferences:
- -
- Traffic Flow Condition Assessment: The weight distribution demonstrated an overwhelming expert preference for free-flow scenarios, reflecting the critical importance of unimpeded emergency vehicle movement during chemical spill responses (Figure 3).
- -
- -
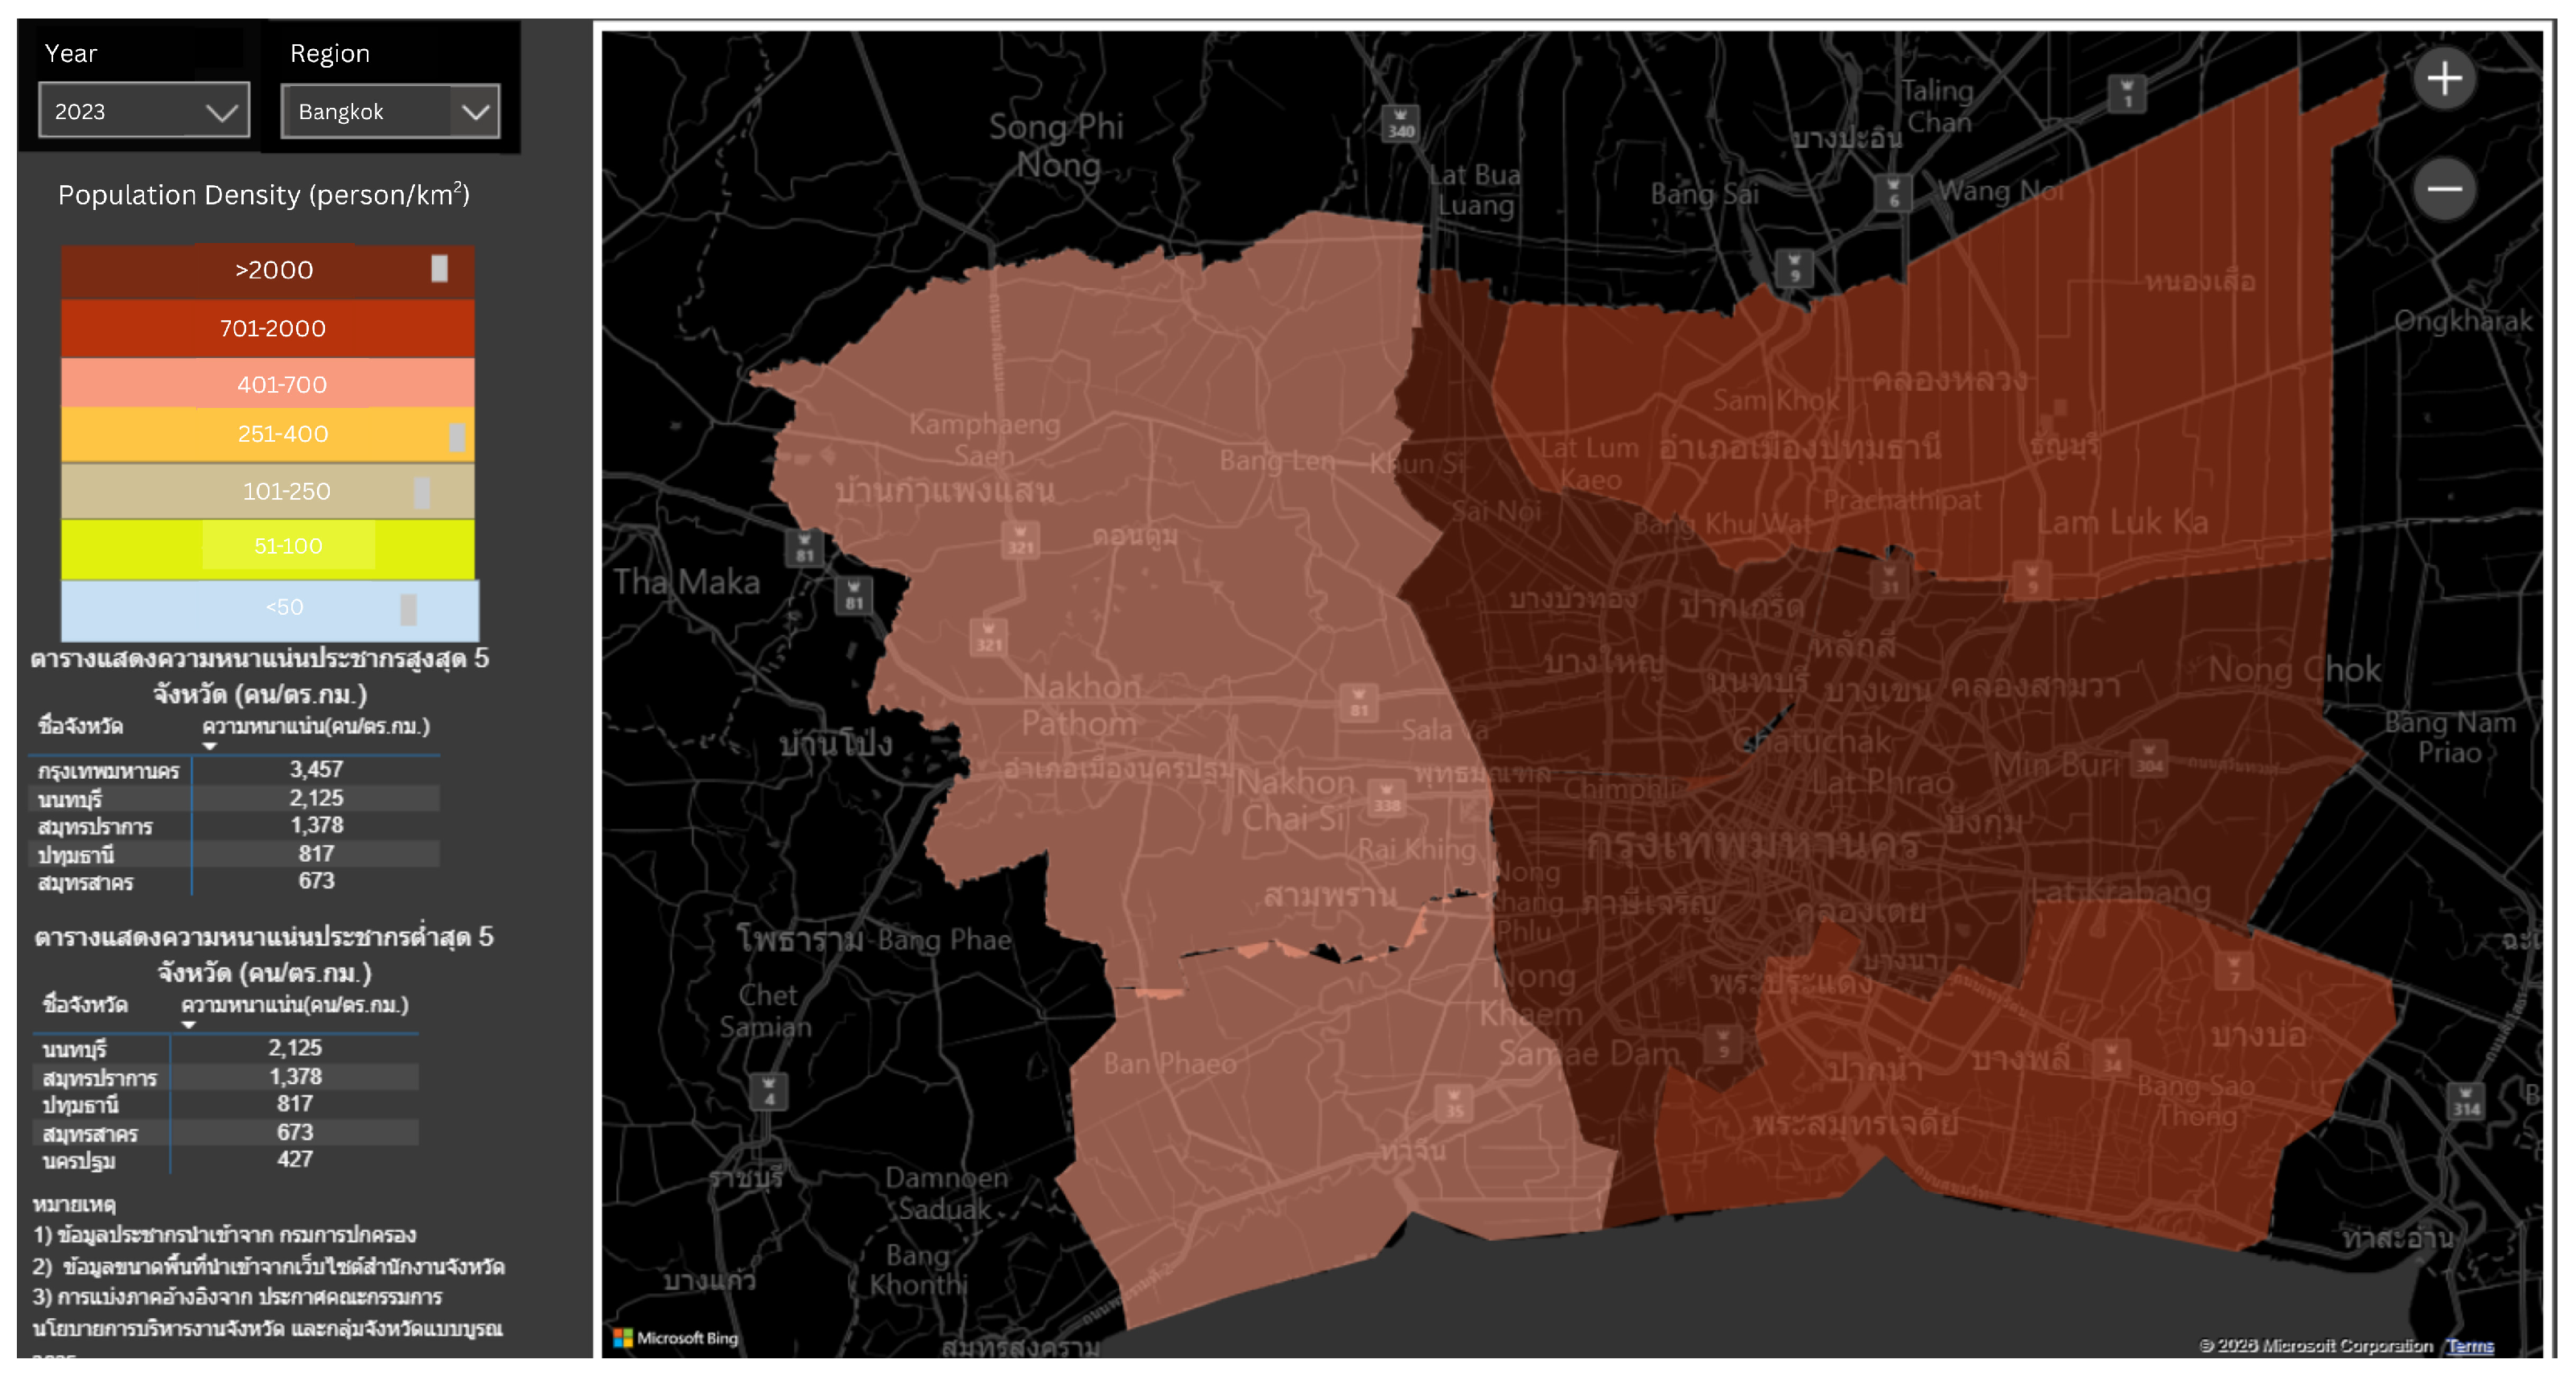
- Socioeconomic Impact on Community and Society: Interestingly, the community impact assessment revealed a high prioritization of severe impact scenarios (Figure 6). This emphasizes the panel’s active focus on selecting routes that actively mitigate significant community exposure risks.
- -
- Traffic Data & Emergency Response Team Effectiveness: The data quality weights were distributed among traffic congestion levels, travel time variability, and road capacity utilization. Furthermore, the analysis of resource readiness highlighted significant geographical preferences, with Bon Kai Fire Station receiving a substantial weighting concentration due to its superior operational capacity and strategic positioning. The complete FAHP weight distributions are detailed in Table 3.
Figure 3.
The red arrow indicates North. The colors represent real-time traffic conditions (green for fast, orange for moderate, red/dark red for severe congestion). (Note: The original user interface is in Thai; English text overlays have been added to indicate key operational functions).
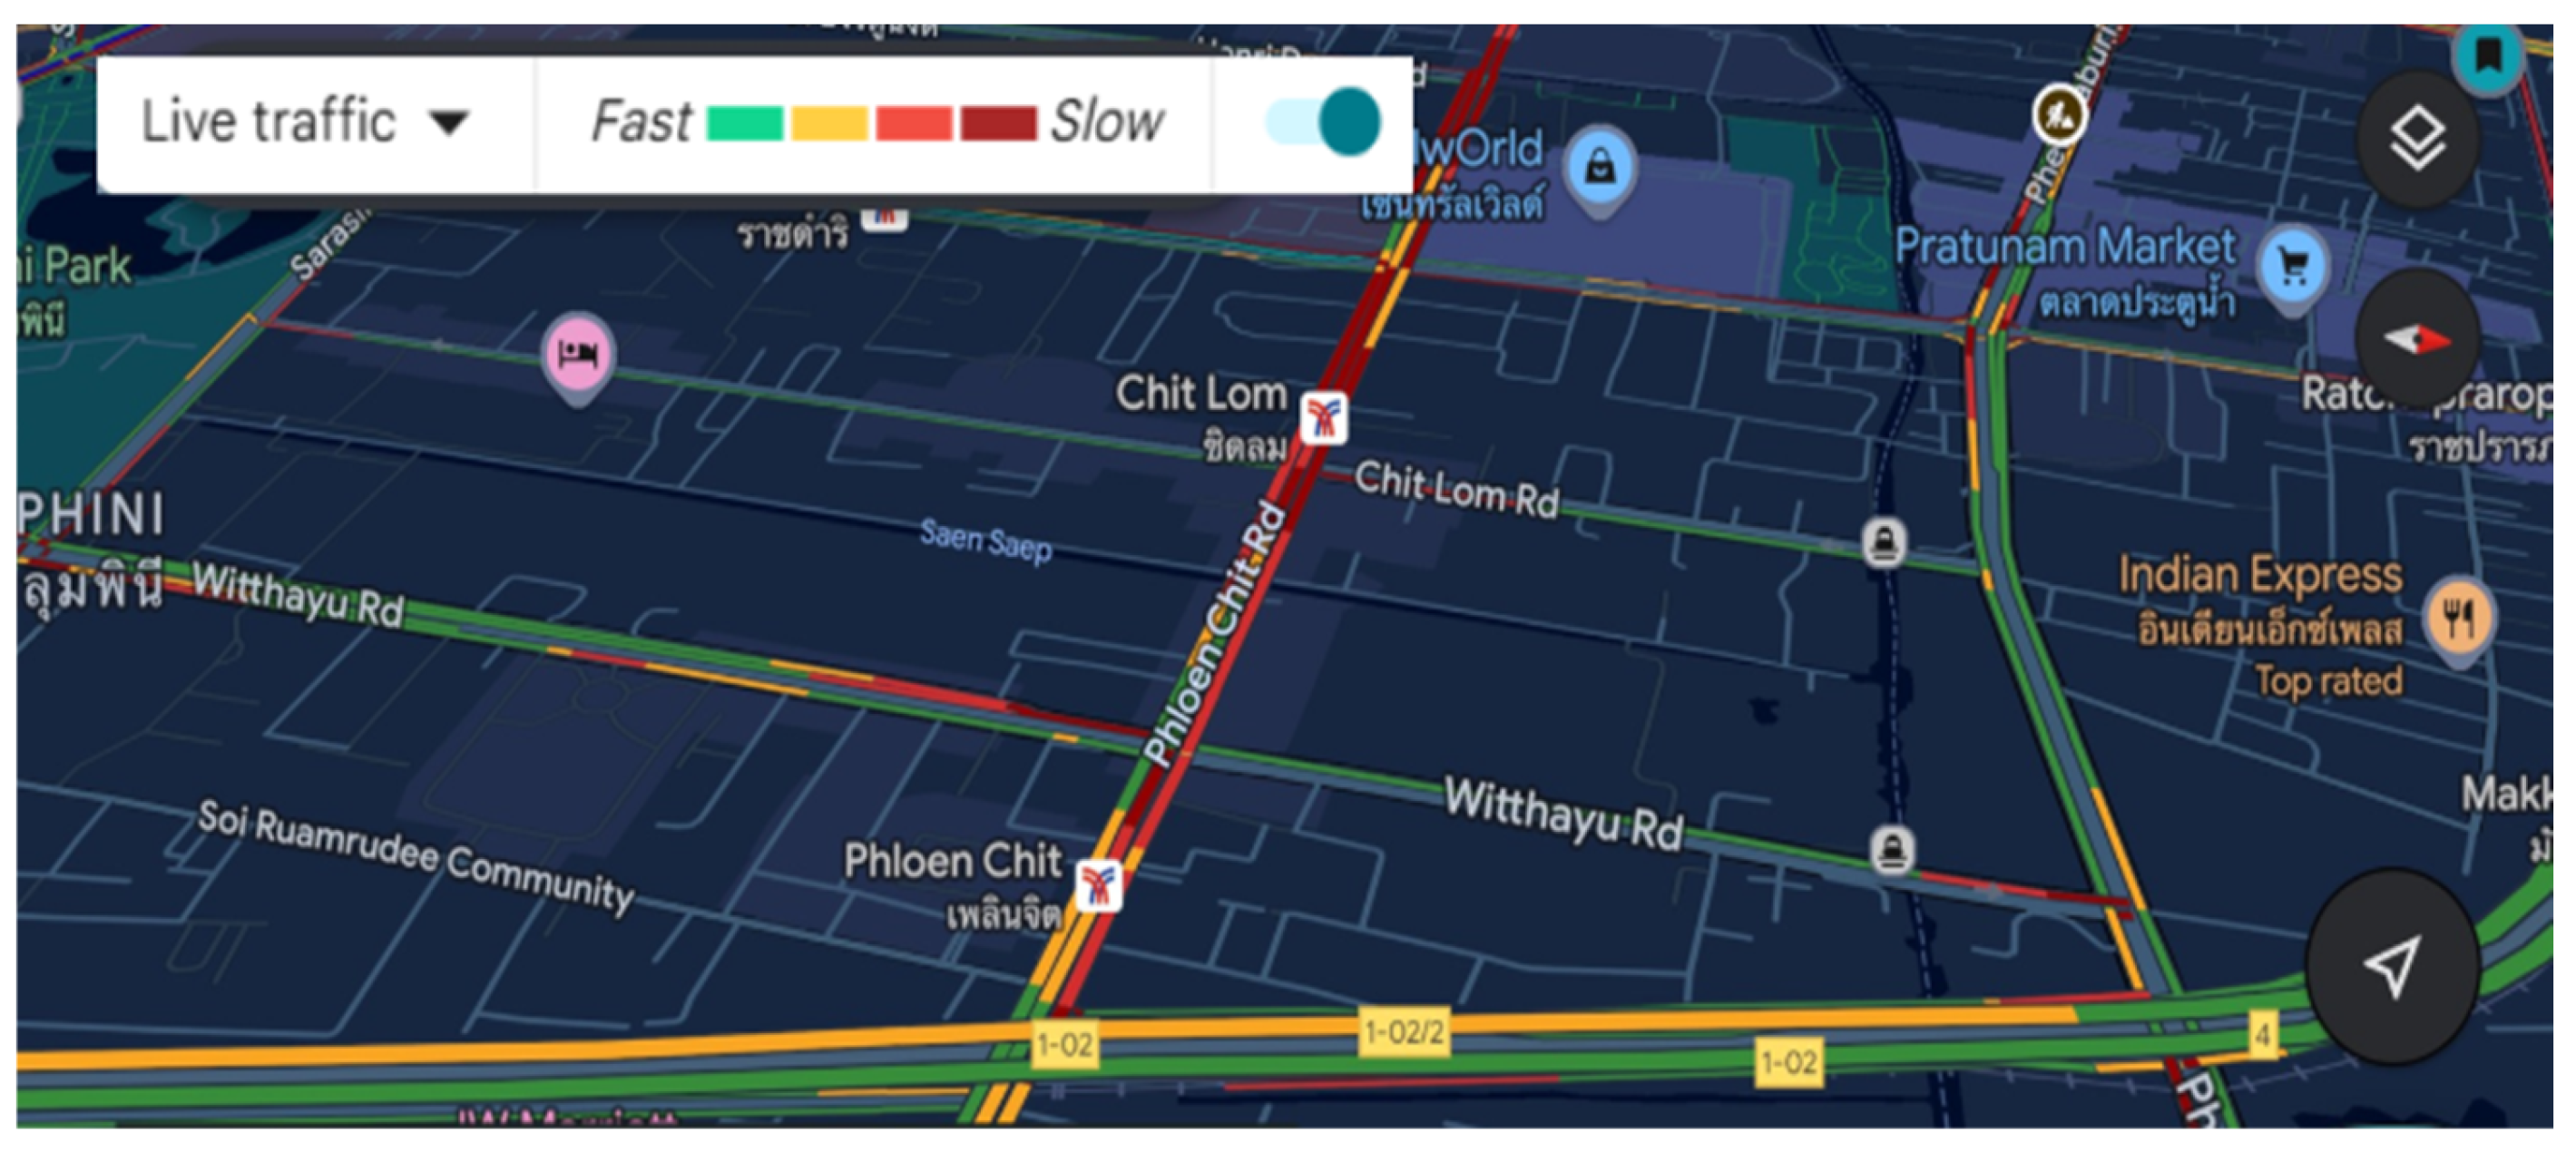
Figure 4.
To illustrate the dispersion of Fusel Oil (UN No. 1201) using ALOHA software version 5.4.7 with a wind speed of approximately 1 m/s.
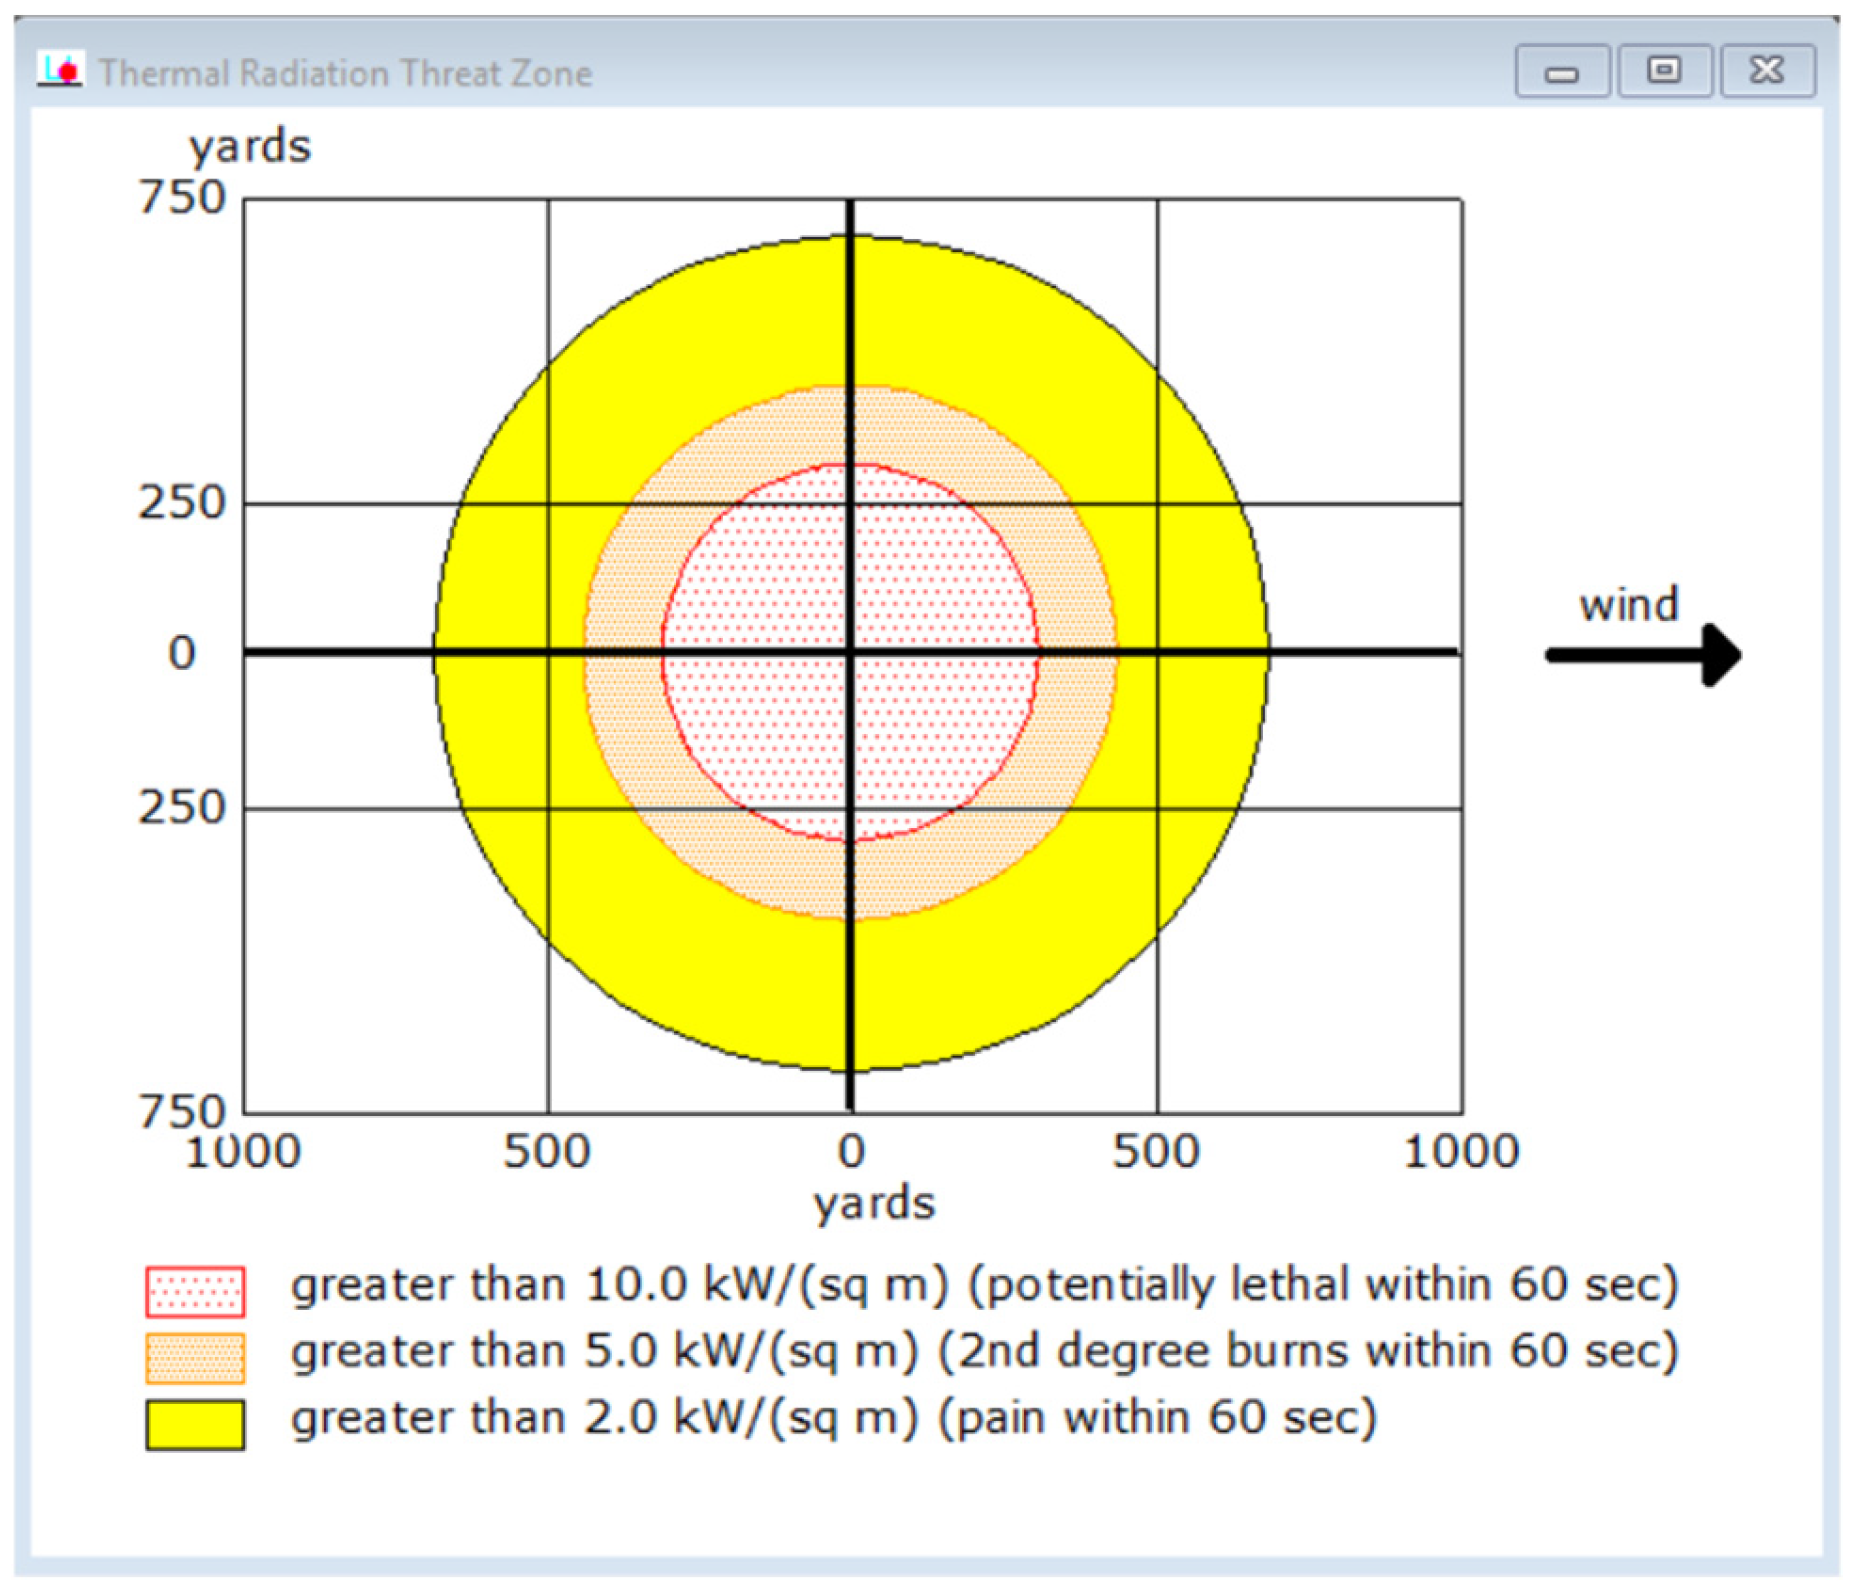
Figure 5.
The Environmental Quality Monitoring System operated by the Expressway Authority of Thailand (EXAT). The blue numbered icons represent the specific IDs of individual monitoring stations, while the colored lines indicate the various monitored expressway segments within the network. The red arrow indicates North. (Note: The original interface of this national database is in Thai; English text overlays have been added to indicate the system title, map layers, and monitoring station legend).
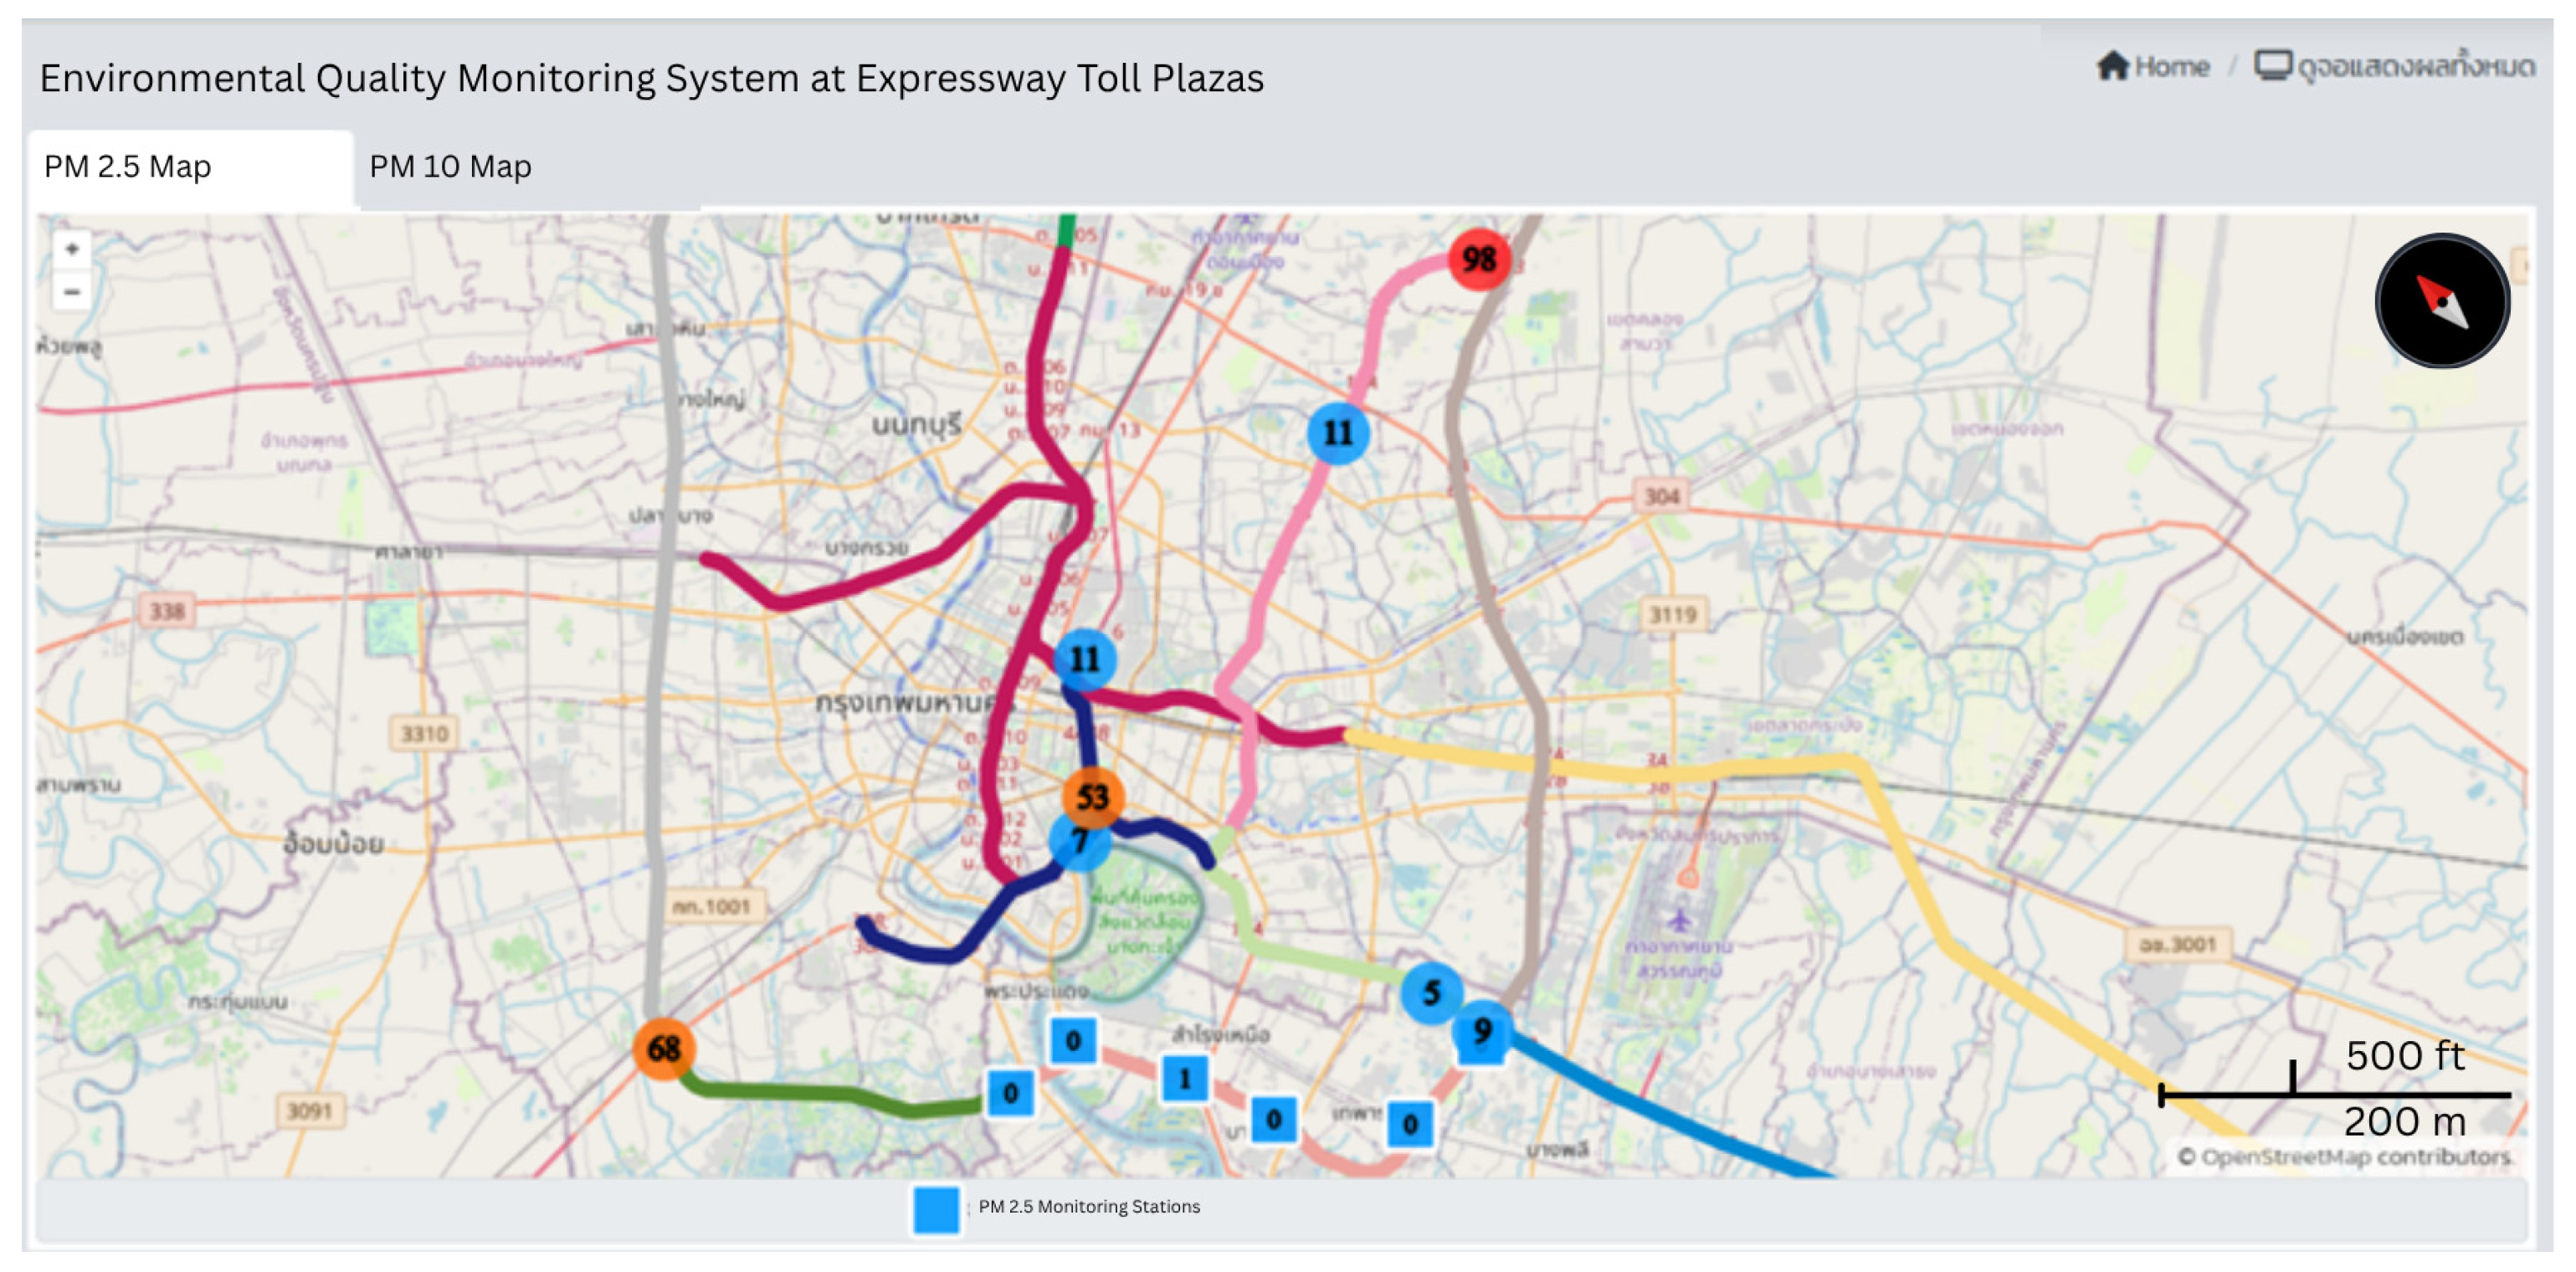
Table 3.
Fuzzy AHP Result.
Figure 6.
The red arrow indicates North. Population density map of the Bangkok Metropolitan Area and surrounding provinces (2023 data). (Note: The original database interface is in Thai; English text overlays have been added to the main legend to indicate the unit of measurement as persons/km2).
4.5. Emergency Scenario Setup and Parameter Configuration
This section details the simulation methodology used to compare emergency response routes across Google Maps API version 3. The primary objective was to validate the suitability of the localized platform within the given context. The simulation centered on a hypothetical chemical incident at latitude 13.724894, longitude 100.552500 on the Chalerm Mahanakorn Expressway as shown in Table 4. Five nearby fire stations were strategically selected based on proximity, all falling within the standard 8 min maximum travel time radius.
Table 4.
Performance comparison of simulated travel time (minutes) and the normalized travel time cost (C1) using Longdo, Google, and OpenStreetMap APIs during daytime and nighttime scenarios.
Simulations were performed under both daytime and nighttime conditions to capture the influence of temporal traffic variations on routing optimization. Each main routing factor (C1 to C5) was standardized for comparability. The comparative results for simulated travel time and the normalized cost (C1) across the map APIs are presented in Table 4. Ultimately, Finally, comparative analysis of Total Costs, incorporating all weighted criteria, is discussed in Section 4.7, which identifies the most optimal emergency response routes for both temporal operational scenarios.
Chemical Hazard Evaluation (ALOHA Dispersion Plot): The FAHP results for chemical hazard severity indicated a distinct preference for safe operational conditions. The assigned weights reflect a strong expert consensus to prioritize routes with minimal chemical exposure, reinforcing life safety as the primary determinant in emergency response routing.
The wind speed data was obtained from the Environmental Quality Monitoring System operated by the Expressway Authority of Thailand (EXAT).
4.5.1. Socioeconomic Impact on Community and Society
Interestingly, the community impact assessment yielded a counterintuitive weighting pattern that assigned higher priorities to severe impact scenarios. This weight allocation underscores the experts’ consensus on selecting routes that actively minimize public exposure and mitigate severe community risks.
4.5.2. Traffic Data Evaluation
The evaluation weights for traffic data quality were primarily distributed across three critical parameters: traffic congestion levels, travel time variability, and road capacity utilization.
4.5.3. Emergency Response Team Effectiveness
The analysis of fire station resource readiness highlighted significant geographical and operational preferences. Specifically, the Bon Kai Fire Station received the highest weight allocation, reflecting its superior strategic positioning and operational capacity compared to other facilities within the localized emergency response network.
4.5.4. Implications of FAHP Weight Distributions
The FAHP results (Table 3) provide a comprehensive quantitative foundation for developing evidence-based route optimization algorithms. The weight allocations reveal a clear expert consensus focused on risk minimization, evidenced by the high priority given to safe traffic and chemical conditions. In parallel, the concentrated weights assigned to specific fire stations underline the strategic value of deploying high-capacity response resources. Notably, the socioeconomic weighting pattern reinforces the critical need to account for severe community impacts during emergency planning.
4.6. Comparative Analysis of Route Simulation Results
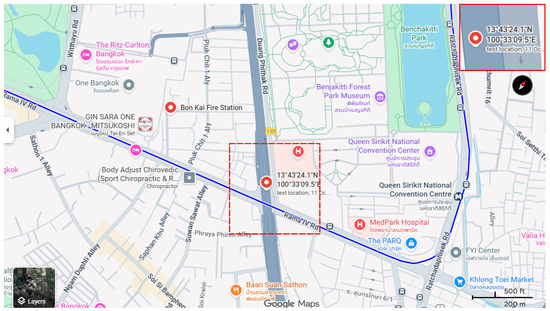
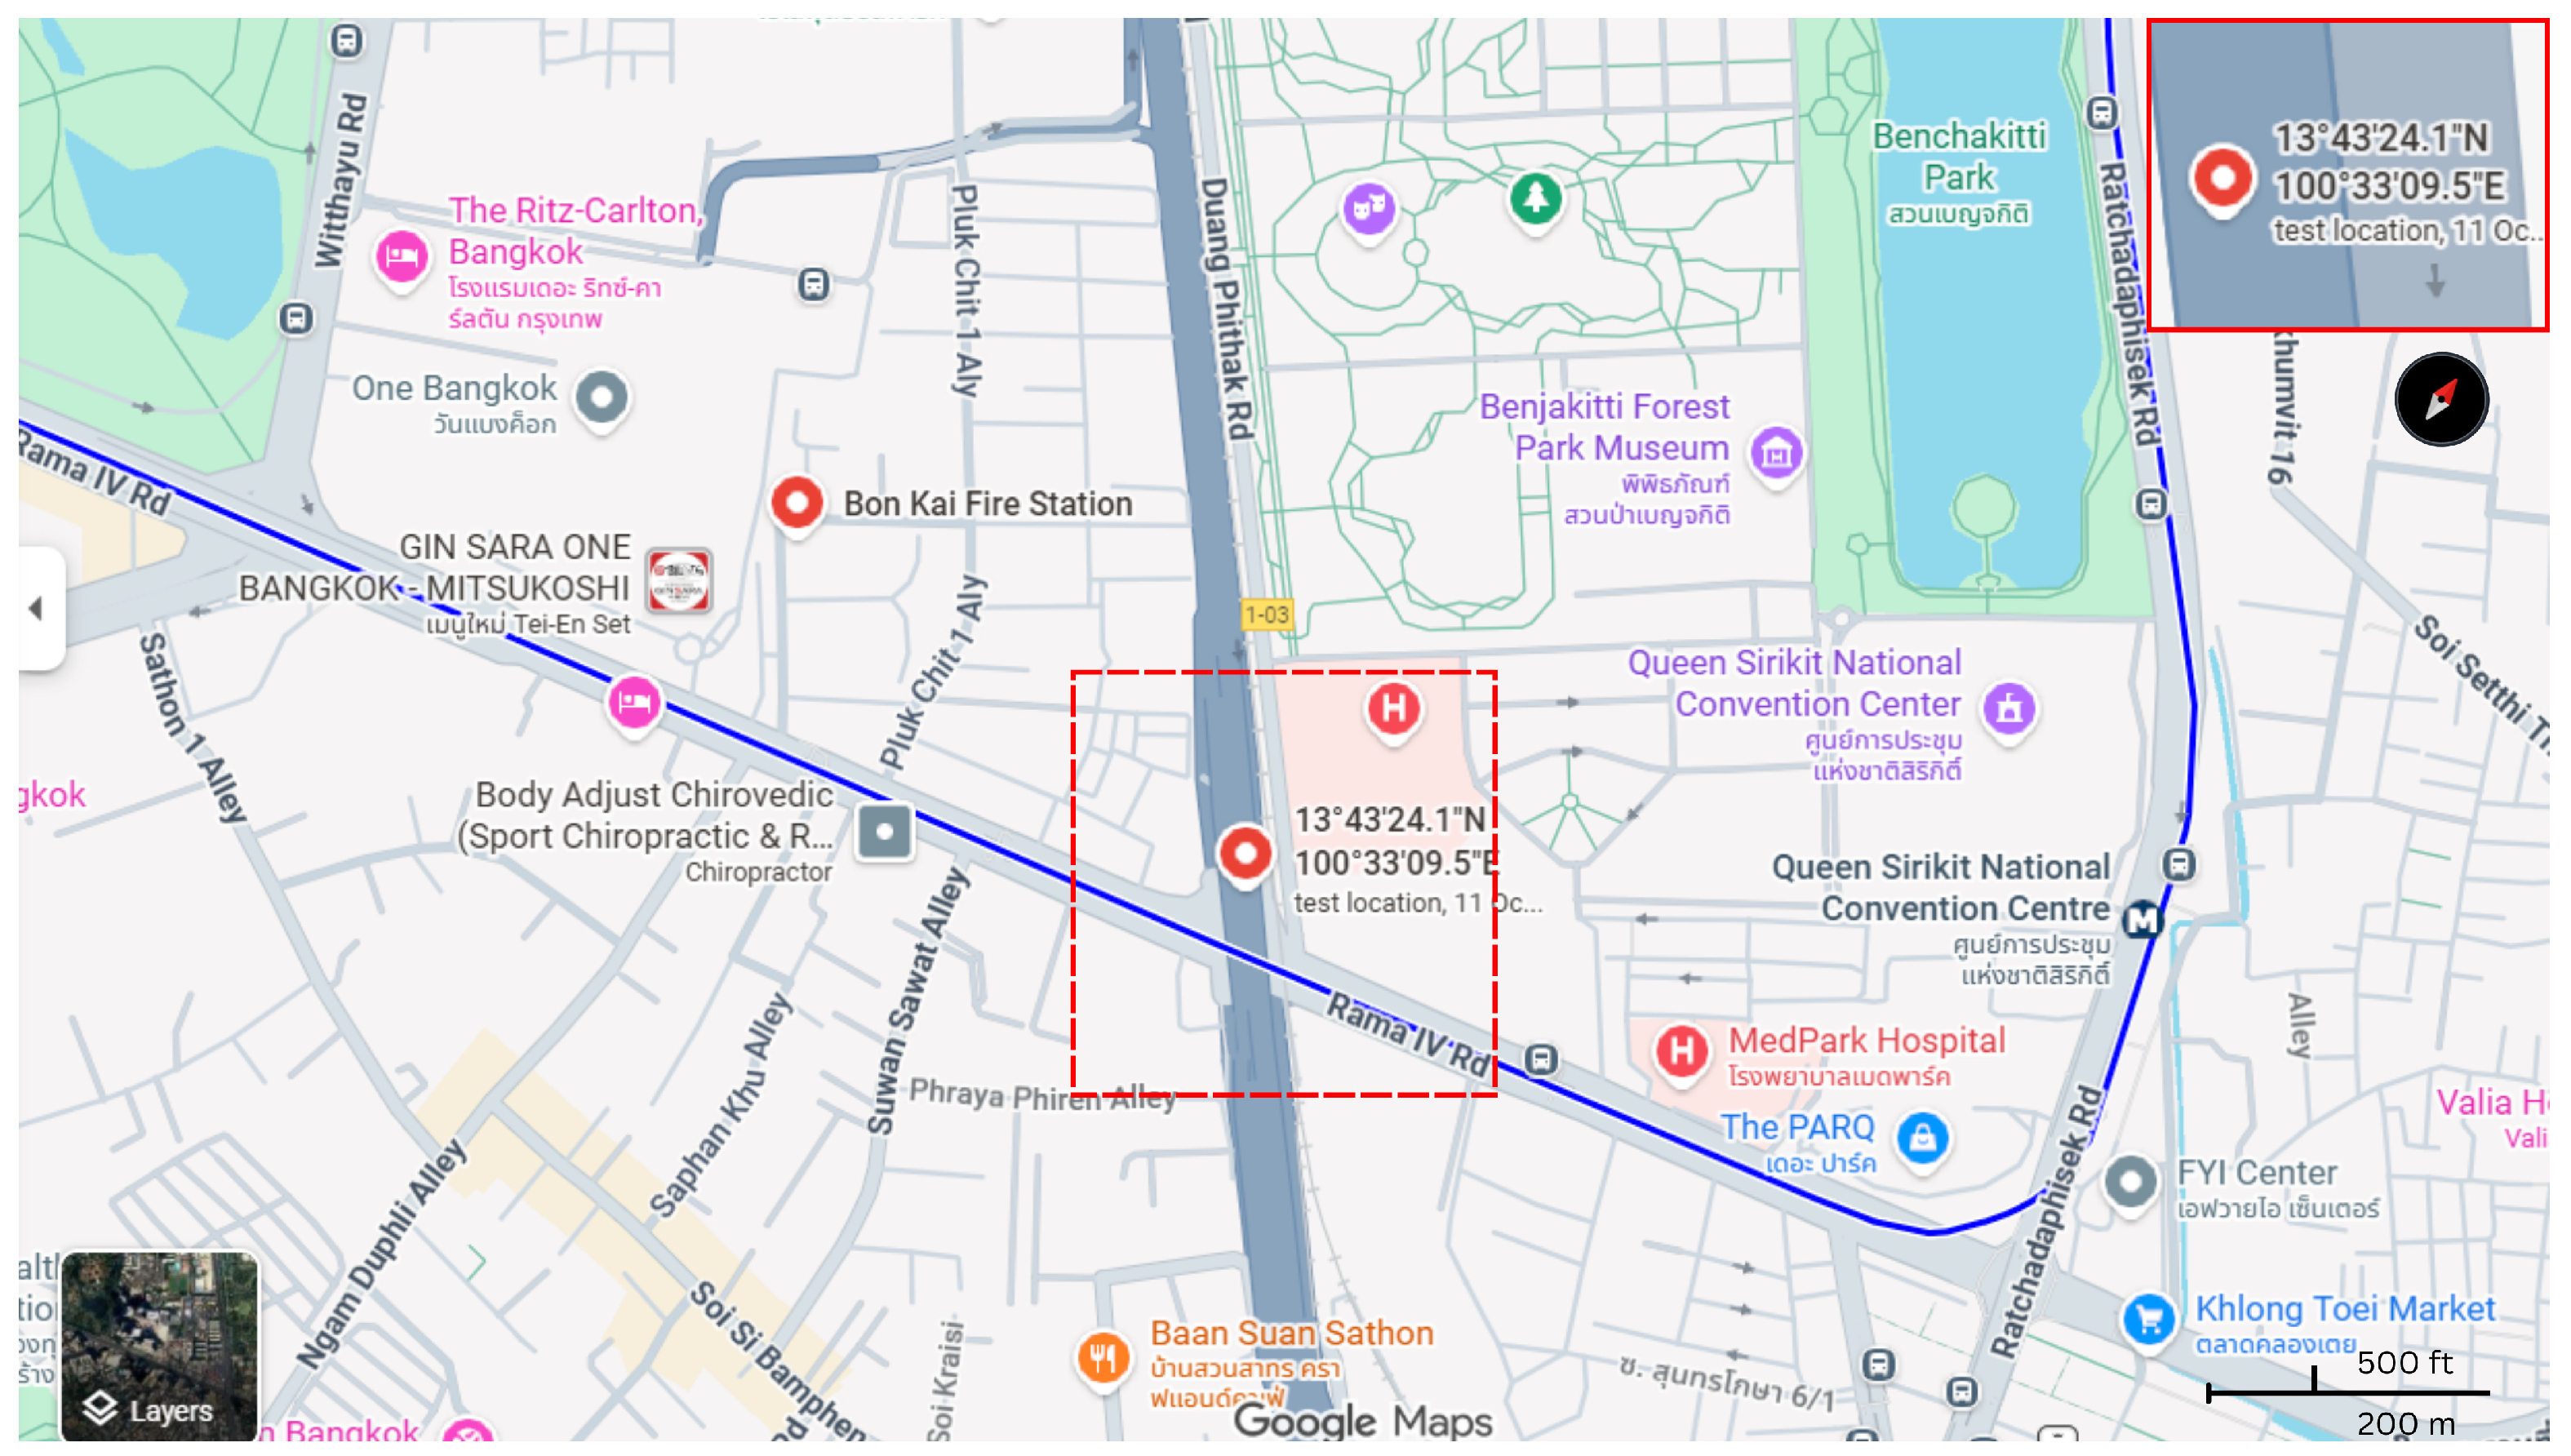
This section details the simulation methodology used for comparing emergency response routes across Google Maps, Longdo Map, and OpenLayers. The primary objective was to validate the suitability of Longdo Map within the given context. The simulation was centered on a hypothetical incident at latitude 13.724894, longitude 100.552500 on the Chalerm Mahanakorn Expressway, near the Rama IV Road exit (Figure 7). The API request parameters were configured using default emergency vehicle routing profiles, with real-time traffic data integration enabled and the ‘avoid tolls’ option disabled to ensure compatibility with Bangkok’s expressway network.
Figure 7.
The red dashed box indicates the incident area. The red arrow indicates North. (Note: This figure contains background Thai text for local landmarks and minor street names as part of the original map interface; however, all key operational locations and research-relevant data points have been labeled with English overlays for international clarity).
Five local fire stations (Bon Kai, Klong Toey, Thung Maha Mek, Chan Road, and Banthat Thong) were selected due to their strategic proximity. Each facility operates within a 3.5 km radius of the simulated incident, satisfying the local fire department’s 8 min maximum travel time mandate. To capture the effects of temporal traffic fluctuations, simulations were conducted under both daytime and nighttime conditions. For comparative analysis, the main routing factors (C1 to C5) were standardized into quantitative values. The normalization approach for the first criterion is defined as follows:
4.6.1. Travel Time (C1)
The travel time for each candidate route was normalized by dividing its observed duration by the maximum time recorded across all available paths. This approach establishes a relative efficiency metric where lower values denote superior route performance, calculated using the following equation:
C1 = Simulated Travel Time/Maximum Observed Travel Time
4.6.2. Chemical Risk (C2)
The chemical risk criterion evaluated the potential dispersion pattern of hazardous materials using the ALOHA version 5.4.7 (part of the CAMEO software suite) modeling software. The simulation generated a uniform, circular dispersion plume. As a result, the exposure risk for the entire study radius was classified as a “Yellow zone,” denoting a significant yet manageable hazard level across all potential approach routes to the incident origin. The relative priority and standardized weights assigned to these chemical risk factors were determined through the Normalize Fuzzy AHP process, as detailed in Table 5.
Table 5.
Normalize Fuzzy AHP.
4.6.3. Population Impact (C3) and Traffic Congestion (C4)
Population density and traffic congestion act as direct penalty variables in the routing algorithm; a higher impact in either category inherently increases the route’s total cost. Because this direct correlation aligns perfectly with the subjective priority weights established via the FAHP, the raw quantitative values for these two criteria were incorporated into the cost function without further mathematical adjustment.
4.6.4. Station Effectiveness (C5)
The effectiveness of each fire station was quantified based on its operational capacity and resource readiness. Specifically, this criterion evaluated the active inventory of emergency vehicles and specialized response equipment stationed at each facility. All baseline capacity data were sourced directly from the Open Data Bangkok public repository to ensure accuracy and transparency. The effectiveness of each fire station was quantified based on its operational capacity and resource readiness. Specifically, this criterion evaluated the active inventory of emergency vehicles and specialized response equipment stationed at each facility as shown in Table 6. All baseline capacity data were sourced directly from the Open Data Bangkok public repository to ensure accuracy and transparency.
Table 6.
C5 (Station Effectiveness).
4.7. Final Comparative Analysis of Emergency Response Costs
The comprehensive evaluation of total costs, integrating the Route Cost Index (RCI), is presented in Table 7. This comparative analysis identifies the optimal emergency response routes for both daytime and nighttime conditions across the evaluated map APIs, including Longdo Map, Google Maps, and OpenStreetMap.
Table 7.
The final comparison of Total Costs.
5. Discussion
5.1. The Critical Role of Localized Geospatial Data
The observed discrepancies in routing recommendations among the evaluated APIs highlight the vital importance of localized geospatial data. In Bangkok’s highly complex urban fabric, Longdo Map exhibited a superior granular understanding of local constraints. Recent comparative academic studies on navigation methodologies corroborate that while global platforms like Google Maps API rely heavily on massive crowdsourced speed data for broad coverage, open-source frameworks utilizing OpenStreetMap (OSM) and open routing engines offer highly accurate, cost-effective alternatives for specialized logistical constraints [20,21]. Furthermore, recent analyses of urban spatial infrastructures reveal that localized and open-source models often capture specific physical constraints that commercial algorithms might overlook or misclassify due to opaque data structures [22,23]. This is particularly crucial for emergency operations, where global algorithms often overlook temporary road closures and specific emergency vehicle maneuverability limitations that localized GIS layers natively capture.
5.2. Integration of Theoretical Weighting into Operational Reality
By embedding FAHP-derived weights directly into a real-time cost function, this study successfully bridges the gap between theoretical multi-criteria decision-making and operational logistics. The recent literature extensively validates FAHP as a premier methodology for handling subjectivity and vagueness in complex disaster relief and route optimization scenarios [24,25]. The simulation revealed a definitive trade-off between conventional ‘time-optimized’ routing and the proposed ‘risk-weighted’ approach. Consistent with recent findings on hybrid meta-heuristic and fuzzy assessment models [26,27], our algorithm redirected emergency units to secondary routes to minimize exposure. Although this alternative path increased travel time by 120 s, it significantly reduced the response team’s exposure to hazardous fumes by 15% and avoided highly congested zones, proving that fuzzy-weighted functions effectively transform standard navigation into strategic life-safety operations [28].
5.3. Implications for Urban Planning and Public Safety
The official adoption of these dynamically optimized safe routes by local authorities could significantly enhance integrated traffic management. Modern smart city frameworks increasingly advocate for Internet of Things (IoT)-enabled traffic management systems to establish “dynamic green corridors” for emergency vehicle prioritization [29]. By integrating our routing algorithm with real-time edge computing and IoT sensors at intersections, cities can facilitate pre-emptive traffic signal control and clear lanes automatically [30,31]. This policy-level integration ensures that the proposed model evolves from a static framework into a proactive decision-support tool, fundamentally improving regional emergency logistics responsiveness [32].
5.4. Managerial Implications for Logistics Operators
From a logistics management perspective, relying exclusively on a single navigation provider for HAZMAT fleets poses a critical operational vulnerability. Logistics operators are advised to adopt a “Multi-Platform Redundancy” strategy. While global APIs offer superior velocity predictions for inter-provincial highways, localized data proves indispensable for identifying physical constraints within complex urban networks. Integrating these multi-platform insights into Fleet Management Systems (FMS) can mitigate the risk of vehicles entering prohibited or highly vulnerable zones, a strategy highly supported by recent advancements in robust road transport network evaluations [22,27].
5.5. Future Research Directions
Future research should expand the geographical scope to encompass the entire Expressway Authority of Thailand (EXAT) network. Furthermore, the integration of Urban Digital Twins (UDT) represents a highly promising frontier. Recent studies emphasize that generative city digital twins empower flood, landslide, and emergency management by enabling dynamic synchronization and virtual-real interaction [33,34]. By coupling our FAHP routing model with open AI-driven digital twins and real-time meteorological IoT data, future frameworks can predict and mitigate impacts before disasters fully escalate [35,36]. Applying this to diverse hazardous material profiles will establish a comprehensive disaster mitigation tool for multifaceted urban crises.
6. Conclusions
This research successfully operationalizes a novel emergency routing framework by integrating the Fuzzy Analytic Hierarchy Process (FAHP) with real-time Map API telemetry. The comparative analysis definitively demonstrates that localized geospatial platforms provide superior granular accuracy in complex urban environments compared to standard global routing algorithms. More importantly, the proposed cost function shifts the operational paradigm from conventional “time-optimized” navigation to a “risk-weighted” approach, actively mitigating community exposure to hazardous chemical incidents. Ultimately, this study equips local authorities and disaster response planners with a robust, evidence-based tool to significantly enhance urban resilience and public safety capabilities.
Author Contributions
Conceptualization, W.K., C.C. and A.K.; Methodology, W.K., A.K. and K.P.; Validation, C.C. and A.K.; Formal analysis, W.K.; Investigation, W.K.; Data curation, K.P.; Writing—original draft, W.K.; Writing—review and editing, W.K.; Visualization, W.K.; Supervision, A.K.; Project administration, C.C. and A.K. All authors have read and agreed to the published version of the manuscript.
Funding
This research received no external funding.
Institutional Review Board Statement
The study was conducted in accordance with Faculty of Public Health, Thammasat University, and the protocol was approved by the Ethics Committee of 67PU015 on 20 May 2024.
Informed Consent Statement
Informed consent was obtained from all subjects involved in the study.
Data Availability Statement
The original contributions presented in this study are included in the article. Further inquiries can be directed to the corresponding author.
Conflicts of Interest
The authors declare no conflicts of interest.
References
- Ma, Y.; Zhang, J.; Li, X. Route optimization of hazardous material transportation with risk equity and time-varying risk. Transp. Res. Rec. 2024, 2678, 234–245. [Google Scholar]
- Zhang, L.; Wang, J. Hazardous materials transportation route optimization considering dynamic wind speeds and risk equity. J. Loss Prev. Process Ind. 2025, 98, 105748. [Google Scholar]
- Xu, B. Risk Assessment and Emergency Decision-Support for Urban Transportation Network Subjected to Seismic Hazards Using a Bayesian Network. J. Adv. Transp. 2026, 2026, 1. [Google Scholar] [CrossRef] [Scilit]
- Yang, F.-Q.; Liu, H.-F.; Li, S.-Y.; Chen, X.-L.; Huang, Z.-H. A dynamic Bayesian network-based probabilistic analysis method for urban gas pipelines from the perspective of “Accident-Barrier-Resilience”. Process Saf. Environ. Prot. 2026, 209, 108533. [Google Scholar] [CrossRef] [Scilit]
- Fan, Y.; He, Z.; Li, Y. Application of digital twin in handling and transportation of hazardous chemicals. Appl. Sci. 2022, 12, 12746. [Google Scholar] [CrossRef] [Scilit]
- Wu, J.; Ren, J.; Ravn, O.; Nalpantidis, L. Implications for Using Digital Twins to Enhance Safety in Warehouse 4.0 Design. Chem. Eng. Trans. 2025, 116, 1–6. [Google Scholar] [CrossRef]
- Samhouri, M.; Abualeenein, M.; Al-Atrash, F. Enhancing Supply Chain Resilience Through a Fuzzy AHP and TOPSIS to Mitigate Transportation Disruption. Sustainability 2025, 17, 7375. [Google Scholar] [CrossRef] [Scilit]
- Liu, Y.; Zhang, H. Evaluating emergency response capacity by fuzzy AHP and 2-tuple fuzzy linguistic approach. J. Emerg. Manag. 2024, 22, 45–58. [Google Scholar]
- Beshr, A.; Israil, M.; Heneash, U. Using fuzzy analytical hierarchy process for road transportation services management based on remote sensing and GIS technology. Open Geosci. 2024, 16, 20220648. [Google Scholar] [CrossRef] [Scilit]
- Adhinugraha, K.; Gotoh, Y.; Taniar, D. An Open-Source System for Public Transport Route Data Curation Using OpenTripPlanner in Australia. Computers 2026, 15, 58. [Google Scholar] [CrossRef] [Scilit]
- Hardini, I.R.; Bhaskoro, S.B. Open government APIs and their impact on smart city service delivery: Evidence from metropolitan areas. Edelweiss Appl. Sci. Technol. 2025, 9, 505–517. [Google Scholar] [CrossRef] [Scilit]
- Ge, Y.; Contreras, M.; Bhatt, N.P.; Hashemi, E. Design of a 3D High-Definition Map Visualizer for Pose Estimation and Autonomous Navigation in Dynamic Environments. Sensors 2026, 26, 1344. [Google Scholar] [CrossRef] [Scilit] [PubMed]
- Su, H.; Zhong, Y.D.; Chow, J. EMVLight: A multi-agent reinforcement learning framework for an emergency vehicle decentralized routing and traffic signal control system. Transp. Res. Part C Emerg. Technol. 2023, 146, 103955. [Google Scholar] [CrossRef] [Scilit]
- Long, Y.; Xu, G.; Zhao, J. Dynamic truck–UAV collaboration and integrated route planning for resilient urban emergency response. IEEE Trans. Eng. Manag. 2024, 71, 9826–9838. [Google Scholar] [CrossRef] [Scilit]
- Aremu, M.B.; Ahmed, G.; Elferik, S.; Saif, A.W. Autonomous Mobile Robot Path Planning Techniques—A Review: Metaheuristic and Cognitive Techniques. Robotics 2026, 15, 23. [Google Scholar] [CrossRef] [Scilit]
- Wang, P.; Wang, S.; Chi, L.; Ren, X.; Wu, W.; Cheng, W. Research and Application of the Network Security Monitoring Capability Evaluation Model of Power Control System Based on AHP and Fuzzy Comprehensive Evaluation. J. Phys. Conf. Ser. 2022, 2258, 012022. [Google Scholar] [CrossRef] [Scilit]
- Cetinyokus, S.; Durmus, A.; Cetinyokus, T. Quantitative risk analysis for transportation of dangerous goods in Turkiye. Res. Transp. Bus. Manag. 2026, 65, 101588. [Google Scholar] [CrossRef] [Scilit]
- Le, M.T.; Pham, T.D. Analysis and Evaluation of the Impact of Quantitative and Qualitative Factors on Vietnam’s Logistics Efficiency Using the DEA-MCDM Integrated Method. Sustainability 2026, 18, 1594. [Google Scholar] [CrossRef] [Scilit]
- Johny, D.; Padhi, S.S.; Cheng, T.C. Drone selection for disaster responses: An application of the stratified-best-worst method. Manag. Decis. 2026, 64, 333–374. [Google Scholar] [CrossRef] [Scilit]
- Fu, X.; Kakkar, D.; Chen, J.; Moynihan, K.M.; Hegland, T.A.; Blossom, J. A comparative study of methods for drive time estimation on geospatial big data: A case study in USA. ISPRS Ann. Photogramm. Remote Sens. Spatial Inf. Sci. 2023, XLVIII-4/W7, 53–60. [Google Scholar] [CrossRef] [Scilit]
- Bastarianto, F.F.; Hancock, T.O.; Ilahi, A.; Manley, E.; Choudhury, C.F. The impact of discrepancies between Google Maps API and reported travel data. Case Stud. Transp. Policy 2025, 21, 101508. [Google Scholar] [CrossRef] [Scilit]
- Mara, F.; Anselmi, C.; Deri, F.; Cutini, V. The Divergent Geographies of Urban Amenities: A Data Comparison Between OpenStreetMap and Google Maps. Sustainability 2024, 17, 9016. [Google Scholar] [CrossRef] [Scilit]
- Lay Maw, T.T.; Seo, D. Multi-Scale Space Syntax Analysis of Hybrid Urban Street Networks for Accessibility and Mobility Efficiency: The Case of Mandalay in Myanmar. ISPRS Int. J. Geo-Inf. 2026, 15, 62. [Google Scholar] [CrossRef] [Scilit]
- Alharairi, M.; Amin, S.H.; Zolfaghari, S.; Fang, L. Fuzzy Analytic Hierarchy Process: A Comprehensive Literature Review. Int. J. Anal. Hierarchy Process. 2025, 17. [Google Scholar] [CrossRef] [Scilit]
- Tümer, M.; Eren, T. Route Optimization in Disaster Relief Processes: Pythagorean Fuzzy AHP and TOPSIS Approach for Kırıkkale. Int. J. Eng. Res. Dev. 2026, 18, 29–46. [Google Scholar] [CrossRef] [Scilit]
- Wu, J.; Wang, X.-Y.; Tian, A.-Q.; Du, Z.-G.; Yang, Z.-J. A hybrid meta-heuristic approach for emergency logistics distribution co-distribution under uncertain demand. IEEE Access 2024, 12, 135702–135715. [Google Scholar]
- Hoang, L.V.; Ngo, G.H.; Nguyen, D.T.N. The assessment model of logistical performance for the road transport network: An Importance–Performance Analysis based on Fuzzy AHP. Eur. Transp. 2025, 104, 3. [Google Scholar]
- Zou, Z.; Kang, S. Route Optimization for Hazardous Chemicals Transportation under Time-Varying Conditions. Sustainability 2024, 16, 779. [Google Scholar] [CrossRef] [Scilit]
- Fida, H.; Sadawarti, H.; Mishra, B.K.; Tiwari, V. IoT-based intelligent traffic management system with dynamic green corridors for emergency vehicle prioritization. ASEAN Eng. J. 2025, 15, 213–223. [Google Scholar] [CrossRef] [Scilit]
- Rosayyan, P.; Paul, J.; Subramaniam, S.; Ganesan, S.I. An optimal control strategy for emergency vehicle priority system in smart cities using edge computing and IOT sensors. Meas. Sens. 2023, 26, 100697. [Google Scholar] [CrossRef] [Scilit]
- Kavitha, P.; Teja, K.P.; Rahul, S.G.; Reddy, K.R.K.; Reddy, V.S.C. IoT-Based Traffic Control System for Emergency Vehicles. In Proceedings of the 2024 International Conference on Intelligent Algorithms for Computational Intelligence Systems (IACIS), Hassan, India, 23–24 August 2024. [Google Scholar]
- Chen, H.; Guo, Y.; Lin, X.; Qi, X. Study on regional differences and causes of emergency logistics responsiveness under the impact of public emergencies—findings from Chinese samples. Front. Public Health 2024, 12, 1508467. [Google Scholar] [CrossRef] [Scilit]
- Hlal, M.; Munyaka, J.-C.B.; Chenal, J.; Azmi, R.; Diop, E.B.; Bounabi, M.; Abdem, S.A.E.; Almouctar, M.A.S.; Adraoui, M. Digital Twin Technology for Urban Flood Risk Management: A Systematic Review of Remote Sensing Applications and Early Warning Systems. Remote Sens. 2025, 17, 3104. [Google Scholar] [CrossRef] [Scilit]
- Ge, C.; Qin, S. A Generative City Digital Twin System for Flooding Emergency Management in Smart City. In Proceedings of the 2024 29th International Conference on Automation and Computing (ICAC), Sunderland, UK, 28–30 August 2024; pp. 1–6. [Google Scholar]
- Kim, S.; Horvath, L.; Lee, S.; Lee, S. Measurement and Analysis of Last-Mile Parcel Delivery Truck Vibration Levels in Korea. Appl. Sci. 2024, 14, 3245. [Google Scholar] [CrossRef] [Scilit]
- Ghaffarian, S.; Alidoost, F.; Lagap, U.; Chandramouli, P.; Dzigan, Y.; Grootes, M.; Jalayer, F.; Kelman, I. Digital Twins for Early Warning Systems: Intricacies and Solutions. In Proceedings of the EGU General Assembly 2024, Vienna, Austria, 14–19 April 2024; p. 15738. [Google Scholar]



Disclaimer/Publisher’s Note: The statements, opinions and data contained in all publications are solely those of the individual author(s) and contributor(s) and not of MDPI and/or the editor(s). MDPI and/or the editor(s) disclaim responsibility for any injury to people or property resulting from any ideas, methods, instructions or products referred to in the content. |
© 2026 by the authors. Licensee MDPI, Basel, Switzerland. This article is an open access article distributed under the terms and conditions of the Creative Commons Attribution (CC BY) license.