1. Introduction
Climate change caused by the massive emissions of greenhouse gases (GHG) has become an important environmental issue of global concern and research. Promoting carbon peaking and neutrality is an urgent task for all countries. The amount of GHG emissions from the food system is significant. According to IPCC’s research, the agriculture, forestry, and land use sectors contribute between 13% and 21% of GHG emissions [
1]. China is the world’s second-largest energy consumer after the United States, with per capita consumption of pork, beef, poultry, and milk increasing threefold, tenfold, elevenfold, and twentyfold, respectively, from 1980 to 2009 [
2]. Meanwhile, GHG emissions grew from 489 Mt carbon dioxide equivalents (CO
2eq) in 1996 to 732 Mt CO
2eq in 2010 [
3]. He et al. [
4] further pointed out that the food consumption structure of Chinese residents varies widely, and the food emissions and nutrition intake of different income groups show various characteristics. Therefore, clarifying the relationship between economic development and food emissions, and targeting interventions according to the characteristics and nutritional needs of households, are of great significance to solving the “food security, human health, and climate change” trilemma faced by developing countries represented by China. This understanding also has a far-reaching impact on the realization of the Sustainable Development Goals (SDG (
https://www.un.org/sustainabledevelopment/sustainable-consumption-production/, accessed on 25 June 2025)) proposed by the United Nations.
Recent food and nutrition research suggests that rising income reshapes food demand through dietary upgrading rather than through a simple environmental curve. Studies in China and other settings show that income growth is associated with more diversified diets, rising animal-source food consumption, and changes in both nutritional quality and environmental pressure [
4,
5,
6]. In the food literature, this process is increasingly framed as a joint nutrition-environment problem rather than as a purely environmental one [
7,
8,
9,
10]. Household-level heterogeneity, therefore, matters because the same increase in income can lead to different food choices, dietary quality outcomes, and emission consequences across regions and demographic groups [
8].
At the same time, the food-related emissions literature does not point to a settled Environmental Kuznets Curve (EKC) pattern. Existing studies document rising carbon pressure from dietary upgrading and animal-source food expansion [
10,
11,
12,
13], while recent household-level evidence shows that income can also shape food-related carbon outcomes through specific behavioral channels such as food waste [
14]. In this context, EKC should be treated as a hypothesis about nonlinear income-emissions relationships rather than as the organizing framework of the food literature. Classic EKC studies remain useful for motivating threshold analysis [
15], but evidence from Cole and McCoskey [
16] and Tonsor and Lusk [
17] is drawn from mature meat markets and cannot be transferred mechanically to Chinese households during an active stage of dietary transition. Consistent with Bennett-type dietary upgrading, empirical studies for China show that income growth is associated with lower cereal dependence and stronger demand for animal-source foods and other quality-differentiated foods [
5,
6].
Taken together, three gaps remain. First, the food and food-consumption literature has documented dietary upgrading, but it rarely connects food consumption amount, food structure, dietary quality, and food-related emissions within one unified household framework. Second, many food-emissions studies rely on macro accounting, regional comparisons, or descriptive trends [
11,
18,
19,
20,
21,
22], leaving limited micro evidence on whether income effects differ across households at different stages of dietary transition. Third, the EKC literature asks whether emissions eventually decouple from growth, but it seldom links that nonlinear question to food-specific mechanisms such as animal-source-food expansion, diet quality, and household heterogeneity. A household-panel approach is therefore needed to analyze the food–environment relationship as a question of dietary transition rather than as a purely macro environmental curve.
Using CHNS household survey data from 2004 to 2011, we examine how income is associated with food-related carbon emissions during a critical stage of dietary transition in China. Our contribution is threefold. First, we provide household-level evidence on how income is associated with food consumption amount, dietary structure, and dietary quality after controlling for household characteristics. Second, we show that the income-emissions relationship is nonlinear, but the evidence supports threshold heterogeneity rather than a short-run EKC turning point. Third, by focusing on 2004–2011 as the active phase of dietary upgrading, we connect household food demand to the broader discussion of food-system sustainability. This Chinese evidence may also offer limited comparative insight for economies undergoing similar dietary transitions, but it should not be read as a general claim about developing countries.
The remainder of the paper is organized as follows.
Section 2 describes the data, carbon-accounting approach, and empirical strategy.
Section 3 presents the empirical results.
Section 4 integrates the discussion and limitations of the study, with
Section 4.1 interpreting the findings and
Section 4.2 consolidating the main limitations.
Section 5 presents the conclusion and policy implications, with
Section 5.1 summarizing the core findings and
Section 5.2 outlining the policy implications.
3. Results
3.1. The Nonlinear Effect of Income on Food-Related Carbon Emissions
To study the threshold effect of household income on food-related carbon emissions, we first determine the number of thresholds that best characterize the model. We used 200 bootstrap replications for the threshold number test. The results reported in
Table A1 show that only the single-threshold specification is statistically significant (
p = 0.035), whereas the double- and triple-threshold specifications are not significant. We, therefore, proceed with the single-threshold model.
Table A2 reports the estimated threshold value, and
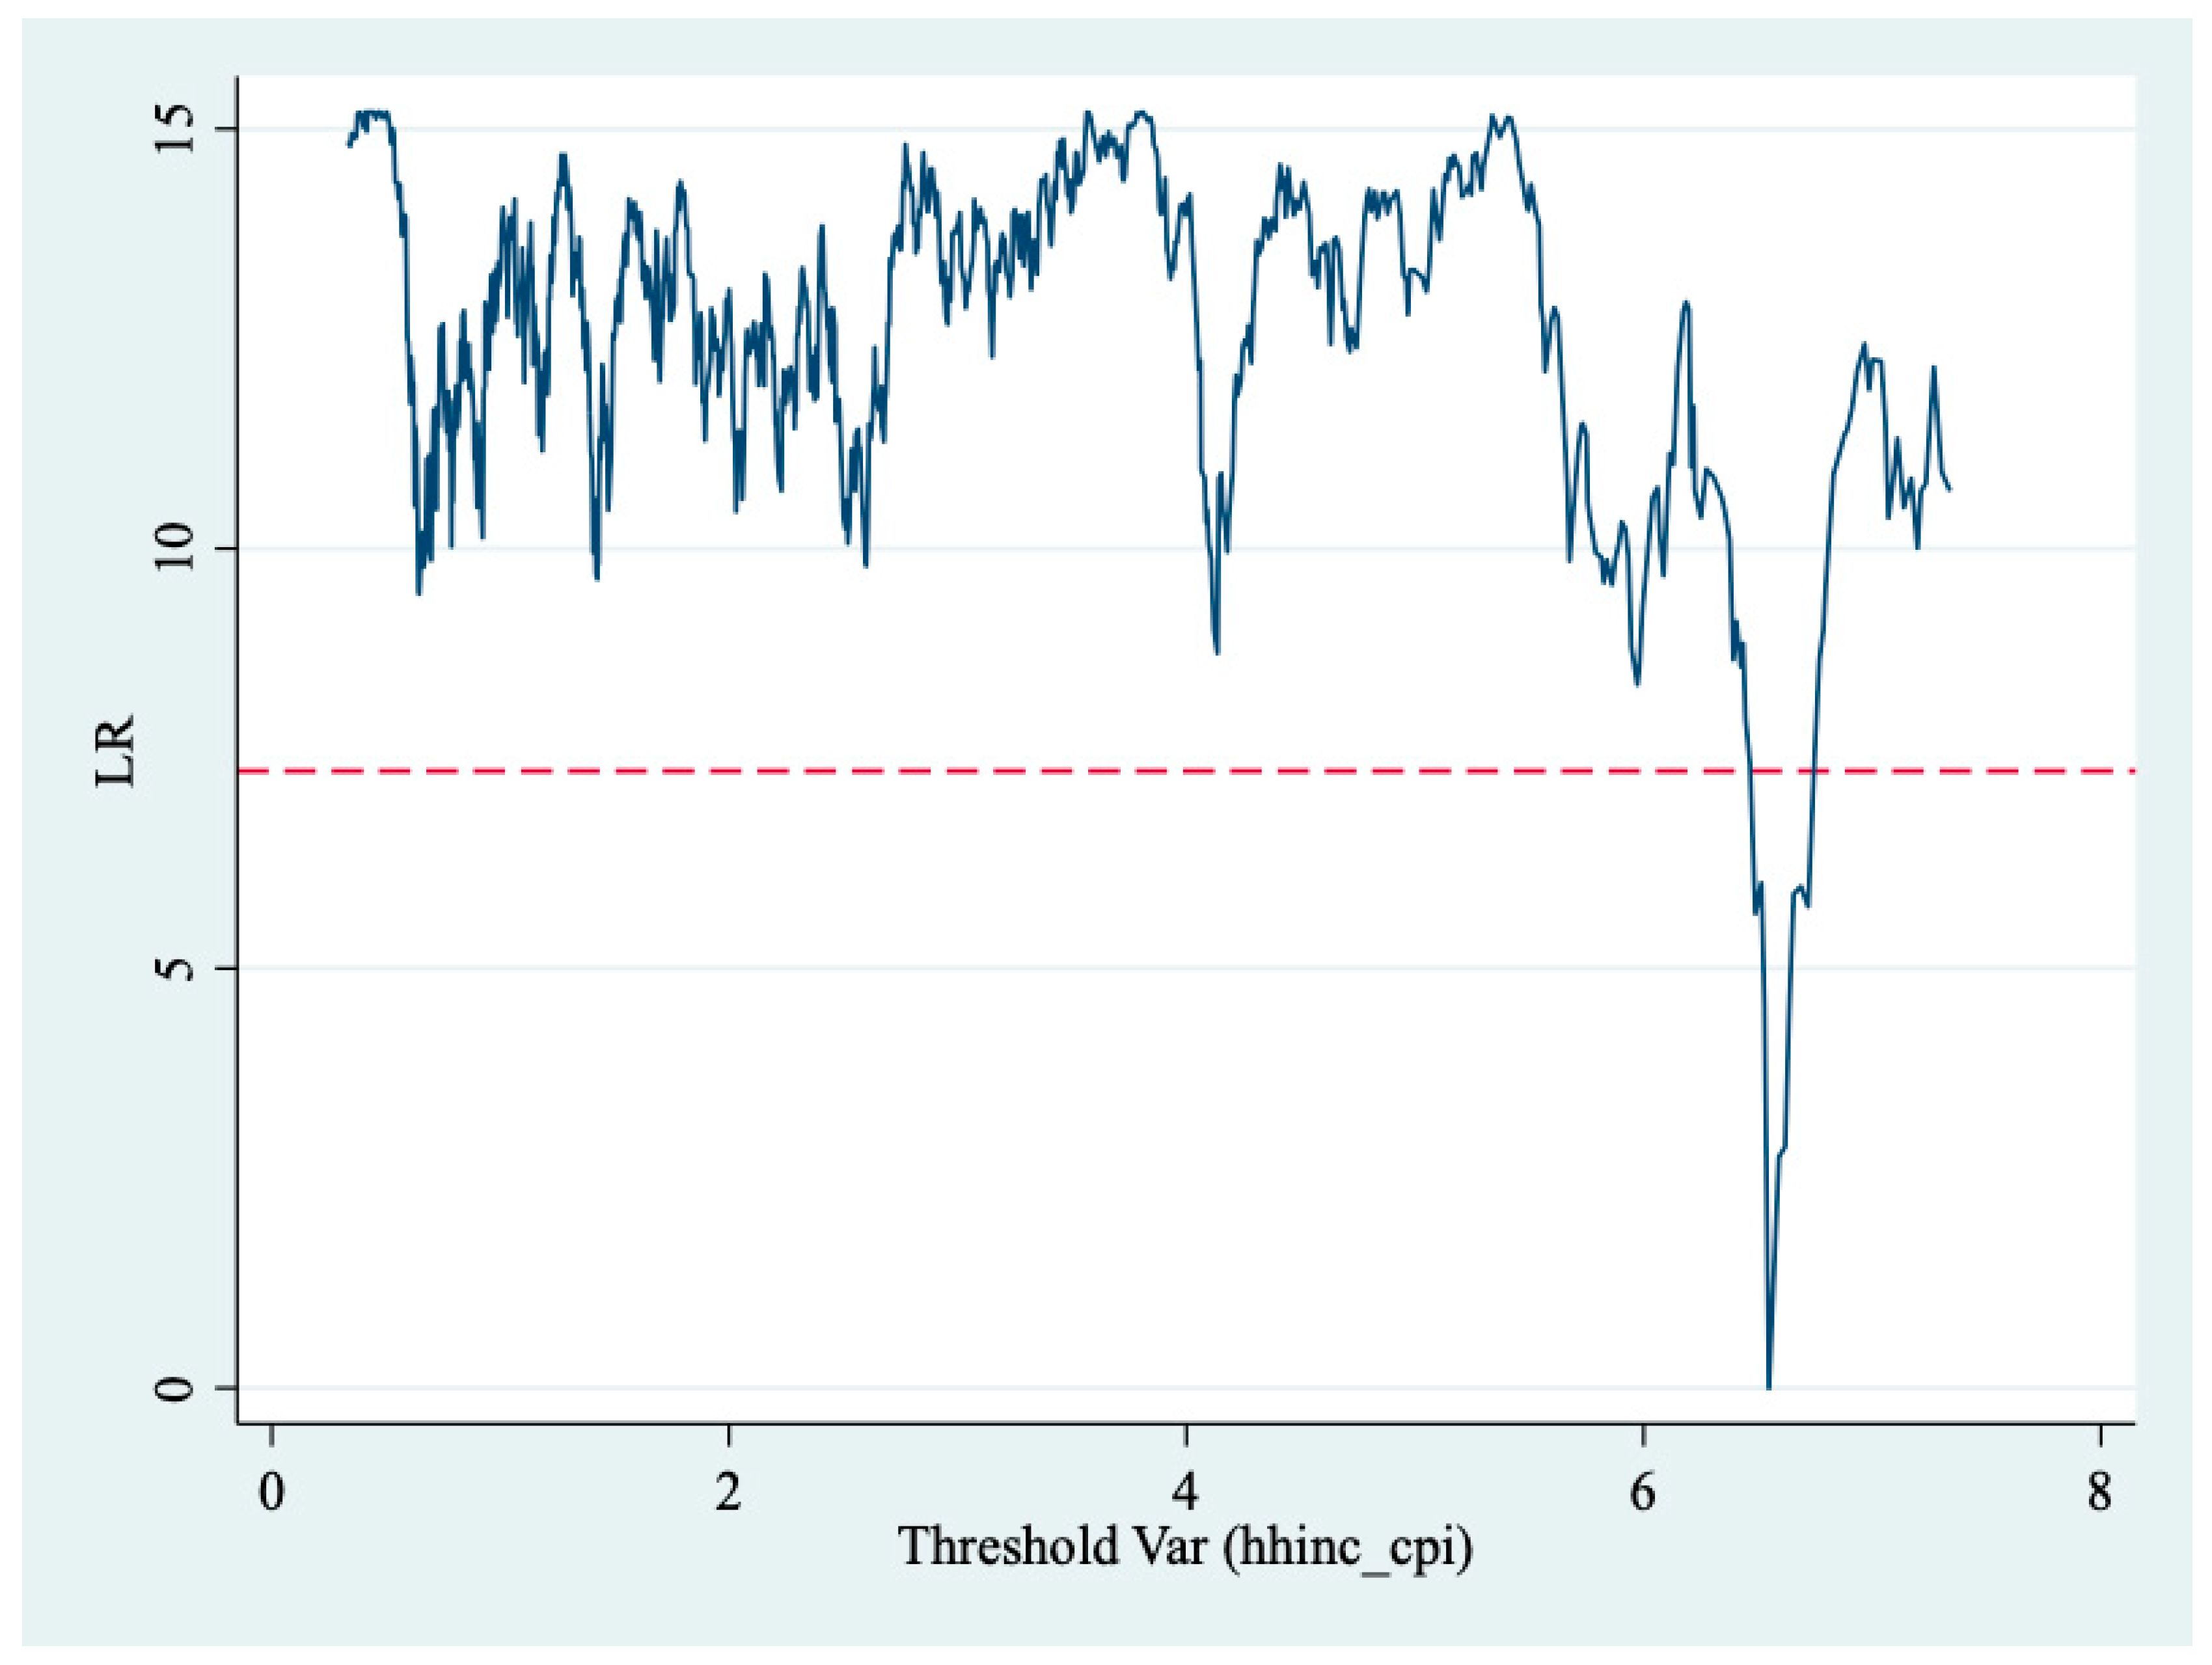
Figure A2 shows its 95% confidence interval.
The estimation results of Equation 1 are shown in
Table 1. The estimated threshold reported in
Table A2 is 6.5479, with a 95% confidence interval of [6.4965, 6.5917]. Because hhinc_cpi is measured in CPI-adjusted 10,000-yuan units, this threshold corresponds to an annual household income of 65,479 yuan. The household samples with incomes less than or equal to the threshold are classified into the low-income group, and the household samples with incomes higher than the threshold are classified into the high-income group. Household income and food-related carbon emissions are significantly and positively correlated in both groups, but the marginal effect of income on household food emissions is weaker than the threshold. For every 10,000-yuan increase in income, food emissions of low-income households increase by 0.0547 tons, whereas food emissions of high-income households increase by 0.0203 tons. Among the control variables, household size is significantly positively related to food-related emissions from food consumption, and the coefficients on age06, age65, and age are negative. The adjusted R
2 of 0.243 indicates that substantial household-level variation remains unexplained, which is consistent with the role of preferences, habits, and other unobserved characteristics in shaping food-related emissions.
Although the regression coefficient of the right side of the threshold is smaller than the left, and the marginal effect of income on household food emissions decreases after exceeding the threshold, it is not enough to show that there is an EKC in food emissions. The theory of EKC suggests that environmental quality will tend to improve after the residents’ income reaches a certain level, and carbon emissions will decrease with the increase in income. However, there is currently insufficient evidence to suggest that there is an “inflection point” in Chinese residents’ food emissions, and further research is needed on the factors influencing food emissions on both sides of the threshold.
3.2. Income Impact on Food Consumption Amount
Food-related carbon emissions are directly related to food consumption.
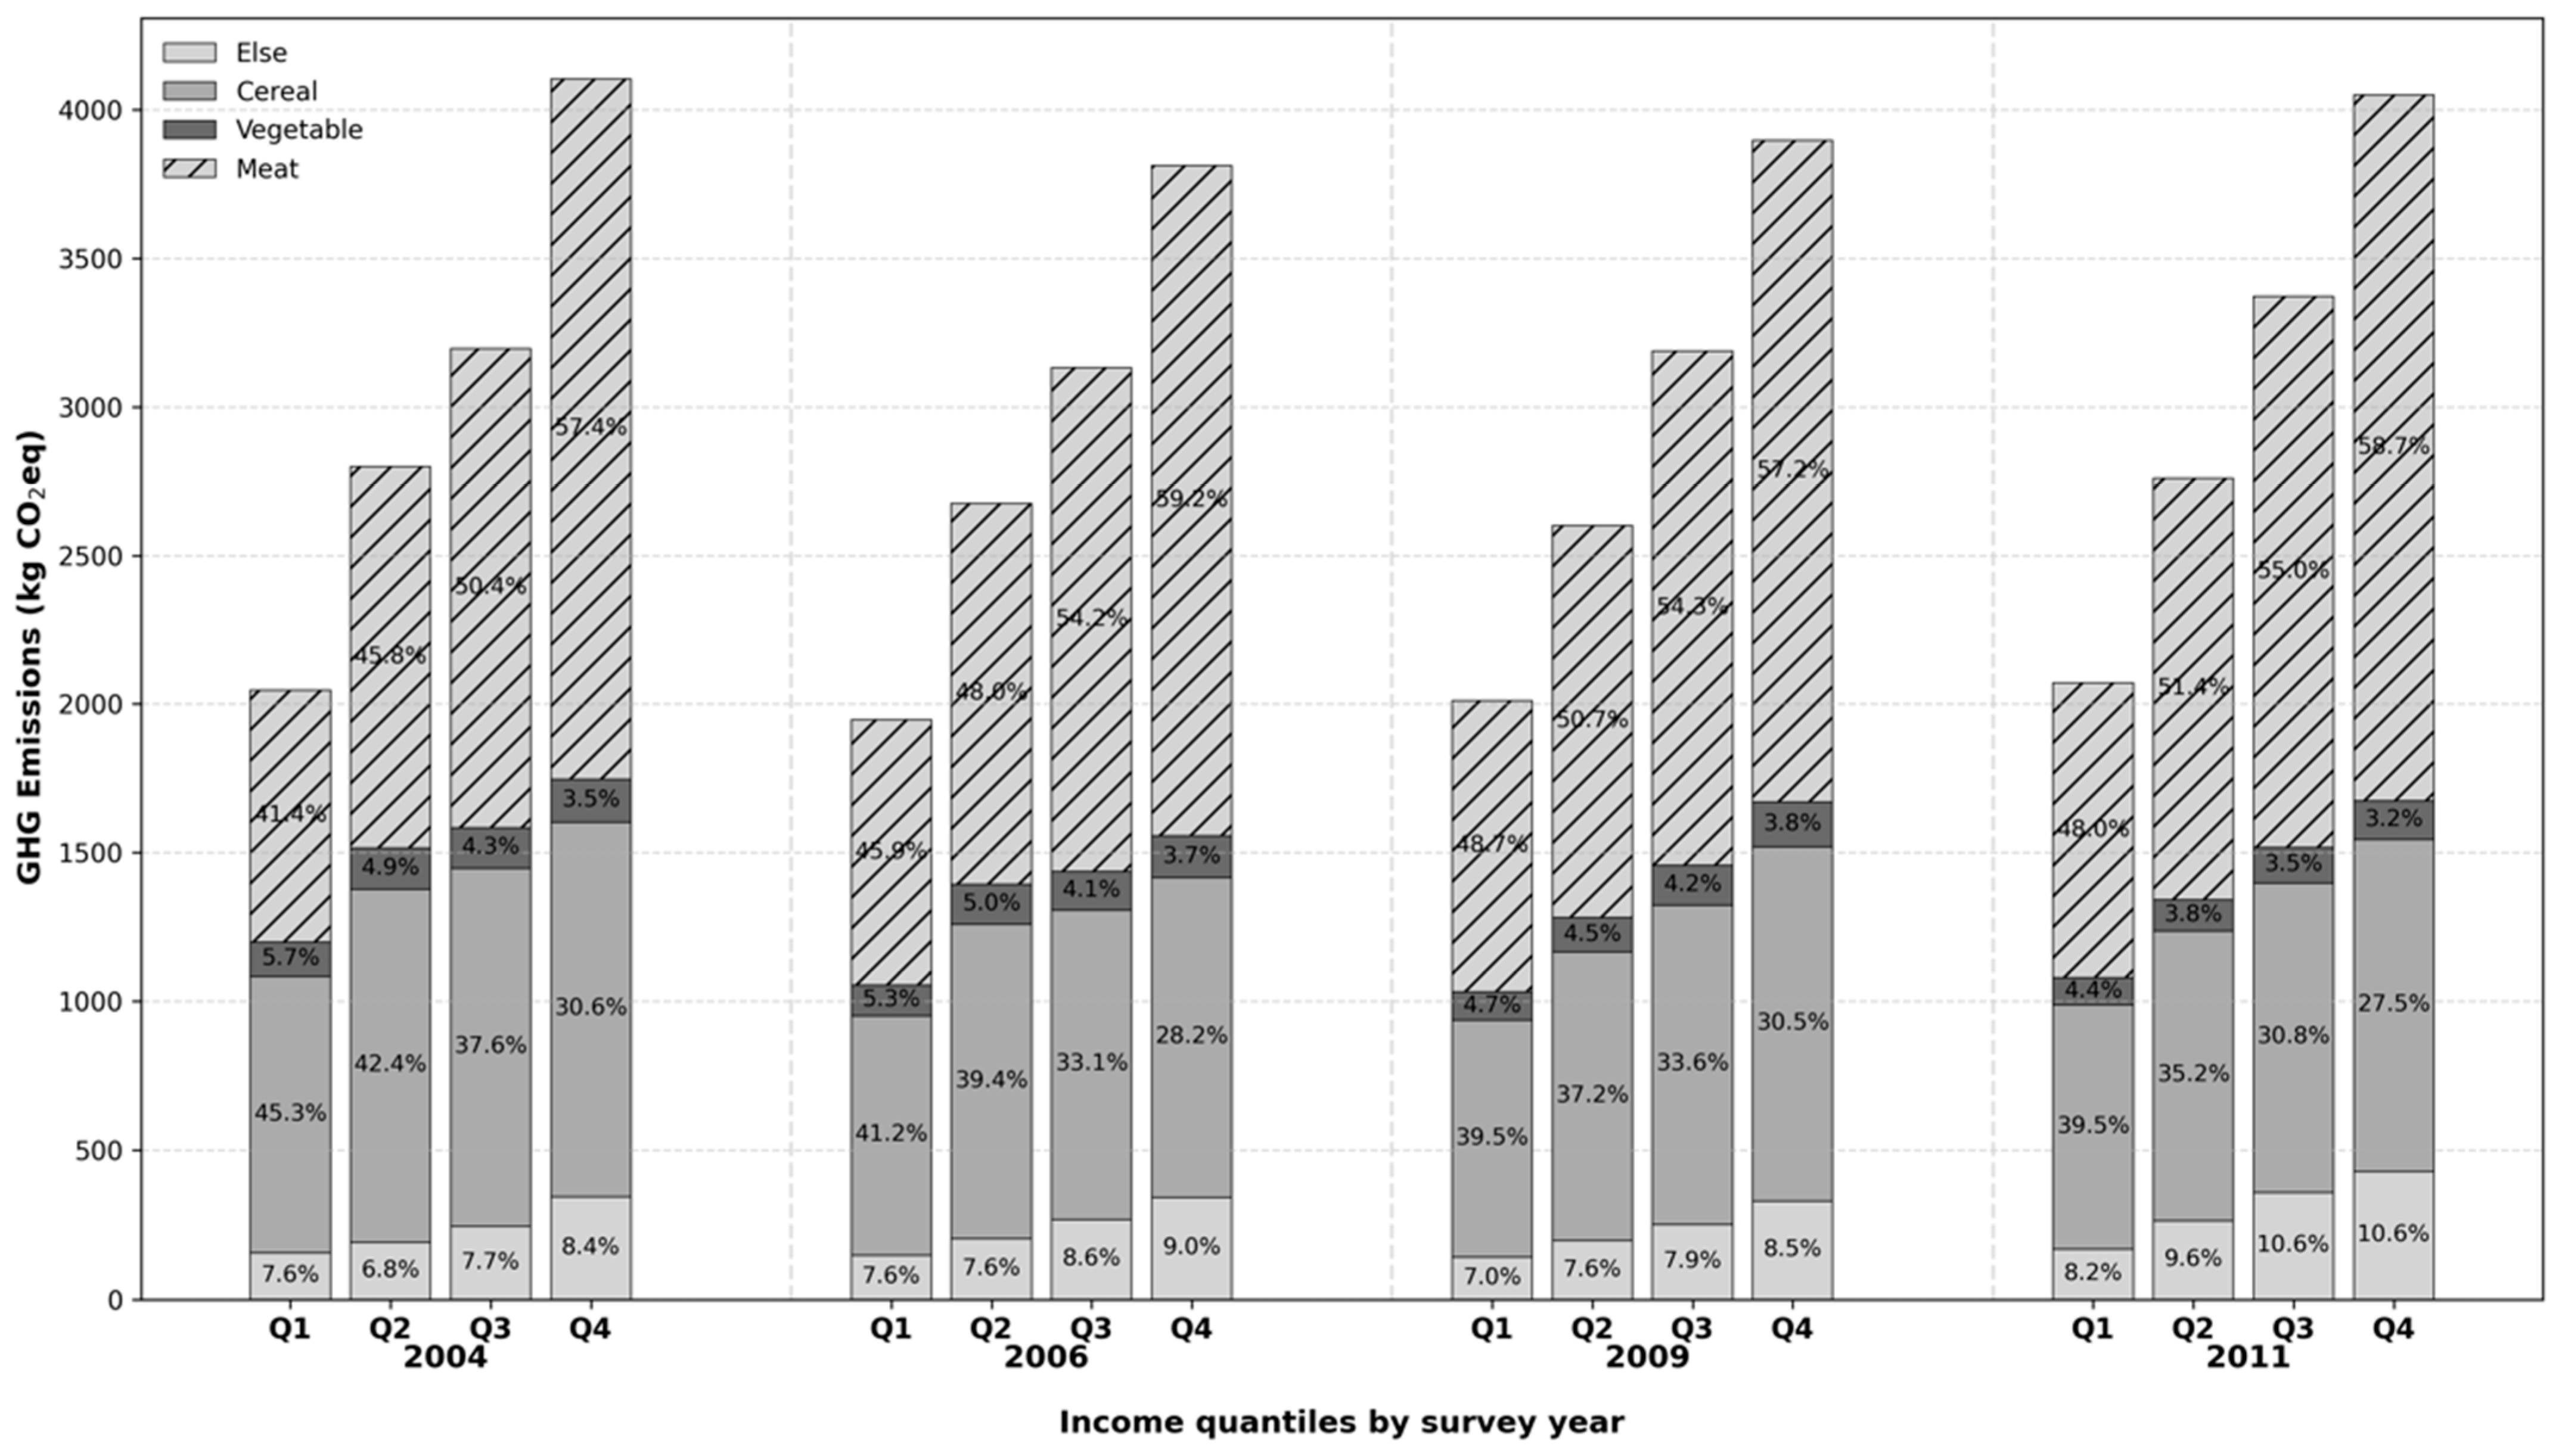
Table 2 reports annual per capita food consumption amounts and percentages for the high-income and low-income groups. High-income households consume more food overall (428.2 kg versus 400.1 kg), substantially less cereal and vegetables, and markedly more fruit and animal-source foods than low-income households. Animal food consumption in the high-income group is about 1.4 times that of the low-income group, and poultry consumption is nearly twice as high. Formal group-difference tests confirm that most of these amounts and share differences are statistically significant.
Taking household food consumption amount as the dependent variable, we regress it on household income and the other control variables, and the results are shown in
Table 3. For every 10,000-yuan increase in household income, the total food consumption amount of the full sample increases by about 4.5 kg on average. The increase is concentrated in low-income households, whose total food consumption rises by 16.4 kg, whereas the income effect for high-income households is statistically insignificant. This stable total consumption among high-income households helps explain why the post-threshold income effect on food-related emissions remains positive but becomes much smaller.
Carbon emissions per unit differ widely across food categories, with meat products emitting substantially more than most plant-based foods. According to Poore and Nemecek [
24], CO
2 emissions are 51.7 kg CO
2eq/kg for beef, 9.8 kg CO
2eq/kg for pork, 7.8 kg CO
2eq/kg for poultry, 4.2 kg CO
2eq/kg for eggs, 2.3 kg CO
2eq/kg for milk, 1.3 kg CO
2eq/kg for wheat, and 3.1 kg CO
2eq/kg for rice, while most vegetables and fruit are below 1 kg CO
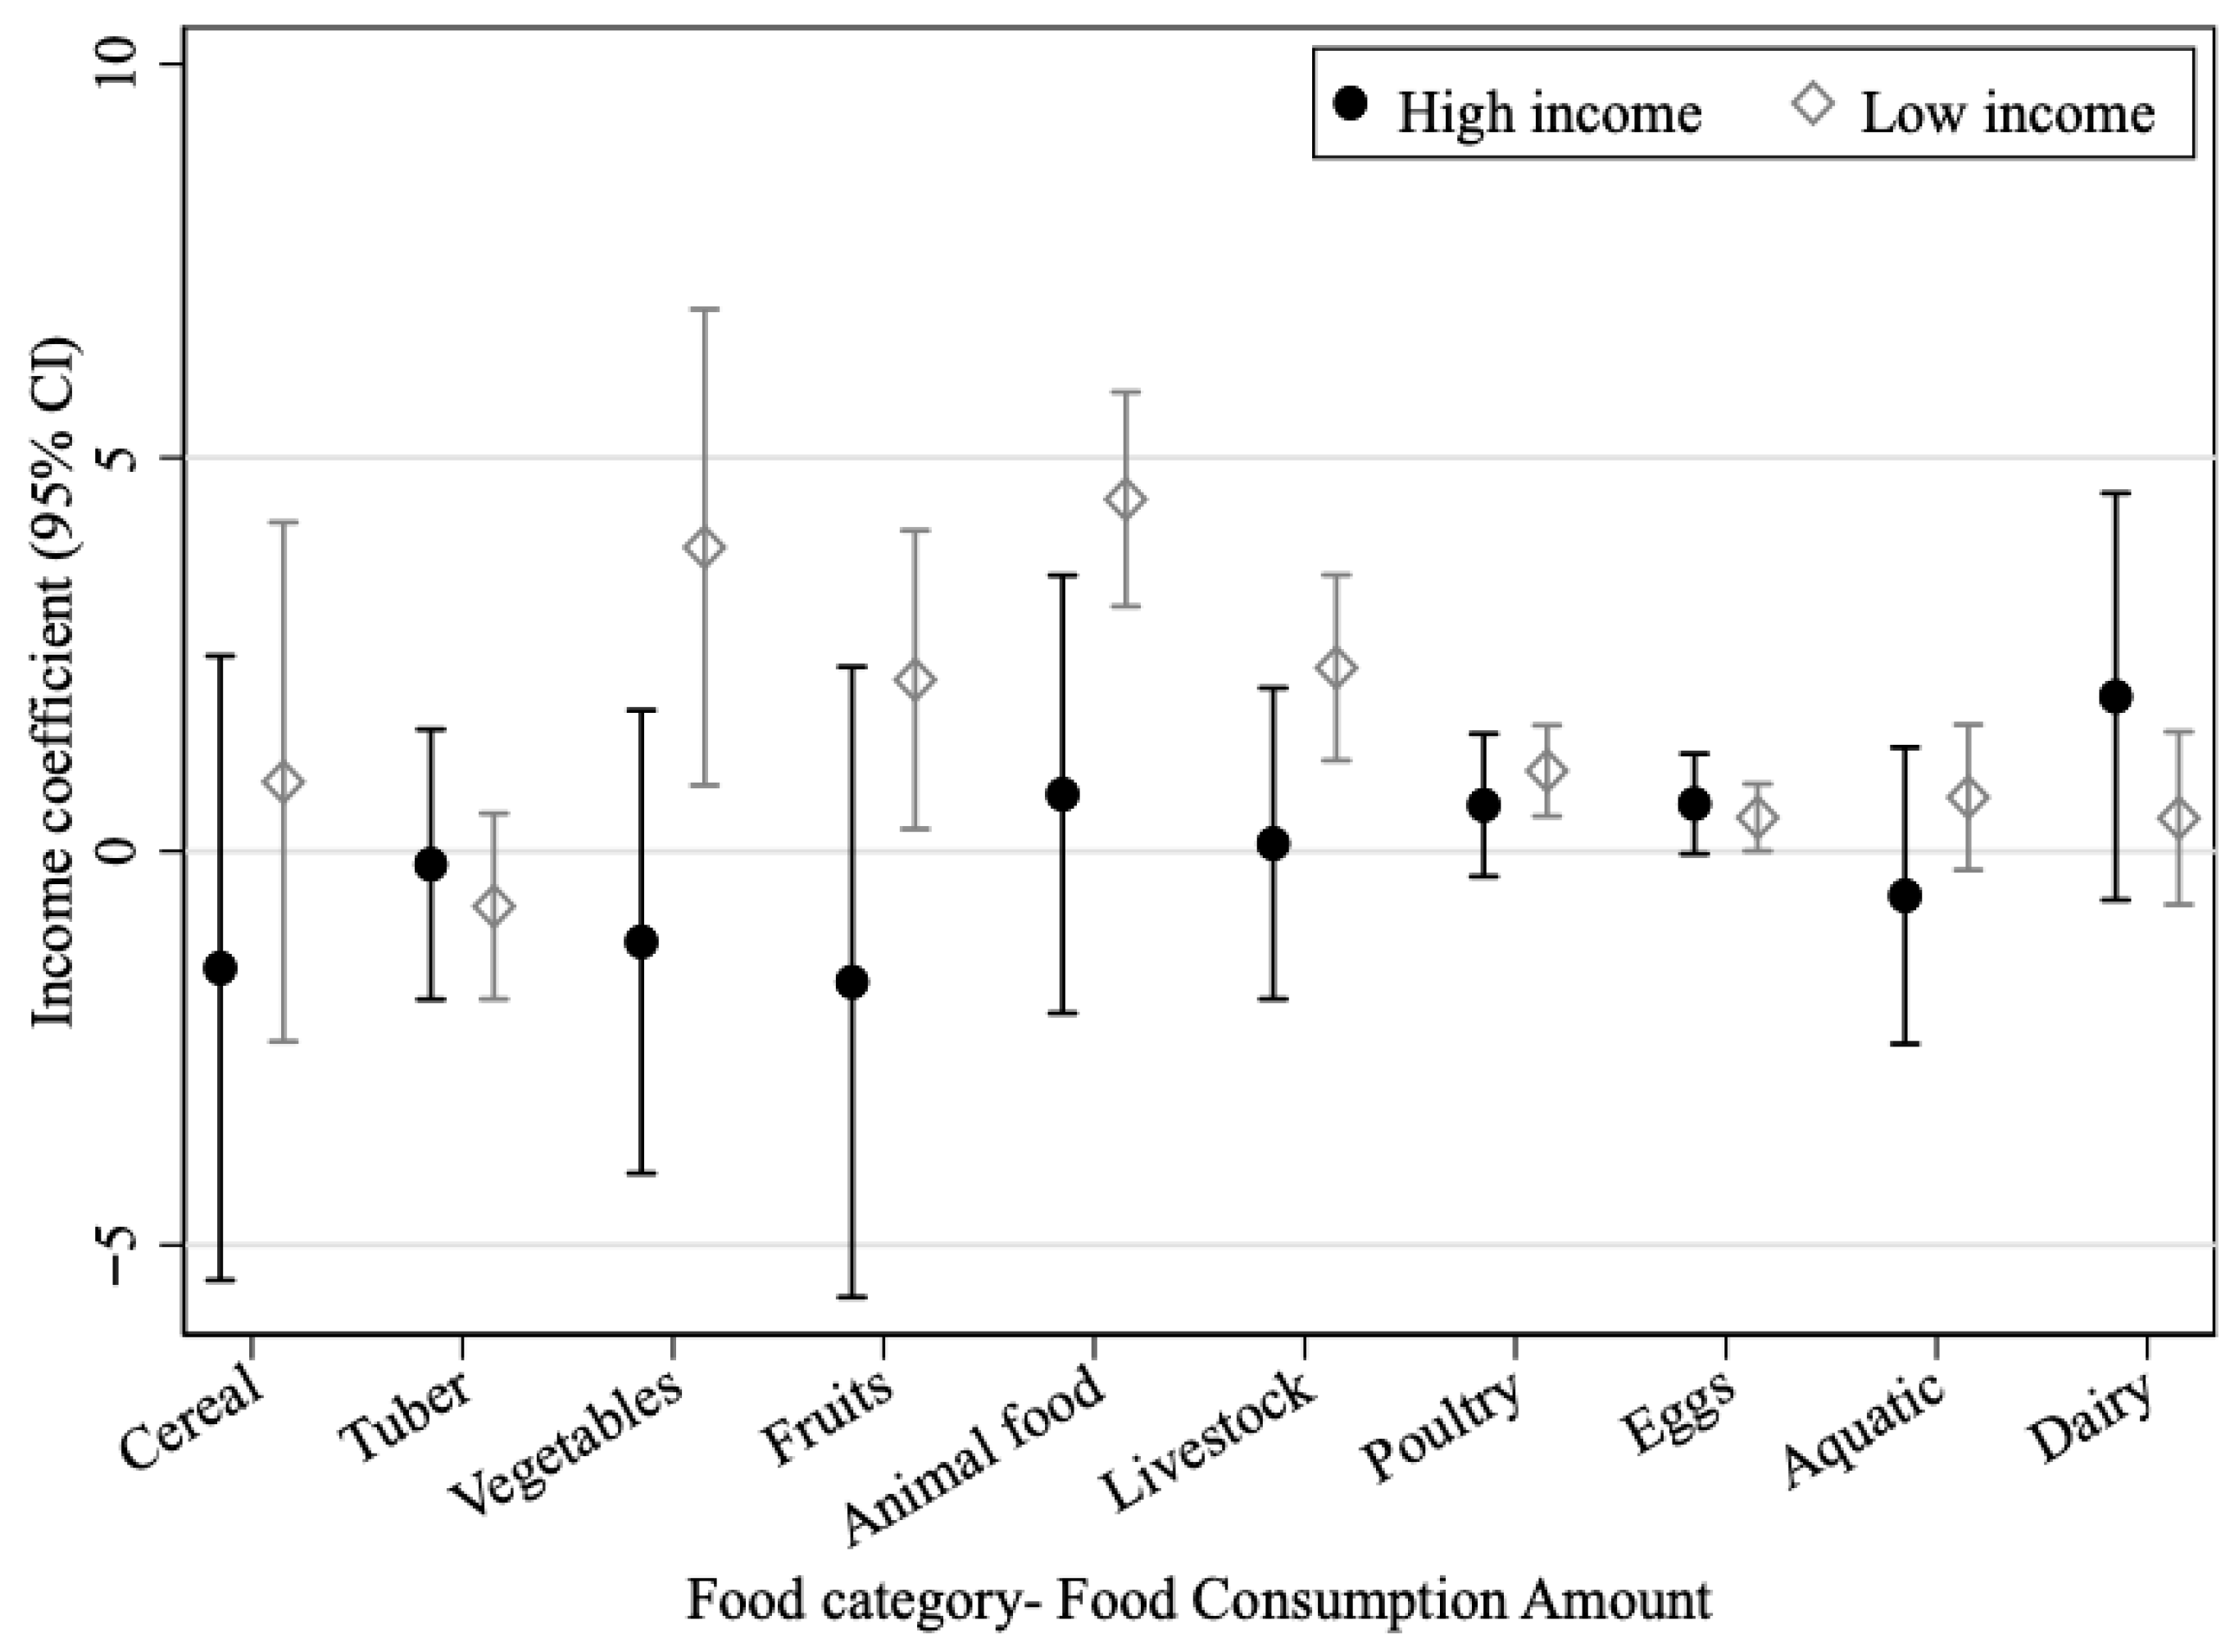
2eq/kg. Regressing category-specific food consumption amounts on household income, the results shown in
Figure 2 indicate that income growth among low-income households significantly increases vegetable, fruit, and animal food consumption. For every 10,000-yuan increase in income, animal food consumption rises by about 4.5 kg, including roughly 2.3 kg of livestock meat and 1.0 kg of poultry.
It is also worth noting that income growth significantly increases the consumption of vegetables and fruit among low-income households, while the income effect on cereal consumption is no longer statistically significant. This pattern suggests that rising income among lower-income households is associated with a broader diet and a higher demand for relatively carbon-intensive foods.
3.3. Income Impact on Food Consumption Structure
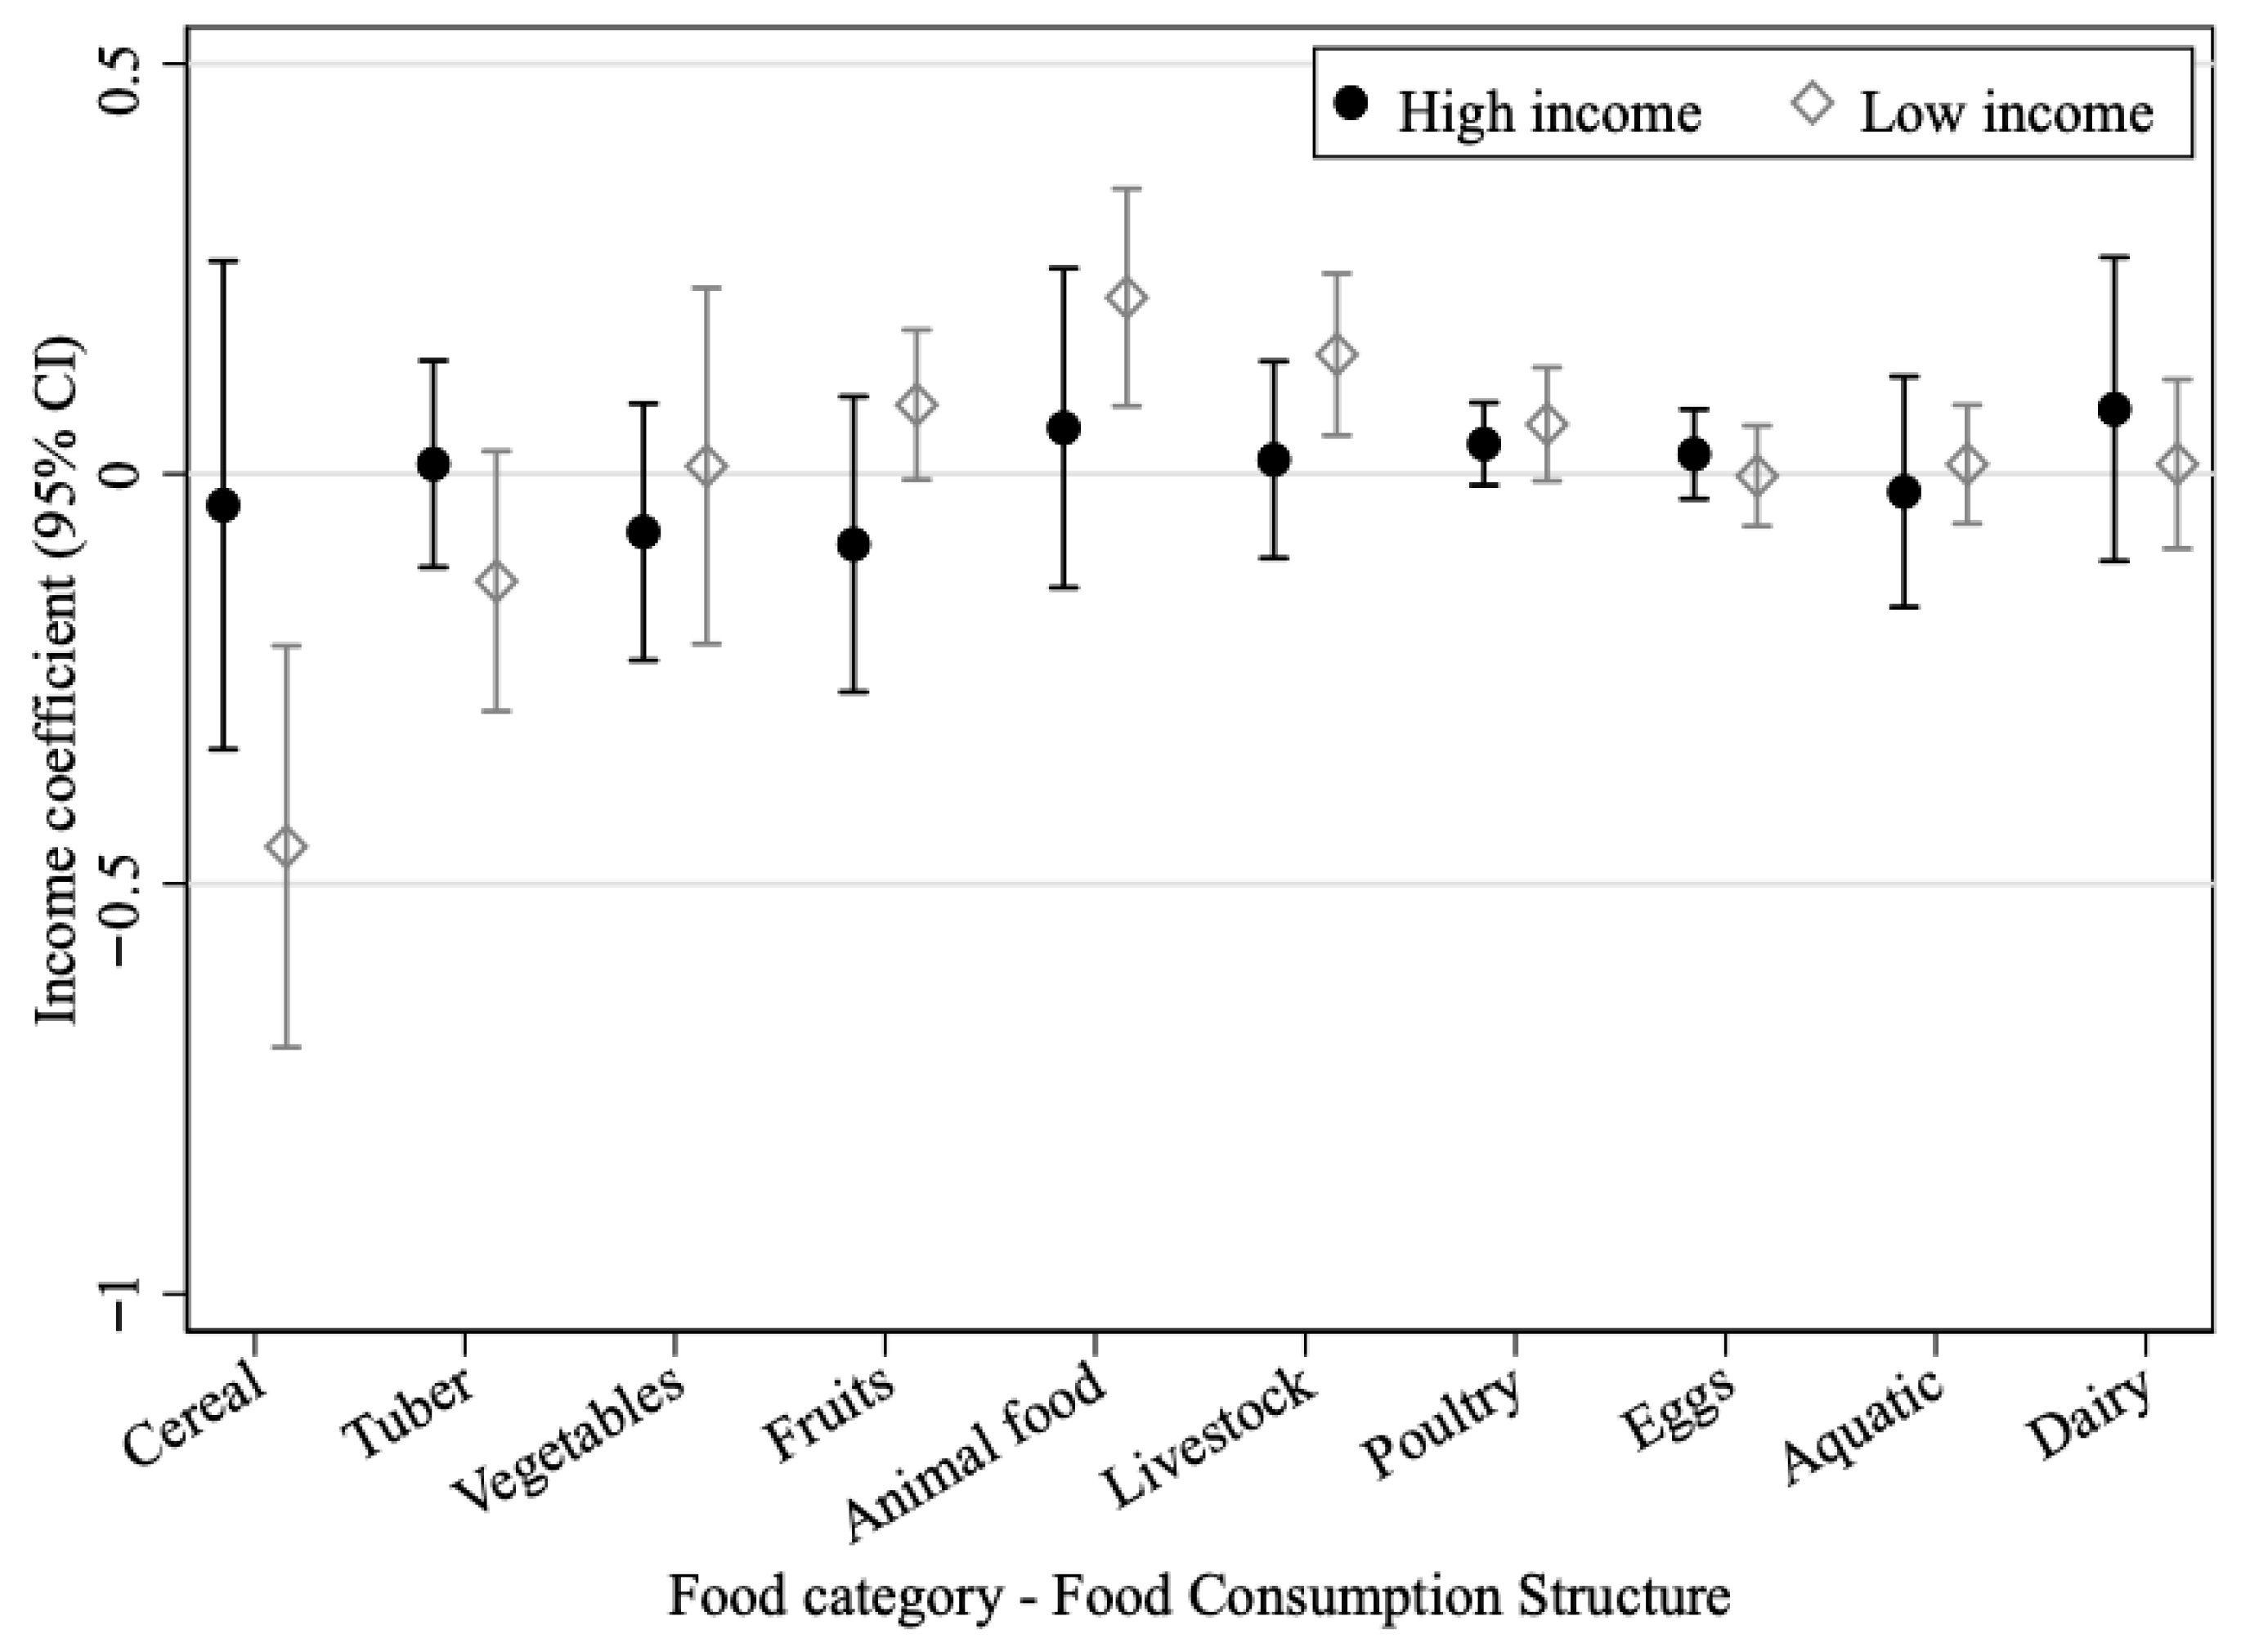
In addition to changes in the amount of food consumption, changes in the structure of food consumption are also of equal interest. We regress the percentage share of each food category on household income, and the results are displayed in
Figure 3.
For low-income households, the direction of the income effect on food-consumption shares is broadly consistent with the effect on absolute amounts. For every 10,000-yuan increase in income, the share of animal food rises by about 0.22 percentage points, the share of livestock rises by about 0.15 percentage points, and the share of cereal falls by about 0.45 percentage points. For high-income households, the income effects on food-consumption structure are statistically insignificant, which suggests a comparatively more stable dietary pattern within the sample period.
These results indicate partial convergence in dietary structure between income groups during the sample period rather than a complete convergence process. Because animal food generally has higher emissions per unit than plant food, the faster rise in animal-food demand among low-income households is consistent with a narrowing emissions gap across income groups. However, this sample-period pattern should not be interpreted as direct evidence that aggregate household food emissions will stabilize or decline in future periods.
3.4. Income Impact on Dietary Quality
After studying the income effect on household food consumption, the natural question is, does household dietary quality improve along with income growth? Clarifying the marginal effect of income on dietary quality can help to better predict the future trend of food-related carbon emissions. In addition, for policymakers, intervening in food overconsumption will have the dual effect of reducing carbon emissions and promoting the health of the population, while intervening in food under-consumption may be detrimental to the improvement of the quality of the population’s diets.
According to the recommended dietary intake provided by the Chinese Food Guide Pagoda (2022) [
28], households with per capita daily food consumption below the lower limit of the recommended range are labeled as “insufficient”, and those above the upper limit are labeled as “excess”. The resulting household dietary quality is shown in
Table 4. There is a serious imbalance in the food consumption of both groups: cereal is the most easily over-consumed food, with about 66.8% of high-income households and 74.3% of low-income households consuming cereal in excess; tuber crops, fruit, and dairy products are under-consumed by large majorities of households; and more than half of low-income households under-consume animal food. Under-consumption of fruit, animal food, and dairy products is less severe in the high-income group, whereas under-consumption of tuber crops and vegetables is more prevalent.
Following He et al. [
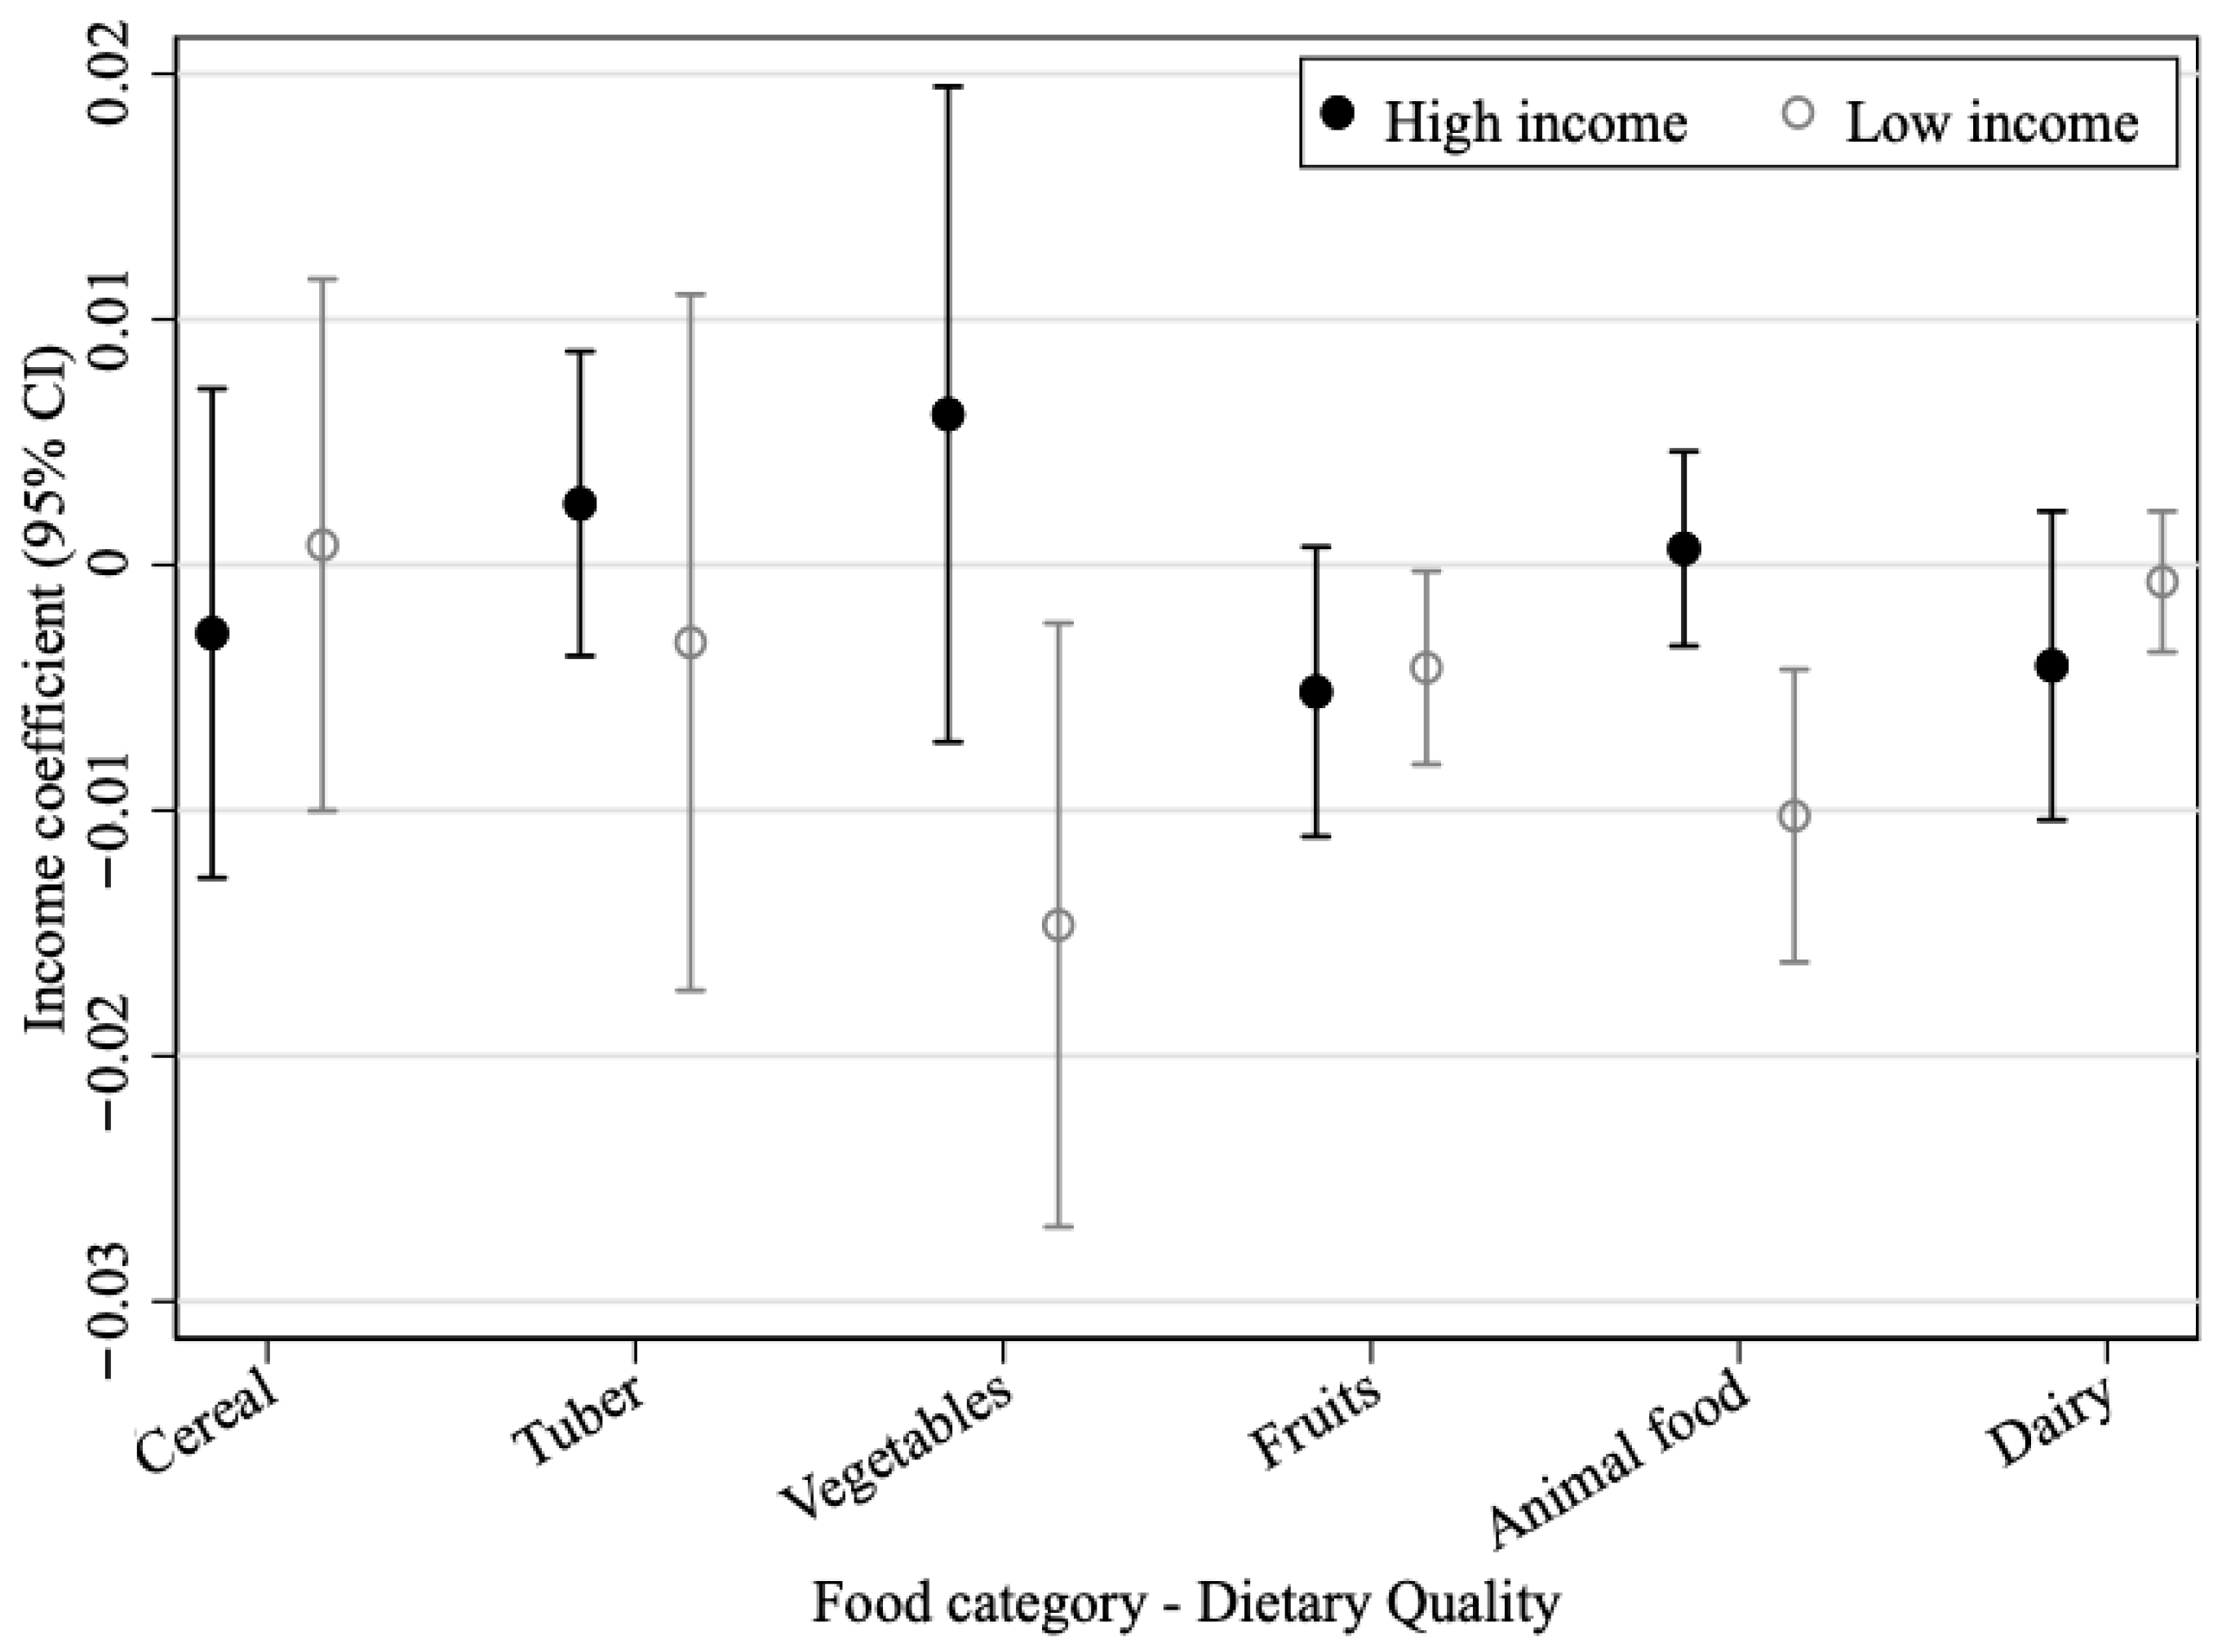
4], we calculate dietary deviation as zero when household consumption falls within the recommended interval; when consumption exceeds the upper bound, the difference between actual consumption and the upper bound is divided by the interval midpoint; and when consumption falls below the lower bound, the difference between the lower bound and actual consumption is divided by the same midpoint. Dietary deviation is therefore non-negative, with values closer to zero indicating better household dietary quality. Using these dietary deviations as the dependent variables, we regress them on household income and the other control variables, and the results are shown in
Figure 4.
The marginal change in dietary quality is not the same for the two groups. For high-income households, income has no statistically significant effect on the quality of the six food categories considered here. For low-income households, higher income significantly worsens the dietary quality of vegetables, fruit, and animal food. The deterioration of vegetables and fruit mainly reflects persistent under-consumption, whereas the deterioration of animal food is more consistent with excessive intake.
In general, China’s food consumption, except for cereal, is under-consumed to a large extent, and the implementation of intervention policies such as carbon taxes on staple foods at this stage may affect the quality of residents’ diets, especially in low-income households, which would harm social equity. Information intervention policies to popularize the knowledge of “green and low-carbon” diets and green agricultural policies are more worthy of consideration under the current development conditions. Finally, it is worth noting that dairy products, as a food with high nutritional quality and relatively mild carbon emissions, are generally under-consumed by both groups of households, and the trend of improvement with income is not significant, which may be constrained by the dietary habits of the Chinese population. Policymakers can guide residents to increase their consumption of dairy products as a substitute for meat, which has higher carbon emissions per unit, and that will have the dual effect of improving dietary quality and reducing carbon emissions.
4. Discussion and Limitations
4.1. Discussion
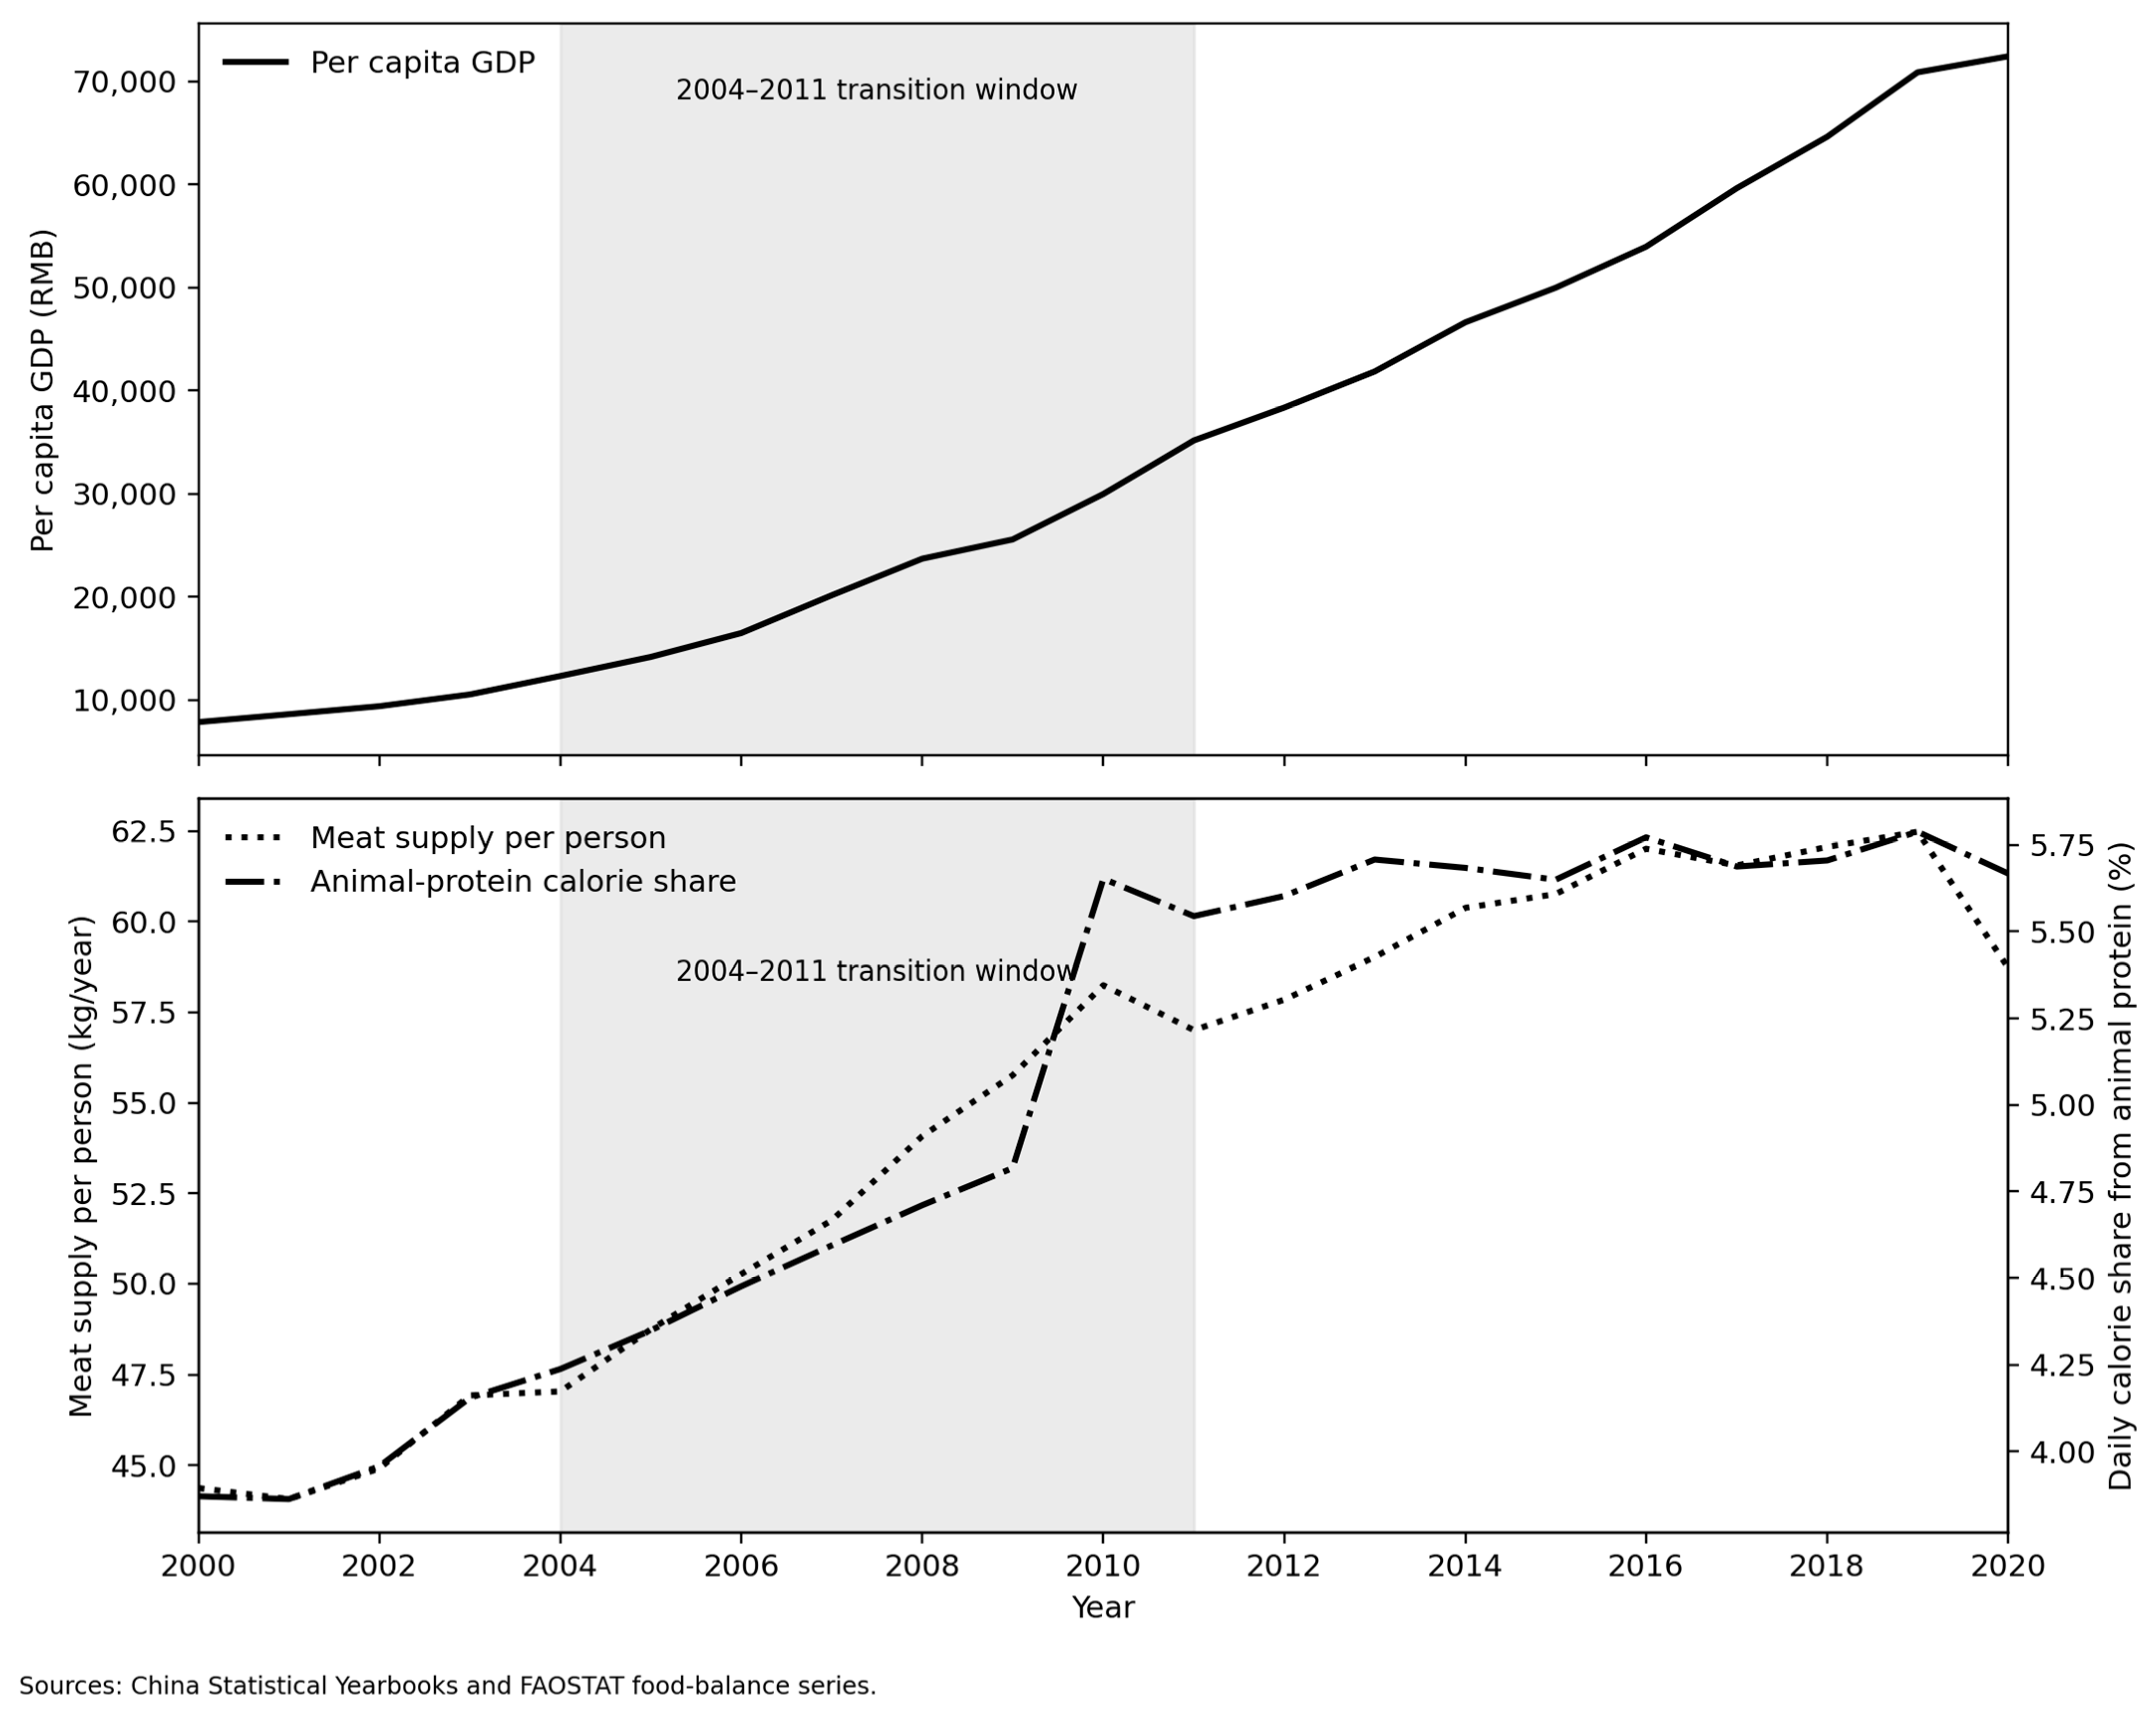
The 2004–2011 sample should be interpreted as a historically specific transition window rather than as a direct description of current Chinese households. Public data show that this was the period when rapid income growth, declining Engel coefficients, and the expansion of animal-source food consumption occurred simultaneously. For that reason, the sample is especially informative for identifying how rising income reshaped household food demand, dietary quality, and food-related carbon emissions during the active phase of dietary upgrading.
The threshold result is better understood as nonlinear heterogeneity than as evidence of an EKC turning point. Below the threshold, additional income is associated with faster growth in total food consumption and animal-source food demand; above the threshold, the marginal effect remains positive but becomes smaller. This pattern is consistent with partial demand saturation, but it may also reflect differences in preferences, habits, and nutritional upgrading rather than any automatic decarbonization mechanism.
The dietary-quality results reinforce this interpretation. Higher income among low-income households is associated with more animal food and fruit consumption, but it does not automatically produce a lower-carbon or fully balanced diet. The findings therefore suggest that the same process of dietary upgrading can improve some dimensions of diet while simultaneously intensifying carbon pressure. For that reason, the evidence should be treated as a mechanism-based interpretation of the 2004–2011 transition rather than as direct proof that future household food emissions will stabilize on their own.
4.2. Limitations
This study has several limitations. First, the sample period ends in 2011, so the results should be interpreted as evidence for a historically specific transition stage rather than as a direct description of present-day Chinese households. Although CHNS remains the most authoritative large-scale micro food-consumption dataset available for China, the 2015 CHNS does not provide the food-consumption module needed to extend the present analysis within the same household-level framework.
Second, household food-related carbon emissions are constructed from indirect global median emission factors rather than from direct observation of all household food-system activities. The analysis is therefore best suited to identifying the structure of dietary transition rather than to measuring every channel of food-related emissions, and the benchmark factors may not fully capture China-specific production conditions, technologies, and supply chains.
Third, the CHNS food-consumption module is based on a 72 h dietary recall. Although this method is standard in nutrition surveys, short recall windows may not fully capture each household’s longer-run dietary patterns, which introduces measurement error into the food-intake variables and the derived carbon-emission indicators.
Fourth, CHNS covers 12 provinces across eastern, central, and western China, but it is not nationally representative of all regions. The geographic scope of the sample should therefore be kept in mind when interpreting the findings, especially given the substantial changes in China’s food environment since 2011, including online food delivery, away-from-home eating, processed foods, cold-chain logistics, and broader supply-chain upgrading.
5. Conclusions and Policy Implications
5.1. Conclusions
Using CHNS household panel data for 2004–2011, this study identifies a nonlinear threshold relationship between income and household food-related carbon emissions in China. The main contribution of the analysis is not that it describes the current level of Chinese food emissions, but that it captures the active phase of dietary upgrading in which rising income, changing food structure, and increasing carbon pressure became tightly linked at the household level.
We find no evidence of a short-term EKC turning point in China’s food-related carbon emissions. Household income remains positively associated with food-related emissions, although the marginal effect declines once annual household income reaches 65,479 yuan. Among low-income households, income growth is associated with higher total food consumption and faster growth in relatively carbon-intensive foods, whereas the income effects on food-consumption amount and structure are statistically insignificant for high-income households during the sample period. These results indicate heterogeneity in dietary responses across income groups, but they should not be read as direct evidence that aggregate household food emissions will stabilize automatically over time.
5.2. Policy Implications
The policy implications of this study should be interpreted in light of the sample period. The results identify a structural relationship between income growth, dietary upgrading, and food-related carbon emissions during a critical transition stage in China; they should not be read as a mechanical forecast for present-day households. Even so, the evidence shows that food-related emissions do not decline automatically as incomes rise and that household dietary upgrading can intensify carbon pressure when it relies heavily on animal-source foods.
Policy responses should not be framed as shifting carbon-intensive food production abroad. Instead, the priority is to reduce emissions within China’s own food system while safeguarding food security. This requires continued support for low-carbon agricultural technologies, cleaner energy use in food production and logistics, more resilient domestic supply chains, and dietary guidance that encourages nutritionally balanced and lower-carbon food choices.
China’s food policy should also be continuously adjusted to guide the green transformation of the population’s food consumption. In the context of improving the lives of the population, “green and low-carbon” should be incorporated into national dietary guidelines and publicized. Foods such as livestock meat have significantly higher carbon emissions than plant foods and dairy products, which provide the same amount of protein. Residents should be encouraged to reduce their meat diets and increase their consumption of dairy products and plant foods, leading to a shift in their food consumption structure towards “less meat, more milk”.
Finally, against the backdrop of relatively stable food demand, carbon emissions reduction on the food production side needs to be given sufficient attention. China should actively promote carbon emissions reduction in the agricultural sector, improve the efficiency of energy utilization in the agricultural sector, and increase guidance and support for green energy technologies and energy-saving technologies at the policy level, including financial subsidies, tax exemptions, and other means, to form a benign development of the industry.