


Abstract
Carbonate thermochemical activation is a promising approach for modifying the mineralogical structure of nepheline–red mud mixtures prior to subsequent alkaline processing. However, quantitative statistical relationships between activation parameters and phase transformation remain insufficiently explored. In this study, Response Surface Methodology (RSM) combined with a Central Composite Design (CCD) was employed to develop and experimentally validate a quadratic regression model describing the influence of activation temperature, activation time, and NaHCO3 concentration on cancrinite formation. Quantitatively determined cancrinite content obtained by X-ray diffraction (XRD) phase analysis was selected as the mineralogical response variable, enabling direct statistical evaluation of cancrinite-forming transformation. The developed quadratic model was statistically significant (F = 21.24, p < 0.0001) and explained 95.5% of the variability in the measured response (R2 = 0.9550). Activation time exerted the strongest statistical influence on cancrinite formation, while activation temperature and NaHCO3 concentration also showed statistically significant effects; the investigated interaction terms were not statistically significant. Numerical optimization identified a favorable region for cancrinite formation, with a predicted maximum response of 22.75 wt.%. Three independent validation experiments performed at practically selected operating conditions of 260 °C, 4 h, and 110 g/L NaHCO3 yielded an average cancrinite content of 20.0 ± 1.0 wt.%. The principal novelty of the study lies in the use of quantitatively determined cancrinite content as the response variable in RSM, providing a direct statistical description of mineralogical transformation rather than optimization based solely on conventional technological responses. The developed model provides a quantitative framework for evaluating factor effects and identifying favorable activation conditions within the investigated experimental domain.
1. Introduction
The increasing demand for sustainable alumina production has intensified the search for alternative aluminum-bearing resources capable of complementing conventional bauxite feedstocks [1,2]. Simultaneously, growing environmental concerns associated with the accumulation of industrial waste have stimulated the development of integrated technologies aimed at improving resource efficiency and promoting circular economy principles [3,4,5,6]. Among the most promising alternative resources are nepheline ores and Bayer red mud, which contain considerable amounts of alumina but remain underutilized because of their complex mineralogical composition and relatively low chemical reactivity [7]. Their integrated utilization offers significant potential for reducing industrial waste while expanding the raw material base for sustainable alumina production [8].
Nepheline ores have long been recognized as one of the most promising non-bauxitic raw materials for alumina production because of their substantial aluminum content and extensive geological distribution [9]. However, unlike bauxite, nepheline is characterized by a highly stable aluminosilicate framework that exhibits limited reactivity under conventional alkaline leaching conditions. As a consequence, efficient alumina recovery requires preliminary activation to modify the mineralogical structure and increase the accessibility of aluminum-bearing phases. Among these approaches, carbonate thermochemical activation has emerged as a particularly promising strategy because it simultaneously promotes aluminosilicate dissolution, carbonate-assisted recrystallization, and the formation of reactive secondary mineral phases, thereby enhancing the efficiency of subsequent hydrometallurgical processing [10,11,12,13].
Although nepheline ores and Bayer red mud have been extensively investigated as individual aluminosilicate resources, considerably fewer studies have addressed their integrated processing [14,15]. The combined utilization of these materials has recently attracted increasing attention because it enables the simultaneous valorization of industrial waste and the improvement of alumina recovery through synergistic mineralogical transformations [16,17]. Under carbonate thermochemical activation conditions, dissolution–reprecipitation reactions promote the redistribution of aluminum and silicon species, resulting in the formation of secondary aluminosilicate phases with enhanced chemical reactivity [18,19,20]. Among these phases, cancrinite is of particular importance because its formation reflects the restructuring of the aluminosilicate framework into a more reactive mineral assemblage, thereby facilitating subsequent alkaline leaching and alumina recovery [21,22,23,24].
Despite the considerable progress achieved in understanding the mineralogical transformations occurring during carbonate thermochemical activation of nepheline-bearing materials, most previous studies have focused primarily on phase characterization, reaction mechanisms, and subsequent alumina recovery [25,26]. Considerably less attention has been devoted to the statistical interpretation of these transformations and to the quantitative evaluation of the relative influence of activation parameters on secondary phase formation [27,28]. Furthermore, published Response Surface Methodology (RSM) studies have predominantly focused on optimizing technological responses, such as extraction efficiency or product yield. Consequently, the statistical relationship between thermochemical activation parameters and quantitatively determined mineralogical characteristics has remained insufficiently explored [29,30].
The present study addresses this research gap by applying Response Surface Methodology (RSM) to statistically describe the influence of thermochemical activation parameters on mineralogical transformation in nepheline–red mud mixtures using measured cancrinite content determined by quantitative X-ray diffraction (XRD) phase analysis as the response variable. The objective of this study was to develop, statistically evaluate, and validate a quadratic regression model describing cancrinite formation as a function of activation temperature, activation time, and NaHCO3 concentration, and to statistically assess the experimentally established activation conditions governing carbonate thermochemical activation. The proposed statistical approach provides a quantitative framework for selecting thermochemical activation conditions on the basis of mineralogical transformation rather than solely technological performance.
2. Results and Discussion
2.1. Development and Evaluation of the Quadratic Regression Model
A quadratic regression model was developed to describe the relationship between the thermochemical activation parameters and the measured cancrinite content determined by quantitative XRD analysis. The adequacy and statistical significance of the model were evaluated by analysis of variance (ANOVA), and the results are summarized in Table 1.
Table 1.
Analysis of variance (ANOVA) for the quadratic regression model describing the measured cancrinite content determined by quantitative XRD analysis.
The developed regression model was statistically significant, with a model F-value of 21.24 and a corresponding p-value below 0.0001. The coefficient of determination (R2 = 0.9550) indicated that approximately 95.5% of the variability in the measured cancrinite content was described by the quadratic model. The Adjusted R2 value of 0.9101 further indicated a good fit of the model to the experimental dataset, whereas the lower Predicted R2 value of 0.6731 suggested reduced predictive performance for new observations compared with the descriptive performance of the fitted model. An Adequate Precision value of 12.87, substantially exceeding the recommended minimum value of four, indicated an adequate signal-to-noise ratio for navigation within the investigated experimental domain.
The ANOVA results revealed that activation time (factor B) exerted the strongest statistical influence on cancrinite formation, while both NaHCO3 concentration (factor C) and activation temperature (factor A) also exhibited statistically significant effects. Among the interaction terms, no statistically significant interactions were observed between the investigated variables, whereas all quadratic terms (A2, B2, and C2) were statistically significant. These results indicate that the response is primarily governed by nonlinear effects of the individual activation parameters rather than by strong interactions between them.
The Lack-of-Fit test was statistically significant (p = 0.0117), indicating that the quadratic model does not capture all systematic variability in the experimental response. This result was therefore considered together with the residual diagnostics and other model-performance statistics when evaluating the applicability of the model.
Based on the fitted quadratic regression model, the predictive equation in terms of coded factors was obtained as follows:
where Y is the predicted cancrinite content (wt.%), and A, B, and C represent the coded values of activation temperature, activation time, and NaHCO3 concentration, respectively. The coded equation enables comparison of the relative contributions of the investigated factors because the coefficients are expressed on a common dimensionless scale.
Y = 24.66 + 1.49A + 6.59B + 2.13C + 0.8750AB + 0.1250AC + 1.63BC − 5.19A2 − 2.01B2 − 2.01C2
For prediction using the actual experimental units, the corresponding equation is:
where A is the activation temperature (°C), B is the activation time (h), and C is the NaHCO3 concentration (g/L). Equation (2) can be used to calculate the predicted cancrinite content within the investigated experimental domain using the factors expressed in their original units.
Y = −135.23326 + 1.03522A + 1.18163B + 0.375339C + 0.007000AB + 0.000083AC + 0.021667BC − 0.002075A2 − 0.320801B2 − 0.002228C2
Despite the high coefficient of determination (R2 = 0.9550) and Adjusted R2 (0.9101), the lower Predicted R2 (0.6731) and the statistically significant Lack-of-Fit (p = 0.0117) indicate limitations in the predictive capability of the quadratic model. The difference of 0.237 between the Adjusted and Predicted R2 indicates that the model describes the experimental dataset more effectively than it predicts new observations. This discrepancy may reflect the complexity of the hydrothermal dissolution–reprecipitation process, experimental variability associated with quantitative XRD phase determination, and mineralogical nonlinearities that cannot be fully represented by a second-order polynomial model. Therefore, the developed model should primarily be considered an empirical statistical tool for quantifying the effects of the investigated activation parameters and identifying favorable operating regions within the experimental domain, rather than a universally predictive model.
2.2. Diagnostic Evaluation of the Regression Model
Following the ANOVA, the adequacy and predictive capability of the developed quadratic regression model were further assessed using standard diagnostic plots generated by Design-Expert® software. These diagnostic analyses were performed to verify the assumptions of regression analysis and to evaluate the reliability of the proposed response surface model.
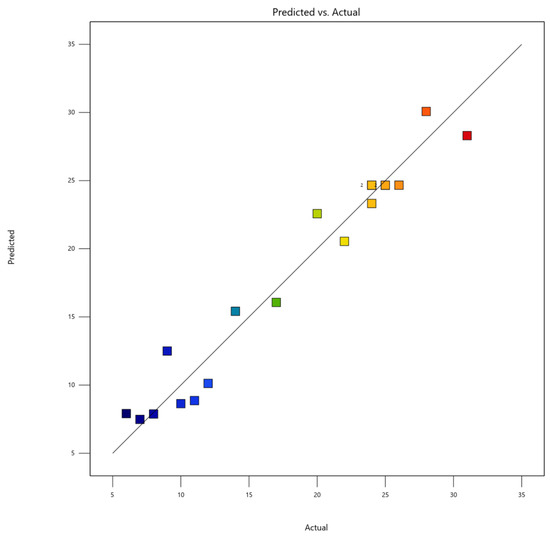
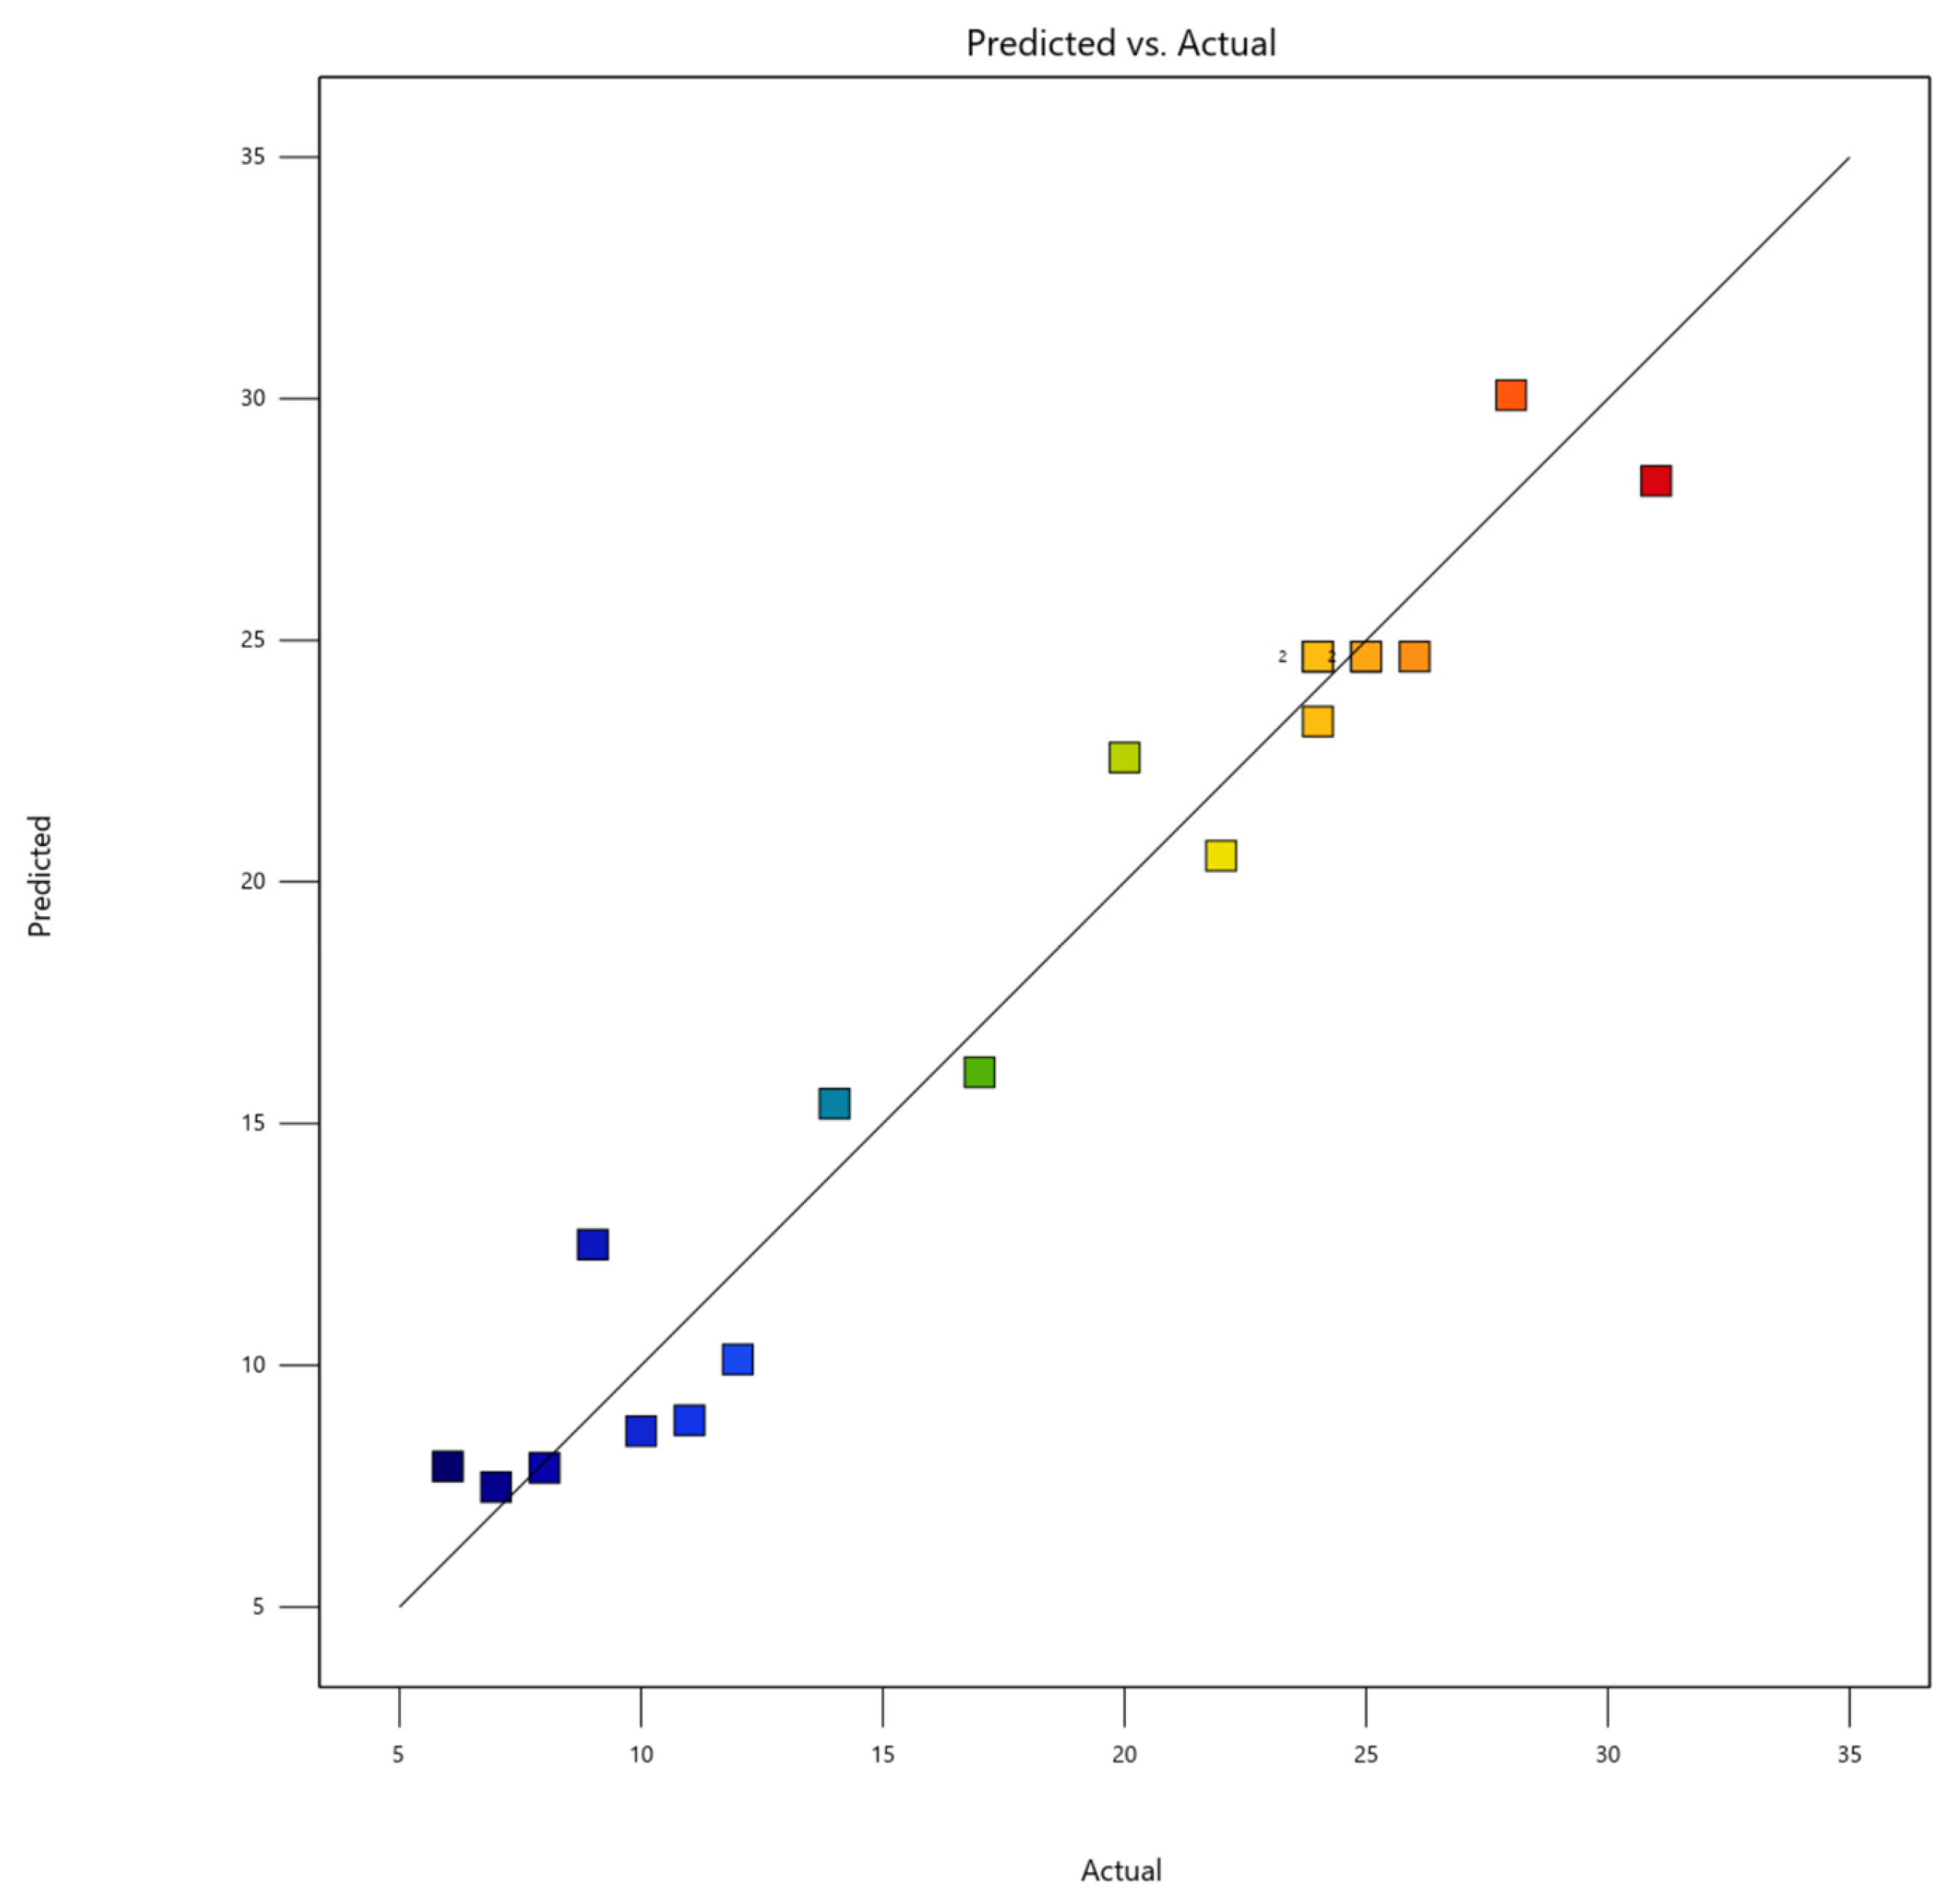
The agreement between the experimentally measured and model-predicted cancrinite contents is presented in Figure 1. Each point represents an individual experimental run of the CCD, with the experimentally measured cancrinite content plotted against the corresponding model-predicted value. The color scale represents the magnitude of the cancrinite response (wt.%), ranging from lower to higher measured cancrinite contents.
Figure 1.
Predicted versus experimentally measured cancrinite content obtained from the developed quadratic regression model. Each point represents an individual CCD experimental run, and the color scale indicates the magnitude of the measured cancrinite content (wt.%).
The distribution of the experimental data around the diagonal line indicates reasonable agreement between the observed and model-predicted values, supporting the descriptive adequacy of the fitted model within the investigated experimental domain.
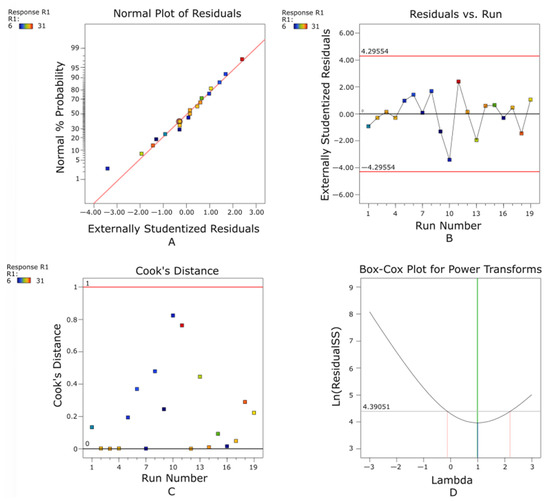
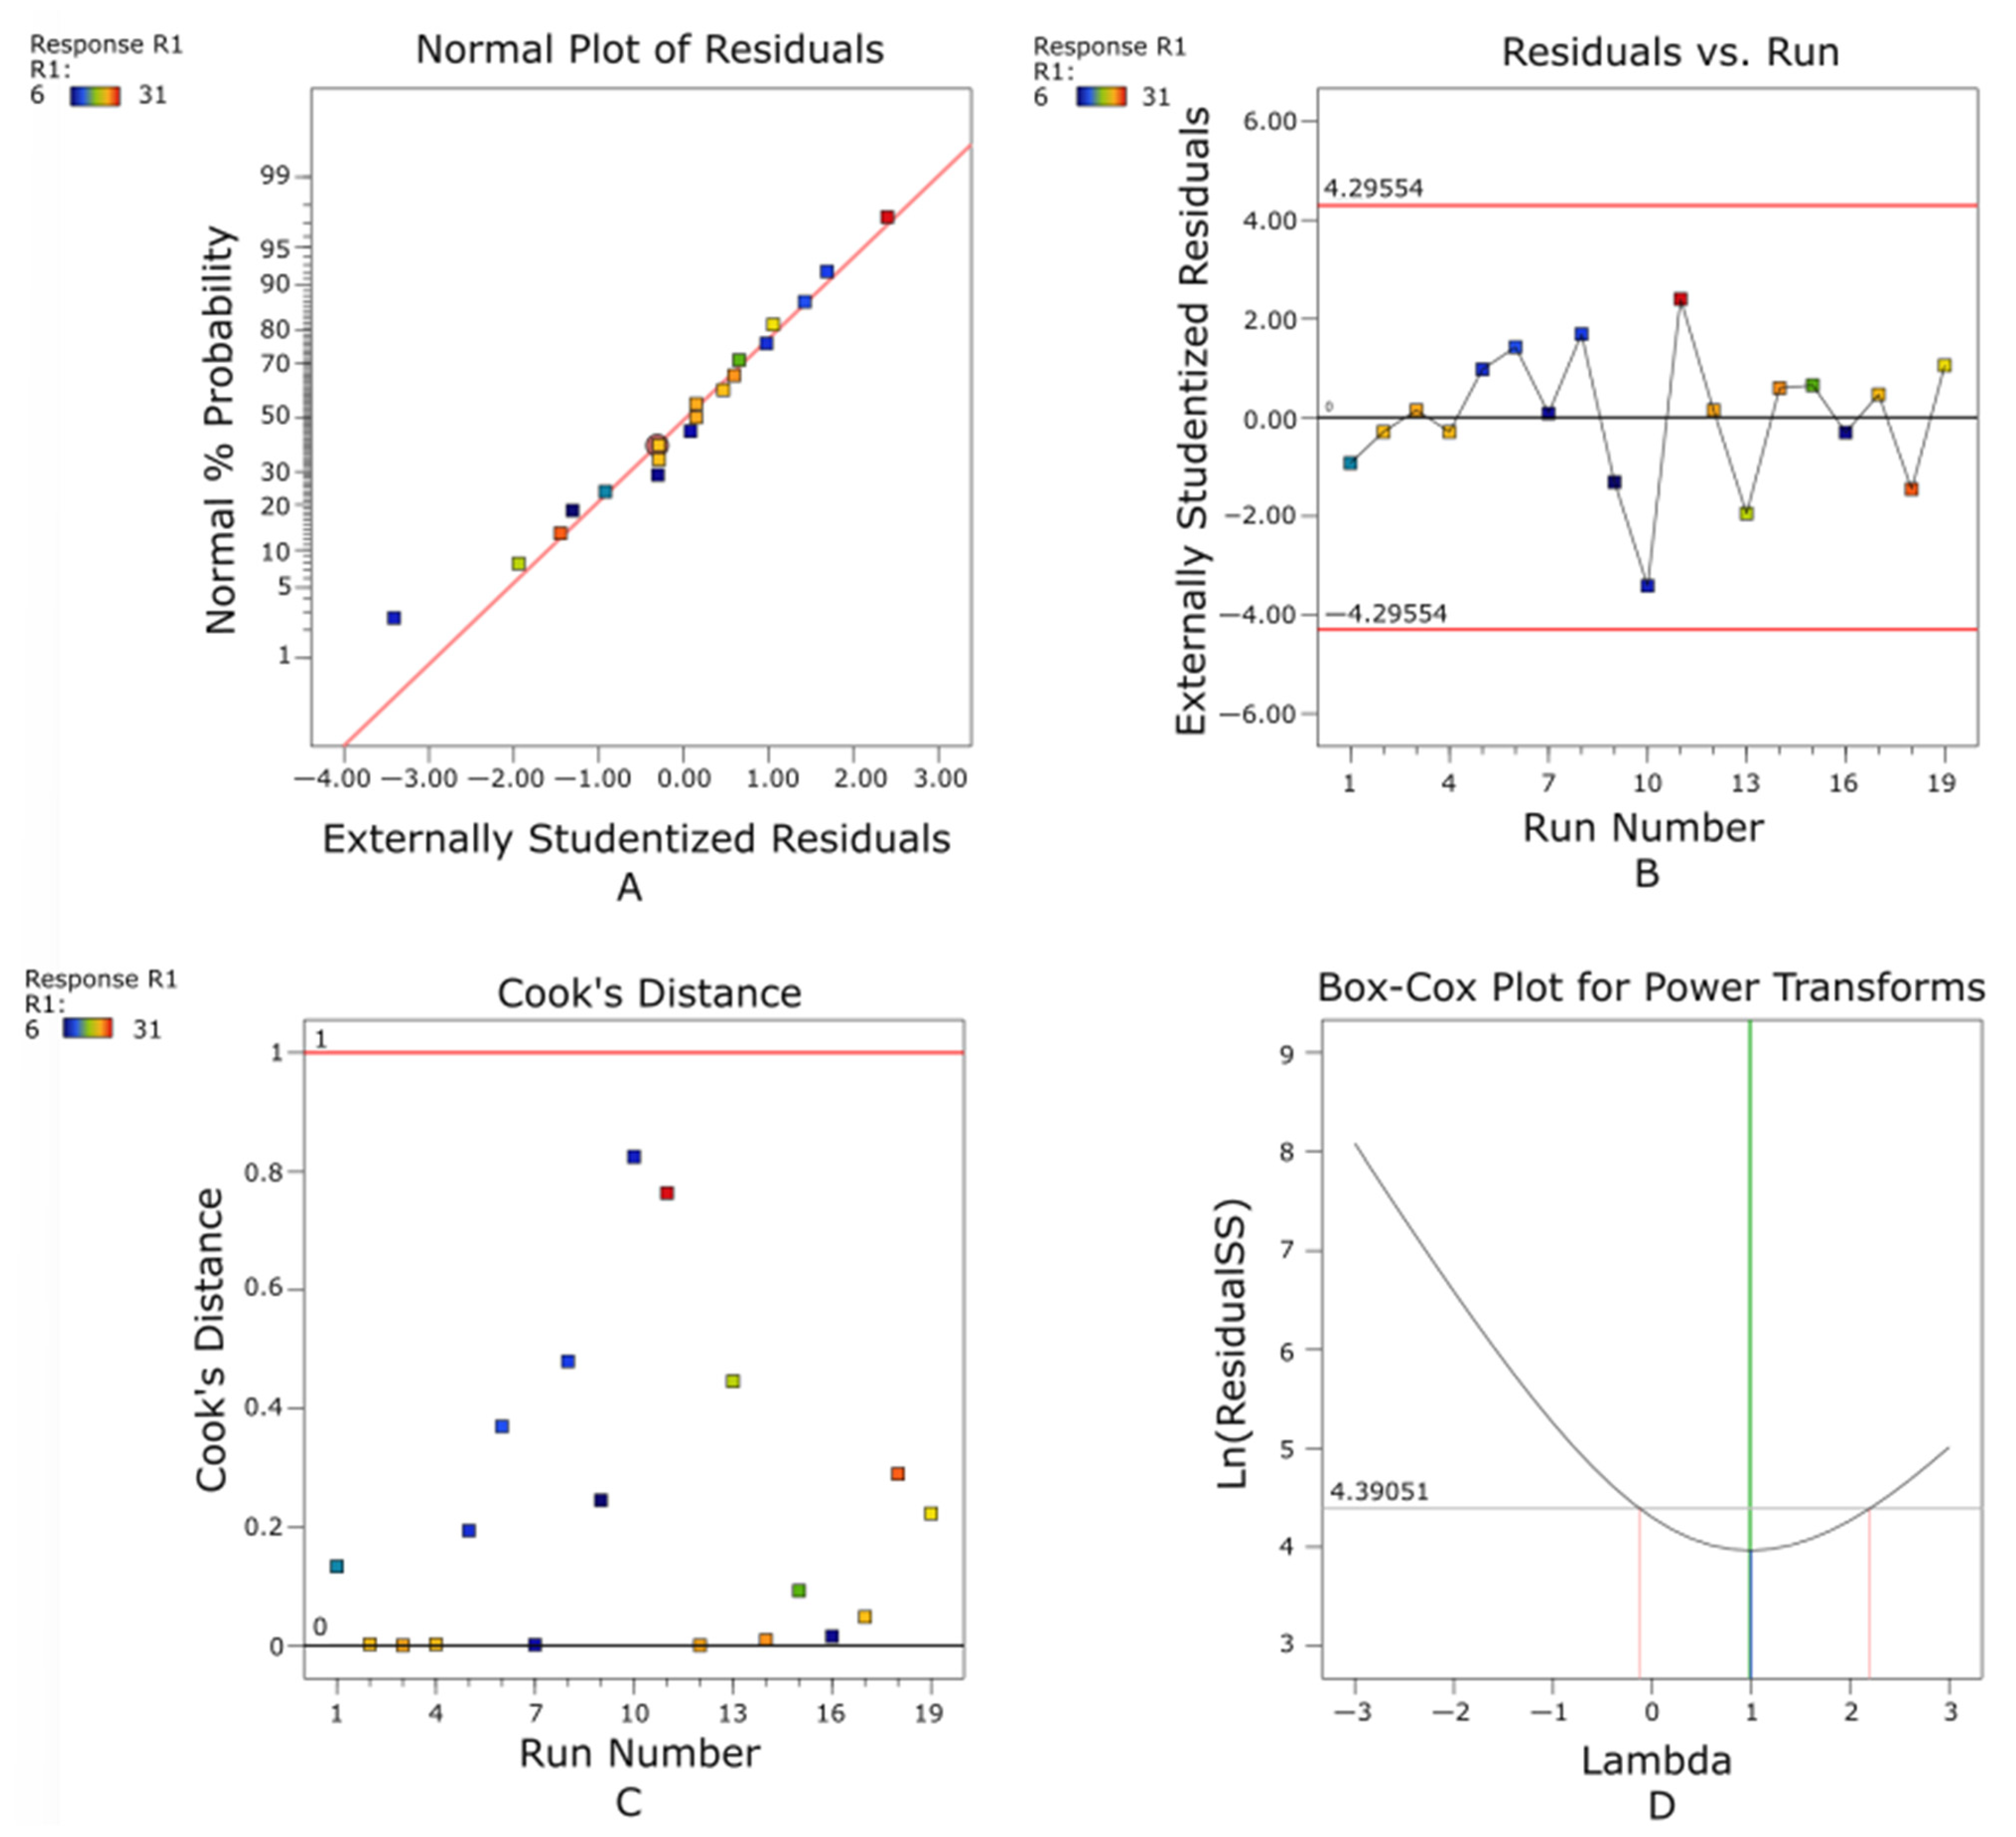
The normal probability plot of externally studentized residuals (Figure 2A) shows that the residuals are distributed approximately along the reference line, with no pronounced systematic deviation from linearity. This diagnostic plot is used to assess the approximate normality of the residual distribution rather than to quantify the predictive correlation of the regression model; therefore, a separate correlation coefficient was not calculated for this plot.
Figure 2.
Diagnostic plots of the developed quadratic regression model: (A) normal probability plot; (B) residuals versus predicted values; (C) Cook’s distance; (D) Box–Cox plot.
The plot of residuals versus predicted values Figure 2B demonstrates a random distribution of residuals around the zero line without any apparent trend or funnel-shaped pattern. This behavior confirms the homogeneity of variance and indicates that the regression model does not exhibit systematic prediction errors within the investigated design space.
The influence of individual experimental observations on the fitted regression model was evaluated using Cook’s distance (Figure 2C). All Cook’s distance values remained below the diagnostic threshold of 1, indicating that no individual experimental run exerted an excessively dominant influence on the fitted model.
The Box–Cox plot Figure 2D was employed to evaluate the necessity of response transformation. The optimum transformation parameter corresponded to λ = 1, indicating that no mathematical transformation of the response variable was required. Consequently, the original experimental data were considered appropriate for regression modeling without additional data manipulation.
Overall, the diagnostic analyses showed no pronounced systematic pattern in the residuals or excessively influential individual observations. Considered together with the ANOVA and model-performance statistics, these results indicate that the quadratic model provides an adequate empirical representation of cancrinite formation for interpretation of factor effects and identification of favorable operating regions within the investigated experimental domain. The statistically significant Lack-of-Fit and the lower Predicted R2 are nevertheless taken into account when interpreting the predictive capability of the model.
2.3. Response Surface Analysis
2.3.1. Effect of Activation Temperature and Time on Cancrinite Formation
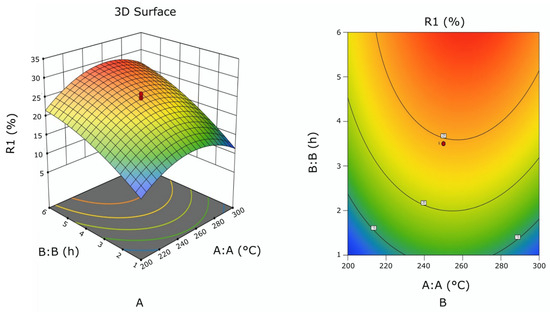
The combined influence of activation temperature and treatment time on cancrinite formation is illustrated in Figure 3. The NaHCO3 concentration was maintained at its central level (90 g/L) to isolate the effects of these two variables.
Figure 3.
(A) three-dimensional response surface showing the combined effect of activation temperature and activation time on cancrinite formation at a constant NaHCO3 concentration of 90 g/L; (B) contour plot illustrating the combined influence of activation temperature and activation time on cancrinite formation.
As shown in Figure 3A, the cancrinite content increased progressively with increasing activation temperature and treatment time, demonstrating that both parameters play essential roles in promoting carbonate thermochemical transformation. At relatively low temperatures (approximately 200–220 °C), only limited cancrinite formation was observed regardless of activation time, indicating that these temperature conditions were insufficient to promote extensive transformation of the primary aluminosilicate framework within the investigated treatment period.
Increasing the activation temperature accelerated the dissolution of nepheline and aluminosilicate phases contained in the red mud, resulting in an increased concentration of dissolved aluminum and silicon species available for secondary mineral formation. Simultaneously, prolonged activation time promoted the dissolution–reprecipitation process, allowing carbonate-bearing cancrinite crystals to nucleate and grow progressively. Consequently, the response surface exhibited a continuous increase toward the optimum region.
The response reached its maximum at temperatures close to 260–270 °C and activation times of approximately 5–6 h. Beyond this region, the response surface gradually approached a plateau, indicating that additional increases in temperature or treatment duration produced only marginal improvements in cancrinite formation. This behavior suggests that the mineralogical transformation approached equilibrium once the majority of the reactive aluminosilicate phases had been converted into secondary carbonate-bearing products.
The contour plot presented in Figure 3B exhibits smooth elliptical contours rather than highly distorted or inclined shapes. This observation agrees well with the ANOVA results, which indicated that the interaction between activation temperature and treatment time was statistically insignificant, whereas the quadratic effects of both variables were highly significant. Therefore, the observed curvature of the response surface primarily reflects the nonlinear kinetics of aluminosilicate dissolution and subsequent carbonate-induced recrystallization rather than strong synergistic interactions between the investigated variables.
Overall, the response surface analysis demonstrates that activation temperature and treatment time are the principal process variables governing cancrinite formation. Their combined optimization establishes favorable conditions for extensive mineralogical restructuring of the nepheline–red mud mixture prior to alkaline leaching.
The dominant influence of activation temperature identified in the present study is consistent with previous investigations of hydrothermal activation of aluminosilicate materials, which demonstrated that increasing temperature accelerates the dissolution of primary aluminosilicate minerals and promotes the formation of secondary reactive phases [31,32]. Similar observations have been reported for nepheline-bearing systems and Bayer red mud, where elevated temperatures enhanced phase transformation and improved the reactivity of alumina-bearing minerals during subsequent alkaline processing. Likewise, prolonged activation time has been shown to promote the completion of dissolution–reprecipitation reactions, thereby facilitating the crystallization of stable carbonate-bearing aluminosilicate phases. The agreement between the present results and previous investigations confirms that the kinetics of mineral dissolution and secondary phase formation are primarily controlled by activation temperature and treatment duration.
2.3.2. Effect of Activation Temperature and NaHCO3 Concentration on Cancrinite Formation
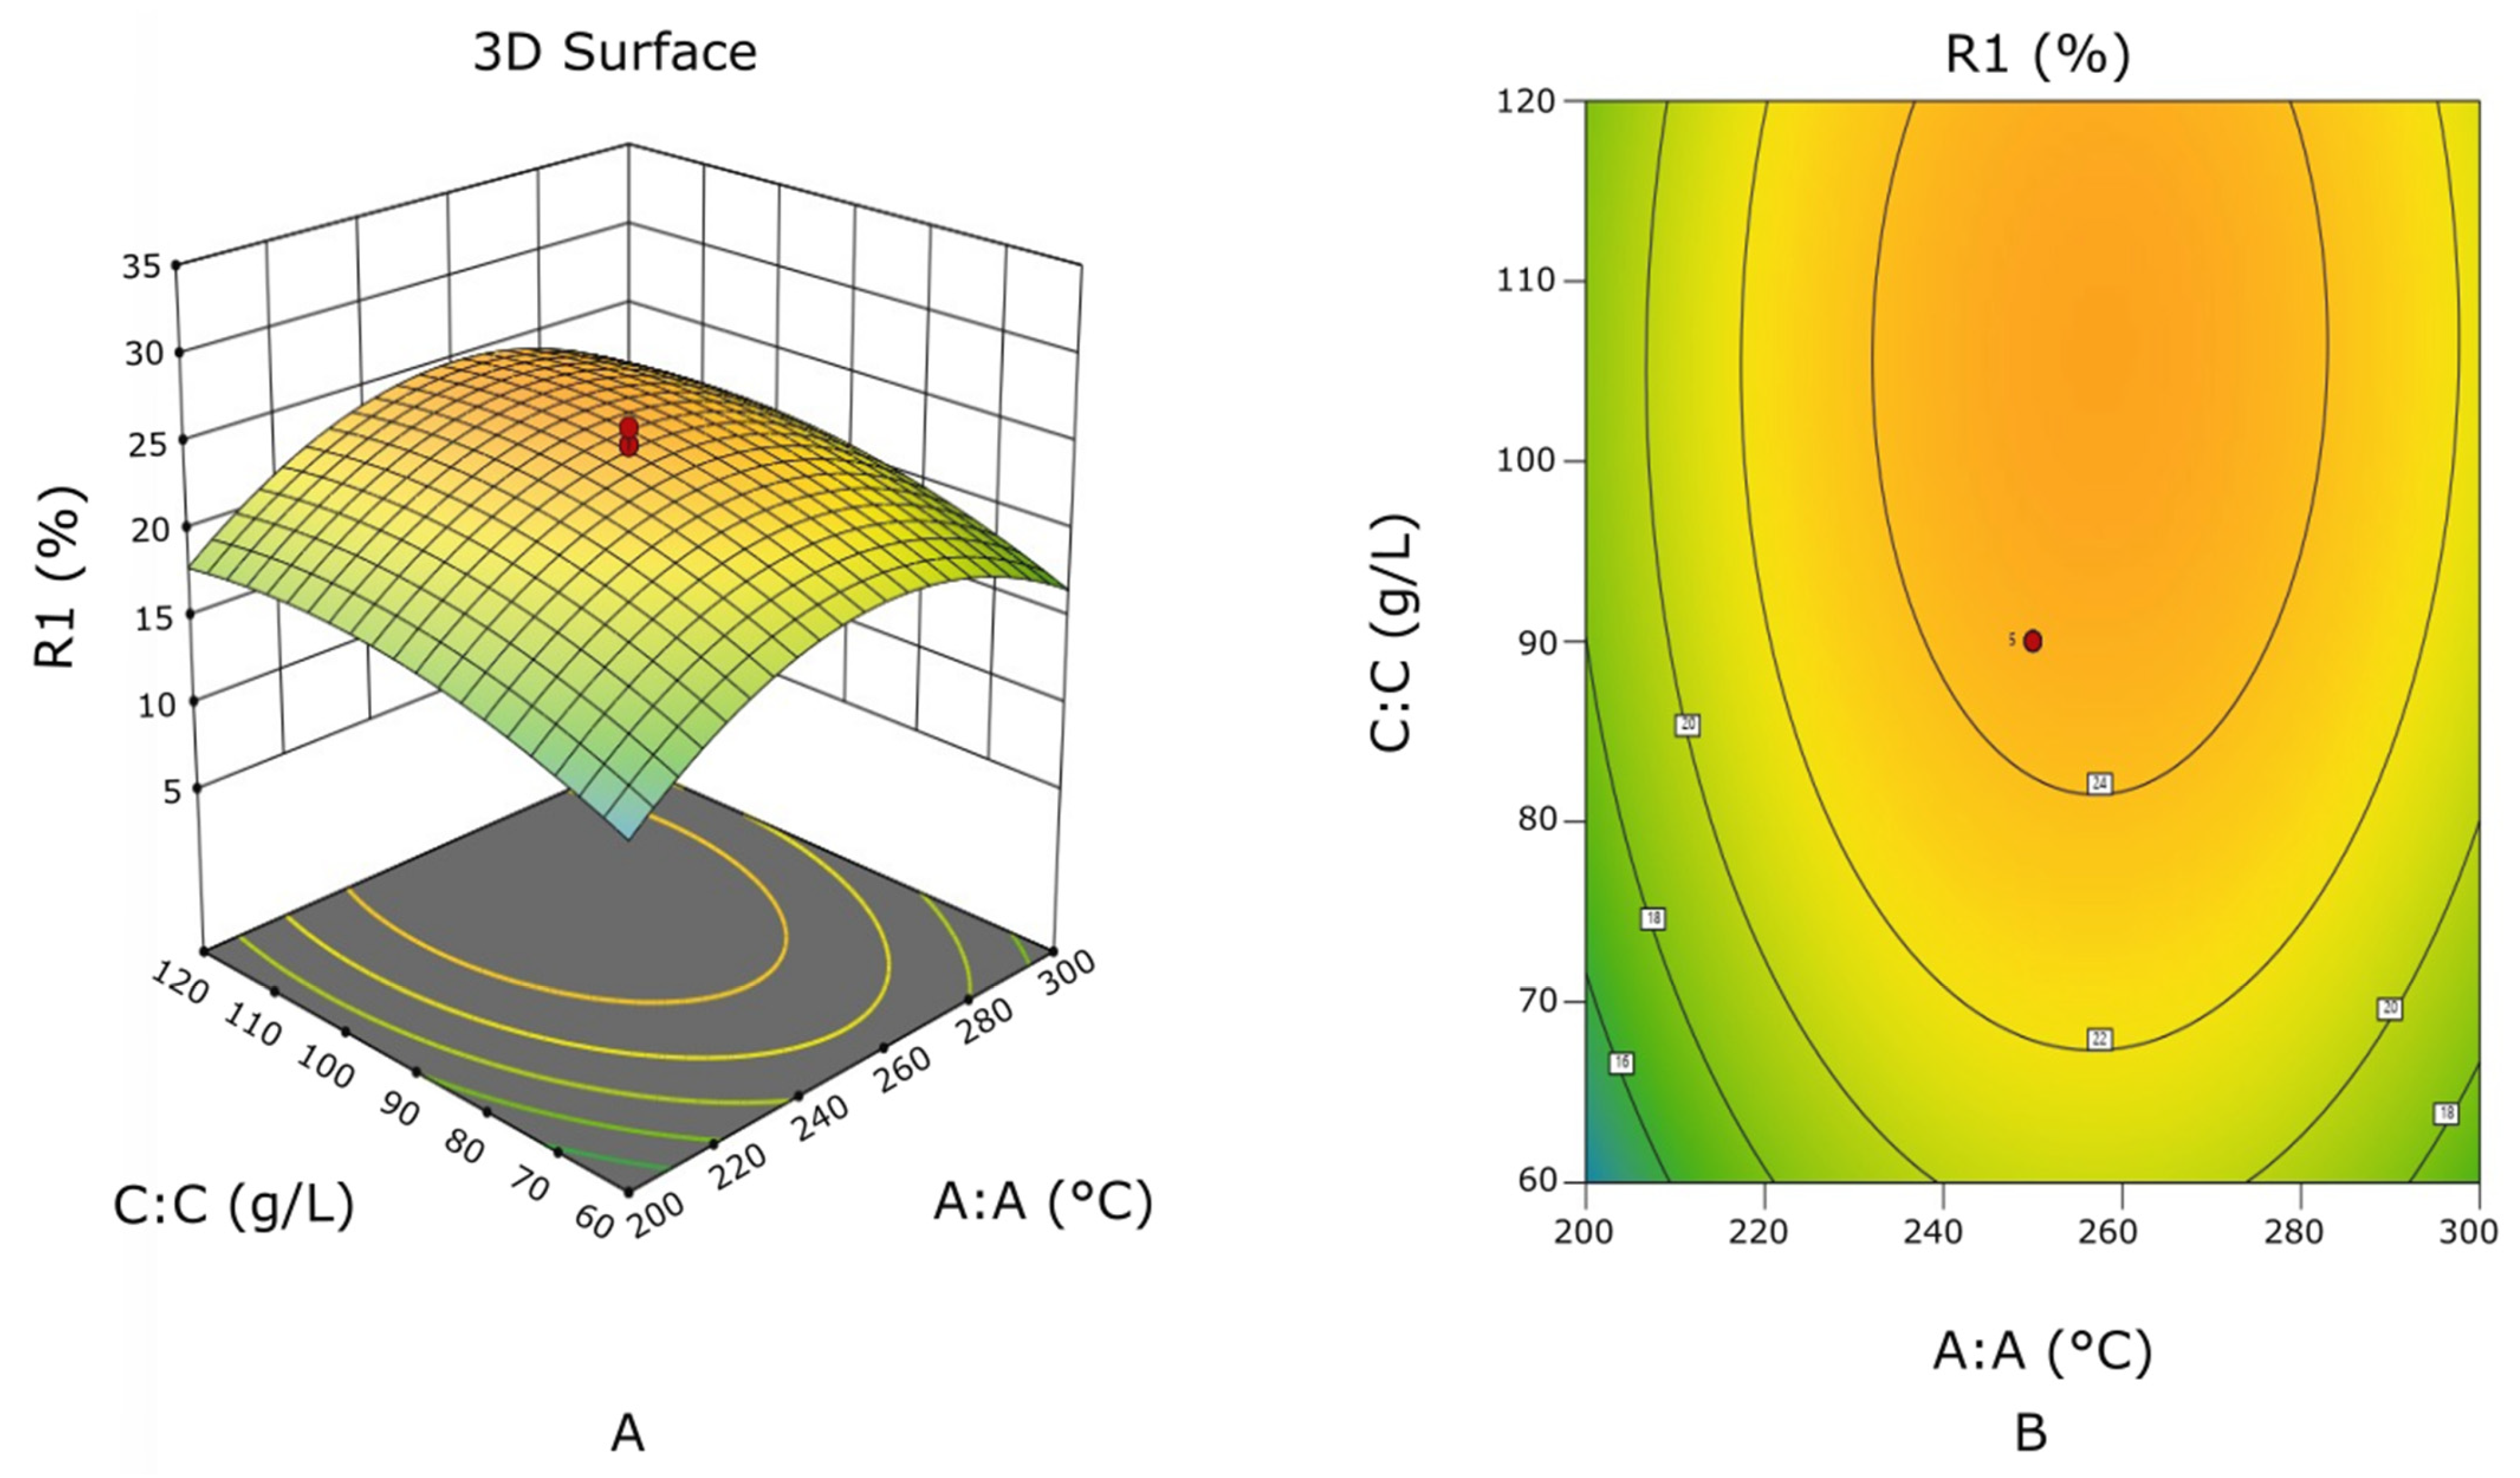
The combined influence of activation temperature and NaHCO3 concentration on cancrinite formation is presented in Figure 4, while the activation time was maintained at the central level of 3.5 h.
Figure 4.
(A) Three-dimensional response surface illustrating the combined influence of activation temperature and NaHCO3 concentration on cancrinite formation at a constant activation time of 3.5 h; (B) Contour plot showing the combined effect of activation temperature and NaHCO3 concentration on cancrinite formation.
As shown in Figure 4A, both activation temperature and carbonate concentration positively influenced cancrinite formation; however, their contributions differed considerably. Increasing the activation temperature resulted in a pronounced increase in the cancrinite content over the entire experimental range, whereas the influence of NaHCO3 concentration was comparatively moderate. The response surface exhibited a broad optimum region centered at temperatures of approximately 250–270 °C and NaHCO3 concentrations close to 90–110 g/L.
The contour plot (Figure 4B) demonstrates nearly symmetrical elliptical contours, indicating that the interaction between activation temperature and NaHCO3 concentration was relatively weak. This observation is consistent with the ANOVA results, where the interaction term between these variables was statistically insignificant. Consequently, the response is governed primarily by the individual effects of temperature and carbonate concentration rather than by their mutual interaction. From a mineralogical perspective, the dominant influence of temperature reflects its role in promoting the destabilization of the primary aluminosilicate framework. Elevated temperatures accelerate the dissolution of nepheline and reactive aluminosilicate phases present in the red mud, increasing the concentration of dissolved Al and Si species available for subsequent recrystallization.
The effect of NaHCO3 concentration is associated mainly with the availability of carbonate ions participating in the crystallization of cancrinite. At relatively low carbonate concentrations, the supply of carbonate species is insufficient to fully stabilize the newly formed aluminosilicate framework, resulting in limited cancrinite formation. Increasing the NaHCO3 concentration promotes carbonate incorporation into the crystal structure and facilitates cancrinite crystallization. However, beyond approximately 100–110 g/L, additional carbonate provides only marginal improvements, indicating that the crystallization process becomes controlled predominantly by mineral dissolution kinetics rather than by carbonate availability.
Overall, the response surface demonstrates that activation temperature remains the principal driving force for cancrinite formation, whereas NaHCO3 concentration acts as a secondary controlling parameter responsible for stabilizing carbonate-bearing aluminosilicate phases during hydrothermal activation.
Activation temperature was identified as the dominant factor governing cancrinite formation, whereas NaHCO3 concentration primarily controlled the stabilization of carbonate-bearing aluminosilicate phases. The broad optimum region indicates that carbonate availability enhances recrystallization only after sufficient dissolution of the primary aluminosilicate matrix has occurred.
2.3.3. Effect of Activation Time and NaHCO3 Concentration on Cancrinite Formation
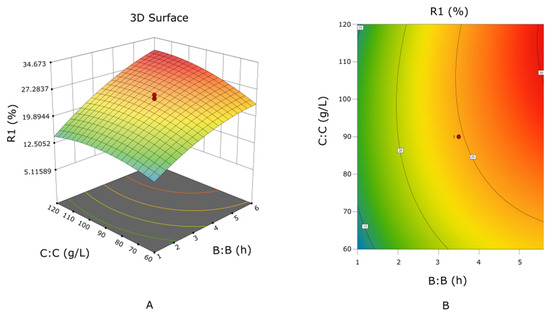
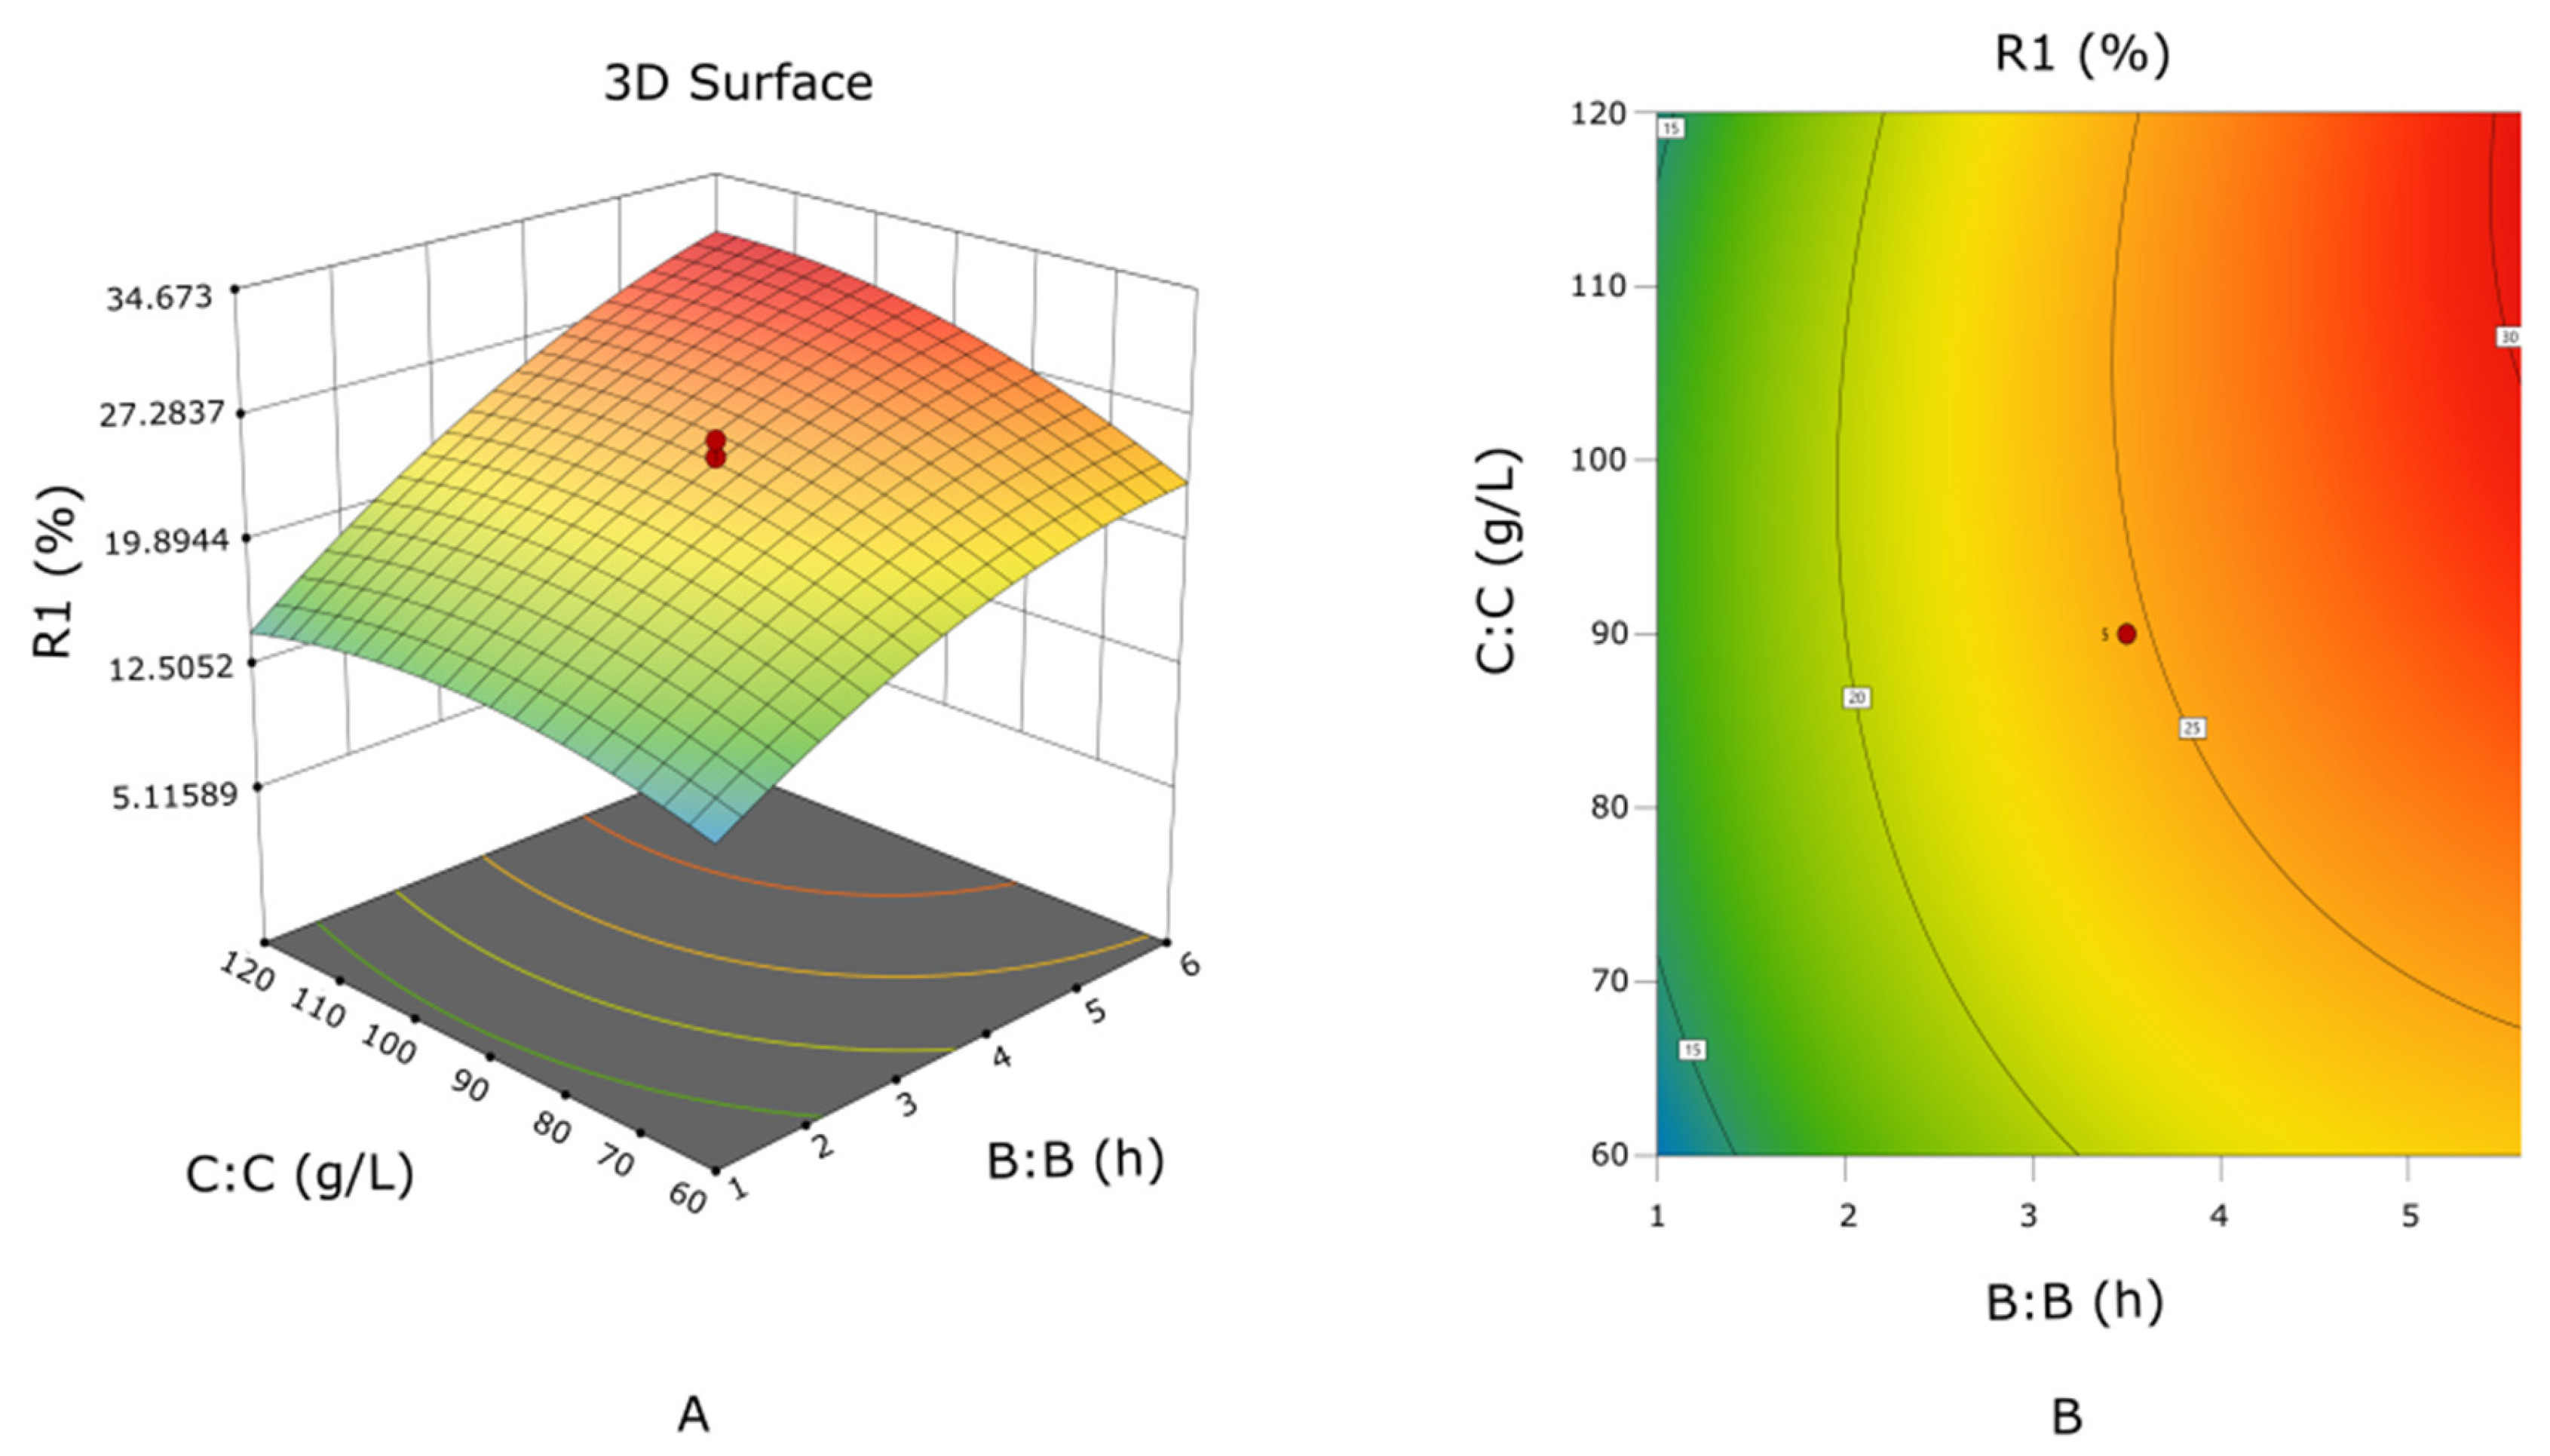
The combined effects of activation time and NaHCO3 concentration on cancrinite formation are presented in Figure 5. During this analysis, the activation temperature was maintained at its central level (250 °C).
Figure 5.
(A) Three-dimensional response surface illustrating the combined influence of activation time and NaHCO3 concentration on cancrinite formation at a constant activation temperature of 250 °C; (B) Contour plot showing the combined effect of activation time and NaHCO3 concentration on cancrinite formation.
As illustrated in Figure 5A, cancrinite formation increased steadily with increasing activation time over the entire investigated range. In contrast, the influence of NaHCO3 concentration was less pronounced, producing only a moderate increase in the response. The response surface therefore indicates that activation time is the dominant process variable under constant temperature conditions.
The contour plot (Figure 5B) confirms this behavior. The contour lines are elongated primarily along the NaHCO3 concentration axis, whereas a much steeper gradient is observed along the activation time axis. Such contour geometry indicates that extending the activation time results in a substantially greater increase in cancrinite content than increasing the carbonate concentration alone. This observation is fully consistent with the ANOVA results, where activation time exhibited the highest statistical significance among all investigated variables.
From a physicochemical standpoint, prolonged activation time promotes progressive dissolution of aluminosilicate minerals and allows sufficient time for the nucleation and growth of cancrinite crystals. As the hydrothermal treatment proceeds, dissolved aluminum and silicon species continuously participate in carbonate-induced recrystallization, leading to a gradual increase in cancrinite content.
The influence of NaHCO3 concentration is primarily associated with the availability of carbonate ions required for the stabilization of the cancrinite framework. However, once sufficient carbonate species are present in the reaction medium, further increases in NaHCO3 concentration produce only limited improvements in cancrinite formation. Under these conditions, the overall transformation rate becomes controlled mainly by the kinetics of mineral dissolution and crystal growth rather than by carbonate availability.
The response surface therefore demonstrates that activation time governs the extent of mineralogical transformation, whereas NaHCO3 concentration mainly provides favorable chemical conditions for carbonate incorporation into the newly formed aluminosilicate framework.
Activation time was identified as the dominant kinetic parameter controlling cancrinite formation, whereas NaHCO3 concentration mainly influenced the stabilization of carbonate-bearing phases. The response surface indicates that prolonged hydrothermal treatment is essential for completing the dissolution–reprecipitation process responsible for cancrinite crystallization.
2.3.4. Comparative Analysis of the Response Surfaces
The response surface analyses consistently demonstrated that activation temperature and activation time were the principal factors governing cancrinite formation, whereas the effect of NaHCO3 concentration was comparatively less pronounced. Temperature primarily promoted the dissolution of aluminosilicate minerals, while prolonged activation time enhanced the dissolution–reprecipitation process responsible for cancrinite crystallization. In contrast, NaHCO3 concentration mainly provided favorable conditions for carbonate incorporation into the newly formed aluminosilicate framework. The predominantly elliptical contour plots and statistically insignificant interaction terms indicate that the investigated factors acted largely independently within the studied experimental domain. These observations provide a sound basis for the numerical optimization of the thermochemical activation process. Consequently, the measured cancrinite content is considered a quantitative mineralogical response characterizing the extent of the targeted cancrinite-forming transformation within the investigated experimental domain.
2.3.5. Comparison with Previous Studies
The present response surface analysis demonstrated that activation temperature and activation time were the principal factors governing cancrinite formation during carbonate thermochemical activation of the nepheline–red mud mixture. This observation is consistent with previous mineralogical studies, which demonstrated that increasing temperature accelerates the dissolution of stable aluminosilicate minerals and promotes the nucleation and growth of secondary carbonate-bearing phases. Similarly, prolonged activation time has been shown to facilitate the completion of dissolution–reprecipitation processes, resulting in more extensive crystallization of cancrinite and other reactive aluminosilicate phases [33,34,35].
The comparatively weaker statistical influence of NaHCO3 concentration relative to activation time indicates that carbonate availability contributes to cancrinite-forming transformation but is not the sole factor controlling the mineralogical response. Although temperature can influence the behavior of bicarbonate and carbonate species in the hydrothermal activation medium, the statistically non-significant AC interaction (p = 0.8870) indicates no additional temperature × NaHCO3 concentration interaction effect could be resolved within the investigated experimental domain. This statistical result should not be interpreted as evidence for the absence of physicochemical effects of temperature on bicarbonate/carbonate behavior, but rather as an indication that such effects were not expressed as a statistically distinguishable interaction in the selected cancrinite response.
From a thermodynamic and phase-stability perspective, the formation of carbonate-bearing cancrinite is favored under hydrothermal conditions in carbonate-containing aluminosilicate systems [36,37]. The incorporation of carbonate species into the aluminosilicate framework contributes to the stabilization of the cancrinite structure, which is consistent with the experimentally observed formation of cancrinite in the nepheline–red mud system under carbonate–hydrothermal conditions reported in our previous study [32]. However, thermodynamic quantities such as ΔG and ΔH were not directly determined in the present study; therefore, the RSM results should be interpreted as an empirical statistical description of the mineralogical response rather than as a thermodynamic model of phase stability.
Consequently, the developed statistical model indicates that carbonate availability becomes a controlling factor only after sufficient dissolution of the primary aluminosilicate framework has occurred, when dissolved aluminum and silicon species are available for cancrinite crystallization.
Unlike the majority of published Response Surface Methodology studies, which generally employ technological responses such as metal recovery, extraction efficiency, or product yield [38,39,40,41], the present study utilizes quantitatively determined cancrinite content obtained by XRD phase analysis as the response variable. This approach enables direct statistical interpretation of mineralogical transformation during carbonate thermochemical activation rather than indirect evaluation through subsequent hydrometallurgical performance. Consequently, the developed response surface model provides a quantitative empirical description of cancrinite-forming transformation and a mineralogically meaningful framework for evaluating the effects of the investigated activation parameters within the experimental domain.
The developed response surface model extends conventional process optimization by providing a quantitative statistical interpretation of cancrinite-forming mineralogical transformation during carbonate thermochemical activation. In this context, quantitatively determined cancrinite content serves as a mineralogical response variable for evaluating the effects of the investigated activation parameters rather than as a universal predictor of overall activation efficiency or subsequent alumina recovery. This approach establishes a link between statistical modeling and experimentally observed phase evolution and provides a quantitative basis for identifying favorable activation conditions within the investigated experimental domain.
Within the investigated experimental domain, the developed RSM model provides a quantitative framework for evaluating the effects of activation temperature, treatment duration, and NaHCO3 concentration on cancrinite formation in the nepheline–red mud system at a fixed 1:1 mass ratio. The model enables identification of favorable activation regions and assessment of the relative contributions of the investigated process variables. As with empirical response surface models, its predictive application is primarily associated with the experimental domain and feed composition used for model development. Variations in the nepheline-to-red mud ratio or substantial changes in the chemical and mineralogical composition of the raw materials may modify the phase-transformation behavior and would therefore require additional validation or model recalibration. These considerations define the applicability range of the present model and provide a basis for its further extension to other feed compositions and operating conditions.
2.4. Experimental Validation of the Response Surface Model
To evaluate the predictive capability of the developed response surface model, validation experiments were carried out under practical operating conditions selected in close proximity to the statistically predicted optimum. The activation temperature, activation time, and NaHCO3 concentration were fixed at 260 °C, 4 h, and 110 g/L, respectively. These conditions represent practically achievable operating parameters while remaining within the optimum region predicted by the statistical model.
The comparison between the predicted and experimentally measured cancrinite contents determined by quantitative XRD analysis is summarized in Table 2. Three independent validation experiments yielded cancrinite contents of 19 wt.%, 21 wt.% and 20 wt.%, corresponding to an average value of 20.0 ± 1.0 wt.%.
Table 2.
Comparison of the predicted and experimentally measured cancrinite content determined by quantitative XRD analysis under validation conditions.
Although the regression model predicted a maximum cancrinite content of 22.75 wt.%, the experimental results confirmed that the selected activation conditions produced intensive cancrinite formation and were located within the optimum response region identified by the response surface model. The difference between the predicted and measured values can be attributed to the simplified nature of the quadratic regression model and the complexity of hydrothermal dissolution–reprecipitation processes, which are not fully represented by polynomial equations. In addition, quantitative XRD analysis is associated with inherent uncertainties related to phase quantification.
Overall, the validation experiments demonstrated satisfactory agreement between the predicted and experimentally measured responses under the selected operating conditions, supporting the practical applicability of the developed response surface model for identifying favorable cancrinite-forming conditions. The validated conditions of 260 °C, 4 h, and 110 g/L NaHCO3 were subsequently adopted as the working activation conditions for further experimental investigations. Thus, the validation was specifically directed toward confirming a practically applicable operating region identified by the statistical model. Although independent validation at the boundaries of the design space was not performed, such experiments could further extend the assessment of model predictive performance beyond the practically selected operating region.
3. Materials and Methods
3.1. Raw Materials and Sample Preparation
Nepheline ore obtained from the Kubasadyr deposit (Republic of Kazakhstan) and Bayer red mud supplied by the Pavlodar Aluminium Plant (Kazakhstan) were used as the raw materials for statistical modeling of the thermochemical activation process. Prior to the experiments, both materials were dried at 105 °C to constant mass, homogenized, and ground in a laboratory ball mill to a particle size below 74 μm in order to ensure uniform reactivity during thermochemical treatment.
The chemical compositions of the nepheline ore and Bayer red mud were determined by X-ray fluorescence (XRF) spectroscopy using a Venus 200 wavelength-dispersive spectrometer (PANalytical B.V., Almelo, The Netherlands). The analytical results are summarized in Table 3.
Table 3.
Chemical composition of raw materials.
The nepheline-to-red mud mass ratio was fixed at 1:1 throughout the present experimental design and was therefore not included as an independent factor in the RSM model.
The mineralogical composition of the raw materials was characterized by X-ray diffraction (XRD) using a D8 Advance diffractometer (Bruker, Billerica, MA, USA) operated with Cu Kα radiation at 40 kV and 40 mA. Quantitative XRD analysis therefore provides a direct mineralogical response for evaluating the extent of the targeted cancrinite-forming transformation during thermochemical activation.
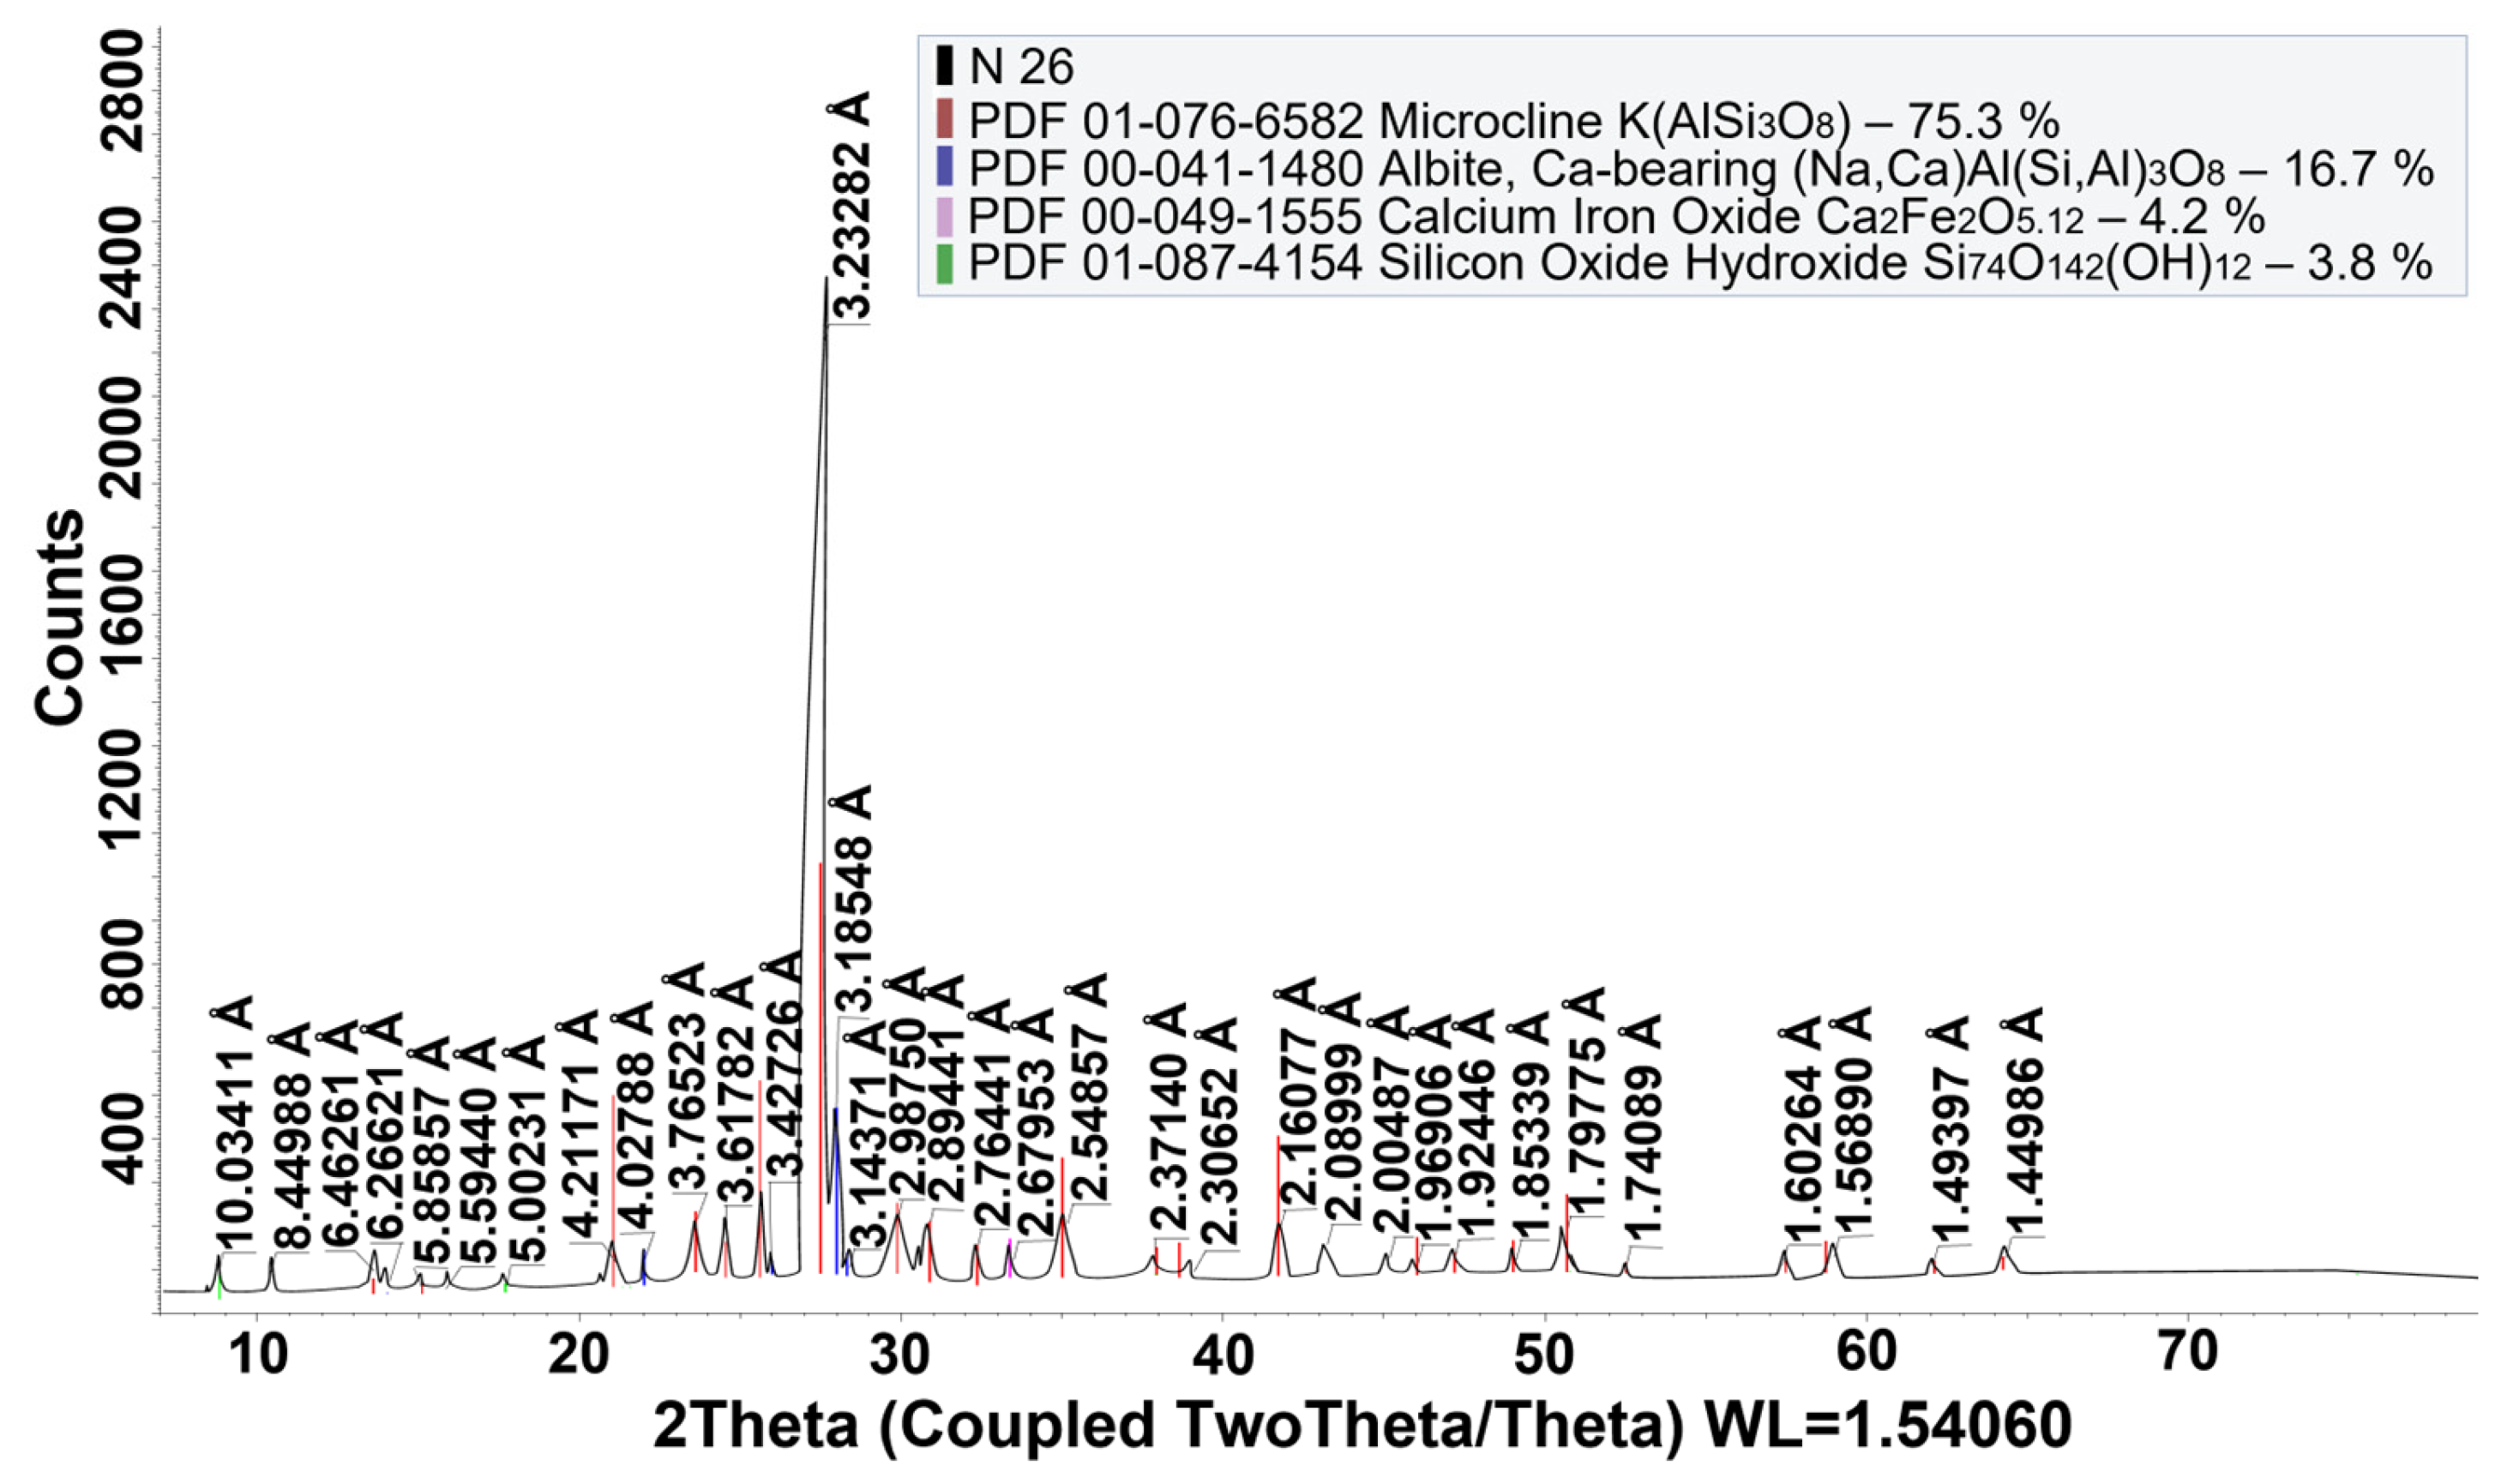
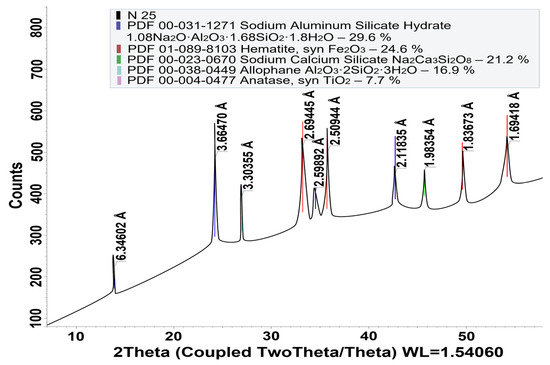
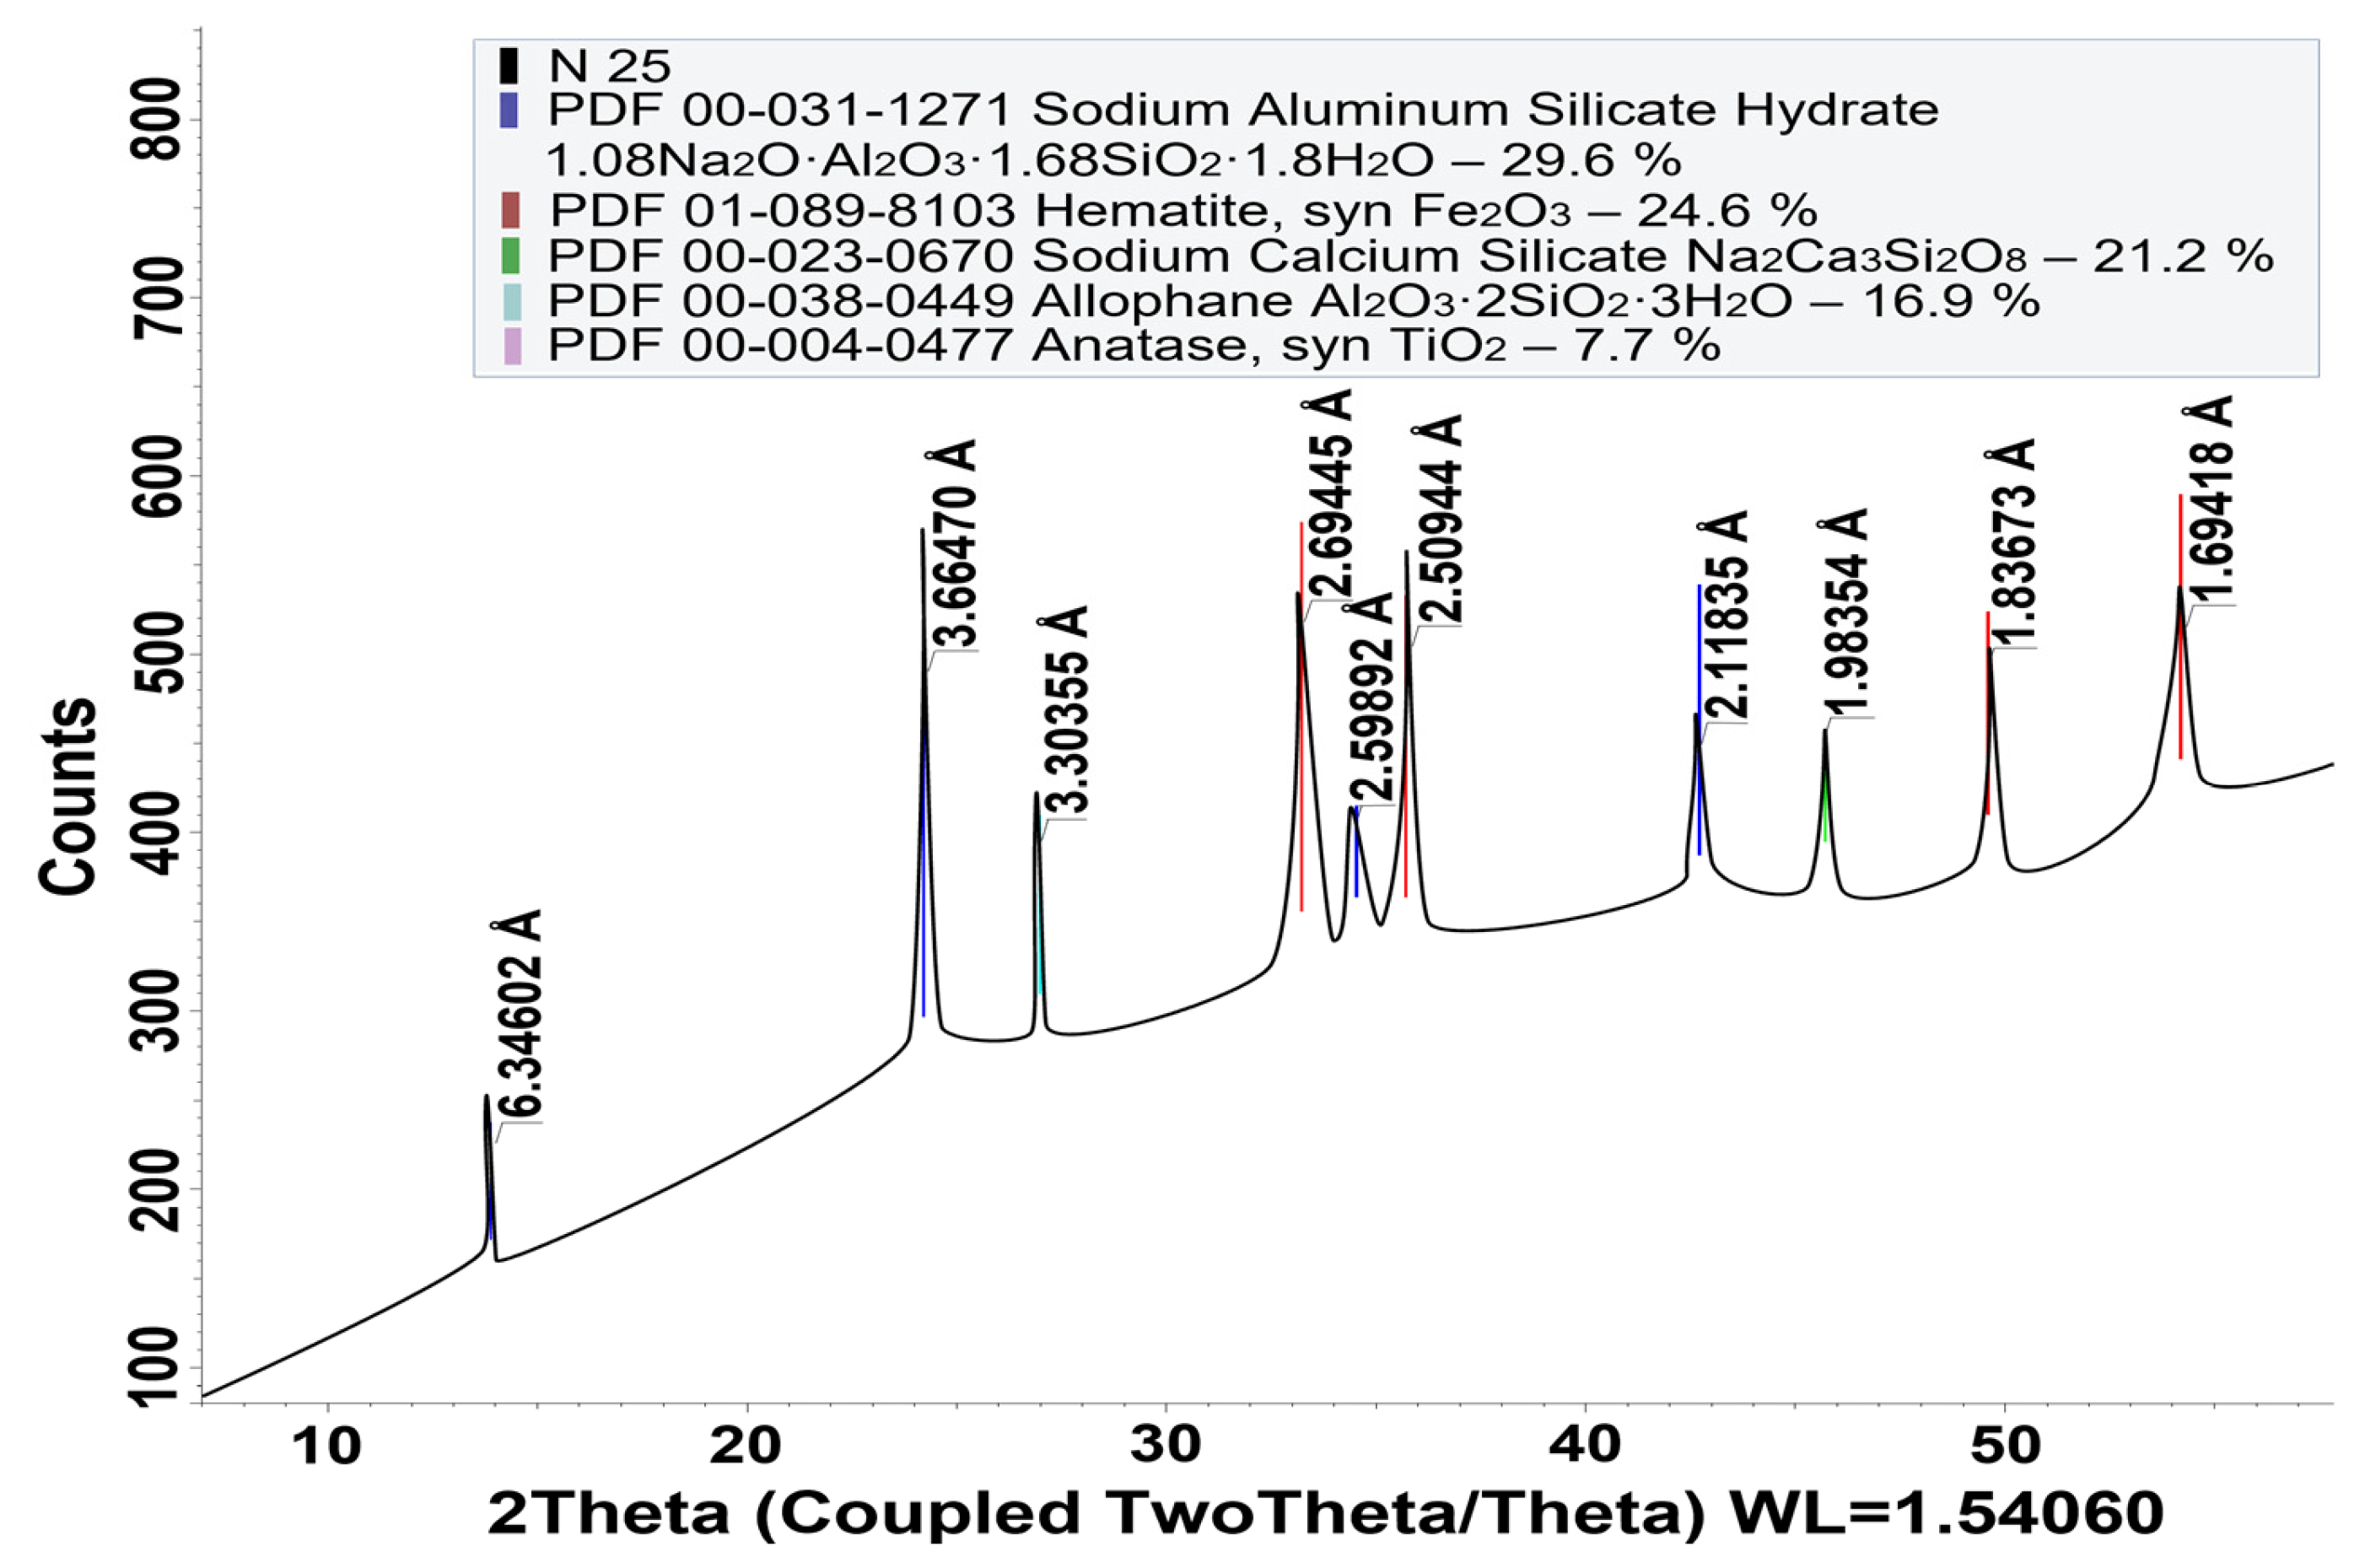
The XRD patterns of the nepheline ore and Bayer red mud are presented in Figure 6 and Figure 7, respectively. No additional crystalline phases were detected prior to thermochemical activation, indicating that phase transformation occurred exclusively during hydrothermal treatment.
Figure 6.
XRD pattern of nepheline ore. Adapted from Ref. [32].
Figure 7.
XRD pattern of Bayer red mud. Adapted from Ref. [32].
3.2. Thermochemical Activation Procedure
Thermochemical activation experiments were performed in a laboratory stainless-steel autoclave equipped with mechanical stirring. Throughout all experiments, the liquid-to-solid (L:S) ratio was maintained at 3:1. Water was used as the solvent in all experiments, and the liquid-to-solid ratio was maintained constant to minimize variations associated with the amount of the liquid phase. Therefore, the solvent itself was not treated as an independent variable in the experimental design, whereas the effect of the aqueous activation medium was evaluated through variation in the NaHCO3 concentration.
The activation parameters, including temperature, activation time, and NaHCO3 concentration, were varied according to the Central Composite Design (CCD) generated by Response Surface Methodology. The investigated experimental ranges are summarized in Table 2.
For each experimental run, the prepared nepheline ore–red mud mixture (1:1 mass ratio) was treated under the selected activation conditions. Upon completion of the thermochemical treatment, the autoclave was cooled naturally to room temperature. The activated solid product was separated by filtration, thoroughly washed with distilled water until neutral pH was reached, and dried at 105 °C to constant mass.
The mineralogical composition of the activated products was determined by quantitative X-ray diffraction (XRD) analysis using the analytical conditions described in Section 3.1. The measured cancrinite content (wt.%), obtained from quantitative phase analysis, was used as the response variable for statistical modeling and subsequent evaluation of the thermochemical activation process.
All experiments included in the Central Composite Design and the validation experiments were performed in triplicate. The experimental results are reported as mean values, and the experimental uncertainty of the measured cancrinite content did not exceed ±3%.
3.3. Experimental Design Using Response Surface Methodology
Response Surface Methodology (RSM) was employed to establish the quantitative relationship between the thermochemical activation parameters and the extent of mineralogical transformation of the nepheline–red mud mixture. A Central Composite Design (CCD) generated in Design-Expert® software (Version 12, Stat-Ease Inc., Minneapolis, MN, USA) was selected because of its capability to evaluate the individual, quadratic, and interaction effects of multiple process variables while minimizing the number of experimental runs.
AQ Three independent process variables were considered in the experimental design: activation temperature (A), activation time (B), and NaHCO3 concentration (C). The factorial levels of the independent variables were selected based on preliminary experimental investigations and previous studies on carbonate thermochemical activation of nepheline-bearing materials. The factorial ranges were 200–300 °C for activation temperature, 1–6 h for activation time, and 60–120 g/L for NaHCO3 concentration. The Central Composite Design additionally included axial points extending beyond these factorial levels to 165 and 334 °C for temperature, 0.7 and 7.8 h for activation time, and 39 and 140 g/L for NaHCO3 concentration, as specified in Table 4.
Table 4.
Central Composite Design (CCD) matrix and experimentally measured cancrinite content determined by quantitative XRD analysis.
The experimental matrix consisted of 19 runs, including factorial points, axial points, and replicated center points. Replication at the center of the design space was introduced to estimate the pure experimental error and to evaluate the adequacy of the regression model.
Unlike conventional optimization studies, which commonly employ metal extraction efficiency as the response variable, the present study selected the measured cancrinite content determined by quantitative X-ray diffraction (XRD) analysis (wt.%) as the primary response. This response was chosen because cancrinite represents the principal secondary phase formed during carbonate thermochemical activation and directly reflects the extent of mineralogical transformation of the aluminosilicate matrix. Quantitative XRD analysis therefore provides a direct mineralogical response for evaluating the extent of the targeted cancrinite-forming transformation during thermochemical activation.
Previous mineralogical investigations demonstrated that carbonate–hydrothermal activation transforms the relatively stable aluminosilicate framework of the nepheline–red mud mixture through dissolution–reprecipitation processes, with cancrinite forming as a major secondary aluminosilicate phase. In our previous experimental study on the same nepheline–red mud system, the formation of approximately 19 wt.% cancrinite was accompanied by substantial restructuring of the primary aluminosilicate matrix and enhanced reactivity during subsequent alkaline leaching, resulting in an Al2O3 recovery of 92–94% [32]. The formation of cancrinite therefore reflects the conversion of structurally resistant primary aluminosilicates into a reorganized carbonate-bearing aluminosilicate system associated with improved aluminum accessibility during subsequent alkaline treatment. On this basis, maximizing cancrinite formation within the investigated activation domain was selected as the mineralogical objective of the present RSM analysis, and quantitatively determined cancrinite content was used as the response variable. However, the present study does not establish a direct proportional relationship between cancrinite content and Al2O3 recovery. Therefore, cancrinite content should be interpreted as a mineralogical indicator of the extent of the targeted cancrinite-forming transformation rather than as an independent or universal predictor of alumina extraction. Other secondary phases, particularly aluminum-bearing phases formed during activation, may also contribute to subsequent leaching behavior, and their combined quantitative relationship with alumina recovery requires further investigation.
The experimental results were analyzed using Response Surface Methodology. A second-order polynomial regression model was developed to describe the relationship between the independent variables and the response. The significance of the regression coefficients and the adequacy of the developed model were evaluated by analysis of variance (ANOVA) at a confidence level of 95% (p < 0.05). Model quality was assessed using the coefficient of determination (R2), adjusted coefficient of determination (Adjusted R2), predicted coefficient of determination (Predicted R2), adequate precision, lack-of-fit analysis, and residual diagnostics.
3.4. Statistical Analysis
Experimental data generated using the Central Composite Design (CCD) were analyzed with Design-Expert® software (Version 12, Stat-Ease Inc., Minneapolis, MN, USA). Response Surface Methodology (RSM) was employed to establish quantitative relationships between the thermochemical activation parameters and the measured cancrinite content determined by quantitative X-ray diffraction (XRD) analysis. The experimental response was fitted to a second-order polynomial regression model according to Equation (1):
where y is the predicted response (cancrinite content, wt.%); b0 is the intercept coefficient; bi, bii, and bij are the linear, quadratic, and interaction regression coefficients, respectively; Xi and Xj are the coded independent variables; and k is the number of independent variables included in the model.
The adequacy and statistical significance of the developed regression model were evaluated by analysis of variance (ANOVA) using the F-test and the corresponding p-values at a confidence level of 95% (p < 0.05). Model performance was further assessed using the coefficient of determination (R2), adjusted coefficient of determination (Adjusted R2), predicted coefficient of determination (Predicted R2), Adequate Precision, the Lack-of-Fit test, and residual diagnostic analysis.
Model diagnostics included normal probability plots of residuals, residuals versus predicted values, predicted versus actual values, Cook’s distance analysis, and Box–Cox transformation analysis. Three-dimensional response surface plots together with corresponding contour plots were generated to evaluate the individual and combined effects of the activation parameters on cancrinite formation.
Numerical optimization based on the desirability function was performed to identify the region corresponding to maximum cancrinite formation. The practical applicability of the developed response surface model in the favorable operating region identified by numerical optimization was subsequently assessed through independent validation experiments.
4. Conclusions
The present study applied Response Surface Methodology (RSM) to quantitatively evaluate the effects of thermochemical activation parameters on cancrinite formation in a nepheline–red mud mixture using cancrinite content determined by quantitative XRD phase analysis as the mineralogical response variable. The principal conclusions are summarized as follows:
- A statistically significant quadratic regression model was developed to describe cancrinite formation as a function of activation temperature, activation time, and NaHCO3 concentration. The model explained 95.5% of the variability in the experimental response (R2 = 0.9550). The lower Predicted R2 (0.6731) and statistically significant Lack-of-Fit (p = 0.0117) indicate that the model is most appropriately applied as an empirical tool for interpretation of factor effects and identification of favorable operating regions within the investigated experimental domain.
- Activation time exerted the strongest statistical influence on cancrinite formation, while activation temperature and NaHCO3 concentration also showed statistically significant effects. The investigated interaction terms were not statistically significant, whereas the quadratic terms were significant, demonstrating the predominantly nonlinear dependence of cancrinite formation on the individual activation parameters.
- Numerical optimization identified a favorable region for cancrinite formation, with a predicted maximum response of 22.75 wt.%. Three independent validation experiments performed at the practically selected conditions of 260 °C, 4 h, and 110 g/L NaHCO3 yielded an average cancrinite content of 20.0 ± 1.0 wt.%. These validated conditions were subsequently adopted as the working activation conditions for further experimental investigations, supporting the practical relevance of the statistically identified operating region.
- The use of quantitatively determined cancrinite content as the RSM response provides a direct statistical description of the targeted cancrinite-forming mineralogical transformation. The approach links statistical process analysis with quantitative phase evolution and provides a framework for selecting favorable activation conditions prior to subsequent hydrometallurgical processing. Its application to substantially different feed compositions, nepheline-to-red mud ratios, or conditions outside the investigated experimental domain would require additional validation or model recalibration.
Author Contributions
Conceptualization, N.A. and Y.A.; methodology, R.A.; validation, Y.A.; formal analysis, N.O.; investigation A.M.; resources, T.S.; writing—original draft preparation, N.A.; writing—review and editing, Y.A.; supervision, N.B. and T.S.; project administration, N.A.; funding acquisition, V.P. All authors have read and agreed to the published version of the manuscript.
Funding
This work was carried out with the financial support of the Committee of Science of the Ministry of Education and Science of the Republic of Kazakhstan under grant funding No. AP26100479.
Institutional Review Board Statement
Not applicable.
Informed Consent Statement
Not applicable.
Data Availability Statement
The original contributions presented in this study are included in the article. Further inquiries can be directed to the corresponding author.
Conflicts of Interest
The authors declare no conflicts of interest.
References
- Li, G.; Liu, J.; Yi, L.; Luo, J. Bauxite Residue (Red Mud) Treatment: Current Situation and Promising Solution. Sci. Total Environ. 2024, 948, 174757. [Google Scholar] [CrossRef] [Scilit] [PubMed]
- Fang, C.; Lou, R.; Ju, Y.; Jia, Y.; Wu, J.; Chen, Y.; Zhang, Y.; Deng, X.; Lv, B.; Chen, X. Critical Metal Recovery from Red Mud: A Systematic Review of Sustainable Extraction Technologies and Circular Economy Potential. J. Environ. Chem. Eng. 2025, 13, 118985. [Google Scholar] [CrossRef] [Scilit]
- Borra, C.R.; Mermans, J.; Blanpain, B.; Pontikes, Y.; Binnemans, K.; Van Gerven, T. Selective Recovery of Rare Earths from Bauxite Residue by Combination of Sulfation, Roasting and Leaching. Miner. Eng. 2016, 92, 151–159. [Google Scholar] [CrossRef] [Scilit]
- Evans, K. The History, Challenges, and New Developments in the Management and Use of Bauxite Residue. J. Sustain. Metall. 2016, 2, 316–331. [Google Scholar] [CrossRef] [Scilit]
- Du, P.X.; Wang, P.; Zhang, X.Q. Properties, hazards and valuable metal recovery technologies of red mud: A review. Particuology 2024, 93, 93328–93348. [Google Scholar] [CrossRef] [Scilit]
- Liu, F.Q.; Li, J.; Chen, K.B.; Li, R.B.; Xie, M.Z.; Liu, G.H.; Zhao, H.L. Current Situation and Technology Development Trend of Resource Utilization for Solid Hazardous Waste in Aluminum Industry in China. Nonferrous Met. (Extr. Metall.) 2024, 9, 1–13. [Google Scholar] [CrossRef]
- Bagani, M.; Balomenos, E.; Panias, D. Nepheline Syenite as an Alternative Source for Aluminum Production. Minerals 2021, 11, 734. [Google Scholar] [CrossRef] [Scilit]
- Santos, D.H.; Rosa, L.P.; Alves, C.R.; Simão, L.; Zaccaron, A.; Arcaro, S.; Montedo, O.R.K.; Raupp-Pereira, F. Using Brazilian Nepheline Syenite Waste as an Alternative Mineral Resource for Various Applications. Minerals 2025, 15, 554. [Google Scholar] [CrossRef] [Scilit]
- Abouzeid, A.-Z.M.; Negm, A.-T.A. Characterization and Beneficiation of an Egyptian Nepheline Syenite Ore. Int. J. Mineral. 2014, 2014, 128246. [Google Scholar] [CrossRef] [Scilit]
- Feng, D.; Meng, Z.; Deng, J.; Wu, M.; Lan, R. Study on Mineral Phase Transformation Behavior in Sealed Reduction Electric Furnace for High-Iron Red Mud and Mechanisms of Efficient Co-Recovery of Iron and Aluminum. Metals 2026, 16, 411. [Google Scholar] [CrossRef] [Scilit]
- Sun, W.; Zheng, S.L.; Zhang, Y.F.; Xu, H.B.; Zhang, Y. Phase Transformation and Alumina Recovery from Bayer Red Mud via NaOH Sub-molten Salt Treatment. J. Hazard. Mater. 2024, 475, 134812. [Google Scholar]
- Samantray, J.; Anand, A.; Dash, B.; Ghosh, M.K. Low-Temperature Hydrothermal Processing to Recover Aluminum from Nepheline Syenite Roast-Leach Residue. Sep. Sci. Technol. 2023, 58, 2505–2518. [Google Scholar] [CrossRef] [Scilit]
- Li, X.-F.; Zhang, T.-A.; Lv, G.-Z.; Wang, K.; Wang, S. Summary of Research Progress on Metallurgical Utilization Technology of Red Mud. Minerals 2023, 13, 737. [Google Scholar] [CrossRef] [Scilit]
- Agrawal, S.; Dhawan, N. Evaluation of Red Mud as a Polymetallic Source—A Review. Miner. Eng. 2021, 171, 107084. [Google Scholar] [CrossRef] [Scilit]
- Nalluri, S.; Ragi, M.R. Nepheline Syenite: A Potential Alternative for Feldspar in the Mineral Industry—A Case Study from SE India. J. Indian Geophys. Union 2020, 24, 33–38. [Google Scholar]
- Akhmadiyeva, N.; Abdulvaliyev, R.; Akcil, A.; Manapova, A. Pre-Activation of Nepheline before the Enrichment. Kompleks. Ispolz. Miner. Syra Complex Use Miner. Resour. 2023, 327, 82–89. [Google Scholar] [CrossRef] [Scilit]
- Reyes, C.A.R.; Williams, C.; Alarcón, O.M.C. Nucleation and growth process of sodalite and cancrinite from kaolinite-rich clay under low-temperature hydrothermal conditions. Mater. Res. 2013, 16, 424–438. [Google Scholar] [CrossRef] [Scilit]
- Gatta, G.D.; Lotti, P. Cancrinite-Group Minerals: Crystal-Chemical Description and Properties under Non-Ambient Conditions—A Review. Am. Mineral. 2016, 101, 253–265. [Google Scholar] [CrossRef] [Scilit]
- Ventura, G.; Bellatreccia, F.; Bonaccorsi, E. CO2 in Minerals of the Cancrinite–Sodalite Group: Pitiglianoite. Eur. J. Mineral. 2005, 17, 847–851. [Google Scholar] [CrossRef] [Scilit]
- Hassan, I. The Thermal Behavior of Cancrinite. Can. Mineral. 1996, 34, 893–900. [Google Scholar]
- Pekov, I.V.; Olysych, L.V.; Chukanov, N.V.; Zubkova, N.V.; Pushcharovsky, D.Y.; Van, K.V.; Giester, G.; Tillmanns, E. Crystal Chemistry of Cancrinite-Group Minerals with an AB-Type Framework: A Review and New Data. I. Chemical and Structural Variations. Can. Mineral. 2011, 49, 1129–1150. [Google Scholar] [CrossRef] [Scilit]
- Pilla, G.; Hertel, T.; Pontikes, Y. Sustainable Valorization of Bauxite Residue (“Red Mud”): Exploring the Potential of H2 Reduction for Multi-metal Recovery. In TMS Annual Meeting & Exhibition; Minerals, Metals and Materials Series; Springer: Cham, Switzerland, 2024; pp. 135–148. [Google Scholar]
- Shao, J.; Li, L.; Wu, Y.; Wang, Y.; Liu, F. Recovery of Alumina and Alkali from Red Mud Using NaFeO2 (NF) as an Additive in the Hydrothermal Process. JOM 2023, 75, 3129–3140. [Google Scholar] [CrossRef] [Scilit]
- Akhmadiyeva, N.; Abdulvaliyev, R.; Gladyshev, S.; Sukurov, B.; Abikak, Y.; Manapova, A.; Bakhytuly, N. Optimizing Technological Parameters for Chromium Extraction from Chromite Ore Beneficiation Tailings. Minerals 2025, 15, 555. [Google Scholar] [CrossRef] [Scilit]
- Abikak, Y.; Kenzhaliev, B.; Akcil, A.; Dembele, S.; Koizhanova, A.; Bakhytuly, N.; Kassymova, G. Optimization of Thiourea-Promoted Gold and Silver Leaching from Pyrite Cinders Using Response Surface Methodology (RSM). Processes 2025, 13, 1277. [Google Scholar] [CrossRef] [Scilit]
- Abikak, Y.; Bakhshyan, A.; Dyussenova, S.; Gladyshev, S.; Kassymzhanova, A. Optimization of Hydrochemical Leaching Process of Kaolinite Fraction of Bauxite with Response Surface Methodology. Processes 2024, 12, 1440. [Google Scholar] [CrossRef] [Scilit]
- Murugesan, M.P.; Kannan, K.; Selvaganapathy, T. Bioleaching Recovery of Copper from Printed Circuit Boards and Optimization of Various Parameters Using Response Surface Methodology (RSM). Mater. Today Proc. 2020, 26, 2720–2728. [Google Scholar] [CrossRef] [Scilit]
- Dembele, S.; Akcil, A.; Panda, S. Investigation of the Characteristics of Stibnite (Sb2S3) Flotation Tailings and Extraction of Critical Metals (Sb and As): Optimization and Scale-Up. Miner. Eng. 2024, 216, 108883. [Google Scholar] [CrossRef] [Scilit]
- Kouchenani, G.; Rezaei, M. Statistical optimization of high specific surface area zinc oxide synthesized through carbonation and thermal decomposition using response surface methodology. Sci. Rep. 2026, 16, 10471. [Google Scholar] [CrossRef] [Scilit] [PubMed]
- Abikak, Y.B.; Kenzhaliyev, B.; Retnawati, H.; Gladyshev, S.; Akcil, A. Mathematical modeling of sulfuric acid leaching of pyrite cinders after preliminary chemical activation. Kompleks. Ispolz. Miner. Syra Complex Use Miner. Resour. 2023, 325, 5–13. [Google Scholar] [CrossRef] [Scilit]
- Akhmadiyeva, N.; Abikak, Y.; Ramazanova, R.; Orakbay, N.; Abdulvaliyev, R.; Burabayeva, N.; Sagyntayeva, T.; Pozmogov, V. Joint Thermochemical Activation of Nepheline Ore and Red Mud: Phase Transformations and Alumina Recovery. Minerals 2026, 16, 434. [Google Scholar] [CrossRef] [Scilit]
- Akhmadiyeva, N.; Gladyshev, S.; Abdulvaliyev, R.; Abikak, Y.; Imangaliyeva, L.; Kasymzhanova, A.; Ruzakhunova, G. Activation of Mineral Composition via Thermochemical Disintegration. Minerals 2025, 15, 1000. [Google Scholar] [CrossRef] [Scilit]
- Yessengaziyev, A.; Karshyga, Z.; Yersaiynova, A.; Tastanova, A.; Smailov, K.; Mukangaliyeva, A.; Orynbayev, B. Optimization of Lithium Recovery from Aluminosilicate Tailings via Sulfation Roasting and Leaching: Experimental Study and RSM Modeling. Metals 2025, 15, 1133. [Google Scholar] [CrossRef] [Scilit]
- Gatta, G.D.; Lotti, P.; Kahlenberg, V.; Haefeker, U. The Low-Temperature Behaviour of Cancrinite: An In Situ Single-Crystal X-ray Diffraction Study. Mineral. Mag. 2012, 76, 933–948. [Google Scholar] [CrossRef] [Scilit]
- Barnes, M.C.; Addai-Mensah, J.; Gerson, A.R. The mechanism of the sodalite-to-cancrinite phase transformation in synthetic spent Bayer liquor. Microporous Mesoporous Mater. 1999, 31, 287–302. [Google Scholar] [CrossRef] [Scilit]
- Hackbarth, K.; Gesing, T.M.; Fechtelkord, M.; Stief, F.; Buhl, J.-C. Synthesis and Crystal Structure of Carbonate Cancrinite Na8[AlSiO4]6CO3(H2O)3.4, Grown under Low-Temperature Hydrothermal Conditions. Microporous Mesoporous Mater. 1999, 30, 347–358. [Google Scholar] [CrossRef] [Scilit]
- Kenyon, N.J.; Weller, M.T. The Effect of Calcium on Phase Formation in the Sodium Aluminium Silicate Carbonate System and the Structure of NaCaSiO3OH. Microporous Mesoporous Mater. 2003, 59, 185–194. [Google Scholar] [CrossRef] [Scilit]
- Wen, J.; Jiang, T.; Liu, Y.; Xue, X. Extraction Behavior of Vanadium and Chromium by Calcification Roasting–Acid Leaching from High Chromium Vanadium Slag: Optimization Using Response Surface Methodology. Miner. Process. Extr. Metall. Rev. 2019, 40, 56–66. [Google Scholar] [CrossRef] [Scilit]
- Movahhedi, H.; Mohammad Beygiani, A.; Keshavarz Alamdari, E.; Moradkhani, D. Developing of a Counter-Current Copper Leaching Process Using Response Surface Methodology. Miner. Process. Extr. Metall. Rev. 2024, 45, 824–834. [Google Scholar] [CrossRef] [Scilit]
- Kenzhaliyev, B.K.; Amangeldy, B.S.; Mukhanbet, A.; Azatbekuly, N.; Koizhanova, A.; Magomedov, D.R. Development of Software for Hydrometallurgical Calculation of Metal Extraction. Kompleks. Ispolz. Miner. Syra Complex Use Miner. Resour. 2025, 335, 78–88. [Google Scholar] [CrossRef] [Scilit]
- Koizhanova, A.K.; Berkinbayeva, A.N.; Sedelnikova, G.V.; Kenzhaliyev, B.K.; Azlan, M.N.; Magomedov, D.R.; Efremova, Y.M. Research of Biochemical Gold Recovery Method Using High-Arsenic Raw Materials. Metalurgija 2021, 60, 423–426. [Google Scholar]

Disclaimer/Publisher’s Note: The statements, opinions and data contained in all publications are solely those of the individual author(s) and contributor(s) and not of MDPI and/or the editor(s). MDPI and/or the editor(s) disclaim responsibility for any injury to people or property resulting from any ideas, methods, instructions or products referred to in the content. |
© 2026 by the authors. Licensee MDPI, Basel, Switzerland. This article is an open access article distributed under the terms and conditions of the Creative Commons Attribution (CC BY) license.