


Abstract
Green-synthesized Nd-doped (2%)-ZnO samples were produced using hydrothermal synthesis (HT) and freeze-drying (FT) procedures. A water extract from Vaccinium vitis-idaea leaves was used to modify the Nd-containing zinc acetate solution. The hydrothermal synthesis was carried out in an autoclave at 170 °C for 8 h. The lyophilization process was carried out for 20 h at 0.15 mbar and then for a further 4 h at 0.10 mbar and at a temperature of −100 °C. The final treatment after both these procedures was carried out at 400 °C for 2 h. Both synthesis methods produced mixtures of rugby-like and ridged ZnO particles. The FT particles possess smaller crystallites sizes (24 nm) and higher polarity (I002/I100) in comparison with the hydrothermally obtained particles. It was ascertained by EPR analyses that there was a higher concentration of oxygen-vacancies-related paramagnetic centers after freeze-drying synthesis (more intensive line at g = 2.000). The photocatalytic reaction rates of the freeze-dried samples toward Malachite Green dye discoloration were found to be higher than those of the HT samples. These rates were greatly affected by the smaller crystallites sizes, higher number of singly ionized oxygen vacancies in the crystal lattice and higher surface polarity.
1. Introduction
Some nanometer-scale zinc oxide semiconductors (powders and thin films) have been extensively studied due to their low cost combined with their attractive photocatalytic, gas-sensing, optical, electrical and magnetic properties [1]. The incorporation of dopants into ZnO is another way to influence the crystal structure, morphology, particle size, shape and the presence of surface defects in ZnO powders, which are responsible for their physicochemical properties [2]. The addition of dopant or impurity to ZnO creates extrinsic n or p-type defects in the crystal lattice. The doping of ZnO with rare earth metals (such as Sm, Y, Nd, Gd) is an efficient way to control the band-gap value of ZnO nanostructures in order to obtain the desired properties [3,4,5]. The direction and magnitude of the changes in the band gap depends on the type and the concentration of the doping element. Rare earth metals possess high conductivity and a high refractive index, and doping with these metals could be a viable approach for the preparation of ZnO structures with a controlled concentration of lattice defects. For instance, the high concentration of oxygen defects is responsible for the improved photocatalytic/antimicrobial activity of ZnO [6]. Several research groups have proved that the doping using neodymium improves the optical and photocatalytical properties of ZnO materials. The neodymium exerts a significant impact on the magnetic/electrical properties, photocatalytic activity, gas sensitivity and selectivity, and it reduces the band gap, causing an increased absorption in the visible region of ZnO [7,8,9,10]. The increased photocatytic performance of Nd-ZnO nanopowders has been explained by the presence of both types of oxygen defects: antisite OZn and interstitial oxygen Oi due to the Nd doping [11].
Some well-known ZnO synthesis methods include mechanical milling [12], the CVD method [13], or the decomposition of zinc-containing salts [14]. The hydrothermal method is very attractive due to the possibility of preparing fine grain-sized zinc oxide possessing the desired morphology and a highly developed specific surface area [15]. Researchers have paid significant attention to the green synthesis route for oxide and metal particle, which is a non-toxic and eco-friendly method that uses different biological systems, such as plants, bacteria, fungi or algae [16]. Among these plants, there are easily available and cheap precursors [17]. Typically, plant-extract-mediated metal oxide synthesis involves mixing the aqueous extract with a precursor solution of the corresponding metal salt. The reaction occurs at room temperature and is complete rapidly. The reduction and chelating processes are quite complex due to the participation of the great number of organic compounds in the plant. Research groups have proved that the major phytochemical constituents of the Vaccinium vitis-idaea L. plant are phenologlycosides, phenylpropanoids, anthocyanins, saponins, arbutin, hydroquinone and flavonoids [18]. The biocompounds in the plant extract with (–OH) functional groups act as a reducing and stabilizing agent in the synthesis of ZnO [19]. Our research group has successfully applied a combination of bio and hydrothermal synthesis methods for ZnO using Mentha Arvensis extract [20]. We have established the positive role of the plant extract addition on the surface area, crystallites sizes, band-gap value and formation of lattice defects.
Recently, the freeze-drying method (lyophiliozation) has attracted significant research attention as a new simple route for preparing large-scale multifunctional materials having novel structures, which possess hierarchical porosity [21]. The porous structure can be controlled by the choice of some technological parameters such as the freezing temperature, concentration, and solvent type [22]. During the freeze-drying process, solvent ice crystals are growing, acting as templates, and the particles are solidified between these crystals. The size of ice crystals varies from several microns up to hundreds of microns. The size and orientation of the ice crystals exert a strong influence on the type of microstructure. In this way, a porous structure is being formed. Last year, a few studies were published that were devoted to the application of freeze drying in the bio-synthesis of ZnO [23,24]. Piva et al. observed the positive effect of the freeze-drying procedure on the photocatalytic and antibacterial efficiency of zinc oxide particles. Modifying freeze-dried ZnO solutions with thyme extract leads to smaller particle sizes and a higher degree of crystallinity [22]. Another research group revealed that Moringa leaves modified with freeze-drying synthesis results in a higher oxygen-to-zinc ratio and the formation of porous 2D nanoflakes. The samples exhibited high visible light photocatalytic efficiency for methyl orange dye degradation [24]. Our preliminary unpublished results have revealed that the doping of ZnO (low concentration dopant—up to 2 atomic percents) with several rare earth elements, by green-hydrothermal synthesis, increases the antimicrobial efficiency of the particles. ZnO nanopowders doped with 2% Nd stand out as the most efficient antibacterial material.
The aim of this paper was to evaluate the changes of the physicochemical parameters of green modified ZnO-Nd freeze-dried particles in comparison to those of hydrothermally synthesized particles as well as to define the potential of these materials as photocatalysts for Malachite Green dye discoloration.
2. Results and Discussion
2.1. EPR Analyses
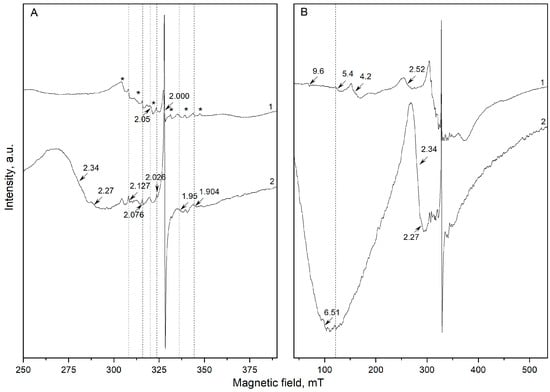
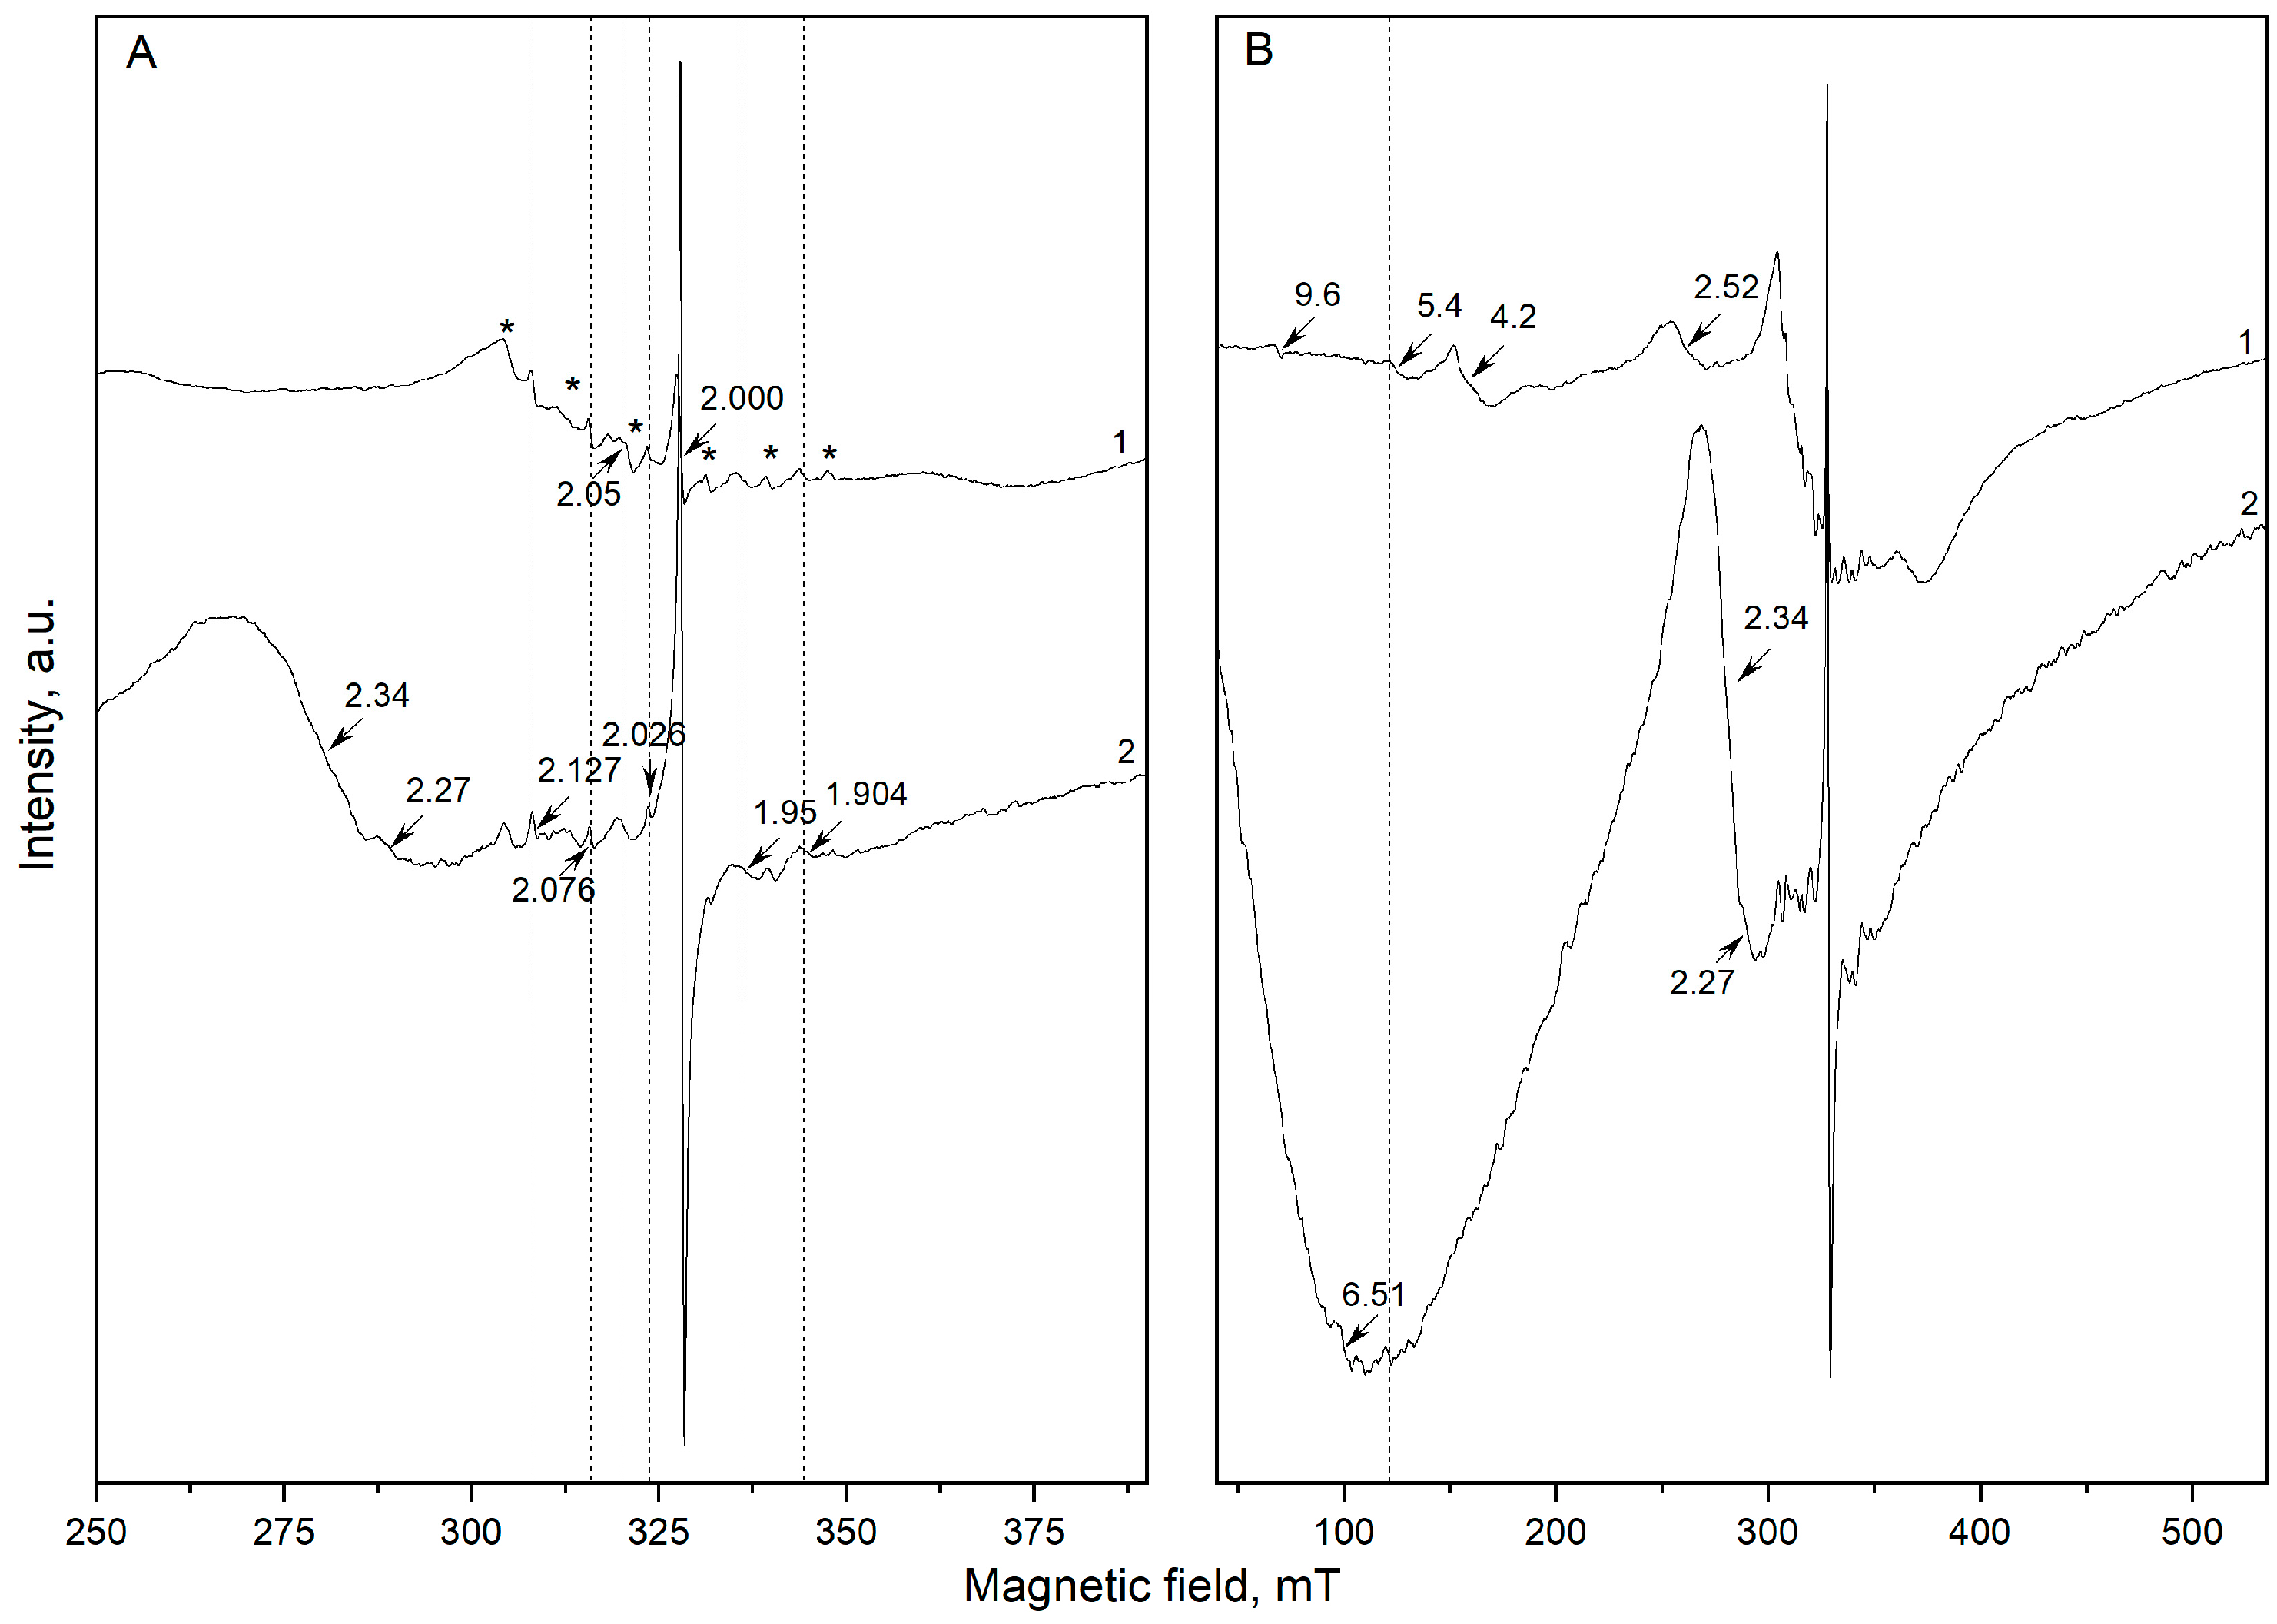
In order to evaluate the influence of the drying procedure on the defect structure of Nd-doped ZnO, the EPR spectra of the powders, prepared by conventional drying and freeze-drying procedures, were compared. The X-band EPR spectra of these samples were recorded both within narrow and wide magnetic field sweeps, and these are represented in Figure 1.
Figure 1.
X-band EPR spectra of: picture (A) narrow magnetic field sweep and (B) wide magnetic field sweep; (1)—ZnO hydrothermal synthesis–HT, (2)—ZnO freeze-drying-FT. *—Mn2+ line.
The EPR spectra of both types of samples exhibit several identical resonance lines in the magnetic field region 350–300 mT. The signals at g = 1.95 and g = 1.904 are associated with shallow effective mass donor centers (SD), which are most likely assigned to Zn-related defects and zinc interstitial donors (Zni) [25,26,27,28]. The resonances at g = 2.026–2.127 are attributed to vacancy-related (: and V0–VZn complexes) [29] and surface-related oxygen radical species (e.g., O2•−, OH•) or defect-modified oxygen sites [30,31]. The resonance line at g = 2.127 is probably associated with zinc vacancy-related centers [32]. The persistence of these signals demonstrates that freeze drying does not substantially modify the bulk defect structure of the ZnO lattice. A significant difference between the two samples is observed for the intensive resonance line at g = 2.000, which can be attributed to singly ionized oxygen vacancies () [25,26]. The significant increase in the intensity of the resonance line at g = 2.000 of the freeze-drying sample indicates a higher concentration of oxygen-vacancy-related paramagnetic centers. In order to provide a semi-quantitative comparison of the defect centers preserved in both samples, the relative spin concentrations were estimated using the relation Ippx(∆Hpp)2 (see Table 1 and Table 2). The calculations were performed for the well-resolved resonance lines at g = 1.904, 1.950, 2.000, 2.026, 2.076, and 2.127, which are present in both spectra. The resonance at g ≈ 2.05 was excluded from the analysis because it partially overlaps with the third hyperfine component of the Mn2+ sextet, preventing reliable determination of its intensity and line width. The calculated values were obtained after normalization of the EPR signal intensity to the same receiver gain and sample mass. Therefore, the relative spin concentrations can be directly compared between the investigated samples. The semi-quantitative analysis based on the relative spin concentration reveals that freeze-drying does not uniformly increase the concentration of all paramagnetic defects. Instead, a selective redistribution of defect centers is observed. The oxygen-vacancy-related center at g = 2.000 exhibits an approximately 3.3-fold increase in relative concentration, whereas the donor-related resonances at g = 1.904 and 1.950 remain nearly unchanged. In contrast, the signals assigned to vacancy-related and surface oxygen centers (g = 2.026–2.127) decrease substantially after freeze-drying. These results indicate that freeze-drying preferentially stabilizes isolated singly ionized oxygen vacancies while suppressing the formation of more complex vacancy-related centers. The simultaneous narrowing of the g = 2.000 resonance further suggests a more homogeneous local environment and weaker spin–spin interactions for the preserved VO+ centers.
Table 1.
EPR parameters and relative spin concentrations of the paramagnetic centers detected in HT samples.
Table 2.
EPR parameters and relative spin concentrations of the paramagnetic centers detected in FT samples.
Some additional differences are observed in the intermediate g-factor region. The freeze-dried sample exhibits two new resonance lines: a broad signal centered at g = 2.34 (ΔHpp = 25.54 mT) and a narrow resonance line at g = 2.26 partially overlapping with the first one mentioned. These signals are absent in the conventionally dried sample. The narrow resonance at g = 2.26 is attributed to a defect center, which possibly involves oxygen-vacancy-related complexes stabilized during freeze-drying. In contrast, the broad signal at g = 2.34 is indicative of defect clusters or some strongly interacting paramagnetic centers characterized by a distribution of local environments. The simultaneous enhancement of the g ≈ 2.00 signal signifies the assumption that these centers are associated with oxygen-vacancy-containing defects. Some contributions from Nd-related defect complexes cannot be excluded. An additional resonance line at g = 6.51 is also detected exclusively in the freeze-dried sample. Such high g-factor values are typically associated with strongly anisotropic paramagnetic centers. This signal could originate from Nd-related defect complexes stabilized during freeze-drying. The absence of this signal in the conventionally dried sample suggests that these centers are either thermally unstable or they are transformed during conventional treatment. In contrast, the hydrothermally obtained sample is exhibiting weak resonance lines at g = 4.2 and g = 9.6, which are absent in the freeze-dried material. Signals in this range are frequently attributed to isolated Fe3+ ions occupying distorted lattice sites [33,34]. Their disappearance after freeze-drying could indicate changes in the local environment of Fe-containing centers or their incorporation into more complex defect structures that are EPR-silent under the experimental conditions. The six characteristic lines in the EPR spectrum, which can be assigned to Mn2+-related signals, are observed around g ≈ 2 (S = 5/2, I = 5/2) [35]. The signal at g = 5.4 in both samples indicates that the drying procedure does not significantly affect the distribution of manganese-containing centers. Overall, the EPR results demonstrate that freeze-drying mainly affects the concentration and distribution of both surface defects and vacancies-related defects, while it is preserving the fundamental donor and acceptor defect structure of Nd-doped ZnO lattice.
2.2. XRD Analyses
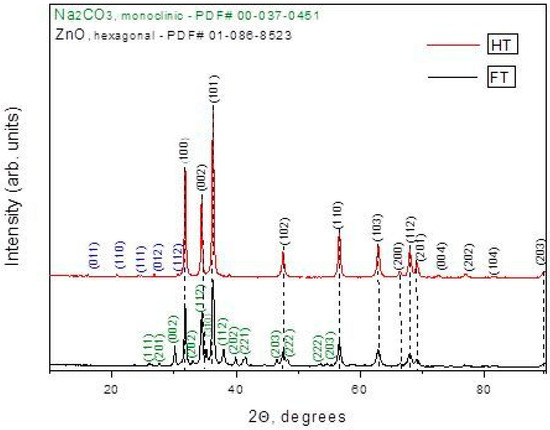
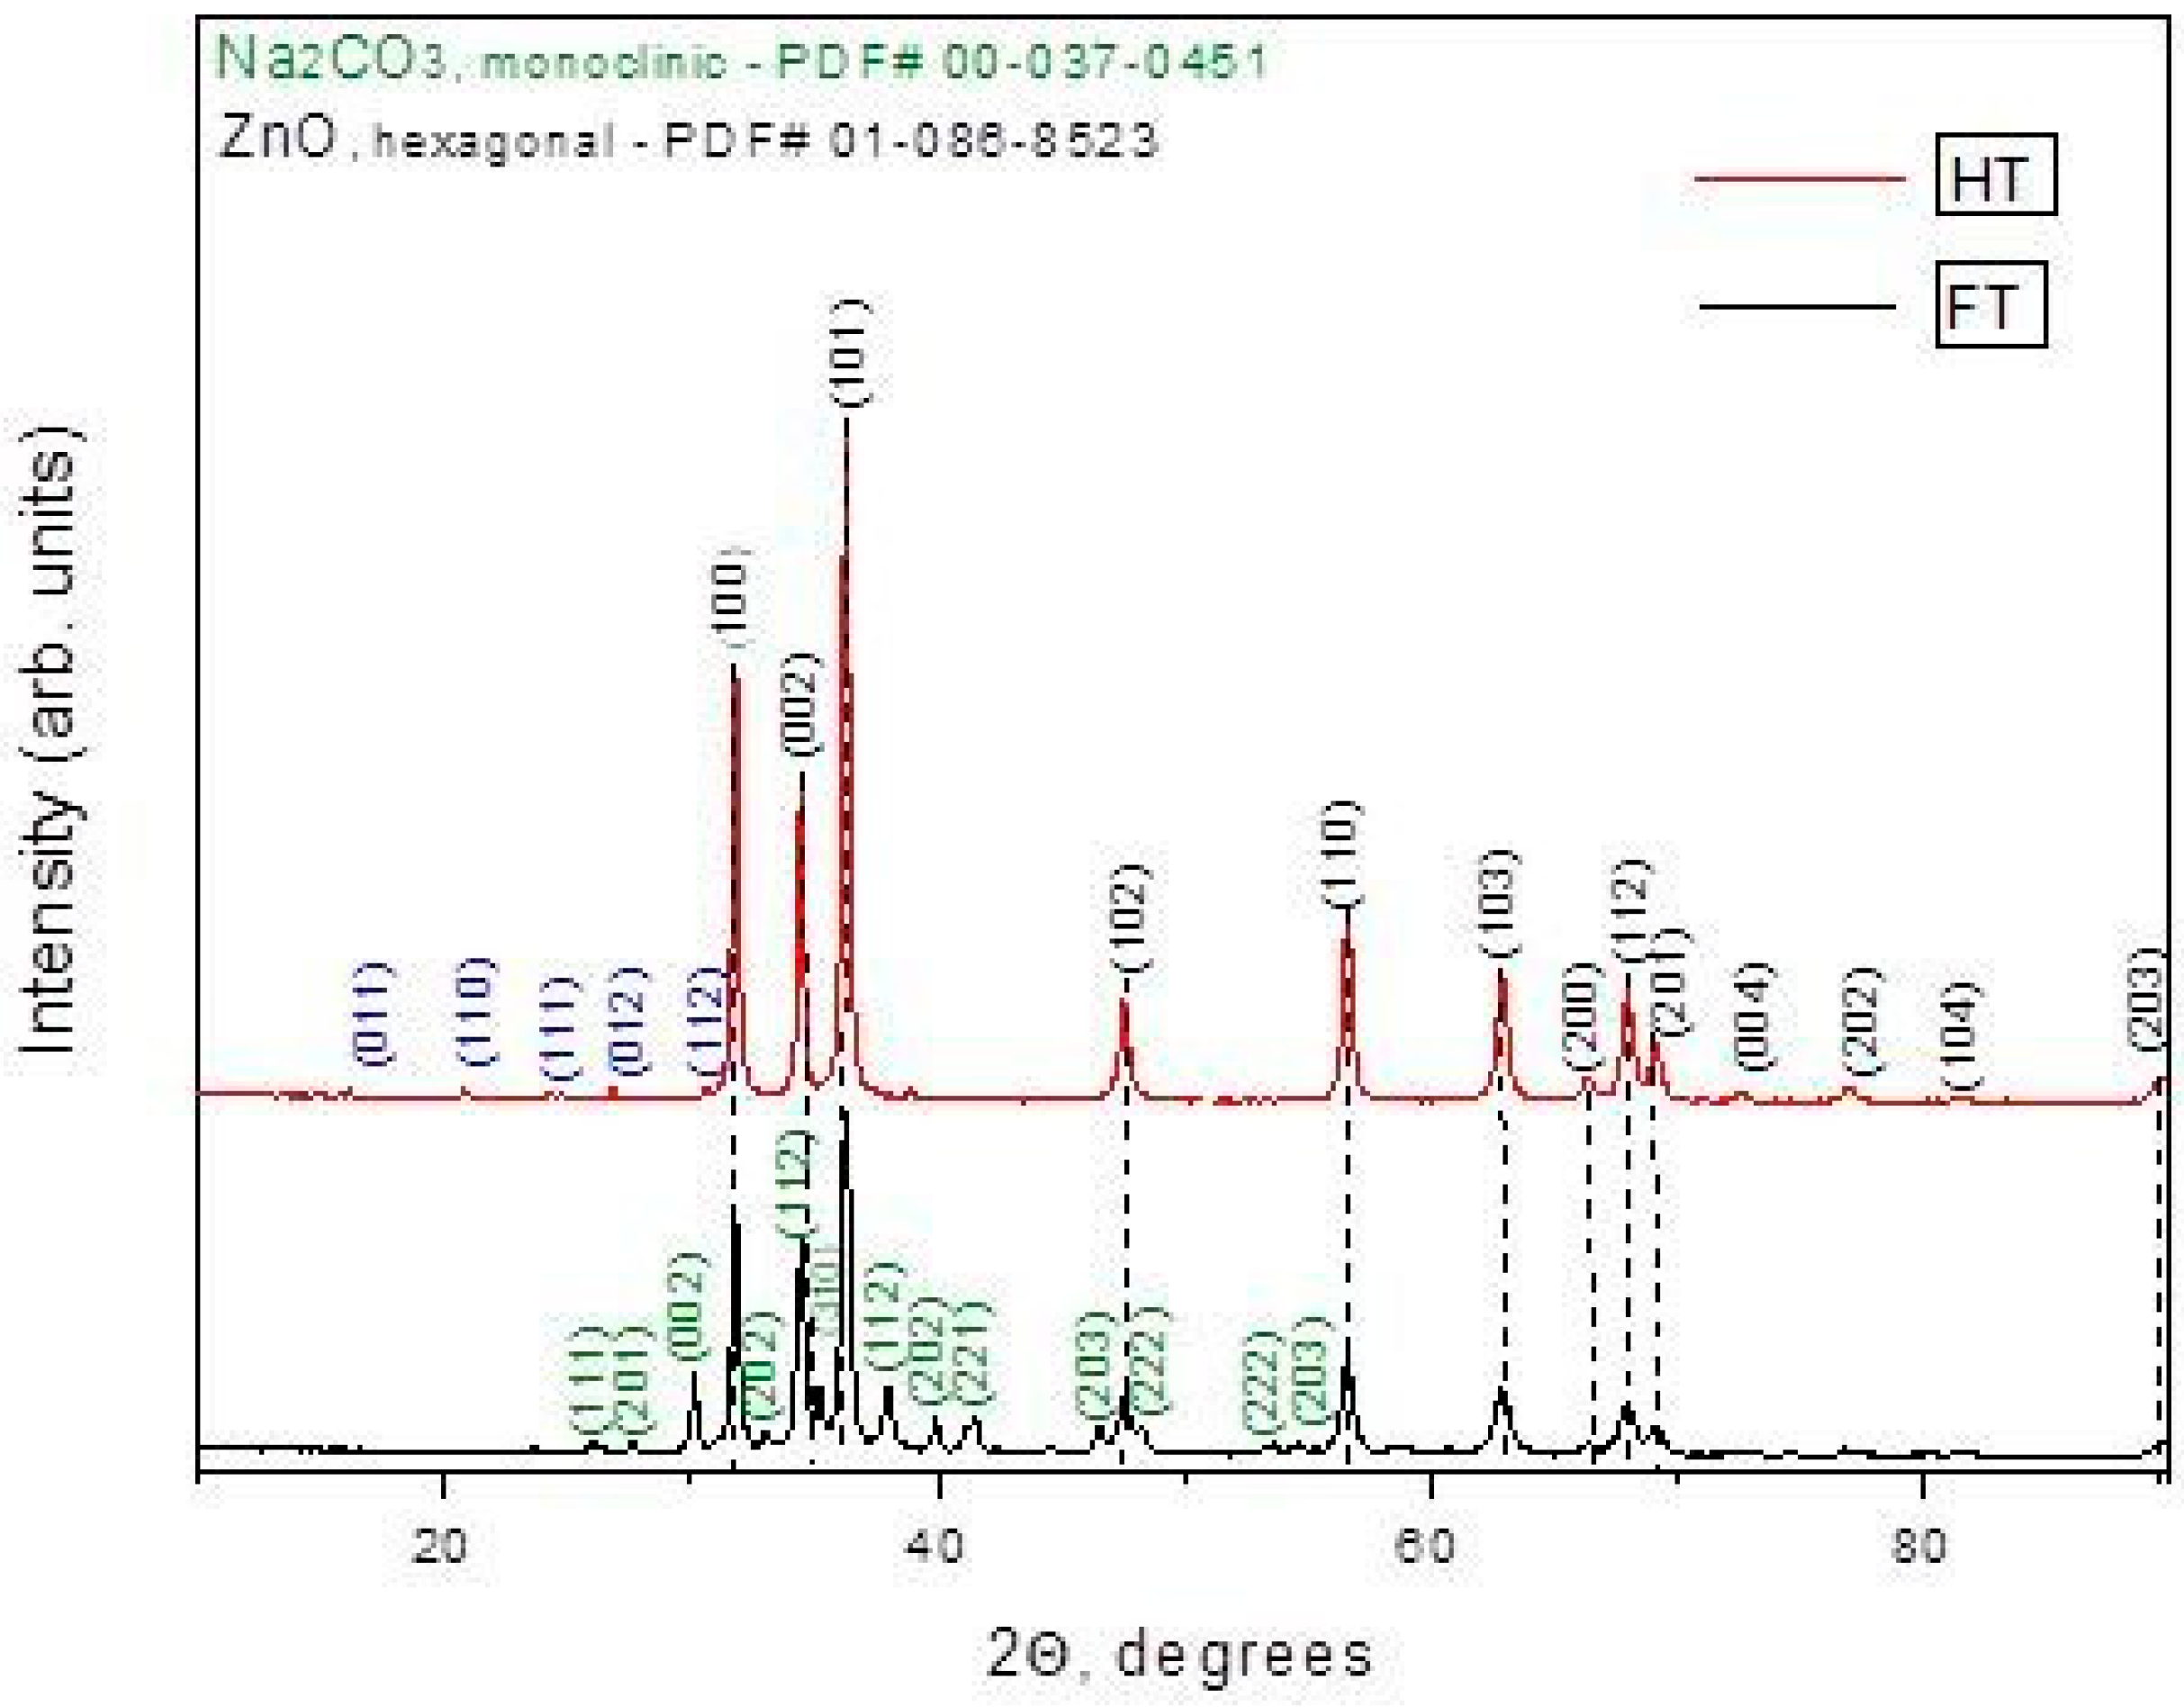
Figure 2 shows the XRD patterns of Nd-doped ZnO nanomaterials, which are synthesized by hydrothermal and freeze-drying methods. The diffraction peaks, corresponding to the characteristic crystallographic planes, confirm the formation of the hexagonal wurtzite ZnO phase. In contrast, the material obtained by the freeze-assisted route exhibited a two-phase composition. In addition to the dominating wurtzite ZnO phase, quantitative phase analysis revealed a significant amount of Na2CO3. The results of the quantitative phase analysis, including the degree of crystallinity, crystallite size, polarity, and lattice micro-strain, are summarized in Table 3. The degree of crystallinity showed similar values for both synthesis methods, whereupon the HT sample exhibited a slightly higher degree of crystallinity (difference ~ 1.6%). The hydrothermal method also resulted in the formation of larger crystallites (32 nm), whereas the freeze-assisted route produced smaller crystallites (24 nm). These observations suggest that the freeze-assisted synthesis pathway promotes the formation and stabilization of sodium carbonate, while it is simultaneously inhibiting crystallite growth.
Figure 2.
XRD patterns of HT and FT samples.
Table 3.
Crystallographic data of the ZnO samples.
It is known that the polarity of the surface is in relationship with the 002 and 100 planes’ diffraction intensity ratio (I(002)/I(100)). The FT sample exhibits higher polarity than the HT sample (0.89 vs. 0.75). Silva et al. [36] have proved that the increased polarity of the polymer-modified samples is in correlation with their increased photocatalytic activity. Thus, it is noteworthy to conclude that the freezing method not only changes the phase composition, it also changes the texture of ZnO powders.
2.3. SEM/EDX and TEM Analyses
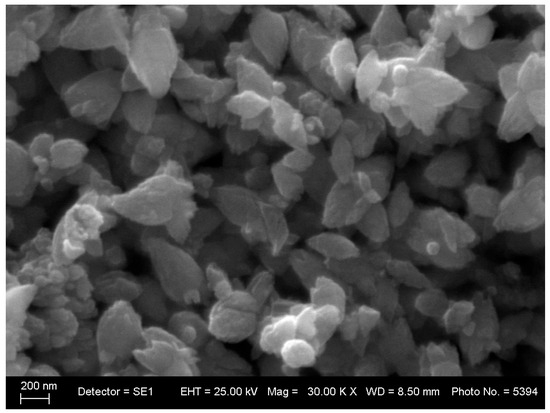
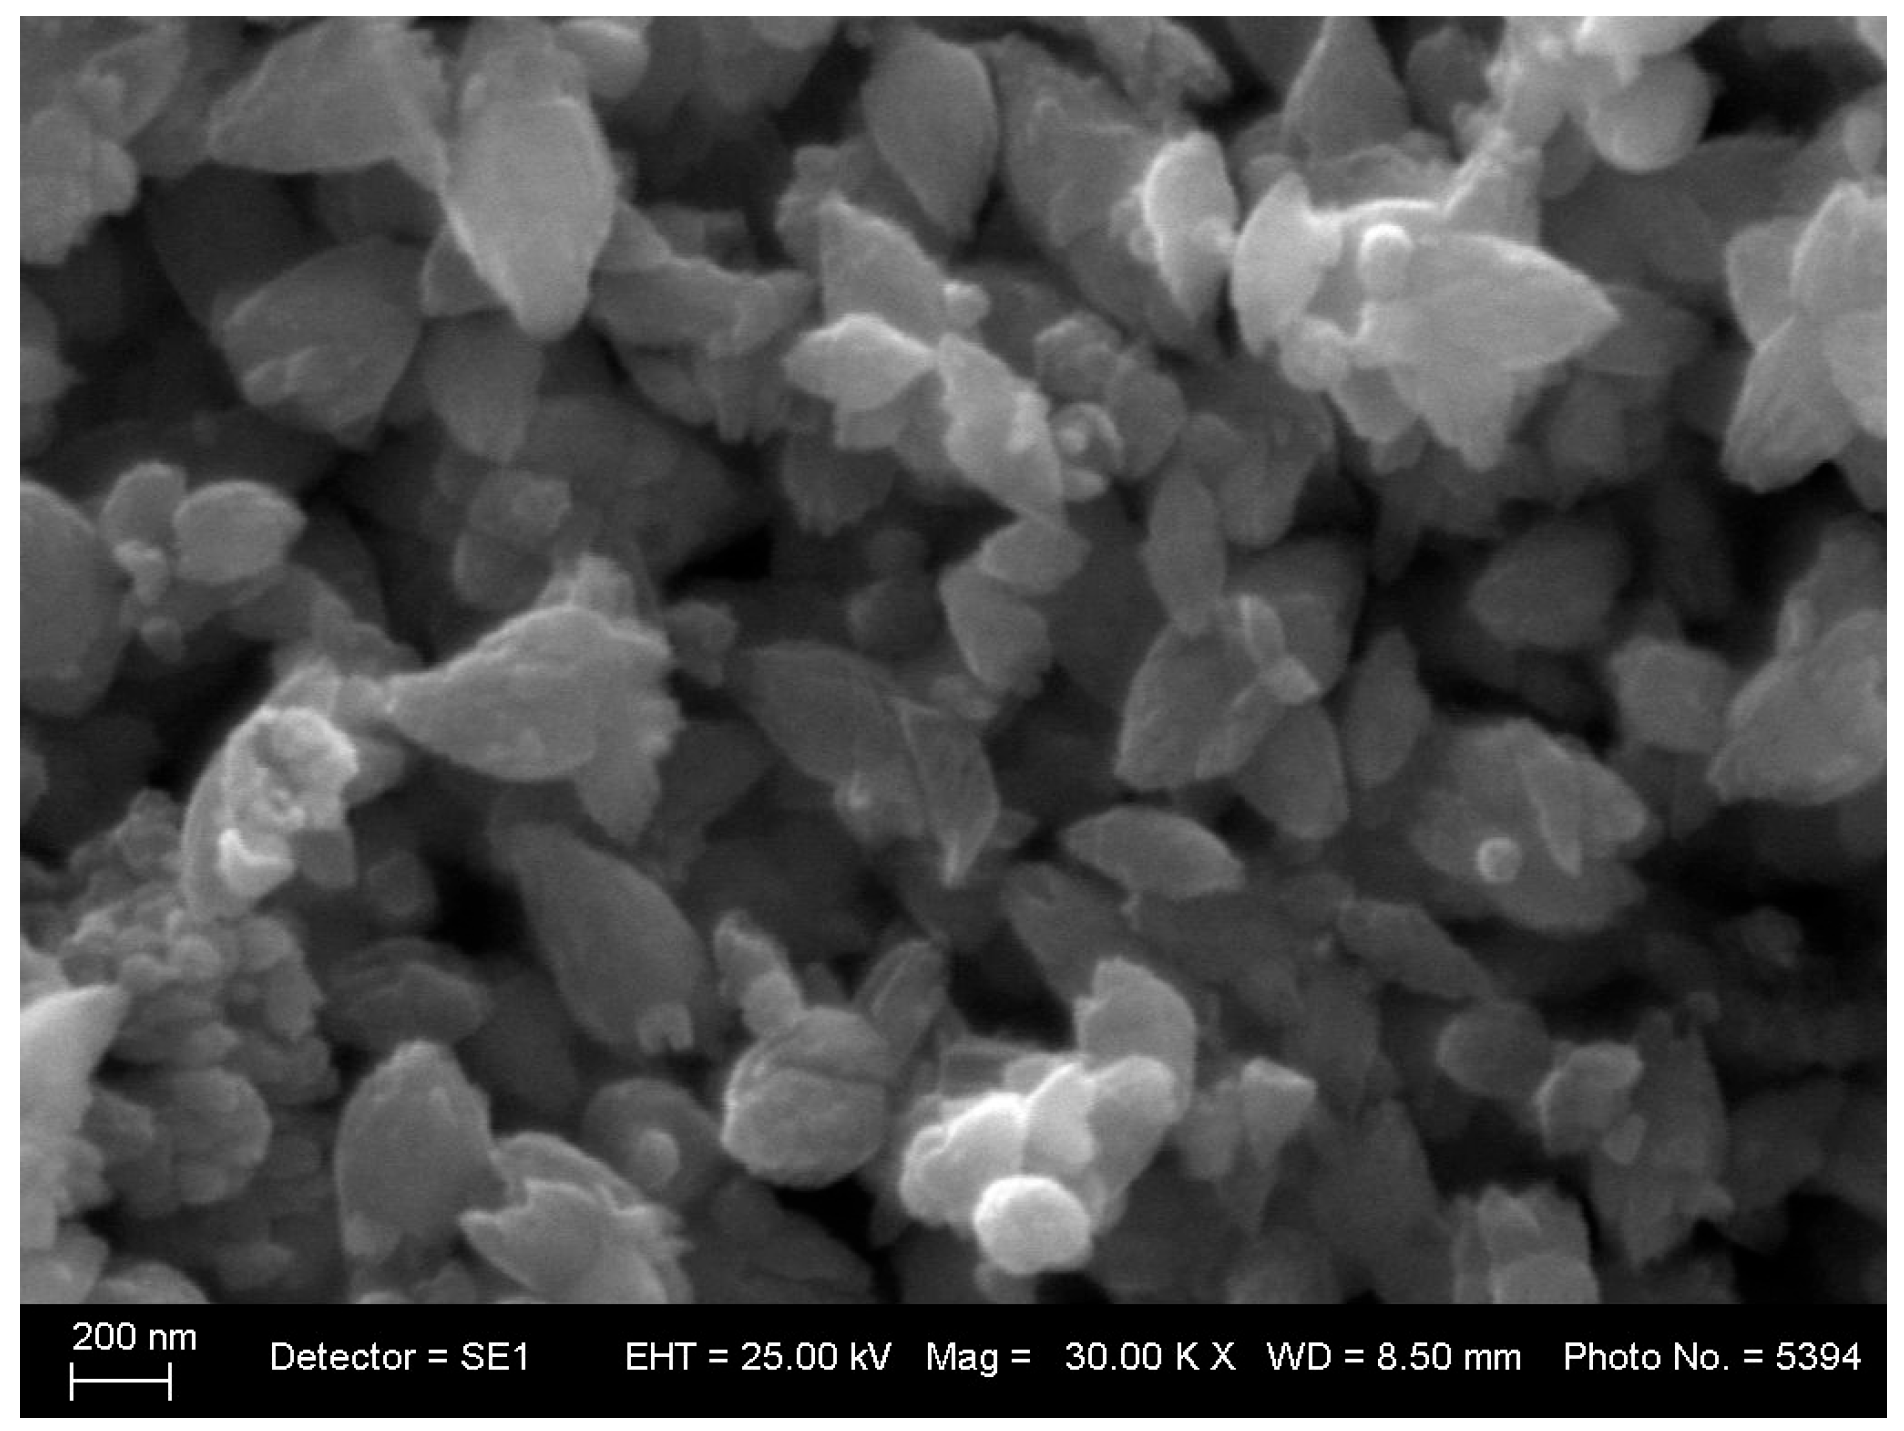
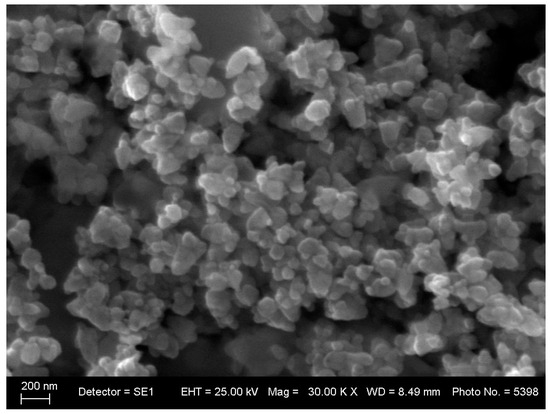
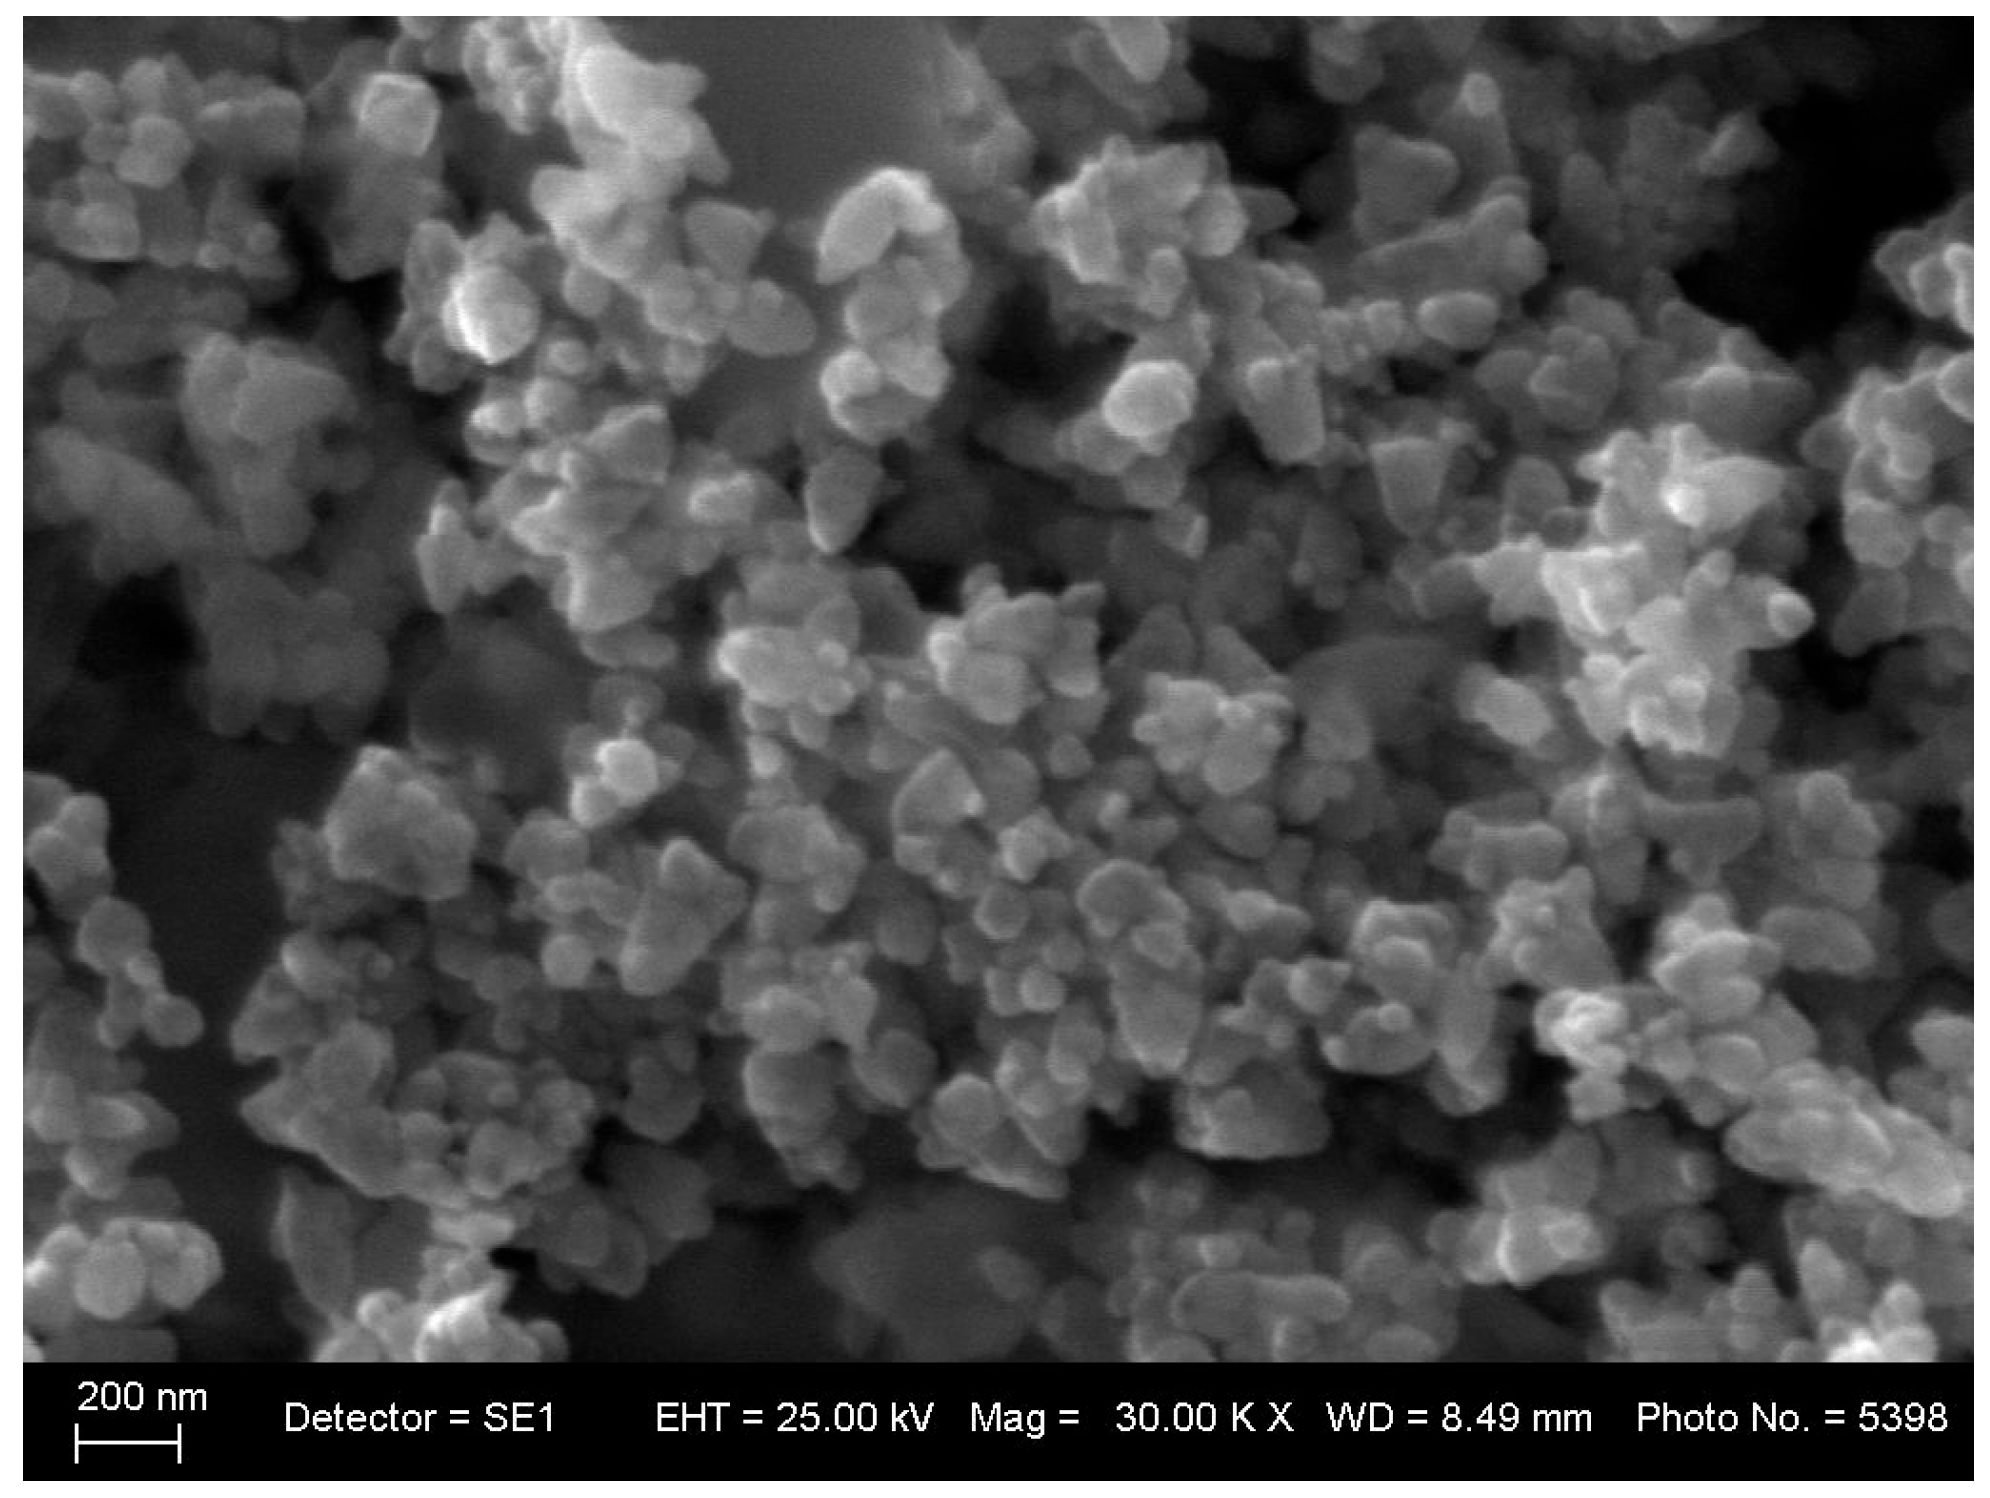
Figure 3 reveals the fact that hydrothermal treatment produces rugby-like and ridged ZnO particles having various sizes (diameters within 50–250 nm range). The freeze-drying procedure results in particles with a similar shape (Figure 4). It has to be noted that the lyophilized particles are significantly finer, having diameters up to 100 nm.
Figure 3.
SEM photograph of HT powders.
Figure 4.
SEM photograph of FT powders.
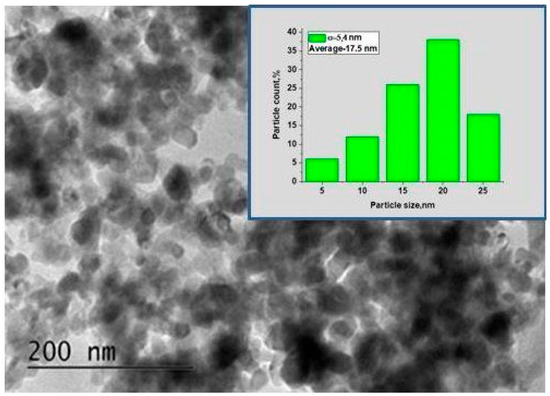
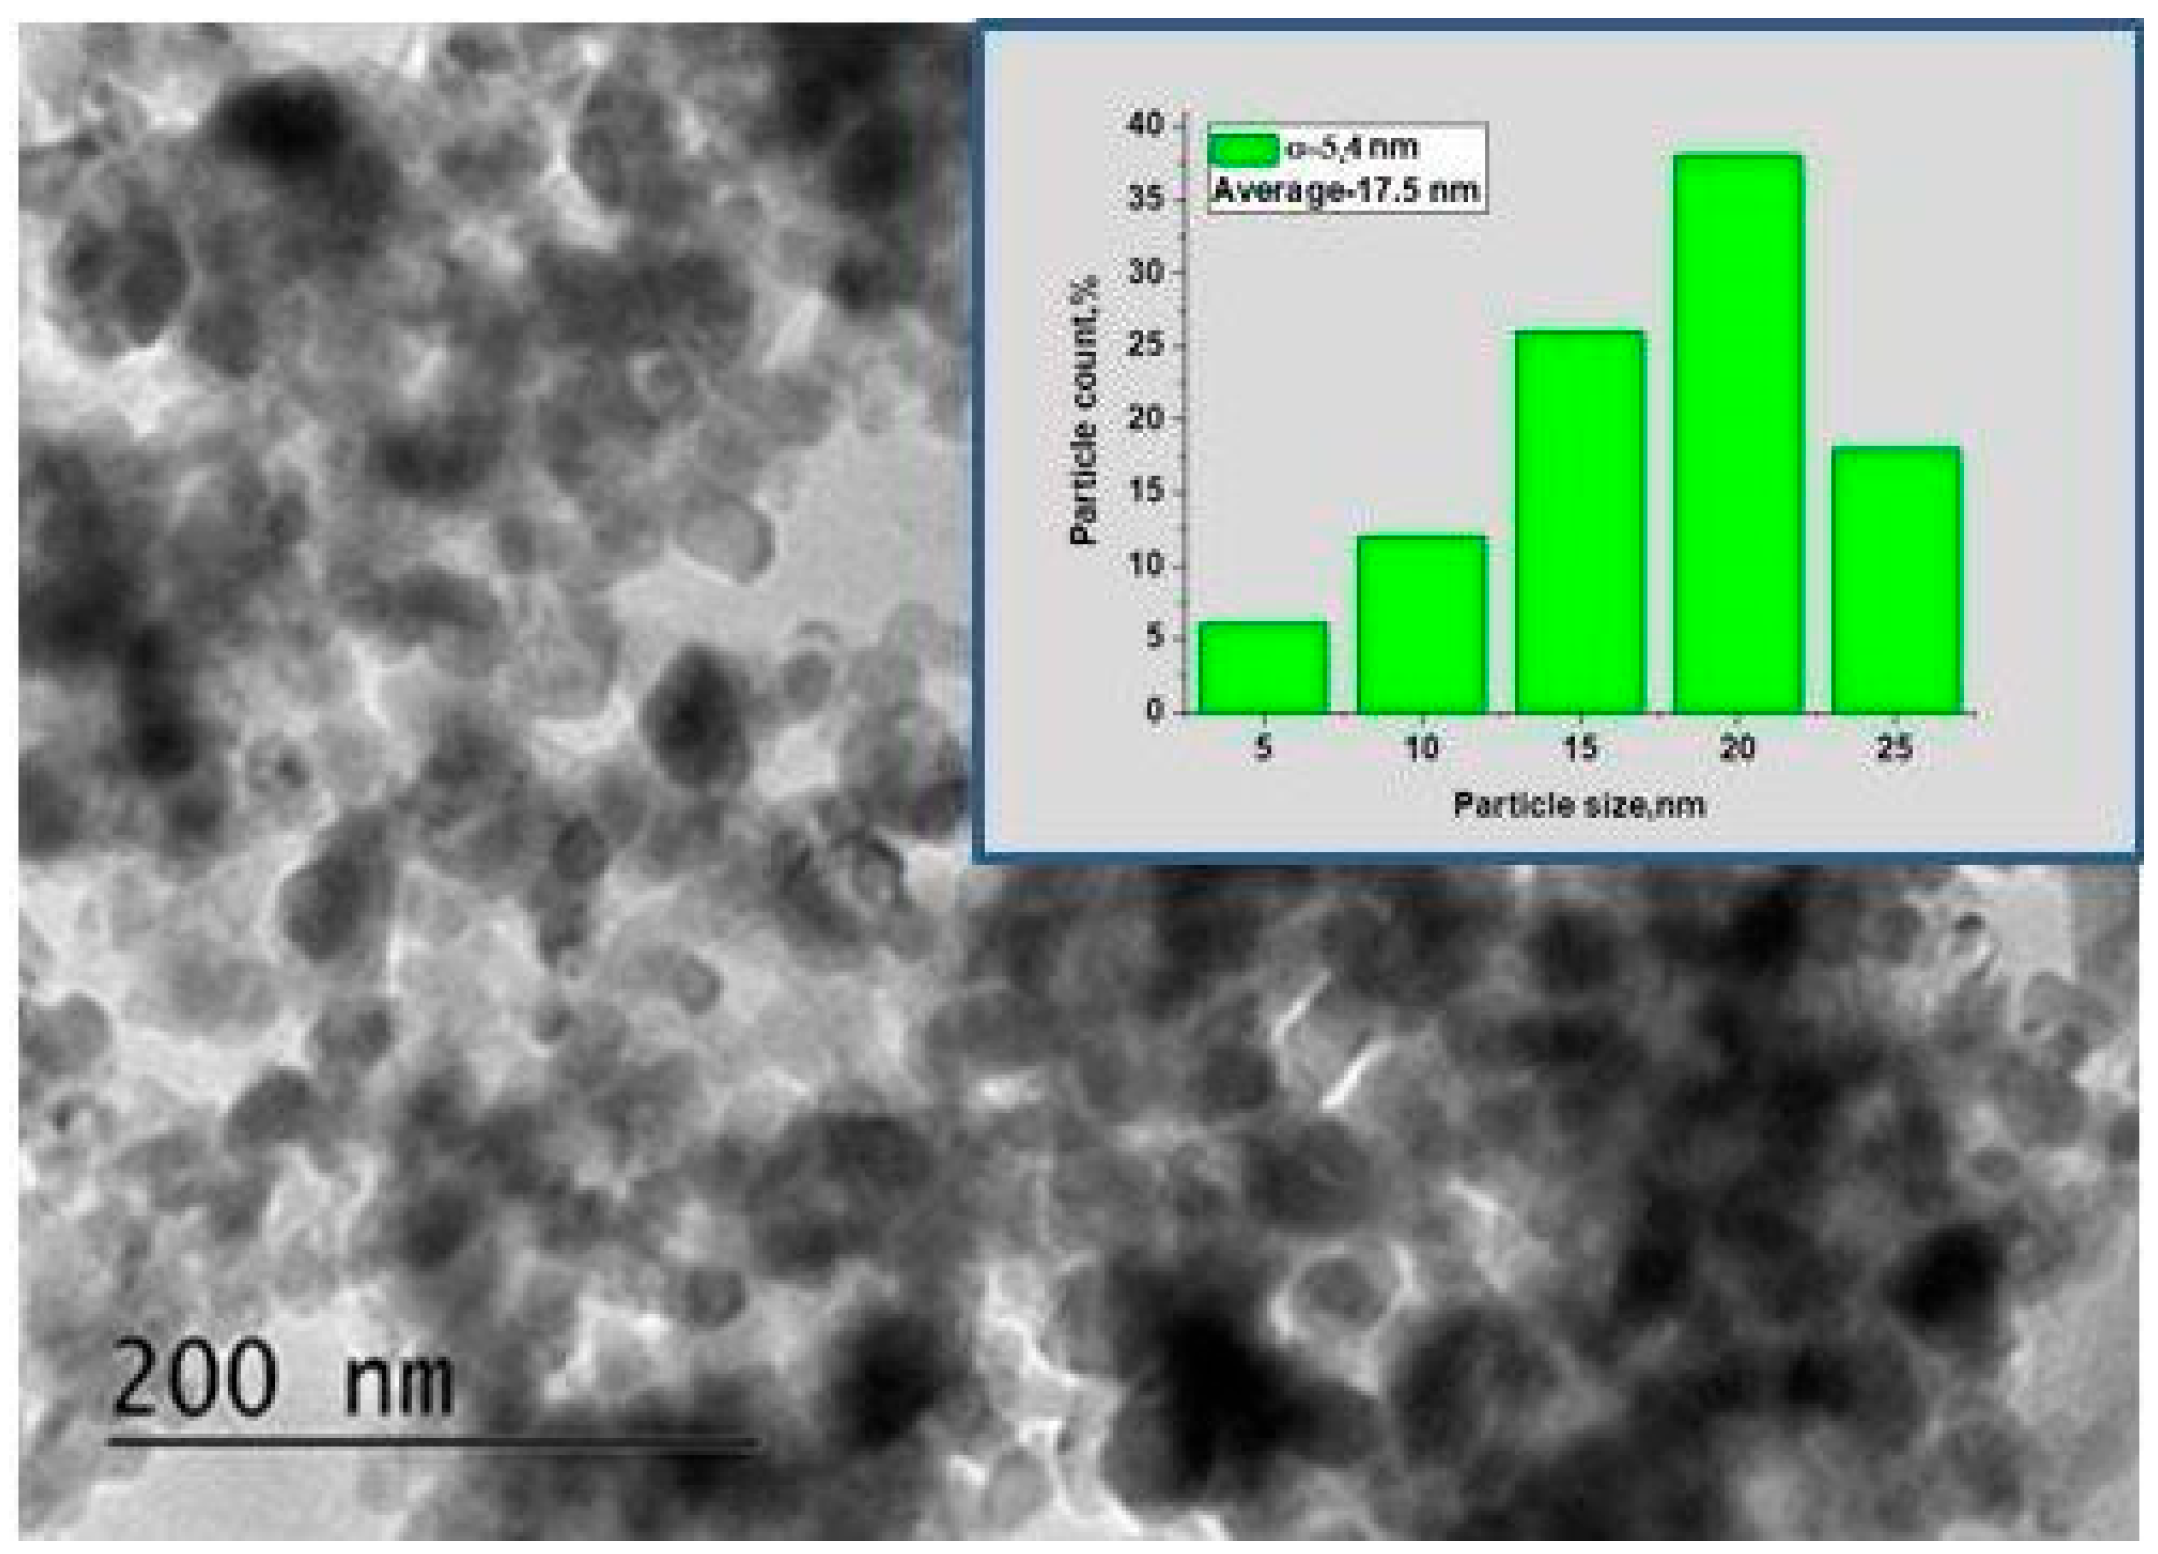
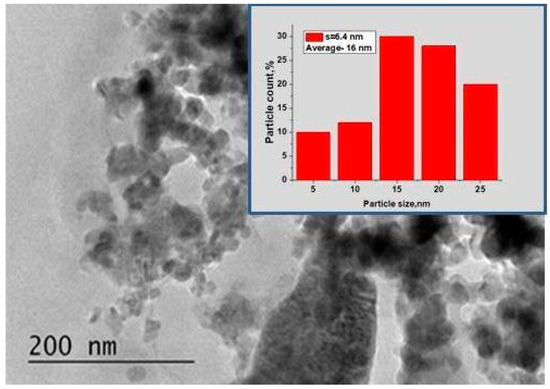
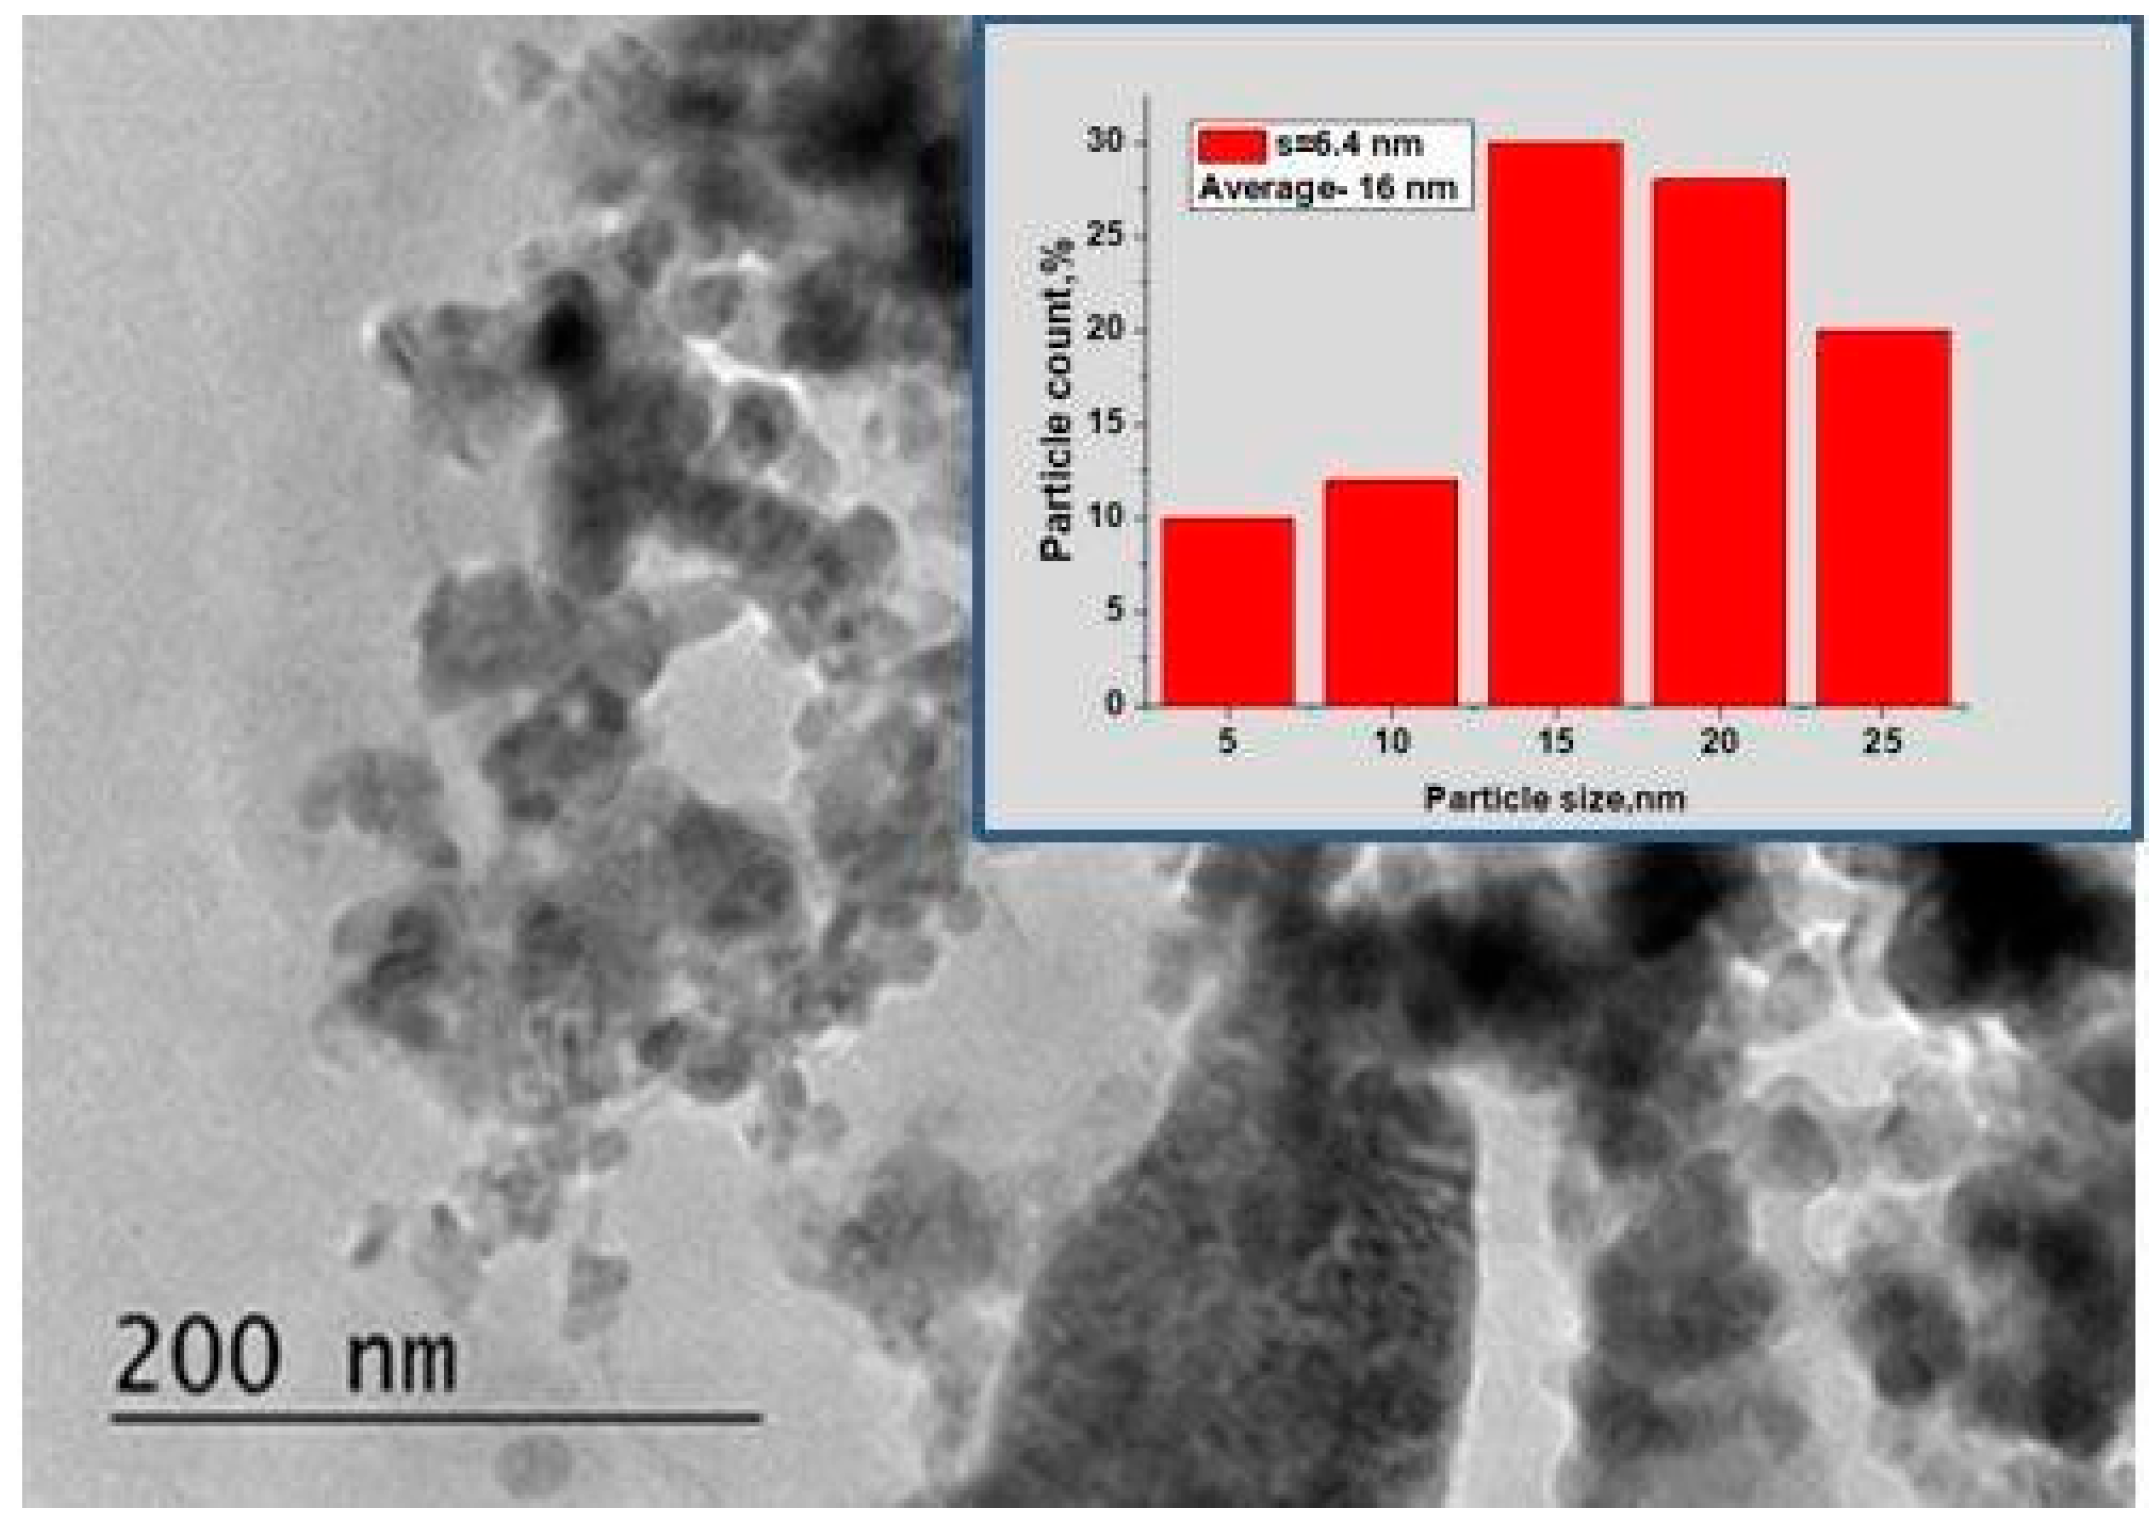
The transmission electron microscopy photographs in Figure 5 and Figure 6 show the obtained results from SEM analyses. Both samples possess ridge-shaped particles. The lyophilization leads to the formation of more aggregated particles (FT sample). The particle distributions of both samples are very similar. The average particles sizes, evaluated by TEM analyses, are in accordance with the SEM photographs.
Figure 5.
TEM photograph of HT powders.
Figure 6.
TEM photograph of FT powders.
2.4. IR Analyses
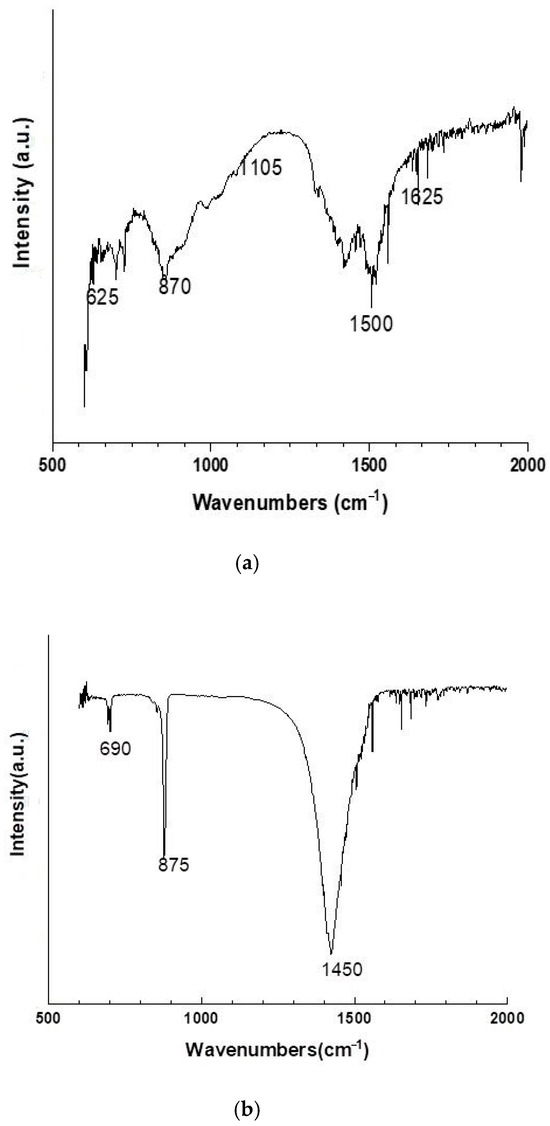
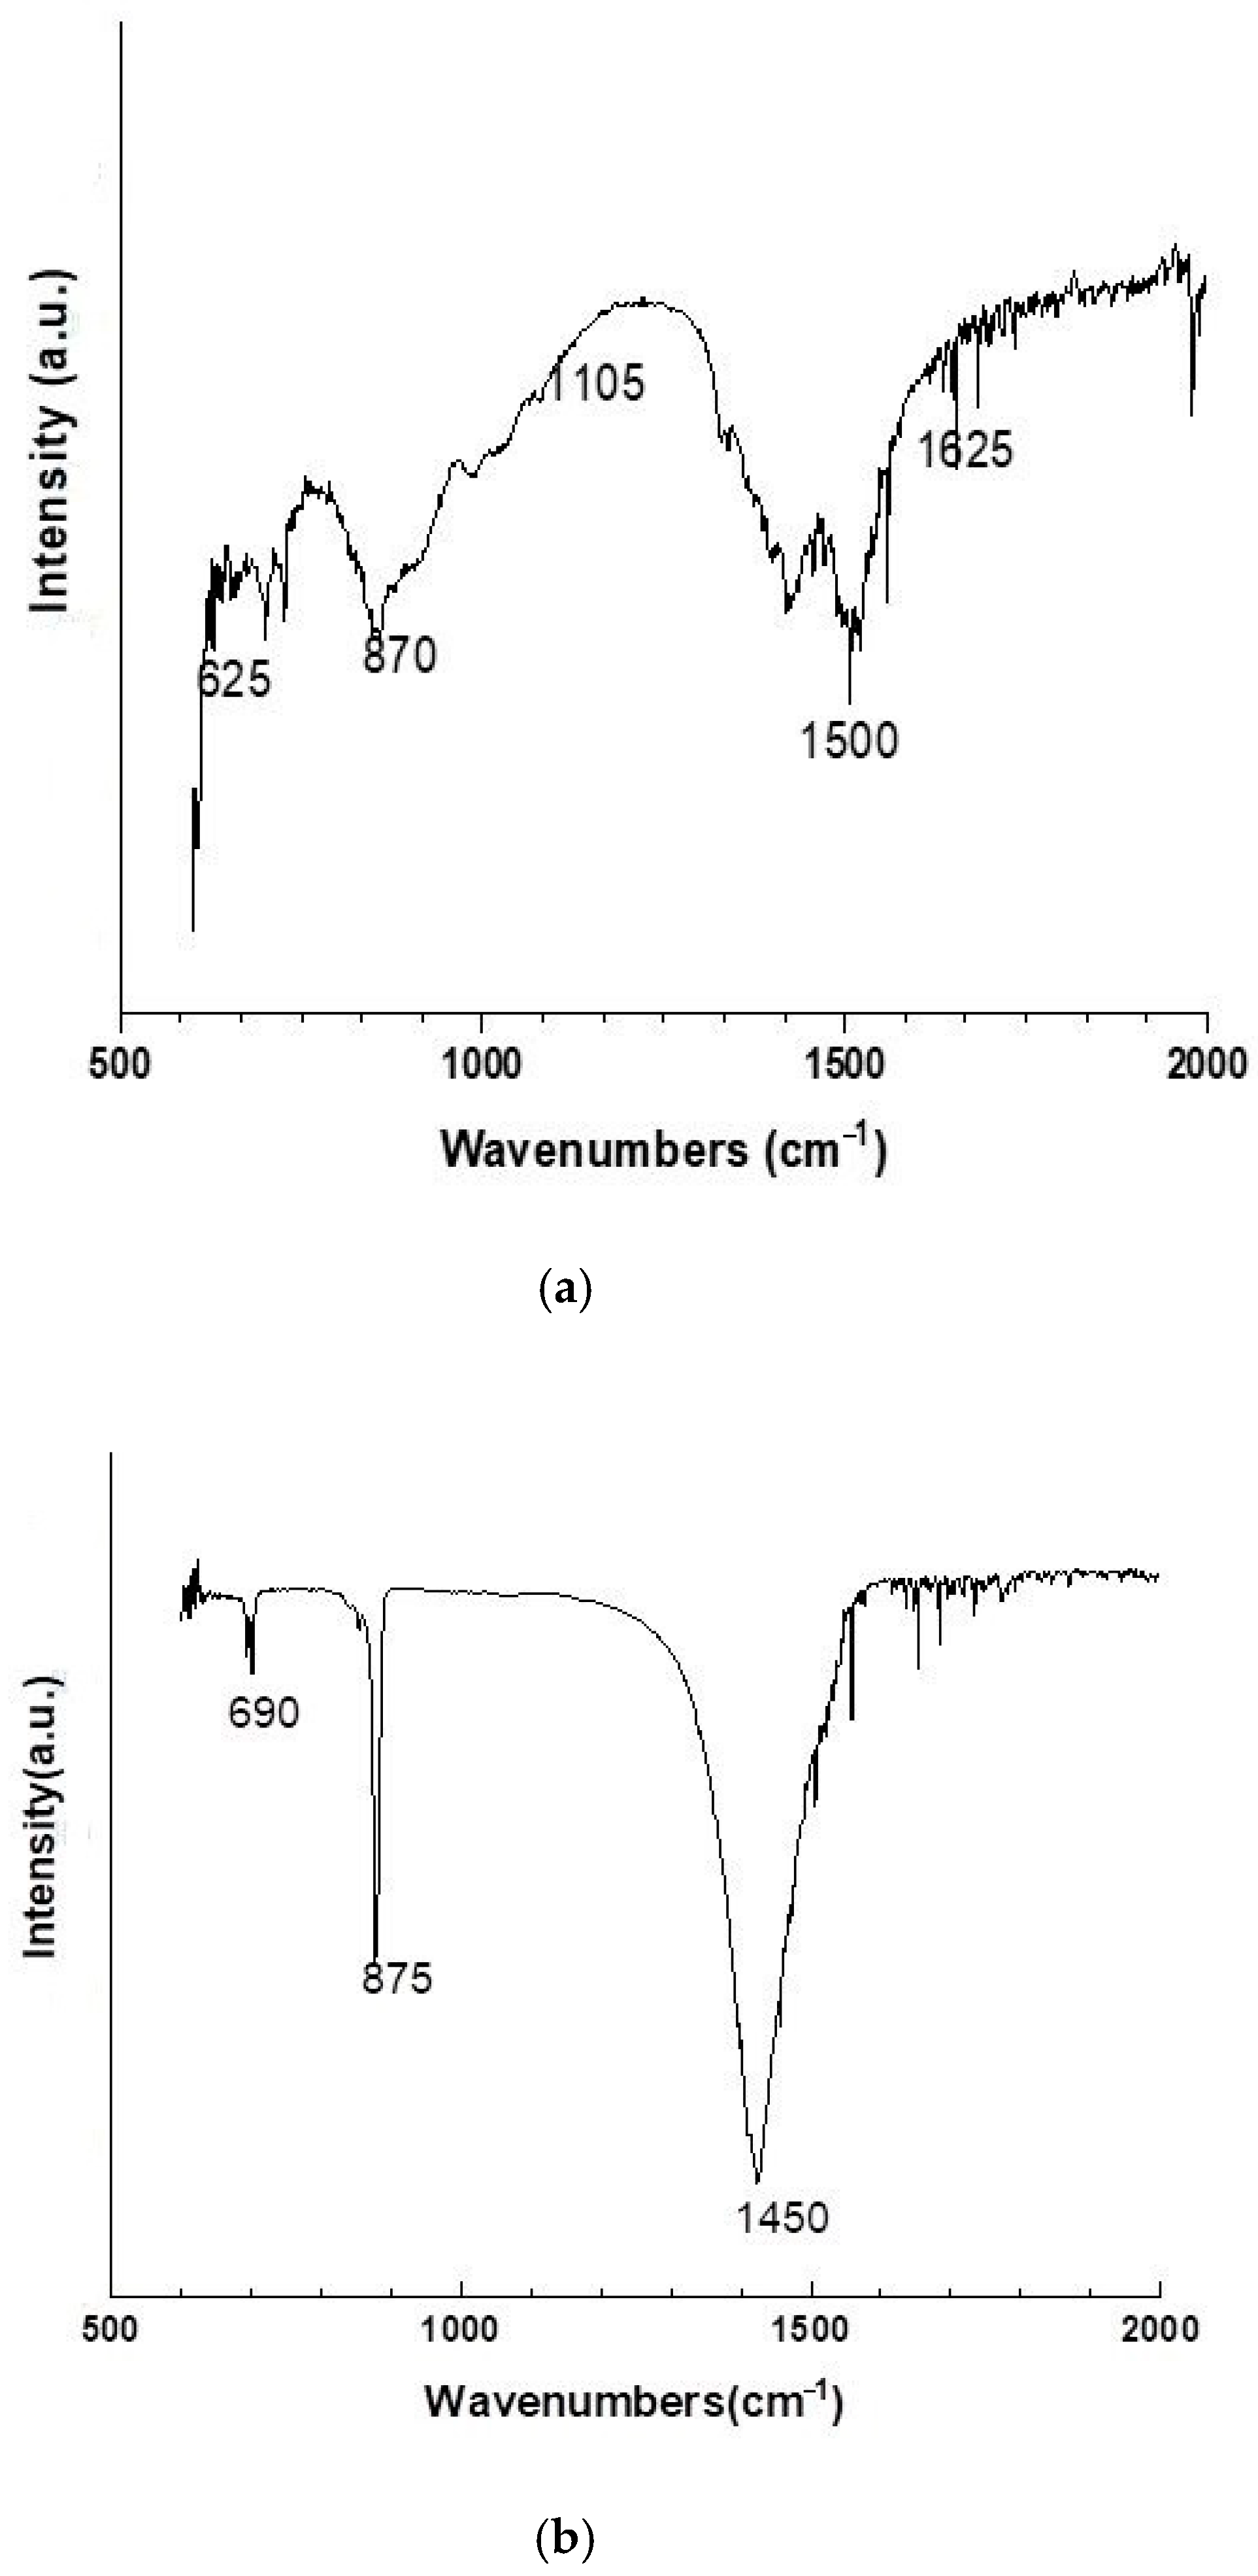
The bands at 750–400 cm−1 are attributed to the Zn–O bonds (formation of ZnO nanoparticles) (Figure 7). All the higher frequency absorption bands (O–H, C–H, C=O, C–O, C=C) are due to the organic molecules contained in the plant extracts, which act as reducing/stabilizing agents. They play the role of a “shell” around the nanoparticles. The main active ingredients in Vaccitinium vitis-idaea include proanthocyanidins (type A), which prevent bacteria from attaching to the urinary tract, vitamin C, flavonoids (quercetin and myricetin, which are isomers), and some organic acids. As can be seen from these spectra, the flavonoids quercetin and myricetin predominate. The peaks registered at 1500 and 1450 cm−1 are due to the aromatic phenolic C = C bonds of flavonoid type. The peak at 1105 cm−1 confirms the presence of C–O–C/C–O ether and ester bonds (Table 4).
Figure 7.
IR spectra of HT sample (a) and FT (b).
Table 4.
IR spectra data of ZnO samples—main characteristics bands.
For ZnO, it is known that bands within the ~400–550 cm−1 region are commonly assigned to Zn–O stretching vibrations. This peak in our samples is shifted to a higher wavenumber, which generally indicates that the bond vibration requires higher energy. The positions of the peak in the samples are different: 625 cm−1 (HT) vs. 690 cm−1 (FT), which usually means that the Zn–O vibrational environment has changed. Since Zn and O masses are unchanged, the higher peak at 690 cm−1 of the lyophilized sample mainly suggests a larger effective force constant—i.e., a stronger/stiffer Zn–O bond environment. The possible reasons include (i) a smaller particle size (proved by SEM and XRD analyses) and (ii) a higher micro-strain and number of crystal defects (proved by EPR analyses).
2.5. DTA/TG Analyses
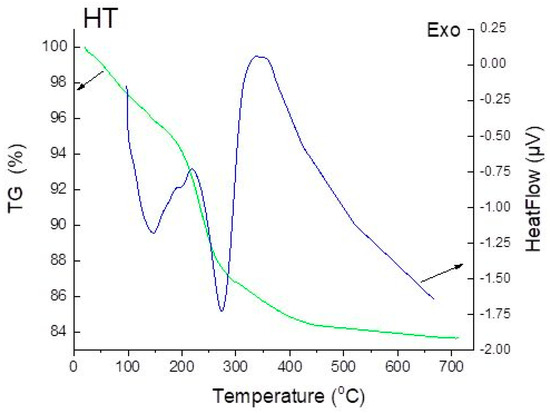
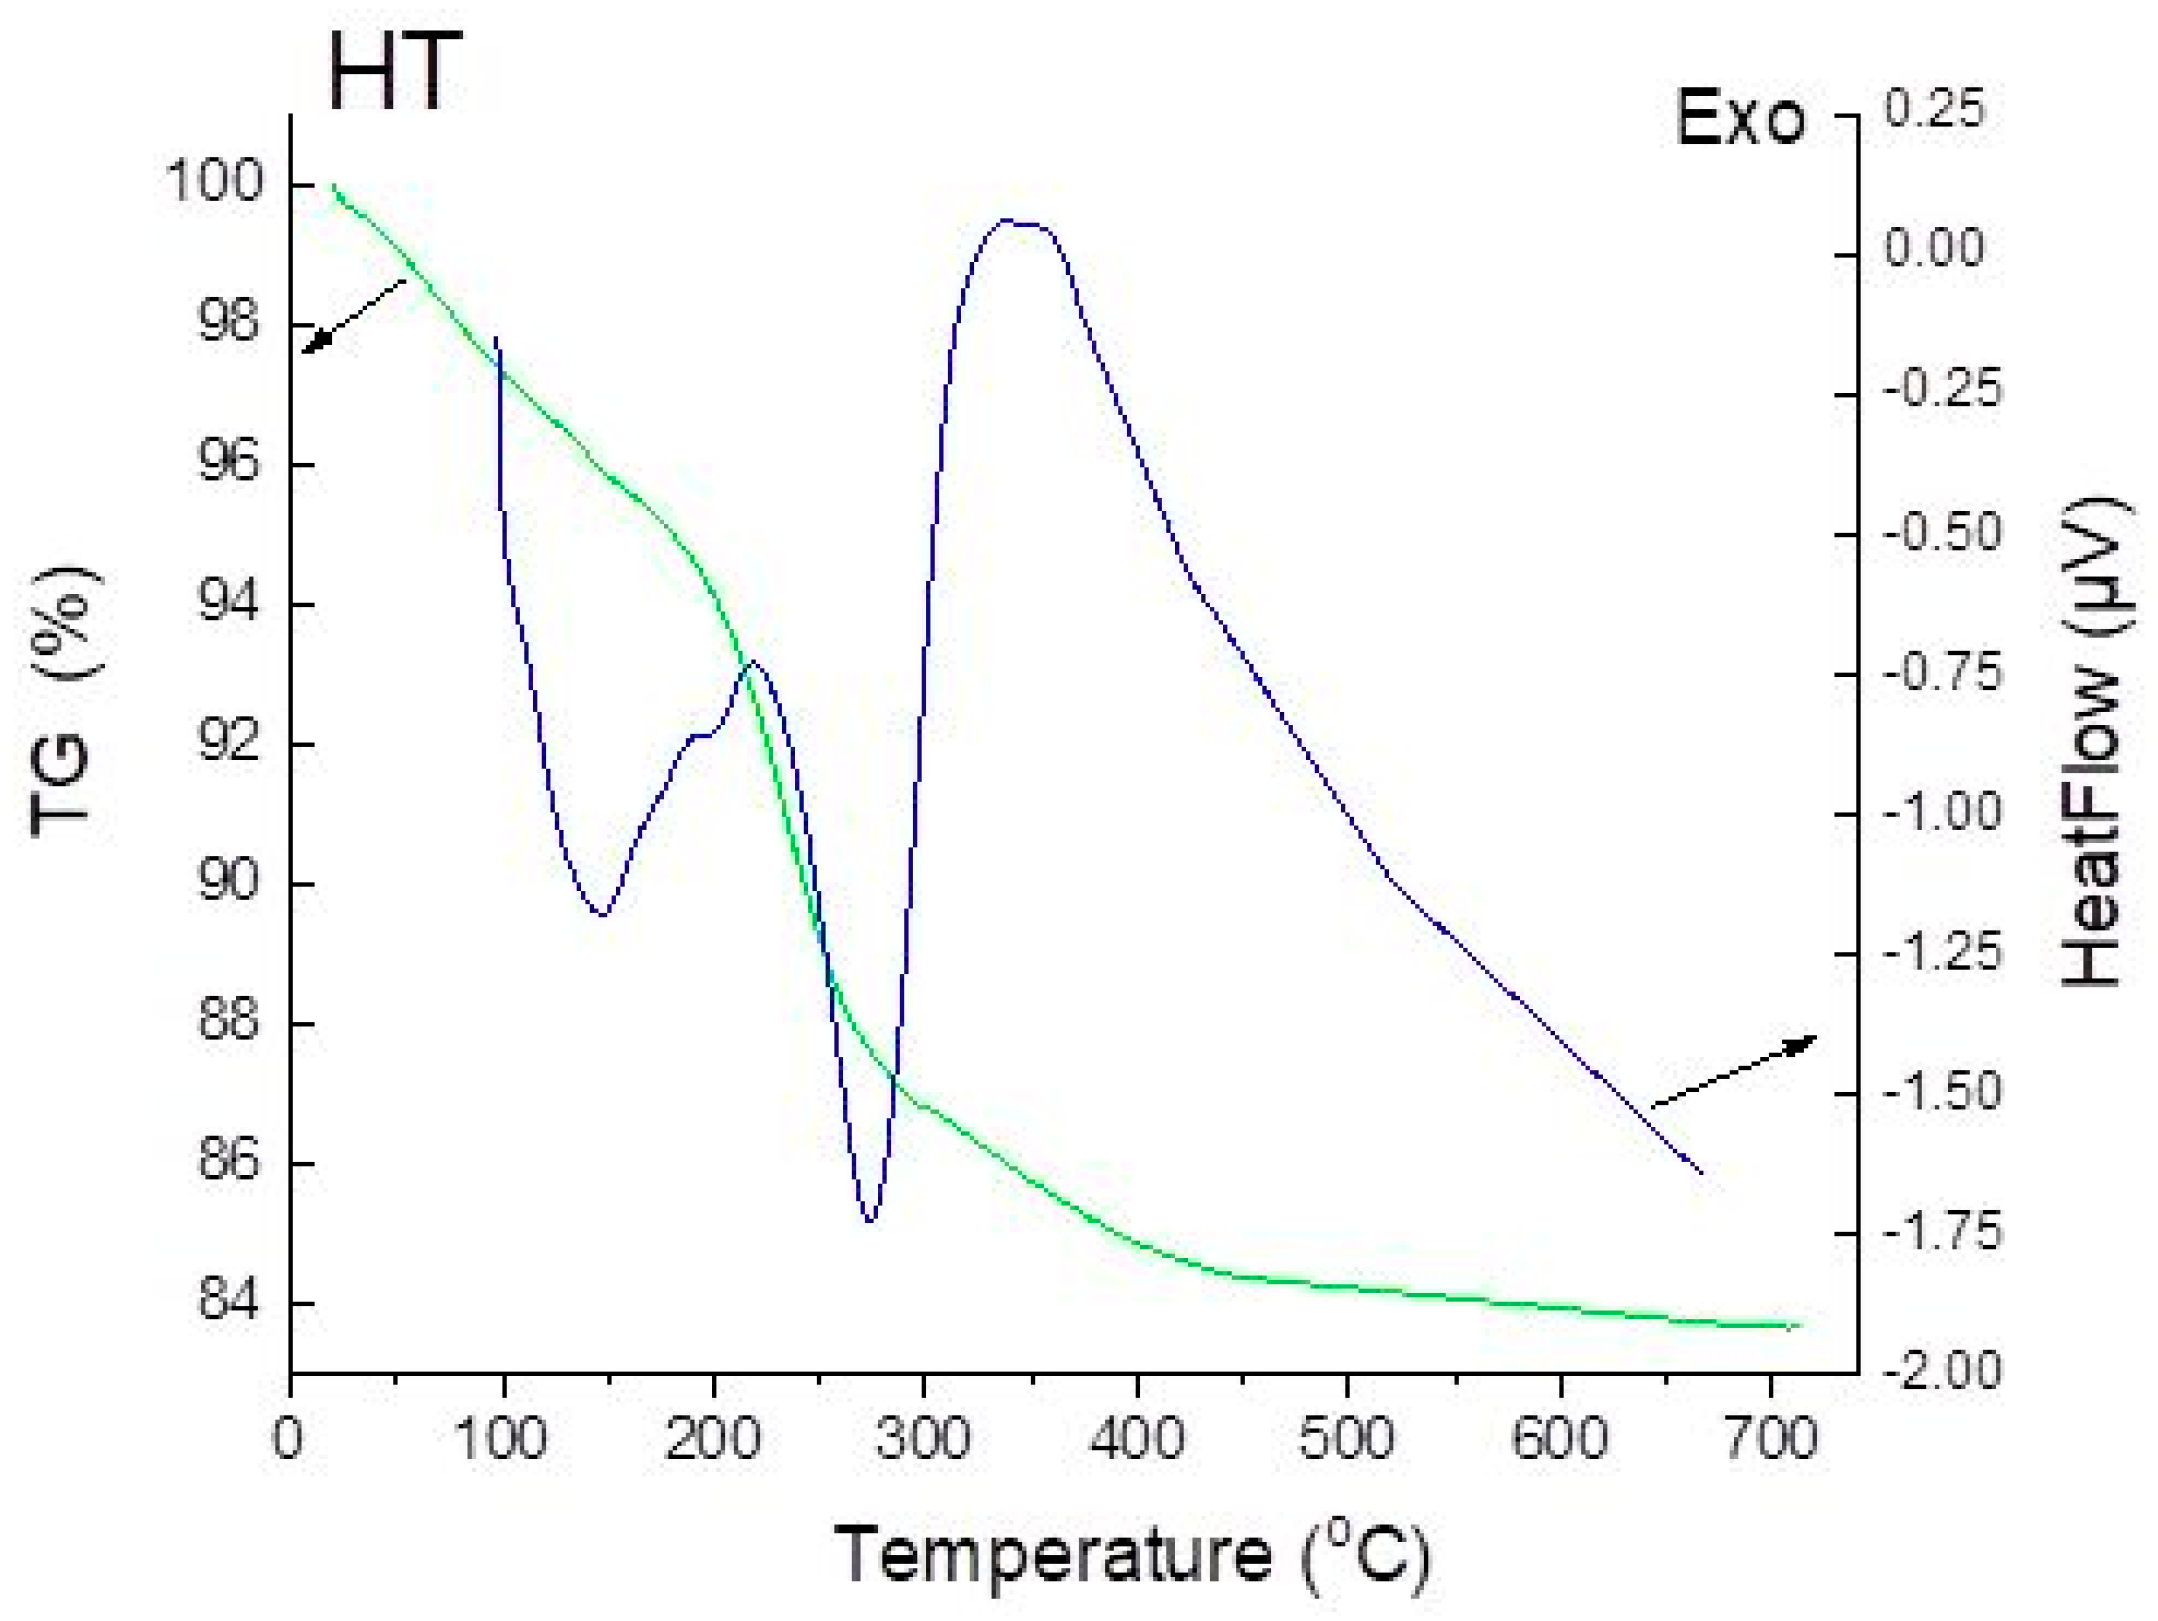
The DTA spectrum of green hydrothermally synthesized ZnO (HT) reveals two main peaks (Figure 8). It is well known that using green synthesis routes, biomolecules from the extract coordinate with Zn2+ ions, and they remain on the nanoparticle surface. Their decomposition often produces an endothermic event within the 180–250 °C range. The first endothermic peak around 230 °C may correspond to the following processes: the removal of physically adsorbed and bound water, the decomposition of hydroxyl groups from intermediate zinc hydroxide species (such as Zn(OH)2), and the thermal degradation of phytochemicals from the plant extract (probably polyphenols, flavonoids, sugars, organic acids, etc.) which remain attached to the ZnO surface. The DTA spectrum of the HT powders also show a second broad peak at about 300°C. It is known that the hydrothermal synthesis already partially forms crystalline ZnO during the reaction stage. Therefore, decomposition starts earlier, and less energy is needed for the crystallization. Also, the transformations are occurring gradually. The relatively lower temperatures of crystallization and broadening are caused by several factors: pre-existing ZnO nuclei and a partial degree of crystallinity, the oxidative combustion of residual organic compounds from the plant extract; the crystallization and grain growth of the ZnO nanoparticles.
Figure 8.
DTA/TG spectrum of HT sample.
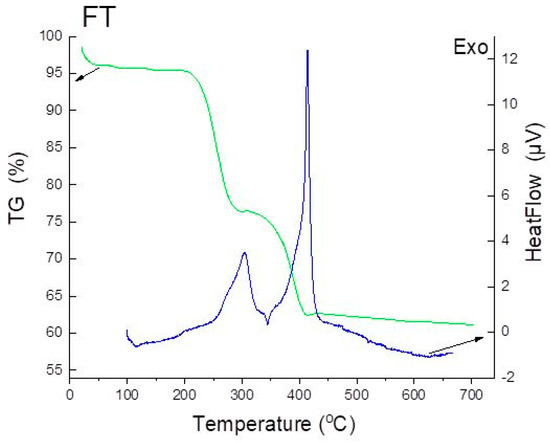
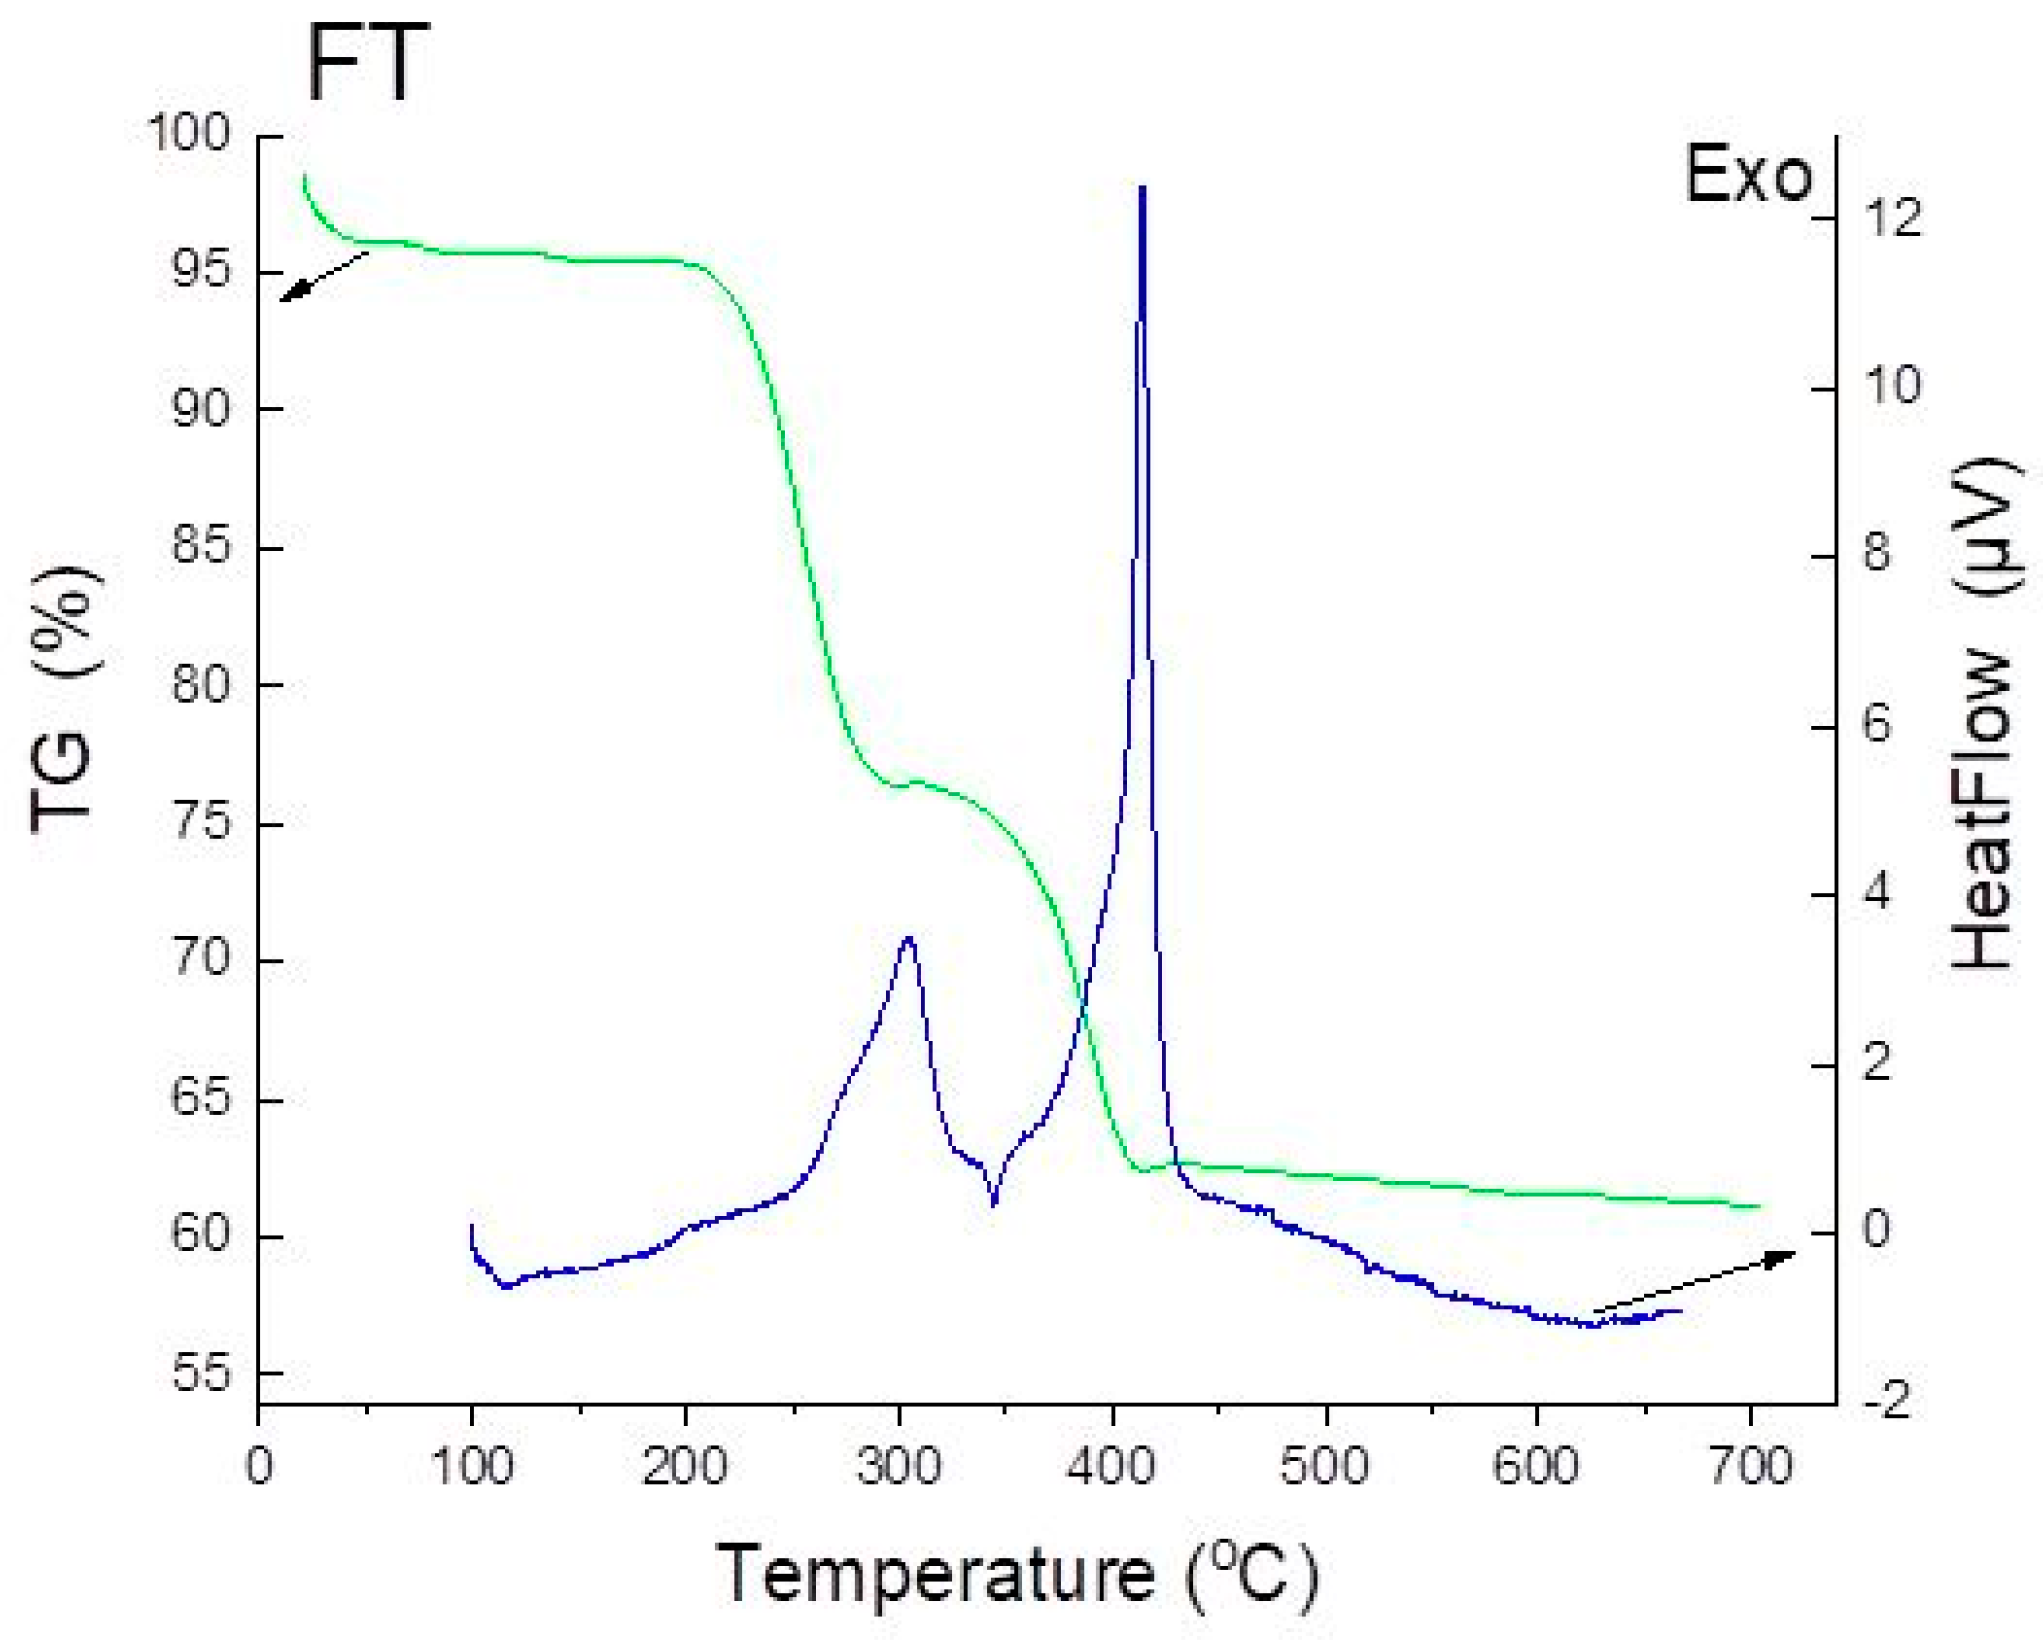
The freeze-dried ZnO precursor exhibited different thermal behavior (Figure 9). The first broad exothermic peak at approximately 270 °C is attributed to overlapping processes including the decomposition of residual organic species, dehydroxylation of zinc hydroxide intermediates, and progressive crystallization and grain growth of the ZnO nanoparticles. The broad nature of the peak indicates some gradual thermal transformation and the heterogeneity of the freeze-dried precursor system: the presence of a second crystallographic phase is proven by XRD analysis. This corresponds to the character of the TG curve. The narrow and intensive exothermic peak at ~403 °C observed in the FT sample usually means a single well-defined thermal event, which is occurring rapidly. Probably, the zinc acetate and the second crystalline phase of Na2CO3 decompose and they crystallize suddenly, leading to the combustion of organics, the collapse of the precursor network, and rapid ZnO crystallization. Upon increasing the temperature further, no other peaks are observed in the spectrum. The difference in the DTA peaks between freeze-dried ZnO and hydrothermally treated plant-modified Zn solution mainly comes from differences in the particle size, defect concentration and thermal decomposition pathway.
Figure 9.
DTA/TG spectrum of FT sample.
2.6. Phocatalytic Activity Tests
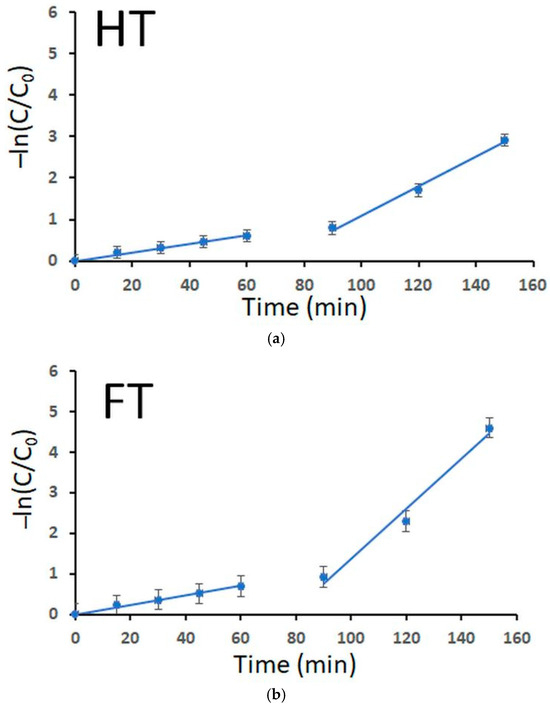
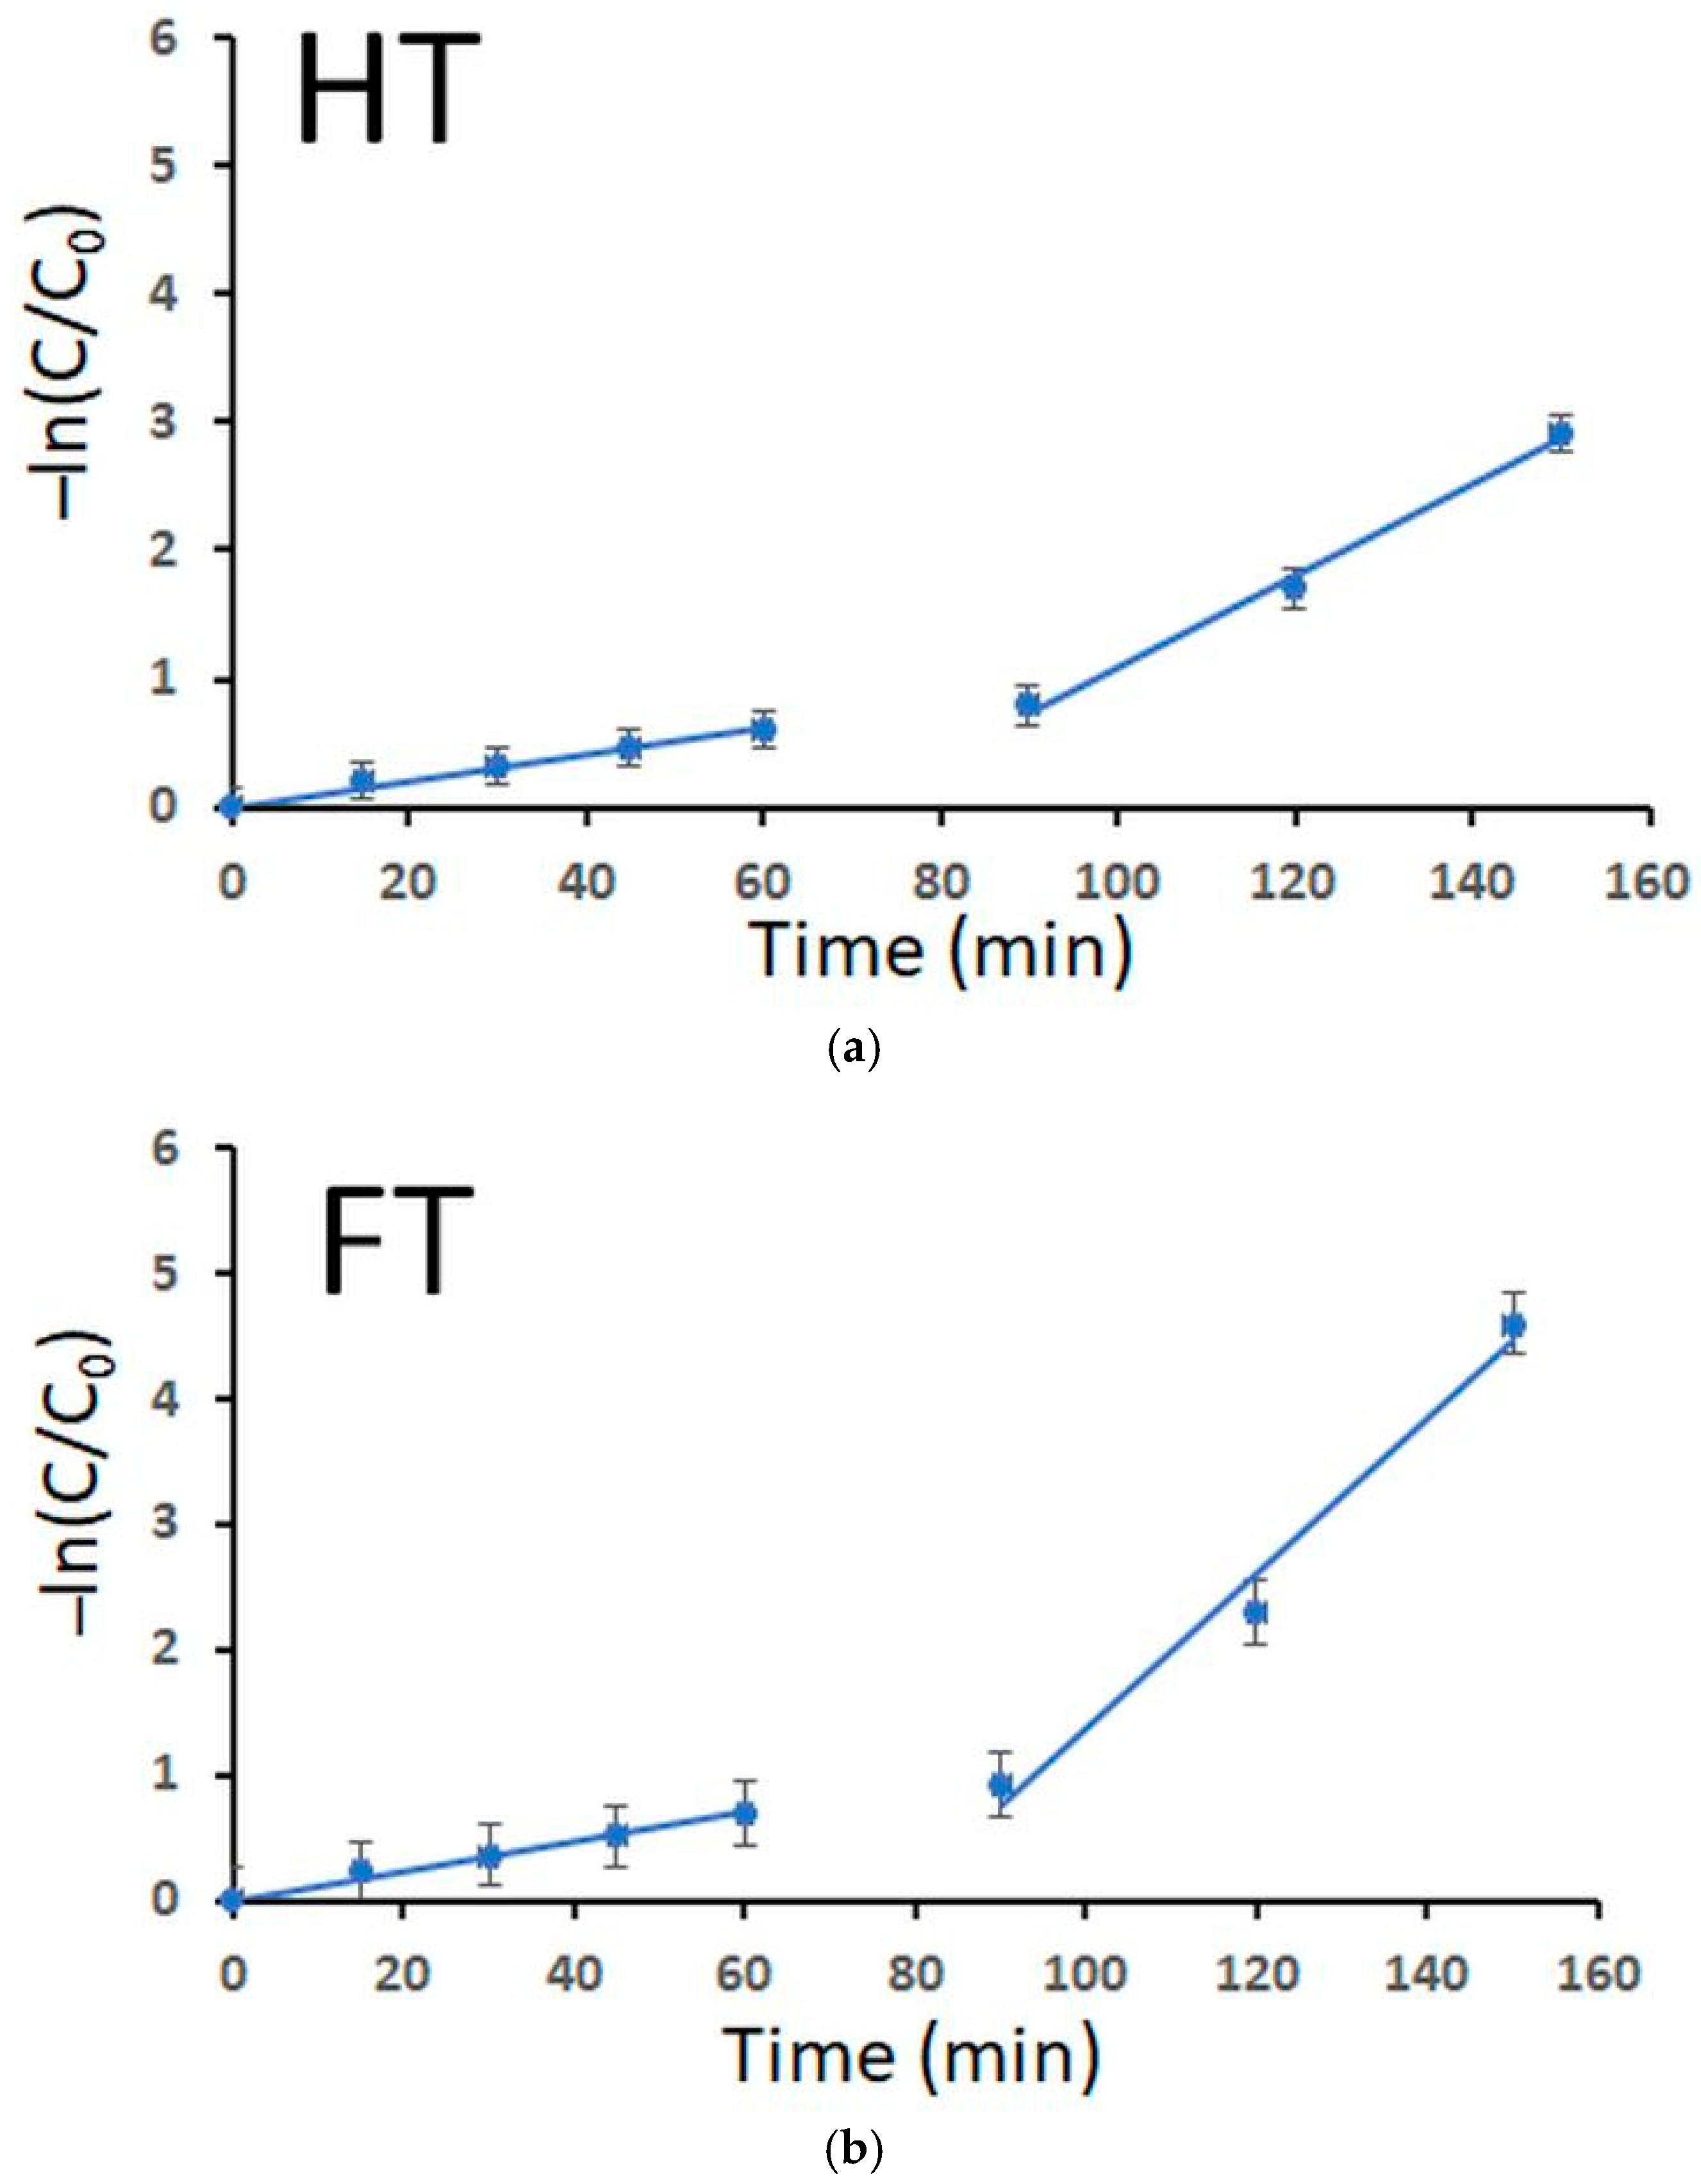
The photocatalytic activities of the obtained Nd-doped ZnO nanomaterials have been tested in the reaction of the photocatalytic decolorization of Malachite Green dye as a model contaminant in aqueous solutions (Figure 10). In the presence of Nd-doped ZnO nanoparticles, the photocatalytic decolorization of Malachite Green dye is proceeding in two stages with different rate constants. The values of the calculated apparent rate constants during the second period are FT (61.5 × 10⁻³ min−1) > HT (35.3 × 10⁻³ min−1) for 150 min under UV illumination. The freeze-drying results in a twofold higher photocatalytic reaction rate of the samples compared to those obtained by hydrothermal synthesis. The calculated values of adsorption capacities of HT and FT after a 30 min dark period are 0.0253 mg/g and 0.0263 mg/g, respectively.
Figure 10.
Kinetic curves of UV discoloration of MG dye using HT (a) and FT (b) powders.
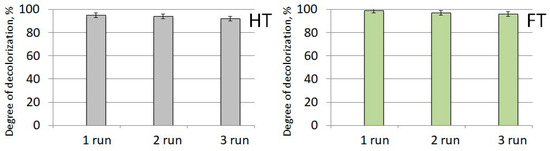
The reusability tests of Nd-doped ZnO photocatalysts determined that they preserve their photocatalytic efficiency relatively well after three consecutive photocatalytic cycles. These results confirmed the stability of the prepared zinc oxide photocatalysts after their repeated use in the photocatalytic reaction of MG discoloration under UV irradiation (Figure 11).
Figure 11.
Degree of discoloration of MG dye using HT and FT samples after three consecutive photocatalytic activity tests.
The relationship between the oxygen defects, crystallites size, degree of crystallinity, polarity and photocatalytic activity is well established. The XRD analyses have revealed that the FT sample possesses smaller crystallite sizes (24 vs. 32 nm) and increased lattice micro-strain (2.12 × 10⁻³ vs. 1.35 × 10⁻³) in comparison to that of the HT samples. This result was also confirmed by SEM photographs. The XRD data are indicating also a higher density of structural defects and local lattice distortions despite the comparable degree of crystallinity. This could be due to the peculiarities of the freeze-drying process: zinc solution becomes trapped within the ice matrix, and the dissolved species have little opportunity to migrate. As the growth process is diffusion-limited, many nucleation sites are formed simultaneously. This leads to the formation of small crystallites sizes. The photocatalytic reaction rate process can be maximized by optimizing the oxide particle size. The ultrafine particles (smaller than 7 nm) result in lower activity due to the faster charge recombination of (e−/h+) pairs [39]. Dodd et al. [40] have also revealed that the optimum particle size of ZnO possessing a high photocatalytic reaction rate is approximately 33 nm. Other research groups have also revealed that the optimal size of the photocatalytic particles is within the range of 20–50 nm [41]. Zinc oxide with particle sizes from 31.8 nm to 51.9 nm showed the best photocatalytic efficiency for the degradation of resorcinol [42]. The particle sizes of our samples, evaluated by both TEM and SEM analyses, are in accordance with the results of the above-mentioned researchers.
At the same time, the EPR analyses proved the presence of a greater amount of oxygen-vacancy-related paramagnetic sites, which were formed during the freeze-drying process. This effect is attributed to the low-temperature dehydration process, which suppresses defect migration, recombination and lattice relaxation phenomena. These phenomena are typically occurring during HT synthesis. As a result, the oxygen-vacancy-related sites formed during freeze-drying synthesis are preserved.
It is known that the higher surface polarity of ZnO materials leads to increased photocatalytic activity [43]. The research group explained this fact by the facile adsorption of O2− and OH− ions on the polar face and on the surface defects. The adsorbed ions react with photogenerated electrons (e−) and holes (h+), and these then produce more high-activity OH•− and O2•− radicals, which are responsible for the enhanced photocatalytic reaction rate.
The EPR and XRD data revealed the correlation between oxygen vacancies and polar planes. The freeze-dried ZnO powders contain more oxygen vacancies, which contributes to the higher polarity of the surface. The polar facets are significant because they: have higher surface energy than nonpolar facets, show greater catalytic activity in many reactions, and thus strongly influence gas-sensing, photocatalysis, and piezoelectric behavior. They also affect crystal morphology and growth kinetics, especially in ZnO materials. It is interesting to note that the BET surface area of our samples is not the main factor that determines the high photocatalytic activity. Similarly, Li et al. have established that catalysts having a larger amount of oxygen vacancy and respectively higher surface polarity (regardless of the low BET area) are exhibiting higher catalytic activity for the N-formylation reaction [44]. Our investigations have also proved that the freeze-dried samples possess a relatively low surface area (2 m2/g) in comparison to that of the HT samples (7 m2/g). The lyophilized samples possess micropores (Dav = 14 nm), while the HT samples have mesopores (Dav = 23 nm) (see Supplementary Material Figure S1). These results indicate that the amount of oxygen vacancies (formed preferably on polar planes) is more important for the catalytic activity than the surface area. At the same time, the freeze-drying process leads to an increased amount of oxygen defects, smaller crystallites, and higher surface polarity. All these physicochemical parameters result in some higher photocatalytic efficiency toward MG discoloration. It is known that the substantial amount of sodium carbonate in oxide powders could induce surface passivation and reduce the number of accessible active sites. It is surprising that the liophilized samples, which contain sodium carbonate as a secondary phase, exhibited a higher photocatalytic efficiency than the HT samples. Peralta-Zamora [45] et al. have proposed the following ways to explain the positive effect of sodium carbonate on the photocatalytic reaction rate: (a) the possible reaction of the carbonate radical and photo-generated hole (b) reaction with the molecules in the bulk of solution due to the peculiarities of the carbonate radical: lower reactivity, longer half-life time and lower oxidation power than those of the OH radicals. The obtained structural and phase features of FT powders including their small crystallites sizes, high number of oxygen surface defects and high surface polarity could facilitate the charge separation of electron–hole pairs and thus improve the photocatalytic activity. As a result, the photocatalytic performance of the Nd-ZnO samples is determined by the synergistic effect of the abovementioned physicochemical parameters.
3. Materials and Methods
3.1. Preparation of the Samples
The Nd-doped ZnO nanoparticles (ZnO-Nps) were prepared using two synthetic approaches, I and II:
- (I)
- The ZnO-Nps were produced using hydrothermal synthesis, and they were denoted as HT. Tri-block copolymer Pluronic P123 (Sigma-Aldrich, Merck Group (Merck KGaA, Darmstadt, Germany); Mw = 5800), Nd2O3 (Sigma-Aldrich), nitric acid 65% (Sigma-Aldrich), Zn(CH3CO2)2, 2H2O (Valerus Co., Sofia, Bulgaria) and sodium hydroxide (Valerus Co., Sofia, Bulgaria) were used as initial precursors. The aqueous solution of Pluronic P123 (2.85 g P123 in 25 mL distilled water) was added to the 400 mL aqueous solution of 0.1 M zinc acetate. Additionally, the estimated quantity of 0.09 g Nd2O3 dissolved in 1 M HNO3 was added in order to obtain 2 at% doped ZnO. Then, the following additives were added to the mixture sequentially: 26 mL aqueous solution of 4 M NaOH until reaching pH = 11 and finally–22 mL of plant extract. The water solution of the plant extract was prepared by placing 6.022 g dried leaves of Vaccinium vitis-idaea L. from a local supplier into 200 mL of distilled water and stirring for 1 h at 75 °C for 30 min, after which it was filtered. The resulting mixture was transferred into an autoclave at 170 °C for 8 h. The so-obtained precipitates were washed and dried up in an oven, after which they were treated at 400 °C for 2 h in air.
- (II)
- The ZnO-NPs were obtained using freeze-drying synthesis and were denoted as FT. The solution, prepared following procedure I, was divided into equal amounts and distributed in separate aluminum vessels having a layer thickness of no more than 5 mm, and then they were pre-frozen with liquid nitrogen. Lyophilization was carried out for 20 h at a pressure of 0.15 mbar and then for a further 4 h at 0.10 mbar 4 h at a pressure of 0.10 mbar. The entire process was carried out at a temperature of −100 °C. The lyophilizer used in the experiment was a Christ Alpha 3–4 LSC basic freeze dryer (Martin Christ Gefriertrocknungsanlagen GmbH, Osterode am Harz, Germany).
3.2. Physicochemical Analyses
The powder X-ray diffraction (PXRD) patterns were performed on a Bruker D2 Phaser diffractometer (Bruker AXS GmbH, Karlsruhe, Germany) within the range of 2θ values between 20° and 100° using Cu Kα radiation (λ = 0.154056 nm) at 40 kV. The presence of the phases in the prepared materials was determined by the ICDD database. The Debye–Scherrer equation was used to estimate the crystallite sizes of the synthesized samples.
Fourier-transform infrared (FTIR) spectra were collected on an Affinity-1 spectrophotometer (Shimadzu, Kyoto, Japan) equipped with a MIRacle ATR accessory (PIKE Technologies, Madison, USA) (diamond crystal, the depth of penetration of the IR beam into the material is 2 μm) through using KBr pellet technique.
The surface morphology of the nanoparticles was studied applying scanning electron microscopy (SEM) using a Zeiss Evo 10 microscope (Carl Zeiss Microscopy, Oberkochen, Germany). The images were taken in secondary electrons mode at an accelerating voltage of 25 keV. The electron-dispersive spectroscopy (EDS) probe Oxford Ultim Max 40 (Oxford Instruments, Abingdon, UK) was used to study the chemical composition of the surface. The obtained results were compiled with AZtec software (version 6.1 HF4).
Transmission electron microscopy (TEM) investigations were carried out using a JEOL 2100 transmission electron microscope and a JEOL 2100 XEDS: Oxford Instruments, X-MAXN 80 T CCD Camera ORIUS 1000, 11 Mp, GATAN (Gatan, Ametek group, Berwyn PA, USA). The distribution of the particles was estimated using Image J 1.53t software.
The specific surface area was studied by the express BET method based on the low-temperature adsorption of nitrogen. The relative error of the method is about 8%. The specific surface area investigations were performed on an automated apparatus NOVA Win—CFR Quantachrom—Gas Sorption System (Boynton Beach, Florida, USA). The surface area was evaluated using the BET equation. The DFT method was applied in order to estimate the size distribution and average pore diameter, assuming a cylindrical pore model. The total pore volume was estimated according to Gurwich’s rule at a relative pressure of 0.96.
The DTA/TG investigations were carried out by a combined LABSYS EVO 1600 DTA/TG device of the SETARAM Company, Caluire-et-Cuire, France. The samples were investigated at a heating rate of 10 °C/min in air atmosphere at air flow of 20 mL/min.
EPR measurements were performed using a JEOL JES-FA 100 EPR spectrometer (JEOL Ltd., Tokyo, Japan) in the X-band (9.4 GHz, standard TE011 cylindrical resonator) at room temperature. The following experimental conditions were applied: modulation frequency 100 kHz, modulation amplitude 0.2 mT, microwave power 5 mW, and time constant 0.1 s. All the measurements are equated to equal EPR parameters and sample mass.
3.3. Photocatalytic Tests
The photocatalytic decolorization of Malachite Green (MG) as a model contaminant with a 5 ppm initial concentration of aqueous solution of the dye has been investigated. The dye was diluted in 75 mL of water. A UV-A illumination lamp (Sliven, Bulgaria) of maximum emission at 365 nm; power of 18 W and illumination intensity of 2.6 mW/cm2 was used. The photocatalytic activity tests were performed in a semi-batch slurry photocatalytic reactor equipped with two frits blowing tiny bubbles of air in order to saturate the dye solution with dissolved oxygen using 0.075 g of photocatalyst under a constant stirring rate (400 rpm). In order to reach adsorption–desorption equilibrium state, the dye solution containing the photocatalyst powder first was stirred in the dark for about 30 min. After that, the UV lamp was switched on in order to estimate the photocatalytic activity. The investigation of the photocatalytic efficiency of the samples was carried out by taking aliquot samples of the suspension out of the reaction vessel after regular time intervals. After that, a centrifugation was performed in order to separate the photocatalytic material from the aliquot solution before the UV–Vis spectrophotometric evaluation of the dye concentration. Then, the mixture containing the photocatalyst and aliquot solution was returned back into the reaction vessel, which ensured operation under constant volume and constant amount of the photocatalytic sample (to maintain the weight ratio catalyst/solution). The reaction course was monitored by a UV-Vis absorbance spectrophotometer SP-UV1100 (DLAB Scientific Co., Ltd., Beijing, China) in the wavelength range from 20 to 800 nm (λmax = 618 nm for MG).
The apparent rate constants (kapp) were calculated assuming a pseudo-first-order kinetic equation:
where C0 and C are, respectively, the initial concentration before turning on the illumination and the residual concentration of the dye solution after illumination in the course of the given time interval.
The adsorption capacity (in darkness for 30 min) of the materials was calculated using the following formula:
where C0 is the initial dye concentration, C is the dye concentration after 30 min, V is the solution volume, and m is the sample mass.
4. Conclusions
Freeze-drying (FT) and hydrothermal (HT) synthesis methods were applied successfully to obtain Nd-doped (2%)-ZnO, using a plant extract of Vaccinium vitis-idaea leaves. It was revealed that the freeze-drying synthesis leads to significant changes in the main physicochemical parameters of the particles, including smaller crystallites sizes, a higher number of oxygen defects in the lattice and a higher surface polarity compared to those of hydrothermally obtained oxide particles. These features of the FT powders are the reason for the higher photocatalytic efficiency for MG dye discoloration. The FT particles possess smaller crystallites sizes (24 nm) and higher polarity (I002/I100) in comparison to those of hydrothermally obtained particles. The EPR analyses revealed that there is a higher concentration of oxygen-vacancy-related paramagnetic centers after the freeze-drying process (more intensive line at g = 2.000). The photocatalytic activity of Nd-ZnO nanoparticles was investigated under UV light using Malachite Green dye. The photocatalytic reaction rate of the freeze-dried photocatalysts was found out to be higher than those of the HT samples. It is greatly affected by the smaller crystallites sizes, higher number of oxygen defects in the lattice and higher surface polarity.
Supplementary Materials
The following supporting information can be downloaded at https://www.mdpi.com/article/10.3390/inorganics14080198/s1, Figure S1: Nitrogen adsorption–desorption isotherms and pore size distribution (inset) of the obtained materials.
Author Contributions
Conceptualization, I.S., D.S. and K.Z.; methodology, I.S., D.S., K.Z. and D.M.; validation, I.S. and K.Z.; formal analysis, K.Z., R.M., M.D. (Mariela Dimitrova), D.M., O.D., P.M., P.T. and S.D.; investigation, I.S., K.Z., D.S., D.M. and P.T.; resources, I.S.; data curation, I.S. and K.Z.; writing—original draft preparation, I.S., D.S., K.Z., M.D. (Mariela Dimitrova), R.M. and M.D. (Milen Dimov); writing—review and editing, I.S. and K.Z.; visualization, K.Z. and I.S.; supervision, I.S. and K.Z.; project administration, I.S. and K.Z.; funding acquisition, I.S. All authors have read and agreed to the published version of the manuscript.
Funding
This research was funded by the Bulgarian National Science Fund, Grant number KP-06-N69/8 (KΠ-06-H69/8).
Data Availability Statement
Data are included in the manuscript.
Acknowledgments
The authors express their gratitude to the project with the Bulgarian National Science Fund, KP-06-N69/8 (KΠ-06-H69/8), “Novel polymer-hybrid materials containing (bio)synthesized metal oxide particles with improved photocatalytic and antimicrobial potential” for the financial support. The contract “Multicomponent oxide coatings for increased corrosion resistance steels” was within the Non-currency Equivalent Exchange Bilateral Cooperation between the Bulgarian Academy of Sciences and the Serbian Academy of Sciences and Fine Arts. The research equipment of the distributed research infrastructure INFRAMAT (part of the Bulgarian National roadmap for research infrastructures) was supported by the Bulgarian Ministry of Education and Science was used in this investigation.
Conflicts of Interest
The authors declare no conflicts of interest.
References
- Suchikova, Y.; Nazarovets, S.; Konuhova, M.; Popov, A.I. Binary Oxide Ceramics (TiO2, ZnO, Al2O3, SiO2, CeO2, Fe2O3, and WO3) for Solar Cell Applications: A Comparative and Bibliometric Analyses. Ceramics 2025, 8, 119. [Google Scholar] [CrossRef] [Scilit]
- Bharat, T.C.; Shubham, S.M.; Gupta, H.S.; Singh, P.K.; Das, A.K. Synthesis of Doped Zinc Oxide Nanoparticles: A Review. Mater. Today Proc. 2005, 11, 757–775. [Google Scholar]
- Aneesh, P.M.; Jayaraj, M.K. Red luminescence from hydrothermally synthesized Eu-doped ZnO nanoparticles under visible excitation. Bull. Mater. Sci. 2010, 33, 227–231. [Google Scholar] [CrossRef] [Scilit]
- Liu, Y.; Ai, K.; Yuan, Q.; Li, L. Fluorescence-enhanced gadolinium-doped zinc oxide quantum dots for magnetic resonance and fluorescence imaging. Biomaterials 2011, 32, 1185–1192. [Google Scholar] [CrossRef] [Scilit] [PubMed]
- Zamiri, R.; Kaushal, A.; Rebelo, A.; Ferreira, J.M.F. Er doped ZnO nanoplates: Synthesis, optical and dielectric properties. Ceram. Intern. 2014, 40, 1635–1639. [Google Scholar] [CrossRef] [Scilit]
- Dhiman, P.; Rana, G.; Kumar, A.; Dawi, E.A.; Sharma, G. Rare Earth Doped ZnO Nanoparticles as Spintronics and Photo Catalyst for Degradation of Pollutants. Molecules 2023, 28, 2838. [Google Scholar] [CrossRef] [Scilit] [PubMed]
- Vijayaprasatha, G.; Murugana, R.; Mahalingamb, T.; Hayakawac, Y.; Revi, G. Enhancement of ferromagnetic property in rare earth neodymium doped ZnO nanoparticles. Ceram. Intern. 2015, 41, 10607–10615. [Google Scholar] [CrossRef] [Scilit]
- Zhang, J.; Deng, S.J.; Liu, S.Y.; Chen, J.M.; Han, B.Q.; Wang, Y.; Wang, Y.D. Preparation and photocatalytic activity of Nd doped ZnO nanoparticles. Mater. Technol. 2014, 29, 262–268. [Google Scholar] [CrossRef] [Scilit]
- Cao, Y.; Pana, W.; Zonga, Y.; Jia, D. Preparation and gas-sensing properties of pure and Nd-doped ZnO nanorods by low-heating solid-state chemical reaction. Sens. Act. B 2009, 138, 480–484. [Google Scholar] [CrossRef] [Scilit]
- Poongodi, G.; Kumar, R.M.; Jayavel, R. Structural, optical and visible light photocatalytic properties of nanocrystalline Nd doped ZnO thin films prepared by spin coating method. Ceram. Intern. 2015, 41, 4169–4175. [Google Scholar] [CrossRef] [Scilit]
- Roy, B.; Chakrabarty, S.; Mondal, O.; Pal, M.; Dutta, A. Effect of neodymium doping on structure, electrical and optical properties of nanocrystalline ZnO Nanocrystalline Nd-doped ZnO Optical band gap. Mater. Charac. 2012, 70, 1–7. [Google Scholar] [CrossRef] [Scilit]
- Gancheva, M.N.; Iordanova, R.S.; Dimitriev, Y.B.; Avdeev, G.B.; Iliev, T.C. Effects of mechanical activation on structure and photocatalytic properties of ZnO powders. Centr. Eur. J. Chem. 2013, 11, 1780–1785. [Google Scholar] [CrossRef] [Scilit]
- Park, J.B.; Oh, H.; Park, J.; Park Kim, N.-J.; Yoon, H.; Yi, G.-C. Scalable ZnO nanotube arrays grown on CVD-graphene films. APL Mater. 2016, 4, 106104. [Google Scholar] [CrossRef] [Scilit]
- Moezzi, A.; Cortie, M.; McDonagh, A. Transformation of zinc hydroxide chloride monohydrate to crystalline zinc oxide. Dalton Trans. 2016, 45, 7385–7739. [Google Scholar] [CrossRef] [Scilit] [PubMed]
- Stambolova, I.; Blaskov, V.; Stoyanova, D.; Avramova, I.; Dimitrov, L.; Milenova, K.; Balashev, K.; Simeonova, S.; Tsonev, A.; Alexandrov, L.; et al. Dependence of the textural properties and surface species of ZnO photocatalytic materials on the type of precipitating agent used in the hydrothermal synthesis. Bull. Mater. Sci. 2017, 40, 483–492. [Google Scholar] [CrossRef] [Scilit]
- Hussain, T.I.; Singh, N.B.; Singh, A.; Singh, H.; Singh, S.C. Green synthesis of nanoparticles and its potential napplication. Biotechnol. Lett. 2016, 38, 545–560. [Google Scholar] [PubMed]
- Penchev, H.; Zaharieva, K.; Dimova, S.; Grancharov, G.; Petrov, P.; Shipochka, M.; Dimitrov, O.; Lazarkevich, I.; Engibarov, S.; Eneva, R. Hybrid Cellulosic Substrates Impregnated with Meta-PBI-Stabilized Carbon Nanotubes/Plant Extract-Synthesized Zinc Oxide—Antibacterial and Photocatalytic Dye Degradation Study. Nanomaterials 2024, 14, 1346. [Google Scholar] [CrossRef] [Scilit] [PubMed]
- Shamilov, A.A.; Bubenchikova, V.N.; Chernikov, M.V.; Pozdnyakov, D.I.; Garciya, E.R. Vaccinium vitis-idaea L.: Chemical Contents, Pharmacological Activities. Pharm. Sci. 2020, 26, 344–362. [Google Scholar] [CrossRef] [Scilit]
- Shakeel, A.; Annu Chaudhry, S.A.; Ikram, S. A review on biogenic synthesis of ZnO nanoparticles using plant extracts and microbes: A prospect towards green chemistry. J. Photochem. Photobiol. B Biol. 2017, 166, 272–284. [Google Scholar] [CrossRef] [Scilit]
- Stoyanova, D.; Stambolova, I.; Blaskov, V.; Georgieva, P.; Shipochka, M.; Zaharieva, K.; Dimitrov, O.; Markov, P.; Dyakova, V.; Kostova, Y.; et al. Modified Approach Using Mentha arvensis in the Synthesis of ZnO Nanoparticles—Textural, Structural, and Photocatalytic Properties. Appl. Sci. 2022, 12, 1096. [Google Scholar] [CrossRef] [Scilit]
- Mi, S.; Liu, Z.; Luo, C.; Cai, L.; Zhang, Z.; Li, L. A review on preparing new energy ultrafine powder materials by freeze-drying. Dry. Technol. 2020, 38, 1544–1564. [Google Scholar]
- Piva, D.H.; Piva, R.H.; Rocha, M.C.; Dias, J.A.; Montedo, O.R.K.; Malavazi, I.; Morelli, M.R. Antibacterial and photocatalytic activity of ZnO nanoparticles from Zn(OH)2 dehydrated by azeotropic distillation, freeze drying and ethanol washing. Adv. Powder Technol. 2017, 28, 463–4721. [Google Scholar] [CrossRef] [Scilit]
- Karakaya, H.; Kızılateş, B.; Erdem, İ. Green synthesis and characterization of zinc oxide nanoparticles via thyme for biomedical applications: Effect of plant extract concentration and drying method. J. Aust. Ceram. Soc. 2026, 62, 855–878. [Google Scholar]
- Hunai, S.A.; Hinari, A.A.; Almansouri, H.E.; Haddabi, Q.A.; Maqbali, H.A.; Yamama, A.; Rudbaii, A. Impact of drying techniques on the structural properties and methyl orange degradation efficiency of Moringa oleifera mediated ZnO nanoparticles. Next Mater. 2026, 12, 102102. [Google Scholar] [CrossRef] [Scilit]
- Krasilinikov, V.; Dyachkova, T.; Tyutyunnik, A.; Gyrdasova, O.; Melkozerova, M.; Baklanova, I.; Perevozchikova, Y.A.; Emelyanova, S.M.; Weber, H.; Marchenkov, V. Magnetic and optical properties as well as EPR studies of polycrystalline ZnO synthesized from different precursors. Mater. Res. Bull. 2018, 97, 553–559. [Google Scholar] [CrossRef] [Scilit]
- Li, W.; Zhang, H.; Zhang, X.; Qin, G.; Li, H.; Xiong, Y.; Ye, L.; Ruan, H.; Tong, C.; Kong, C.; et al. Non-axial NO-VZn shallow acceptor complexes in nitrogen implanted p-type ZnO thin films. Appl. Surf. Sci. 2020, 529, 147168. [Google Scholar] [CrossRef] [Scilit]
- Ammar, A.; Yildirim, I.; Aleinawi, M.; BulduAkturk, M.; Turhan, N.; Nadupalli, S.; Rostas, A.; Erdem, E. Multifrequency EPR spectroscopy study of Mn, Fe, and Cu doped nanocrystalline ZnO. Mat. Res. Bull. 2023, 160, 112117. [Google Scholar] [CrossRef] [Scilit]
- Nistor, M.; Dobrin, D.; Gherendi, F.; Perriere, J. Impact of high oxygen deficiency on the photoluminescence properties of black zinc oxide thin films. Nanoscale 2025, 17, 23000–23009. [Google Scholar] [CrossRef] [Scilit] [PubMed]
- Stan, M.; Popa, A.; Toloman, D.; Dehelean, A.; Lung, I.; Katona, G. Enhanced photocatalytic degradation properties of zinc oxide nanoparticles synthesized by using plantex tracts. Mat. Sci. Semicond. Process. 2015, 39, 23–29. [Google Scholar] [CrossRef] [Scilit]
- Brückner, A.; Bentrup, U.; Zanthoff, H.; Maschmeyer, D. The role of different Ni sites in supported nickel catalysts for butene dimerization under industry-like conditions. J. Catal. 2009, 266, 120–128. [Google Scholar] [CrossRef] [Scilit]
- Micic, O.I.; Zhang, Y.; Cromack, K.R.; Trifunac, A.D.; Thurmauer, M.C. Trapped holes on TiO2 colloids studied by Electron Paramagnetic Resonance. J. Phys. Chem. 1993, 97, 7277–7283. [Google Scholar] [CrossRef] [Scilit]
- Reddy, A.J.; Kokila, M.K.; Nagabhushana, H.; Shivakumara, C.; Chakradhar, R.P.S.; Nagabhushana, B.M.; Krishna, R.H. Luminescence studies and EPR investigation of solution combustion derived Eu doped ZnO. Spectrochim. Acta Part A Mol. Biomol. Spectr. 2014, 132, 305–312. [Google Scholar] [CrossRef] [Scilit]
- Cabrera-Baez, M.; Padron-Hernandez, E.; Soares, J.M.; Santos, F.E.P.; Guerra, Y.; Pena-Garcia, R. Effect of yttrium substitution in Fe-doped ZnO nanoparticles: An EPR study. J. Magn. Magn. Mater. 2021, 538, 168317. [Google Scholar] [CrossRef] [Scilit]
- Singh, S.P.; Chakradhar, R.P.S.; Rao, J.L.; Karmakar, B. EPR, FTIR, optical absorption and photoluminescence studies of Fe2O3 and CeO2 doped ZnO–Bi2O3–B2O3 glasses. J. Alloys Comp. 2010, 493, 256–262. [Google Scholar] [CrossRef] [Scilit]
- Chandra, S.; Ruchi. Synthesis, spectroscopic characterization, molecular modeling and antimicrobial activities of Mn(II), Co(II), Ni(II), Cu(II) complexes containing the tetradentate aza Schiff base ligand. Spectrochim. Acta Part A Mol. Biomol. Spectr. 2013, 103, 338–348. [Google Scholar] [CrossRef] [Scilit]
- Silva, H.; Mateos-Pedrero, C.; Magén, C.; Pacheco Tanaka, D.A.; Mendes, A. Simple Hydrothermal Synthesis Method for Tailoring the Physicochemical Properties of ZnO: Morphology, Surface Area and Polarity. RSC Adv. 2014, 4, 31166–31176. [Google Scholar] [CrossRef] [Scilit]
- Tabe, M.; Isbilen, O.; Walker, J.N.; Cinar, E. Zingiber officinale-mediated zinc oxide nanoparticles: Antimicrobial activity against multidrug-resistant bacteria. BMC Complement. Med. Ther. 2026, 26, 88. [Google Scholar] [CrossRef] [Scilit] [PubMed]
- Thongam, D.D.; Gupta, J.; Sahu, N.K. Effect of induced defects on the properties of ZnO nanocrystals: Surfactant role and spectroscopic analysis. SN Appl. Sci. 2019, 1, 1030. [Google Scholar] [CrossRef] [Scilit]
- Zhang, Z.; Wang, C.C.; Zakaria, R.; Ying, J.Y. Role of particle size in nanocrystalline TiO2-based photocatalysts. J. Phys. Chem. B 1998, 102, 10871–10878. [Google Scholar] [CrossRef] [Scilit]
- Dodd, A.C.; McKinley, A.J.; Saunders, M.; Tsuzuki, T. Effect of Particle Size on the Photocatalytic Activity of Nanoparticulate Zinc Oxide. J. Nanopart. Res. 2006, 8, 43–51. [Google Scholar] [CrossRef] [Scilit]
- Du, L.; Furube, A.; Yamamoto, A.; Hara, K.; Katoh, R.; Tachiya, M. Plasmon-Induced charge separation and recombination dynamics in Gold-TiO2 nanoparticle systems: Dependence on TiO2 particle size. J. Phys. Chem. C 2009, 113, 6454–6462. [Google Scholar] [CrossRef] [Scilit]
- Pardeshi, S.K.; Patil, A.B. Effect of morphology and crystallite size on solar photocatalytic activity of zinc oxide synthesized by solution free mechanochemical method. J. Molec. Catal. A Chem. 2009, 308, 32–40. [Google Scholar] [CrossRef] [Scilit]
- Yang, J.; Wang, J.; Li, X.; Lang, J.; Liu, F.; Yang, L.; Zhai, H.; Gao, M.; Zhao, X. Effect of polar and non-polar surfaces of ZnO nanostructures on photocatalytic properties. J. Alloys Comp. 2012, 528, 28–33. [Google Scholar] [CrossRef] [Scilit]
- Li, G.R.; Hu, T.; Pan, G.L.; Yan, T.Y.; Gao, X.P.; Zhu, H.Y. Morphology-Function Relationship of ZnO: Polar Planes, Oxygen Vacancies, and Activity. J. Phys. Chem. C 2008, 112, 11859–11864. [Google Scholar] [CrossRef] [Scilit]
- Peralta-Zamora, P.; Gouvêa, C.A.K.; Wypych, F.; Durán, N. Effect of Na2CO3 on the photocatalytic degradation of remazol brilliant blue R. Toxicol. Environ. Chem. 2001, 80, 83–93. [Google Scholar] [CrossRef] [Scilit]

Disclaimer/Publisher’s Note: The statements, opinions and data contained in all publications are solely those of the individual author(s) and contributor(s) and not of MDPI and/or the editor(s). MDPI and/or the editor(s) disclaim responsibility for any injury to people or property resulting from any ideas, methods, instructions or products referred to in the content. |
© 2026 by the authors. Licensee MDPI, Basel, Switzerland. This article is an open access article distributed under the terms and conditions of the Creative Commons Attribution (CC BY) license.