


Abstract
The persistent accumulation of tetracycline (TC) antibiotics in aquatic environments poses severe ecological and public health risks, necessitating the development of multifunctional platforms capable of simultaneous detection and degradation. Herein, we report magnetically recoverable plasmonic Fe3O4/Cu2O-Ag nanocomposites (NCs) that integrate visible-light-driven photocatalysis with ultrasensitive surface-enhanced Raman scattering (SERS) detection. Hierarchical flower-like Fe3O4 nanocrystals were employed as magnetic supports, followed by in situ growth of Cu2O nanocrystals and controlled deposition of Ag nanocrystals. The optimized composite (FCA-2) exhibited enhanced visible-light absorption (Eg = 1.86 eV), suppressed electron–hole recombination, and improved photocurrent response, which were attributed to Schottky barrier formation at the Cu2O-Ag interface and localized surface plasmon resonance (LSPR) effects. Under simulated solar irradiation, FCA-2 NCs achieved 91.79% degradation of TC within 60 min, following pseudo-first-order kinetics (k = 20.37 × 10⁻³ min−1). Finite-difference time-domain (FDTD) simulations revealed that optimal Ag loading maximized plasmonic “hot spot” density, thereby enhancing electromagnetic field intensity and SERS performance. The FCA-2 substrate enabled ultrasensitive TC detection with a limit of detection of as low as 10−10 M. Moreover, the superparamagnetic Fe3O4 core allowed for rapid magnetic separation and sustained performance over multiple SERS–photocatalysis cycles, with negligible signal attenuation after 30 days. This work presents a rational strategy for constructing plasmonic magnetic NCs that synergistically couple photocatalytic remediation, ultrasensitive sensing, and magnetic recyclability, offering significant potential for integrated environmental monitoring and sustainable water treatment applications.
1. Introduction
In recent years, the widespread use of antibiotics in medical and agricultural applications has led to a significant increase in their environmental residues, rendering them a key focus in emerging contaminant research [1]. Among many antibiotic categories, tetracycline antibiotics (TCs) rank second in the world in terms of usage due to their prominent broad-spectrum antibacterial efficacy, and are widely used in the treatment of clinical diseases and as feed additives in animal husbandry [2]. However, TCs accumulate in the water environment for a long time, which may induce the production of drug-resistant strains [3]. Drug-resistant strains not only enter the human body through the food chain, causing health risks such as abnormal enamel development, liver and kidney function damage, and immune suppression, but also pose a severe challenge to the ecosystem [4]. In view of this, the development of efficient and reliable detection and removal technologies to deal with the pollution of tetracycline antibiotics in the aquatic environment has significant practical value.
To date, various analytical techniques have been employed for the detection of TC, yet each approach exhibits certain technical limitations. For example, although high-performance liquid chromatography–tandem mass spectrometry (HPLC-MS/MS) offers excellent quantitative accuracy, its bulky instrumentation and operational complexity hinder its application in rapid on-site screening [5]. Fluorescence and colorimetric methods, while suitable for field detection, are susceptible to environmental interference and often exhibit limited sensitivity [6]. In contrast, surface-enhanced Raman scattering (SERS) has emerged as a promising analytical technique for TC detection owing to its convenient operation, rapid response, low detection limit, and molecular fingerprint recognition capability. Beyond antibiotic detection, SERS has also been widely applied in environmental monitoring, biosensing, food safety analysis, chemical imaging, and clinical diagnostics [7,8,9]. The signal enhancement mechanism of this technology is generally considered to mainly come from two key contributions: the electromagnetic enhancement (EM) effect and the chemical enhancement (CE) effect [10]. The relative contributions of EM and CE depend on the substrate architecture and analyte molecules. EM mainly arises from the local surface plasmon resonance (LSPR) characteristics, and CE is closely related to the electron transfer process at the interface [10]. Studies have shown that coupling semiconductors with noble metals can effectively facilitate charge transfer between the substrate and the analyte, thereby significantly enhancing the CE effect [11]. Recent studies have further demonstrated that rationally designed plasmonic semiconductor–metal hybrid nanostructures can simultaneously enhance localized electromagnetic fields and facilitate interfacial charge transfer, thereby improving SERS sensitivity and stability [8,9]. Additionally, strong adsorption of analyte molecules onto the substrate surface is crucial for achieving high SERS signals. Inspired by these advances, constructing multifunctional plasmonic semiconductor–metal composites capable of integrating efficient charge transfer, strong plasmonic enhancement, and robust molecular adsorption remains an effective strategy for developing high-performance SERS substrates for highly sensitive TC detection.
Meanwhile, the efficient removal of TC from water bodies remains technologically demanding. Conventional approaches—including adsorption, advanced oxidation processes and microbial degradation—often suffer from incomplete removal, high operational costs and significant energy consumption, and susceptibility to environmental fluctuations [4,12]. Photocatalytic technology has garnered considerable attention in recent years due to its operational simplicity, low energy requirements, and environmental compatibility. Nevertheless, traditional wide-bandgap semiconductor photocatalysts such as TiO2 and ZnO exhibit limited visible-light utilization, thereby constraining their practical application [13,14]. In contrast, cuprous oxide (Cu2O) has ranked among potential visible light-responsive photocatalytic materials due to its high-efficiency absorption characteristics of visible light, excellent photochemical stability, and relatively small band gap. It is a pity that the actual performance of this system is limited by the insufficient carrier migration rate and the rapid recombination of photogenerated electron–hole pairs [15]. Constructing a heterojunction structure of semiconductors and metals has been proved to be an effective strategy. However, the effectiveness of Schottky junctions strongly depends on the interface quality and metal loading [16]. By constructing a Schottky barrier at the Cu2O/metal interface, the charge separation process can be effectively promoted, and then the efficiency of the photocatalytic reaction can be improved. In particular, when Cu2O is coupled with plasmonic metals (e.g., Ag or Au), the LSPR effect of the plasmonic metal can significantly broaden the light absorption range and improve light-harvesting efficiency, thereby substantially boosting photocatalytic degradation performance. Simultaneously, the synergistic interplay between interfacial charge transfer and the CE mechanism can concurrently enhance the SERS sensitivity [17]. With this dual characteristic, a single composite platform can simultaneously achieve high-sensitivity detection and efficient degradation of TC. Furthermore, facile recovery and recyclability of the nanocomposites (NCs) are essential for sustainable environmental applications. Conventional separation methods, including centrifugation, filtration, and sedimentation, are often laborious, time-consuming, and may result in loss of functional activity [18]. Magnetic separation offers a rapid and convenient alternative. Superparamagnetic Fe3O4 nanocrystals, characterized by large specific surface area and high saturation magnetization, have been the optimal choice for magnetic supports [19]. Therefore, the integration of Fe3O4 with Cu2O/Ag nanostructures presents a promising strategy for achieving sensitive antibiotic detection, efficient photocatalytic degradation, and convenient magnetic recovery.
In this study, an innovative Fe3O4/Cu2O-Ag composite plasmonic nanomaterial was designed and prepared. This material successfully integrates the dual functions of efficient photocatalytic degradation of pollutants and ultrasensitive SERS detection. The influence of varying Ag loadings on the photocatalytic and SERS performances was systematically investigated to identify the optimal composition. A plausible photocatalytic degradation mechanism of TC by the optimized NCs was proposed. Concurrently, the sensitivity, reproducibility, and long-term stability of the optimal nanocomposite as a SERS substrate were comprehensively evaluated, and the electromagnetic field enhancement effects under different Ag loadings were elucidated through finite-difference time-domain (FDTD) simulations. Furthermore, benefiting from the superparamagnetic nature of the Fe3O4 core, the as-prepared NCs enable convenient magnetic separation and recycling, underscoring their practical applicability in complex environmental matrices. This study is anticipated to provide a versatile design strategy for constructing plasmonic magnetic NCs that bridge environmental remediation and analytical sensing, offering considerable promise for integrated pollutant monitoring and sustainable water treatment.
2. Results and Discussion
2.1. Morphological and Structural Characterization of Fe3O4/Cu2O-Ag NCs
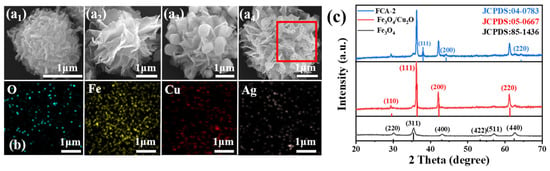
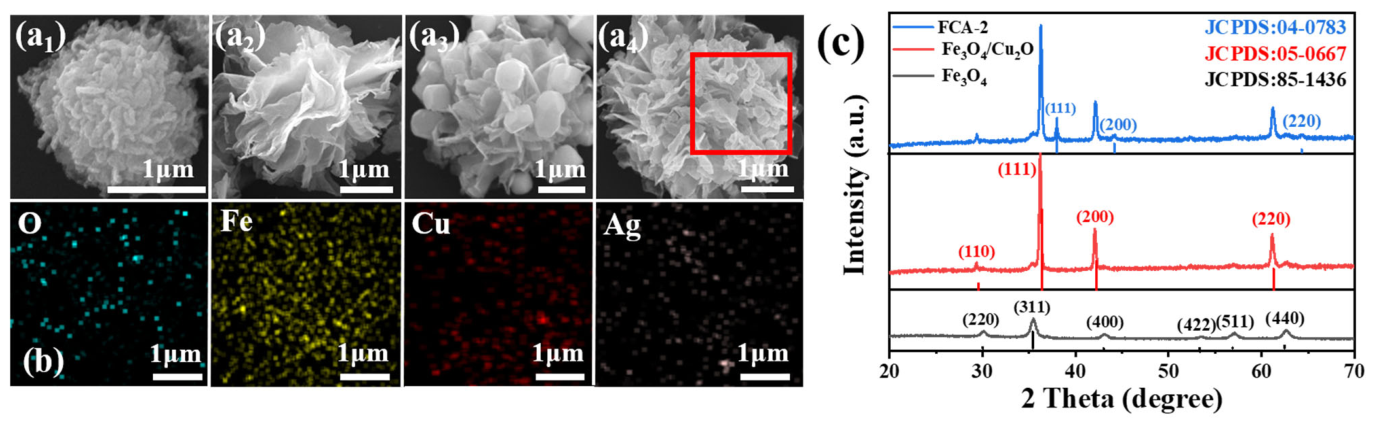
Using SEM technology, this study systematically characterized the micro-morphological characteristics of iron alcohol precursors, Fe3O4 nanocrystals, Fe3O4/Cu2O composites and Fe3O4/Cu2O-Ag NCs. The observation results show that the iron alcohol precursor shows a regular flower-cluster-like structure, and its average particle size is about 1.5 μm (as shown in Figure 1(a1)). After calcination under an inert (N2) atmosphere, the organic components undergo in situ carbonization/decomposition, while the iron alkoxide is converted into Fe3O4 nanocrystals [20]. The resulting Fe3O4 nanocrystals retain the hierarchical flower-like architecture of the precursor, consisting of porous nanosheets. As shown in Figure 1(a2), the obtained Fe3O4 nanocrystals exhibit a uniform diameter of approximately 3 μm and a relatively smooth, petal-like layered surface. As shown in Figure 1(a3), benefiting from the hierarchical architecture of the flower-like Fe3O4 nanocrystals, Cu2O nanocrystals (~500 nm) are uniformly anchored onto the petal-like nanosheets, forming Fe3O4/Cu2O NCs. After Ag loading, the surface of Fe3O4/Cu2O NCs becomes noticeably rougher (Figure 1(a4)). The introduction of Ag nanocrystals increases surface roughness and potentially enhances surface reactivity and the number of active sites for photocatalytic reactions, improving the overall photocatalytic activity. However, due to their small particle size (~5 nm), Ag nanocrystals are difficult to distinguish from Cu2O nanocrystals based solely on SEM observations. Therefore, EDS elemental mapping (Figure 1b) and TEM analysis (Figure S1) were employed, demonstrating the presence of O, Fe, Cu and Ag elements and verifying the successful loading of Cu2O and Ag nanocrystals onto the surfaces of Fe3O4 nanocrystals.
Figure 1.
SEM images of (a1) iron alkoxide precursors, (a2) Fe3O4 nanocrystals, (a3) Fe3O4/Cu2O, and (a4) FCA-2 NCs; (b) EDS elemental mapping of Fe3O4/Cu2O-Ag NCs (O, Fe, Cu, and Ag); and (c) XRD patterns of Fe3O4 nanocrystals, Fe3O4/Cu2O, and Fe3O4/Cu2O-Ag NCs.
The crystal structures of Fe3O4 nanocrystals, Fe3O4/Cu2O composite systems, and Fe3O4/Cu2O-Ag ternary NCs were analyzed using XRD technology. According to the diffraction pattern in Figure 1c, the Fe3O4 nanocrystals showed characteristic diffraction peaks, and their diffraction angles (2θ) were 30.1°, 35.4°, 43.0°, 53.4°, 56.9°, and 62.5° respectively, corresponding to the (220), (311), (400), (422), (511), and (440) crystal planes in crystallography (JCPDS standard card number 85-1436) [21], and no other impurity phase diffraction signals were observed, indicating that the sample had a high phase purity. After the deposition of Cu2O was completed, new diffraction peaks observed at 2θ angles of 29.5°, 36.4°, 42.2°, and 61.3° had their crystal plane indices respectively assigned to the (110), (111), (200), and (220) crystal planes of Cu2O (referring to JCPDS standard card number 05-0667) [22]. After the successful deposition of Ag nanocrystals, through X-ray diffraction analysis, it was found that three groups of new diffraction peaks appeared at characteristic angle positions of 38.1°, 44.3°, and 64.4°. The crystal plane assignments of these diffraction peaks were confirmed, corresponding to the (111), (200), and (220) crystal planes of metallic silver respectively, and their standard diffraction data were completely matched with the JCPDS No. 04-0783 card [23]. At the same time, the diffraction signal intensity of the original Cu2O nanocrystals was significantly weakened, and their characteristic peak positions had slight displacements. The cause of this phenomenon mainly involves two core elements. First, Ag nanocrystals deposited on the Cu2O surface partially block incident X-rays and attenuate the diffracted signals from Cu2O nanocrystals, leading to the reduction in intensity of the Cu2O diffraction peaks [24]. Second, the interfacial lattice mismatch between Ag and Cu2O introduces lattice strain in the near-surface region of Cu2O nanocrystals, thereby altering the interplanar spacing [25]. These observations confirm the successful loading of Ag onto Cu2O and suggest strong interfacial interaction between the two components.
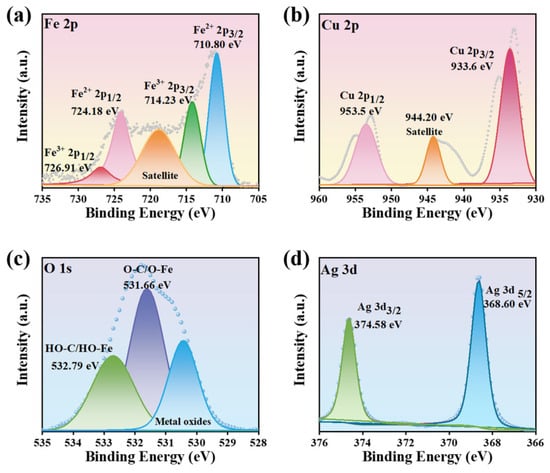
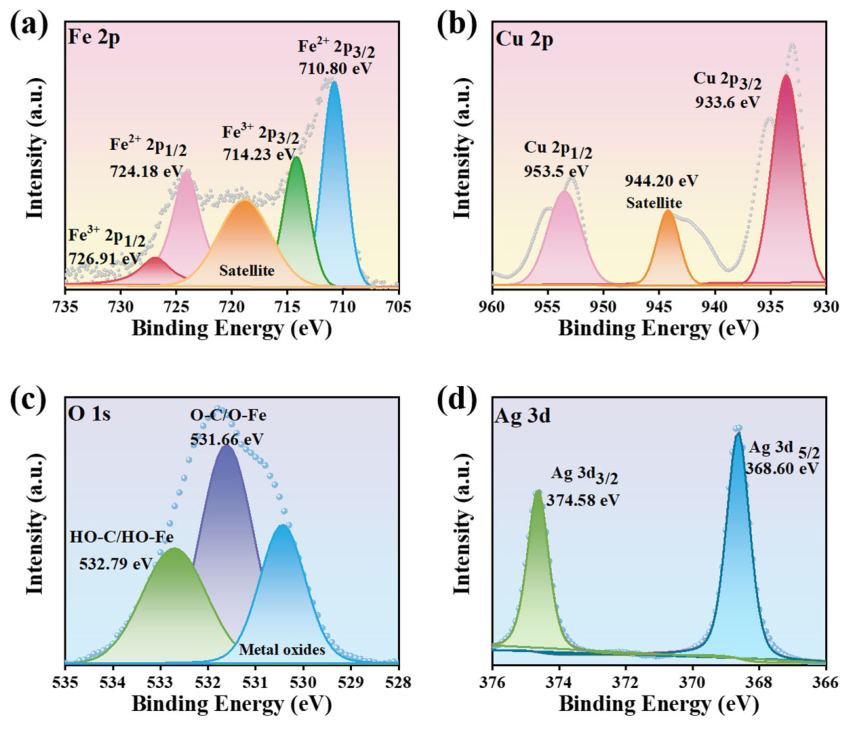
XPS was employed to further identify the surface chemical composition and valence states of FCA-2 NCs. The adventitious C 1s signal at 284.8 eV was used as the calibration reference to eliminate possible charge-induced shifts. As shown in the survey spectrum (Figure S2), the signals of Fe, Cu, O, Ag and C are clearly detected, and no other impurity elements can be observed, indicating the successful fabrication of FCA-2 NCs. As presented in Figure 2a, the high-resolution Fe 2p spectrum can be fitted into four characteristic peaks.
Figure 2.
High-resolution XPS spectra of (a) Fe 2p, (b) Cu 2p, (c) O 1s, and (d) Ag 3d of FCA-2 NCs.
The peaks centered at 710.80 and 724.18 eV are assigned to Fe2+ 2p3/2 and Fe2+ 2p1/2, respectively, whereas the peaks located at 714.23 and 726.91 eV correspond to Fe3+ 2p3/2 and Fe3+ 2p1/2, respectively [26]. The coexistence of Fe2+ and Fe3+ demonstrates the formation of mixed-valence iron oxide species in FCA-2 NCs, which may facilitate interfacial electron transfer by providing redox-active Fe2+/Fe3+ couples [27]. As can be seen from Figure 2b, the Cu 2p spectrum displays two main peaks at 933.6 and 953.5 eV, which are attributed to Cu 2p3/2 and Cu 2p1/2, respectively. Moreover, the weak satellite peak at 944.20 eV suggests the presence of a small amount of surface-oxidized Cu species, while the dominant Cu 2p signals reveal that Cu mainly exists in a Cu+-related chemical environment [28]. Figure 2c shows that the O 1s spectrum can be deconvoluted into several oxygen-containing components. The low-binding-energy contribution is ascribed to lattice oxygen in metal oxides, while the peaks at 531.66 and 532.79 eV are associated with O-C/O-Fe species and surface hydroxyl/adsorbed oxygen species, respectively [29]. These results indicate the existence of metal–oxygen bonds and oxygen-containing surface groups in the composite. In the Ag 3d spectrum (Figure 2d), two distinct peaks located at 368.60 and 374.58 eV are assigned to Ag 3d5/2 and Ag 3d3/2, respectively. The spin–orbit separation of approximately 6.0 eV confirms that Ag is mainly present in the metallic Ag0 state [28]. Consequently, the XPS results further verify the successful construction of FCA-2 NCs composed of mixed-valence Fe oxide species, Cu+-dominated Cu species with slight surface oxidation, surface oxygen-containing groups, and metallic Ag.
2.2. Optical and Photoelectrochemical Properties of Fe3O4/Cu2O-Ag NCs
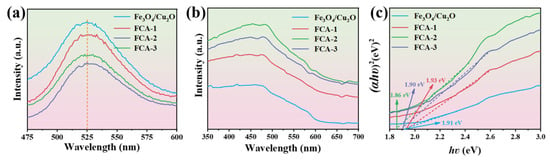
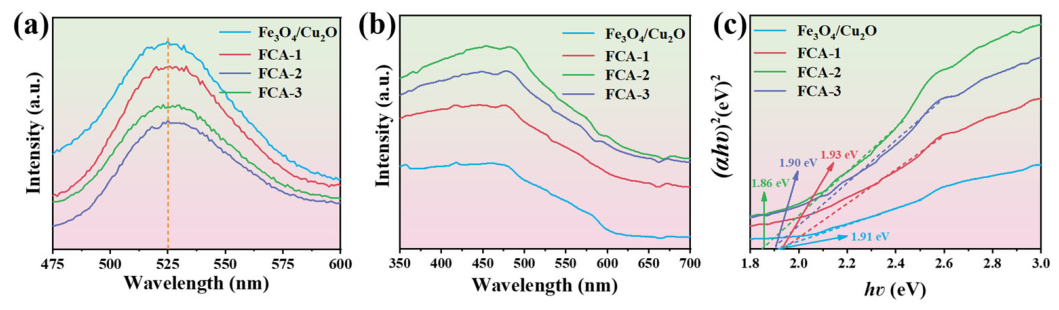
We systematically explored the recombination kinetics of photo-generated electron–hole pairs using PL spectroscopy technology [30]. Generally, the decay of PL signal intensity characterizes the efficiency of the carrier recombination process, and the lower PL emission intensity corresponds to the optimization of the charge separation and transport process, that is, it has a more efficient light-induced carrier separation ability. From the spectral data in Figure 3a, it can be seen that the emission spectra of several NCs such as Fe3O4/Cu2O, FCA-1, FCA-2 and FCA-3 have highly similar contour characteristics under the excitation condition of 440nm wavelength, and the center positions of the main peaks are all concentrated near 525nm. It is worth noting that the photoluminescence (PL) intensity of the Fe3O4/Cu2O–Ag is significantly lower than that of the pure Fe3O4/Cu2O nanocomposite structure. This phenomenon reveals that the doping of Ag nanocrystals effectively improves the migration rate and separation efficiency of electron–hole pairs. It is particularly worth emphasizing that among all the tested composite materials, the FCA-2 nanocomposite structure shows the lowest PL signal, which suggests that its micro-structure has been optimally adjusted so that the carrier recombination probability at the composite interface is reduced to the minimum, thus endowing it with excellent potential for photocatalytic performance [31]. UV-Vis DRS was used to evaluate the effect of Ag deposition on the optical absorption of Fe3O4/Cu2O NCs. As illustrated in Figure 3b, all samples exhibit broad absorption in the visible-light region. After Ag deposition, the visible-light absorption intensity is significantly enhanced compared with that of pristine Fe3O4/Cu2O, which can be attributed to the LSPR effect of Ag nanocrystals. Among the Ag-modified samples, FCA-2 exhibits the strongest visible-light absorption capability, indicating improved light-harvesting performance. The optical band-gap energies (Eg) of Fe3O4/Cu2O and FCA-2 NCs were calculated according to the experiential Tauc equation [32]:
αhν = A (hν − Eg) n/2
Figure 3.
(a) PL spectra, (b) UV-Vis DRS, and (c) corresponding Tauc plots for band-gap energy determination of Fe3O4/Cu2O, FCA-1, FCA-2 and FCA-3 NCs.
Among them, α, hν and A respectively refer to the absorption coefficient, photon energy and proportionality constant. As shown in Figure 3c, the method for determining the Eg is as follows: plot (αhν)2 against hν, and the abscissa of the intersection point of the tangent to the resulting curve with the horizontal axis is the band-gap energy. According to this calculation, the Eg of the Fe3O4/Cu2O and FCA-2 NCs are about 1.91 eV and 1.86 eV respectively. Although the band-gap energy decreases slightly after Ag incorporation (by approximately 0.05 eV), this change is relatively limited. Accordingly, the Tauc analysis is primarily used to compare the optical absorption characteristics of different samples, and the calculated band-gap values should be interpreted together with the UV-Vis DRS, PL, and SERS measurement results. Based on these complementary characterizations, the enhanced visible-light absorption and photocatalytic performance are mainly attributed to the LSPR effect of Ag nanocrystals, while the slight band-gap narrowing may provide an additional contribution.
2.3. Photocatalytic Performance of Fe3O4/Cu2O-Ag NCs
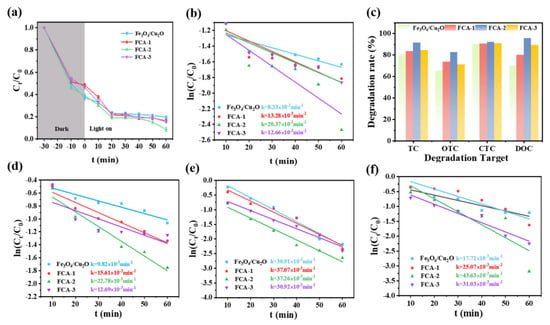
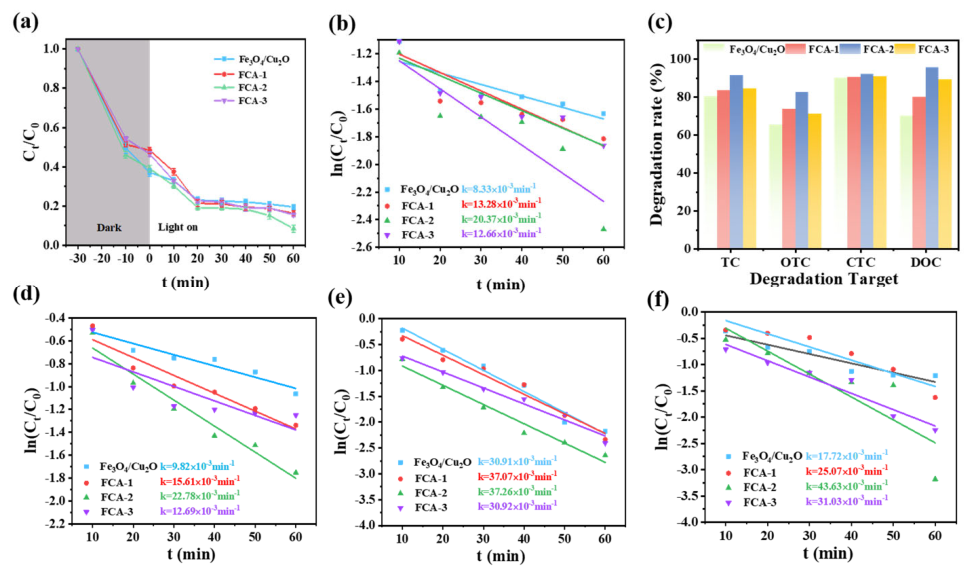
To systematically investigate the photocatalytic performance of FCA-2 NCs towards the degradation of TC, under the simulated sunlight radiation conditions, multiple groups of degradation experiments were carried out. In the experiments, the dosage of the catalyst was set at 0.1g·L−1, and the initial concentration of TC was also 0.1g·L−1. As shown in Figure 4a, in order to ensure that the adsorption–desorption process reaches equilibrium, the reaction suspension needs to be stirred in the dark room for 30 min before the light treatment begins. After 60 min of light treatment, the degradation efficiency of Fe3O4/Cu2O NCs for TC is about 79.98%. This modest efficiency is attributed to severe photoinduced carrier recombination, which significantly suppresses photocatalytic activity. In contrast, the Ag-modified Fe3O4/Cu2O NCs exhibit markedly improved activity, with degradation efficiencies of ~82.69%, 83.33%, and 91.79% for FCA-1, FCA-3 and FCA-2 NCs within 60 min, respectively. Among them, FCA-2 NCs demonstrate both optimal TC adsorption capacity and the highest photocatalytic degradation efficiency. Notably, the photocatalytic performance of FCA samples exhibits a volcano-type trend (increasing initially and then decreasing) with increasing Ag content, indicating the existence of an optimal Ag loading threshold. When the Ag content is excessive, the nano-Ag particles may cover the active sites on the surface of the photocatalyst, and at the same time, have a hindering effect on the light absorption process, thereby leading to a decrease in photocatalytic activity. This phenomenon is in line with the analytical conclusions made previously on optical and photoelectrochemical properties [33]. In Figure 4b, there is a good linear relationship between ln(Ct/C0) and the reaction time, which further confirms the above trend. The FCA-2 nanocomposite shows the highest kinetic rate constant, reaching 20.37 × 10⁻³ min−1. At the same time, under the same simulated sunlight radiation conditions, photocatalytic degradation experiments were carried out on OTC, CTC, and DOC. The FCA-2 nanocomposite shows excellent adsorption and photocatalytic performance when degrading OTC, CTC, and DOC pollutants (their kinetic rate constants are 22.78 × 10⁻³, 37.07 × 10⁻³, and 43.63 × 10⁻³ min−1 respectively), and the relevant data are shown in Figure 4d–f. After 60 min of light irradiation, the degradation rates of OTC, CTC, and DOC were increased to 81.59%, 92.01%, and 97.71% respectively, and the specific changes in degradation efficiency can be seen in Figure 4c. The above research results strongly confirm that the FCA-2 photocatalyst shows universality in degrading representative organic pollutants.
Figure 4.
(a) Ct/C0 versus reaction time for TC degradation; (b) corresponding first-order kinetics for TC; (c) Ct/C0 versus reaction time for TC, OTC, CTC, and DOC; and (d–f) corresponding first-order kinetics for OTC, CTC, and DOC.
2.4. Photocatalytic Mechanism of Fe3O4/Cu2O-Ag NCs
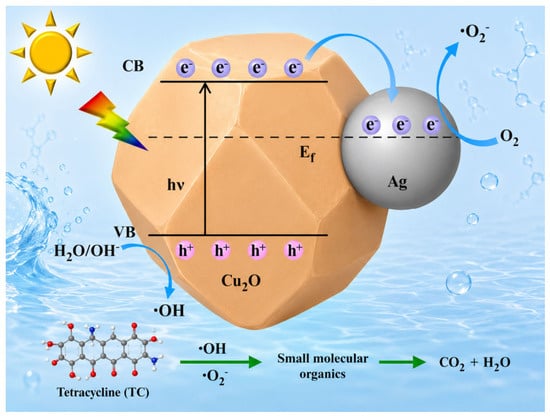
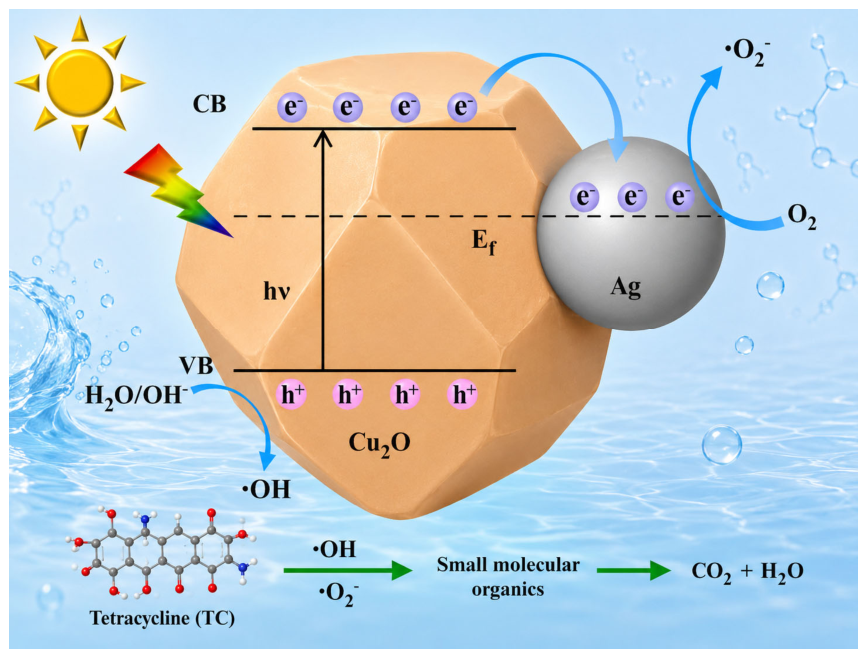
Based on the experimental results, a plausible photocatalytic degradation mechanism of TC by Fe3O4/Cu2O-Ag NCs was proposed, as illustrated in Figure 5. Given that Cu2O and Ag have different work functions, a Schottky barrier will be constructed at the Cu2O-Ag heterojunction interface when they are in contact [34]. Electrons migrate from Ag with a lower work function to Cu2O with a higher work function until the system reaches the equilibrium state of the Fermi level. This change causes the Fermi level of Ag to shift downward, while the Fermi level of Cu2O shows an upward movement, and then the band structure bends downward. When irradiated by visible light, the Fe3O4/Cu2O-Ag NCs are excited. At this time, photogenerated electrons are excited from the VB of Cu2O to the CB, and thus electron–hole pairs are formed [35]. Given that the conduction band potential of Cu2O is more negative than the equilibrium Fermi level of Ag, the photogenerated electrons generated by light excitation will continuously transfer from the conduction band of Cu2O to Ag nanocrystals [36]. However, the existence of the Schottky barrier constitutes a migration obstacle, making it difficult for these electrons to flow back to the Cu2O system in reverse. Therefore, Ag nanocrystals act as electron traps, which can efficiently restrain the recombination process of electron–hole pairs. The electrons adsorbed on the surface of Ag can be captured by O2 molecules in the environment, and then superoxide anion radicals (O2−) with strong oxidizing property are formed. This process plays a key promoting role in the degradation of TC. At the same time, the photogenerated holes remaining in the valence band of Cu2O can directly oxidize and decompose TC molecules, and finally generate inorganic small molecular by-products such as H2O and CO2 [37]. It is worth noting that silver nanocrystals with the LSPR effect can enhance the separation efficiency of photogenerated electron–hole pairs and then increase the carrier concentration, and this mechanism also has a positive effect on the degradation process of TC [38]. Based on the above analysis, the introduction of silver nanocrystals not only provides a richer source for the generation of active free radicals in the system, but also significantly optimizes the light energy capture and conversion efficiency of the Fe3O4/Cu2O-Ag NCs. Therefore, when the loading amount reaches the optimal ratio, the prepared FCA-2 nanocomposite shows excellent photocatalytic degradation performance [39].
Figure 5.
Schematic illustration of the proposed photocatalytic mechanism of Fe3O4/Cu2O-Ag NCs.
2.5. SERS Detection Activity of FCA-2 NCs
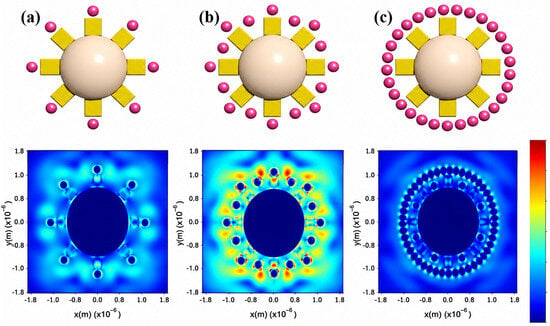
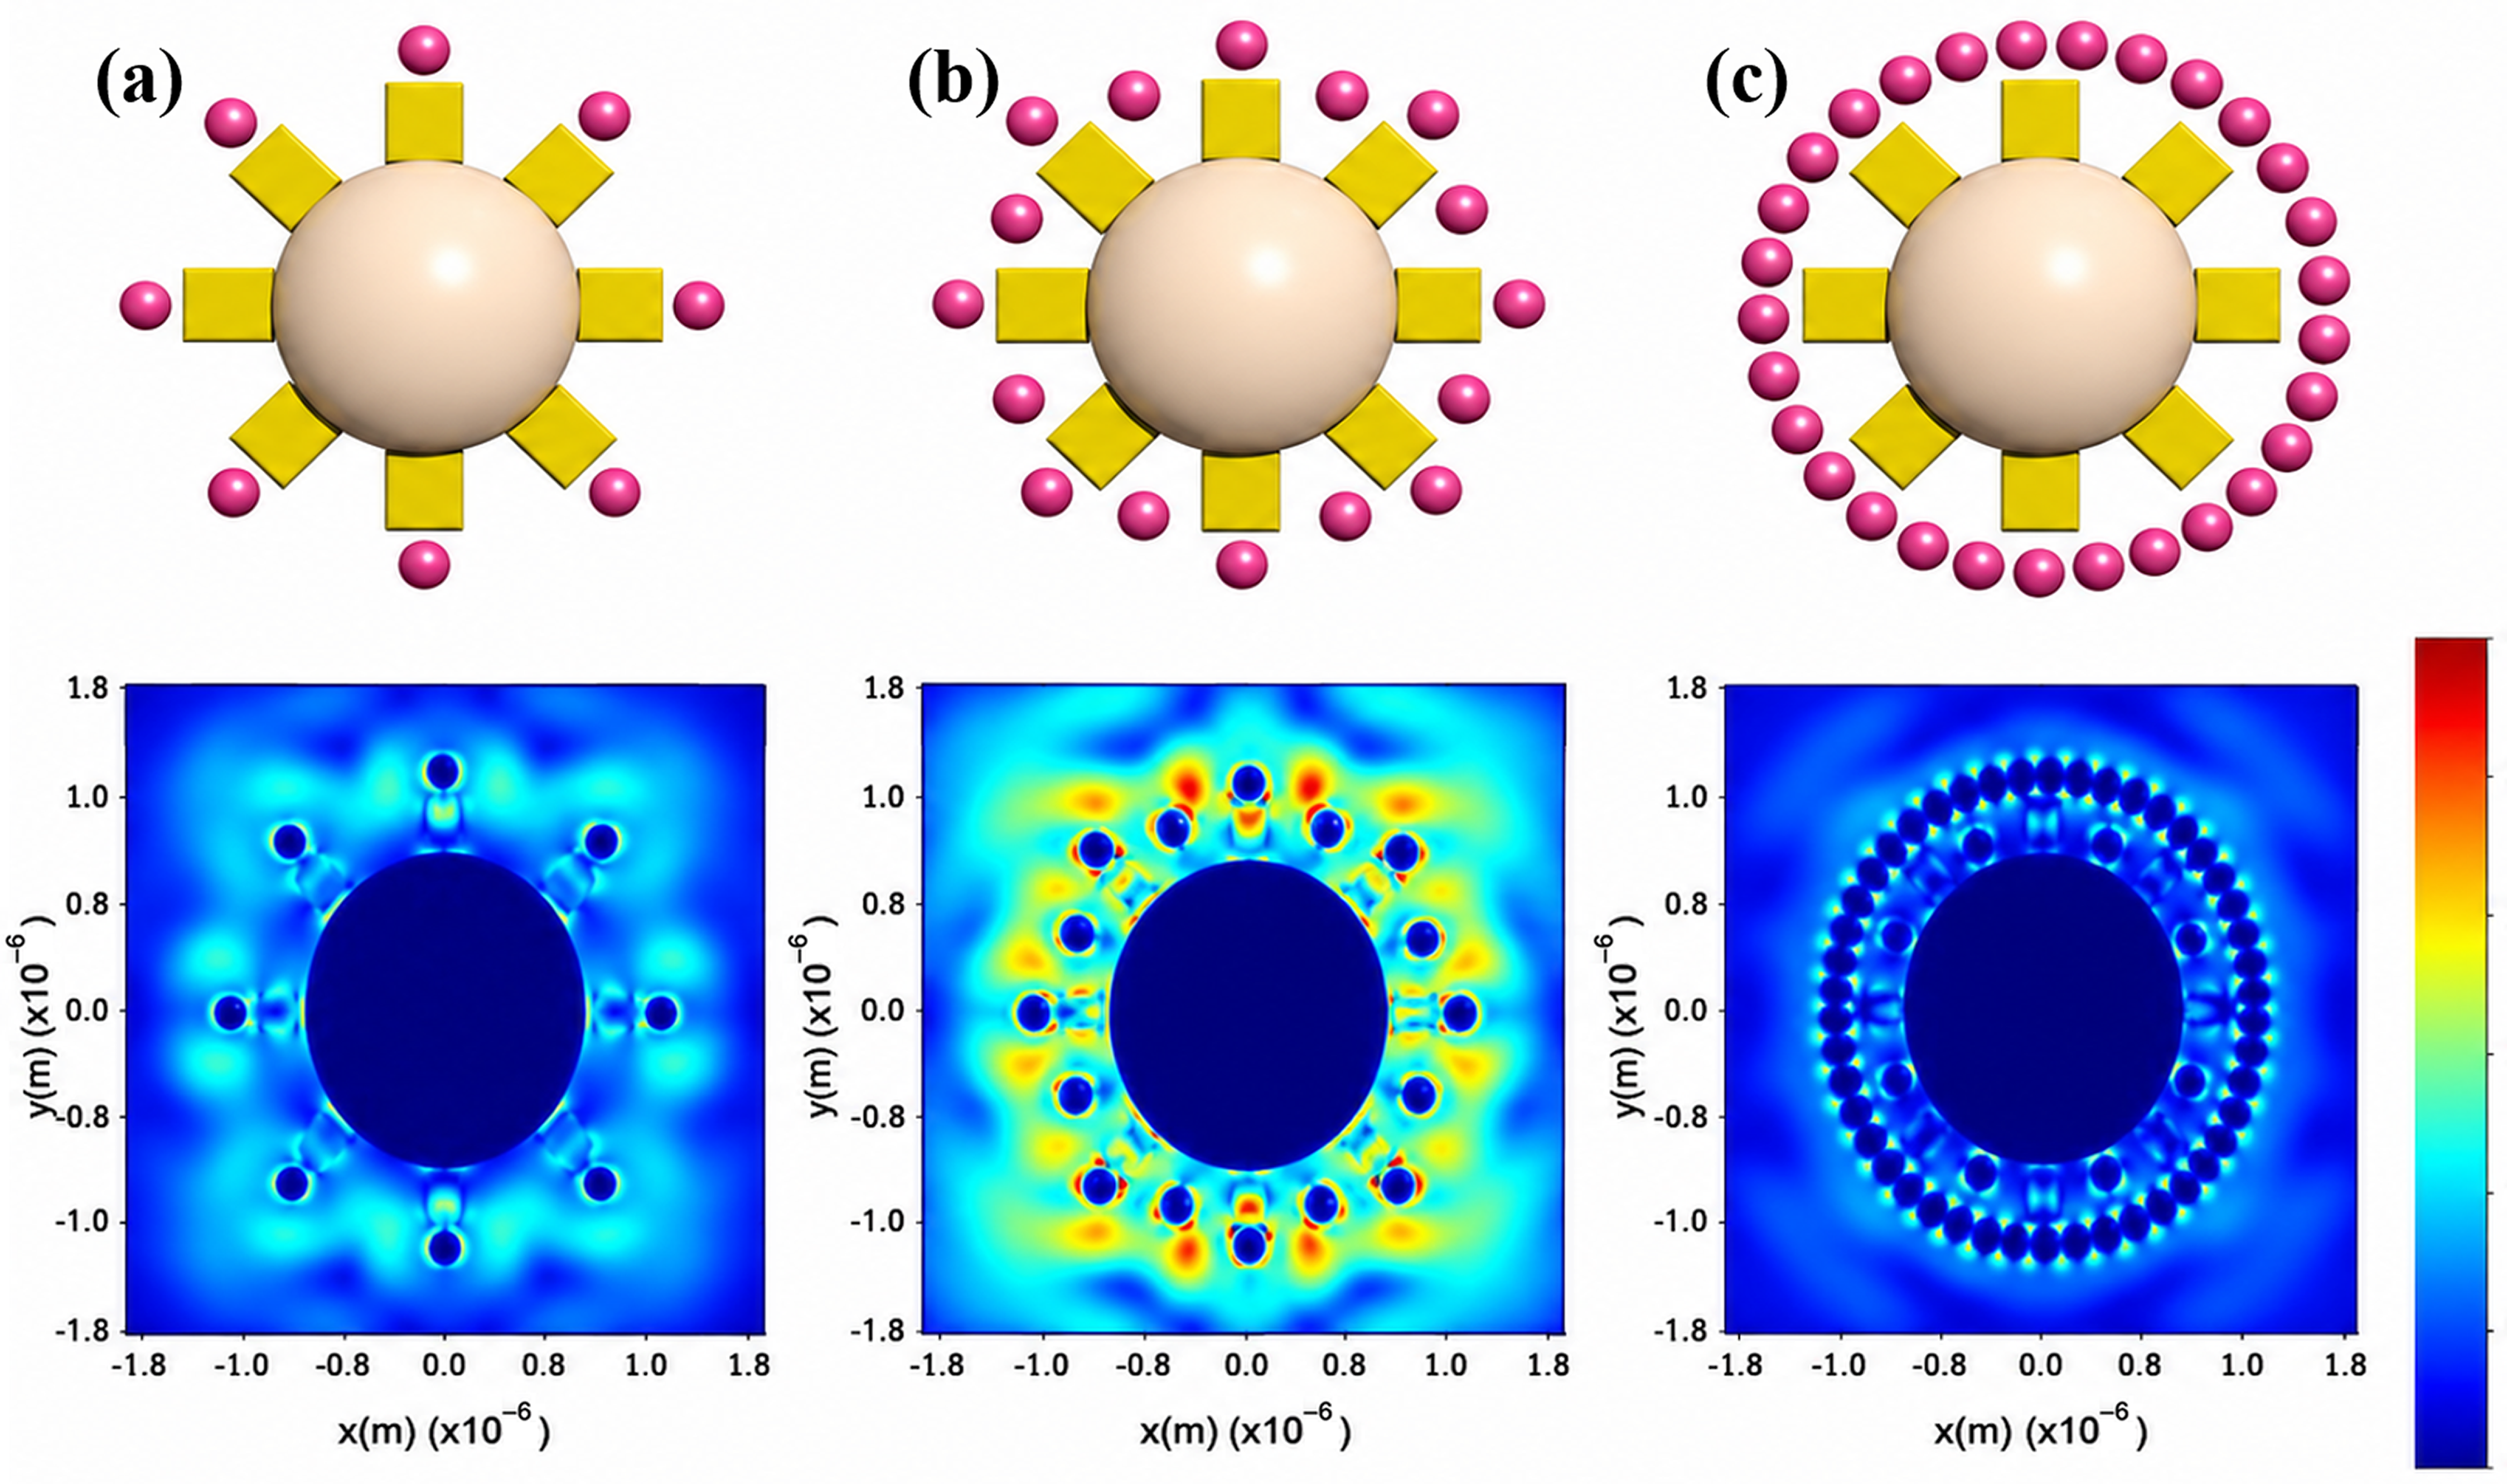
To elucidate the relationship between Ag loading and SERS sensitivity, FDTD simulations were conducted to simulate the electric field distribution and intensity around FCA-1, FCA-2, and FCA-3 NCs (Figure 6). The simulation results reveal that the majority of plasmonic “hot spots” are localized within the nanogaps between adjacent Ag nanocrystals. Both the number and intensity of hot spots increase with the noble metal nanoparticle density [40]. However, excessive loading results in nanoparticle agglomeration or overlap, which severely diminishes hot spot generation. These findings are in good agreement with the experimental observations and can be attributed to LSPR-induced electromagnetic enhancement, which is widely recognized as the dominant contributor to SERS enhancement. Moderate Ag loading promotes strong plasmonic coupling between adjacent nanocrystals, generating intense localized electromagnetic fields and significantly amplifying Raman signals [41]. In contrast, excessive Ag loading induces aggregation and partial surface coverage, diminishing hot spot density and SERS intensity [42]. Thus, both the number and distribution of hot spots are crucial to the overall SERS performance.
Figure 6.
FDTD models and corresponding electric field distributions for (a) FCA-1, (b) FCA-2, and (c) FCA-3 NCs.
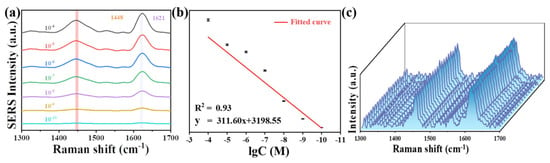
In practical applications of SERS technology, the intensity and stability of substrate signal detection are critical performance metrics [43]. To evaluate the SERS activity of FCA-2 NCs, systematic SERS measurements were conducted. As shown in Figure 7a, the SERS intensity of the characteristic TC peak at 1448 cm−1 gradually decreases with decreasing concentration from 10−4 to 10−10 M. Notably, the characteristic signal of TC remains distinguishable at concentrations as low as 10−10 M, indicating a detection limit (LOD) of 10−10 M. Quantitative analysis (Figure 7b) further indicates a linear relationship between the Raman intensity at 1448 cm−1 and the logarithm of TC concentration over the range of 10−4 to 10−10 M (R2 = 0.93).
Figure 7.
(a) SERS spectra and (b) linear relationship between Raman intensity at 1448 cm−1 and concentration (10−4 to 10−10 M) of TC adsorbed on FCA-2 NCs; (c) SERS spectra of TC (10−4 M) acquired at 20 randomly selected points on FCA-2 NCs.
In addition, to evaluate the reproducibility characteristics of the SERS substrate, a spatially resolved detection strategy was employed to verify the uniformity of the FCA-2 NCs. As shown in Figure 7c, SERS fingerprint spectra of TC (10−4 M) were collected from 20 randomly selected micro-regions (2 μm in diameter) on the material’s surface. The signal fluctuation parameters for 1448 cm−1 were calculated based on the principles of statistical process control (Figure S3). The analysis reveals that the relative standard deviation (RSD) of Raman intensities across all detection sites is only 3.15%, confirming the excellent spatial uniformity and signal reproducibility of FCA-2 NCs. These results demonstrate that the material can satisfy the stringent requirements for signal reproducibility in trace detection, highlighting its application potential as a high-performance SERS substrate.
2.6. Long-Term Stability Assessment
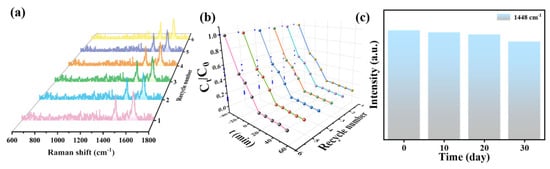
The stability of FCA-2 NCs was evaluated through six consecutive SERS–photocatalysis cycles. As shown in Figure 8a,b, both the SERS signal intensity and the photocatalytic degradation efficiency towards TC (0.1g·L−1) remain largely unchanged over repeated cycles. The slight decrease observed in later cycles may be attributed to marginal loss of adsorption capacity. However, the overall performance confirms excellent recyclability and durability, underscoring the suitability of FCA-2 NCs for practical environmental applications. Furthermore, the storage stability tests of FCA-2 NCs (Figure 8c) demonstrate that after 30 days of storage, the characteristic Raman peak of TC molecules at 1448 cm−1 retains more than 95% of its initial intensity. This minimal attenuation (<5%) demonstrates the outstanding structural and functional stability of FCA-2 NCs, meeting the stringent requirements for practical SERS-based detection.
Figure 8.
(a) SERS detection and (b) photocatalytic degradation recycling tests of TC over FCA-2 NCs under identical experimental conditions (six consecutive cycles); and (c) histogram of average SERS intensity of TC at 1448 cm for FCA-2 NCs stored over different durations.
3. Materials and Methods
3.1. Chemicals and Instruments
Urea, iron chloride hexahydrate (FeCl3·6H2O), oxytetracycline (OTC), chlortetracycline (CTC), and doxycycline (DOC) were purchased from Shanghai Macklin Biochemical Co., Ltd. (Shanghai, China). Ethylene glycol (EG), silver nitrate (AgNO3), hydroxylammonium chloride (NH2OH·HCl), sodium hydroxide (NaOH), and absolute ethanol were purchased from Sinopharm Chemical Reagent Co, Ltd. (Shanghai, China). Tetramethylammonium bromide (TBAB), sodium dodecyl sulfate (SDS), tetracycline (TC), and copper chloride dihydrate (CuCl2) were obtained from Aladdin Reagent Co., Ltd. (Shanghai, China). All chemicals used in this experiment were analytical grade and used without further purification.
The crystal structures, morphologies and elemental compositions of the prepared samples were determined by X-ray diffractometer (XRD; Rigaku D/Max-2500; Tokyo, Japan) using Cu Kα radiation (λ = 1.5406 Å) over a 2θ range of 10–80° with a scanning rate of 5° min−1. The morphologies and microstructures were examined by scanning electron microscopy (SEM; FEI Nova NanoSEM 450, Thermo Fisher Scientific FEI, Hillsboro, OR, USA) equipped with an energy dispersive spectrometer (EDS) and transmission electron microscopy analysis (TEM; JEOL 2100, JEOL Ltd., Tokyo, Japan). X-ray photoelectron spectroscopy (XPS; ESCALAB 250Xi, Thermo Fisher Scientific, Waltham, MA, USA) was employed to determine surface chemical states, and all binding energies were calibrated using the C 1s peak at 284.8 eV as the reference. The photochemical properties were investigated using photoluminescence spectroscopy (PL; F-4600, Hitachi, Tokyo, Japan, excitation wavelength: 440 nm) and ultraviolet-visible diffuse reflectance spectra (UV-Vis DRS; LAMBDA 950, PerkinElmer, Waltham, MA, USA; using BaSO4 as the reference material). Ultraviolet-visible spectra were observed on a spectrophotometer (UV-Vis; UV-3600, Shimadzu, Kyoto, Japan). The SERS spectra were acquired on a Raman microscope (SENTERRA II, Bruker, Ettlingen, Germany) with an excitation wavelength of 532 nm in the spectral region from 800 to 1800 cm−1.
3.2. Synthesis of Fe3O4/Cu2O and Fe3O4/Cu2O-Ag NCs
The Fe3O4 nanocrystals, Fe3O4/Cu2O NCs, and Fe3O4/Cu2O-Ag NCs were synthesized according to our previously reported procedures [21]. The obtained Fe3O4/Cu2O-Ag nanocrystals with different Ag loadings are denoted by FCA-1, FCA-2, and FCA-3, respectively.
3.3. FDTD Simulation Method
The localized electromagnetic field distribution of Fe3O4/Cu2O-Ag NCs was simulated using the FDTD method (Lumerical solutions). The simulation region was defined as an 800 × 800 × 800 nm3 cuboid surrounded by perfectly matched layer-absorbing boundaries to eliminate numerical reflections. The structural parameters employed in the FDTD simulation were consistent with the experimentally observed dimensions of the Fe3O4/Cu2O-Ag NCs. A continuous-wave excitation source (λ = 532 nm) with an area of 800 × 800 nm2 was placed along the positive z-axis, and the electric field polarization was oriented along the y-axis.
3.4. SERS Detection of TC in Wastewater
In order to investigate the influences of Ag content on SERS performance and ascertain an optimal SERS substrate, Fe3O4/Cu2O-Ag NCs with various Ag loading amounts were used as SERS substrates for TC detection. Specifically, 1 mg of FCA-1, FCA-2 and FCA-3 NCs was dispersed into 3 mL of TC solution (10−4 M), respectively. Then, the mixture was blended and shaken on an oscillator in the dark for several hours to ensure sufficient adsorption. The material was then collected with a magnet, dropped onto a clean silicon wafer, and dried at room temperature for subsequent SERS detection. SERS spectra were recorded using a 532 nm laser with a power of 10 mW. The spectral range was 200–2000 cm−1, and acquisition time was about 10 s. According to SERS results, FCA-2 NCs exhibited the best performance and were therefore identified as optimal SERS substrate for DOC, OTC, and CTC. The detection process of DOC, OTC, and CTC was the same as that for the above SERS detection of TC. Furthermore, SERS spectra of TC were acquired at 20 randomly selected spots on FCA-2 NCs to evaluate signal reproducibility.
3.5. Photocatalytic Experiments
The photocatalytic capacity of the samples was investigated by monitoring the degradation efficiency of TC in aqueous solution at room temperature. Xe lamps with wavelengths of 300–1100 nm were used to simulate solar irradiation. Prior to illumination, 10 mg of photocatalyst was dispersed in 100 mL of an TC solution (10 mg·L−1). In the dark, the suspension was stirred for 30 min to ensure adsorption–desorption equilibrium. During irradiation, 5 mL aliquots were withdrawn at regular intervals, filtered through a 0.22 μm syringe filter to remove the photocatalyst and the residual TC concentration was determined by UV-Vis absorption spectrophotometry.
4. Conclusions
In summary, a magnetically recoverable Fe3O4/Cu2O-Ag plasmonic nanocomposite was successfully engineered as a multifunctional platform for the simultaneous photocatalytic degradation and ultrasensitive SERS detection of TCs. The hierarchical Fe3O4 nanocrystals provided robust magnetic supports for facile separation, while Cu2O nanocrystals served as visible-light-responsive semiconductors. The incorporation of Ag nanocrystals established a Cu2O-Ag Schottky junction and introduced LSPR effects, collectively enhancing light harvesting, promoting charge separation, and amplifying electromagnetic fields. The optimized FCA-2 NCs demonstrated superior photocatalytic performance, achieving 91.79% TC degradation within 60 min under simulated solar irradiation, with excellent recyclability. The superior photocatalytic performance was mechanistically attributed to the synergistic interplay of the LSPR effect—which broadened visible-light utilization—and the formation of a Cu2O/Ag Schottky barrier, which effectively trapped photoinduced electrons and prevented carrier recombination. Furthermore, the FCA-2 NCs exhibited outstanding broad-spectrum photocatalytic activity, efficiently degrading a variety of TC analogs (TC, OTC, CTC, and DOC) within 60 min. Concurrently, FDTD simulations and experimental SERS measurements confirmed that moderate Ag loading maximized plasmonic hot spot density, enabling a detection limit of as low as 10−10 M with outstanding signal reproducibility and long-term stability. Importantly, the integration of magnetic separability, plasmon-enhanced photocatalysis, and ultrasensitive molecular detection within a single nanoplatform addressed key challenges in environmental remediation and analytical sensing. This study provides a versatile design paradigm for multifunctional plasmonic–magnetic heterostructures and offers a promising approach toward sustainable antibiotic monitoring and water purification technologies.
Supplementary Materials
The following supporting information can be downloaded at https://www.mdpi.com/article/10.3390/inorganics14070188/s1, Figure S1: TEM mapping (Fe, Cu, O and Ag) of FCA-2 NCs; Figure S2: XPS survey spectra of FCA-2 NCs; Figure S3: The corresponding RSD values of TC (10−4 M) obtained at 20 random points on FCA-2 at 1448 cm−1.
Author Contributions
Conceptualization, H.H. and B.M.; methodology, H.S.; software, H.S.; validation, H.L. and Z.L.; formal analysis, H.H.; investigation, W.Z.; resources, W.Z.; data curation, B.M.; writing—original draft preparation, B.M.; writing—review and editing, B.M.; visualization, N.R.K.; supervision, B.F.; project administration, Y.L.; funding acquisition, Y.L. All authors have read and agreed to the published version of the manuscript.
Funding
This work was financially supported by the National Natural Science Foundation of China, China (Grant Number 22378158) and the Program for the Development of Science and Technology of Jilin Province, China (Grant Number 20240101074JC).
Institutional Review Board Statement
Not applicable.
Informed Consent Statement
Not applicable.
Data Availability Statement
The original contributions presented in this study are included in this article/Supplementary Material. Further inquiries can be directed to the corresponding authors.
Conflicts of Interest
The authors declare no conflict of interest.
References
- Hu, X.; Zhang, Z.; Lu, P.; Zhou, Y.; Zhou, Y.; Bai, Y.; Yao, J. Cyano-deficient g-C3N4 for round-the-clock photocatalytic degradation of tetracycline: Mechanism and application prospect evaluation. Water Res. 2024, 260, 121936. [Google Scholar] [CrossRef] [Scilit] [PubMed]
- Amangelsin, Y.; Semenova, Y.; Dadar, M.; Aljofan, M.; Bjørklund, G. The impact of tetracycline pollution on the aquatic environment and removal strategies. Antibiotics 2023, 12, 440. [Google Scholar] [CrossRef] [Scilit] [PubMed]
- Semenova, Y.; Makalkina, L.; Glushkova, N.; Gaipov, A. Tetracyclines in the Modern Era: Global Consumption, Antimicrobial Resistance, Environmental Occurrence, and Degradation Techniques. Antibiotics 2025, 14, 1183. [Google Scholar] [CrossRef] [Scilit] [PubMed]
- Li, Y.; Liu, C.; Li, Q.; Mao, S. Fluorescence analysis of antibiotics and antibiotic-resistance genes in the environment: A mini review. Chin. Chem. Lett. 2024, 35, 109541. [Google Scholar] [CrossRef] [Scilit]
- Kayani, K.F. Tetracycline in the environment: Toxicity, uses, occurrence, detection, and removal by covalent organic frameworks−Recent advances and challenges. Sep. Purif. Technol. 2025, 364, 132418. [Google Scholar] [CrossRef] [Scilit]
- Guo, X.; Sun, H.; Yang, Y.; Zhong, W.; Wang, M.; Wang, G.; Zhang, Y. Nanozyme-based colorimetric and smartphone imaging advanced sensing platforms for tetracycline detection and removal in food. Talanta 2025, 283, 127028. [Google Scholar] [CrossRef] [Scilit] [PubMed]
- Han, D.; Guo, B.; Li, Y.; Feng, W.; Liu, K.; Wu, T.; Wan, Y.; Wang, L.; Gao, M.; Liu, Y.; et al. Simultaneous photocatalytic degradation and SERS detection of tetracycline with self-sustainable and recyclable ternary PI/TiO2/Ag flexible microfibers. Microsyst. Nanoeng. 2024, 10, 39. [Google Scholar] [CrossRef] [Scilit] [PubMed]
- Bandarenka, H.; Burko, A.; Laputsko, D.; Dronina, L.; Kovalchuk, N.; Podelinska, A.; Shapel, U.; Popov, A.I.; Bocharov, D. Ultraviolet Exposure Improves SERS Activity of Graphene-Coated Ag/ZrO2 Substrates. Crystals 2023, 13, 1570. [Google Scholar] [CrossRef] [Scilit]
- Ahmad, I.; Rehman, Z.U.; Hussain, S.; Raza, A.; Mahmood, S.; Qayyum, H.; Ullah, S. Laser-Based Synthesis of Pt–Au Bimetallic Alloy/Core–Shell Nanoparticles and Their SERS Sensitivity Analysis. Phys. Status Solidi A 2025, 222, 2500188. [Google Scholar] [CrossRef] [Scilit]
- Chaudhry, I.; Hu, G.; Ye, H.; Jensen, L. Toward Modeling the Complexity of the Chemical Mechanism in SERS. ACS Nano 2024, 18, 20835–20850. [Google Scholar] [CrossRef] [Scilit] [PubMed]
- Long, Y.; Li, H.; Du, Z.; Geng, M.; Liu, Z. Confined Gaussian-distributed electromagnetic field of tin(II) chloride-sensitized surface-enhanced Raman scattering (SERS) optical fiber probe: From localized surface plasmon resonance (LSPR) to waveguide propagation. J. Colloid Interface Sci. 2021, 581, 698–708. [Google Scholar] [CrossRef] [Scilit] [PubMed]
- Li, Q.; Zheng, Y.; Guo, L.; Xiao, Y.; Li, H.; Yang, P.; Xia, L.; Liu, X.; Chen, Z.; Li, L. Microbial degradation of tetracycline antibiotics: Mechanisms and environmental implications. J. Agric. Food Chem. 2024, 72, 13523–13536. [Google Scholar] [CrossRef] [Scilit]
- Zhang, S.; Li, X.; Bai, X.; Zhao, W.; Zhao, S.; Chang, C.; Wang, S.; Duan, E. Facet-engineered Cu2O microparticles on graphitic carbon nitride nanosheets as Z-scheme heterojunction photocatalysts for degradation of tetracycline. ACS Appl. Nano Mater. 2024, 7, 16127–16140. [Google Scholar] [CrossRef] [Scilit]
- Sun, X.; Yang, H.; Xie, J.; Teng, G.; He, J.; Zhao, Z.; Zhang, C. A photocatalyst combined of copper doped ZnO and graphdiyne (Cu/ZnO@GDY) for photocatalytic degradation of tetracycline: Mechanism and application. Water Res. 2025, 278, 123345. [Google Scholar] [CrossRef] [Scilit] [PubMed]
- Liu, C.; Wang, A.; Hu, X.; Wang, W.; Guo, Y. In-situ sulfidation of Cu2O with highly reactive sites to form a Cu2O@Cu7S4 core–shell structure for the efficient degradation of tetracycline hydrochloride. Appl. Surf. Sci. 2025, 714, 164320. [Google Scholar] [CrossRef] [Scilit]
- Wang, C.; Mirzaei, A.; Wang, Y.; Chaker, M.; Zhang, Q.; Ma, D. Construction of Ultrathin BiVO4-Au-Cu2O Nanosheets with Multiple Charge Transfer Paths for Effective Visible-Light-Driven Photocatalytic Degradation of Tetracycline. Small Methods 2024, 9, 2301804. [Google Scholar] [CrossRef] [Scilit] [PubMed]
- Wang, X.; Wang, J.; Zhao, W.; Guo, R.; Cui, S.; Huang, J.; Lu, J.; Liu, H.; Liu, Y. Integrated treatment of tetracycline in complex environments with MIPs-based Fe3O4-Cu2O-Au nanocomposites: Selective SERS detection and targeted photocatalytic degradation. J. Alloys Compd. 2024, 982, 173796. [Google Scholar] [CrossRef] [Scilit]
- Jung, J.-Y.; Hur, J.W.; Kim, K.; Han, H.-S. Evaluation of floc-harvesting technologies in biofloc technology (BFT) system for aquaculture. Bioresour. Technol. 2020, 314, 123719. [Google Scholar] [CrossRef] [Scilit] [PubMed]
- Harikumar, B.; Subhiksha, V.; Okla, M.K.; Abdel-maksoud, M.A.; El-Tayeb, M.A.; Alatar, A.A.; Al-amri, S.S.; Elbadawi, Y.B.; Sivaranjani, P.R.; Khan, S.S. Magnetic Fe3O4 nanospheres supported N/S-SnO2 nanorod for highly effective visible light photocatalytic degradation of tetracycline. J. Alloys Compd. 2024, 986, 174017. [Google Scholar] [CrossRef] [Scilit]
- Zhao, J.; Liu, Y.; Fan, M.; Yuan, L.; Zou, X. From solid-state metal alkoxides to nanostructured oxides: A precursor-directed synthetic route to functional inorganic nanomaterials. Inorg. Chem. Front. 2015, 2, 198–212. [Google Scholar] [CrossRef] [Scilit]
- Huang, J.; Zhou, T.; Zhao, W.; Cui, S.; Guo, R.; Li, D.; Kadasala, N.R.; Han, D.; Jiang, Y.; Liu, Y. Multifunctional magnetic Fe3O4/Cu2O-Ag nanocomposites with high sensitivity for SERS detection and efficient visible light-driven photocatalytic degradation of polycyclic aromatic hydrocarbons (PAHs). J. Colloid Interface Sci. 2022, 628, 315–326. [Google Scholar] [CrossRef] [Scilit] [PubMed]
- Wang, K.; Lv, M.; Si, T.; Tang, X.; Wang, H.; Chen, Y.; Zhou, T. Mechanism analysis of surface structure-regulated Cu2O in photocatalytic antibacterial process. J. Hazard. Mater. 2024, 461, 132479. [Google Scholar] [CrossRef] [Scilit] [PubMed]
- Alharthi, S.S.; Gomathi, T.; Joseph, J.J.; Rakshavi, J.; Florence, J.A.K.; Sudha, P.N.; Rajakumar, G.; Thiruvengadam, M. Biological activities of chitosan-salicylaldehyde Schiff base assisted silver nanoparticles. J. King Saud Univ. Sci. 2022, 34, 102177. [Google Scholar] [CrossRef] [Scilit]
- Deng, X.; Wang, C.; Zhou, E.; Huang, J.; Shao, M.; Wei, X.; Liu, X.; Ding, M.; Xu, X. One-Step Solvothermal Method to Prepare Ag/Cu2O Composite with Enhanced Photocatalytic Properties. Nanoscale Res. Lett. 2016, 11, 29. [Google Scholar] [CrossRef] [Scilit] [PubMed]
- Santra, S.; Tudu, P.; Kuiri, B.; Pramanik, S.; Patra, A.S.; Kuiri, P.K.; Gorai, S.; Raha, S. Synergy of photoluminescence emission and antibacterial activity of Ag-Cu2O nanocomposite. Phys. Scr. 2024, 99, 115964. [Google Scholar] [CrossRef] [Scilit]
- Chen, T.; Zhang, Z.; Zhou, X.; Zhang, Z.; Liu, J.; Gong, Q.; Ma, T.; Dilihumaer, A.; Zhan, Y.; Xie, Z.; et al. Fe3O4@PDA Nanoparticle-Doped Smart Hydrogel Scaffold for Osteochondral Defect Repair by Synergistical Stimulation. Adv. Funct. Mater. 2025, 35, 2501354. [Google Scholar] [CrossRef] [Scilit]
- Guo, Y.; Feng, C.; Qiao, S.; Wang, S.; Chen, T.; Zhang, L.; Zhao, Y.; Wang, J. Magnetic Fe3O4-Encapsulated VAN@MIL-101(Fe) with Mixed-Valence Sites and Mesoporous Structures as Efficient Bifunctional Water Splitting Photocatalysts. Nanoscale 2020, 12, 12705–12718. [Google Scholar] [CrossRef] [Scilit]
- Ma, B.; Zhao, W.; Wu, Y.; Wan, X.; Zhao, H.; Wang, Y.; Lang, J.; Li, J.; Liu, Y. Novel Z-scheme Cu2O@Ag/g-C3N4 heterojunctions: Integrating ultrasensitive SERS detection with superior visible-light photocatalysis for tetracycline elimination. Talanta 2026, 296, 128446. [Google Scholar] [CrossRef] [Scilit] [PubMed]
- Zhao, X.; Pan, Y.; Chen, W.; Yang, W.; Zeng, Q.; Li, L.; Liao, X.; Zhang, Z.; Liu, S.; Lai, Y. Insights into the efficiency improvement for CZTSSe solar cells with over 12% efficiency via Ga incorporation. Adv. Funct. Mater. 2023, 33, 2301377. [Google Scholar] [CrossRef] [Scilit]
- Zhang, Q.; Zhang, H.; Gu, B.; Tang, Q.; Cao, Q.; Fang, W. Sunlight-driven photocatalytic oxidation of 5-hydroxymethylfurfural over a cuprous oxide-anatase heterostructure in aqueous phase. Appl. Catal. B Environ. 2023, 320, 122006. [Google Scholar] [CrossRef] [Scilit]
- Hunge, Y.; Yadav, A.; Kang, S.-W.; Kim, H. Facile synthesis of multitasking composite of Silver nanoparticle with Zinc oxide for 4-nitrophenol reduction, photocatalytic hydrogen production, and 4-chlorophenol degradation. J. Alloys Compd. 2022, 928, 167133. [Google Scholar] [CrossRef] [Scilit]
- Moharana, A.K.; Kumar, P.; Vaish, R.; Boukhris, I.; Alomayrah, N.; Al-Buriahi, M. Synergetic photocatalysis and piezocatalysis of Bi4Ti2Nb0.5Fe0.5O12 for degradation of organic pollutants. Appl. Water Sci. 2025, 15, 295. [Google Scholar] [CrossRef] [Scilit]
- Mirzaei, A.; Chen, Z.; Haghighat, F.; Yerushalmi, L. Magnetic fluorinated mesoporous g-C3N4 for photocatalytic degradation of amoxicillin: Transformation mechanism and toxicity assessment. Appl. Catal. B Environ. 2019, 242, 337–348. [Google Scholar] [CrossRef] [Scilit]
- Jian, L.; Cai, D.; Su, G.; Lin, D.; Lin, M.; Li, J.; Liu, J.; Wan, X.; Tie, S.; Lan, S. The accelerating effect of silver ion on the degradation of methyl orange in Cu2O system. Appl. Catal. A Gen. 2016, 512, 74–84. [Google Scholar] [CrossRef] [Scilit]
- Ni, Q.; Ke, X.; Qian, W.; Yan, Z.; Luan, J.; Liu, W. Insight into tetracycline photocatalytic degradation mechanism in a wide pH range on BiOI/BiOBr: Coupling DFT/QSAR simulations with experiments. Appl. Catal. B Environ. 2024, 340, 123226. [Google Scholar] [CrossRef] [Scilit]
- Qiu, P.; Xiong, J.; Lu, M.; Liu, L.; Li, W.; Wen, Z.; Li, W.; Chen, R.; Cheng, G. Integrated pn/Schottky junctions for efficient photocatalytic hydrogen evolution upon Cu@TiO2-Cu2O ternary hybrids with steering charge transfer. J. Colloid Interface Sci. 2022, 622, 924–937. [Google Scholar] [CrossRef] [Scilit] [PubMed]
- Feng, H.; Wang, W.; Wang, W.; Zhang, M.; Wang, C.; Ma, C.; Li, W.; Chen, S. Charge transfer channels of silver@cuprous oxide heterostructure core-shell nanoparticles strengthen high photocatalytic antibacterial activity. J. Colloid Interface Sci. 2021, 601, 531–543. [Google Scholar] [CrossRef] [Scilit] [PubMed]
- Antos, J.; Piosik, M.; Ginter-Kramarczyk, D.; Zembrzuska, J.; Kruszelnicka, I. Tetracyclines contamination in European aquatic environments: A comprehensive review of occurrence, fate, and removal techniques. Chemosphere 2024, 353, 141519. [Google Scholar] [CrossRef] [Scilit] [PubMed]
- Sharma, S.; Sudhaik, A.; Raizada, P.; Ahamad, T.; Thakur, S.; Van Le, Q.; Selvasembian, R.; Nguyen, V.-H.; Mishra, A.K.; Singh, P. Critical review on the tetracycline degradation using photo-Fenton assisted g-C3N4-based photocatalysts: Modification strategies, reaction parameters, and degradation pathway. J. Environ. Chem. Eng. 2024, 12, 112984. [Google Scholar] [CrossRef] [Scilit]
- Wani, M.Y.; Bashir, N.; Ahmad, S.; Rehman, M.; Shah, S.A.; Beig, S.U.R. Integrating Ni-MOF/g-C3N4/chitosan derived S-scheme photocatalyst for efficient visible light photodegradation of tetracycline and antibacterial activities. Environ. Res. 2025, 267, 120659. [Google Scholar] [CrossRef] [Scilit] [PubMed]
- Wang, X.; Dong, Y.; Luan, Y.; Tian, S.; Li, C.; Li, Y.; Zhou, J. Integrated assessment of the spatial distribution, sources, degradation, and human risk of tetracyclines in honey in China. J. Hazard. Mater. 2024, 473, 134681. [Google Scholar] [CrossRef] [Scilit] [PubMed]
- Tang, J.; Hao, J.; Li, Z.; Bai, J. Towards understanding hybrid influencing mechanisms of substrate microstructure on SERS effect. Appl. Surf. Sci. 2024, 660, 159974. [Google Scholar] [CrossRef] [Scilit]
- Liu, C.; Xu, D.; Dong, X.; Huang, Q. A review: Research progress of SERS-based sensors for agricultural applications. Trends Food Sci. Technol. 2022, 128, 90–101. [Google Scholar] [CrossRef] [Scilit]
Disclaimer/Publisher’s Note: The statements, opinions and data contained in all publications are solely those of the individual author(s) and contributor(s) and not of MDPI and/or the editor(s). MDPI and/or the editor(s) disclaim responsibility for any injury to people or property resulting from any ideas, methods, instructions or products referred to in the content. |
© 2026 by the authors. Licensee MDPI, Basel, Switzerland. This article is an open access article distributed under the terms and conditions of the Creative Commons Attribution (CC BY) license.