


Abstract
An optical vector analysis (OVA) based on serrodyne modulation is proposed and numerically verified by simulations. In the proposed OVA, serrodyne modulation is implemented using a dual-parallel dual-drive Mach–Zehnder modulator to generate asymmetric optical double-sideband (ODSB) signals including a frequency-shifted optical carrier. The generated signals subsequently propagate through the optical device under test (ODUT). Owing to the asymmetric ODSB structure, the proposed OVA is inherently immune to errors induced by the nonlinearity of the electro-optic modulator (EOM). Consequently, the responses of the ODUT can be accurately obtained by processing the frequency-shifted photocurrent, which is converted from the frequency-shifted carrier and the two desired sidebands. Furthermore, the proposed approach overcomes the limitation of conventional optical single-sideband-based OVA in characterizing bandpass responses. Through numerical simulations, the frequency responses of a uniform fiber Bragg grating, a Fabry–Perot cavity, and a bandpass filter are obtained within a bandwidth of 20 GHz. The proposed OVA provides an approach for characterization of optical devices and integrated microwave photonics systems.
1. Introduction
With the rapid advancements in optoelectronic information integration technology, optical devices are extensively employed in the field of quantum information processing, on-chip photonic integrated circuits, optical microcavities and numerous other applications [1,2,3]. Additionally, optical devices such as Fabry–Perot (FP) cavities play a crucial role in mechanical resonators, optical sensors, optical filters and related photonic applications [4,5,6,7,8,9]. Therefore, accurate measurement of key parameters, including magnitude response, phase response, and other critical characteristics, is important for the design of optical devices and optoelectronic systems [10,11]. Over the past few decades, optical vector analysis (OVA) based on the phase-shift modulation method or optical interferometry method has been successfully implemented [12,13]. However, due to the limited wavelength accuracy and poor stability of tunable laser sources (TLS), achieving high accuracy and high resolution is challenging [14].
In recent years, microwave photonics (MWP)-based OVA technology has been proposed and demonstrated. To date, optical single-sideband (OSSB) and ODSB modulation techniques remain the two most widely used approaches for implementing the MWP-based OVAs [15,16,17,18,19,20,21,22,23,24,25,26,27,28,29,30,31,32]. Owing to the point-to-point frequency mapping between the optical and microwave domains, these techniques can theoretically achieve ultra-high resolution at the sub-hertz level. By using ultranarrow linewidth lasers, previous studies have experimentally demonstrated a resolution of 334 Hz. Additionally, benefiting from the electrical ultrafine frequency scanning and accurate magnitude-phase detection, the measurement accuracy has been significantly improved [33]. Nevertheless, a large modulation index should be adopted for the electro-optic modulator (EOM) so as to enhance the signal-to-noise ratio and dynamic range. Unfortunately, owing to the nonlinearity of the EOM, unwanted high-order sidebands introduce considerable errors through their beat notes [15,16]. To alleviate this problem, several OSSB-based OVA techniques employing fixed low-frequency detection [17] and polarization control [18] have been theoretically analyzed and experimentally demonstrated, enabling high measurement accuracy even at large modulation indices. However, due to the limited bandwidth of optoelectronic devices and the increased complexity of the system, achieving a wide measurement range and high accuracy in OSSB-based OVA remains challenging [19]. Besides, accurately characterizing the bandpass responses of the ODUT is difficult in OSSB-based OVA because the optical carrier is significantly suppressed when it falls within the stopband of the ODUT [21,22]. To overcome these limitations, asymmetric ODSB-based OVA techniques utilizing an acousto-optic modulator (AOM) have been experimentally demonstrated [23,24,25]. Nevertheless, the AOMs increase both system complexity and cost while also reducing the stability and measurement accuracy. Alternative approaches based on stimulated Brillouin scattering (SBS) have also been proposed to improve measurement accuracy and dynamic range [29,30]. However, because the Brillouin frequency shift depends on the optical wavelength and the SBS gain becomes relatively weak at high frequencies, the achievable measurement accuracy remains limited.
In this work, the OVA based on serrodyne modulation for the characterization of arbitrary optical responses in an ideal situation is proposed. By employing serrodyne modulation and carrier-suppressed ODSB (CS-ODSB) modulation, asymmetric ODSB signals consisting of a frequency-shifted optical carrier and the desired ±1st-order sidebands are generated and subsequently transmitted through the ODUT. The optical signals are converted into a frequency-shifted photocurrent in the photodetector (PD), from which the responses of the ODUT carried by the asymmetric ODSB signals can be extracted. Thanks to the asymmetric ODSB architecture, the errors originating from EOM nonlinearity at arbitrary modulation indices can be suppressed. This is attributed to the fact that beat signals produced by high-order sidebands differ from those generated by the frequency-shifted carrier and the two useful sidebands. Additionally, the working range is improved compared with the conventional OSSB-based OVA. In the simulation, the responses of a uniform FBG, an FP cavity and a bandpass filter are obtained with a resolution of 1 MHz over a frequency range of 20 GHz, so that the capability of characterizing arbitrary responses can be verified. The spurious frequency-shifted optical sidebands originated by the fall time of the sawtooth wave affect the accuracy, with errors increasing as the fall time increases. The proposed OVA provides an approach for optical devices and advances other innovations of integrated microwave photonics systems [34,35].
2. Theoretical Analysis
2.1. Principle of OVA Based on Serrodyne Modulation
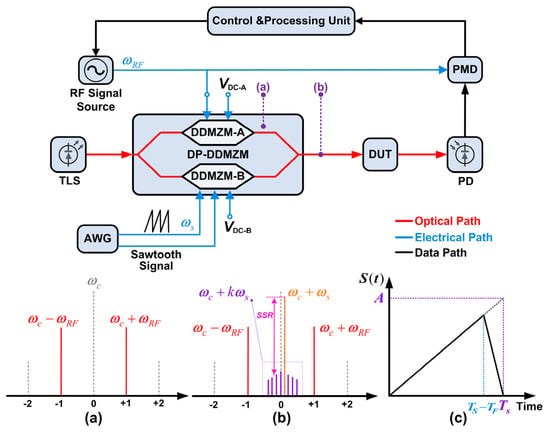
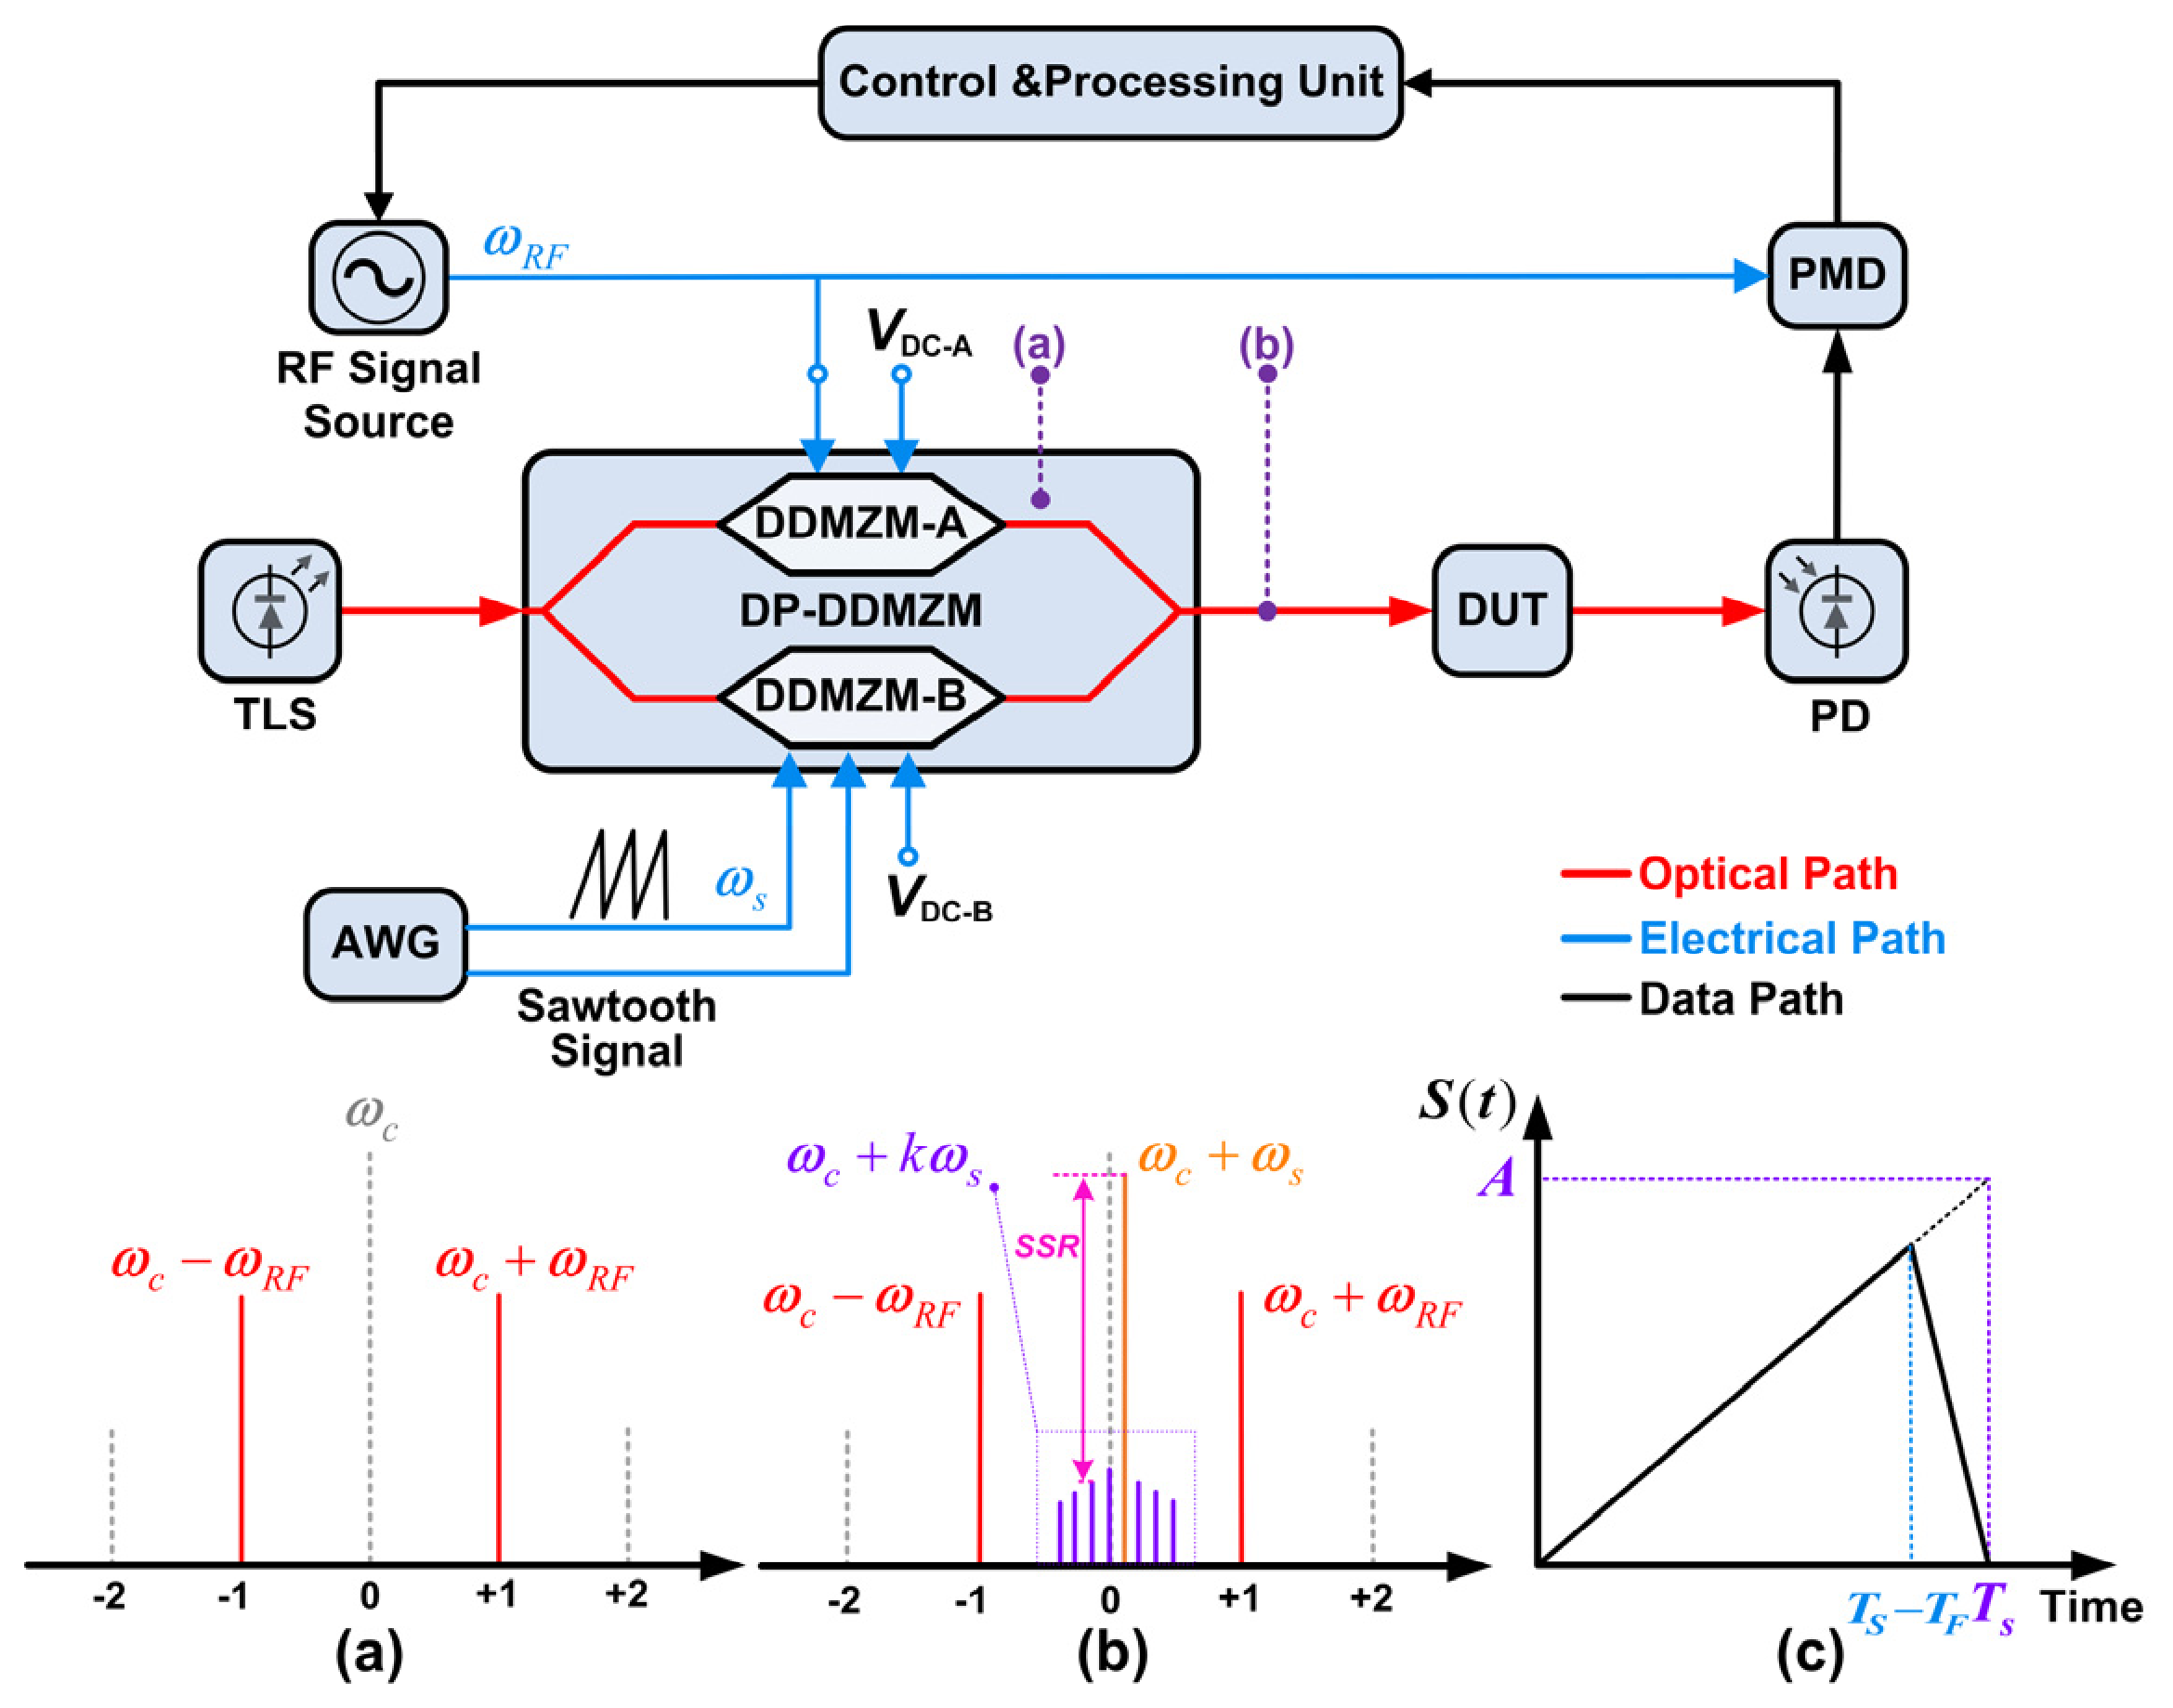
Figure 1 shows a schematic of the proposed OVA employing serrodyne modulation. The optical carrier, expressed as E0exp(jωct), generated by the tunable laser source (TLS), is fed into the DP-DDMZM and split into two branches with equal power. The DP-DDMZM consists of two parallel-connected sub-DDMZMs (DDMZM-A and DDMZM-B), each equipped with two independent RF and DC ports. Here, Vπ denotes the half-wave voltage, and VDC represents the bias voltage of the DP-DDMZM. In the upper branch of the DP-DDMZM, the optical signal is modulated by an RF swept signal. The DC bias voltage of the DDMZM-A is adjusted to the minimum transmission point (MITP), i.e., VDC−A = Vπ, thereby generating a CS-ODSB signal in the upper branch. The output of DDMZM-A, illustrated in Figure 1a, can be expressed as [36,37]:
where tff is the insertion loss of the DDMZM, γ = (ε1/2 − 1)/(ε1/2 + 1), ε is the DDMZM extinction ratio, m = π ⋅ VRF/Vπ is the modulation index, J2n−1(⋅) and J2n(⋅) are the (2n − 1) th-order and the 2n th-order Bessel functions of the first kind, respectively, and ωRF is the angular frequency of the RF signal. In the ideal limit of ε approaches infinity, γ approaches 1, only carrier-suppressed odd-order sidebands are produced.
Figure 1.
Schematic of the proposed OVA. TLS: tunable laser source; DP-DDMZM: dual-parallel dual-drive Mach-Zehnder modulator; RF signal source: radio-frequency signal source; AWG: arbitrary waveform generator; DUT: device under test; PD: photodetector; PMD: phase-magnitude detector. (a,b) Schematics of the optical spectra at different locations; (c) Scheme of the sawtooth wave.
In the lower branch, the DC voltage of the DDMZM-B is set to the maximum transmission point (MATP), i.e., V_DC-B = 0. Under this condition, only the optical carrier is transmitted through DDMZM-B and can be expressed as follows [38]:
Serrodyne modulation enables frequency translation of the optical carrier by applying a sawtooth wave with an amplitude of 2Vπ [39,40,41]. Specifically, Serrodyne modulation imposes a periodic phase change on the optical signal using a sawtooth wave; a linear phase ramp φ(t) = 2πfst is mathematically equivalent to a frequency shift by fs. When the phase increases linearly with time, the optical signal output acquires a constant frequency shift. In contrast, sinusoidal modulation causes the instantaneous frequency to vary continuously, and the output spectrum is expanded into multiple sidebands according to Bessel functions, resulting in poor spectral purity. Therefore, the sawtooth waveform is the most suitable driving signal for Serrodyne modulation. In the proposed scheme, a sawtooth wave with a positive slope and an angular frequency ωs generated by an arbitrary waveform generator (AWG) is applied to DDMZM-B. The sawtooth wave is characterized by its amplitude A, period Ts = 2π/ωs and fall time TF. For convenience, TF = αTs is designated, where 0 ≤ α ≤ 1 and α can be set by the AWG. Therefore, the sawtooth wave is illustrated in Figure 1c and is delineated as follows:
When DDMZM-B is driven by two identical sawtooth waves into the RF ports, it is equivalent to a phase modulator [40,41]. As a result, at the output of the DP-DDMZM, the frequency-shifted optical carrier and a pair of CS-ODSB signals are generated and can be fully expressed as:
where exp[j ⋅ π ⋅ S(t)/Vπ] can be written as , and |ak| is given by:
Under ideal circumstances, the fall time TF is 0; thus, perfect frequency translation can be achieved. The optical carrier at angular frequency ωc is shifted to angular frequency ωc + ωs without generating spurious sidebands. That is, a1 = 1 and ak = 0 where k ≠ 1. Therefore, Equation (4) can be rewritten as:
After passing through the ODUT, the optical signal that carries the responses of the device is written as
where H(ω)=HODUT(ω) ⋅ Hsys(ω), HODUT(ω) and Hsys(ω) are the complex frequency responses of the ODUT and the measurement system without the DUT, respectively.
After the PD, the photocurrent at the angular frequencies ωs + ωRF and |ωRF − ωs| is extracted by setting the phase-magnitude detector (PMD). Owing to the asymmetric ODSB structure, the angular frequencies of the photocurrents i(ωs + ωRF) and i(|ωRF − ωs|) are different. In addition, i(ωs − ωRF) and i(ωRF − ωs) represent the photocurrents generated under different operating conditions, and can be expressed as follows:
where η is the responsivity of the PD.
To eliminate the responses of the system, a calibration procedure is performed. Under this condition, the detected photocurrent without the ODUT is given by:
According to Equations (8) and (9), the responses of the ODUT on both sides of the optical carrier can be obtained by removing the system responses as follows:
where HODUT(ωc + ωs) is the frequency response of the ODUT at the frequency-shifted carrier, which is a measurable complex constant, is the conjugate complex constant of HODUT(ωc + ωs).
2.2. Principle of Errors Caused by the Spurious Sidebands
In practice, generating an ideal sawtooth wave is challenging because it inevitably possesses a finite fall time. Numerical simulations indicate that the amplitudes of the spurious frequency-shifted sidebands increase as the fall time increases [36,37,38,39,40,41,42]. Consequently, a small fraction of the power of the optical carrier is converted to spurious frequency-shifted optical sidebands with angular frequencies of ωc + k ⋅ ωs, where −∞ < k < +∞ and k ≠ 1. When these spurious optical sidebands are considered, Equation (4) is rewritten as
where the corresponding complex constants A2n−1(m), B2n(m) and Ck are expressed as
After passing through the ODUT, both the magnitude and phase of the optical signal expressed in Equation (11) are changed according to the transfer function of the device, yielding
After square-law detection in the PD, the desired photocurrents at angular frequencies ωs + ωRF and |ωRF − ωs| are extracted and expressed as
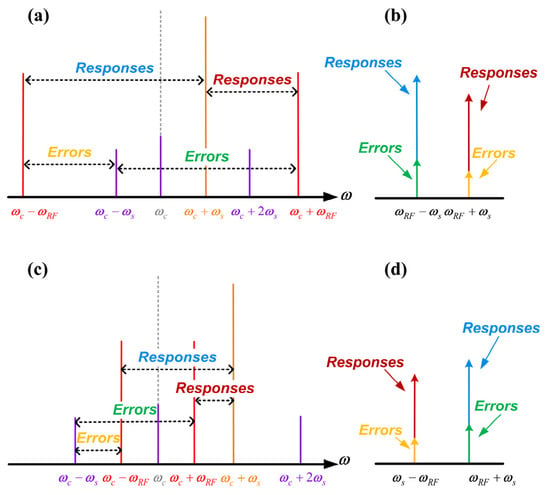
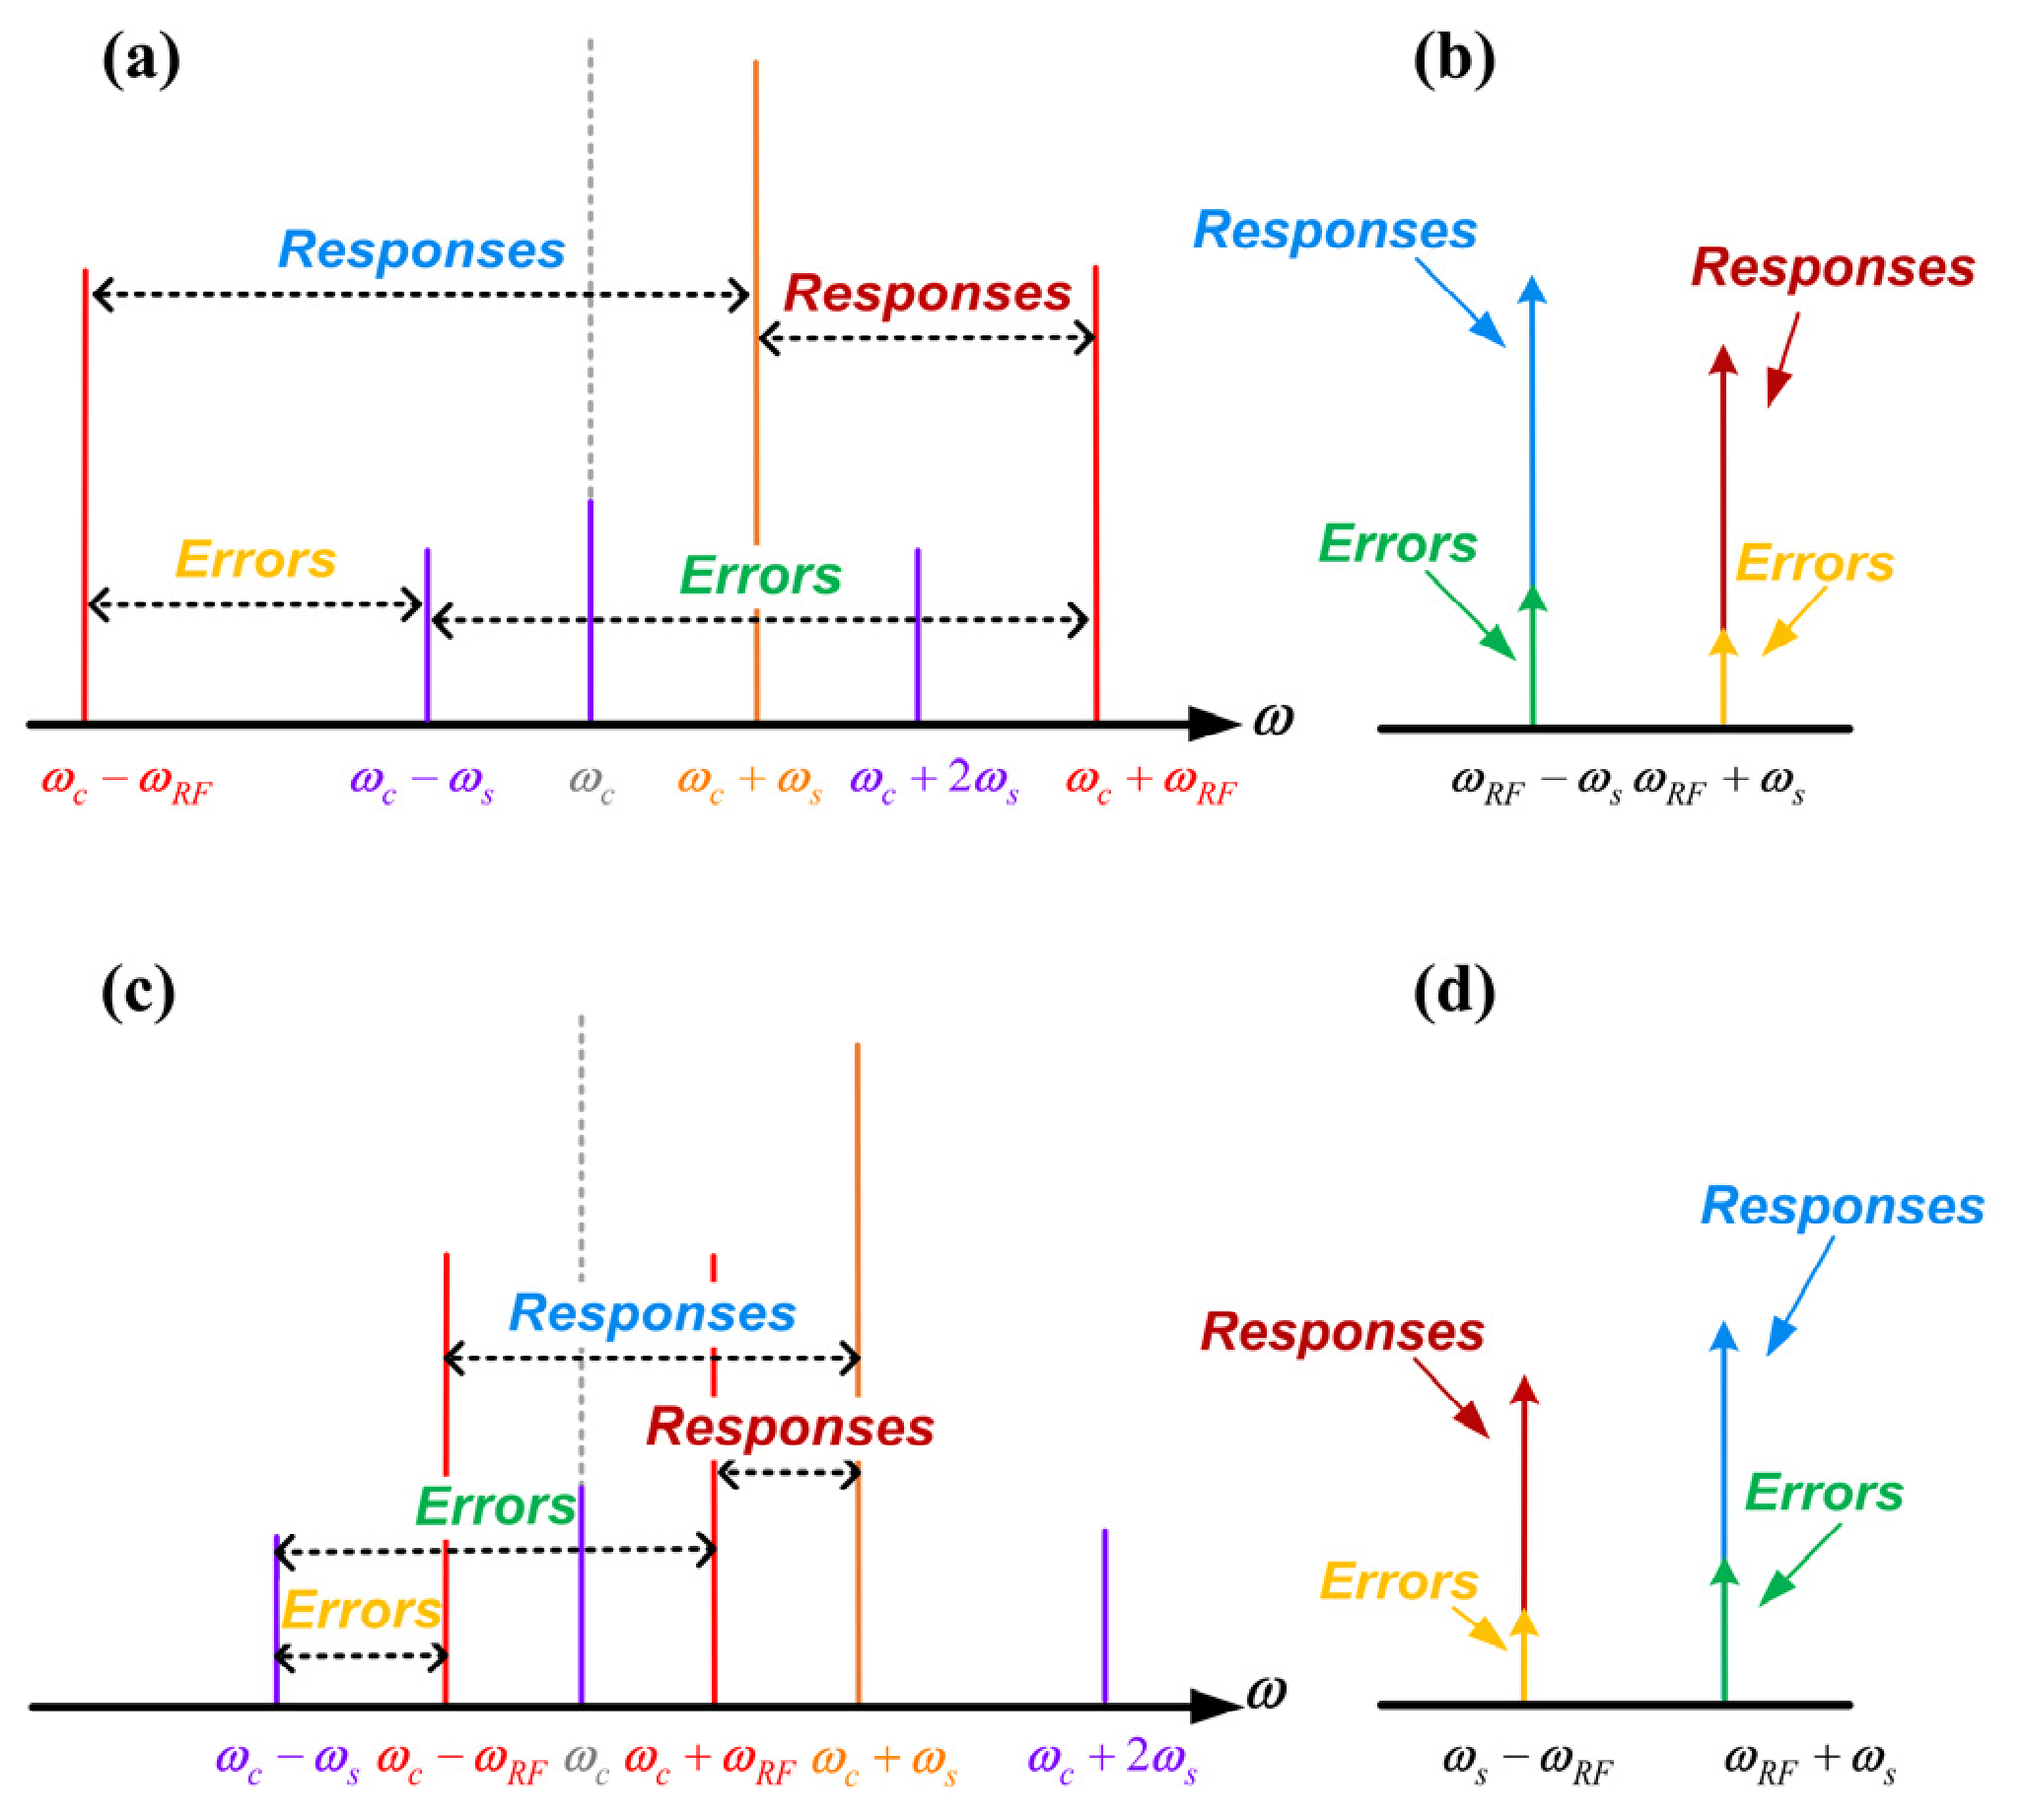
As observed, on the right-hand side of Equation (14), the first term is the photocurrent carrying the frequency response, whereas the second term is the error introduced by the spurious frequency-shifted −1st-order sideband. A schematic diagram of the error introduced by the spurious frequency-shifted −1st¬-order sideband is shown in Figure 2.
Figure 2.
Scheme of the error introduced by the spurious frequency-shifted −1st¬-order sideband in the proposed OVA. (a) Generated optical spectra and (b) desired photocurrent in the PD when the frequency of the RF signal is greater than that of the sawtooth wave; (c) generated optical spectra and (d) desired photocurrent in the PD when the frequency of the RF signal is less than that of the sawtooth wave.
To remove the responses of the system, a calibration step is implemented. When the sawtooth fall time is less than 1% of the sawtooth period, the spurious sidebands are more than 30 dB lower than the desired frequency-shifted signal at an angular frequency of ωc + ωs [38,39,40,43]. The spurious suppression ratio (SSR) is therefore defined as the ratio between the amplitude of the frequency-shifted signal at ωc + ωs and the amplitude of the spurious frequency-shifted sideband signal at ωc − ωs, as illustrated in Figure 1b. Because the SSR is larger than 30 dB, |C1|≫|C−1| can be achieved. Therefore, in the calibration step, the error induced by the spurious frequency-shifted −1st-order sideband can be ignored, and the photocurrent at ωs + ωRF and |ωRF − ωs| can be expressed as follows [23]:
Therefore, the frequency responses of the ODUT can be given as follows:
where is the frequency response of the ODUT at the frequency-shifted carrier, which is a measurable complex constant; is the conjugate complex constant of HODUT(ωc + ωs). Δ1, Δ2 and Δ3 are the errors introduced by the spurious frequency-shifted −1st-order sideband, which are given by:
As indicated by Equation (17), the errors comprise the spurious frequency-shifted −1st sideband and the transmission functions of the ODUT and the system.
3. Numerical Simulation Results
3.1. Optical Vector Analysis for Arbitrary Responses
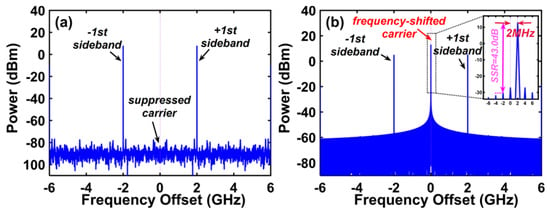
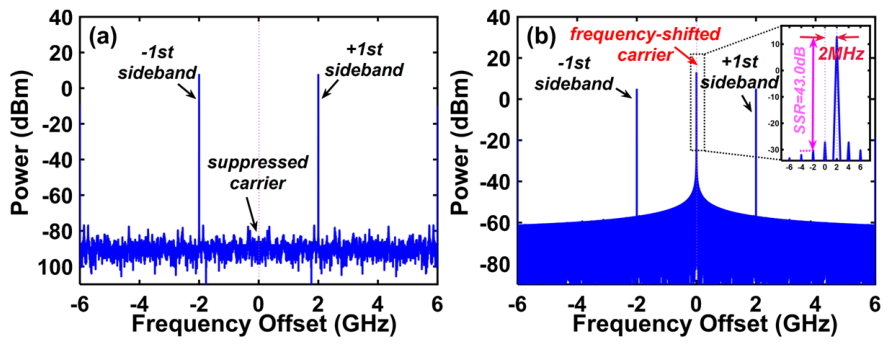
To validate the practicability of the presented scheme, theoretical simulations are carried out according to the system architecture illustrated in Figure 1. All results were obtained through numerical simulations conducted in an environment designed to closely emulate practical experimental conditions. An optical signal generated by a TLS with a frequency of 193.5 THz and an initial phase of 0 degrees was launched into the DP-DDMZM and equally divided into two branches. The Fujitsu FTM7960EX was employed as the simulated DP-DDMZM, featuring a half-wave voltage of 3.5 V and a 3-dB operating bandwidth of 25 GHz. The modulation index m was set to 0.6 by adjusting the amplitude of the RF signal applied to DDMZM-A, while the DC bias voltage of DDMZM-A was fixed at the MITP to generate the CS-DSB signal. The optical spectra of the CS-DSB signal at the output of DDMZM-A under an RF signal with a modulation frequency of 2 GHz are shown in Figure 3a. A sawtooth wave signal is connected to the RF port of DDMZM-B, and the DC bias voltage of DDMZM-B is set to operate at the MATP. Thus, only an optical carrier is generated at the output of the DDMZM-B. The Uni-Trend UTG9604T was selected as the simulated AWG, which has a 600 MHz analog bandwidth, providing a maximum ramp waveform operating bandwidth of 30 MHz, a frequency resolution of 1 μHz, and an adjustable symmetry ranging from 0.00% to 100.00%.
Figure 3.
(a) Optical spectra of the CS-DSB signal at the output of DDMZM-A when an RF signal with a modulation frequency of 2 GHz is applied. (b) Optical spectra of the double-sideband signal with a frequency-shifted carrier at the output of the DP-DDMZM when a sawtooth wave with a frequency of 2 MHz and an RF signal with a modulation frequency of 2 GHz are applied.
In the proposed method, a sawtooth wave with a frequency of 2 MHz and a fall time of 0.01% was used for the simulation. The amplitude of the sawtooth wave was set to approximately 7.0 V, which is twice the half-wave voltage of the DP-DDMZM, and was then connected to the RF port of DDMZM-B. The optical spectra of the double-sideband signal with a frequency-shifted carrier at the output of the DP-DDMZM under a sawtooth wave frequency of 2 MHz and an RF signal with a modulation frequency of 2 GHz are shown in Figure 3b. As observed, the SSR is approximately 43.0 dB, which results in a limited influence on the accuracy according to Equation (17). The optical signals were subsequently converted into electrical photocurrents using a simulated Finisar XPDV2120R photodetector with a responsivity of 0.65 A/W and an operating bandwidth of 50 GHz. The PMD was implemented using a commercial electrical vector analyzer (EVA), specifically the R&S ZVA67, which provided simultaneous amplitude and phase measurements over a bandwidth of 67 GHz. The swept RF signal of the EVA was arranged to sweep across 0–10 GHz, and 10,001 frequency points were adopted. The CS-ODSB modulation enables simultaneous sweeping using the positive and negative 1st-order sidebands, thereby doubling the working range compared with that of conventional single-sideband modulation. As a result, a bandwidth of 20 GHz with a frequency resolution of 1 MHz was achieved.
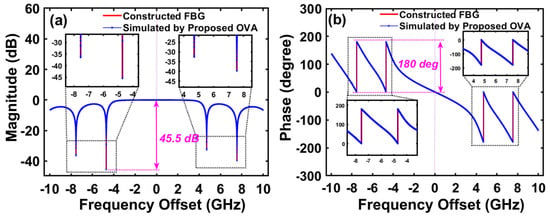
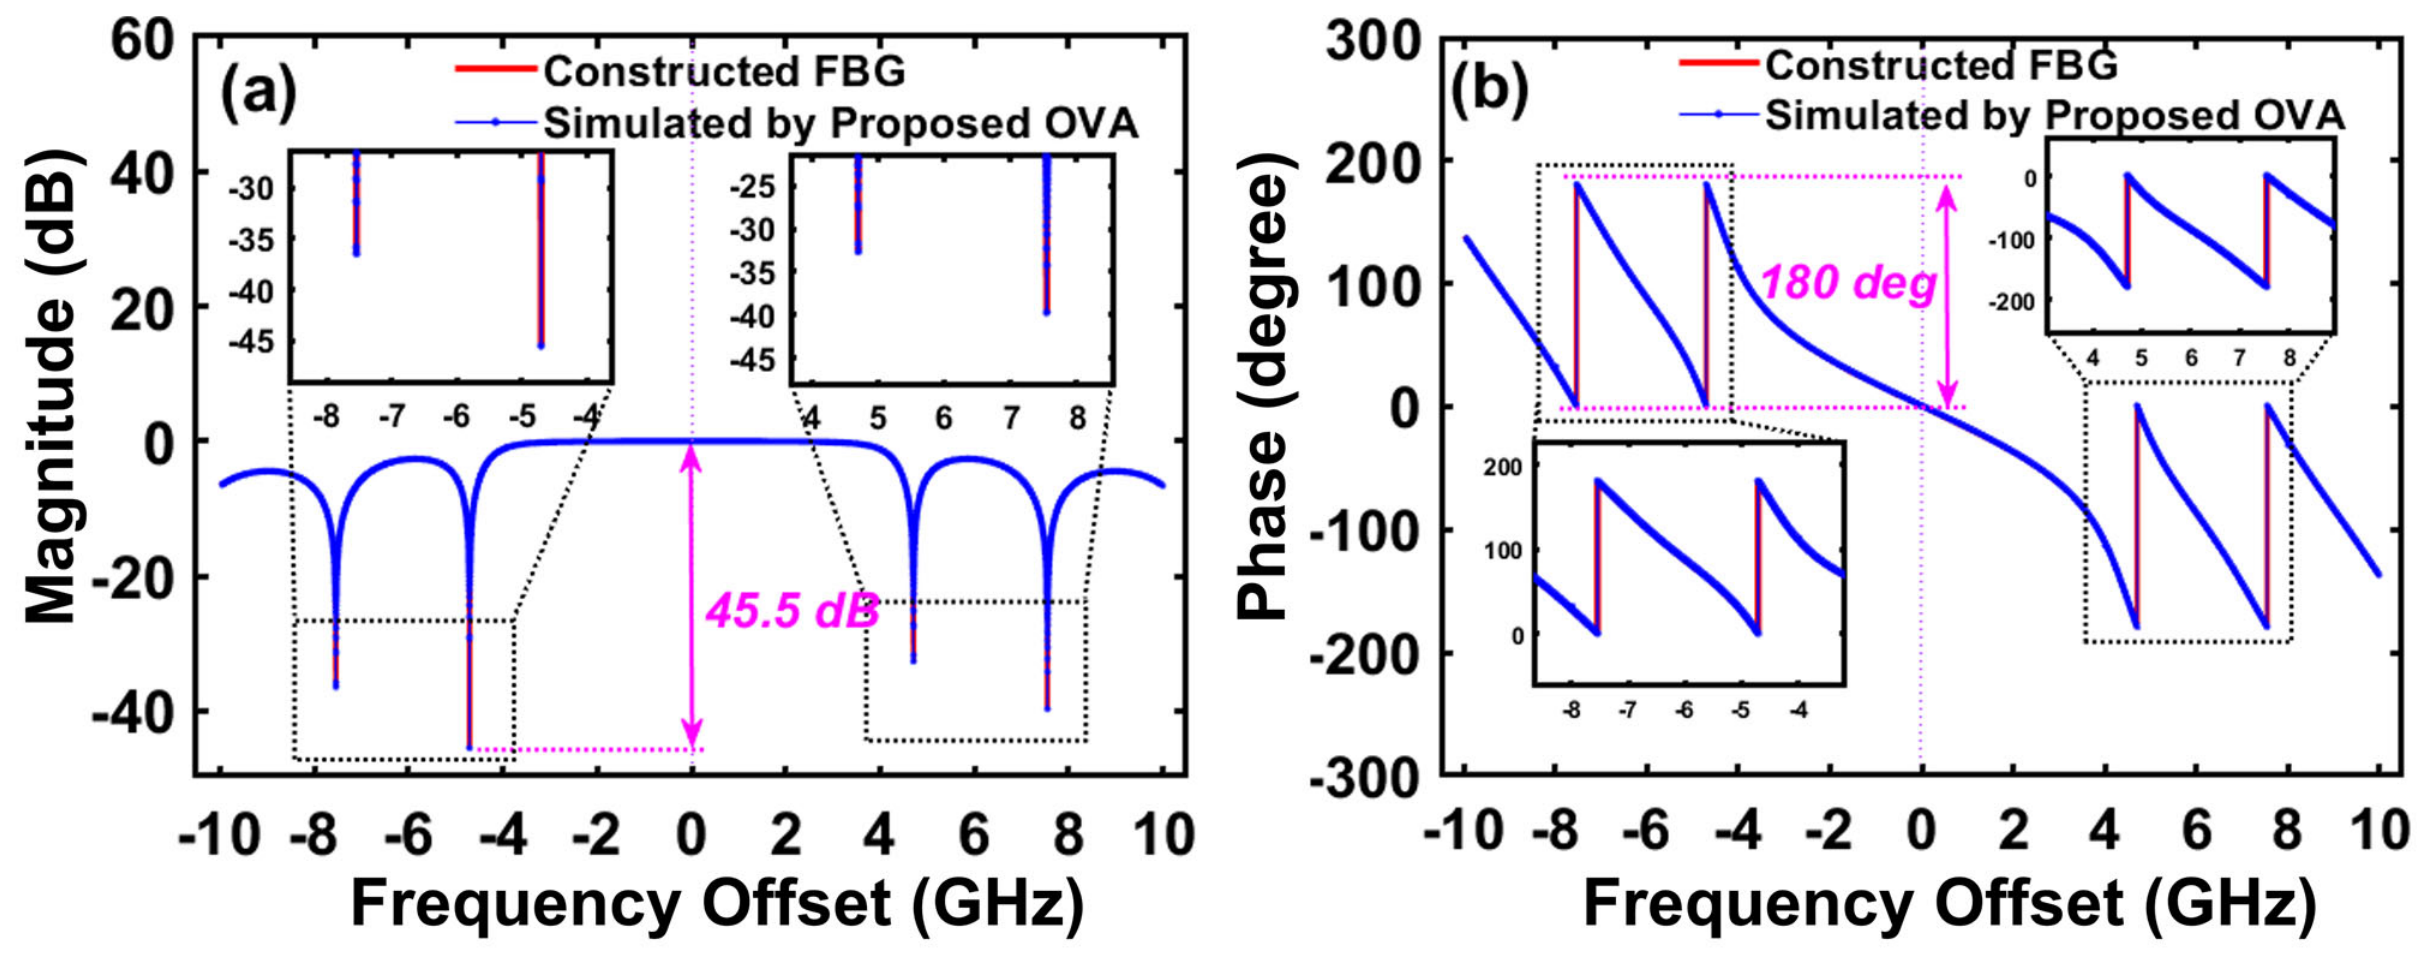
An ideal uniform FBG with a center wavelength of 1550 nm, an operating bandwidth of 20 GHz and a maximum depth of 45.5 dB relative to the center frequency was simulated and utilized as the ODUT. The simulated responses of the FBG are shown in Figure 4. The responses of the constructed FBG are also shown in Figure 4a–b for comparison. As derived from Equation (8), the angular frequencies of the photocurrents are different from those generated by the ±1st-order and higher-order sidebands, such that the errors induced by the frequency aliasing can be effectively avoided. As illustrated in Figure 4, the simulated responses are consistent with those of the simulated FBG, indicating that the proposed OVA can accurately characterize asymmetric optical devices.
Figure 4.
Simulated (a) magnitude response and (b) phase response of the FBG based on the proposed OVA.
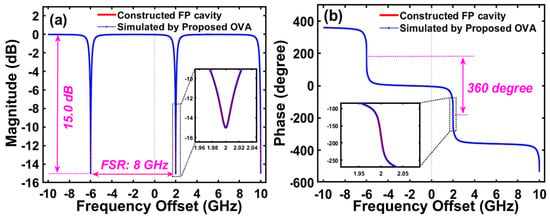
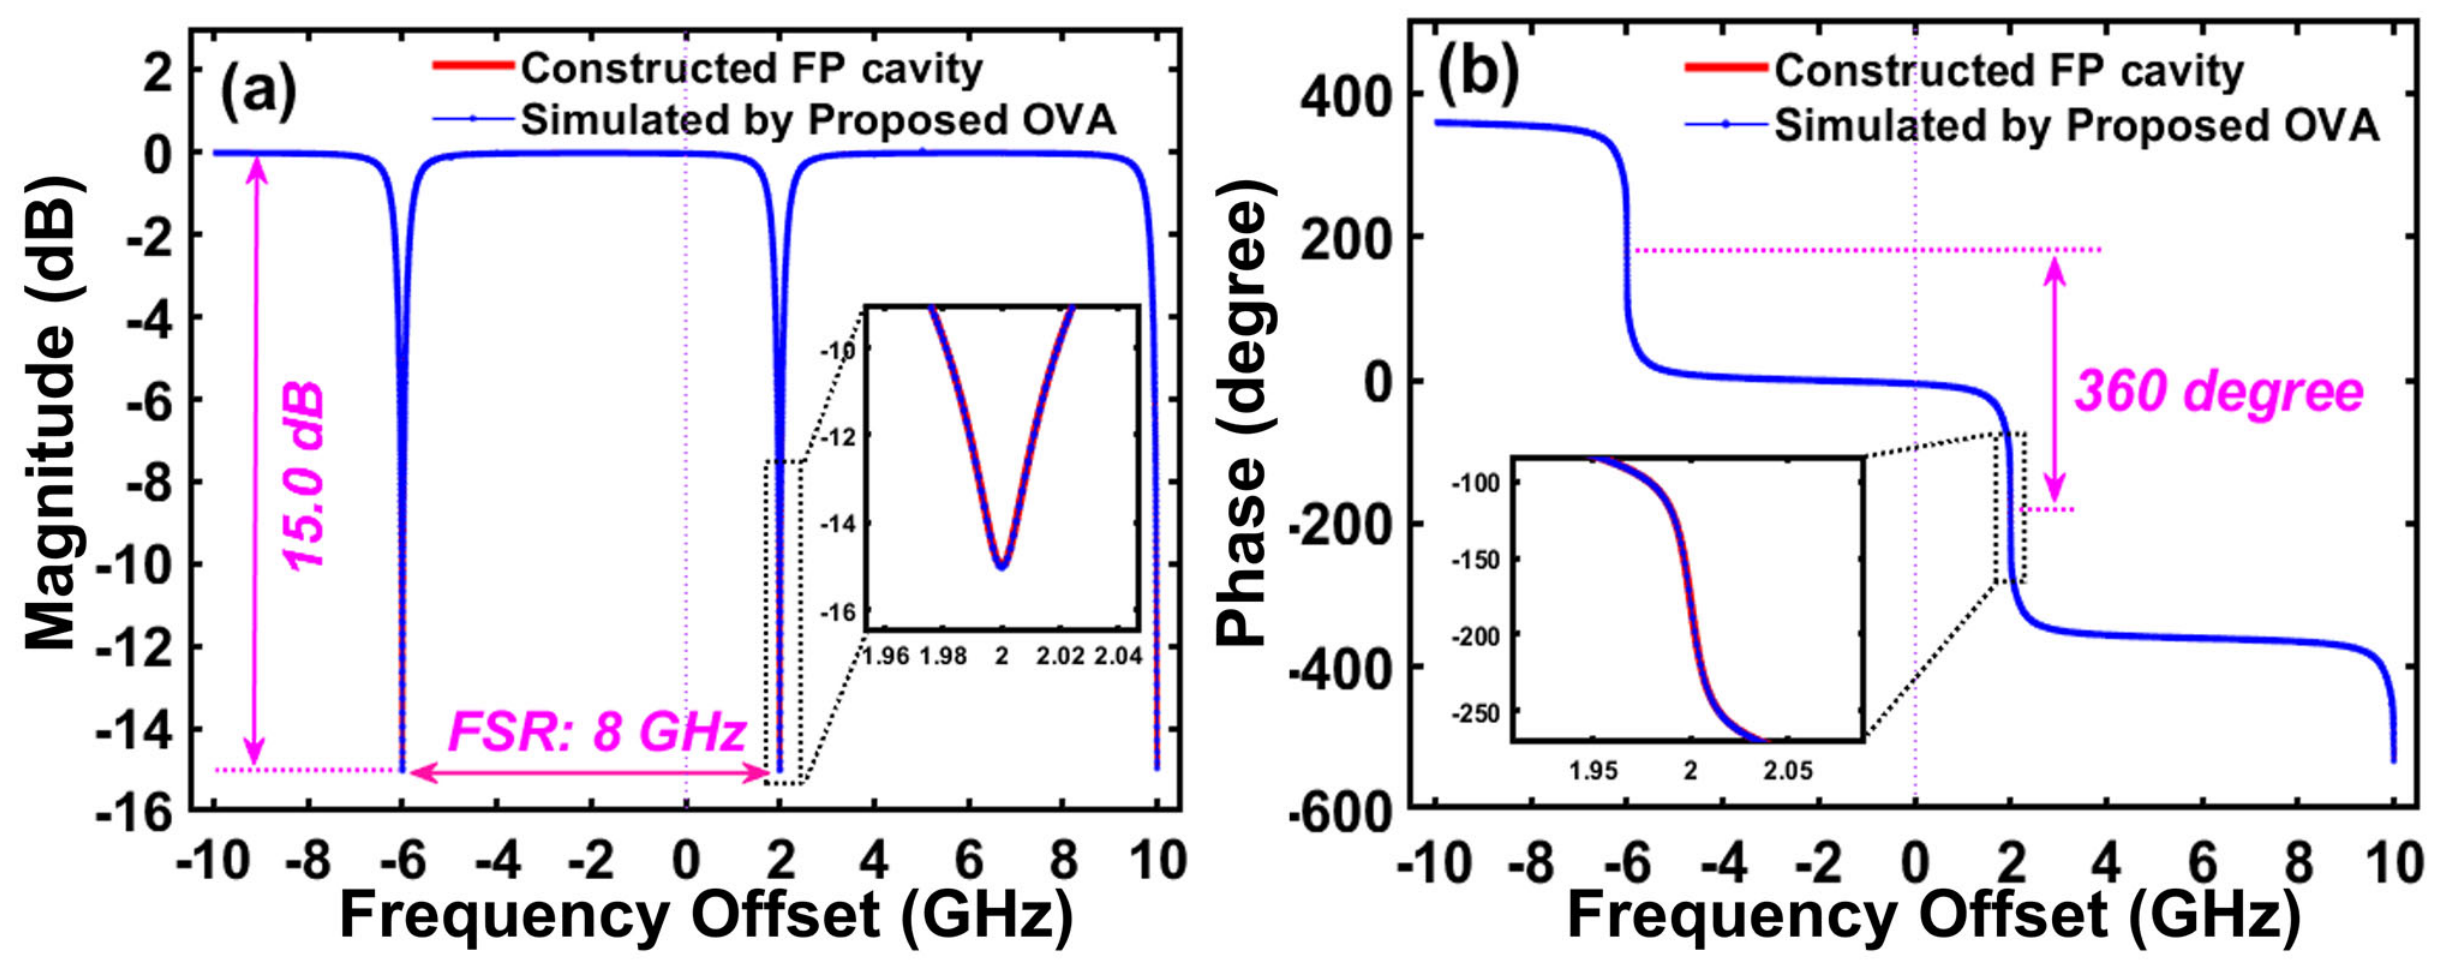
Given the critical role of ODUTs with band-stop responses in practical applications, validating the feasibility of the proposed scheme for accurately obtaining the band-stop responses is also important [22,26]. Here, an ideal FP cavity with a notch depth of 15.0 dB, a free spectral range (FSR) of 8 GHz, and a phase shift of 360 is simulated and used as the ODUT with a band-stop response. The simulated magnitude and phase responses of the FP cavity are presented in Figure 5. The inset of Figure 5 illustrates that the simulated frequency responses match well with those of the constructed FP cavity, showing good agreement with the theoretical predictions and analysis.
Figure 5.
Simulated (a) magnitude response and (b) phase response of the FP cavity based on the proposed OVA.
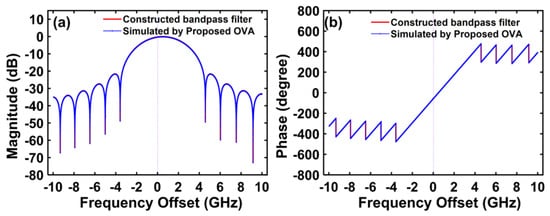
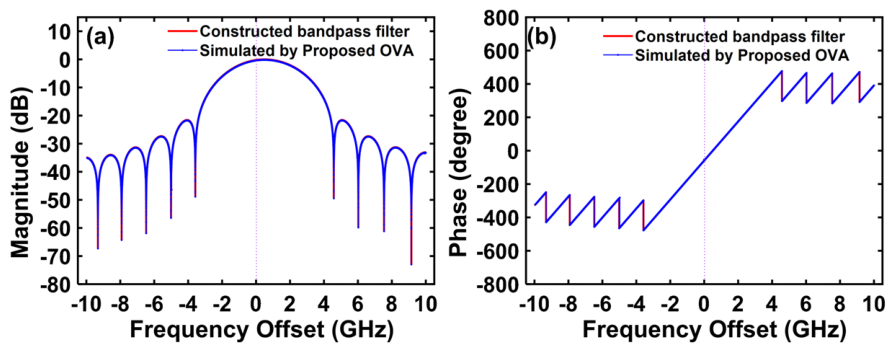
Another advantage of the proposed OVA is its ability to characterize ODUTs with bandpass responses. In the proposed method, the frequency-shifted optical carrier is not suppressed because it does not need to be located at the notch responses. Therefore, the photocurrent carrying the responses of the ODUT can be generated and obtained, representing an improvement over conventional OSSB-based OVAs. In the simulation, a 26th-order bandpass filter designed using a Hann window, with an operating bandwidth of 20 GHz and a maximum depth of 72.8 dB relative to the center frequency, was simulated and used as the ODUT. The simulated responses of the bandpass filter are shown in Figure 6. The simulated results agree well with the responses obtained from the established model, indicating that arbitrary responses can be obtained using the proposed scheme in an ideal situation. Notably, in practical implementations, the power of the modulation sideband signal is limited. Therefore, when the ODUT exhibits band-stop responses with large suppression, the sideband signal is significantly suppressed, preventing sufficient photocurrent generation for reliable measurement. Consequently, the proposed method can accurately characterize arbitrary responses provided that the frequency-shifted carrier maintains adequate power and there is a stable complex reference signal.
Figure 6.
Simulated (a) magnitude response and (b) phase response of the simulated bandpass filter based on the proposed OVA.
3.2. The Effect of the Modulation Index on Accuracy
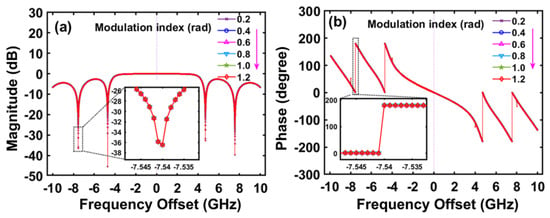
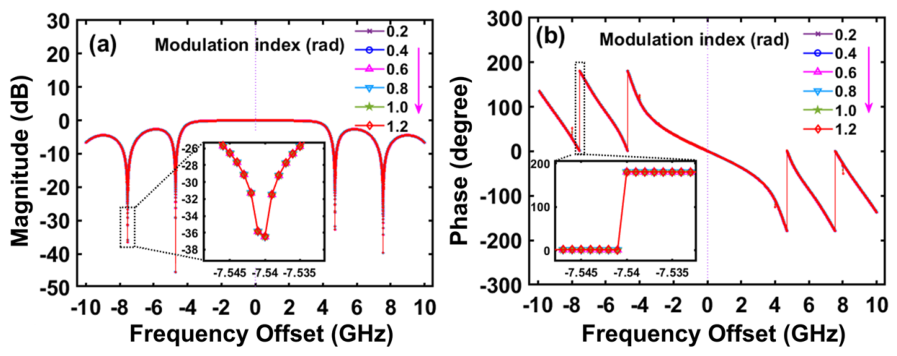
In the proposed OVA, by extracting the photocurrent at ωs + ωRF and |ωRF − ωs|, the system was immune to errors induced by higher-order sidebands. This is due to the fact that the frequency of the beat notes between the higher-order sidebands is different from those of the frequency-shifted carrier and the desired ±1st-order sidebands. To validate this advantage, the responses of the FBG were simulated using the proposed OVA at different modulation indices. As illustrated in Figure 7, the modulation index varied from 0.2 to 1.2. It is evident that the simulated magnitude and phase responses of the FBG are highly consistent across the different modulation indices.
Figure 7.
Simulated (a) magnitude response and (b) phase response of the FBG based on the proposed OVA with various modulation indices.
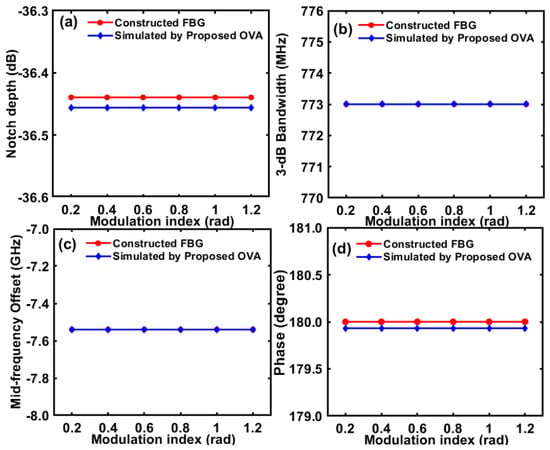
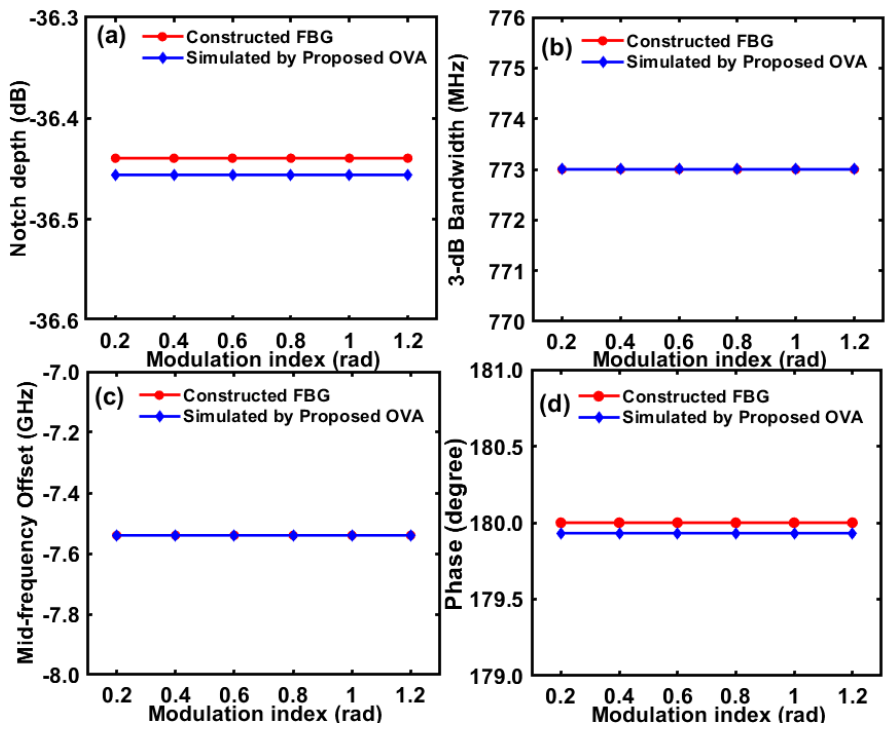
To better reveal the influence of the modulation index on the accuracy of the frequency responses of the FBG, the corresponding notch depth, 3-dB bandwidth, mid-frequency offset, and phase shift were extracted and are shown in Figure 8. All data were obtained at −7.54 GHz from the center frequency. As evident, when the system operates at different modulation indices, the simulated parameters are in good agreement with those of the constructed FBG, demonstrating good consistency across different modulation indices.
Figure 8.
Simulated (a) notch depth, (b) 3-dB bandwidth, (c) mid-frequency offset, and (d) phase shift of the FBG with various modulation indices. The parameters of the constructed FBG are also presented for comparison.
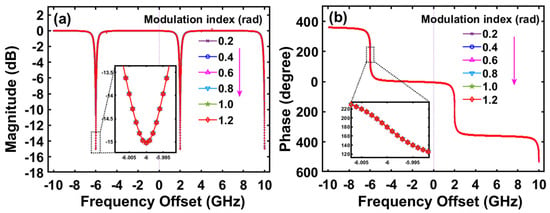
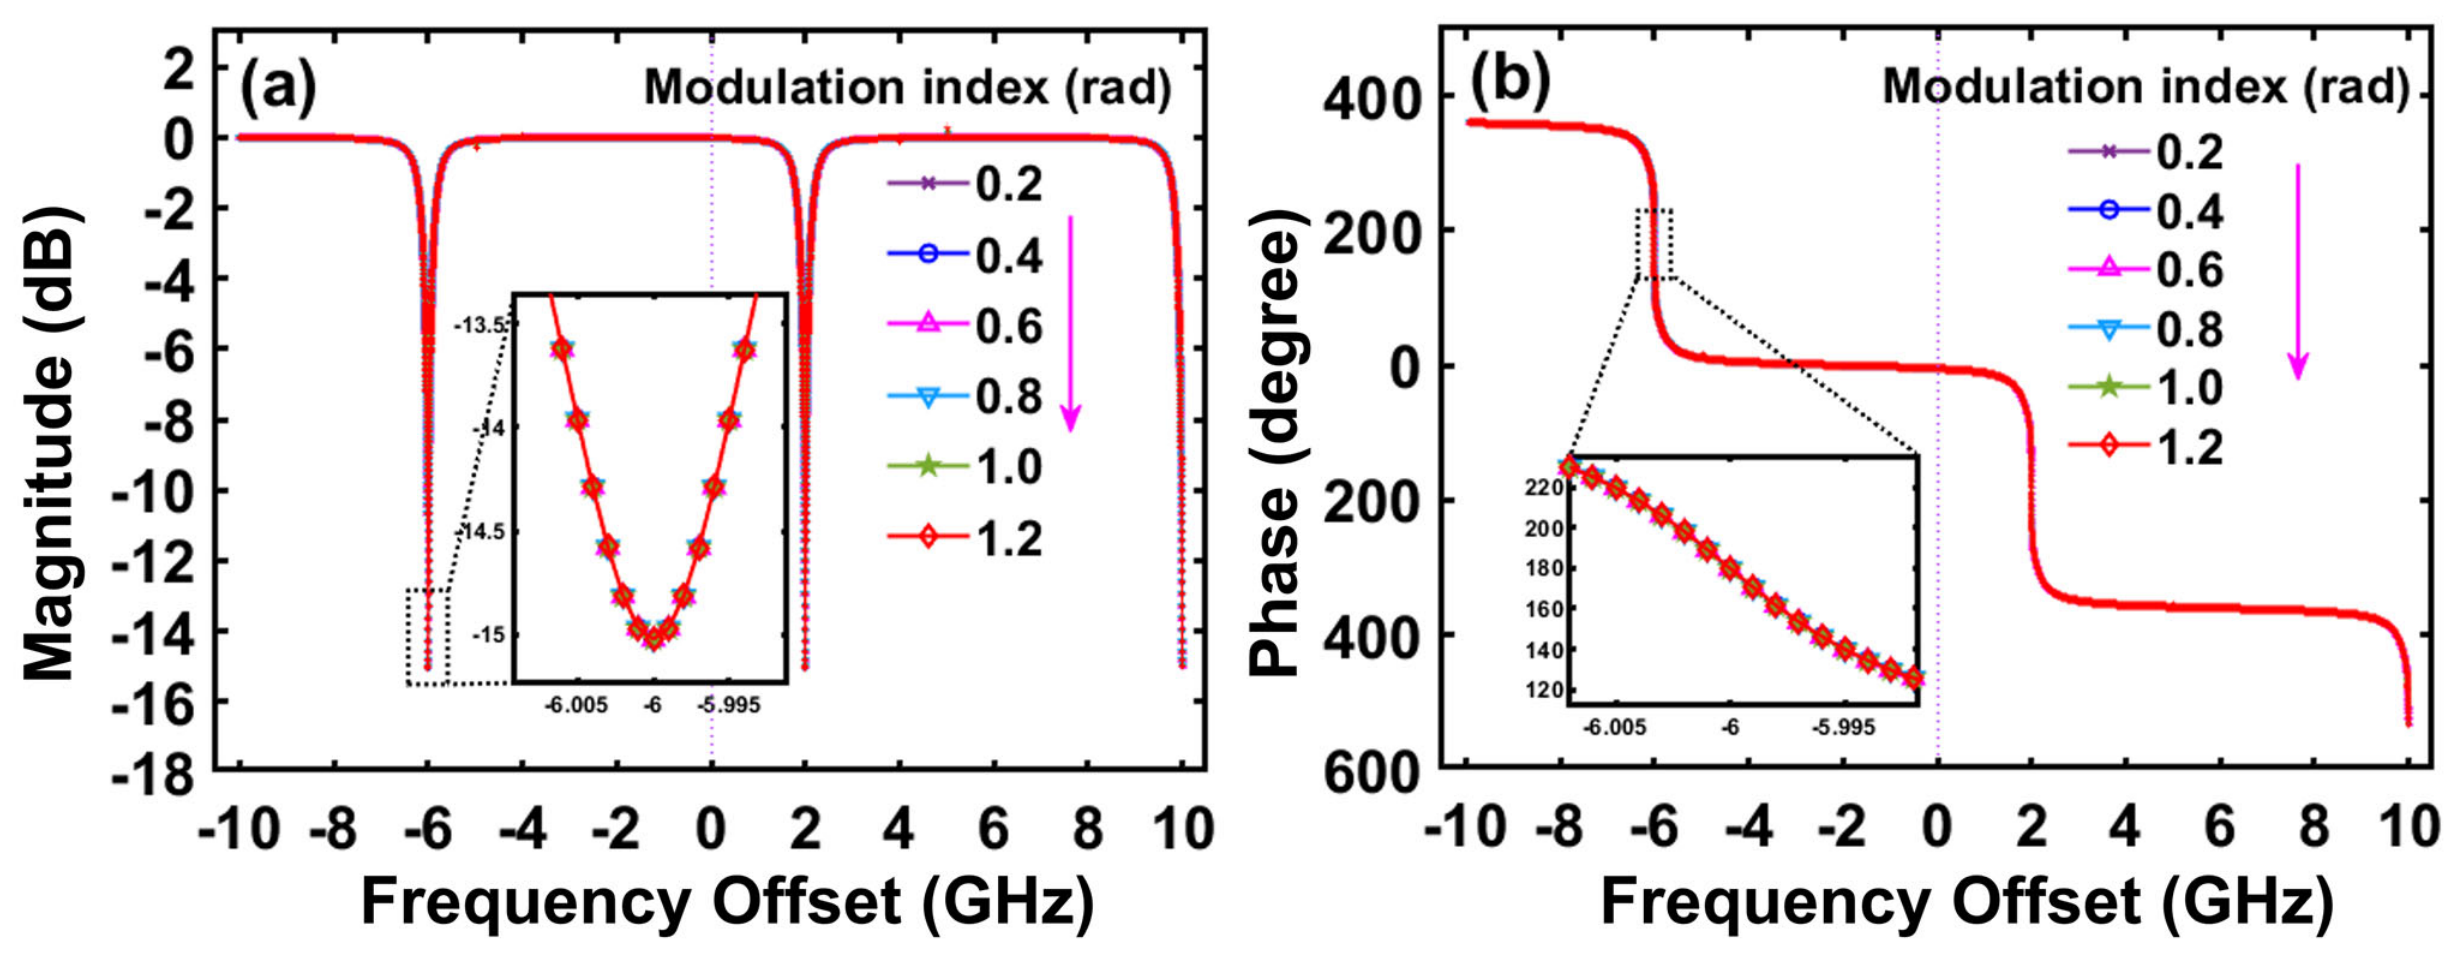
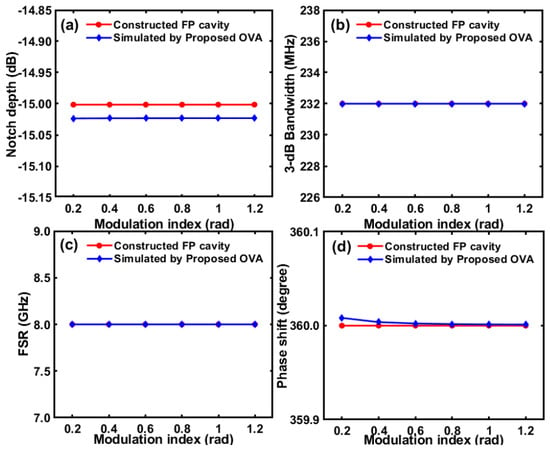
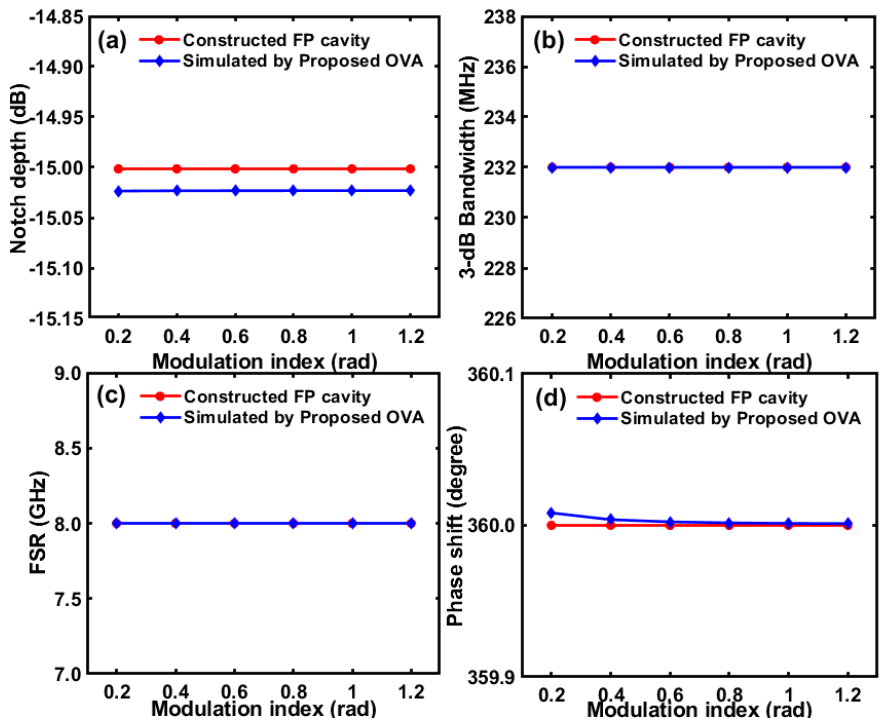
To validate that the proposed method can also achieve high accuracy of the ODUT with band-stop responses under various modulation indices, another simulation is also implemented in Figure 9. As evident, the simulated frequency responses also show a high consistency with the increase of the modulation index. The corresponding notch depth, the free spectrum range (FSR), the 3-dB bandwidth, and the phase shift of the FP cavity extracted from Figure 9 are also shown in Figure 10, respectively. It is clear that the four simulated parameters match well with those of the constructed FP cavity. It should be noted that the slight difference in the phase shift shown in Figure 10d is due to numerical errors in the simulation. Based on the above analysis and simulated results, it can be concluded that the proposed OVA is capable of achieving high accuracy under arbitrary modulation indices.
Figure 9.
Simulated (a) magnitude response and (b) phase response of the FP cavity based on the proposed OVA with various modulation indices.
Figure 10.
Simulated (a) notch depth, (b) 3-dB bandwidth, (c) FSR, and (d) phase shift of the FP cavity with various modulation indices. The parameters of the constructed FP cavity are also presented for comparison.
3.3. The Effect of the Fall Time Ratio on Accuracy
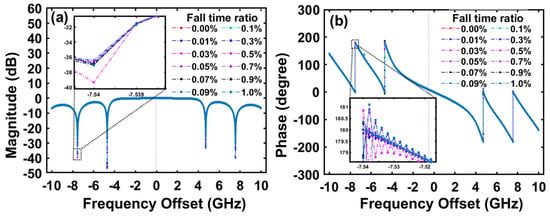
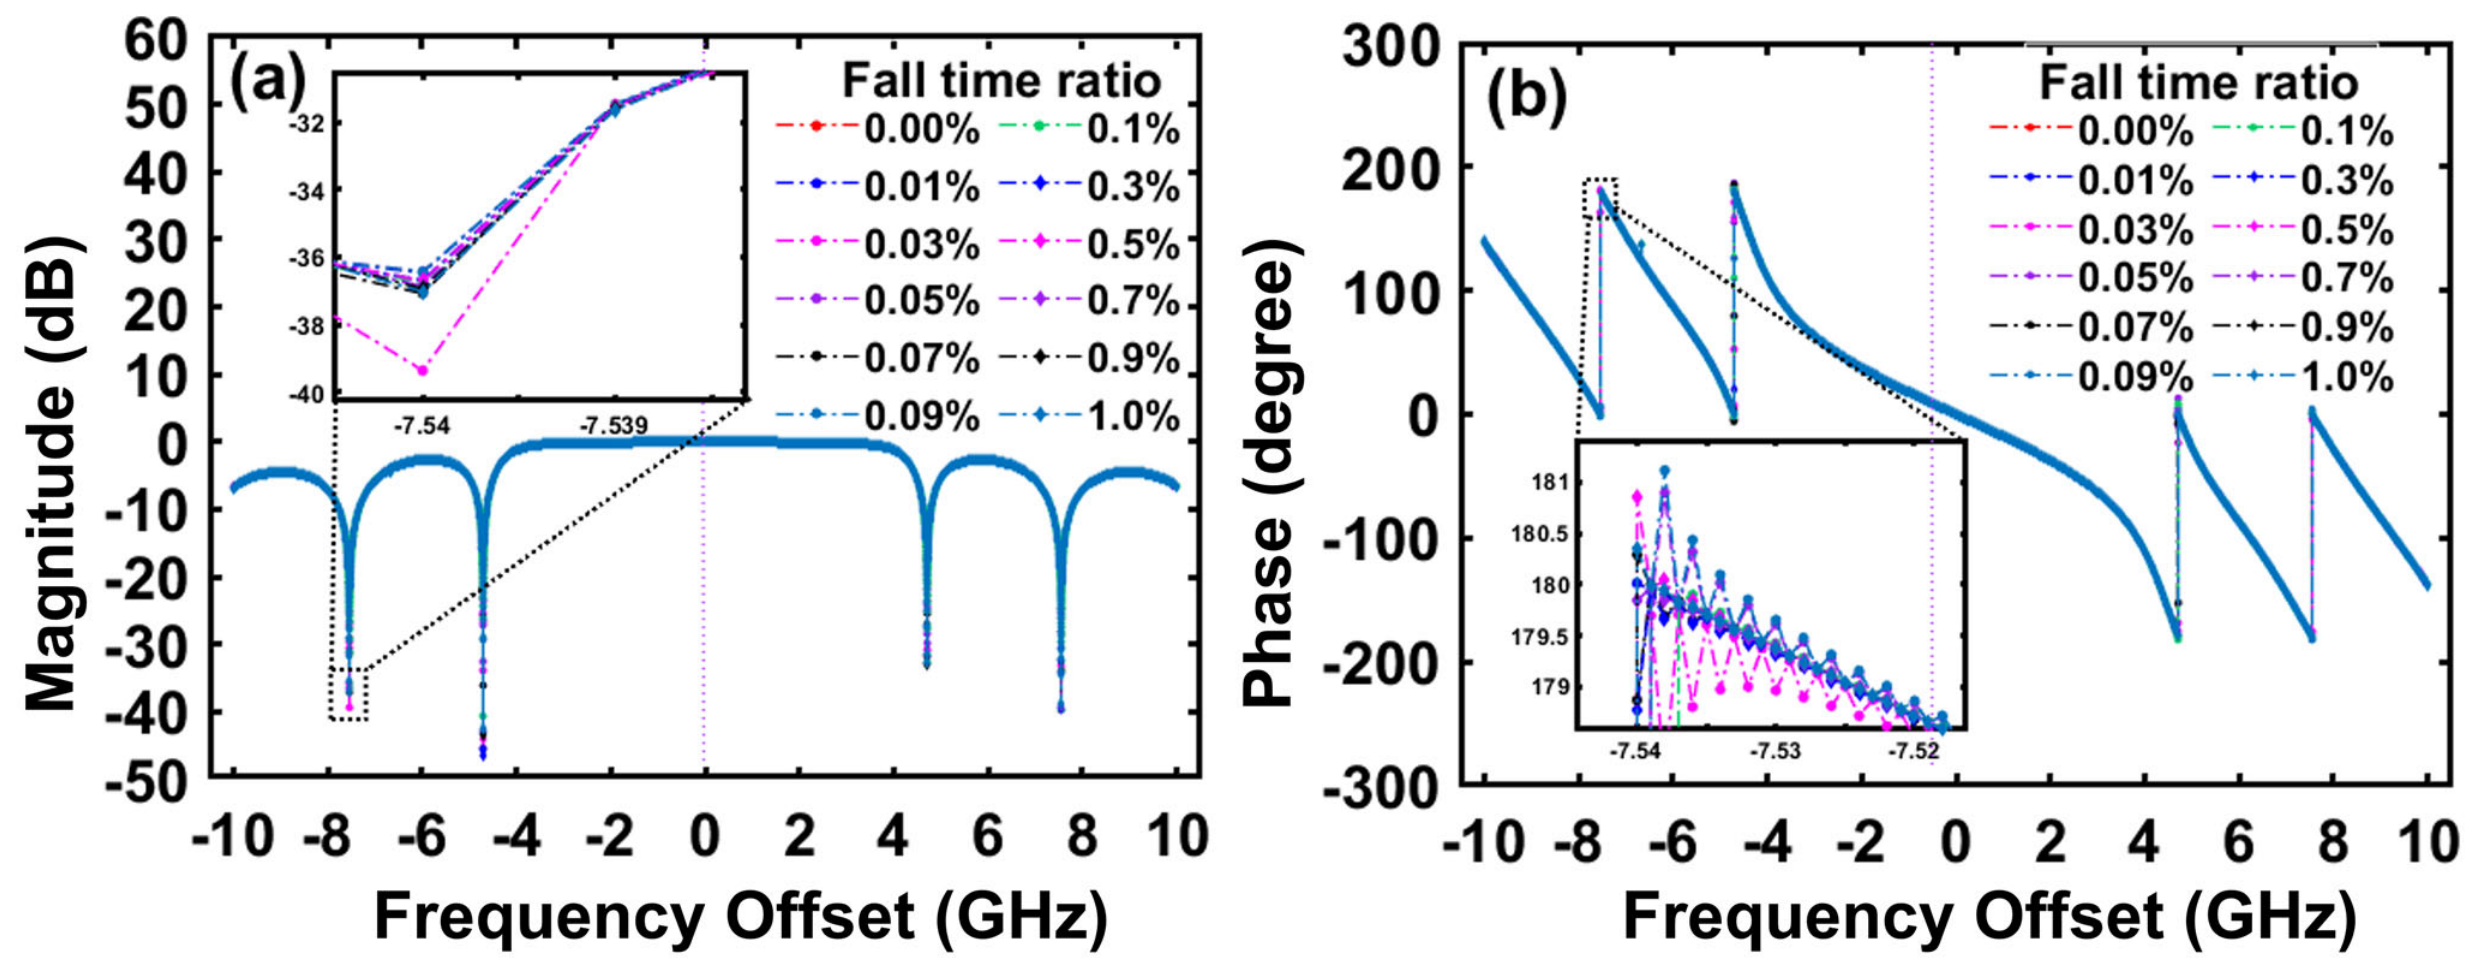
In practice, due to nonideal performance, the sawtooth wave generated by the AWG has a finite fall time. Thus, spurious frequency-shifted optical sidebands were generated. According to Figure 2 and Equation (17), the errors of the proposed OVA mainly originate from the spurious frequency-shifted −1st-order sideband. To comprehensively investigate the influence of the fall time on the accuracy of the frequency responses, numerical simulations were implemented. Figure 11 shows the responses of the FBG at various fall times, and the fall time ratio varies from 0.00% to 1.0%. The simulation results show that the simulated frequency responses gradually deviate from those of the constructed ones as the fall time increases, particularly at the notch peak.
Figure 11.
Simulated (a) magnitude response and (b) phase response of the FBG based on the proposed OVA with various fall time ratios.
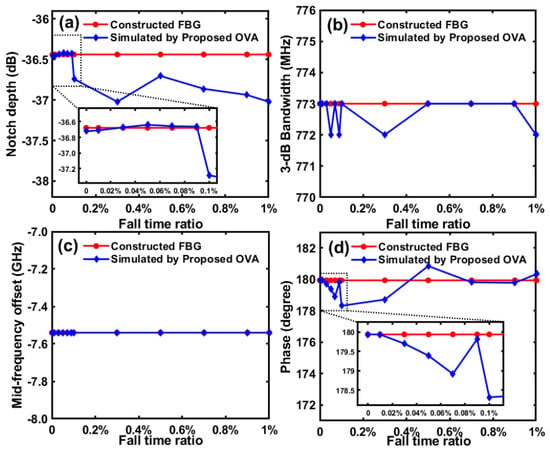
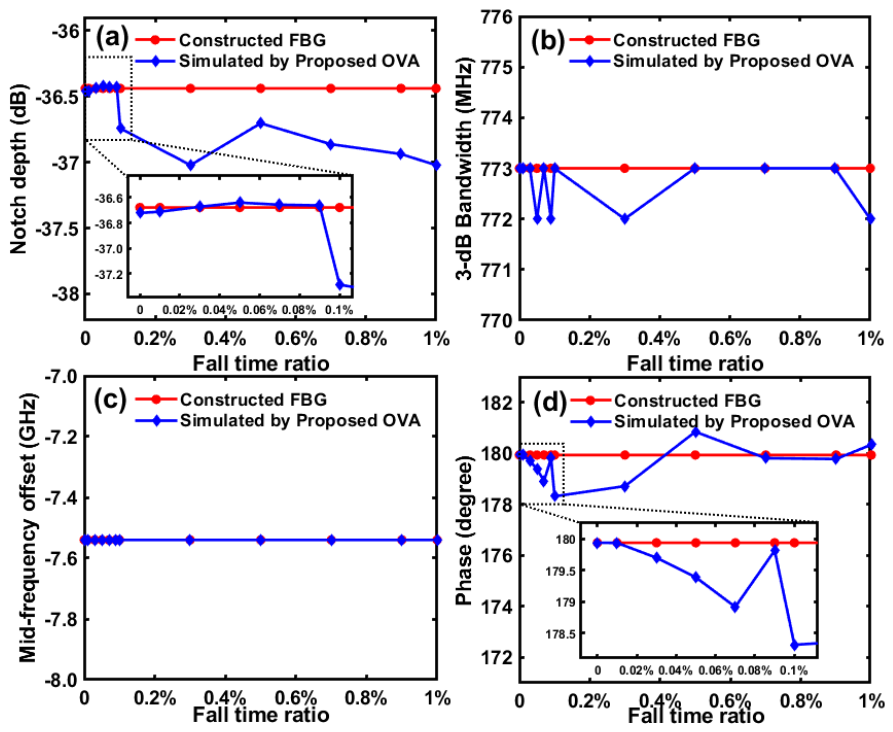
To better demonstrate the effect induced by the fall time, the corresponding notch depth, 3-dB bandwidth, mid-frequency offset, and phase shift, all extracted at −7.54 GHz from the center frequency, are displayed in Figure 12. As numerically verified in Figure 12a,d, with increasing fall time, the simulated results of notch depth and phase shift deviate from those of the constructed FBG. When the fall time ratio exceeds 0.1%, the simulated errors gradually increase, with larger fall times exerting a more significant influence on the accuracy of the magnitude response. In contrast, the simulated results of the 3-dB bandwidth and mid-frequency offset exhibit excellent agreement with those of the constructed FBG, and remain highly consistent across different fall times. The slight discrepancy observed in the 3-dB bandwidth can be attributed primarily to the limited resolution of the proposed method.
Figure 12.
Simulated (a) notch depth, (b) 3-dB bandwidth, (c) mid-frequency offset, and (d) phase shift of the FBG at various fall time ratios. The parameters of the constructed FBG are also presented for comparison.
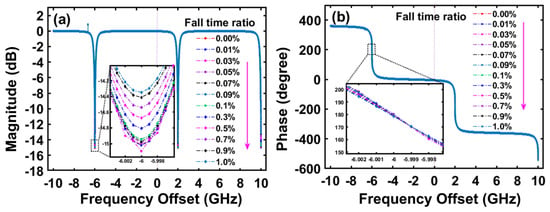
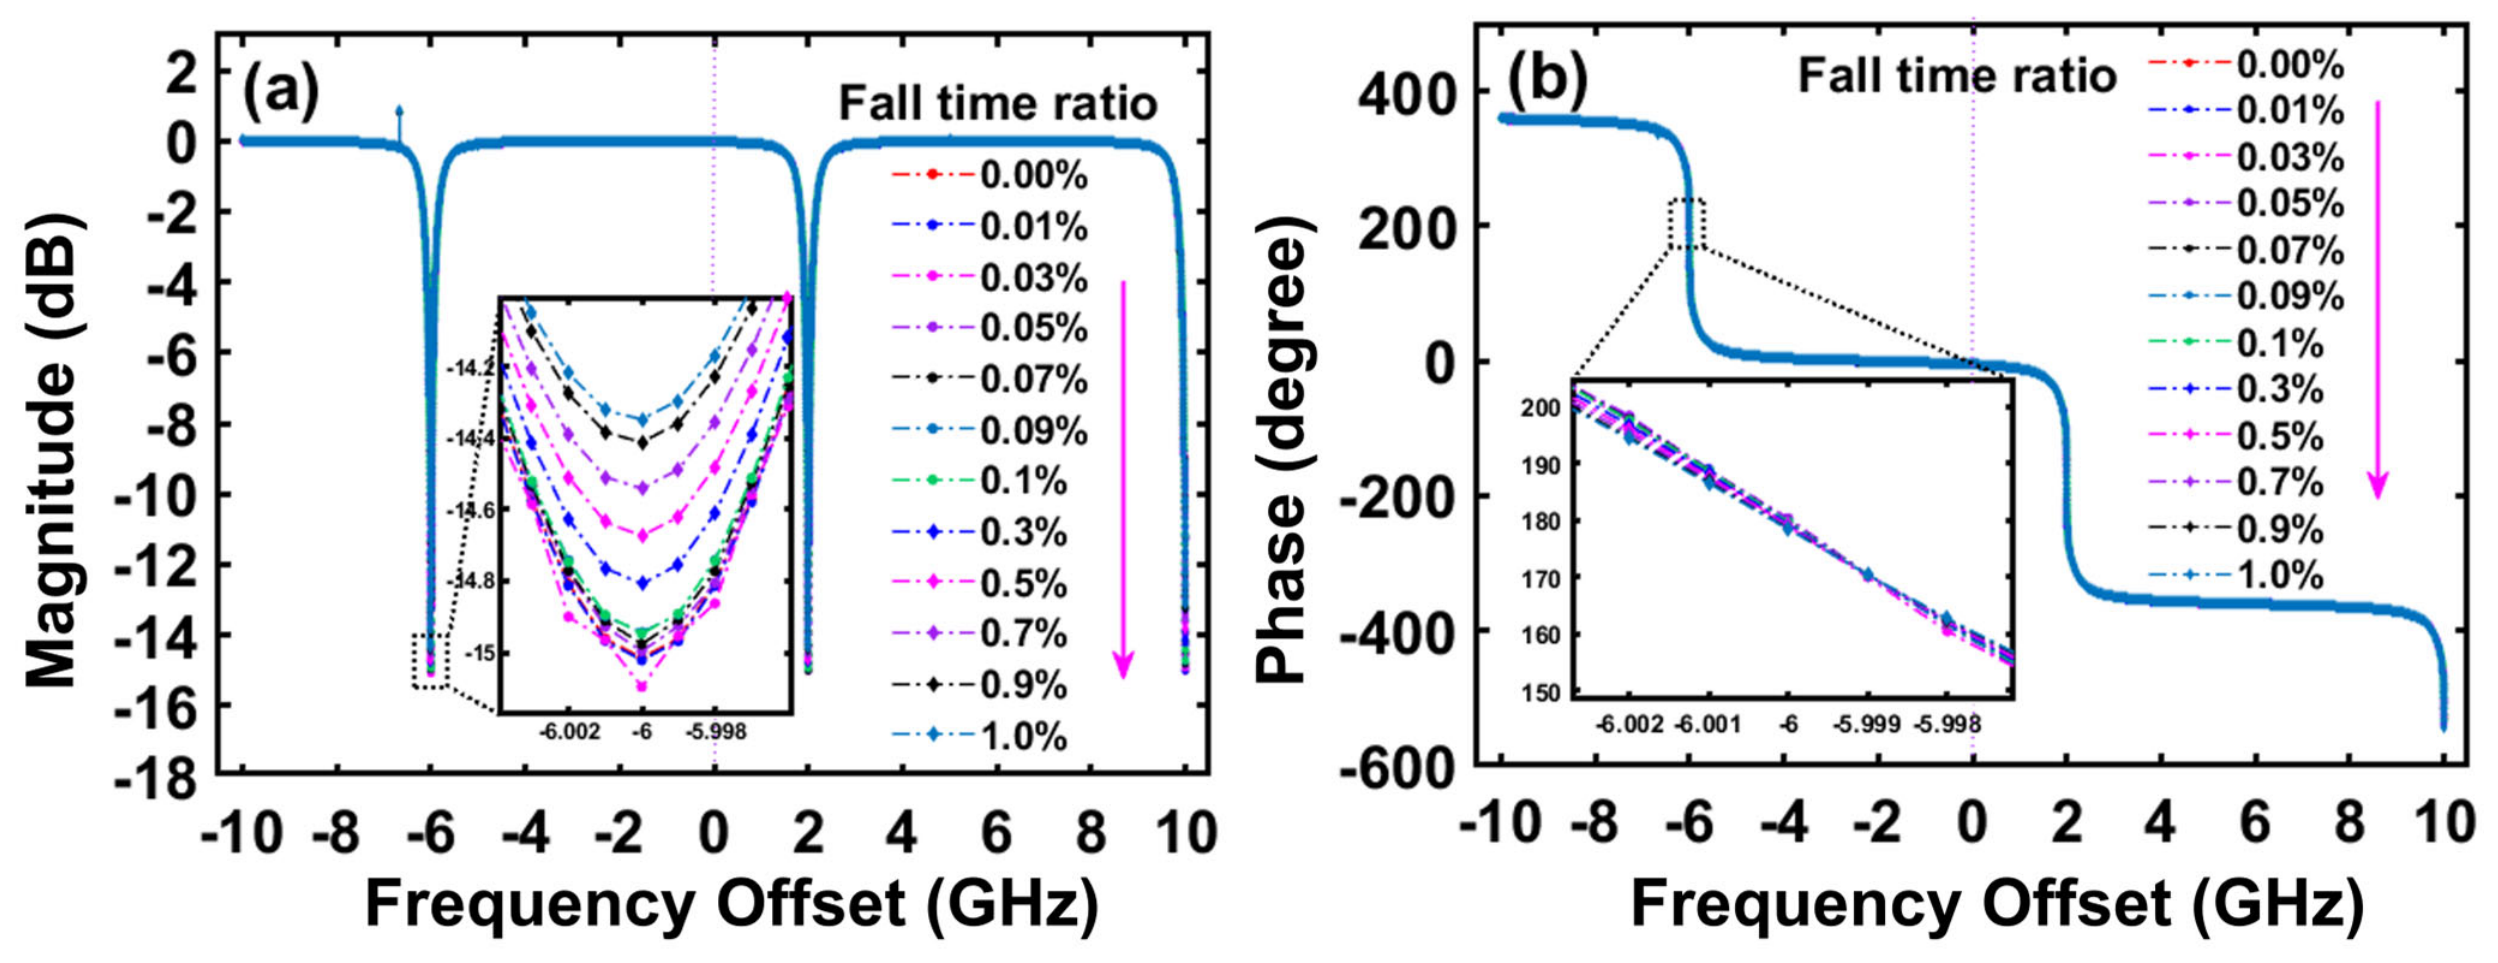
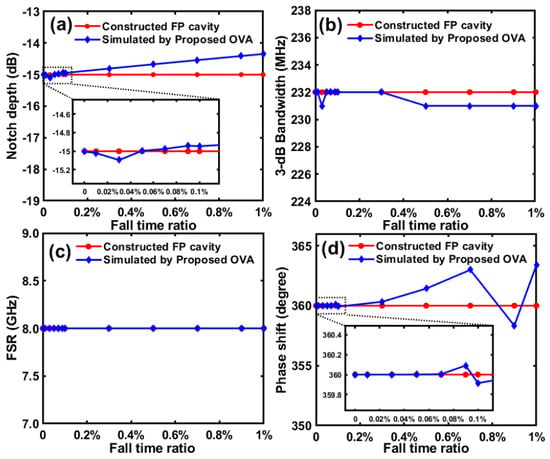
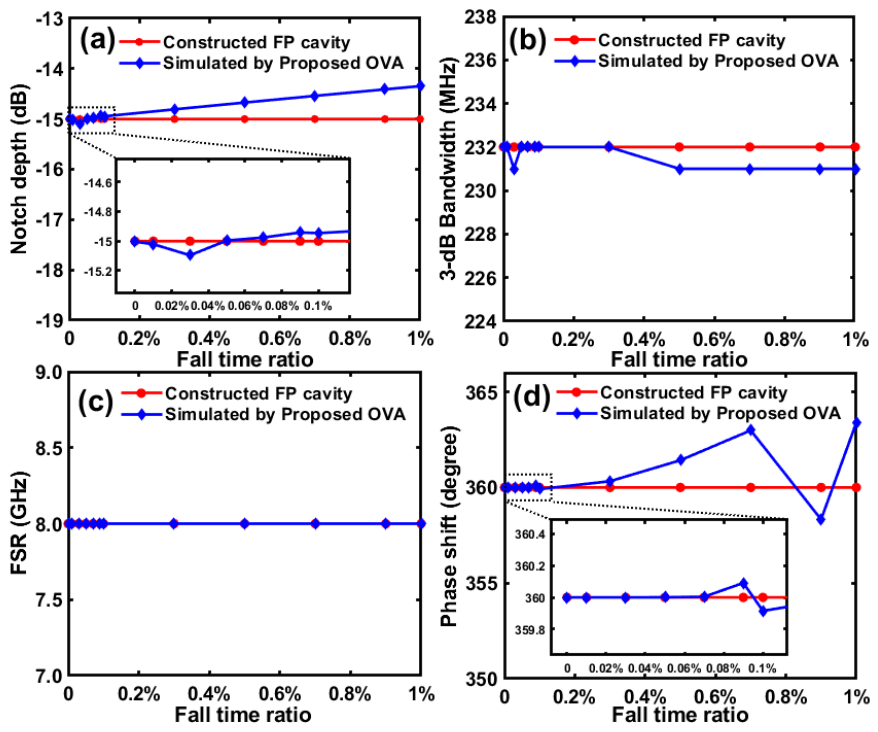
To comprehensively investigate the influence of spurious frequency-shifted sidebands on the accuracy of ODUT with band-stop responses, another simulation was performed, as demonstrated in Figure 13. The simulated responses of the FP cavity obtained using the proposed OVA at various fall times are illustrated. The fall time ratio varied from 0.00% to 1.0%. The corresponding notch depth, the 3-dB bandwidth, FSR, and phase shift of the FP cavity were also extracted and are displayed in Figure 14. As observed, the simulated notch depth and phase shift vary with the fall time and reach the values of the constructed FP cavity when the fall time ratio is set to 100%. Consistent with the results shown in Figure 12, the simulated 3-dB bandwidth and FSR are also in excellent agreement with those of the constructed FP cavity and exhibit high consistency at a large fall time ratio. Notably, the slight discrepancy observed in the simulated 3-dB bandwidth as depicted in Figure 14b can also be attributed to the limited resolution of the proposed method. Overall, it was found that the errors increase with increasing fall time, which is consistent with the theoretical analysis.
Figure 13.
Simulated (a) magnitude response and (b) phase response of the FP cavity based on the proposed OVA with various fall time ratios.
Figure 14.
Simulated (a) notch depth, (b) 3-dB bandwidth, (c) FSR, and (d) phase shift of the FP cavity with various fall time ratios. The parameters of the constructed FP cavity are also presented for comparison.
4. Discussion
In practical measurements, nonideal factors such as temperature fluctuations and mechanical vibrations of the system [44], as well as the finite extinction ratio and DC bias drift of the EOM, can influence the measurement accuracy [45]. Besides, the limited performance of the EOM and PD at high frequencies can also introduce noise [46]. The limited suppression ratio of the spurious frequency-shifted sidebands is also caused by imperfect polarization. By using more stable devices with better performance and applying commercially available modulator bias-control circuits or polarization-maintaining fibers, the robustness and stability of the OVA will be improved. Moreover, it is feasible to acquire enhanced resolution down to the theoretical sub-Hz level through more swept points or the deployment of lasers with ultra-narrow linewidth and suppressed frequency drift [47].
In addition, the amplitude of the sawtooth waveform is an important influencing factor for the sideband suppression ratio of the Serrodyne frequency shifting [48]. By precisely controlling the amplitude of the sawtooth wave signal, the accuracy of the proposed method can be improved.
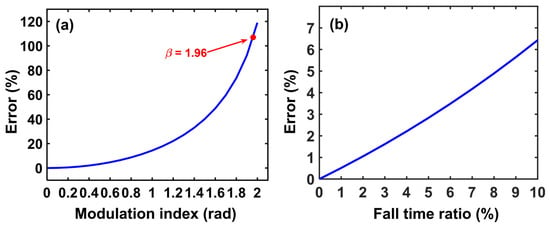
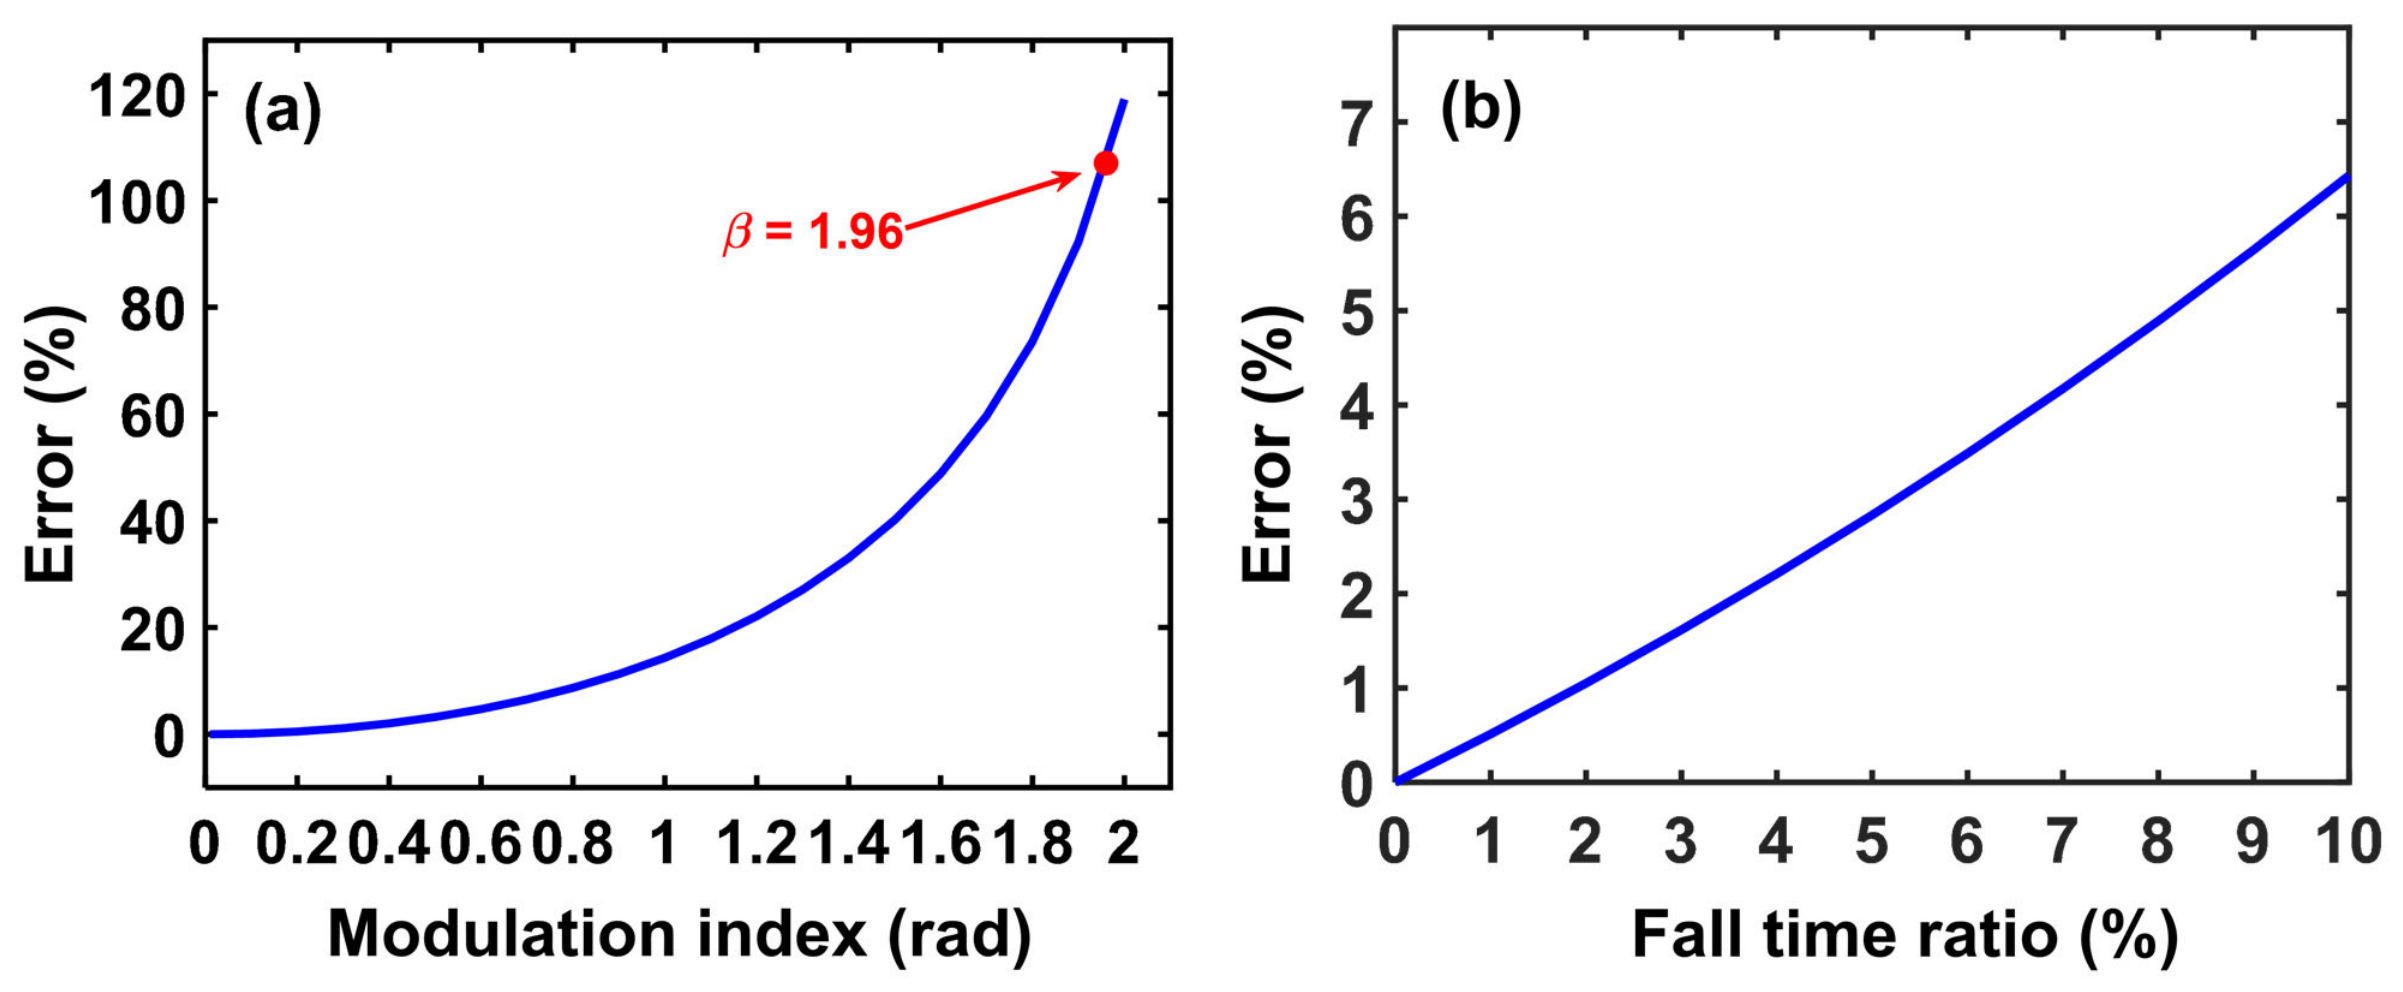
To further demonstrate that the presented scheme possesses high accuracy, a simulated quantitative comparison between the proposed OVA and the OVA based on OSSB was performed, as shown in Figure 15a. When the modulation index exceeds 0.4, the errors become significantly larger. At the modulation index of 1.96, the error exceeds 100%, resulting in significant distortion of the frequency responses. However, the proposed OVA is immune to errors induced by higher-order sidebands because the beat notes generated between the higher-order sidebands occur at frequencies different from those of the frequency-shifted carrier and the desired ±1st-order sidebands.
Figure 15.
(a) The simulated errors introduced by the undesired beatings between the high-order sidebands with various modulation indices in the conventional OSSB-based OVA; (b) The simulated errors caused by different fall times of the sawtooth waveform in the proposed OVA.
However, due to nonideal performance, the sawtooth wave generated by the AWG has a finite fall time. As a result, the spurious frequency-shifted optical sidebands were generated. According to Figure 2 and Equation (17), the error of the proposed OVA mainly originates from the −1st-order sideband of the spurious frequency shift. As shown in Figure 15b, the error increases with increasing fall time ratio. However, even if the fall time ratio increases to 10%, the error does not exceed 7%. Because the fall time ratio of the sawtooth waveform is also affected by the bandwidth of the AWG, the accuracy can be further improved by selecting a sawtooth wave source with a higher bandwidth.
5. Conclusions
In conclusion, an OVA based on serrodyne modulation was proposed and validated. By employing serrodyne modulation, asymmetric ODSB signals are generated and subsequently pass through the ODUT. The optical signals are then converted into a frequency-shifted photocurrent, enabling the extraction of the ODUT’s responses. Owing to the asymmetric ODSB structure, the errors induced by the EOM’s nonlinearity under arbitrary modulation indices are reduced because the beat signals from the high-order sidebands occur at frequencies different from those generated by the frequency-shifted carrier and the desired sidebands. Here, the capability of the proposed OVA is demonstrated by numerical simulations for characterizing arbitrary optical responses in an ideal situation, achieving a 20 GHz frequency range for a uniform FBG, an FP cavity, and a bandpass filter. Moreover, the influence of spurious frequency-shifted optical sidebands generated by the fall time of the sawtooth wave on characterization accuracy was also investigated. Unfortunately, the current work relies solely on numerical simulation. Under actual experimental conditions, the practical imperfections such as polarization effects, bias drift, reflections, and component nonidealities will be considered in future experimental work. The proposed OVA offers a new approach for characterizing the optical devices.
Author Contributions
Conceptualization, Y.L. and Z.C.; methodology, Y.L.; software, Y.L.; validation, Y.L., H.Z. and Z.C.; formal analysis, Y.L. and H.Z.; investigation, Y.L. and Z.X.; resources, Z.C.; data curation, Y.L. and H.Z.; writing—original draft preparation, Y.L.; writing—review and editing, Y.L., H.Z., Z.X. and Z.C.; visualization, Y.L.; supervision, Z.C.; project administration, Z.C.; funding acquisition, Z.C. All authors have read and agreed to the published version of the manuscript.
Funding
This research was funded by the National Natural Science Foundation of China (62401249); the Natural Science Foundation of Hunan Province (2024JJ6390); the Scientific Research Fund of Hunan Provincial Education Department (23B0413); the PhD Scientific Research Start-up Fund of University of South China (200XQD070); and the Hunan Province Key Laboratory for Ultra-Fast Micro/Nano Technology and Advanced Laser Manufacture (Grant No. 2018TP1041).
Institutional Review Board Statement
Not applicable.
Informed Consent Statement
Not applicable.
Data Availability Statement
The data that support the findings of this article are not publicly available due to privacy. Data are available from the authors upon request.
Conflicts of Interest
The authors declare no conflicts of interest.
References
- Blais, A.; Girvin, S.M.; Oliver, W.D. Quantum information processing and quantum optics with circuit quantum electrodynamics. Nat. Phys. 2020, 16, 247–256. [Google Scholar] [CrossRef] [Scilit]
- Feng, H.; Ge, T.; Guo, X.; Wang, B.; Zhang, Y.; Chen, Z.; Zhu, S.; Zhang, K.; Sun, W.; Huang, C.; et al. Integrated lithium niobate microwave photonic processing engine. Nature 2024, 627, 80–87. [Google Scholar] [CrossRef] [Scilit] [PubMed]
- Yang, J.; Chen, Y.; Rao, Z.; Zheng, Z.; Song, C.; Chen, Y.; Xiong, K.; Chen, P.; Zhang, C.; Wu, W.; et al. Tunable quantum dots in monolithic Fabry–Perot microcavities for high-performance single-photon sources. Light. Sci. Appl. 2024, 13, 33. [Google Scholar] [CrossRef] [Scilit] [PubMed]
- Tenbrake, L.; Faßbender, A.; Hofferberth, S.; Linden, S.; Pfeifer, H. Direct laser-written optomechanical membranes in fiber Fabry–Perot cavities. Nat. Commun. 2024, 15, 209. [Google Scholar] [CrossRef] [Scilit] [PubMed]
- Han, X.; Zhong, H.; Li, K.; Xue, X.; Wu, W.; Hu, N.; Lu, X.; Huang, J.; Xiao, G.; Mai, Y.; et al. Operando monitoring of dendrite formation in lithium metal batteries via ultrasensitive tilted fiber Bragg grating sensors. Light. Sci. Appl. 2024, 13, 24. [Google Scholar] [CrossRef] [Scilit] [PubMed]
- Zheng, J.; Cao, H.; Zhang, S.; Lu, J.; Cao, S.; Li, W.; Yu, K.; Shi, F.; Wei, W. High mechanical strength thermally regenerated fiber Bragg gratings for high-temperature stress monitoring. IEEE Trans. Instrum. Meas. 2024, 73, 7002907. [Google Scholar] [CrossRef] [Scilit]
- Elsherif, M.; Salih, A.E.; Muñoz, M.G.; Alam, F.; AlQattan, B.; Antonysamy, D.S.; Zaki, M.F.; Yetisen, A.K.; Park, S.; Wilkinson, T.D.; et al. Optical fiber sensors: Working principle, applications, and limitations. Adv. Photonics Res. 2022, 3, 2100371. [Google Scholar] [CrossRef] [Scilit]
- Wang, J.; Guo, X.; Li, C.; Zhou, H.; Yan, Y.; Zhu, F.; Wang, J.; Cai, G.; Schmidt, O.G. Tunable MXene/WO3 Fabry−Pérot microcavity architecture for bioinspired soft electrochromic actuators with vivid colors. Adv. Funct. Mater. 2025, 35, 2416812. [Google Scholar] [CrossRef] [Scilit]
- Chang, Z.; Luo, Z.; Cao, S.; Ouyang, K.; Ge, K.; Wan, Z. Narrow-band tunable optical filters based on cascaded Fabry–Perot cavities. Opt. Express 2022, 30, 13864–13874. [Google Scholar] [CrossRef] [Scilit] [PubMed]
- Kang, H.; Lee, D.; Yang, Y.; Oh, D.K.; Seong, J.; Kim, J.; Jeon, N.; Kang, D.; Rho, J. Emerging low-cost, large-scale photonic platforms with soft lithography and self-assembly. Photonics Insights 2023, 2, R04. [Google Scholar] [CrossRef] [Scilit]
- Yue, H.; Fu, J.; Zhang, H.; Xiong, B.; Pan, S.; Chu, T. Silicon modulator exceeding 110 GHz using tunable time-frequency equalization. Optica 2025, 12, 203–215. [Google Scholar] [CrossRef] [Scilit]
- Genty, G.; Niemi, T.; Ludvigsen, H. New method to improve the accuracy of group delay measurements using the phase-shift technique. Opt. Commun. 2002, 204, 119–126. [Google Scholar] [CrossRef] [Scilit]
- VanWiggeren, G.D.; Motamedi, A.R.; Barley, D.M. Single-scan interferometric component analyzer. IEEE Photon. Technol. Lett. 2003, 15, 263–265. [Google Scholar] [CrossRef] [Scilit]
- Morozov, O.; Nureev, I.; Sakhabutdinov, A.; Kuznetsov, A.; Morozov, G.; Il’in, G.; Papazyan, S.; Ivanov, A.; Ponomarev, R. Ultrahigh-resolution optical vector analyzers. Photonics 2020, 7, 14. [Google Scholar] [CrossRef] [Scilit]
- Wen, J.; Shi, D.F.; Jia, Z.; Shi, Z.; Li, M.; Zhu, N.H.; Li, W. Accuracy-enhanced wideband optical vector network analyzer based on double-sideband modulation. J. Lightw. Technol. 2019, 37, 2920–2926. [Google Scholar] [CrossRef] [Scilit]
- Xue, M.; Lv, M.; Wang, Q.; Zhu, B.; Yu, C.; Pan, S. Broadband optoelectronic frequency response measurement utilizing frequency conversion. IEEE Trans. Instrum. Meas. 2021, 70, 7004205. [Google Scholar] [CrossRef] [Scilit]
- Xue, M.; Chen, W.; Heng, Y.; Pan, S. Ultrahigh-resolution optical vector analysis using fixed low-frequency electrical phase-magnitude detection. Opt. Lett. 2018, 43, 3041–3044. [Google Scholar] [CrossRef] [Scilit] [PubMed]
- Luo, Y.; Zou, H.; Chen, Z. High-accuracy optical vector analysis based on dual-polarization MZM and polarization control. IEEE Photon. Technol. Lett. 2024, 36, 941–944. [Google Scholar] [CrossRef] [Scilit]
- Pan, S.; Xue, M. Ultrahigh-resolution optical vector analysis based on optical single-sideband modulation. J. Lightw. Technol. 2017, 35, 836–845. [Google Scholar] [CrossRef]
- Wang, B.; Zhang, W.; Fan, X. Self-calibrated optical vector analyzer with a largely extended measurement range based on linearly frequency-modulated waveform and recirculating frequency shifter. Opt. Express 2020, 28, 28536–28547. [Google Scholar] [CrossRef] [Scilit] [PubMed]
- Wen, J.; Wang, L.; Yang, C.; Li, M.; Zhu, N.H.; Guo, J.; Xiong, L.; Li, W. Optical vector network analyzer based on double-sideband modulation. Opt. Lett. 2017, 42, 4426–4429. [Google Scholar] [CrossRef] [Scilit] [PubMed]
- Liu, S.; Xue, M.; Fu, J.; Wu, L.; Pan, S. Ultrahigh-resolution and wideband optical vector analysis for arbitrary responses. Opt. Lett. 2018, 43, 727–730. [Google Scholar] [CrossRef] [Scilit] [PubMed]
- Qing, T.; Li, S.; Xue, M.; Li, W.; Zhu, N.; Pan, S. Optical vector analysis based on asymmetrical optical double-sideband modulation using a dual-drive dual-parallel Mach–Zehnder modulator. Opt. Express 2017, 25, 4665–4671. [Google Scholar] [CrossRef] [Scilit] [PubMed]
- Qing, T.; Li, S.; Tang, X.; Li, P.; Chen, X.; Wang, L.; Fang, Y.; Cao, M.; Wu, L.; Pan, S. Comprehensive vector analysis for electro-optical, opto-electronic, and optical devices. Opt. Lett. 2021, 46, 1856–1859. [Google Scholar] [CrossRef] [Scilit] [PubMed]
- Cao, M.; Qing, T.; Wang, L.; Li, S.; Fang, Y.; Tang, X.; Chen, X.; Li, P.; Pan, S. Wideband optical vector analysis based on microwave photonic frequency downconversion. IEEE Photon. Technol. Lett. 2022, 34, 145–148. [Google Scholar] [CrossRef] [Scilit]
- Chen, Z.; Luo, Y.; Zou, H.; Liu, Z.; Li, D. High-accuracy optical vector network analyzer for optical notch and bandpass responses. Appl. Opt. 2024, 63, 4441–4446. [Google Scholar] [CrossRef] [Scilit] [PubMed]
- Qing, T.; Li, S.; Xue, M.; Pan, S. Optical vector analysis based on double-sideband modulation and stimulated Brillouin scattering. Opt. Lett. 2016, 41, 3671–3674. [Google Scholar] [CrossRef] [Scilit] [PubMed]
- Li, W.; Liu, J.G.; Zhu, N.H. Optical vector network analyzer with improved accuracy based on polarization modulation and polarization pulling. Opt. Lett. 2015, 40, 1679–1682. [Google Scholar] [CrossRef] [Scilit] [PubMed]
- Heng, Y.; Xue, M.; Chen, W.; Han, S.; Liu, J.; Pan, S. Large-dynamic frequency response measurement for broadband electro-optic phase modulators. IEEE Photon. Technol. Lett. 2019, 31, 291–294. [Google Scholar] [CrossRef] [Scilit]
- Xue, M.; Wang, Q.; Xu, Z.; Heng, Y.; Yu, C.; Pan, S. Large dynamic and precision optical vector analysis assisted by SBS processing. J. Lightw. Technol. 2022, 40, 2435–2440. [Google Scholar] [CrossRef] [Scilit]
- Zhang, Y.; Zhang, L.; Zeng, Z.; Yang, F.; Zhang, Z.; Zhang, S.; Li, H.; Liu, Y. Ultrafast and wideband optical vector analyzer based on optical dual linear-frequency modulation. IEEE Photon. Technol. Lett. 2023, 35, 1055–1058. [Google Scholar] [CrossRef] [Scilit]
- Chen, Z.; Luo, Y.; Zou, H. High-resolution optical vector analysis based on single sideband modulation using a dual port Mach–Zehnder modulator. Opt. Eng. 2024, 63, 038103. [Google Scholar] [CrossRef] [Scilit]
- Qing, T.; Li, S.; Tang, Z.; Gao, B.; Pan, S. Optical vector analysis with attometer resolution, 90-dB dynamic range and THz bandwidth. Nat. Commun. 2019, 10, 5135. [Google Scholar] [CrossRef] [Scilit] [PubMed]
- Cheng, Z.; Shu, X.; Ma, L.; Chen, B.; Li, C.; Sun, C.; Wei, M.; Yu, S.; Li, L.; Lin, H.; et al. On-chip silicon electro-optical modulator with ultra-high extinction ratio for fiber-optic distributed acoustic sensing. Nat. Commun. 2024, 14, 7409. [Google Scholar] [CrossRef] [Scilit] [PubMed]
- Dong, Y.; Luo, W.; Li, W.; Zhang, C.; Hu, P.; Fu, H.; Yang, H.; Yang, R.; Dong, Y.; Tan, J. Focus on sub-nanometer measurement accuracy: Distortion and reconstruction of dynamic displacement in a fiber-optic microprobe sensor. Light. Adv. Manuf. 2024, 5, 51. [Google Scholar] [CrossRef] [Scilit]
- Kumar, R.; Raghuwanshi, S.K. Photonic generation of multi-featured chirp microwave signal with a phase tunable mechanism for chirp rate variation. J. Light. Technol. 2025, 43, 627–635. [Google Scholar] [CrossRef] [Scilit]
- Huang, C.; Chan, E.H.W. Microwave photonic frequency translators with large spurious suppression and wide bandwidth. IEEE Photonics J. 2021, 13, 5500809. [Google Scholar] [CrossRef] [Scilit]
- Huang, C.; Chan, E.H.W. Photonic frequency down conversion approach to measure microwave signal angle of arrival. IEEE Photon. J. 2022, 14, 7226608. [Google Scholar] [CrossRef] [Scilit]
- Johnson, L.M.; Cox, C.H. Serrodyne optical frequency translation with high sideband suppression. J. Lightw. Technol. 1988, 6, 109–112. [Google Scholar] [CrossRef] [Scilit]
- Huang, C.; Chan, E.H.W. Photonics-based serrodyne microwave frequency translator with large spurious suppression and phase shifting capability. J. Lightw. Technol. 2021, 39, 2052–2058. [Google Scholar] [CrossRef] [Scilit]
- Wang, Y.; Du, D.; Song, Y.; Li, Z.; Ye, N.; Zhang, Q. Integrated radar jamming signal generation and secure wireless communication based on photonics at Ka-band. IEEE Trans. Microw. Theory Tech. 2024, 72, 6010–6019. [Google Scholar] [CrossRef] [Scilit]
- Li, Y.; Guo, Y.; Yin, B.; Wang, Z.; He, Q.; Wang, M. Single-channel system for joint unambiguous measurement of DFS and AOA based on serrodyne modulation. Appl. Opt. 2023, 62, 6924–6930. [Google Scholar] [CrossRef] [Scilit] [PubMed]
- Wang, H.; Wen, A.; Men, Y.; Wang, Y. Photonics-based radar jamming signal generation and self-interference cancellation. J. Lightw. Technol. 2023, 41, 5922–5929. [Google Scholar] [CrossRef] [Scilit]
- Dai, J.; Chen, Z.; Wang, X.; Ye, L.; Zhang, T.; Xu, K. Accurate optical vector network analyzer based on optical double-sideband suppressed carrier modulation. Opt. Commun. 2019, 447, 61–66. [Google Scholar] [CrossRef] [Scilit]
- Sun, S.; He, M.; Xu, M.; Gao, S.; Chen, Z.; Zhang, X.; Ruan, Z.; Wu, X.; Zhou, L.; Liu, L.; et al. Bias-drift-free Mach–Zehnder modulators based on a heterogeneous silicon and lithium niobate platform. Photon. Res. 2020, 8, 1958–1963. [Google Scholar] [CrossRef] [Scilit]
- Sun, J.Z.; Xu, B.R.; Shi, D.F.; Wen, H.S.; Wang, X.; Zhu, N.H. Dual-wavelength light source assisted frequency response measurement method of photodetectors. IEEE Photon. Technol. Lett. 2021, 33, 695–698. [Google Scholar] [CrossRef] [Scilit]
- Zhang, Y.; Zhang, Y.; Yuan, F.; Zhang, Z.; Zhang, S.; Li, H.; Liu, Y. Hyperfine optical vector analysis of ultra-narrowband optical bandpass filters based on coherent two-tone sweeping and fixed low-frequency detection. Opt. Express 2021, 29, 42663–42673. [Google Scholar] [CrossRef] [Scilit]
- Poberzheskiy, I.Y.; Bortnik, B.; Chou, J.; Jalali, B.; Fetterman, H.R. Serrodyne frequency translation of continuous optical signals using ultrawide-band electrical sawtooth waveforms. IEEE J. Quantum Electron. 2005, 41, 1533–1539. [Google Scholar] [CrossRef]
Disclaimer/Publisher’s Note: The statements, opinions and data contained in all publications are solely those of the individual author(s) and contributor(s) and not of MDPI and/or the editor(s). MDPI and/or the editor(s) disclaim responsibility for any injury to people or property resulting from any ideas, methods, instructions or products referred to in the content. |
© 2026 by the authors. Licensee MDPI, Basel, Switzerland. This article is an open access article distributed under the terms and conditions of the Creative Commons Attribution (CC BY) license.